Embed Size (px)
Citation preview

Estonian Journal of Earth Sciences, 2019, 68, 2, 76–87 https://doi.org/10.3176/earth.2019.07
76
Provenance of heavy minerals in the Quaternary deposits of the Lemme outcrop, Estonia, based on optical microscopy, X-ray diffractometry and
scanning electron microscope microanalysis
Johanna-Iisebel Järvelilla, Toivo Kallasteb, Anne Kleesmentb, Siim Pajusaarb and Anto Raukasb,c a School of Natural Sciences and Health, Tallinn University, Narva Road 25, 10120 Tallinn, Estonia; [email protected] b Department of Geology, Tallinn University of Technology, Ehitajate tee 5, 19086 Tallinn, Estonia; [email protected],
[email protected], [email protected], [email protected] c Institute of Ecology, Tallinn University, Uus-Sadama 5, 10120 Tallinn, Estonia Received 17 January 2019, accepted 26 March 2019, available online 7 May 2019 Abstract. This paper is a methodological development, where optical microscopy, X-ray diffractometry (XRD) and microanalysis under a scanning electron microscope (SEM) were used for comparative determination of heavy minerals in Quaternary sandy sediments in the Lemme outcrop, southwestern Estonia, and for evaluation of possible provenance rocks. For comparison, samples from Devonian drill cores were analysed. Heavy minerals in the Lemme coastal deposits mostly originated from the till of the last glaciation, which contained clasts and fines from rocks of the Svecofennian Domain of the Fennoscandian (Baltic) Shield. Garnets were the dominating minerals in the Lemme samples, whereas the crystal lattice parameter of the main component was 11.535 Å. The Devonian garnets were different, with the lattice parameter of the main component being 11.610 Å. Amphiboles, ilmenite and magnetite were also important minerals in the Lemme samples, but scarce in the Devonian samples. A detailed study of magnetite revealed a Ti content of 0.3%, which is consistent with the lattice parameter 8.397 Å. The hematite content of the Lemme samples was about twice as high as that of magnetite. The Ti content of hematite grains was higher in the surface (about 5%) than in the middle section (1.6%). The XRD analysis showed that titanium in hematite grains was probably fine crystalline rutile. In the Devonian samples, the main opaque mineral was pseudorutile. Key words: heavy minerals, opaque minerals, optical microscopy, X-ray diffractometry, scanning electron microscope.
INTRODUCTION The heavy minerals of Estonian Quaternary deposits have been extensively studied using optical microscopy (Raukas 1964; Kessel & Raukas 1967; Lutt & Popova 1993), but not with X-ray diffractometry (XRD) and scanning electron microscopy with energy dispersive X-ray spectroscopy (SEM/EDX). Despite the success of XRD methods elsewhere in the world (Webster et al. 2003; Kemp et al. 2011), they have not yet been used in the study of heavy minerals in Estonia. The aim of the present study was to comparatively determine heavy minerals in Quaternary sandy sediments in the Lemme outcrop in southwestern Estonia and to identify possible provenance rocks using optical microscopy, XRD and SEM/EDX. X-ray diffractometry requires less work than the optical microscopy and SEM/EDX methods and has an advantage over optical microscopy by offering an opportunity to analyse opaque ore minerals. The downsides of the XRD method include lower accuracy
of quantitative analysis and lower sensitivity (the detection limits of different minerals vary from 0.5% to 2%). We compared semiquantitative XRD analysis with optical microscopy and performed precise measurements of lattice parameters to study the variability of minerals and determine their varieties. The SEM/EDX micro-analysis is likely the optimal method for studying heavy minerals. However, we did not use it widely enough and thus several questions that arose in the course of the work require additional and more detailed analysis with this method.
The heavy minerals in the Quaternary deposits in the Lemme area are mainly of northern origin and were carried there by glaciers from Finland and from the bottom of the northern part of the Baltic Sea. Another potential provenance could be Estonian Palaeozoic bedrock, especially Devonian sandstones and siltstones, on which the studied Quaternary sediments lie. We analysed comparative material from Devonian drill cores and used a published dataset on heavy minerals in
© 2019 Authors. This is an Open Access article distributed under the terms and conditions of the Creative Commons Attribution4.0 International Licence (http://creativecommons.org/licenses/by/4.0).

J.-I. Järvelill et al.: Heavy minerals in Lemme
77
tills of southern Finland (Al-Ani & Ahtola 2014) to find out to what extent they have contributed to the composition of heavy minerals in the Lemme area.
MATERIAL AND METHODS Samples Nos 3501–3509, 3512, 3513 and Lemme-5 analysed in this paper come from both banks of the Lemme River (57°58′N, 24°25′E) on the southwestern coast of Estonia (Fig. 1). This study utilized duplicates of the mineral samples that were analysed using the optical microscopy method in earlier studies. The heavy minerals in all samples were separated by bromoform with a density of 2.8 g/cm3.
Samples 3501–3509, 3512 and 3513 (11 samples), collected from a 0–380 cm profile, were previously analysed in a soil formation study by Reintam et al. (2001). The Lemme-5 sample, from a 10 cm thick layer with a heavy mineral content of up to 80%, was earlier studied in relation to abnormal radioactivity (Raukas et al. 2014; Järvelill et al. 2015). The mentioned papers provide a thorough description of the Lemme outcrop and the topography and geological setting of the region.
Fig. 1. Location of the Lemme sample site on the southwestern coast of Estonia.
The Devonian samples (6) were from the collection of the Department of Geology, Tallinn University of Technology (TalTech GD). These were duplicate samples from various studies; the selection criterion was that the quantity of the sample needed to be sufficient for XRD analysis. Information on the location, depth and strati-graphy of the samples is provided in Table 1.
The XRD analyses were conducted using a Bruker D8 diffractometer (Fe-filtered Co-radiation and LynxEye detector). The samples were ground manually using a mortar and pestle, mixed with ethyl alcohol to form a paste and spread on a glass slide. In order to perform a precise measurement of lattice parameters, approximately 10% of Si internal standard was added to the sample. The measurement conditions were Co tube (35 kV, 40 mA), range 8–75 deg, step 0.01 deg, time 190 s. Quantitative analysis of the minerals using the Rietveld method and calculation of the lattice parameters were performed using TOPAS software.
The results of the quantitative XRD analysis were expressed as mass percentages. The results of the optical microscopy analysis were given as percentages of mineral grain counts. In order to perform a comparison, the counting results were calculated into mass per-centages taking into account the densities of minerals and presuming that the grain size distribution was the same for all minerals in the fraction. Since there was no information on the size (volume) of all the grains, the comparison was approximate. Quantitative XRD is not an exact method. For zircon, the reasons for the discrepancy between XRD and optical microscopy results are brought out in the paper, but the question remained open for amphibole. The accuracy of the XRD analysis can be improved by further studies.
The Lemme-5 sample was studied using a SEM/EDX microanalyser in two laboratories, namely the Adam Mickiewicz University in Poznan (Hitachi S-3700N) and the TalTech GD (Zeiss EVO MA15). In Poznan, the test was performed on the surface of the grains, which made it difficult to produce accurate results. Still, the majority of the 15 analysed grains were identified (the number of grains is given in brackets); these were garnet (4), amphibole (2), tourmaline (2), rutile (2), zircon (1), ilmenite (1) and leucoxene (1).
Table 1. Samples from Devonian sandstone, location, depth and stratigraphy
Heimtali 422-16 Luutsniku 451-4351 Põlva 72-1 Põlva 72-13 Taagepera 4 Taagepera 10
Borehole Heimtali 422 Luutsniku 451 Põlva 72 Põlva 72 Taagepera Taagepera Latitude (deg) 58.35 57.62 ~58 ~58 57.99 57.99 Longitude (deg) 25.46 27.00 ~27 ~27 25.67 25.67 Depth (m) 63.4–63.5 435.1 31.0–31.4 299.5–300.0 251.9–252.0 206.6–206.8 Local stratigraphy Pärnu Rezekne Koorküla Rezekne Kemeri Pärnu

Estonian Journal of Earth Sciences, 2019, 68, 2, 76–87
78
The magnetic fractions (magnetite and hematite fraction) of the Lemme-5 sample were studied at the TalTech GD using a SEM/EDX microanalyser. Polished EPO-THIN epoxy preparations and hematite from the surface of the grains were analysed. The analysis took place in low vacuum conditions without any coating on the preparations.
RESULTS AND DISCUSSION The counting results of the optical microscopy analysis of Lemme samples 3501–3509, 3512 and 3513 (fraction 0.05–0.1 mm) and the results of the XRD quantitative analysis (fraction 0.05–0.1 mm) are given in Tables 2 and 3, respectively. The results of the optical microscopy analysis and XRD quantitative analysis of the coarser fraction (0.1–0.25 mm) of Lemme samples 3501–3509, 3512 and 3513 are given in Tables 4 and 5. The counting results of the optical microscopy analysis of the Lemme-5 sample are available in Raukas et al. (2014, table 11). The counting results of the optical microscopy analysis and the results of the XRD quantitative analysis of the Devonian samples (fraction 0.05–0.1 mm) are presented in Tables 6 and 7.
A more detailed overview of the main minerals in both the Lemme (fractions 0.05–0.1 mm and 0.1–
0.25 mm) and Devonian samples (fraction 0.05–0.1 mm) is provided in the next sections.
Garnets Garnets were the main minerals in the heavy fraction of the Lemme samples, thus it was possible to conduct a detailed XRD study. The XRD reflections of garnets from the Lemme samples were asymmetrical, i.e. the samples contained garnets with different lattice parameters due to differences in composition. This study used a two-component model (garnet-1 and garnet-2) in TOPAS software. The actual distribution of com-positional variations is unknown; the two-component model may have also described continuous distribution.
Garnets manifested similarly in all the Lemme samples. The average values of the lattice parameters of its components and standard deviations (st. dev.) were as follows: garnet-1 (fraction 0.05–0.1 mm, nine samples) a = 11.535 Å (st. dev. 0.0005 Å), garnet-1 (fraction 0.1–0.25 mm, six samples) a = 11.535 Å (st. dev. 0.0006 Å), garnet-2 (fraction 0.05–0.1 mm, six samples) a = 11.588 Å (st. dev. 0.005 Å), garnet-2 (fraction 0.1–0.25 mm, six samples) a = 11.585 Å (st. dev. 0.002 Å).
Table 2. Results of optical microscopy analysis of Lemme samples 3501–3509, 3512 and 3513 (grain counts (%), 0.05–0.1 mm fraction)
Minerals 3501 3502 3503 3504 3505 3506 3507 3508 3509 3512 3513
Ilmenite, magnetite 21.2 28.8 19.3 16 15 23.1 12.6 14 13 11.6 7.8 Fe-hydroxide 0.8 1 1.2 9 4.6 3.6 2.4 2.5 1.5 0.4 2.1 Pyrite – – – – – – – – – – – Leucoxene – 0.8 0.5 – 0.8 0.2 0.4 – 1.5 1.6 1 Barite – – – – – – – 1.9 – – – Micas 0.8 – 0.5 1.8 0.8 – 2.6 2 0.4 2.4 11 Amphiboles 23.8 17.4 39.1 21.8 28.8 21.3 46.8 35.8 35.5 44 45.6 Pyroxenes 6.8 5 5 3.8 3.8 4.7 7.6 7 7 5.2 7.1 Epidote group 2 1.4 2.1 1.8 0.6 2.2 0.8 1 3.1 2.8 1.6 Garnet 38.8 36.4 28.5 38.2 36.8 34.2 20.6 28.7 28.7 22 16.7 Staurolite – – – – – 0.2 – 0.4 0.2 – – Kyanite – – 0.2 – 0.4 – – 0.2 1.4 1.6 1.2 Zircon 4.8 7.8 2.5 5.8 6.6 8.5 4.2 4.1 4.9 3 2.1 Monazite – 0.2 – – – – – – 0.4 0.2 – Tourmaline 0.4 0.4 0.2 0.2 0.4 0.2 0.2 0.4 1 1.2 1.2 Apatite – – 0.2 0.2 1 0.8 1.2 1 0.6 2 1.4 Rutile 0.6 0.6 0.2 1.2 0.2 0.6 0.4 0.4 0.4 0.6 1 Titanite – – 0.2 0.2 0.2 – – 0.6 – 1 – Anatase – – – – – – – – – 0.2 – Weathered Ti-minerals – 0.2 0.3 – – 0.4 0.2 – – 0.2 0.2 Heavy mineral content in fraction (%) 9 6 18 10.8 13.8 13 13.7 8.3 5.3 1.8 2.2 ____________________ – not found.

J.-I. Järvelill et al.: Heavy minerals in Lemme
79
Table 3. Results of X-ray diffractometry of Lemme samples 3502–3509, 3512 and 3513 using the Rietveld method (wt%, 0.05–0.1 mm fraction)
Minerals 3502 3504 3505 3506 3507 3508 3509 3512 3513
Garnet-1 33.6 33.4 33.1 29.0 26.6 32.2 31.0 17.2 12.5 Garnet-2 9.1 8.8 8.7 9.3 6.2 9.0 9.6 6.3 6.3 Hornblende 7.9 14.9 15.4 11.1 26.6 14.4 24.0 26.7 23.7 Ilmenite 8.5 8.4 8.9 10.9 10.0 8.5 6.0 2.6 2.3 Hematite 8.7 6.0 6.0 9.5 4.9 0.3 0.8 1.5 1.4 Magnetite 4.9 2.5 3.0 4.6 0.7 0.6 0.2 0.1 0.3 Zircon 4.2 4.0 4.1 5.2 4.7 5.9 2.4 1.6 1.1 Augite 4.1 4.1 4.2 4.4 4.4 4.5 4.2 4.1 3.9 Orthopyroxene 1.8 2.0 1.4 2.2 2.6 2.8 5.0 3.1 1.9 Rutile 2.2 1.8 1.8 2.1 1.6 1.7 1.8 1.6 1.5
Traces near the detection limit or not detected
Apatite 0.6 0.5 0.9 1.3 1.1 1.8 2.1 3.9 2.8 Schorl 0.4 0.4 0.3 0.1 – 0.3 0.4 0.7 0.6 Pyrite 0.5 0.4 0.6 0.7 0.7 0.3 0.9 0.7 0.8 Chamosite – 0.1 0.1 0.1 0.2 0.2 0.3 0.4 0.5 Goethite 0.8 0.5 0.6 0.6 0.8 0.3 0.0 0.2 0.2 Epidote* 2.6 1.5 1.7 2.0 1.8 2.6 2.6 4.3 4.0
Excluded from the heavy mineral assemblage
Quartz 6.8 6.9 6.7 5.6 4.8 9.3 5.5 10.6 13.4 Orthoclase – 1.1 0.7 – 0.6 1.9 1.5 2.1 5.7 Albite 2.3 1.9 1.7 0.5 1.1 2.8 1.1 1.2 1.7 Dolomite 0.9 0.9 0.2 0.7 0.4 0.7 0.6 11.1 15.5 ______________________ * complication due to overlapping; – not found.
Table 4. Results of optical microscopy analysis of Lemme samples 3501–3509, 3512 and 3513 (grain counts (%), 0.1–0.25 mm fraction)
Minerals 3501 3502 3503 3504 3505 3506 3507 3508 3509 3512 3513
Ilmenite, magnetite 13.4 21.4 16 11.4 10.6 15.8 8.8 6.4 4 7.2 6.5 Fe-hydroxide 2.6 3.4 2.2 4.2 2 1.8 1.6 0.8 0.6 0.8 1.5 Pyrite – – – 0.2 – – – – – 0.2 0.2 Leucoxene 0.4 1 1 – 0.2 – 0.8 0.4 0.2 0.4 0.4 Barite – 0.2 – – – – – – – – – Micas – 0.2 0.4 – – 0.4 0.2 1 – 2.6 5.8 Amphiboles 23.4 15.8 29 23.4 24.4 21.2 28.6 24.8 33 39 42.5 Pyroxenes 7.4 4 3.2 8.6 6.2 8.2 8.6 7.2 10.8 8.4 10.6 Epidote group 0.8 0.4 2.2 0.6 1.4 2.8 2.6 0.6 2.6 1.2 1.7 Garnet 49.6 50.4 42.4 47.6 54.3 48.2 46.4 55.8 42.2 36 27.4 Staurolite 0.6 0.8 0.8 – – 0.2 0.2 – 0.2 – – Kyanite – – – 0.2 – – – – – – – Zircon 1.4 1.4 1.2 3.2 1.6 1 1 1.6 0.6 1.4 1.9 Monazite – – – – – – – – – – – Tourmaline 0.4 – 1.2 0.4 0.2 0.2 0.2 0.4 0.4 0.6 0.4 Apatite – 0.4 – – – 0.2 1 0.6 0.8 1.4 1.1 Rutile – 0.6 0.4 0.2 – – – – 0.6 0.6 – Titanite – – – – – – – 0.4 – 0.2 – Anatase – – – – – – – – – – – Weathered Ti-minerals – – – – – – – – – – – Heavy mineral content in fraction (%) 3.1 2 0.9 1.6 2.3 5.2 4.8 2 3.3 1.1 0.9
______________________ – not found.

Estonian Journal of Earth Sciences, 2019, 68, 2, 76–87
80
Table 5. Results of X-ray diffractometry of Lemme samples 3501, 3503–3505, 3508 and 3513 using the Rietveld method (wt%, 0.1–0.25 mm fraction)
Minerals 3501 3503 3504 3505 3508 3513
Garnet-1 39.5 41.1 32.1 34.2 37.8 18.8 Garnet-2 12.5 14.9 10.8 13.2 10.5 8.7 Hornblende 14.4 10.3 21.4 20.9 16.9 32.8 Ilmenite 3.3 3 3.4 3 1.6 1.6 Hematite 3.8 3.1 2.9 2.7 0.5 1.8 Magnetite 0.9 0.1 1 0.3 0.1 0.2 Zircon 0.8 0.8 1.2 0.6 0.2 0.4 Augite 3.5 3.6 3.6 3.6 3.5 3.9 Orthopyroxene 2.5 0.9 2.4 3 1.5 4.1 Rutile 1.3 1.6 1.4 1.1 0.8 0.7 Traces near the detection limit or not detected Apatite 0.5 0.6 – 0.2 0.8 4.5 Schorl 1.5 2.3 0.7 0.9 1 0.4 Pyrite 0.7 0.7 0.7 0.6 0.4 0.4 Chamosite 0.1 – 0.1 – – 0.6 Goethite 0.7 0.9 0.7 0.3 0.1 0.3 Epidote* 2.4 2.5 2.9 3.3 2.3 4.2 Excluded from the heavy mineral assemblage Quartz 9.1 10.9 9.8 8.7 16.9 6.3 Orthoclase 0.7 0.1 1.5 1.3 1.6 1.5 Albite 1.1 2 3 1.6 3.2 1.1 Dolomite 0.5 0.5 0.4 0.5 0.3 7.7 ______________________ * complication due to overlapping; – not found.
Table 6. Results of optical microscopy analysis of Devonian sandstone samples (grain counts (%), fraction 0.05–0.1 mm)
Minerals Heimtali 422-16
Luutsniku 51-4351
Põlva 72-1
Põlva 72-13
Taagepera 4
Taagepera 10
Biotite (green) – 2.4 0.2 0.2 0.4 0.2 Chlorite – – – 0.4 0.4 – Muscovite – 0.6 – – – – Glauconite – – – – 0.2 – Barite 2.4 – – – 0.2 0.8 Pyrite 21.2 – – – 0.8 5.1 Fe-hydroxides 4.8 2.2 1.2 0.6 0.2 0.8 Leucoxene 0.6 3.2 7.8 2.4 3.6 3.8 Apatite (biogenic) – 0.2 – 0.2 0.2 1 Dark ore minerals 15.8 44.1 60.6 35.2 22.2 18.8 Translucent allothigenic minerals (sum%) 55.2 47.3 30.2 61 71.8 69.5 Garnets 74.8 46.4 1.4 69.6 71.8 73.3 Zircon 14.6 42 67.8 20.4 3.6 12.2 Tourmaline 2.2 6.8 9.6 4.4 6.2 5.1 Staurolite 0.4 – 3.2 – – – Kyanite – – 0.6 – – – Apatite 0.4 – 6.2 5.2 15.4 7.8 Rutile 0.6 3.4 8 0.2 1.8 1.3 Titanite 6 – – – – – Anatase – – 0.6 – – – Ti-minerals (weathered) 0.6 0.6 1.6 – 1.2 0.3 Monazite – 0.6 1 0.2 – – Amphibole 0.2 – – – – – Pyroxene 0.2 – – – – – Epidote/Zoisite – 0.2 – – – – Heavy mineral content in fraction (%) 5.78 1.38 2.14 2.54 1.87 1.27
_____________________ – not found.

J.-I. Järvelill et al.: Heavy minerals in Lemme
81
The lattice parameter of garnet-1 was close to that of almandine (Fe garnet, a = 11.526 Å). It was also the predominant component of Lemme garnets, forming 70–80% of all garnets in all the samples. The lattice parameter of garnet-2 was close to that of spessartine (Mn garnet, a = 11.621 Å). Spessartine was likely part of garnet-2 in the Lemme samples. The registered spes-sartine/almandine ratio in the tills of southern Finland is approximately 1:10 (Al-Ani & Ahtola 2014). In reality, the lattice parameter of garnet depends on the Fe–Mg–Mn–Ca ratio in the crystal lattice. The SEM/EDX micro-analysis of some garnet grains from Lemme indicated that the composition was close to that of almandine with minor Mg (2–3 atom%), Ca (0.3–1 atom%) and Mn (0.4–0.5 atom%). When compared to pure almandine, the lattice parameter of Lemme garnet-1 was slightly larger; consequently, the effect of large cations Ca and Mn was stronger than the opposite effect of smaller Mg ions on average (the effect of Ca substitution was 5 times greater than that of Mg, and the effect of Mn was 1.4 times greater).
The garnets in the Devonian samples were different. Two discrete garnets were clearly distinguishable in some samples (double peaks). The average lattice parameter values of both components were slightly larger than in the Lemme samples, and the variability was greater as well:
garnet-1 (fraction 0.05–0.1 mm, five samples) a = 11.550 Å (st. dev. 0.007 Å), garnet-2 (fraction 0.05–0.1 mm, five samples) a = 11.610 Å (st. dev. 0.016 Å).
A greater difference between the Devonian and Lemme garnets occurred in opposite proportions of their components (Fig. 1B); in the Devonian samples, garnet-2 dominated over garnet-1. It is still unclear whether the garnet in the Devonian sandstone was so different from the Lemme garnet because it originated from different types of rock or because of changes that occurred after sedimentation.
The garnet content determined via the XRD method roughly corresponded to the optical microscopy results (Fig. 2A). The XRD method provided a somewhat larger result in the case of the Lemme samples (an average relative difference of 15%). This could be explained by above-average garnet grain sizes in the analysed 0.05–0.1 mm fraction.
Amphiboles Amphiboles were the second main component among the heavy minerals of the Lemme samples, so it was possible to perform a detailed XRD analysis. Quantitative analysis of amphiboles using the Rietveld method was
Table 7. Results of X-ray diffractometry of Devonian sandstone samples (wt% of quantified components, fraction 0.05–0.1 mm)
Minerals Heimtali 422-16 Luutsniku 451-4351
Põlva 72-1 Põlva 72-13 Taagepera 4 Taagepera 10
Garnet-1 16.2 8.4 – 20.6 10.0 17.2 Garnet-2 27.3 17.8 – 42.5 22.0 35.7 Zircon 6.4 24.5 26.6 11.4 0.8 3.5 Rutile 4.2 10.8 15.4 3.4 2.2 2.8 Schorl 1.2 9.1 11.6 5.2 5.2 4.5 Hematite 2.0 3.7 11.7 0.7 0.4 – Anatase – 4.0 6.1 0.8 0.5 0.4 Apatite – – 2.2 2.6 11.2 4.3 Pyrite 20.7 – – – 0.7 4.7 Marcasite 2.3 – – – – – Titanite 2.5 – – – – – Traces near the detection limit or not detected Chamosite – – – – 0.8 0.5 Ilmenite 1.0 1.5 1.9 0.8 0.8 0.5 Magnetite 0.3 0.0 – 0.3 0.0 – Goethite – 1.5 – – – – Excluded from the heavy mineral assemblage Quartz 15.8 18.7 24.5 11.9 43.9 7.8 Dolomite – – – – 1.3 18.3 XRD intensity (1.7 Å, area) 123.7 300.1 366.9 271.4 91.2 127.0 ______________________ Pseudorutile not quantified by XRD, intensities of the 1.7 Å reflection correlate with dark ore data from optical microscopy; – not found.

Estonian Journal of Earth Sciences, 2019, 68, 2, 76–87
82
more accurate when using the atom coordinates of the same or a similar mineral variety. We searched databases for amphibole varieties with lattice parameters similar to those of the Lemme amphiboles, and found that Mg-hornblende from southwestern Finland was the closest (Mancini et al. 1996) (Table 8).
Different amphiboles have been found in southern Finland (pargasite, potassium pargasite, Fe-hornblende and actinolite), but their lattice parameters differ from those of Lemme amphiboles. Two Lemme amphibole grains were identified via SEM/EDX analysis, whereas the composition of one grain was similar to that of the Mg-hornblende described in the study by Mancini et al. (1996).
The determination of the amphibole content in the Lemme samples detected via the XRD method correlated well with the optical microscopy results, but were systematically smaller (a relative difference of 20–30%). The reason for this is unknown.
Only occasional traces of amphiboles could be detected in the analysed Devonian samples (see Table 6), with contents remaining below the detection limit of the XRD analysis. According to the heavy mineral analysis database of the TalTech GD (more than 1000 analyses by optical microscopy), the average content of amphiboles
is low in Devonian rocks in South Estonia. Devonian rocks as provenance for amphibole could be ruled out in the Lemme area.
Zircon The heavy minerals of the Lemme samples contained 6% zircon on average (0.05–0.1 mm fraction; calculated by mass percentage determined by optical microscopy). The XRD analysis showed a considerably smaller amount. The XRD method worked at this concentration level, but a detailed analysis was difficult to perform. Some of the Devonian samples had a high zircon content, but the XRD results again showed lower contents compared to those obtained by counting under the optical microscope. Figure 3 shows the percentage of zircon in translucent heavy minerals, which allowed a comparison between the data from the Lemme and Devonian samples (the quantitative analysis of the bulk sample was obstructed by the pseudorutile content in the Devonian samples). One possible reason for divergent zircon analysis results obtained by the two methods was that the zircon grains in the fraction were smaller than average in the Lemme samples because the zircon content in heavy minerals increased as the grain size decreased (Table 9).
A B
Fig. 2. Garnet mass percentage of translucent heavy minerals in the 0.05–0.1 mm fraction. A comparison of the two methods (A)and garnet components of different lattice parameters in the Lemme and Devonian samples (B).
Table 8. Lattice parameters (a, b, c), angle (β) and unit cell volume (V) of amphiboles from Lemme and southwestern Finland (Sääksjärvi). The standard deviations of the Lemme samples are shown in brackets (six samples of 0.05–0.1 mm and nine samples of 0.1–0.25 mm)
Sample a (Å) b (Å) c (Å) (deg) V (Å3)
Lemme 0.1–0.25 mm 9.854 (0.002) 18.118 (0.005) 5.311 (0.003) 104.85 (0.02) 916.5 (0.5) Lemme 0.05–0.1 mm 9.853 (0.003) 18.120 (0.004) 5.311 (0.005) 104.85 (0.04) 916.6 (0.9) Sääksjärvi (Mancini et al.
1996) 9.857 18.112 5.309 104.81 916.33

J.-I. Järvelill et al.: Heavy minerals in Lemme
83
Fig. 3. The mass percentage of zircon in translucent heavy minerals in the 0.05–0.1 mm fraction.
Table 9. Zircon percentage in heavy minerals of the Lemme samples and the surrounding nearshore sediments of Pärnu Bay (Lutt & Popova 1993) (counting results of the optical microscopy analysis)
Location Fraction 0.01–0.05 mm
Fraction 0.05–0.1 mm
Fraction 0.1–0.25 mm
Lemme 0 4.9 1.5 Pärnu Bay 6.5 3.2 0.8
The XRD quantitative analysis was also influenced
by defects in the crystal lattice of zircon, which were caused by the decay of radioactive elements in zircon, namely uranium and thorium. The crystallinity of zircon could be improved via heating. Our heating test with the Lemme-5 sample (920 °C, 3 h) showed an increase in the intensity of zircon reflections (15% when heating grains and 30% when heating powder).
Magnetite and hematite The magnetite and hematite contents of the Lemme samples were correlated (Fig. 4A), likely due to their similar densities (5.17 g/cm3 and 5.26 g/cm3). The con-ditions that influenced the composition of heavy minerals varied for different layers of the Lemme section, which made some samples (layers) rich in minerals of higher density and others rich in lighter amphibole (with a density of 3–3.5 g/cm3). Through shear sorting, heavy minerals are concentrated in thin laminations as described by Inman et al. (1966) and Bagnold (1956). The XRD and SEM/EDX methods were used to conduct a more detailed study of magnetite and hematite in magnetically separated fractions in the Lemme-5 sample. The fractions were separated using a hand-held magnet. The magnetite fraction (fraction 1)
Fig. 4. The positive correlation between Lemme magnetite and hematite (A) and the negative correlation between Lemme magnetite and amphiboles (B).
was separated at a distance of 1 cm and the hematite fraction (fraction 2) was separated from the remaining part at a distance of 1 mm. The results of the XRD analysis are provided in Table 10.
Twenty-two grains of Fe oxide (with an 80% chance of being magnetite) were analysed from the polished preparation of the magnetite fraction. The Ti impurity did not exceed 1.3%, and its average content was 0.31%. The average content of vanadium impurity was 0.17%. The Lemme magnetite (lattice parameter a = 8.397 Å) was close to a pure variety. According to the International Centre for Diffraction Data database, the lattice parameter of synthetic varieties of magnetite is 8.394–8.396 Å, with a Ti impurity increasing it linearly by approximately 0.006 Å per 1%.
Five grains of Fe oxide (with a 99% chance of being hematite) were analysed from the polished preparation of the hematite fraction. The Ti impurity was 0.3–4.4% in all grains (1.6% on average). As it was suspected that the polished preparation had been contaminated with Ti
Estonian Journal of Earth Sciences, 2019, 68, 2, 76–87
84
Table 10. Results of the X-ray diffractometry analysis of the magnetic fractions of the Lemme-5 sample
Fraction Magnetite (%)
Hematite (%)
Ilmenite (%)
Rutile (%)
Quartz (%)
Fraction 1 76.4 19.1 3.7 0.3 0.5 Fraction 2 1.1 84.8 10.4 2.3 1.3
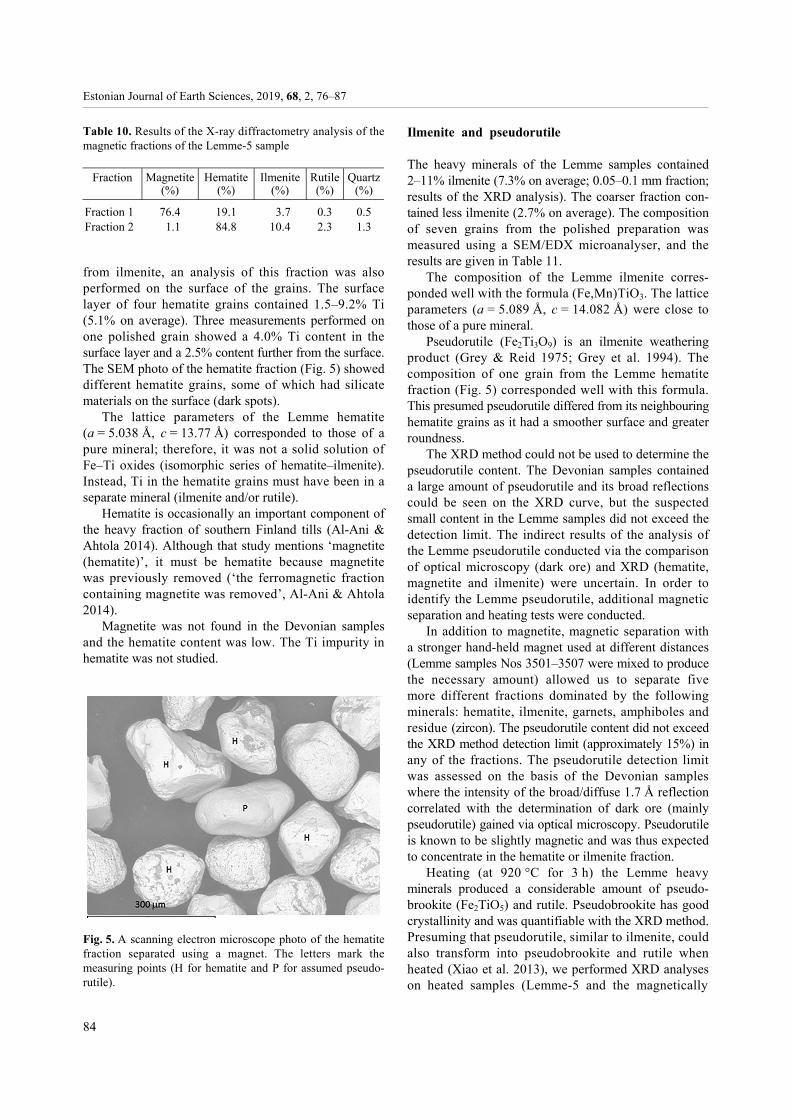
from ilmenite, an analysis of this fraction was also performed on the surface of the grains. The surface layer of four hematite grains contained 1.5–9.2% Ti (5.1% on average). Three measurements performed on one polished grain showed a 4.0% Ti content in the surface layer and a 2.5% content further from the surface. The SEM photo of the hematite fraction (Fig. 5) showed different hematite grains, some of which had silicate materials on the surface (dark spots).
The lattice parameters of the Lemme hematite (a = 5.038 Å, c = 13.77 Å) corresponded to those of a pure mineral; therefore, it was not a solid solution of Fe–Ti oxides (isomorphic series of hematite–ilmenite). Instead, Ti in the hematite grains must have been in a separate mineral (ilmenite and/or rutile).
Hematite is occasionally an important component of the heavy fraction of southern Finland tills (Al-Ani & Ahtola 2014). Although that study mentions ‘magnetite (hematite)’, it must be hematite because magnetite was previously removed (‘the ferromagnetic fraction containing magnetite was removed’, Al-Ani & Ahtola 2014).
Magnetite was not found in the Devonian samples and the hematite content was low. The Ti impurity in hematite was not studied.
Fig. 5. A scanning electron microscope photo of the hematite fraction separated using a magnet. The letters mark the measuring points (H for hematite and P for assumed pseudo-rutile).
Ilmenite and pseudorutile The heavy minerals of the Lemme samples contained 2–11% ilmenite (7.3% on average; 0.05–0.1 mm fraction; results of the XRD analysis). The coarser fraction con-tained less ilmenite (2.7% on average). The composition of seven grains from the polished preparation was measured using a SEM/EDX microanalyser, and the results are given in Table 11.
The composition of the Lemme ilmenite corres-ponded well with the formula (Fe,Mn)TiO3. The lattice parameters (a = 5.089 Å, c = 14.082 Å) were close to those of a pure mineral.
Pseudorutile (Fe2Ti3O9) is an ilmenite weathering product (Grey & Reid 1975; Grey et al. 1994). The composition of one grain from the Lemme hematite fraction (Fig. 5) corresponded well with this formula. This presumed pseudorutile differed from its neighbouring hematite grains as it had a smoother surface and greater roundness.
The XRD method could not be used to determine the pseudorutile content. The Devonian samples contained a large amount of pseudorutile and its broad reflections could be seen on the XRD curve, but the suspected small content in the Lemme samples did not exceed the detection limit. The indirect results of the analysis of the Lemme pseudorutile conducted via the comparison of optical microscopy (dark ore) and XRD (hematite, magnetite and ilmenite) were uncertain. In order to identify the Lemme pseudorutile, additional magnetic separation and heating tests were conducted.
In addition to magnetite, magnetic separation with a stronger hand-held magnet used at different distances (Lemme samples Nos 3501–3507 were mixed to produce the necessary amount) allowed us to separate five more different fractions dominated by the following minerals: hematite, ilmenite, garnets, amphiboles and residue (zircon). The pseudorutile content did not exceed the XRD method detection limit (approximately 15%) in any of the fractions. The pseudorutile detection limit was assessed on the basis of the Devonian samples where the intensity of the broad/diffuse 1.7 Å reflection correlated with the determination of dark ore (mainly pseudorutile) gained via optical microscopy. Pseudorutile is known to be slightly magnetic and was thus expected to concentrate in the hematite or ilmenite fraction.
Heating (at 920 °C for 3 h) the Lemme heavy minerals produced a considerable amount of pseudo-brookite (Fe2TiO5) and rutile. Pseudobrookite has good crystallinity and was quantifiable with the XRD method. Presuming that pseudorutile, similar to ilmenite, could also transform into pseudobrookite and rutile when heated (Xiao et al. 2013), we performed XRD analyses on heated samples (Lemme-5 and the magnetically
J.-I. Järvelill et al.: Heavy minerals in Lemme
85
separated fractions of Lemme samples 3501–3507). The control heating test with the ilmenite from the TalTech GD confirmed the formation of pseudobrookite and rutile with the mass ratio of 3:1 according to the following formula:
2FeTiO3 + O Fe2TiO5 + TiO2.
The heating of the Lemme samples produced more pseudobrookite and less rutile than expected from ilmenite thermal transformation; it could not be explained by the contribution from the pseudorutile. One explanation could be that pseudobrookite formed at the expense of the rutile in hematite grains (Fe2O3 + TiO2 Fe2TiO5).
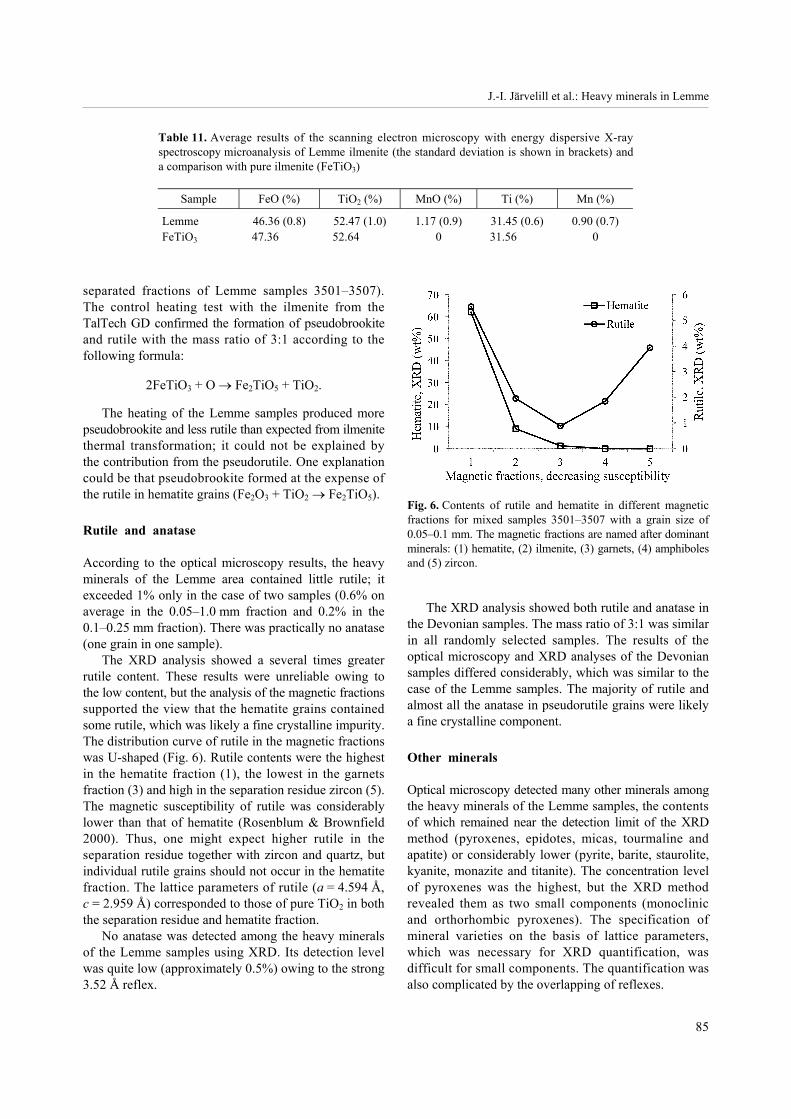
Rutile and anatase According to the optical microscopy results, the heavy minerals of the Lemme area contained little rutile; it exceeded 1% only in the case of two samples (0.6% on average in the 0.05–1.0 mm fraction and 0.2% in the 0.1–0.25 mm fraction). There was practically no anatase (one grain in one sample).
The XRD analysis showed a several times greater rutile content. These results were unreliable owing to the low content, but the analysis of the magnetic fractions supported the view that the hematite grains contained some rutile, which was likely a fine crystalline impurity. The distribution curve of rutile in the magnetic fractions was U-shaped (Fig. 6). Rutile contents were the highest in the hematite fraction (1), the lowest in the garnets fraction (3) and high in the separation residue zircon (5). The magnetic susceptibility of rutile was considerably lower than that of hematite (Rosenblum & Brownfield 2000). Thus, one might expect higher rutile in the separation residue together with zircon and quartz, but individual rutile grains should not occur in the hematite fraction. The lattice parameters of rutile (a = 4.594 Å, c = 2.959 Å) corresponded to those of pure TiO2 in both the separation residue and hematite fraction.
No anatase was detected among the heavy minerals of the Lemme samples using XRD. Its detection level was quite low (approximately 0.5%) owing to the strong 3.52 Å reflex.
Fig. 6. Contents of rutile and hematite in different magnetic fractions for mixed samples 3501–3507 with a grain size of 0.05–0.1 mm. The magnetic fractions are named after dominant minerals: (1) hematite, (2) ilmenite, (3) garnets, (4) amphiboles and (5) zircon.
The XRD analysis showed both rutile and anatase in the Devonian samples. The mass ratio of 3:1 was similar in all randomly selected samples. The results of the optical microscopy and XRD analyses of the Devonian samples differed considerably, which was similar to the case of the Lemme samples. The majority of rutile and almost all the anatase in pseudorutile grains were likely a fine crystalline component.
Other minerals Optical microscopy detected many other minerals among the heavy minerals of the Lemme samples, the contents of which remained near the detection limit of the XRD method (pyroxenes, epidotes, micas, tourmaline and apatite) or considerably lower (pyrite, barite, staurolite, kyanite, monazite and titanite). The concentration level of pyroxenes was the highest, but the XRD method revealed them as two small components (monoclinic and orthorhombic pyroxenes). The specification of mineral varieties on the basis of lattice parameters, which was necessary for XRD quantification, was difficult for small components. The quantification was also complicated by the overlapping of reflexes.
Table 11. Average results of the scanning electron microscopy with energy dispersive X-ray spectroscopy microanalysis of Lemme ilmenite (the standard deviation is shown in brackets) and a comparison with pure ilmenite (FeTiO3)
Sample FeO (%) TiO2 (%) MnO (%) Ti (%) Mn (%)
Lemme 46.36 (0.8) 52.47 (1.0) 1.17 (0.9) 31.45 (0.6) 0.90 (0.7) FeTiO3 47.36 52.64 0 31.56 0

Estonian Journal of Earth Sciences, 2019, 68, 2, 76–87
86
There was always quartz in the heavy mineral fraction of the Lemme samples. The feldspar impurity usually remained below the detection limit. It is likely that quartz was stuck on other mineral grains. It could also be found in magnetically separated fractions. Quartz and dolomite were not included in the assemblage of heavy minerals. CONCLUSIONS Heavy minerals in Lemme mostly originated from the Svecofennian Domain of the Fennoscandian (Baltic) Shield, which provided most of the garnets, amphiboles, ilmenite and magnetite. Nevertheless, some of the heavy minerals likely originated from Estonian Devonian rocks; indicator minerals should be pseudorutile and some varieties of garnets.
Detailed analysis of different minerals helped us to determine their parent rocks from the Finnish part of the Svecofennian Domain. Our study provides a reference for the comparison of amphibole lattice parameters, but its fingerprint has every mineral, besides lattice parameters also the accessory elements. This requires a more detailed analysis.
This study relied heavily on XRD analysis, which is not a universal method for studying heavy minerals. An automatized version of SEM/EDX microanalysis would be preferable when analysing a large amount of grains, as it provides more detailed information on the com-position of the minerals (allowing distinction between different mineral varieties). An advantage of the XRD method was shown in distinguishing magnetite–hematite and in situations where microcrystalline Ti oxide impurities (rutile and anatase) occurred in hematite or pseudorutile grains.
The present study shows that it would be reasonable to use XRD together with magnetic separation, which provides a quick overview of the main components of heavy/magnetic minerals without the use of heavy liquid, as most heavy minerals (except zircon) are magnetic. In addition, the lattice parameters of magnetically enriched minerals could be measured more accurately.
Acknowledgements. The samples used in this study were from the geological collection of the Department of Geology, Tallinn University of Technology. The authors are grateful to Mrs Ursula Toom, the head of the department. Gratitude goes to Adam Mickiewicz University in Poznan for the preliminary analysis of some samples. The authors express sincere thanks to V. Zelčs and the anonymous reviewer for their constructive comments and suggestions to improve the quality of the paper and Editage (www.editage.com) for English language editing. The publication costs of this article were partially covered by the Estonian Academy of Sciences.
REFERENCES Al-Ani, T. & Ahtola, T. 2014. Mineralogical Analysis of
Heavy Minerals from Selected Till Samples of Häme Belt, Southern Finland. Geological Survey of Finland, Archive report 167/2013, 21 pp.
Bagnold, R. A. 1956. The flow of cohesionless grains in fluids. Proceedings of the Royal Society of London Series A, 249, 235–297.
Grey, I. E. & Reid, A. F. 1975. The structure of pseudorutile and its role in the natural alteration of ilmenite. American Mineralogist, 60, 898–906.
Grey, I. E., Watts, J. A. & Bayliss, P. 1994. Mineralogical nomenclature: pseudorutile revalidated and neotype given. Mineralogical Magazine, 58, 597–600.
Inman, D. L., Ewing, D. C. & Corliss, J. B. 1966. Coastal sand dunes of Guerrero Negro, Baja California, Mexico. Bulletin of the Geologic Society of America, 77, 787–802.
Järvelill, J.-I., Kleesment, A. & Raukas, A. 2015. Accumulation of heavy minerals in the eastern coast of the Gulf of Riga, south-western Estonia. Bulletin of the Geological Society of Finland, 87, 67–78.
Kemp, S. J., Wagner, D. & Mounteney, I. 2011. Mineralogical Analysis of Heavy Minerals from Stream Sediments, Nigeria. British Geological Survey Internal Report, IR/11/008, 18 pp.
Kessel, H. J. & Raukas, A. V. 1967. The Deposits of the Ancylus Lake and Littorina Sea in Estonia [Pribrezhnye otlozheniya Antsilovo ozera i Litorinovogo morya v Éstonii]. Valgus, Tallinn, 135 pp. [in Russian, with English summary].
Lutt, J. & Popova, L. 1993. Põhjasetete mineraalkoostis [Mineral composition of bottom sediments]. In Eesti Šelfi Geoloogia [Geology of the Estonian Shelf] (Lutt, J. & Raukas, A., eds), pp. 117–138. Estonian Geological Society, Tallinn [in Estonian, with English summary].
Mancini, F., Sillanpää, R., Marshall, B. & Papunen, H. 1996. Magnesian hornblende from a metamorphosed ultramafic body in southwestern Finland: crystal chemistry and petrological implications. Canadian Mineralogist, 34, 835–844.
Raukas, A. 1964. Rasketest mineraalidest Eesti vanades ranniku-setetes [About heavy minerals in Estonian ancient coastal deposits]. In VII Eesti Loodusuurijate Päeva Ettekannete Teesid [VII Estonian Naturalists′ Day, Abstracts of Presentations] (Rõõmusoks, A., ed.), pp. 72–88. Valgus, Tallinn [in Estonian, with Russian and English summaries].
Raukas, A., Koch, R., Jüriado, K. & Järvelill, J.-I. 2014. Anomalous radioactivity level and high concentrations of heavy minerals in Lemme area, South-West Estonia. Baltica, 27, 93–104.
Reintam, L., Raukas, A., Kleesment, A., Moora, T. & Kährik, K. 2001. Podzolization in aeolian sands underlain by gleysol formation, during nine millennia in south-western Estonia. Proceedings of the Estonian Academy of Sciences, Geology, 50, 254–281.
Rosenblum, S. & Brownfield, I. K. 2000. Magnetic Suscepti-bilities of Minerals. U.S. Geological Survey, Open-File Report 99-529, 37 pp.
Webster, J. R., Kight, R. P., Winburn, R. S. & Cool, C. A. 2003. Heavy mineral analysis of sandstones by Rietveld analysis. Advances in X-ray Analysis, 46, 204–209.
Xiao, W., Lu, X., Zou, X., Wei, X. & Ding, W. 2013. Phase transitions, micro-morphology and its oxidation mechanism in oxidation of ilmenite (FeTiO3) powder. Transactions of Nonferrous Metals Society of China, 23, 2439−2445.

J.-I. Järvelill et al.: Heavy minerals in Lemme
87
Raskete mineraalide päritolu Lemme paljandi Kvaternaari setetes, põhinedes optilisele mikroskoopiale, röntgendifraktomeetriale ja skaneerivale elektronmikroskoopiale
Johanna-Iisebel Järvelill, Toivo Kallaste, Anne Kleesment, Siim Pajusaar ja Anto Raukas
Käesolev artikkel on metodoloogiline edasiarendus, kus proovide analüüsimiseks kasutati optilist mikroskoopiat, röntgendifraktomeetriat (XRD) ja skaneerivat elektronmikroskoopi (SEM), saades teada Lemme kvaternaarsete setete koostise ning määrates võimalikud lähtekivimid. Uuriti raskeid mineraale Lemme Kvaternaari läbilõikest Edela-Eestis, võrdluseks analüüsiti Devoni proove Eesti puuraukudest. Lemme rasked mineraalid on valdavas osas pärit kvaternaarses moreenis sisalduvatest Fennoskandia (Balti) kilbi Svekofenni kompleksi kivimitest. Granaat on Lemme proovides peamine raske mineraal, selle põhikomponendi võreparameeter on 11,535 Å, Devoni granaat on erinev, selle põhikomponendi võreparameeter on 11,610 Å. Amfiboolid, ilmeniit ja magnetiit, mis on Lemme proovides olulised komponendid, Devoni proovides praktiliselt puuduvad. Magnetiidi detailuuring andis keskmiseks Ti-sisalduseks 0,3%, võreparameeter 8,397 Å on sellega kooskõlas. Hematiiti on Lemme proovides magnetiidist umbes kaks korda rohkem. Hematiiditerade Ti-sisaldus on suurem pinnakihis (keskmiselt 5%), keskosas keskmiselt 1,6%. XRD-analüüsi alusel on titaan hematiiditerades tõenäoliselt peenkristalse rutiilina. Devoni proovides on peamine maakmineraal pseudorutiil.