Embed Size (px)
Citation preview
catalysts
Review
Proton Exchange Membrane Fuel Cell Reversal:A ReviewCongwei Qin 1,2, Jue Wang 1,2, Daijun Yang 1,2, Bing Li 1,2,* and Cunman Zhang 1,2,*
1 School of Automotive Studies, Tongji University, Shanghai 201804, China; [email protected] (C.Q.);[email protected] (J.W.); [email protected] (D.Y.)
2 Clean Energy Automotive Engineering Center, Tongji University, Shanghai 201804, China* Correspondence: [email protected] (B.L.); [email protected] (C.Z.);
Tel.: +86-21-6958-3891 (B.L.); +86-21-6958-3850 (C.Z.)
Academic Editors: David Sebastián and Vincenzo BaglioReceived: 19 July 2016; Accepted: 10 September 2016; Published: 8 December 2016
Abstract: The H2/air-fed proton exchange membrane fuel cell (PEMFC) has two major problems: costand durability, which obstruct its pathway to commercialization. Cell reversal, which would createirreversible damage to the fuel cell and shorten its lifespan, is caused by reactant starvation, loadchange, low catalyst performance, and so on. This paper will summarize the causes, consequences,and mitigation strategies of cell reversal of PEMFC in detail. A description of potential change in theanode and cathode and the differences between local starvation and overall starvation are reviewed,which gives a framework for comprehending the origins of cell reversal. According to the root factorof cell starvation, i.e., fuel cells do not satisfy the requirements of electrons and protons of normalanode and cathode chemical reactions, we will introduce specific methods to mitigate or prevent fuelcell damage caused by cell reversal in the view of system management strategies and componentmaterial modifications. Based on a comprehensive understanding of cell reversal, it is beneficial tooperate a fuel cell stack and extend its lifetime.
Keywords: PEMFC; cell reversal; starvation; mitigation strategies
1. Introduction
At present, the proton exchange membrane fuel cell is the most promising energy system usedin commercialized electric vehicles; it has the following advantages: low-temperature operation(50–100 ◦C), high power density (40%–60%), nearly zero pollutants compared to conventional internalcombustion gasoline vehicles, simple structure, and so on [1,2]. However, during the PEMFCtechnological development, there are two primary barriers to commercialization—durability andcost [3].
Cell polarity reversal occurs frequently in standard fuel cell operating conditions. In such acondition, there is some irreversible damage to fuel cell stack material, including flow field plate,membrane electrode assembly (MEA), and other constructional elements, which seriously affects thedurability of PEMFC. There are two principal approaches to solving this problem. The first is a systemcontrol strategy whereby specially designed software would monitor anode and cathode outlet exhaustgas composition, cell voltage, and local density variation response. The software would then regulatefuel/air stoichiometry, cell temperature, current density, water management, and any other operatingparameters to minimize fuel cell reversal damage [4–6]. Although the system control strategy can bean effective and efficient method to extend a fuel cell’s lifespan, it would require a peripheral sensor tomonitor and feedback information, and even to regulate the system parameters for steady operation.In fact, it does not take long for cell reversal damage to occur. The extra equipment involved wouldnot only increase system complexity and decrease cost efficiency, but also cannot address cell reversal
Catalysts 2016, 6, 197; doi:10.3390/catal6120197 www.mdpi.com/journal/catalysts
Catalysts 2016, 6, 197 2 of 21
in time. Therefore, there is a second more direct strategy, system hardware material modification.Because all forms of cell reversal damage eventually lead to system material degradation, optimizedmaterials would minimize cell reversal and improve fuel cell durability in nature. This paper presentsthe causes, types of damage, and improvement approaches related to cell reversal in a fuel cell.
2. PEMFC Cell Reversal Description
In a single fuel cell or fuel cell stack system, electrode potential drives chemical reactions, includinghydrogen oxidation reaction (HOR), oxygen reduction reaction (ORR), carbon corrosion, and waterelectrolysis. In normal operations, there are excess hydrogen and air supplied to the anode and cathode,respectively. HOR and ORR take place in the anode and cathode, respectively, to produce sufficientamounts of electrons and protons. Nevertheless, there are many extreme operations or conditions,such as insufficient supply of reactant [5–7], low catalyst performance, uneven gas distribution, drasticcurrent load change, and startup or shutdown operations [8], which would result in potential change.In PEMFC cell reversal, the experiment polarity curve shows that the anode potential increases andthe cathode potential decreases, narrowing the electric potential difference and even reversing forseveral seconds. The fuel cell stack cannot work normally anymore and will consume energy insteadof supplying energy. As a result, hydrogen and oxygen would be present in the wrong electrodecomponents of fuel cell, which induces a corresponding potential change. In each cavity, all kindsof matter spontaneously recombine and react with each other to make the system right. However,because of the wrong initial conditions, the result cannot match what the fuel cell should be.
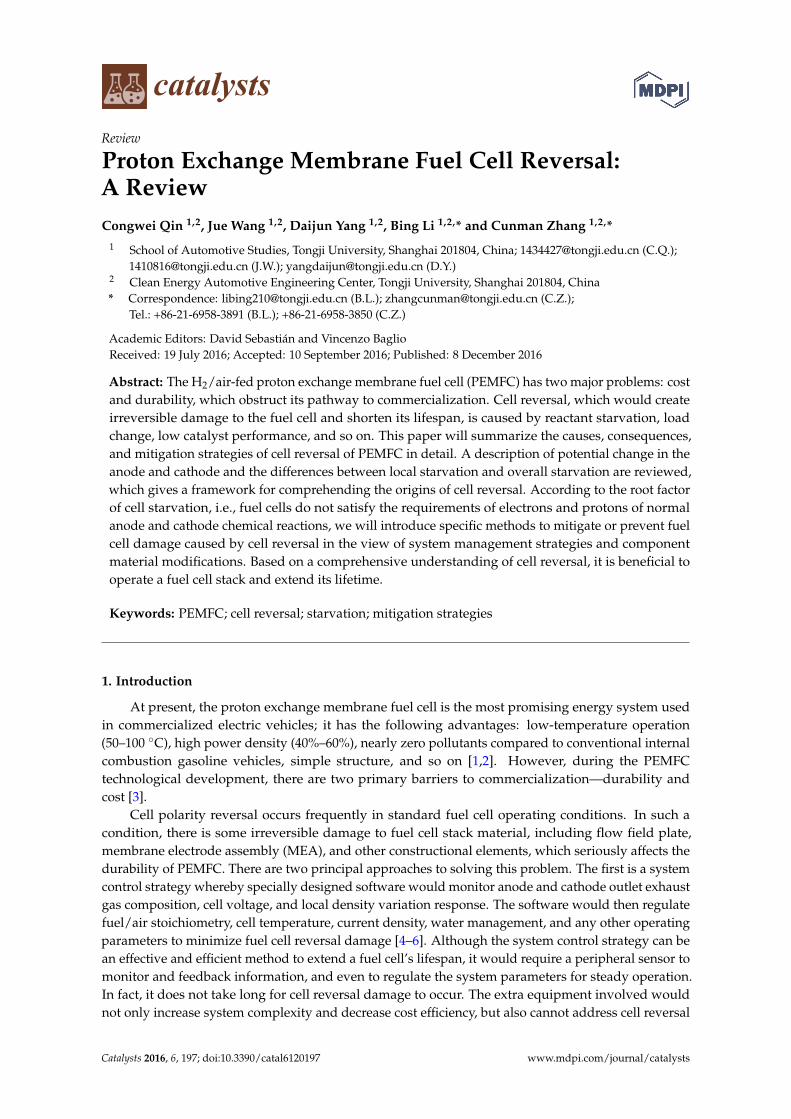
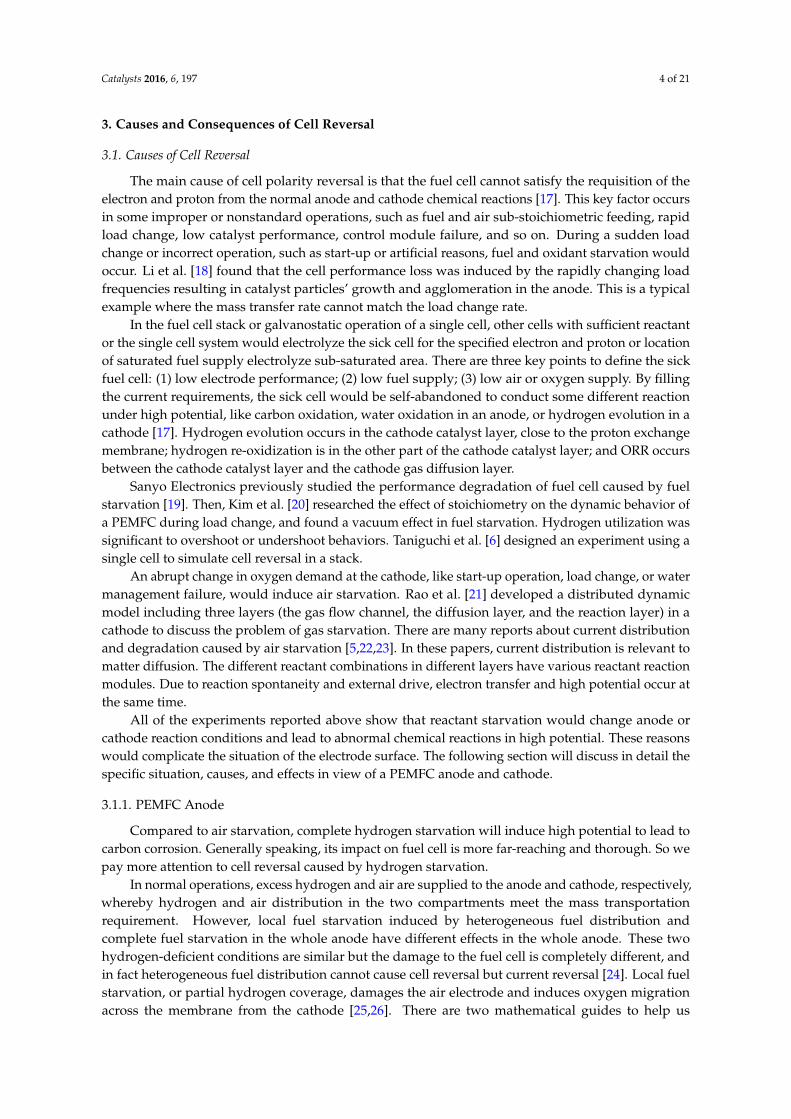
As shown in Figure 1, the fuel cell was subjected to cell reversal test experiment (hydrogenstarvation). Figure 1 illustrates the time-dependent change in the anode and cathode potentials versusRHE in hydrogen starvation. The cell terminal voltage quickly changed to a negative voltage, from 1.0to −2.0 V [6]. This will be discussed in more detail in Section 3.1.1.44 A. Taniguchi et al. / Journal of Power Sources 130 (2004) 42–49
connected to a standard hydrogen electrode by a H2SO4electrolyte junction was used as shown inFig. 1. For thisexperiment, the cell housing made from PTFE, the cell B,was used. The current collectors were made from titanium.The periphery of the electrode was filled with 1 M H2SO4aqueous solution. A Viton® gasket is located between elec-trode and H2SO4 aqueous solution. The standard hydrogenelectrode was connected to the membrane at the peripheryof the electrode by 1 M H2SO4 aqueous solution as shownin our previous paper[16].
2.4. Characterization by TEM, EDX, and XPS
A small piece was removed from the MEA for preparationof the TEM sample and carbon paper was peeled from bothplane of this piece. The cross-section of the MEA samplewas prepared via epoxy impregnation and ultramicrotomesectioning using a diamond knife. Samples for the TEM ob-servations were directly supported on a copper mesh witha carbon micro-grid. The TEM observation was performedusing a JEOL JEM-3000F electron microscope at an accel-erating voltage of 300 kV. The particle size distribution mea-surements were performed on digital images using the im-age analyzing software Image-Pro. The TEM was equippedwith a nano-EDX device for analysis of the elemental com-position in the nanosize region.
A small piece of a MEA sample was also characterizedon a larger scale using a field emission scanning electronmicroscope (SEM, JSM-6700FA, Jeol) equipped with EDX(EX-2300BU, Jeol) for elemental analysis of the MEAs.
For the XPS measurements, a small piece removed fromthe MEA and carbon paper on both sides was placed on thesample holder. XPS measurements of the catalyst layer wereperformed using a SHIMADZU ESCA-3400. Since repro-ducible separation of the catalyst layer from the membraneafter hot-pressing is very difficult, the XPS was measuredon the back surface of the catalyst layer after separation ofthe carbon paper.
3. Results and discussion
Cell reversal occurs when the fuel cell stack is loaded andnot enough fuel is supplied to the anode. Drawing excessivecurrent from any one cell—more than its fuel delivery canproduce—can lead to cell reversal. In this study, an exper-iment using a single cell that mimics the cell reversal in astack was carried out. After the cell reversal degradation ex-periment under the condition of 100% fuel utilization usingexternal direct-current power sources, various characteriza-tions was carried out.
The potential change of the cell terminal voltage and in-dividual electrodes during the cell reversal experiment wasmeasured using the cell B connected to a reference elec-trode by an electrolyte junction. The typical time-dependentchange of the cell terminal voltage during an experiment
Fig. 2. The time-dependent changes of the anode and cathode potentialduring the cell reversal experiment.
is shown in Fig. 2. In addition, this figure shows thetime-dependent change of the anode and cathode potentialsversus RHE. It was observed that the cell terminal volt-age rapidly dropped to the negative voltage and the MEAchanges polarity due to cell reversal as soon as the experi-ment started. After this initial rapid drop, the cell terminalvoltage showed a steady decrease with time. Cell reversaloccurred when the anode potential increased and becamemore positive than the cathode potential. The anode poten-tial quickly increased to near 1.5 V. This result indicatesthat the anode potential increased until water electrolysisoccurs as soon as the experiment started since the anodewas starved of fuel[9].
Fig. 3 showsI–V curves of the cell after different exper-imental periods during the cell reversal test using the cellA. These curves were measured under the condition whereenough hydrogen fuel containing 50 ppm CO was supplied.The original performance of the cell was lowered by increas-ing the experimental time. Especially, the performance of
Fig. 3. The change in current–voltage performance of PEMFC by cellreversal experiment: (a) before experiment; (b) after experiment for 3 min;and (c) after experiment for 7 min.
Figure 1. Anode and cathode potential change experienced cell reversal caused by hydrogen starvation.Reproduced with permission from [6]. Copyright Elsevier, 2004.
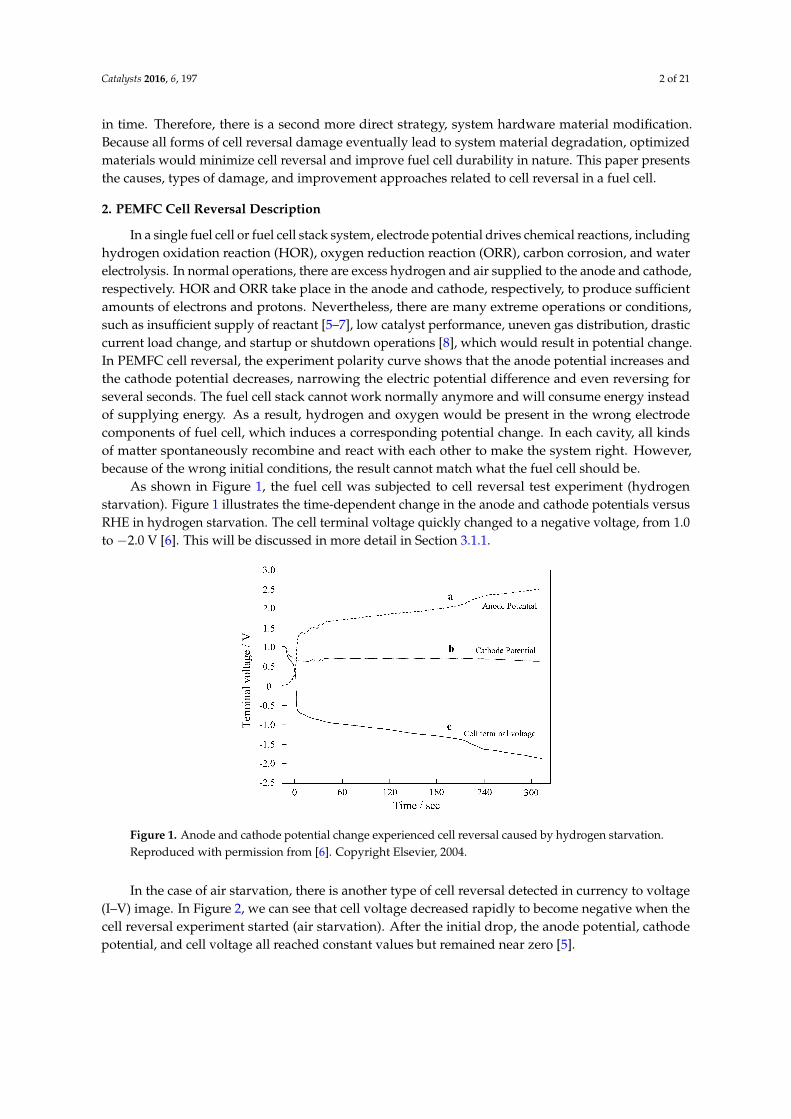
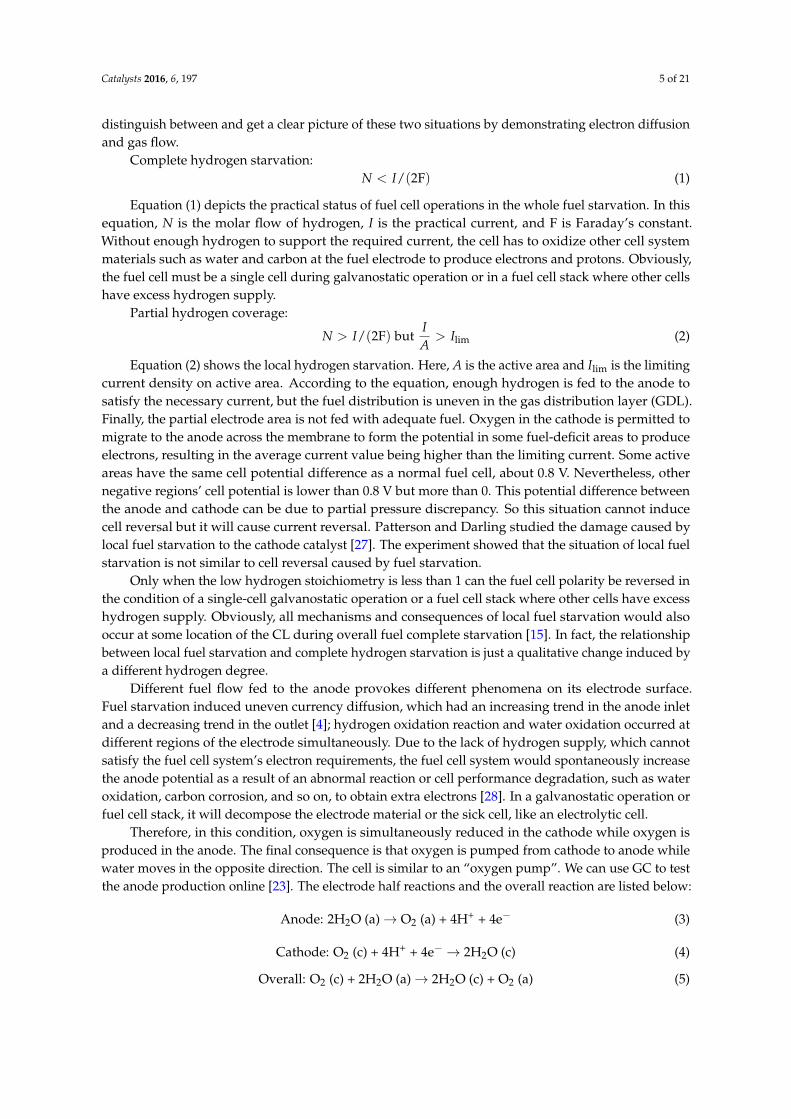
In the case of air starvation, there is another type of cell reversal detected in currency to voltage(I–V) image. In Figure 2, we can see that cell voltage decreased rapidly to become negative when thecell reversal experiment started (air starvation). After the initial drop, the anode potential, cathodepotential, and cell voltage all reached constant values but remained near zero [5].
Catalysts 2016, 6, 197 3 of 21
Fig. 3 shows I2V curves of the cell after different experi-
mental periods during the cell-reversal test using cell A.
These curves were measured when enough air, 300 cc=min,
was supplied. An increase in the experimental time lowered
the original performance of the cell. The internal resistance
did not show an obvious change with the experimental time.
With pure hydrogen fuel, the anode overpotential can usually
be considered to be almost negligible [20]. Therefore, this
degradation may be attributed to the deterioration of oxygen
reduction performance of the cathode catalyst.
In situ cyclic voltammetry is useful for assessing the
electrochemically active surface area of the MEA catalyst
layer. This method was used to compare the electrochemi-
cally active surface area of the fuel cell cathodes. Fig. 4 shows
the cyclic voltammograms before and after the cell-reversal
experiments. The effect of cell reversal on hydrogen adsorp-
tion and desorption is shown. The hydrogen adsorption and
desorption area, the electrochemically active surface area of
the cathode, decreased during the cell-reversal experiments.
First, we showed that the process of the cyclic voltammetry
measurement itself did not contribute to the hydrogen
adsorption and desorption features. Therefore, these findings
mean that the electrochemically active surface area de-
creased with the duration of the cell-reversal experiment.
The time dependency of the electrochemically active surface
area derived from the hydrogen desorption area is shown in
Fig. 5. The electrochemically active surface area decreased
with time and was saturated at a decrease of approximately
46% at 120 min of cell reversal, as shown in Fig. 5 (solid line b).
However, this change cannot be attributed solely to cell
reversal. The electrochemically active surface area of MEA
decreases to some extent upon normal fuel cell operation at
the same current density with adequate air supply. The time
dependency of the electrochemically active surface of MEA in
normal cell operation is also shown in Fig. 5 (dashed line a).
Such a decrease in the electrochemically active surface of
platinum can usually be seen in new MEA at an early stage of
cell operation. However, this figure suggests that the decrease
in the electrochemically active surface area in cell-reversal
experiment is much greater than in normal operation.
A TEM analysis was performed on the cathode catalyst layer
of the MEA. Fig. 6 shows TEM images of the sample at the air
outlet region, location B, before and after the cell-reversal
experiment for 120 min. In the sample before the experiment,
the smallest detected particles have a size of 1.0–2.0 nm,
as can be seen in the image (Fig. 6a). However, these smallest
particles disappeared and particles grew in the image of the
sample after the cell-reversal experiment, as seen in Fig. 6b.
Fig. 7 shows the particle size distribution for cathode catalysts
determined from the TEM images. The average particle size
increased from 2:81 nm, the value before experiment, not only
ARTICLE IN PRESS
Term
inal
vol
tage
/ V
Time / sec
Cathode Potential
Anode Potential
Cell terminal voltage
-0.2
0.4
0.6
0.8
1.2
0 60 120 180 240 300-0.2
0.0
0.2
0.4
0.6
0.8
1.0
1.2
-0.2
0.4
0.6
0.8
1.2
-0.2
0.0
0.2
0.4
0.6
0.8
1.0
1.2
Time / sec
Term
inal
vol
tage
/ V
-0.2
0.0
0.2
0.4
0.6
0.8
1.0
1.2
0 15105
Fig. 2 – Time-dependent changes in the anode and cathode potential during the cell-reversal experiment.
0.0
0.1
0.2
0.3
0.4
0.5
0.6
0.7
0.8
0.9
1.0
0
a
b cCel
l vol
tage
/ V
Current density / mA cm-2600500400300200100
Fig. 3 – Change in current–voltage performance of PEMFC in
a cell-reversal experiment: (a) before experiment, (b) after
experiment for 10 min and (c) after experiment for 120 min.
I N T E R N AT I O N A L J O U R N A L O F H Y D R O G E N E N E R G Y 3 3 ( 2 0 0 8 ) 2 3 2 3 – 2 3 2 92326
Figure 2. Anode and cathode potential change in cell reversal caused by oxygen starvation. Reproducedwith permission from [5]. Copyright Elsevier, 2008.
Fuel starvation results in a markedly different level of cell reversal compared to air starvation.Cell terminal voltage is much larger with low fuel feed compared to low air feed. The damage tomaterial under low potential is less serious than the high potential caused by hydrogen starvation.From this point, we can understand that the damage of fuel starvation could be caused by gas supplyand flow field diffusion. In view of keeping reactant diffusion steady, and considering gas diffusionlayer design, flow field design, and membrane gas permeation, the assembly of different layers shouldattract more attention. In the meantime, how to eliminate interface effect is also a point to be researched.Steadier system operation conditions will mean a longer lifetime.
Due to the carbon corrosion in cell reversal, polarity curve, gas chromatography (GC) anddifferential electrochemical mass spectrometry (DEMS) can be the main in situ measurements toanalyze the extent of carbon corrosion, the exhaust gas compositions, and the anode or cathode outletcontents [9–11]. These techniques can realize online detection of carbon dioxide generated by carboncorrosion. After cell reversal, energy dispersive X-ray analysis (EDX), transmission electron microscopy(TEM) [6], scanning electron microscopy (SEM), X-ray diffraction (XRD), electrochemical impedancespectrum (EIS), inductively coupled plasma (ICP), and Raman Spectroscopy are the main meansused to characterize the status of the catalyst layer (CL), catalyst nanoparticles sintering, and carboncorrosion extent [10,12–15]. These methods analyze CL morphology, catalyst distribution, elementalcontent, atomic structure, and impedance, respectively.
In a fuel cell reversal system experiment, there is a three-step protocol to test and categorize theelectrode’s reversal tolerance [16]. The point of this protocol is to build fuel starvation by replacing H2
content with humidified N2 to measure the performance of MEA after cell reversal. Specifically, Step 1,MEA should be in the condition of cell reversal for a long time, with a period of H2 supply. Step 2,MEA is in the cycle between cell reversal and normal H2 supply every 30 s. Step 3, MEA would be incell reversal until the cell potential is −2.0 V. In the whole test procedure, the anode outlet air wouldbe measured for the concentration of CO2 and O2.
To simulate and design cell reversal experiment, sub-stoichiometric reactant feeding is the firststep. Then, regulating the fuel and air ratio should take a more important place for cell reversal dataimage. The data collection should include I–V image, different electrode potential of time-dependentlike Figures 1 and 2, localized current and potential change across the electrode plane, and so on.
Catalysts 2016, 6, 197 4 of 21
3. Causes and Consequences of Cell Reversal
3.1. Causes of Cell Reversal
The main cause of cell polarity reversal is that the fuel cell cannot satisfy the requisition of theelectron and proton from the normal anode and cathode chemical reactions [17]. This key factor occursin some improper or nonstandard operations, such as fuel and air sub-stoichiometric feeding, rapidload change, low catalyst performance, control module failure, and so on. During a sudden loadchange or incorrect operation, such as start-up or artificial reasons, fuel and oxidant starvation wouldoccur. Li et al. [18] found that the cell performance loss was induced by the rapidly changing loadfrequencies resulting in catalyst particles’ growth and agglomeration in the anode. This is a typicalexample where the mass transfer rate cannot match the load change rate.
In the fuel cell stack or galvanostatic operation of a single cell, other cells with sufficient reactantor the single cell system would electrolyze the sick cell for the specified electron and proton or locationof saturated fuel supply electrolyze sub-saturated area. There are three key points to define the sickfuel cell: (1) low electrode performance; (2) low fuel supply; (3) low air or oxygen supply. By fillingthe current requirements, the sick cell would be self-abandoned to conduct some different reactionunder high potential, like carbon oxidation, water oxidation in an anode, or hydrogen evolution in acathode [17]. Hydrogen evolution occurs in the cathode catalyst layer, close to the proton exchangemembrane; hydrogen re-oxidization is in the other part of the cathode catalyst layer; and ORR occursbetween the cathode catalyst layer and the cathode gas diffusion layer.
Sanyo Electronics previously studied the performance degradation of fuel cell caused by fuelstarvation [19]. Then, Kim et al. [20] researched the effect of stoichiometry on the dynamic behavior ofa PEMFC during load change, and found a vacuum effect in fuel starvation. Hydrogen utilization wassignificant to overshoot or undershoot behaviors. Taniguchi et al. [6] designed an experiment using asingle cell to simulate cell reversal in a stack.
An abrupt change in oxygen demand at the cathode, like start-up operation, load change, or watermanagement failure, would induce air starvation. Rao et al. [21] developed a distributed dynamicmodel including three layers (the gas flow channel, the diffusion layer, and the reaction layer) in acathode to discuss the problem of gas starvation. There are many reports about current distributionand degradation caused by air starvation [5,22,23]. In these papers, current distribution is relevant tomatter diffusion. The different reactant combinations in different layers have various reactant reactionmodules. Due to reaction spontaneity and external drive, electron transfer and high potential occur atthe same time.
All of the experiments reported above show that reactant starvation would change anode orcathode reaction conditions and lead to abnormal chemical reactions in high potential. These reasonswould complicate the situation of the electrode surface. The following section will discuss in detail thespecific situation, causes, and effects in view of a PEMFC anode and cathode.
3.1.1. PEMFC Anode
Compared to air starvation, complete hydrogen starvation will induce high potential to lead tocarbon corrosion. Generally speaking, its impact on fuel cell is more far-reaching and thorough. So wepay more attention to cell reversal caused by hydrogen starvation.
In normal operations, excess hydrogen and air are supplied to the anode and cathode, respectively,whereby hydrogen and air distribution in the two compartments meet the mass transportationrequirement. However, local fuel starvation induced by heterogeneous fuel distribution andcomplete fuel starvation in the whole anode have different effects in the whole anode. These twohydrogen-deficient conditions are similar but the damage to the fuel cell is completely different, andin fact heterogeneous fuel distribution cannot cause cell reversal but current reversal [24]. Local fuelstarvation, or partial hydrogen coverage, damages the air electrode and induces oxygen migrationacross the membrane from the cathode [25,26]. There are two mathematical guides to help us
Catalysts 2016, 6, 197 5 of 21
distinguish between and get a clear picture of these two situations by demonstrating electron diffusionand gas flow.
Complete hydrogen starvation:N < I/(2F) (1)
Equation (1) depicts the practical status of fuel cell operations in the whole fuel starvation. In thisequation, N is the molar flow of hydrogen, I is the practical current, and F is Faraday’s constant.Without enough hydrogen to support the required current, the cell has to oxidize other cell systemmaterials such as water and carbon at the fuel electrode to produce electrons and protons. Obviously,the fuel cell must be a single cell during galvanostatic operation or in a fuel cell stack where other cellshave excess hydrogen supply.
Partial hydrogen coverage:
N > I/(2F) butIA
> Ilim (2)
Equation (2) shows the local hydrogen starvation. Here, A is the active area and Ilim is the limitingcurrent density on active area. According to the equation, enough hydrogen is fed to the anode tosatisfy the necessary current, but the fuel distribution is uneven in the gas distribution layer (GDL).Finally, the partial electrode area is not fed with adequate fuel. Oxygen in the cathode is permitted tomigrate to the anode across the membrane to form the potential in some fuel-deficit areas to produceelectrons, resulting in the average current value being higher than the limiting current. Some activeareas have the same cell potential difference as a normal fuel cell, about 0.8 V. Nevertheless, othernegative regions’ cell potential is lower than 0.8 V but more than 0. This potential difference betweenthe anode and cathode can be due to partial pressure discrepancy. So this situation cannot inducecell reversal but it will cause current reversal. Patterson and Darling studied the damage caused bylocal fuel starvation to the cathode catalyst [27]. The experiment showed that the situation of local fuelstarvation is not similar to cell reversal caused by fuel starvation.
Only when the low hydrogen stoichiometry is less than 1 can the fuel cell polarity be reversed inthe condition of a single-cell galvanostatic operation or a fuel cell stack where other cells have excesshydrogen supply. Obviously, all mechanisms and consequences of local fuel starvation would alsooccur at some location of the CL during overall fuel complete starvation [15]. In fact, the relationshipbetween local fuel starvation and complete hydrogen starvation is just a qualitative change induced bya different hydrogen degree.
Different fuel flow fed to the anode provokes different phenomena on its electrode surface.Fuel starvation induced uneven currency diffusion, which had an increasing trend in the anode inletand a decreasing trend in the outlet [4]; hydrogen oxidation reaction and water oxidation occurred atdifferent regions of the electrode simultaneously. Due to the lack of hydrogen supply, which cannotsatisfy the fuel cell system’s electron requirements, the fuel cell system would spontaneously increasethe anode potential as a result of an abnormal reaction or cell performance degradation, such as wateroxidation, carbon corrosion, and so on, to obtain extra electrons [28]. In a galvanostatic operation orfuel cell stack, it will decompose the electrode material or the sick cell, like an electrolytic cell.
Therefore, in this condition, oxygen is simultaneously reduced in the cathode while oxygen isproduced in the anode. The final consequence is that oxygen is pumped from cathode to anode whilewater moves in the opposite direction. The cell is similar to an “oxygen pump”. We can use GC to testthe anode production online [23]. The electrode half reactions and the overall reaction are listed below:
Anode: 2H2O (a)→ O2 (a) + 4H+ + 4e− (3)
Cathode: O2 (c) + 4H+ + 4e− → 2H2O (c) (4)
Overall: O2 (c) + 2H2O (a)→ 2H2O (c) + O2 (a) (5)
Catalysts 2016, 6, 197 6 of 21
Water oxidation is the initial main reaction in a fuel cell, caused by fuel complete starvation in theanode. While the cell reversal experiment proceeds, the cell voltage becomes more and more negative.In Figure 1, we can see that the anode potential could be more than 1.5 V and the cathode is about0.85 V at the first decreased stage. So the cell voltage is less than −0.65 V. At the next stage, the anodepotential would become so high that carbon could be corroded gradually, especially with a platinum(Pt)-based catalyst, which would promote carbon corrosion. Finally, the cell voltage would get close to−2.0 V until the fuel cell cannot function.
According to Equations (3), (10), and (11), corrosion in the anode, water oxidation, and carbonwould produce heat to dehydrate the anode ionomer and membrane electrolyte. When the cell voltagereaches −2.0 V, the membrane would be completely degraded by dielectric breakdown [16]. We canjudge which cell reversal strategy is best based on the time it takes the cell to reach −2.0 V in order toavoid cell reversal causing irreversible damage. The better strategy should have a longer time to reach−2.0 V of cell potential.
Aside from the cell polarity change, local current density and temperature also have specialdistribution across the CL in cell reversal. Zhang and his team analyzed dynamically the local currentdensities and temperatures in proton exchange membrane fuel cells during reactant starvations [7].The dynamic variations of local current densities with cell voltage and local temperatures duringhydrogen starvation are studied. In this experiment, the hydrogen flow rate was held at 50 NmL·min−1
(equal to average current density of 450 mA·cm−2). In the average current controlled operation, itwas set to increase from 440 to 470 mA·cm−2 to mimic fuel starvation. We can see that at the initialstage in this experiment, about 10 to 20 s, carbon corrosion is less than water oxidation, as indicatedby a relatively stable current density variation. Then the local current densities began to diverge.The closer the location is to the anode inlet, the larger the current density. The outlet area had thecompletely opposite case. The local temperature variation was similar to local current density. Withouta stable −0.2 V cell voltage during fuel starvation [16,29], current density and temperature would beso divergent that the MEA would fail. The temperature and current density show a relatively clearpicture to explain the electrode reaction.
In addition, cell reversal caused by hydrogen starvation would induce an abnormal oxidationreduction reaction at the electrode surface plane. There are different situations in different hydrogenfeeding stoichiometry.
Akira Taniguchi et al. discussed and analyzed electrocatalyst degradation in PEMFC causedby cell reversal during fuel starvation [6]. The ruthenium dissolution occurred in the anode catalystlayer and the outlet had more severe degradation. There was also surface activity area loss in thecathode. The standard potential of transition metal couple is smaller than the electrode surfacepotential. Hence, some transition metal dissolution and redeposition are likely to occur. This is whythe catalyst particle size becomes bigger than before cell reversal. In fuel starvation, the anode reactionis complex, involving hydrogen oxidation, water oxidation, carbon corrosion, and oxygen reduction.All of these reactions involve proton and electron transfer, which promote potential difference acrossthe electrode plane. Reaction correspondence cannot be executed across the anode plane. It wouldsimply get worse and worse until the system is dead.
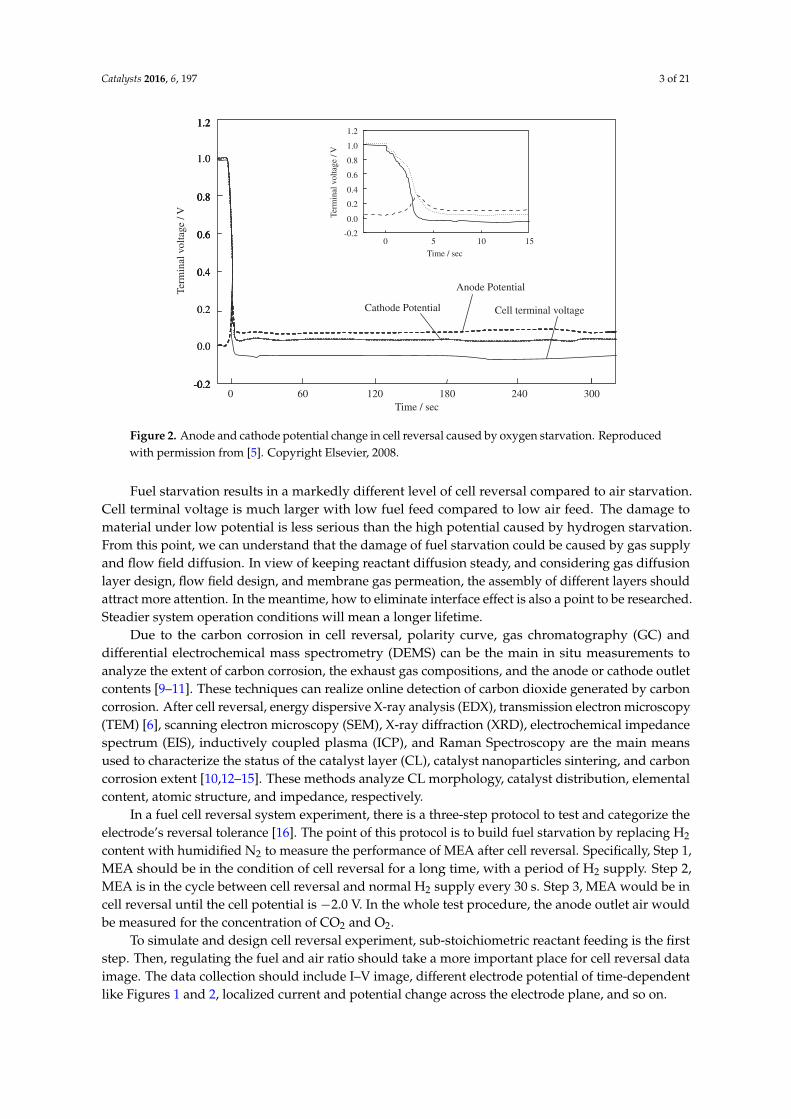
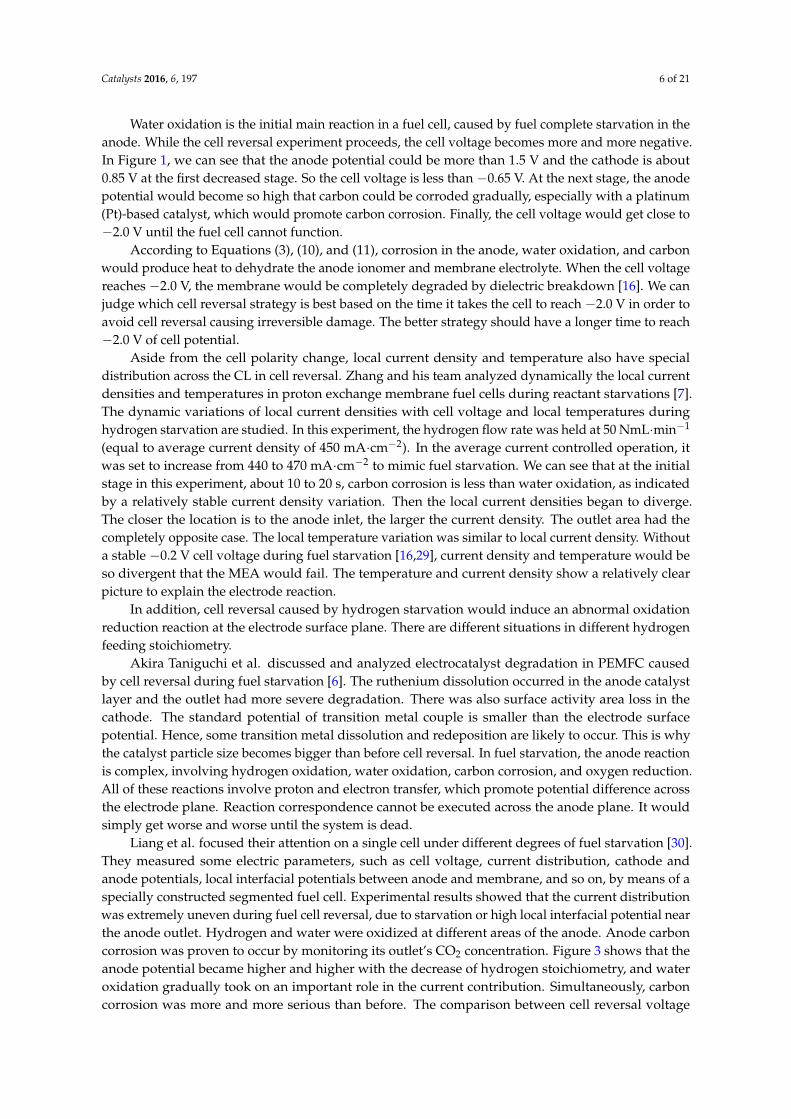
Liang et al. focused their attention on a single cell under different degrees of fuel starvation [30].They measured some electric parameters, such as cell voltage, current distribution, cathode andanode potentials, local interfacial potentials between anode and membrane, and so on, by means of aspecially constructed segmented fuel cell. Experimental results showed that the current distributionwas extremely uneven during fuel cell reversal, due to starvation or high local interfacial potential nearthe anode outlet. Hydrogen and water were oxidized at different areas of the anode. Anode carboncorrosion was proven to occur by monitoring its outlet’s CO2 concentration. Figure 3 shows that theanode potential became higher and higher with the decrease of hydrogen stoichiometry, and wateroxidation gradually took on an important role in the current contribution. Simultaneously, carboncorrosion was more and more serious than before. The comparison between cell reversal voltage
Catalysts 2016, 6, 197 7 of 21
and anode potential under different hydrogen conditions is shown in Table 1. Different hydrogenstoichiometry creates different terminal cell potential.
Catalysts 2016, 6, 197 7 of 21
affected by the fuel cell test device. Taniguchi’s test result was not steady even 300 s after the
experiment started, as compared to Liang’s. It involves support material, test device design, sealing,
and so on.
Figure 3. Changes of the anode potentials over time under different hydrogen stoichiometry. From 1
to 4, hydrogen stoichiometry is 1.09, 0.91, 0.73, and 0.55, respectively. Reproduced with permission
from [30]. Copyright Elsevier, 2009.
Table 1. Different times for cell reversal in different hydrogen stoichiometry.
Hydrogen
Stoichiometry
Time for Cell
Reversal (s)
Cell Voltage
(V)
Anode Potential
(V) Reference
0.8 Experiment started About −0.7 1.3 [6]
0.8 About 300 −2.0 2.5
1.09 26 −0.718 0.955
[30] 0.91 10 −1.125 1.313
0.73 6 −1.689 1.821
0.55 4 −1.951 2.058
They also proposed that the hydrogen stoichiometry would shift the position of the lowest
current [31]. With a comparatively high hydrogen feed, the position of the lowest current was closer
to the anode outlet, where the fuel feed would encounter the gas drawn back from the outlet manifold
and fuel starvation first occurred. The inadequate hydrogen supplied and “vacuum effect” would
mix in the fuel cell. In this situation, researchers could analyze the area of fuel starvation in the anode
according to the hydrogen stoichiometry to design a catalyst layer of anisotropy to avoid or mitigate
the fuel starvation caused by inadequate fuel feed.
3.1.2. PEMFC Cathode
When the real‐time current exceeds the limiting current for ORR, air starvation occurs. In this
case, the cathode voltage approaches the potential of reversible hydrogen due to the existence of
hydrogen evolution. The potential of the cell is slightly negative in this condition, which is smaller
than the hydrogen starvation. At this comparatively low potential value, it is hard to corrode carbon
material.
In the PEMFC cathode, oxidation supply and the obstruction of gas channels caused by water
flooding or freezing are the main causes of cell reversal. The causes also include control system failure
and incorrect operation. Water flooding or ice would block the access of the reactant gases to the
Figure 3. Changes of the anode potentials over time under different hydrogen stoichiometry. From 1to 4, hydrogen stoichiometry is 1.09, 0.91, 0.73, and 0.55, respectively. Reproduced with permissionfrom [30]. Copyright Elsevier, 2009.
Table 1. Different times for cell reversal in different hydrogen stoichiometry.
HydrogenStoichiometry
Time for CellReversal (s)
Cell Voltage(V)
Anode Potential(V) Reference
0.8 Experiment started About −0.7 1.3[6]0.8 About 300 −2.0 2.5
1.09 26 −0.718 0.955
[30]0.91 10 −1.125 1.3130.73 6 −1.689 1.8210.55 4 −1.951 2.058
With the change of cell voltage over time, fuel cell system would begin to search reaction balance.In the anode, a compromise between hydrogen oxidation, water oxidation, and carbon corrosion moveanode reaction from chaos to relative balance. Hydrogen stoichiometry has a different influence on theanode when it is lower than its satisfied supply. However, the experimental result is also affected bythe fuel cell test device. Taniguchi’s test result was not steady even 300 s after the experiment started,as compared to Liang’s. It involves support material, test device design, sealing, and so on.
They also proposed that the hydrogen stoichiometry would shift the position of the lowestcurrent [31]. With a comparatively high hydrogen feed, the position of the lowest current was closer tothe anode outlet, where the fuel feed would encounter the gas drawn back from the outlet manifoldand fuel starvation first occurred. The inadequate hydrogen supplied and “vacuum effect” wouldmix in the fuel cell. In this situation, researchers could analyze the area of fuel starvation in the anodeaccording to the hydrogen stoichiometry to design a catalyst layer of anisotropy to avoid or mitigatethe fuel starvation caused by inadequate fuel feed.
Catalysts 2016, 6, 197 8 of 21
3.1.2. PEMFC Cathode
When the real-time current exceeds the limiting current for ORR, air starvation occurs. In this case,the cathode voltage approaches the potential of reversible hydrogen due to the existence of hydrogenevolution. The potential of the cell is slightly negative in this condition, which is smaller than thehydrogen starvation. At this comparatively low potential value, it is hard to corrode carbon material.
In the PEMFC cathode, oxidation supply and the obstruction of gas channels caused by waterflooding or freezing are the main causes of cell reversal. The causes also include control system failureand incorrect operation. Water flooding or ice would block the access of the reactant gases to theelectrocatalyst surface and result in a slower mass transport rate compared to the oxygen reductionreaction and a relative absence of cathode reactant. There are three ways for the PEMFC cathodeto generate excess water, i.e., humidified hydrogen and air to optimize the interaction between theinterface and reactant, the reaction product in the cathode, and water migrating across the membraneby electro-osmotic drag with protons [5].
Combined with Figure 2, it is evident that the final cell voltage in cell reversal caused by airstarvation was close to −0.1 V, which is much lower than the fuel starvation including anode andcathode voltage. Because potential is the driving force of electrochemical reaction, with high potential itis easier to realize carbon corrosion, catalyst metal dissolution, and sinter. Fuel starvation at the PEMFCanode results in irreversible damage to the PEMFC after several minutes under higher potential and ismore critical than improper gas supply or distribution at the cathode [15].
When oxidation starvation happens, protons and electrons produced in the anode enter into thecathode. Simultaneously, hydrogen is consumed in the anode and produced in the cathode. Protonsact as a “hydrogen pump” [23]. The electrode half reactions and the overall reaction are listed below:
Anode: H2 (a)→ 2H+ + 2e− (6)
Cathode: 2H+ + 2e− → H2 (c) (7)
Overall: H2 (a)→ H2 (c) (8)
Regarding air starvation, researchers have focused on its causes, its dynamic characteristics acrossthe anode plane, and the relationships between air feed and fuel cell degradation. Tüber et al. focusedon the water flooding phenomenon at the fuel cell cathode caused by an accumulation of H2O [32].They analyzed the effect of air flow, humidity, temperature, and flow-field type on flooding.
Zhang et al. also detected the dynamic characteristics of local current densities and temperaturesin proton exchange membrane fuel cells during air starvation under current controlled and voltagecontrolled operation [7]. Their experimental results were obtained at different times and relativepositions. This paper demonstrated that the local temperature changes followed the local currentdensity changes during experimental operation. It is similar with hydrogen starvation. Due to reactantstarvation, anode and cathode chemical reactions cannot follow normal operations. It refers thata mixture of gas evolution, reactant oxidation, and reduction reaction occur in anode or cathode.According to different reactions’ energy change, there must be a relationship between electrodetemperature and current density.
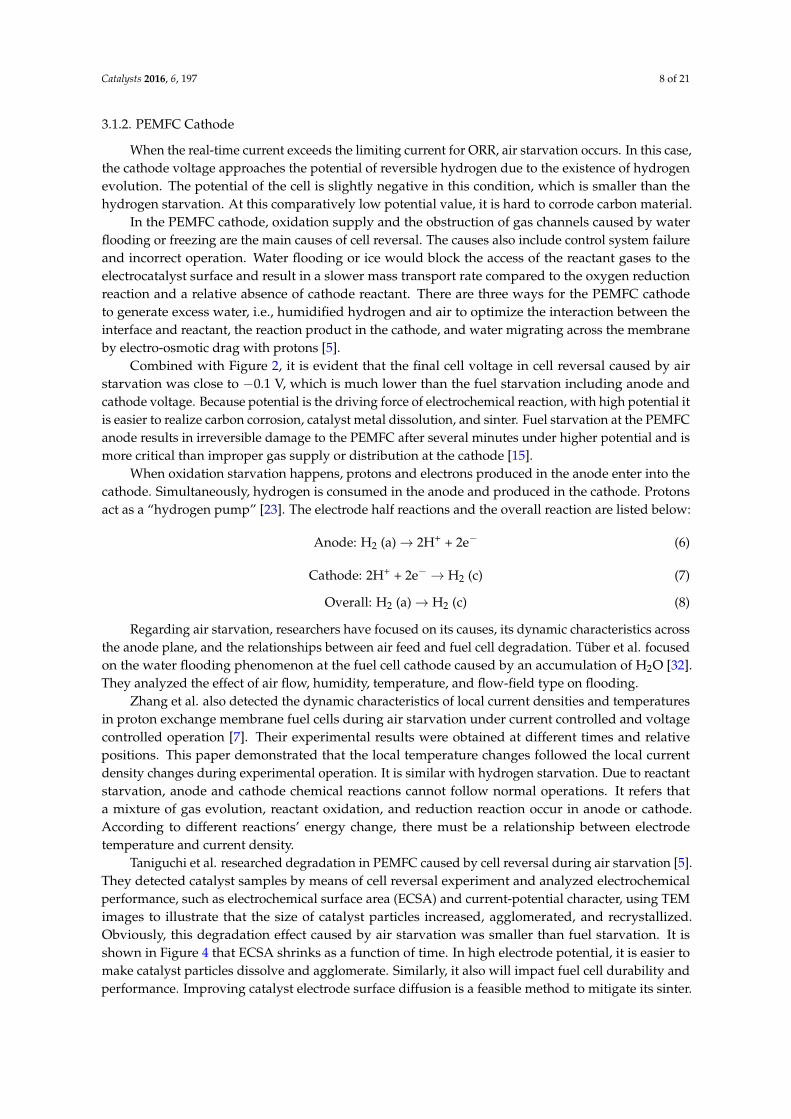
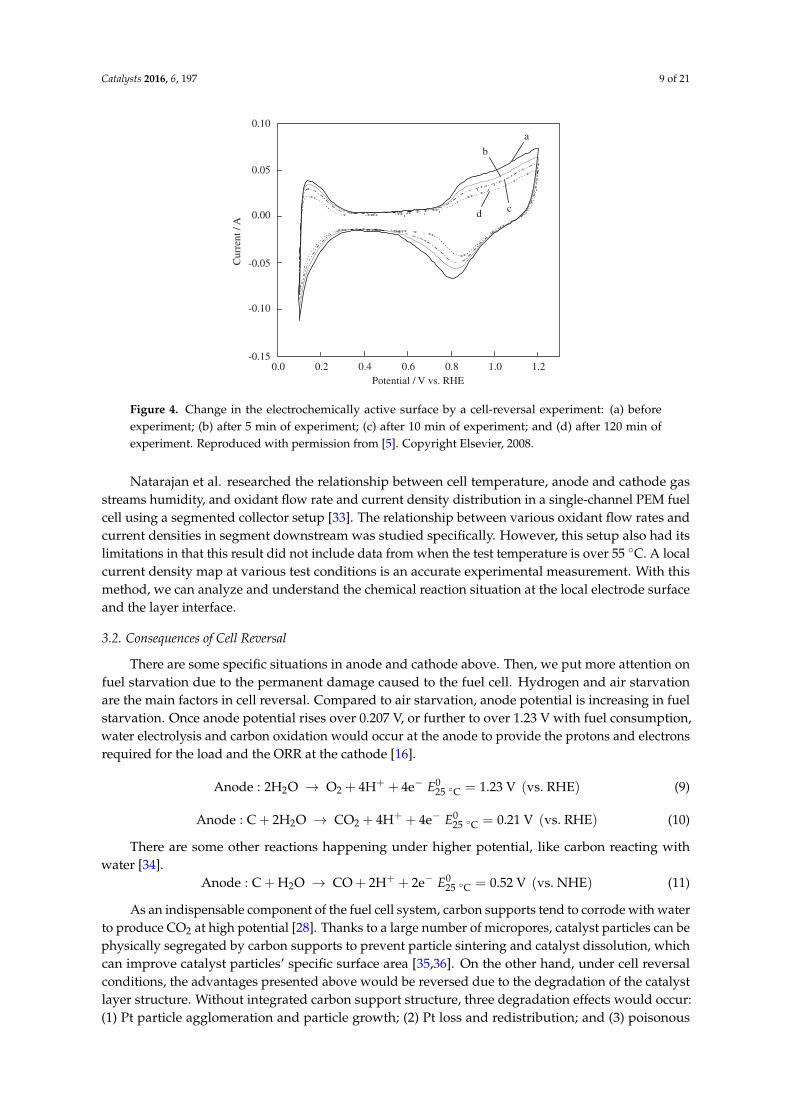
Taniguchi et al. researched degradation in PEMFC caused by cell reversal during air starvation [5].They detected catalyst samples by means of cell reversal experiment and analyzed electrochemicalperformance, such as electrochemical surface area (ECSA) and current-potential character, using TEMimages to illustrate that the size of catalyst particles increased, agglomerated, and recrystallized.Obviously, this degradation effect caused by air starvation was smaller than fuel starvation. It isshown in Figure 4 that ECSA shrinks as a function of time. In high electrode potential, it is easier tomake catalyst particles dissolve and agglomerate. Similarly, it also will impact fuel cell durability andperformance. Improving catalyst electrode surface diffusion is a feasible method to mitigate its sinter.
Catalysts 2016, 6, 197 9 of 21
by operation under cell reversal but also by normal operation.
The average particle size reached 4.16 nm at the air inlet region,
location A, and 4.83 nm at the air outlet region, location B, with
cell reversal. On the other hand, the average particle sizes for a
normally operated cell were 2.92 nm at the air inlet region and
2.84 nm at the air outlet region. The results in these figures
suggest that the particle size after cell-reversal experiment was
much larger than that after normal operation. The smallest
particles with a size below 2.0 nm disappeared in the sample at
the air inlet region after the cell-reversal experiment, as seen in
Fig. 7a. In the image of the sample at the air outlet region, even
the particles with a size of 2.0–2.5 nm disappeared, as can be
seen in Fig. 7b. The average particle size of cell reversal at the air
outlet region was greater than that at the air inlet region. This
phenomenon was not seen in normally operated MEA. These
results mean that degradation is more severe in the region
starved of oxygen. A loss of platinum surface area through
sintering or recrystallization within the porous cathode has
been proposed to be the reason for the decrease in activity in
low temperature fuel cells [8,21]. Such catalyst degradation can
occur through the surface migration of platinum and platinum
ARTICLE IN PRESS
-0.15
-0.10
-0.05
0.00
0.05
0.10
0.0 0.8 1.0
a
b
cd
Cur
rent
/ A
Potential / V vs. RHE1.20.60.40.2
Fig. 4 – Change in the electrochemically active surface by a cell-reversal experiment: (a) before experiment, (b) after
experiment for 5 min, (c) after experiment for 10 min and (d) after experiment for 120 min.
0
20
40
60
80
100
0
a
b
Time / min
Perc
enta
ge o
f in
itial
Pt s
urfa
ce a
rea
/ %
150120906030
Fig. 5 – Time dependency of the electrochemically active
surface derived from the hydrogen desorption area of cyclic
voltammograms shown in Fig. 4: (a) normal fuel cell
operation and (b) cell-reversal experiment.
Fig. 6 – TEM images of the cathode catalyst: (a) before and
(b) after the cell-reversal experiment for 120 min.
I N T E R N A T I O N A L J O U R N A L O F H Y D R O G E N E N E R G Y 3 3 ( 2 0 0 8 ) 2 3 2 3 – 2 3 2 9 2327
Figure 4. Change in the electrochemically active surface by a cell-reversal experiment: (a) beforeexperiment; (b) after 5 min of experiment; (c) after 10 min of experiment; and (d) after 120 min ofexperiment. Reproduced with permission from [5]. Copyright Elsevier, 2008.
Natarajan et al. researched the relationship between cell temperature, anode and cathode gasstreams humidity, and oxidant flow rate and current density distribution in a single-channel PEM fuelcell using a segmented collector setup [33]. The relationship between various oxidant flow rates andcurrent densities in segment downstream was studied specifically. However, this setup also had itslimitations in that this result did not include data from when the test temperature is over 55 ◦C. A localcurrent density map at various test conditions is an accurate experimental measurement. With thismethod, we can analyze and understand the chemical reaction situation at the local electrode surfaceand the layer interface.
3.2. Consequences of Cell Reversal
There are some specific situations in anode and cathode above. Then, we put more attention onfuel starvation due to the permanent damage caused to the fuel cell. Hydrogen and air starvationare the main factors in cell reversal. Compared to air starvation, anode potential is increasing in fuelstarvation. Once anode potential rises over 0.207 V, or further to over 1.23 V with fuel consumption,water electrolysis and carbon oxidation would occur at the anode to provide the protons and electronsrequired for the load and the ORR at the cathode [16].
Anode : 2H2O → O2 + 4H+ + 4e− E025 ◦C = 1.23 V (vs. RHE) (9)
Anode : C + 2H2O → CO2 + 4H+ + 4e− E025 ◦C = 0.21 V (vs. RHE) (10)
There are some other reactions happening under higher potential, like carbon reacting withwater [34].
Anode : C + H2O → CO + 2H+ + 2e− E025 ◦C = 0.52 V (vs. NHE) (11)
As an indispensable component of the fuel cell system, carbon supports tend to corrode with waterto produce CO2 at high potential [28]. Thanks to a large number of micropores, catalyst particles can bephysically segregated by carbon supports to prevent particle sintering and catalyst dissolution, whichcan improve catalyst particles’ specific surface area [35,36]. On the other hand, under cell reversalconditions, the advantages presented above would be reversed due to the degradation of the catalystlayer structure. Without integrated carbon support structure, three degradation effects would occur:(1) Pt particle agglomeration and particle growth; (2) Pt loss and redistribution; and (3) poisonous
Catalysts 2016, 6, 197 10 of 21
effects caused by contaminants [13]. Due to the inherent tendency of catalyst nanoparticles toagglomerate to reduce the surface energy, without the limit of support carbon it would promotedeterioration of catalyst performance. Low catalyst performance would inhibit electron and protonproduction for the anode. With the low chemical reaction rate, the anode would only seize carbon andwater as reactant material for ORR. This creates a vicious cycle that leads to fuel cell degradation andobsolescence. In the end, the fuel cell would be in a dynamic balance for several chemical reactions onthe cathode and anode plane or interface.
However, in air starvation conditions, because of the lower anode and cathode potential, 0.05 Vat anode and 0.85 or 0.05 V at cathode (localized ORR and HOR, respectively), carbon corrosion isunlikely to occur [24]. Instead, the mixture of oxygen and hydrogen may damage the fuel cell, due tothe large hydrogen explosion ranging from 4% to 75.6% that is likely to occur at room temperature in anarrow and airtight space. Elsewhere, with the reduction of water and high cell voltage, the membranewould be completely degraded and broken apart. Air starvation does not have a direct or seriouseffect on electrodes compared to fuel starvation.
4. Mitigation Strategies
In the case of cell reversal, there are many approaches to attenuate or solve this question, such assystem management and material modification. This review will discuss two ways to summarizecell reversal failures. System strategies mainly monitor operation parameters and feed it back byadjusting gas flow and load change, and controlling gas humidity and system temperature. Becausethe system management method should consider material features, we mainly pay attention to the roleof electrode material and catalyst layer design. The quality and design of fuel cell installation are key tosolving fuel cell system failure. Thus, in terms of materials, we focus on three parts: high performancecatalysts, carbon support materials, and water oxidation reaction. Because the damage caused byair starvation is less than that caused by fuel starvation, we focus on the design and structure of theanode CL. For the cathode, researchers [37] adjusted the porosity of GDL to improve gas diffusion andchanged the supported material to optimize the transformation of oxygen and water.
4.1. System Management Strategies
System management mitigates catalyst degradation by regulating fuel cell system operationparameters such as pressures, cell temperature, humidity levels, and current density [38]. Withauxiliary equipment, researchers can detect reverse cell potential by monitoring cell voltages ofindividual cells or groups of cells in the stack [39]. Combined with current density distribution andtemperature distribution detected by electrode segmentation technology [40], researchers can alsounderstand the situation of cell starvation specifically. Furthermore, by setting an alarm value onthe monitored cell voltage, the system can adjust operation parameters such as reactant flow rate,operation load, and water management data, and so on to avoid cell reversal or system halt situations.For instance, a sensor in the cell test system activates a switch that plays the role of removing the stackload the instant the sensor detects a precipitous loss of voltage [41].
Vahidi et al. proposed a fast-responding auxiliary power source to prevent oxygen starvation ina fuel cell during rapid current transitions [42]. In the oxidation starvation experiment of increasingstack power, the reactant starvation was less than 1% in the hybrid installation. An image of the hybridinstallation follows. In the schematic, a capacitor was used to provide deficit current when the powersensor gives a signal. With capabilities of model predictive control, it can mitigate cell reversal damagein air starvation. However, it is transitory for fuel starvation to make carbon corrosion. This auxiliaryinstallation cannot support adequate current in fuel starvation.
4.2. System Material Modification
Compared to the system management strategy, the design and composition of a fuel cell structureare more important, especially in terms of preventing cell reversal. While there are additional accessory
Catalysts 2016, 6, 197 11 of 21
costs, improving corrosion resistance naturally increases the fuel cell lifespan. Due to the high potential,slow reaction rate, and reactant transfer rate, which cannot meet current density in fuel cell stacks andin galvanostatic operations, researchers focused on the three aspects previously discussed—catalyst,carbon material, and water oxidation reaction.
Specifically, there are four approaches used to attenuate performance degradation and extendfuel cell lifespan [11,15,37].
1. High catalyst activity and homogenous distribution;2. Corrosion-resistant support material;3. Water oxidation catalysts to promote water oxidation instead of carbon corrosion;4. Increasing anode gas humidity.
4.2.1. High-Performance Catalyst
Low-performance catalysts would induce low anode and cathode reaction rates without sufficientprotons and electrons supported in cell stacks and galvanostatic operations. However, in normaloperation, Pt-based catalysts could meet the requirements of HOR and ORR due to their excellentcatalyst performance [43].
Catalyst dissolution and agglomeration would occur via carbon support material corrosion [44],Pt loss [13,45], and surface energy reduction during standard fuel cell operations. Generally, thedissolution of Pt in the anode was more stable than in the cathode because of the electrode potential;the Pt particles’ dissolution follows Equations (12) and (13) into Pt2+, and the standard equilibriumpotential is +0.88 V vs. RHE [46]. However, in cell reversal, the potential polarity is changed so thatcatalyst metals have high ORR potential with carbon support corrosion.
Pt + H2O→ PtO + 2H+ + 2e− (12)
PtO + 2H+ + 2e− ↔ Pt2+ + H2O (13)
Pt-based catalyst dissolution is more common during cell reversal in the anode. According to themetal couple potential, different catalyst metal dissolution and redeposition occur. Furthermore, thecatalyst particle size becomes bigger as a result of the electrochemical surface area decreasing. Then, italso would induce activity degradation and the potential would grow higher and higher. Obviously,this is another vicious cycle.
High durability and catalyst activity are the keys to solving this problem. Pt–alloy catalysts havebetter activity and stability compared to traditional Pt/C catalysts, like Pt–Co and Pt–Cr–Ni [47].The different alloy elements and the larger size of catalyst particles show excellent properties [48].With high catalyst activity to decrease ORR or HOR activity energy, the basic electrode reaction ratecan occur even in poor operating conditions such as bad fuel or air transfer operation. As to thedurability, the non-noble metals in the Pt alloy catalysts are more sensitive to the ionomer phase byXRD analysis. These non-noble metals can partially lose to induce (111) Pt skin to increase catalystactivity [49]. It indirectly improves fuel cell catalyst durability.
Various kinds of alloy metals have already proved to be capable in a fuel cell operatingenvironment, including Co, Cr, Fe, Ni, and V. Due to its advantage of stability, researchers paidmore attention to Pt–Co/C recently [50,51]. Adzic et al. [52] showed that the durability of Pt-basedcatalyst could be improved with the addition of gold (Au) clusters. The above reports showed that thePt alloy could not only use a second metal to replace unavailable Pt to reduce costs, but also coulduse other metals to stabilize the Pt skin and frame structure to increase its lifespan. However, in cellreversal, catalyst performance only adds brilliance to its present splendor. Its root is reactant supplyand material corrosion resistance.
Catalysts 2016, 6, 197 12 of 21
4.2.2. Carbon Support Material
As to material corrosion resistance, carbon is commonly used in PEMFC as a catalyst support,in GDLs, and as a bipolar-plate material [24]. Carbon support has many basic features, suchas high specific surface area, good electrical conductivity, and chemical stability in a fuel cellsystem [53]. The stronger the interaction between carbon material and catalyst particles is, the betterthe performance of catalyst particles that is not prone to sinter is [36]. However, carbon oxidationreaction (COR) has a direct relationship with electrocatalytic material stability, and thermodynamicallythe reaction would happen at the cathode, because the reaction oxidation potential is 0.207 V (vs. RHEat T = 298 K). In the case of cell reversal, high potential in both the anode and cathode could electrolyzecarbon material. Furthermore, with the existence of Pt-based catalyst, carbon corrosion would beeasier [10,54].
Different kinds of carbon material have an impact on corrosion resistance. As a new carbonmaterial, graphene has special optical, chemical, and mechanical properties. Due to its high surfacearea, high conductivity, and unique graphitized basal plane structure, it has potential to serve as afuel cell catalyst support material to overcome the problem of corrosion [55]. Considering the stronginteraction between graphene and nanoparticles with functional groups, it is hard for Pt-based catalystnanoparticles to dissolve or sinter [56]. Graphene increases a Pt-based catalyst metal’s dissolutionpotential. Guo and Sun developed a facile solution-phase self-assembly method to deposit FePtNPs on a graphene surface [43]. This experiment mainly shows that graphene as a carbon supportcould have an effect on carbon corrosion in harsh conditions. Although graphene has influence onimproving catalyst activity and durability, easily stacking between graphene sheets, the effects ofsurface functional groups should be intensively investigated.
Generally, graphitic content is a point to be researched. Luis Castanheira and coworkers proposedthat the structure of carbon material, including high-surface area carbon (HSAC), Vulcan XC72, orreinforced-graphite (RG) with identical Pt (40 wt %), was the key to carbon corrosion caused by thehydrogen/air interface [10]. Results showed that there were 60% and 80% ECSA loss for Pt/Vulcanand Pt/HSAC, respectively. However, Pt/RG only had 25%. Compared to other disorganized carbonmaterial, graphitic carbon is more robust against carbon corrosion.
Similarly, Artyushkova et al. [57,58] found a relationship between carbon material structure andchemical parameters. Good electrochemical activity of ORR but poor activity of COR were seen withhigh amounts of graphite carbon, small specific surface area, less carbon surface oxides, and manylarge-sized pores. In fact, it is a contradiction that graphite carbon has less surface deficit, which makesit resistant to corrosion, and has weak interaction with catalyst particles. ORR and COR should bein balance only if we consider carbon material surface factor. Carbon material surface structure andfunction can be a method of improving this situation. This paper [58] introduced the relationshipbetween different carbon material structural features, corrosion resistance, and hydrophobicity orhydrophilicity. According to this relationship, we have a path to manufacture and synthesize idealcarbon material.
Carbon surface porosity plays a role in corrosion resistance and wettability. Wlodarczyk [59]suggested that carbon could show good corrosion resistance with a porosity value in excess of 10%,because its wettability decreased with the value of porosity.
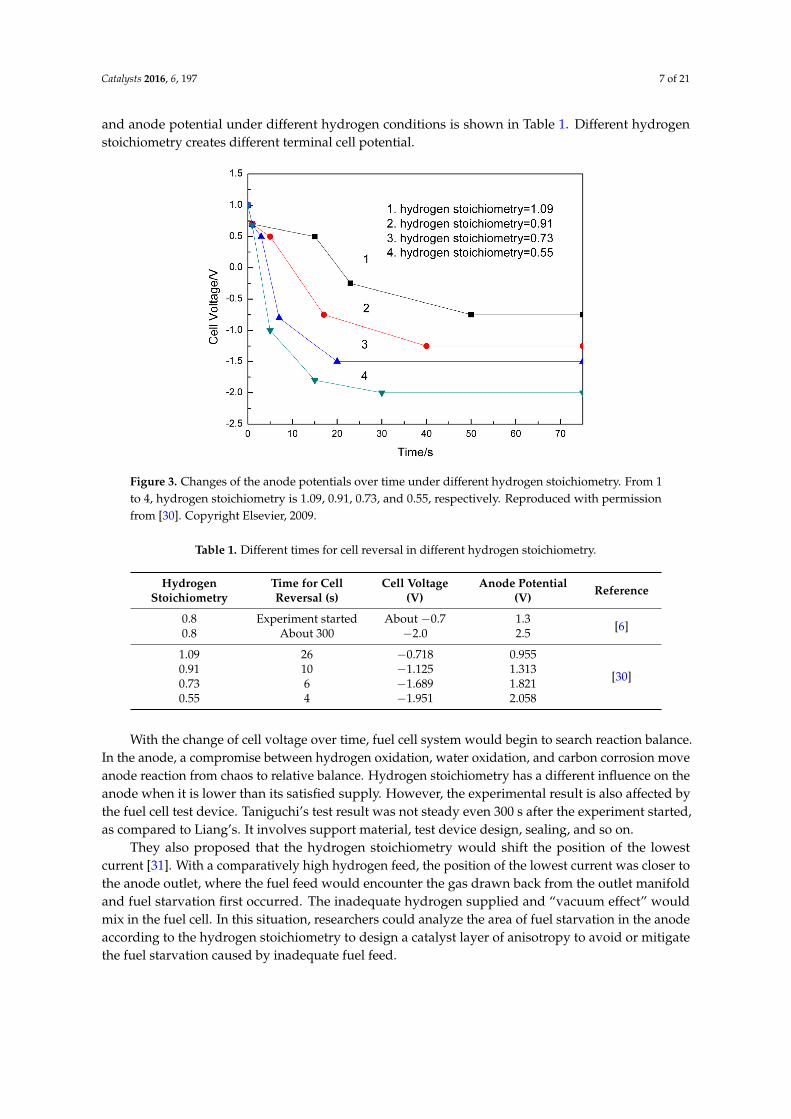
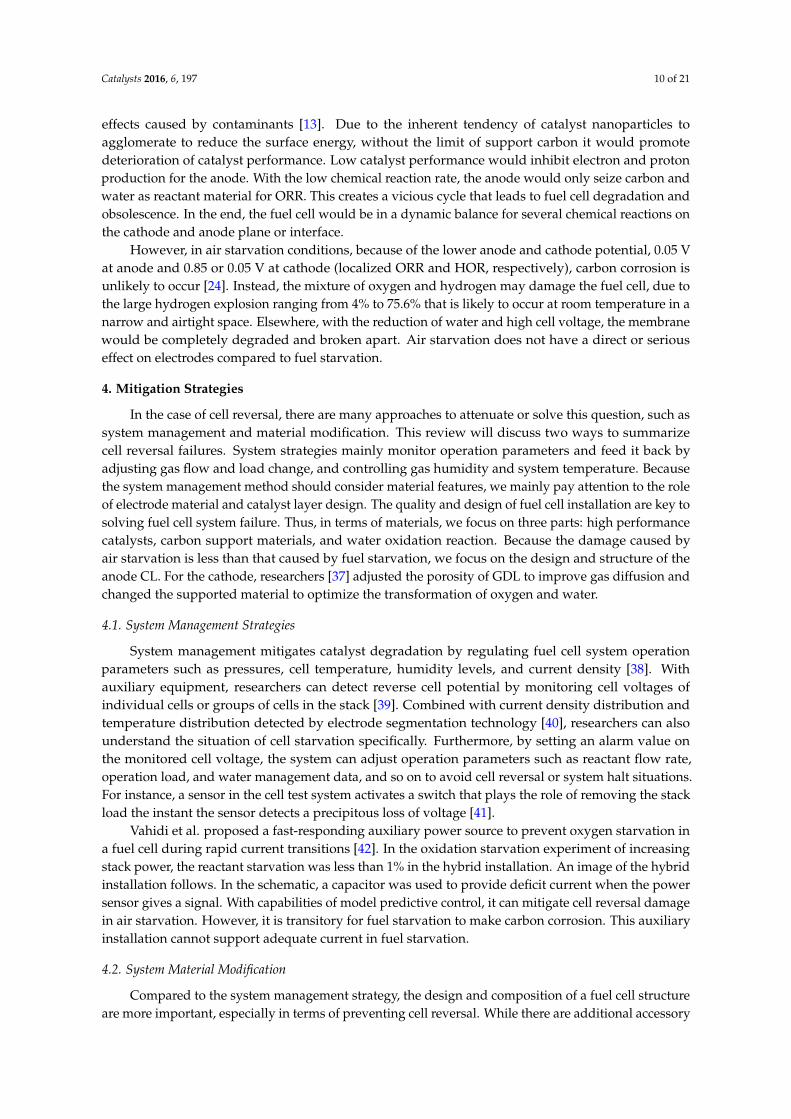
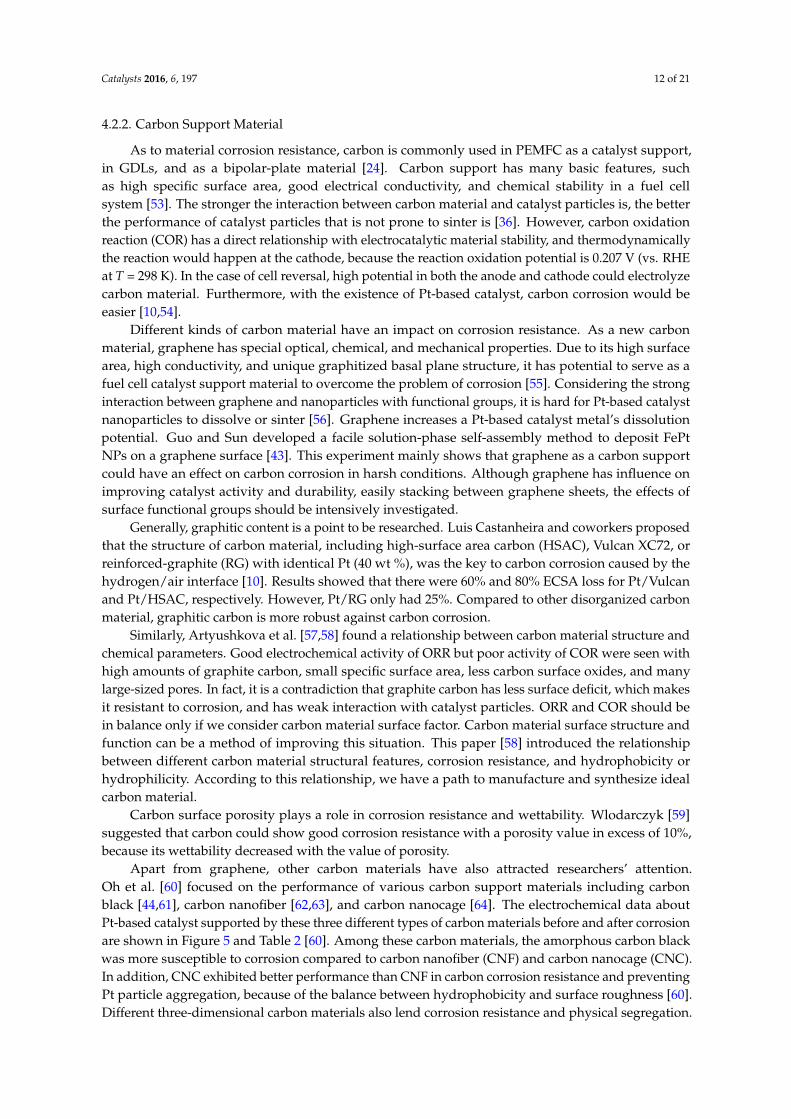
Apart from graphene, other carbon materials have also attracted researchers’ attention.Oh et al. [60] focused on the performance of various carbon support materials including carbonblack [44,61], carbon nanofiber [62,63], and carbon nanocage [64]. The electrochemical data aboutPt-based catalyst supported by these three different types of carbon materials before and after corrosionare shown in Figure 5 and Table 2 [60]. Among these carbon materials, the amorphous carbon blackwas more susceptible to corrosion compared to carbon nanofiber (CNF) and carbon nanocage (CNC).In addition, CNC exhibited better performance than CNF in carbon corrosion resistance and preventingPt particle aggregation, because of the balance between hydrophobicity and surface roughness [60].Different three-dimensional carbon materials also lend corrosion resistance and physical segregation.
Catalysts 2016, 6, 197 13 of 21
By combining these two points—carbon surface and spatial structure, we can design the desired carbonmaterial structure to optimize a fuel cell.
6516 H.-S. Oh et al. / Electrochimica Acta 54 (2009) 6515–6521
Fig. 1. The graphical presentation of three different types of carbon supported Pt particles, (a) Pt/CB, (b) Pt/CNF, (c) Pt/CNC.
performance reached a steady-state. Several electrochemical anal-yses were conducted on the prepared MEAs. Polarization curveswere obtained at a cell temperature of 75 ◦C under ambient pres-sure, with 150 ccm O2 delivered to the cathode and 150 ccm H2 tothe anode. Impedance measurements were performed at 0.8 V tomeasure membrane resistance and charge transfer resistance underthe same of polarization experiment. Cyclic voltammetry (CV) wasperformed in the range 0.05–1.2 V at a sweep rate of 50 mV s−1 tomeasure the active Pt surface area. Prior to CV, the cathode waspurged with nitrogen gas for 40 min to remove all oxygen. Aftercompletion of CV, carbon corrosion experiments were conductedat a cell temperature of 90 ◦C. The cathode of fuel cell was exposedto humidified N2 at 30 ccm whereas humidified H2 at 20 ccm wassupplied to the anode of fuel cell at 90 ◦C. A constant potential of1.4 V with reference to the anode was applied to the cathode of fuelcell for 30 min and the amounts of CO2 produced from the cathodeof fuel cell were monitored as a function of time using on-line massspectrometry. During the corrosion test, the cathode of the fuel cellbecomes the anode of the externally powered cell, exhibiting car-bon corrosion. On the other hand, the anode of the fuel cell behavesas a counter electrode as well as a reference electrode.
Dispersion of the carbon support in a two-phase water/hexane(1:1) mixture was used to explore hydrophobicity. One milligram ofeach carbon support was wetted with 10 mL water and dispersedin a sonication bath for 1 min. Next, an equal volume of hexanewas added. Mixtures were swiftly hand-agitated and observed. ThePt sintering effect of each carbon support was investigated underhalf-cell conditions using 0.5 M H2SO4 as electrolyte. Catalysts weresprayed onto 4 cm2 Au plates with 0.8 mg cm−2 of Pt. Next, CV wasperformed in the range of 0.0–0.8 V to minimize carbon corrosionwith a sweep rate of 50 mV s−1 for up to 4,000 cycles. Changes inPt active surface area were determined by CV measurements in therange 0.0–1.2 V with a 5 mV s−1 sweep rate at the 500th, 1000th,2000th, 3000th, and 4000th cycles. Active surface areas were cal-culated from the CV hydrogen adsorption peaks.
X-ray photoelectron spectroscopy (XPS) was used to inspectfunctional groups on carbon surfaces, and both X-ray diffraction(XRD) and high-resolution transmission electron microscopy (HR-TEM) were performed to examine the graphitic structure of carbonsupports and to measure Pt particle sizes. ICP-AES analysis wascarried out to estimate the Pt loading over the carbon support.
3. Results and discussion
Fig. 2 shows XRD patterns of three different carbon supports.Diffraction peak at 2� = 26◦ reflecting carbon graphitic structure isobserved with CNF and CNC. However, no such peak was presentin the CB spectrum indicating that CB is amorphous structure.The degree of graphitization and Brunauer–Emmett–Teller (BET)
Fig. 2. XRD patterns of different carbon supports. (a) CB, (b) platelet-type CNF, and(c) CNC.
surface area of three different carbon supports were summarizedin Table 1. To evaluate the degree of graphitization, crystallitethickness (Lc values) and interlayer spacing (d0 0 2 values) were cal-culated using the Scherrer formula and Bragg’s law, respectively.Higher Lc value of (0 0 2) peak and lower d0 0 2 number imply highergraphitization [21–23]. When different carbon supports were com-pared, CNF showed the lowest d0 0 2 value of 0.3356 nm, close tothat of pure graphite (0.3354 nm) [23]. CNF also yielded a higher Lc
value than did the other two carbon supports. Thus, it can be con-cluded that CNF has the highest degree of graphitization among thethree carbon supports tested. However, CNF showed the smallestBET surface area.
HR-TEM images are presented in Fig. 3. Fig. 3a shows an imageof CB which exhibit a particle size of 30–50 nm. Fig. 3c displays CNF,showing well-aligned platelet-type graphitic layers with diametersof 50–200 nm. Fig. 3e shows that CNCs with caged carbon parti-cles with hollow interiors surrounded by walls composed of a fewgraphitic layers. Pt was deposited onto each type of carbon support.HR-TEM images of Pt-bearing supports are also shown in Fig. 3. Ptparticle size on the CNF support appeared larger than on CB and
Table 1The degree of graphitization and BET surface area of different carbon supports.
Sample BET surface area (m2 g−1) d0 0 2 (nm) Lc (nm)
Carbon black 906 0.3522 0.8CNF 45 0.3356 14.2CNC 154 0.3489 5.1
Figure 5. Three different types of carbon materials: (a) carbon black; (b) carbon nanofiber; (c) carbonnanocage. Reproduced with permission from [60]. Copyright Elsevier, 2009.
Table 2. Changes in different types of carbon materials’ electrical data before and aftercorrosion experiments.
Condition
Active SurfaceArea (m2·g−1)
MembraneResistance
Charge TransferResistance
CO2 Emission(µL) Reference
Before After Before After Before After 30 [email protected] V
Pt/XC-72(1200 cycle) 62.2 40.0 – – – – – [44]
Pt/BP2000 59.9 26.7 – – – – – –Pt/Carbon Black(up to 4000 cycle) 41.7 15.2 0.016 0.025 0.039 0.328 651 [60]
Pt/CNF 30.1 27.7 0.016 0.016 0.054 0.058 49 –Pt/CNC 33.6 32.9 0.016 0.016 0.04 0.041 4 –
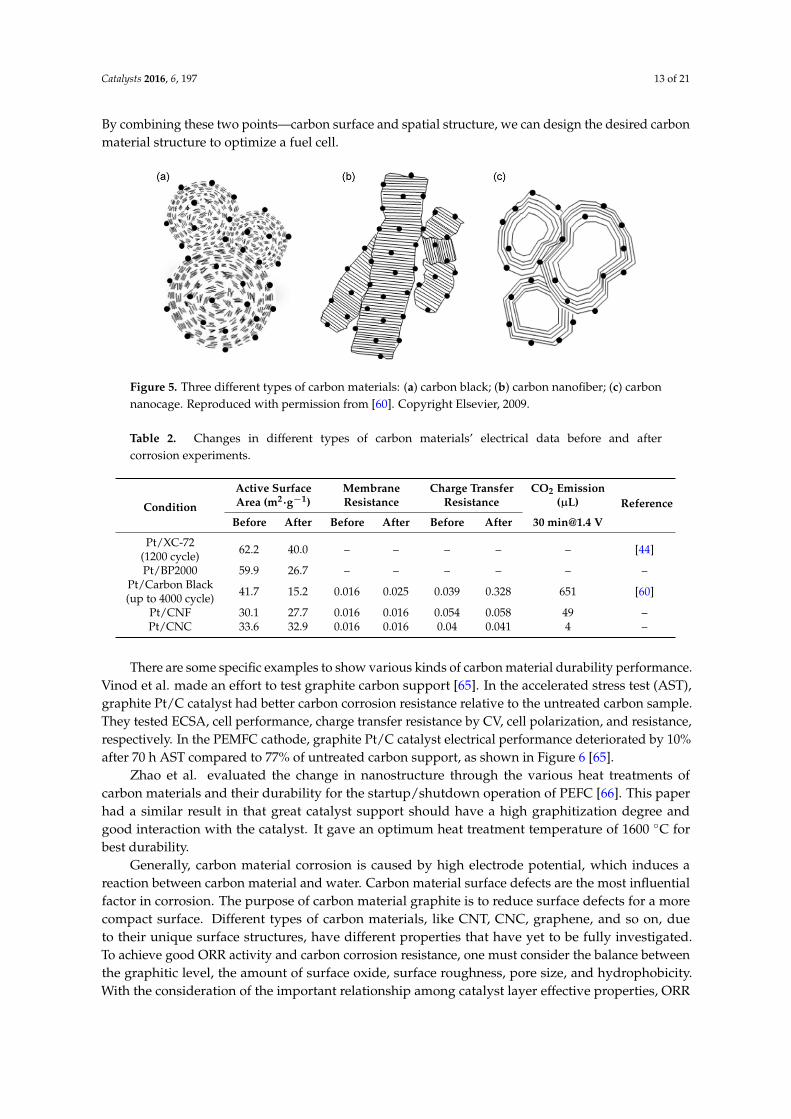
There are some specific examples to show various kinds of carbon material durability performance.Vinod et al. made an effort to test graphite carbon support [65]. In the accelerated stress test (AST),graphite Pt/C catalyst had better carbon corrosion resistance relative to the untreated carbon sample.They tested ECSA, cell performance, charge transfer resistance by CV, cell polarization, and resistance,respectively. In the PEMFC cathode, graphite Pt/C catalyst electrical performance deteriorated by 10%after 70 h AST compared to 77% of untreated carbon support, as shown in Figure 6 [65].
Zhao et al. evaluated the change in nanostructure through the various heat treatments ofcarbon materials and their durability for the startup/shutdown operation of PEFC [66]. This paperhad a similar result in that great catalyst support should have a high graphitization degree andgood interaction with the catalyst. It gave an optimum heat treatment temperature of 1600 ◦C forbest durability.
Generally, carbon material corrosion is caused by high electrode potential, which induces areaction between carbon material and water. Carbon material surface defects are the most influentialfactor in corrosion. The purpose of carbon material graphite is to reduce surface defects for a morecompact surface. Different types of carbon materials, like CNT, CNC, graphene, and so on, dueto their unique surface structures, have different properties that have yet to be fully investigated.To achieve good ORR activity and carbon corrosion resistance, one must consider the balance betweenthe graphitic level, the amount of surface oxide, surface roughness, pore size, and hydrophobicity.With the consideration of the important relationship among catalyst layer effective properties, ORR
Catalysts 2016, 6, 197 14 of 21
performance, and durability, it would prove useful to set design rules to produce and optimize thestructure carbon material and MEA in order to satisfy various kinds of fuel cell operation conditions.
Catalysts 2016, 6, 197 13 of 21
Figure 5. Three different types of carbon materials: (a) carbon black; (b) carbon nanofiber; (c) carbon
nanocage. Reproduced with permission from [60], Copyright Elsevier, 2009.
Table 2. Changes in different types of carbon materials’ electrical data before and after corrosion
experiments.
Condition
Active Surface
Area (m2∙g−1)
Membrane
Resistance
Charge Transfer
Resistance
CO2 Emission
(μL) Reference
Before After Before After Before After 30 [email protected] V
Pt/XC‐72
(1200 cycle) 62.2 40.0 – – – – – [44]
Pt/BP2000 59.9 26.7 – – – – – –
Pt/Carbon Black
(up to 4000 cycle) 41.7 15.2 0.016 0.025 0.039 0.328 651 [60]
Pt/CNF 30.1 27.7 0.016 0.016 0.054 0.058 49 –
Pt/CNC 33.6 32.9 0.016 0.016 0.04 0.041 4 –
There are some specific examples to show various kinds of carbon material durability
performance. Vinod et al. made an effort to test graphite carbon support [65]. In the accelerated stress
test (AST), graphite Pt/C catalyst had better carbon corrosion resistance relative to the untreated
carbon sample. They tested ECSA, cell performance, charge transfer resistance by CV, cell
polarization, and resistance, respectively. In the PEMFC cathode, graphite Pt/C catalyst electrical
performance deteriorated by 10% after 70 h AST compared to 77% of untreated carbon support, as
shown in Figure 6 [65].
Catalysts 2016, 6, 197 14 of 21
Figure 6. Steady‐state performance curves for PEFCs with (a) Pt/Non‐GrC and (b) Pt/GrC cathodes
prior to AST and after 50 or 70 h of AST with H2–O2 at 60 °C. Reproduced with permission from [65].
Copyright WILEY‐VCH, 2011.
Zhao et al. evaluated the change in nanostructure through the various heat treatments of carbon
materials and their durability for the startup/shutdown operation of PEFC [66]. This paper had a
similar result in that great catalyst support should have a high graphitization degree and good
interaction with the catalyst. It gave an optimum heat treatment temperature of 1600 °C for best
durability.
Generally, carbon material corrosion is caused by high electrode potential, which induces a
reaction between carbon material and water. Carbon material surface defects are the most influential
factor in corrosion. The purpose of carbon material graphite is to reduce surface defects for a more
compact surface. Different types of carbon materials, like CNT, CNC, graphene, and so on, due to
their unique surface structures, have different properties that have yet to be fully investigated. To
achieve good ORR activity and carbon corrosion resistance, one must consider the balance between
the graphitic level, the amount of surface oxide, surface roughness, pore size, and hydrophobicity.
With the consideration of the important relationship among catalyst layer effective properties, ORR
performance, and durability, it would prove useful to set design rules to produce and optimize the
structure carbon material and MEA in order to satisfy various kinds of fuel cell operation conditions.
4.2.3. Water Oxidation Reaction
In fuel cell reversal, water oxidation occurs in combination with carbon corrosion among
abnormal reactions. Like the sacrificial anode preventing metal corrosion, water oxidation would
occur more prevalently to minimize carbon oxidation. Some papers [11,37] also propose that the
promotion of water oxidation over carbon through anode structure and component modification
would mitigate the catalyst degradation. Obviously, there are two kinds of approaches to promoting
chemical reaction: (1) increasing the amount of reactant and (2) reducing water oxidation reaction’s
activation energy. In Equations (9) and (10), we can see that reducing the water oxidation reaction’s
over‐potential and increasing its kinetic rate instead of the protons and electrons produced by carbon
corrosion can protect the fuel cell system. These two methods are reported in detail as follows.
Water Oxidation Catalyst
Catalysts can increase or decrease reaction activity energy to promote chemical reactions in
directions we expect. Adding catalysts to boost water oxidation and reduce carbon corrosion would
be an effective method of decreasing cell reversal.
Figure 6. Steady-state performance curves for PEFCs with (a) Pt/Non-GrC and (b) Pt/GrC cathodesprior to AST and after 50 or 70 h of AST with H2–O2 at 60 ◦C. Reproduced with permission from [65].Copyright WILEY-VCH, 2011.
4.2.3. Water Oxidation Reaction
In fuel cell reversal, water oxidation occurs in combination with carbon corrosion among abnormalreactions. Like the sacrificial anode preventing metal corrosion, water oxidation would occur moreprevalently to minimize carbon oxidation. Some papers [11,37] also propose that the promotion ofwater oxidation over carbon through anode structure and component modification would mitigate thecatalyst degradation. Obviously, there are two kinds of approaches to promoting chemical reaction:(1) increasing the amount of reactant and (2) reducing water oxidation reaction’s activation energy.In Equations (9) and (10), we can see that reducing the water oxidation reaction’s over-potential andincreasing its kinetic rate instead of the protons and electrons produced by carbon corrosion can protectthe fuel cell system. These two methods are reported in detail as follows.
Catalysts 2016, 6, 197 15 of 21
Water Oxidation Catalyst
Catalysts can increase or decrease reaction activity energy to promote chemical reactions indirections we expect. Adding catalysts to boost water oxidation and reduce carbon corrosion would bean effective method of decreasing cell reversal.
Ralph et al. [16] added 20 wt % RuO2 to 20% Pt and 10% Ru catalysts supported on Vulcan XC72R with PTFE. The time to achieve −2.0 V increased from 22 to 32 min. As Table 3 shows, three wateroxidation catalysts, RuO2, RuO2–TiO2, and RuO2–IrO2, had different effects on cell reversal with theincreasing reactivity RuO2–IrO2 > RuO2–TiO2 > RuO2.
Table 3. The catalysts effect in anodes on the cell reversal tolerance in Step 3 of the protocol. Reproducedwith permission from [16]. Copyright ECS, 2006.
Anode Design with Different Catalyst Time (min)
20% Pt, 10% Ru/Shawinigan anode catalyst 0.25Anode Catalyst* + RuO2/Shawinigan 4.5
Anode Catalyst* + RuO2–TiO2 (90:10 atomic ratio Ru/Ti)/Shawinigan 24Anode Catalyst* + RuO2–IrO2 (90:10 atomic ratio Ru/Ir)/Shawinigan 4820% Pt, 10% Ru/Shawinigan+ RuO2–IrO2 (90:10 atomic ratio Ru/Ir) 74
40% Pt, 20% Ru/Shawinigan 16740% Pt, 20% Ru/Shawinigan + RuO2–IrO2 (90:10 atomic ratio Ru/Ir) 1630
Ralph and coworkers made a series of investigations into electrochemical catalyst loading forwater oxidation both unsupported and supported on various kinds of carbon materials. In thethree-step protocol presented above, it is easy to recognize the performance of electrochemical catalystsaccording to the time it takes to get −2.0 V of cell potential, as listed in Table 3. The time to get to−2.0 V can partially demonstrate the effect of a water oxidation catalyst. Combined with CV, TEM,or SEM imaging before and after cell reversal experiment, we can analyze the morphology of carbonsupport and catalyst particles generally.
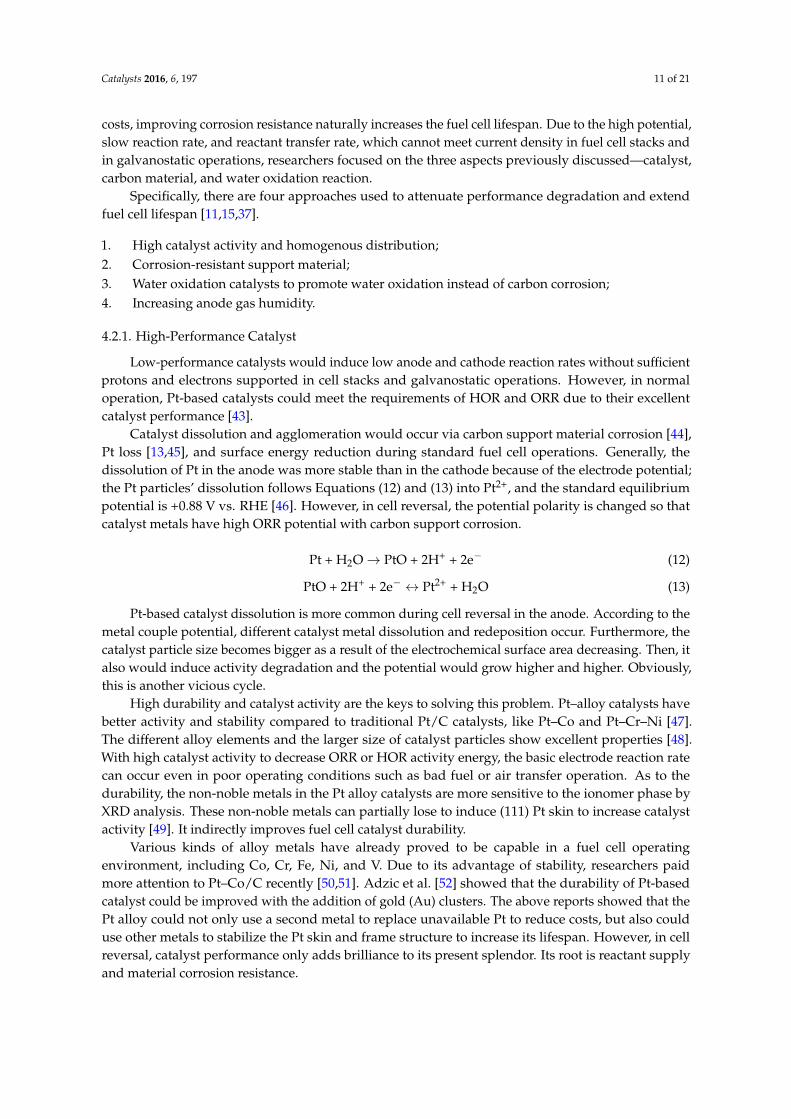
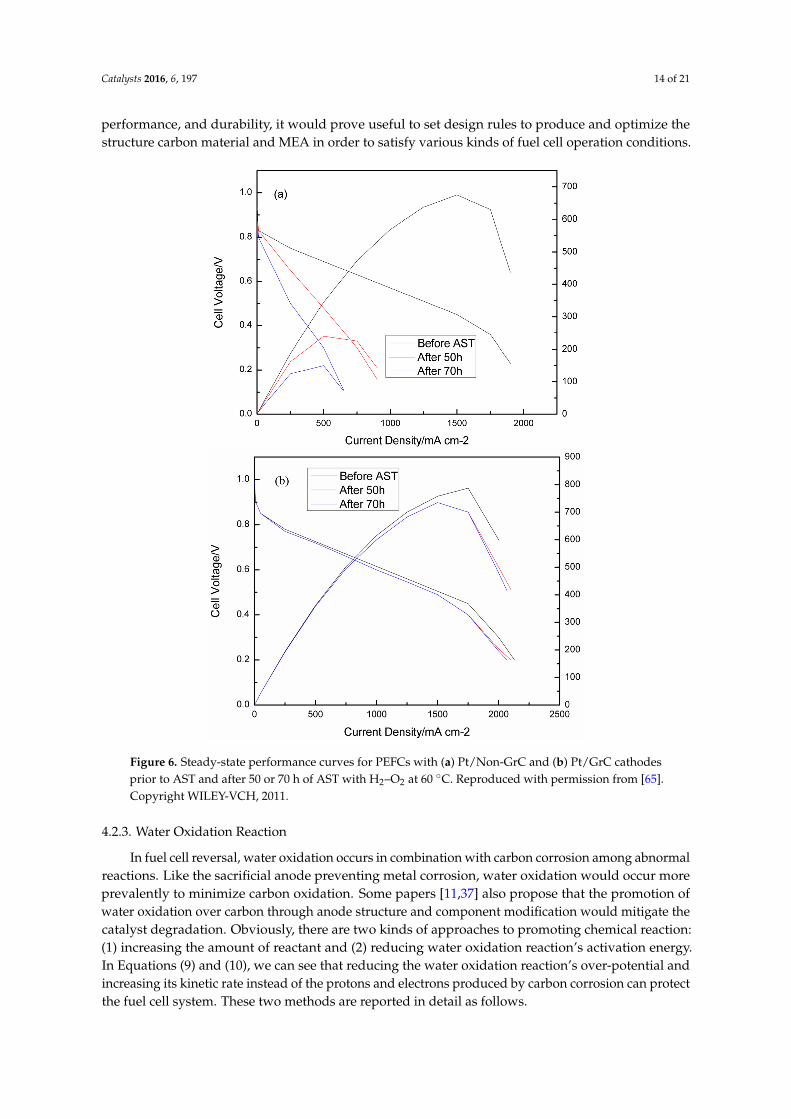
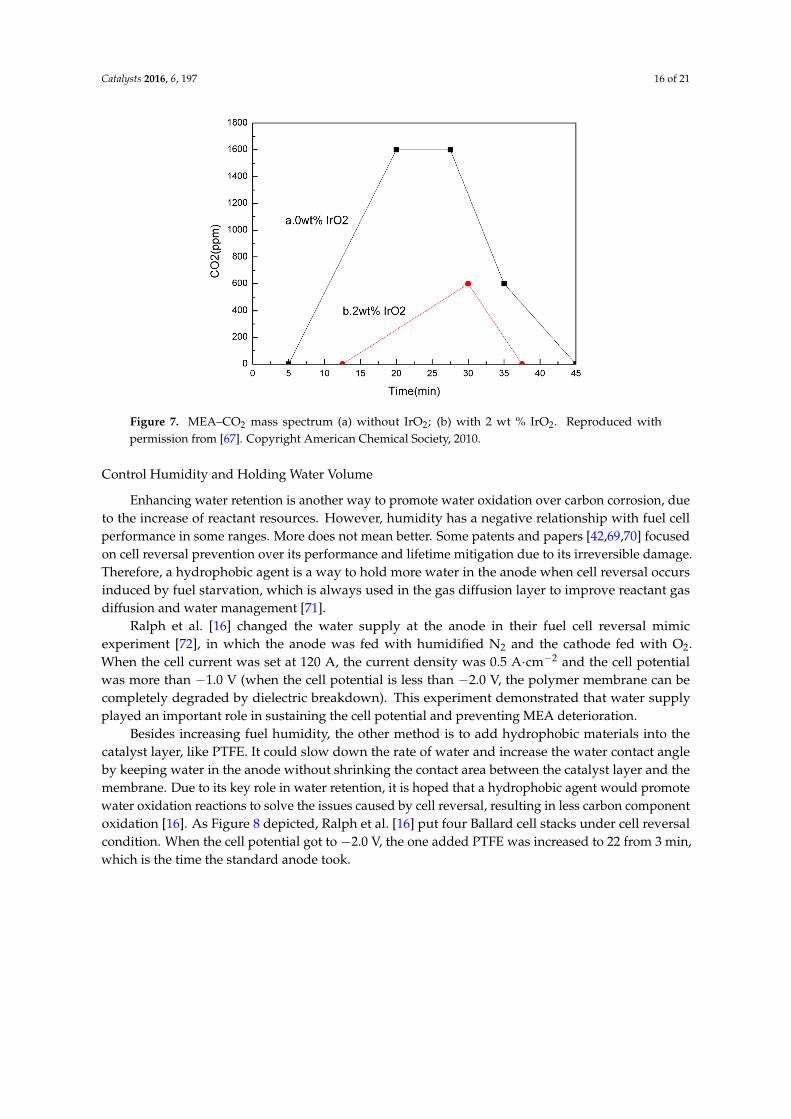
Jang et al. [67] studied the effect of water oxidation catalyst added into cathode to weakencarbon corrosion. In Figure 7, compared with commercialized Pt/C catalyst, the electrochemicalcarbon corrosion decreased by 76% with 2 wt % IrO2 (0.016 mg·cm−2) under 1.6 V (vs. NHE) and70 ◦C. CO2 monitoring showed that the water oxidation catalyst had the effect of mitigating carboncorrosion. Carbon dioxide is produced by carbon corrosion in a fuel cell. The decrease of carbondioxide production means the amount of COR is reducing. Theoretically, a water oxidation catalystcould also be used in anodes to decrease carbon corrosion.
Jang et al. [68] also studied the performance of IrO2 and IrO2/C mixed with Pt/C on cathodedurability during fuel starvation. In an accelerated fuel starvation test, with varying amounts ofIrO2 (2.5, 5, 10, or 20 wt %), the peak power densities of the cell cathode catalyst were decreased by10.21%, 6.52%, 2.93%, and almost 0, respectively. This shows that IrO2 plays an important role inmaintaining cell performance under extreme operation conditions. However, due to the screeningeffect, IrO2 particles in the cathode surface mixed with the commercial Pt/C would reduce the activityof the Pt-based catalyst. Therefore, IrO2/C was chosen as the mixture of cathode catalyst. As a waterelectrolysis catalyst, with the IrO2/C increasing, the durability of the fuel cell became better and betterdue to the rapid decomposition of water molecules. According to the screening effect and catalystdurability, 10 wt % IrO2/C with Pt/C catalyst is a better choice.
In the case of water oxidation, the most important points are the design of catalyst layers mixedbetween Pt-based catalysts and water oxidation catalysts. Some papers [16,67,68] proposed that thewater oxidation catalyst has a positive effect on water electrolysis over and above carbon corrosionand the degradation of carbon support material. It is obvious that water oxidation catalyst improvesthe cell reversal tolerance with increasing effect (RuO2–IrO2 > RuO2–TiO2 > RuO2).
Catalysts 2016, 6, 197 16 of 21
Catalysts 2016, 6, 197 15 of 21
Ralph et al. [16] added 20 wt % RuO2 to 20% Pt and 10% Ru catalysts supported on Vulcan XC
72R with PTFE. The time to achieve −2.0 V increased from 22 to 32 min. As Table 3 shows, three water
oxidation catalysts, RuO2, RuO2–TiO2, and RuO2–IrO2, had different effects on cell reversal with the
increasing reactivity RuO2–IrO2 > RuO2–TiO2 > RuO2.
Ralph and coworkers made a series of investigations into electrochemical catalyst loading for
water oxidation both unsupported and supported on various kinds of carbon materials. In the three‐
step protocol presented above, it is easy to recognize the performance of electrochemical catalysts
according to the time it takes to get −2.0 V of cell potential, as listed in Table 3. The time to get to −2.0
V can partially demonstrate the effect of a water oxidation catalyst. Combined with CV, TEM, or SEM
imaging before and after cell reversal experiment, we can analyze the morphology of carbon support
and catalyst particles generally.
Table 3. The catalysts effect in anodes on the cell reversal tolerance in Step 3 of the protocol.
Reproduced with permission from [16], Copyright ECS, 2006.
Anode design with different catalyst Time (min)
20% Pt, 10% Ru/Shawinigan anode catalyst 0.25
Anode Catalyst* + RuO2/Shawinigan 4.5
Anode Catalyst* + RuO2–TiO2 (90:10 atomic ratio Ru/Ti)/Shawinigan 24
Anode Catalyst* + RuO2–IrO2 (90:10 atomic ratio Ru/Ir)/Shawinigan 48
20% Pt, 10% Ru/Shawinigan+ RuO2–IrO2 (90:10 atomic ratio Ru/Ir) 74
40% Pt, 20% Ru/Shawinigan 167
40% Pt, 20% Ru/Shawinigan + RuO2–IrO2 (90:10 atomic ratio Ru/Ir) 1630
Jang et al. [67] studied the effect of water oxidation catalyst added into cathode to weaken carbon
corrosion. In Figure 7, compared with commercialized Pt/C catalyst, the electrochemical carbon
corrosion decreased by 76% with 2 wt % IrO2 (0.016 mg∙cm−2) under 1.6 V (vs. NHE) and 70 °C. CO2
monitoring showed that the water oxidation catalyst had the effect of mitigating carbon corrosion.
Carbon dioxide is produced by carbon corrosion in a fuel cell. The decrease of carbon dioxide
production means the amount of COR is reducing. Theoretically, a water oxidation catalyst could
also be used in anodes to decrease carbon corrosion.
Figure 7. MEA–CO2 mass spectrum (a) without IrO2; (b) with 2 wt % IrO2. Reproduced with
permission from [67]. Copyright American Chemical Society, 2010.
Figure 7. MEA–CO2 mass spectrum (a) without IrO2; (b) with 2 wt % IrO2. Reproduced withpermission from [67]. Copyright American Chemical Society, 2010.
Control Humidity and Holding Water Volume
Enhancing water retention is another way to promote water oxidation over carbon corrosion, dueto the increase of reactant resources. However, humidity has a negative relationship with fuel cellperformance in some ranges. More does not mean better. Some patents and papers [42,69,70] focusedon cell reversal prevention over its performance and lifetime mitigation due to its irreversible damage.Therefore, a hydrophobic agent is a way to hold more water in the anode when cell reversal occursinduced by fuel starvation, which is always used in the gas diffusion layer to improve reactant gasdiffusion and water management [71].
Ralph et al. [16] changed the water supply at the anode in their fuel cell reversal mimicexperiment [72], in which the anode was fed with humidified N2 and the cathode fed with O2.When the cell current was set at 120 A, the current density was 0.5 A·cm−2 and the cell potentialwas more than −1.0 V (when the cell potential is less than −2.0 V, the polymer membrane can becompletely degraded by dielectric breakdown). This experiment demonstrated that water supplyplayed an important role in sustaining the cell potential and preventing MEA deterioration.
Besides increasing fuel humidity, the other method is to add hydrophobic materials into thecatalyst layer, like PTFE. It could slow down the rate of water and increase the water contact angleby keeping water in the anode without shrinking the contact area between the catalyst layer and themembrane. Due to its key role in water retention, it is hoped that a hydrophobic agent would promotewater oxidation reactions to solve the issues caused by cell reversal, resulting in less carbon componentoxidation [16]. As Figure 8 depicted, Ralph et al. [16] put four Ballard cell stacks under cell reversalcondition. When the cell potential got to −2.0 V, the one added PTFE was increased to 22 from 3 min,which is the time the standard anode took.
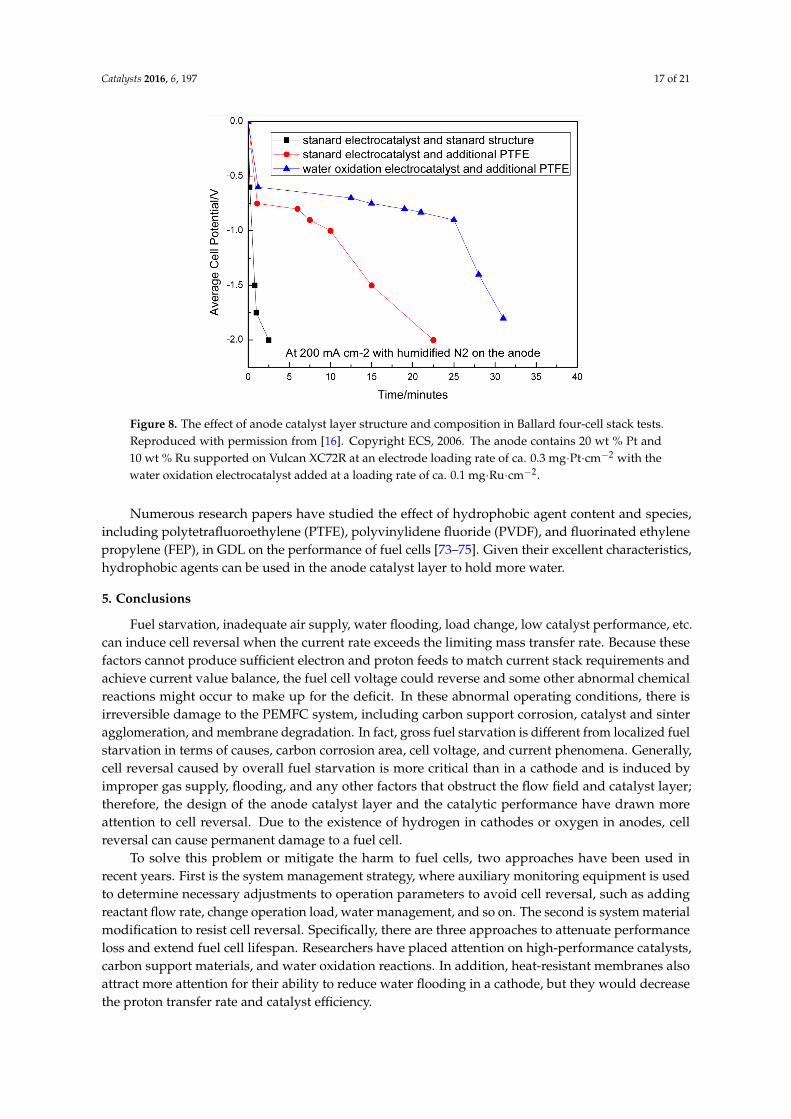
Catalysts 2016, 6, 197 17 of 21Catalysts 2016, 6, 197 17 of 21
Figure 8. The effect of anode catalyst layer structure and composition in Ballard four‐cell stack tests.
Reproduced with permission from [16], Copyright ECS, 2006. The anode contains 20 wt % Pt and 10
wt % Ru supported on Vulcan XC72R at an electrode loading rate of ca. 0.3 mg∙Pt∙cm−2 with the water
oxidation electrocatalyst added at a loading rate of ca. 0.1 mg∙Ru∙cm−2.
Numerous research papers have studied the effect of hydrophobic agent content and species,
including polytetrafluoroethylene (PTFE), polyvinylidene fluoride (PVDF), and fluorinated ethylene
propylene (FEP), in GDL on the performance of fuel cells [73–75]. Given their excellent characteristics,
hydrophobic agents can be used in the anode catalyst layer to hold more water.
5. Conclusions
Fuel starvation, inadequate air supply, water flooding, load change, low catalyst performance,
etc. can induce cell reversal when the current rate exceeds the limiting mass transfer rate. Because
these factors cannot produce sufficient electron and proton feeds to match current stack requirements
and achieve current value balance, the fuel cell voltage could reverse and some other abnormal
chemical reactions might occur to make up for the deficit. In these abnormal operating conditions,
there is irreversible damage to the PEMFC system, including carbon support corrosion, catalyst and
sinter agglomeration, and membrane degradation. In fact, gross fuel starvation is different from
localized fuel starvation in terms of causes, carbon corrosion area, cell voltage, and current
phenomena. Generally, cell reversal caused by overall fuel starvation is more critical than in a cathode
and is induced by improper gas supply, flooding, and any other factors that obstruct the flow field
and catalyst layer; therefore, the design of the anode catalyst layer and the catalytic performance have
drawn more attention to cell reversal. Due to the existence of hydrogen in cathodes or oxygen in
anodes, cell reversal can cause permanent damage to a fuel cell.
To solve this problem or mitigate the harm to fuel cells, two approaches have been used in recent
years. First is the system management strategy, where auxiliary monitoring equipment is used to
determine necessary adjustments to operation parameters to avoid cell reversal, such as adding
reactant flow rate, change operation load, water management, and so on. The second is system
material modification to resist cell reversal. Specifically, there are three approaches to attenuate
performance loss and extend fuel cell lifespan. Researchers have placed attention on high‐
performance catalysts, carbon support materials, and water oxidation reactions. In addition, heat‐
resistant membranes also attract more attention for their ability to reduce water flooding in a cathode,
but they would decrease the proton transfer rate and catalyst efficiency.
Obviously, there are still several problems in need of further study, such as (1) understanding
the effects of different types of carbon materials’ surface forms and structure; (2) developing a novel
Figure 8. The effect of anode catalyst layer structure and composition in Ballard four-cell stack tests.Reproduced with permission from [16]. Copyright ECS, 2006. The anode contains 20 wt % Pt and10 wt % Ru supported on Vulcan XC72R at an electrode loading rate of ca. 0.3 mg·Pt·cm−2 with thewater oxidation electrocatalyst added at a loading rate of ca. 0.1 mg·Ru·cm−2.
Numerous research papers have studied the effect of hydrophobic agent content and species,including polytetrafluoroethylene (PTFE), polyvinylidene fluoride (PVDF), and fluorinated ethylenepropylene (FEP), in GDL on the performance of fuel cells [73–75]. Given their excellent characteristics,hydrophobic agents can be used in the anode catalyst layer to hold more water.
5. Conclusions
Fuel starvation, inadequate air supply, water flooding, load change, low catalyst performance, etc.can induce cell reversal when the current rate exceeds the limiting mass transfer rate. Because thesefactors cannot produce sufficient electron and proton feeds to match current stack requirements andachieve current value balance, the fuel cell voltage could reverse and some other abnormal chemicalreactions might occur to make up for the deficit. In these abnormal operating conditions, there isirreversible damage to the PEMFC system, including carbon support corrosion, catalyst and sinteragglomeration, and membrane degradation. In fact, gross fuel starvation is different from localized fuelstarvation in terms of causes, carbon corrosion area, cell voltage, and current phenomena. Generally,cell reversal caused by overall fuel starvation is more critical than in a cathode and is induced byimproper gas supply, flooding, and any other factors that obstruct the flow field and catalyst layer;therefore, the design of the anode catalyst layer and the catalytic performance have drawn moreattention to cell reversal. Due to the existence of hydrogen in cathodes or oxygen in anodes, cellreversal can cause permanent damage to a fuel cell.
To solve this problem or mitigate the harm to fuel cells, two approaches have been used inrecent years. First is the system management strategy, where auxiliary monitoring equipment is usedto determine necessary adjustments to operation parameters to avoid cell reversal, such as addingreactant flow rate, change operation load, water management, and so on. The second is system materialmodification to resist cell reversal. Specifically, there are three approaches to attenuate performanceloss and extend fuel cell lifespan. Researchers have placed attention on high-performance catalysts,carbon support materials, and water oxidation reactions. In addition, heat-resistant membranes alsoattract more attention for their ability to reduce water flooding in a cathode, but they would decreasethe proton transfer rate and catalyst efficiency.
Catalysts 2016, 6, 197 18 of 21
Obviously, there are still several problems in need of further study, such as (1) understandingthe effects of different types of carbon materials’ surface forms and structure; (2) developing a novelcatalyst layer assembly including a high-performance catalyst, corrosion-resistant carbon material,a water oxidation catalyst, and hydrophobic agents; and (3) distinguishing the specific electrodereaction caused by the phenomenon of hydrogen pump and oxygen pump. Compared to a fuel cellsystem of water and heat management, this is simpler and more critical to catalyst layer design, andwould make system management more efficient by diminishing several controlling limitations.
Acknowledgments: This paper was generously supported by the National Natural Science Foundation(No. 21206128).
Author Contributions: Daijun Yang, Bing Li, and Cunman Zhang collected experiment data, analyzed andsynthesized fuel cell theory, Jue Wang and Bing Li revised the English expression. Congwei Qin analyzedreferences material, experiment data and wrote the paper.
Conflicts of Interest: The authors declare no conflict of interest.
References
1. Yi, B. Fuel Cell-Principle, Technology and Application; Chemical Industry: Beijing, China, 2003; p. 41.2. Rajashekara, K.; Rathore, A.K. Power conversion and control for fuel cell systems in transportation and
stationary power generation. Electr. Power Compon. Syst. 2015, 43, 1376–1387. [CrossRef]3. Popovich, N. US Department of Energy Hydrogen and Fuel Cells Program 2015 Annual Merit Review and Peer
Evaluation Report: June 8–12, 2015, Arlington, Virginia; NREL (National Renewable Energy Laboratory (NREL):Golden, CO, USA, 2015.
4. Zhou, F.; Andreasen, S.J.; Kær, S.K. Experimental study of cell reversal of a high temperature polymerelectrolyte membrane fuel cell caused by H2 starvation. Int. J. Hydrogen Energy 2015, 40, 6672–6680.[CrossRef]
5. Taniguchi, A.; Akita, T.; Yasuda, K.; Miyazaki, Y. Analysis of degradation in PEMFC caused by cell reversalduring air starvation. Int. J. Hydrogen Energy 2008, 33, 2323–2329. [CrossRef]
6. Taniguchi, A.; Akita, T.; Yasuda, K.; Miyazaki, Y. Analysis of electrocatalyst degradation in PEMFC causedby cell reversal during fuel starvation. J. Power Sources 2004, 130, 42–49. [CrossRef]
7. Zhang, G.; Shen, S.; Guo, L.; Liu, H. Dynamic characteristics of local current densities and temperatures inproton exchange membrane fuel cells during reactant starvations. Int. J. Hydrogen Energy 2012, 37, 1884–1892.[CrossRef]
8. Yu, Y.; Li, H.; Wang, H.; Yuan, X.-Z.; Wang, G.; Pan, M. A review on performance degradation of protonexchange membrane fuel cells during startup and shutdown processes: Causes, consequences, and mitigationstrategies. J. Power Sources 2012, 205, 10–23. [CrossRef]
9. Dou, M.; Hou, M.; Liang, D.; Shen, Q.; Zhang, H.; Lu, W.; Shao, Z.; Yi, B. Behaviors of proton exchangemembrane fuel cells under oxidant starvation. J. Power Sources 2011, 196, 2759–2762. [CrossRef]
10. Castanheira, L.; Silva, W.O.; Lima, F.H.; Crisci, A.; Dubau, L.; Maillard, F.D.R. Carbon corrosion inproton-exchange membrane fuel cells: Effect of the carbon structure, the degradation protocol, and the gasatmosphere. ACS Catal. 2015, 5, 2184–2194. [CrossRef]
11. Knights, S.D.; Colbow, K.M.; St-Pierre, J.; Wilkinson, D.P. Aging mechanisms and lifetime of PEFC andDMFC. J. Power Sources 2004, 127, 127–134. [CrossRef]
12. Zhou, F.; Andreasen, S.J.; Kær, S.K.; Yu, D. Analysis of accelerated degradation of a HT-PEM fuel cell causedby cell reversal in fuel starvation condition. Int. J. Hydrogen Energy 2015, 40, 2833–2839. [CrossRef]
13. Zhang, S.; Yuan, X.-Z.; Hin, J.N.C.; Wang, H.; Friedrich, K.A.; Schulze, M. A review of platinum-basedcatalyst layer degradation in proton exchange membrane fuel cells. J. Power Sources 2009, 194, 588–600.[CrossRef]
14. Kang, J.; Jung, D.W.; Park, S.; Lee, J.-H.; Ko, J.; Kim, J. Accelerated test analysis of reversal potential causedby fuel starvation during PEMFCs operation. Int. J. Hydrogen Energy 2010, 35, 3727–3735. [CrossRef]
15. Yousfi-Steiner, N.; Moçotéguy, P.; Candusso, D.; Hissel, D. A review on polymer electrolyte membranefuel cell catalyst degradation and starvation issues: Causes, consequences and diagnostic for mitigation.J. Power Sources 2009, 194, 130–145. [CrossRef]
Catalysts 2016, 6, 197 19 of 21
16. Ralph, T.R.; Hudson, S.; Wilkinson, D.P. Electrocatalyst stability in PEMFCs and the role of fuel starvationand cell reversal tolerant anodes. ECS Trans. 2006, 1, 67–84.
17. Yang, X.-G.; Ye, Q.; Cheng, P. Hydrogen pumping effect induced by fuel starvation in a single cell of a PEMfuel cell stack at galvanostatic operation. Int. J. Hydrogen Energy 2012, 37, 14439–14453. [CrossRef]
18. Li, B.; Higgins, D.C.; Xiao, Q.; Yang, D.; Zhng, C.; Cai, M.; Chen, Z.; Ma, J. The durability of carbon supportedPt nanowire as novel cathode catalyst for a 1.5 kW PEMFC stack. Appl. Catal. B 2015, 162, 133–140. [CrossRef]
19. Sakamoto, S.; Karakane, M.; Maeda, H.; Miyake, Y.; Susai, T.; Isono, T. Study of the Factors Affecting PEFC LifeCharacteristic; Ecology and Energy Systems Research Center, SANYO Electric Co., Ltd.: Tochigi, Japan, 2000;pp. 326–8534.
20. Kim, S.; Shimpalee, S.; van Zee, J. The effect of stoichiometry on dynamic behavior of a proton exchangemembrane fuel cell (PEMFC) during load change. J. Power Sources 2004, 135, 110–121. [CrossRef]
21. Rao, R.M.; Rengaswamy, R. A distributed dynamic model for chronoamperometry, chronopotentiometryand gas starvation studies in PEM fuel cell cathode. Chem. Eng. Sci. 2006, 61, 7393–7409.
22. Shen, Q.; Hou, M.; Yan, X.; Liang, D.; Zang, Z.; Hao, L.; Shao, Z.; Hou, Z.; Ming, P.; Yi, B. The voltagecharacteristics of proton exchange membrane fuel cell (PEMFC) under steady and transient states.J. Power Sources 2008, 179, 292–296. [CrossRef]
23. Liu, Z.; Yang, L.; Mao, Z.; Zhuge, W.; Zhang, Y.; Wang, L. Behavior of PEMFC in starvation. J. Power Sources2006, 157, 166–176. [CrossRef]
24. Büchi, F.N.; Inaba, M.; Schmidt, T.J. Polymer Electrolyte Fuel Cell Durability; Springer: New York, NY,USA, 2009.
25. Ofstad, A.; Davey, J.; Sunde, S.; Borup, R.L. Carbon corrosion of a PEMFC during shut-down/start-up whenusing an air purge procedure. ECS Trans. 2008, 16, 1301–1311.
26. Hu, J.; Sui, P.; Kumar, S.; Djilali, N. Modelling and simulations of carbon corrosion during operation of apolymer electrolyte membrane fuel cell. Electrochim. Acta 2009, 54, 5583–5592. [CrossRef]
27. Patterson, T.W.; Darling, R.M. Damage to the cathode catalyst of a PEM fuel cell caused by localized fuelstarvation. Electrochem. Solid-State Lett. 2006, 9, A183–A185. [CrossRef]
28. Lim, K.H.; Oh, H.-S.; Jang, S.-E.; Ko, Y.-J.; Kim, H.-J.; Kim, H. Effect of operating conditions on carboncorrosion in polymer electrolyte membrane fuel cells. J. Power Sources 2009, 193, 575–579. [CrossRef]
29. Ralph, T.; Hogarth, M. Catalysis for low temperature fuel cells. Platin. Met. Rev. 2002, 46, 117–135.30. Liang, D.; Shen, Q.; Hou, M.; Shao, Z.; Yi, B. Study of the cell reversal process of large area proton exchange
membrane fuel cells under fuel starvation. J. Power Sources 2009, 194, 847–853. [CrossRef]31. Liang, D.; Dou, M.; Hou, M.; Shen, Q.; Shao, Z.; Yi, B. Behavior of a unit proton exchange membrane fuel cell
in a stack under fuel starvation. J. Power Sources 2011, 196, 5595–5598. [CrossRef]32. Tüber, K.; Pócza, D.; Hebling, C. Visualization of water buildup in the cathode of a transparent PEM fuel cell.
J. Power Sources 2003, 124, 403–414. [CrossRef]33. Natarajan, D.; van Nguyen, T. Current distribution in PEM fuel cells. Part 2: Air operation and temperature
effect. AIChE J. 2005, 51, 2599–2608. [CrossRef]34. Rangel, C.; Travassos, M.A.; Fernandes, V.R.; Silva, R.; Paiva, T. Fuel Starvation: Irreversible Degradation
Mechanisms in PEM Fuel Cells; WHEC—World Hydrogen Energy Convention: Essen, Germany, 2010.35. Zhang, J.; Yang, H.; Fang, J.; Zou, S. Synthesis and oxygen reduction activity of shape-controlled Pt3Ni
nanopolyhedra. Nano Lett. 2010, 10, 638–644. [CrossRef] [PubMed]36. Yu, X.; Ye, S. Recent advances in activity and durability enhancement of Pt/C catalytic cathode in PEMFC:
Part II: Degradation mechanism and durability enhancement of carbon supported platinum catalyst.J. Power Sources 2007, 172, 145–154. [CrossRef]
37. Wilkinson, D.; St-Pierre, J.; Vielstich, W.; Gasteiger, H.; Lamm, A. Handbook of fuel cells—Fundamentals,technology and applications. Fuel Cell Technol. Appl. 2003, 3, 611.
38. Maass, S.; Finsterwalder, F.; Frank, G.; Hartmann, R.; Merten, C. Carbon support oxidation in PEM fuel cellcathodes. J. Power Sources 2008, 176, 444–451. [CrossRef]
39. Barton, R.H. Preventing Voltage Reversal Conditions in Solid Polymer Electrolyte Cells; Heating Resistorand Rectifier in Series; Sensing Thermistor; Detecting a Low Voltage in a Fuel Cell. U.S. Patent 6,724,194,20 April 2004.
40. Baumgartner, W.; Parz, P.; Fraser, S.; Wallnöfer, E.; Hacker, V. Polarization study of a PEMFC with fourreference electrodes at hydrogen starvation conditions. J. Power Sources 2008, 182, 413–421. [CrossRef]
Catalysts 2016, 6, 197 20 of 21
41. Perry, M.L.; Patterson, T.; Reiser, C. Systems strategies to mitigate carbon corrosion in fuel cells. ECS Trans.2006, 3, 783–795.
42. Vahidi, A.; Stefanopoulou, A.; Peng, H. Model predictive control for starvation prevention in a hybrid fuelcell system. In Proceedings of the 2004 American Control Conference, 30 June–2 July 2004; IEEE: Boston,MA, USA; pp. 834–839.
43. Jung, N.; Chung, D.Y.; Ryu, J.; Yoo, S.J.; Sung, Y.-E. Pt-based nanoarchitecture and catalyst design for fuel cellapplications. Nano Today 2014, 9, 433–456. [CrossRef]
44. Wang, J.; Yin, G.; Shao, Y.; Zhang, S.; Wang, Z.; Gao, Y. Effect of carbon black support corrosion on thedurability of Pt/C catalyst. J. Power Sources 2007, 171, 331–339. [CrossRef]
45. Luo, Z.; Li, D.; Tang, H.; Pan, M.; Ruan, R. Degradation behavior of membrane–electrode-assembly materialsin 10-cell PEMFC stack. Int. J. Hydrogen Energy 2006, 31, 1831–1837. [CrossRef]
46. Yoda, T.; Uchida, H.; Watanabe, M. Effects of operating potential and temperature on degradation ofelectrocatalyst layer for PEFCs. Electrochim. Acta 2007, 52, 5997–6005. [CrossRef]
47. Colón-Mercado, H.R.; Popov, B.N. Stability of platinum based alloy cathode catalysts in PEM fuel cells.J. Power Sources 2006, 155, 253–263. [CrossRef]
48. Gasteiger, H.A.; Kocha, S.S.; Sompalli, B.; Wagner, F.T. Activity benchmarks and requirements for Pt, Pt–alloy,and non-Pt oxygen reduction catalysts for PEMFCs. Appl. Catal. B 2005, 56, 9–35. [CrossRef]
49. Wan, L.J.; Moriyama, T.; Ito, M.; Uchida, H.; Watanabe, M. In situ STM imaging of surface dissolution andrearrangement of a Pt–Fe alloy electrocatalyst in electrolyte solution. Chem. Commun. 2002. [CrossRef]
50. Paulus, U.; Wokaun, A.; Scherer, G.; Schmidt, T.; Stamenkovic, V.; Radmilovic, V.; Markovic, N.; Ross, P.Oxygen reduction on carbon-supported Pt–Ni and Pt–Co alloy catalysts. J. Phys. Chem. B 2002, 106,4181–4191. [CrossRef]
51. Yu, P.; Pemberton, M.; Plasse, P. PtCo/C cathode catalyst for improved durability in PEMFCs. J. Power Sources2005, 144, 11–20. [CrossRef]
52. Zhang, J.; Sasaki, K.; Sutter, E.; Adzic, R. Stabilization of platinum oxygen-reduction electrocatalysts usinggold clusters. Science 2007, 315, 220–222. [CrossRef] [PubMed]
53. Stevens, D.; Hicks, M.; Haugen, G.; Dahn, J. Ex situ and in situ stability studies of PEMFC catalysts effect ofcarbon type and humidification on degradation of the carbon. J. Electrochem. Soc. 2005, 152, A2309–A2315.[CrossRef]
54. Kim, M.; Jung, N.; Eom, K.; Yoo, S.J.; Kim, J.Y.; Jang, J.H.; Kim, H.-J.; Hong, B.K.; Cho, E. Effects of anodeflooding on the performance degradation of polymer electrolyte membrane fuel cells. J. Power Sources 2014,266, 332–340. [CrossRef]
55. Antolini, E. Graphene as a new carbon support for low-temperature fuel cell catalysts. Appl. Catal. B 2012,123, 52–68. [CrossRef]
56. Guo, S.; Sun, S. FePt nanoparticles assembled on graphene as enhanced catalyst for oxygen reductionreaction. J. Am. Chem. Soc. 2012, 134, 2492–2495. [CrossRef] [PubMed]
57. Artyushkova, K.; Atanassov, P.; Dutta, M.; Wessel, S.; Colbow, V. Structural correlations: Design levers forperformance and durability of catalyst layers. J. Power Sources 2015, 284, 631–641. [CrossRef]
58. Artyushkova, K.; Pylypenko, S.; Dowlapalli, M.; Atanassov, P. Structure-to-property relationships in fuel cellcatalyst supports: Correlation of surface chemistry and morphology with oxidation resistance of carbonblacks. J. Power Sources 2012, 214, 303–313. [CrossRef]
59. Wlodarczyk, R. Porous carbon materials for elements in low-temperature fuel cells. Arch. Metall. Mater. 2015,60, 117–120. [CrossRef]
60. Oh, H.-S.; Lim, K.H.; Roh, B.; Hwang, I.; Kim, H. Corrosion resistance and sintering effect of carbon supportsin polymer electrolyte membrane fuel cells. Electrochim. Acta 2009, 54, 6515–6521. [CrossRef]
61. Dicks, A.L. The role of carbon in fuel cells. J. Power Sources 2006, 156, 128–141.62. Yang, W.; Wang, Y.; Li, J.; Yang, X. Polymer wrapping technique: An effective route to prepare Pt
nanoflower/carbon nanotube hybrids and application in oxygen reduction. Energy Environ. Sci. 2010,3, 144–149. [CrossRef]
63. Oh, H.S.; Kim, H. Efficient synthesis of Pt nanoparticles supported on hydrophobic graphitized carbonnanofibers for electrocatalysts using noncovalent functionalization. Adv. Funct. Mater. 2011, 21, 3954–3960.[CrossRef]
Catalysts 2016, 6, 197 21 of 21
64. Lim, K.H.; Oh, H.-S.; Kim, H. Use of a carbon nanocage as a catalyst support in polymer electrolyte membranefuel cells. Electrochem. Commun. 2009, 11, 1131–1134. [CrossRef]
65. Vinod Selvaganesh, S.; Selvarani, G.; Sridhar, P.; Pitchumani, S.; Shukla, A. Graphitic carbon as durablecathode-catalyst support for PEFCs. Fuel Cells 2011, 11, 372–384. [CrossRef]
66. Zhao, X.; Hayashi, A.; Noda, Z.; Kimijima, K.i.; Yagi, I.; Sasaki, K. Evaluation of change in nanostructurethrough the heat treatment of carbon materials and their durability for the start/stop operation of polymerelectrolyte fuel cells. Electrochim. Acta 2013, 97, 33–41. [CrossRef]
67. Jang, S.-E.; Kim, H. Effect of water electrolysis catalysts on carbon corrosion in polymer electrolyte membranefuel cells. J. Am. Chem. Soc. 2010, 132, 14700–14701. [CrossRef] [PubMed]
68. Jang, I.; Hwang, I.; Tak, Y. Attenuated degradation of a PEMFC cathode during fuel starvation by usingcarbon-supported IrO2. Electrochim. Acta 2013, 90, 148–156. [CrossRef]
69. Reiser, C.A. Preventing Fuel Starvation of a Fuel Cell Stack. U.S. Patent 7,807,302, 5 October 2010.70. Wilkinson, D.P.; Chow, C.Y.; Allan, D.E.; Johannes, E.P.; Roberts, J.A.; St-Pierre, J.; Longley, C.J.; Chan, J.K.
Method and Apparatus for Operating an Electrochemical Fuel Cell with Periodic Fuel Starvation at theAnode. U.S. Patent 6,096,448, 1 August 2000.
71. Park, S.; Lee, J.-W.; Popov, B.N. A review of gas diffusion layer in PEM fuel cells: Materials and designs.Int. J. Hydrogen Energy 2012, 37, 5850–5865. [CrossRef]
72. Knights, S.D.; Taylor, J.L.; Wilkinson, D.P.; Wainwright, D.S. Fuel Cell Anode Structures for Voltage ReversalTolerance. U.S. Patent 6,517,962, 11 February 2003.
73. Lim, C.; Wang, C. Effects of hydrophobic polymer content in GDL on power performance of a PEM fuel cell.Electrochim. Acta 2004, 49, 4149–4156. [CrossRef]
74. Park, S.; Popov, B.N. Effect of hydrophobicity and pore geometry in cathode GDL on PEM fuel cellperformance. Electrochim. Acta 2009, 54, 3473–3479. [CrossRef]
75. Ismail, M.; Hughes, K.; Ingham, D.; Ma, L.; Pourkashanian, M. Effect of PtFe loading of gas diffusion layerson the performance of proton exchange membrane fuel cells running at high-efficiency operating conditions.Int. J. Energy Res. 2013, 37, 1592–1599. [CrossRef]
© 2016 by the authors; licensee MDPI, Basel, Switzerland. This article is an open accessarticle distributed under the terms and conditions of the Creative Commons Attribution(CC-BY) license (http://creativecommons.org/licenses/by/4.0/).