Embed Size (px)
Citation preview

PROSPECTS FOR PROSPECTS FOR NATIONAL HEALTH CARE NATIONAL HEALTH CARE
REFORMREFORMBeth Israel Deaconess Medical Center, Harvard Medical SchoolESRD: State of the Art and Charting the Challenges for the Future
April 25, 2009
Drew Altman, Ph.D.President and CEO, Kaiser Family Foundation
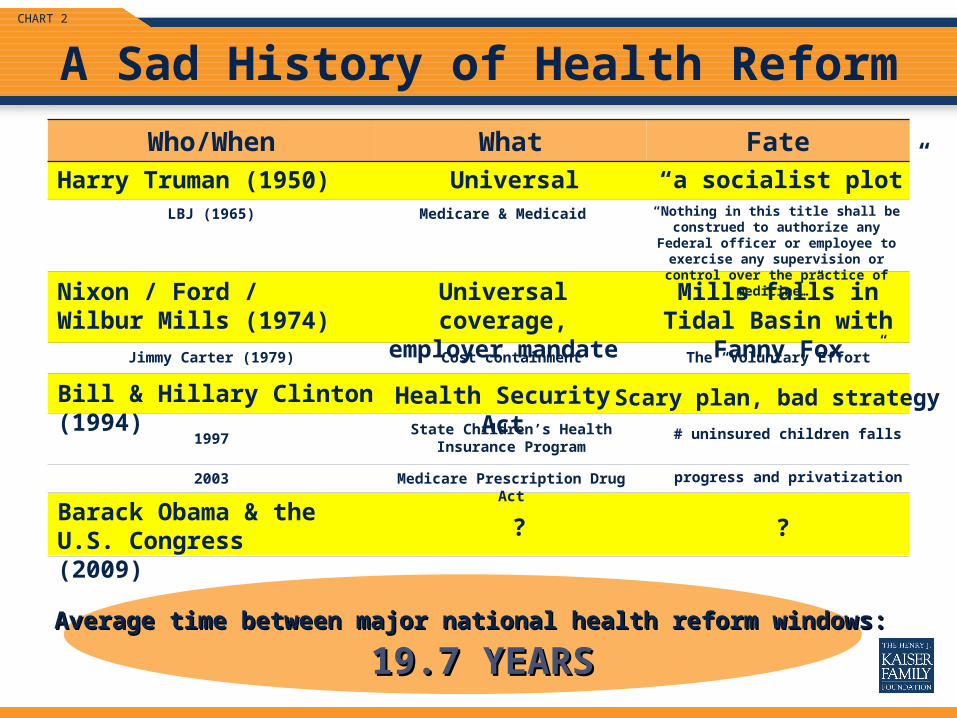
CHART 2
A Sad History of Health Reform
Who/When What Fate
Harry Truman (1950)LBJ (1965)
Average time between major national health reform windows:Average time between major national health reform windows:
19.7 YEARS19.7 YEARS
Nixon / Ford / Wilbur Mills (1974)
Jimmy Carter (1979)
Bill & Hillary Clinton (1994)
Barack Obama & the U.S. Congress (2009)
Universal “a socialist plot”Medicare & Medicaid “Nothing in this title shall be construed
to authorize any Federal officer or employee to exercise any supervision or control over the practice of medicine…”
Universal coverage, employer mandate
Mills falls in Tidal Basin with Fanny Fox
Cost containment The “Voluntary Effort”
? ?
Health Security Act Scary plan, bad strategy
1997State Children’s Health Insurance
Program# uninsured children falls
2003 Medicare Prescription Drug Act progress and privatization

CHART 3
REFORM HEALTH CARE OR I WILL DESTROY THE EARTH…
KLAATU BARADA NIKTO…


CHART 5
Projections of National Health Expenditures and Their Share of Gross Domestic Product, 2007-2018
2,378.62,509.5 2,624.4
3,110.9
3,541.3
4,061.7
2,241.2
4,353.2
3,790.2
3,313.0
2,930.72,770.3
$0
$500
$1,000
$1,500
$2,000
$2,500
$3,000
$3,500
$4,000
$4,500
$5,000
2007* 2008 2009 2010 2011 2012 2013 2014 2015 2016 2017 2018
*2007 are actual data from the 2009 National Health Expenditure Accounts; 2008-2018 are projected data from the 2009 National Health Expenditure Accounts.
Source: Centers for Medicare and Medicaid Services, Office of the Actuary, National Health Statistics Group, at ttp://www.cms.hhs.gov/NationalHealthExpendData/03_NationalHealthAccountsProjected.asp#TopOfPage (see Projected; NHE Historical and projections, 1965-2018, file nhe65-18.zip) and http://www.cms.hhs.gov/NationalHealthExpendData/ (see Historical; NHE summary including share of GDP, CY 1960-2007; file nhegdp07.zip).
NHE as a % of GDP:
Do
lla
rs i
n B
illi
on
s
16.2 16.6 17.6 17.7 17.9 18.0 18.2 18.5 18.9 19.3 19.8 20.3

CHART 6
Projected Number of Uninsured, 2009 and 2019
4554
0
20
40
60
80
100
2009 2019
Source: CBO Key Issues in Analyzing Major Health Insurance Proposals, available at http://cbo.gov/ftpdocs/99xx/doc9924/12-18-KeyIssues.pdf
Mil
lio
ns

CHART 7
$21,863
$19,458
$17,318
$14,679$13,980$13,314$12,680
$20,626
$18,357
$16,337$15,413
$0
$5,000
$10,000
$15,000
$20,000
$25,000
2008 2009 2010 2011 2012 2013 2014 2015 2016 2017 2018
Projections of Employer-Sponsored Insurance Premiums for Family Coverage, 2008-2018
Source: Kaiser Family Foundation analysis of Kaiser/HRET Employer Health Benefits Survey, 2008. Premium projections assume an annual premium increase of 5% from 2008-2012 and 6% from 2013-2018.
Nissan Versa$9,990
Nissan Versa$13,425.72
1.6


CHART 9
The Cost of Cancer & Family Budgets


CHART 11
The Critical Path to Health Reform
Democrats promote issue in Primaries
Stage 1: THE ELECTION
Big enough debate in General to keep momentum alive
Registers in exit polls
Becomes an economic issue

CHART 12
The Critical Path to Health Reform
Democrats promote issue in Primaries
Stage 1: THE ELECTION
Big enough debate in General to keep momentum alive
Stage 2:THE PRESIDENT
Registers in exit polls
• CHIPRA passes• $149 billion “down payment” on health reform in stimulus bill
Makes health reform a top priority - wants action this year - sets aside $634 billion in budget - leaves details to Congress
Becomes an economic issue

CHART 13
Children’s Health Insurance Program Reauthorization Act of 2009
• Provides $33 billion in federal funds for children’s coverage over next 4.5 years; financed by a $.62 increase in federal tobacco tax
• Expected to reach an additional 4.1 million uninsured children
• Makes some eligibility changes- States set eligibility levels / Medicaid match for kids >300% FPL ($54,930 for a family of 3)- New option to cover legal immigrant children and pregnant women in the US for less than five years- Phases out coverage for most adults
• Provides new tools and fiscal incentives to enroll uninsured kids
SOURCE: Children’s Health Insurance Program Reauthorization Act of 2009 (CHIPRA), KCMU Fact Sheet, February 2009.

CHART 14
American Recovery and Reinvestment Act of 2009 Medicaid and COBRA Provisions
• Temporary Increase in Medicaid FMAP ($87 billion)– Relief for 10/1/08 – 12/31/2010– 3 components:
• Hold harmless (no state would see a drop in FMAP)• Base increase of 6.2%• Additional assistance based on unemployment
– States cannot have more restrictive eligibility levels or standards than 7/1/2008
• Other Medicaid Provisions ($3.2 billion)– Temporary increase in DSH allotments - 2.5% in 2009-2010– Extension of moratoria on Medicaid regulations – Extension of TMA and QI1 programs
• Premium Subsidies for COBRA ($25 billion)– 65% subsidy for COBRA premiums for 9 months for workers
involuntarily terminated between 9/1/2008 and 12/31/2009

CHART 15
Health Infrastructure & Investment Provisions
• Health Information Technology ($19.2 billion)
• National Institutes of Health ($10 billion)
• Comparative Effectiveness ($1.1 billion)
• Investment in Health Centers ($2 billion)
• Development of Primary Care Workforce ($500 million)
• Indian Health Service ($500 million)

CHART 16
Looking Ahead
• Although the economic recovery package provides significant funds for state fiscal relief, states will still face budget gaps
• The enhanced FMAP and the COBRA subsidies are designed
to help support coverage during the economic downturn, but many will not be eligible for these programs leaving significant coverage gaps for recently unemployed workers
• This is not health reform: The stimulus funds were intended to provide temporary assistance to help boost the economy and to put investments in place for broader health reform and coverage expansions

CHART 17
The Critical Path to Health Reform
Democrats promote issue in Primaries
Stage 1: THE ELECTION
Big enough debate in General to keep momentum alive
Stage 2:THE PRESIDENT
Registers in exit polls
• CHIPRA passes• $149 billion “down payment” on health reform in stimulus bill
Makes health reform a top priority - wants action this year - sets aside $634 billion in budget - leaves details to Congress
Becomes an economic issue
Stage 3:THE CONGRESS
Major Health Reform Legislation Passes this Summer or Fall
SCENARIO CPartisan gridlock
continues, no way to pay
Opportunity Lost Again
SCENARIO AConsensus bill emerges in
Senate in June, with bipartisan support. House bill in August. Administration get on board.
SCENARIO BReconciliation process: “slam
dunk” by Democrats
SCENARIO DCongress/President
fall back to an incremental step
All political scientists say
“I told you so”


CHART 19
I’m going to read you a list of things that some people worry about and others do not. How worried are you about each of the following things – are you very worried, somewhat worried, not too worried, or not at all worried?
Having to pay more for your health care or health insurance
Your income not keeping up with rising prices
Not being able to pay your rent or mortgage
Losing your job**
Losing your savings in the stock market
Being the victim of a terrorist attack
Losing your health insurance coverage*
Being the victim of a violent crime
Percent saying “very worried”
Influence of Health Benefits on Life Decisions
* Based on those with health insurance coverage only.** Based on employed only.
Source: Kaiser Family Foundation Health Tracking Poll: Election 2008 (conducted Oct. 8-13, 2008)
19%
25%
27%
29%
32%
38%
47%
18%

CHART 20
16%
18%
18%
19%
28%
29%
44%
61%
As a result of recent changes in the economy, have you and your family experienced any of the following problems, or not? Was this a serious problem, or not?
Problems Experienced as a Result of Changes in the Economy
Percent saying each was a “serious problem”
Problems paying for gas
Problems getting a good-paying job or a raise in pay
Problems paying yourrent or mortgage
Problems paying for health care and health insurance
Problems paying for food
Problems with credit card debt or other personal debt
Losing money in the stock market
Report any of the above was a “serious” problem
Source: Survey Brief: Economic Problems Facing Families, Kaiser Family Foundation, April 2008.

CHART 21
0
7%
15%
21%
23%
27%
34%
35%
53%
Consequences of Health Care Costs
Source: Kaiser Health Tracking Poll (conducted Feb. 3-12, 2009)
In the past 12 months, have you or another family member living in your household done each of the following because of the cost, or not?
Skipped a recommended medical test or treatment
Not filled a prescription for a medicine
Cut pills in half or skipped doses of medicine
Had problems getting mental health care
Put off or postponed getting health care you needed
Skipped dental care or checkups
Did any of the above
Relied on home remedies or over the counter drugs instead of going to see a doctor

CHART 22
When thinking about rising health care costs, which ONE of the following concerns you most? (among registered voters)
Specific Health Care Cost Concerns
13%
14%
16%
44%
3%
5%
Increases in what the national as a whole spends on health care
All of these (vol.)
Increases in the amount people pay for their health insurance premiums
and other out-of-pocket costs
Increases in spending on gov’t health programs like Medicare/Medicaid
Increases in insurance premiums employers pay to cover workers
None of these (vol.)
Note: “Don’t know/Refused” responses not shown.Source: Kaiser Health Tracking Poll: Election 2008 (conducted Oct 8-13, 2008)

CHART 23
Health Care Reform in Economic Hard Times
4%
34%
62%
Which comes closer to describing your own views? Given the serious economic problems facing the country…
We cannot afford to take on health care
reform right now
It is more important than ever to take on health care reform
now
Don't know/Refused
Source: Kaiser Health Tracking Poll (conducted Feb. 3-12, 2009)

CHART 24
CBO says growth in Medicare spending mainly due to growth in health care costs, not aging of population
0%
5%
10%
15%
20%
25%
30%
2007 2017 2027 2037 2047 2057 2067 2077
Medicare outlays net of beneficiary premiums as share of Gross Domestic Product (GDP):
SOURCE: Congressional Budget Office, The Long-Term Outlook for Health Care Spending, November 2007.
Historical trends in
health care cost growth
Aging populationCurrent Medicare spending

CHART 25
Health Care’s Growing Share of the Federal Budget
0%
10%
20%
30%
40%
50%
60%
Projection of Medicare and Medicaid as a share federal spending (excluding interest on the debt)
under the status quo
57%
Source: Kaiser Family Foundation calculations based on CBO projections
23%

CHART 26
Decrease in State Revenues
SOURCE: John Holahan and Bowen Garrett, Rising Unemployment, Medicaid, and the Uninsured, prepared for the Kaiser Commission on Medicaid and the Uninsured, January 2009.
1%
Increase in National
Unemployment Rate
=
1.0 1.1
Increase in Medicaid and
CHIP Enrollment
(million)
Increase in Uninsured(million)
&
Impact of a 1% Point Increase in Unemployment on State Revenues, Medicaid, CHIP & Uninsured
3- 4%


CHART 28
Senators Baucus (D-Mont.) & Grassley (R-Iowa) at Kaiser Newsmaker Breakfast


CHART 30
Subsidies for Low and Middle Income
($110 B)
Medicaid expansion to everyone under poverty
($50 B)
Small business tax credit ($5 B)
Rough Cost of a “Shared Responsibility” Universal Coverage Plan
Full Year Cost in 2009 Dollars
10 year cost (assuming 7 years of operation) =about $1.7 trillion
Source: Kaiser Family Foundation analysis based on modeling for the Foundation by Jonathan Gruber and other sources.
Total: $165 Billion

CHART 31
A Menu of Guesstimates for Financing a $1.7 Trillion Plan Over 10 Years
Major Reform Decision PointsEmployer pay or play (<10 exempt, 6% of payroll) $200 BPublic plan that lowers subsidy costs by 20% $212 BComparative effectiveness research (CBO option) -$1 BRequire use of health IT (CBO option) $34 BCap the tax exemption (75th percentile, grows at CPI) (CBO option) $452 BEliminate the tax exemption $2.5 T*
Medicare/Medicaid SavingsMedicare/Medicaid savings from Obama reserve fund $316 BRaise Medicare eligibility to 67 (CBO option) $86 BReduce Medicare payment rates in high cost areas (CBO option) $51 BReduce hospital inpatient update by 1% (CBO option) $93 BMedical home for Medicare beneficiaries with chronic conditions (CBO Option) -$6 B
New RevenuesIncrease Medicare payroll tax by 1 percentage point (CBO option) $592 B3 cent excise tax on sugar sweetened drinks (CBO option) $50 BAdditional $1/pack tax on cigarettes (CBO option) $95 BIncrease taxes on alcohol (CBO option) $60 B
Notes: Rough projections based on Kaiser Family Foundation analysis and CBO estimates. CBO estimates are generally over 10 years. In some cases, there are interaction effects among policies.

CHART 32
Additional Tax Per Tax Return With a Tax Liability
$1,238
$2,476
Single Family
Understanding the Magnitude of the Cost of a Comprehensive Plan
Source: Kaiser Family Foundation analysis based IRS figures for tax returns in 2006.
What if a $165 billion per year health reform plan were funded with a flat across-the-board income tax increase?

CHART 33
How They Might Get There
• Reduce the price tag (without sacrificing the benefit package too much)
• Share the responsibility– Employers– Consumers
• Savings– Cut increases in future Medicare payments to hospitals and doctors (sorry)– A public plan?– Delivery reforms
• Revenues– Taxing unhealthy behaviors– Cap the tax preference for employer-based insurance– Increase taxes on upper income people
• Phasing In
• Triggers


CHART 35
55%
0%
10%
20%
30%
40%
50%
60%
Jul90
Jan91
Jul91
Jan92
Jul92
Jan93
Jul93
Jan94
Jul94
Jan95
Jul95
Jan96
Jul96
Jan97
Jul97
Jan98
Jul98
Jan99
Jul99
Jan00
Jul00
Jan01
Jul01
Jan02
Jul02
Jan03
Jul03
Jan04
Jul04
Jan05
Jul05
Jan06
Jul06
Jan07
Jul07
Jan08
Jul08
Jan09
Source: NBC/Wall Street Journal; Harris Polls
Percent naming health care one of two most important issues for government to address
Note: "Don't know" responses were included in the base when percentages were calculated.
Top Down, Not Bottom Up
Clinton Health Care Reform Debate
January 2009 16%

CHART 36
“The nation’s doctors believe the practice of medicine will change substantially in the coming decade but fear that only a few of the changes will be for the better, according to a study released today by the Henry J. Kaiser Family Foundation.”
“Among all the predicted changes, the ones that draw the greatest opposition from physicians have to do with loss of autonomy.”
“In all, the study noted, ‘the most frequent type of change noted by physicians involves various forms of external regulation with emphasis upon government controls and interference.’”
1982survey of physician attitudes as they relate to the future practice of medicine. Conducted by Louis Harris and the Henry J. Kaiser Family Foundation.

CHART 37
KEITH BLESSINGTONRON GASTON