Embed Size (px)
Citation preview
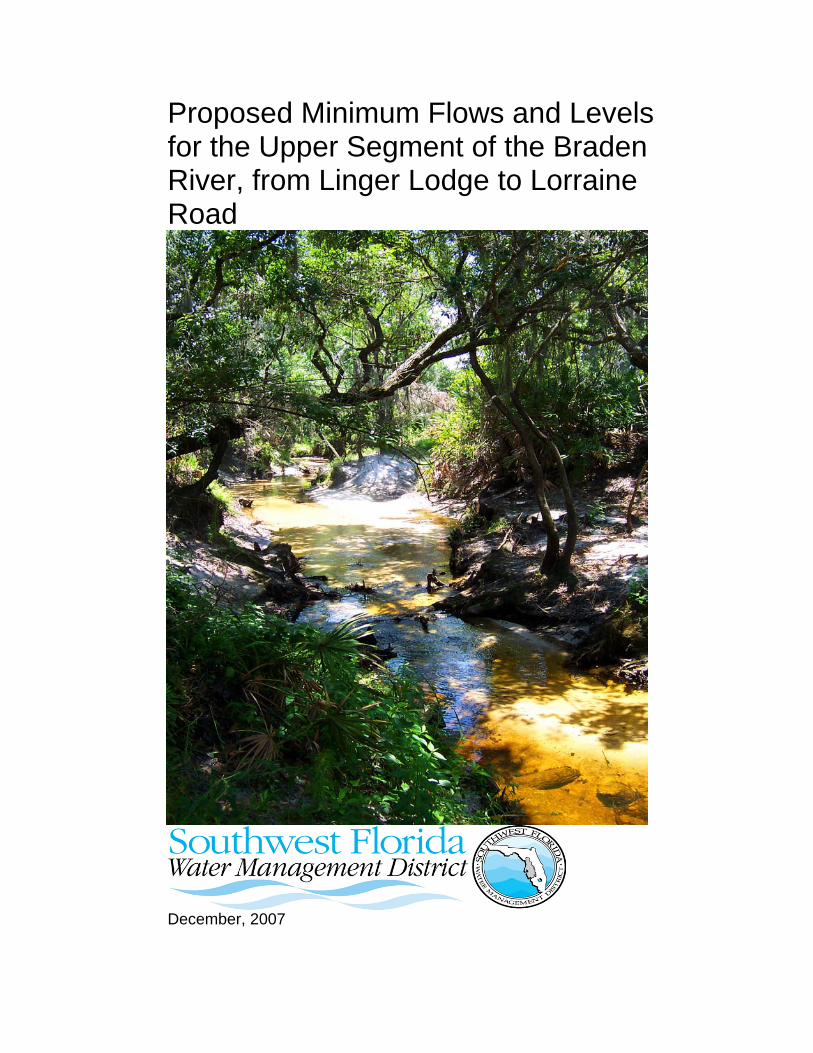
Proposed Minimum Flows and Levels for the Upper Segment of the Braden River, from Linger Lodge to Lorraine Road
December, 2007

ii
Proposed Minimum Flows and Levels for the Upper Segment of the Braden River, from Linger Lodge to Lorraine Road December, 2007 Ecologic Evaluation Section Resource Conservation and Development Department Southwest Florida Water Management District Brooksville, Florida 34604-6899 Marty Kelly Adam B. Munson Jonathan Morales Douglas A. Leeper The Southwest Florida Water Management District (District) does not discriminate upon the basis of any individual’s disability status. This non-discriminatory policy involves every aspect of the District’s functions, including one’s access to, participation, employment, or treatment in its programs or activities. Anyone requiring accommodation as provided for in the American with Disabilities Act should contact (352) 796-7211 or 1-800-423-1476, extension 4215; TDD ONLY 1-800-231-6103; FAX (352) 754-6749.
i
Table of Contents TABLE OF CONTENTS.................................................................................................................................I
TABLE OF FIGURES.................................................................................................................................. IV
LIST OF TABLES...................................................................................................................................... VIII
EXECUTIVE SUMMARY.............................................................................................................................. X
ACKNOWLEDGEMENTS ......................................................................................................................... XIII
CHAPTER 1 MINIMUM FLOWS AND LEVELS....................................................................................... 1-1 1.1 OVERVIEW AND LEGISLATIVE DIRECTION.......................................................1-1 1.2 HISTORICAL PERSPECTIVE...........................................................................1-2 1.3 THE FLOW REGIME .....................................................................................1-3 1.4 ECOSYSTEM INTEGRITY AND SIGNIFICANT HARM ...........................................1-4 1.5 SUMMARY OF THE SWFWMD APPROACH FOR DEVELOPING MINIMUM FLOWS.1-5
1.5.1 A Building Block Approach.................................................................1-6 1.6 FLOWS AND LEVELS ....................................................................................1-8 1.7 CONTENT OF REMAINING CHAPTERS ............................................................1-9
CHAPTER 2 BASIN DESCRIPTION WITH EMPHASIS ON LAND USE, HYDROLOGY AND WATER QUALITY..................................................................................................................................... 2-1
2.1 OVERVIEW..................................................................................................2-1 2.2 WATERSHED DESCRIPTION (MATERIAL IN THIS SECTION WAS TAKEN LARGELY FROM DELCHARCO AND LEWELLING, 1997). .......................................................2-1
2.2.1 Geographic Location..........................................................................2-1 2.2.2 Climate...............................................................................................2-2
2.3 LAND USE CHANGES IN THE BRADEN RIVER WATERSHED ..............................2-3 2.3.1 Braden River Watershed....................................................................2-3 2.3.2 Upper Braden River Sub-Basin..........................................................2-7 2.3.3 Lower Braden River Sub-Basin........................................................2-10
2.4 HYDROLOGY.............................................................................................2-13 2.4.1 Overview..........................................................................................2-13 2.4.2 Florida River Flow Patterns and the AMO........................................2-13 2.4.3 Braden River Flow Trends ...............................................................2-17 2.4.4 Benchmark Periods .........................................................................2-22 2.4.5 Seasonal Flow Patterns and the Building Block Approach ..............2-23
WATER CHEMISTRY ........................................................................................2-26 2.4.6 Water Quality Data ..........................................................................2-26 2.4.7 Phosphorus......................................................................................2-26 2.4.8 Nitrogen ...........................................................................................2-27 2.4.9 Potassium........................................................................................2-27
CHAPTER 3 GOALS, ECOLOGICAL RESOURCES OF CONCERN AND KEY HABITAT INDICATORS ............................................................................................................................................ 3-1
3.1 GOAL – PREVENTING SIGNIFICANT HARM......................................................3-1 3.2 RESOURCES AND AREA OF CONCERN...........................................................3-2
ii
3.3 RESOURCE MANAGEMENT GOALS AND KEY HABITAT INDICATORS...................3-2 3.3.1 Fish Passage and Recreational Use..................................................3-3 3.3.2 Wetted Perimeter Inflection Point ......................................................3-3 3.3.3 In-Channel Habitats for Fish and Macroinvertebrates........................3-4 3.3.4 Woody Habitats .................................................................................3-5 3.3.5 Hydrologic Connections Between the River Channel and Floodplain 3-6
CHAPTER 4 TECHNICAL APPROACH FOR ESTABLISHING MINIMUM FLOWS AND LEVELS FOR THE UPPER BRADEN RIVER......................................................................................................... 4-1
4.1 OVERVIEW..................................................................................................4-1 4.2 TRANSECT LOCATIONS AND FIELD SAMPLING OF INSTREAM AND FLOODPLAIN HABITATS.........................................................................................................4-1
4.2.1 HEC-RAS Cross-Sections .................................................................4-2 4.2.2 PHABSIM Cross-Sections .................................................................4-3 4.2.3 Instream Habitat Cross-Sections .......................................................4-3 4.2.4 Floodplain Vegetation/Soils Cross Sections ......................................4-4
4.3 MODELING APPROACHES.............................................................................4-7 4.3.1 HEC-RAS Modeling ...........................................................................4-7 4.3.2 Physical Habitat Simulation (PHABSIM) Modeling ..........................4-10 4.3.3 Long-term Inundation Analyses .......................................................4-14
4.4 SEASONAL FLOW AND DEVELOPMENT OF BLOCKS 1, 2, AND 3 ......................4-16 4.5 LOW-FLOW THRESHOLD ............................................................................4-17
4.5.1 Wetted Perimeter.............................................................................4-17 4.5.2 Fish Passage ...................................................................................4-18
4.6 PRESCRIBED FLOW REDUCTION FOR BLOCK 1.............................................4-19 4.6.1 PHABSIM – Application for Block 1 .................................................4-19
4.7 PRESCRIBED FLOW REDUCTION FOR BLOCK 2.............................................4-19 4.7.1 PHABSIM – Application for Block 2 .................................................4-20 4.7.2 Snag and Exposed Root Habitat Analyses ......................................4-20
4.8 PRESCRIBED FLOW REDUCTION FOR BLOCK 3.............................................4-21 4.8.1 Floodplain Connection Analyses – Application for Block 3 ..............4-21
CHAPTER 5 RESULTS AND RECOMMENDED MINIMUM FLOWS...................................................... 5-1 5.1 OVERVIEW..................................................................................................5-1 5.2 LOW-FLOW THRESHOLD ..............................................................................5-1
5.2.1 Fish Passage Criteria.........................................................................5-1 5.2.2 Wetted Perimeter Criteria ..................................................................5-2 5.2.3 Low-Flow Threshold ..........................................................................5-3
5.3 PRESCRIBED FLOW REDUCTION FOR BLOCK 1...............................................5-4 5.3.1 PHABSIM Results for Block 1............................................................5-4 5.3.2 Short-Term Compliance Standards for Block 1..................................5-6
5.4 PRESCRIBED FLOW REDUCTIONS FOR BLOCK 3.............................................5-6 5.4.1 Inundation of Floodplain Features .....................................................5-6 5.4.2 Inundation of Floodplain Vegetation Classes and Soils .....................5-9 5.4.3 Percent-of-Flow Reductions for Floodplain Features, Vegetation Classes and Soils .....................................................................................5-15 5.4.4 Short-Term Compliance Standards for Block 3................................5-17
iii
5.5 PRESCRIBED FLOW REDUCTION FOR BLOCK 2.............................................5-18 5.5.1 PHABSIM Results for Block 2..........................................................5-18 5.5.2 Instream Habitats.............................................................................5-20 5.5.3 Flow Relationships with Woody Instream Habitats ..........................5-22 5.5.4 Selection of the Prescribed Flow Reductions for Block 2.................5-24 5.5.5 Short-Term Compliance Standards for Block 2................................5-24
5.6 COMPLIANCE STANDARDS AND PROPOSED MINIMUM FLOWS FOR THE BRADEN RIVER NEAR LORRAINE....................................................................................5-25
CHAPTER 6 LITERATURE CITED........................................................................................................... 6-1
CHAPTER 7 GLOSSARY OF TERMS ..................................................................................................... 7-1
CHAPTER 8 APPENDIX A ....................................................................................................................... 8-1
CHAPTER 9 APPENDIX B – STAFF RESPONSE TO THE PEER REVIEW REPORT.......................... 9-1
iv
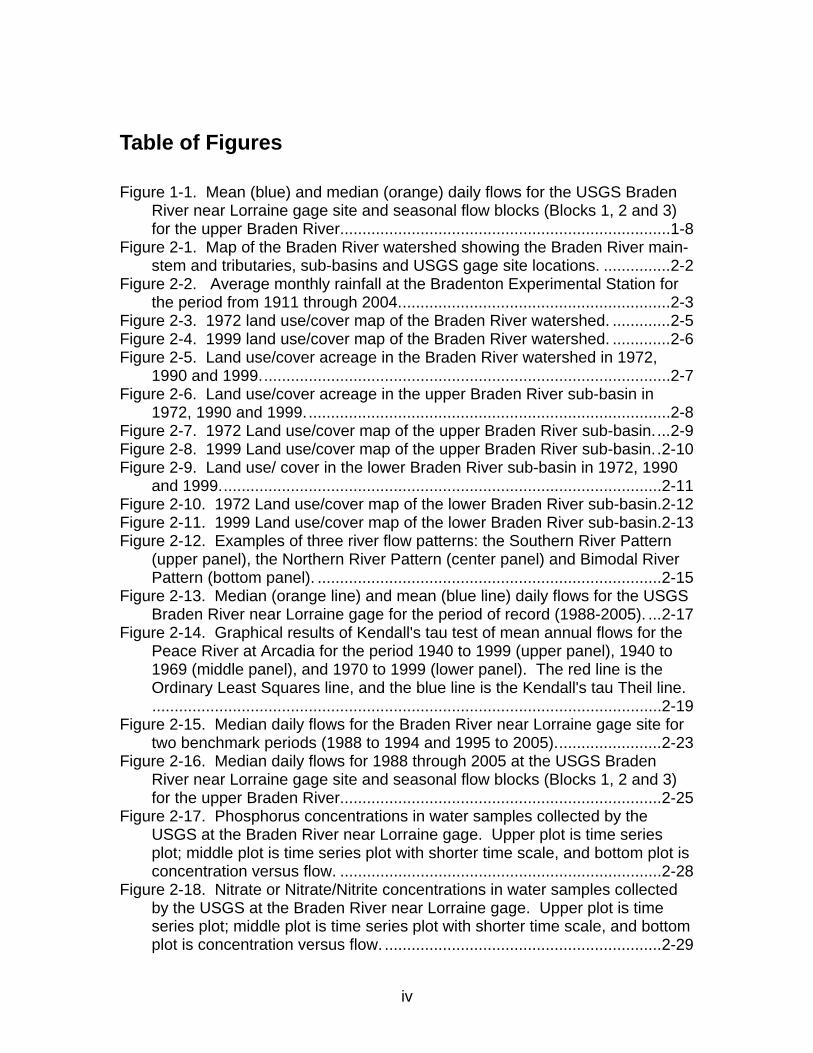
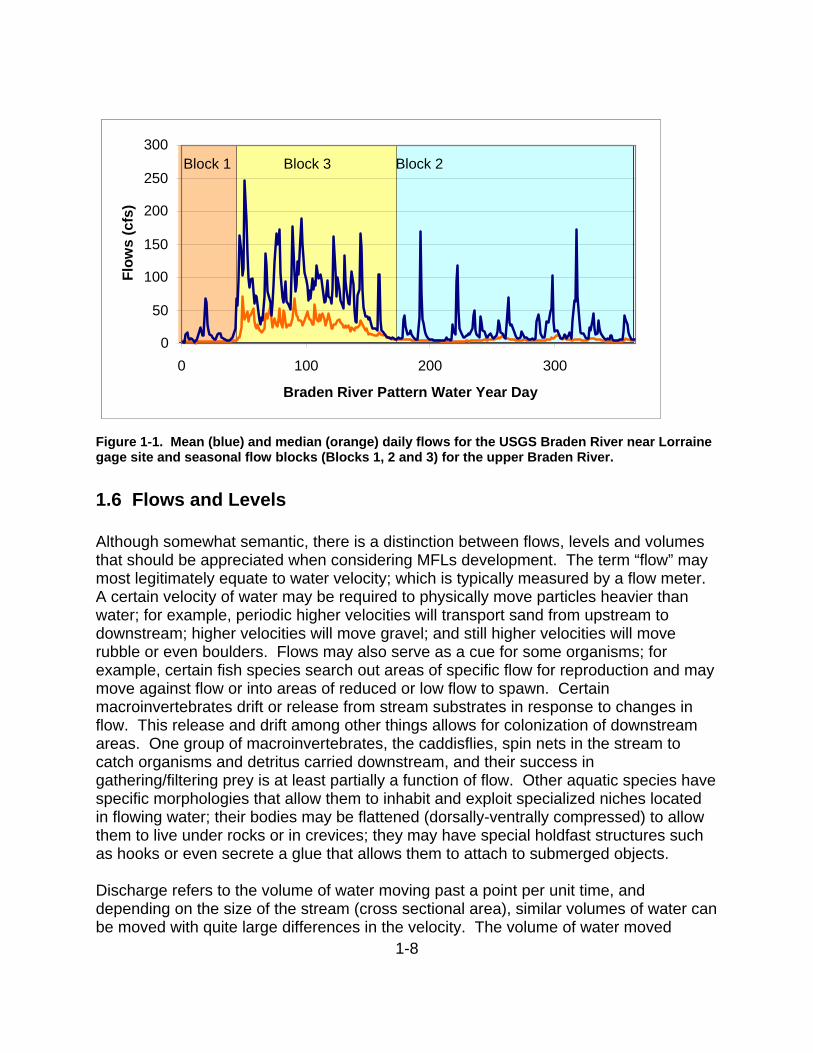
Table of Figures Figure 1-1. Mean (blue) and median (orange) daily flows for the USGS Braden
River near Lorraine gage site and seasonal flow blocks (Blocks 1, 2 and 3) for the upper Braden River..........................................................................1-8
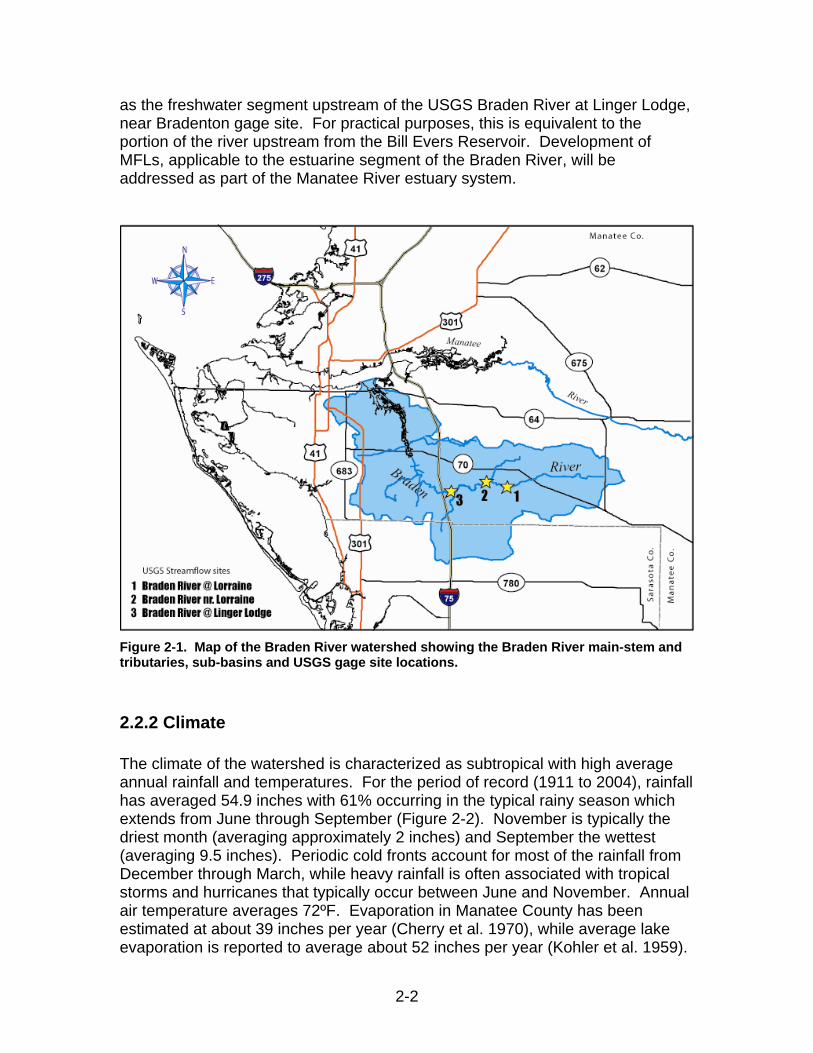
Figure 2-1. Map of the Braden River watershed showing the Braden River main-stem and tributaries, sub-basins and USGS gage site locations. ...............2-2
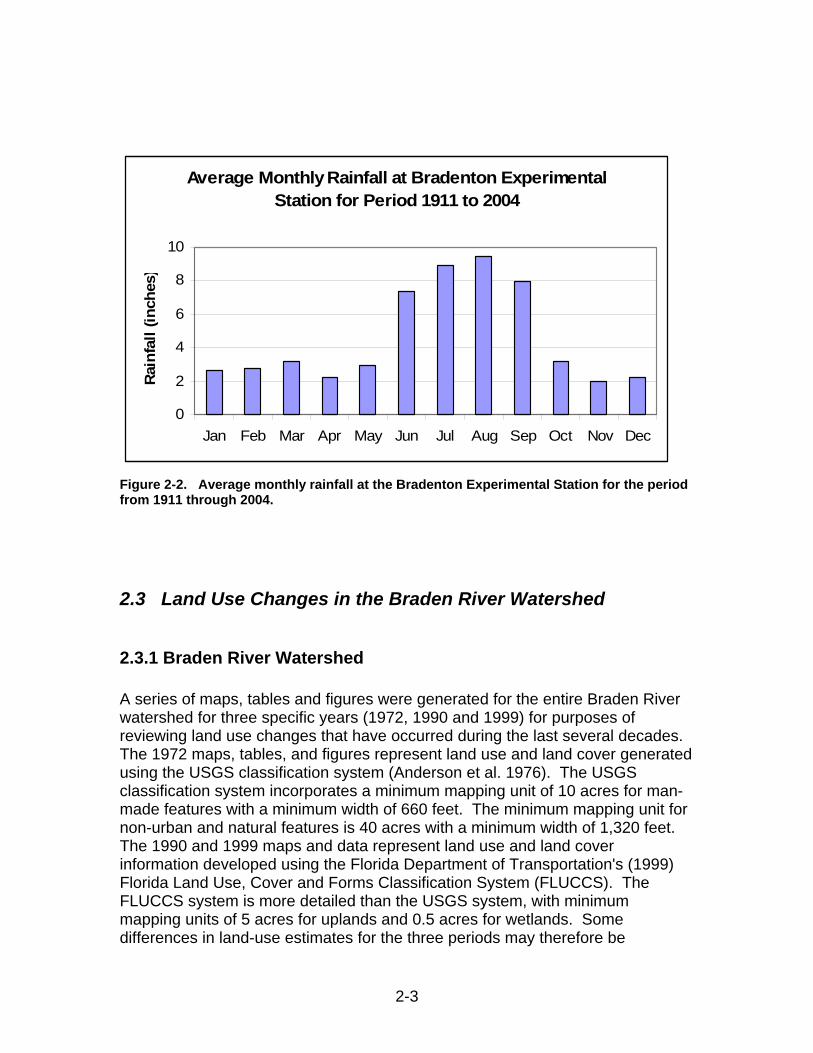
Figure 2-2. Average monthly rainfall at the Bradenton Experimental Station for the period from 1911 through 2004.............................................................2-3
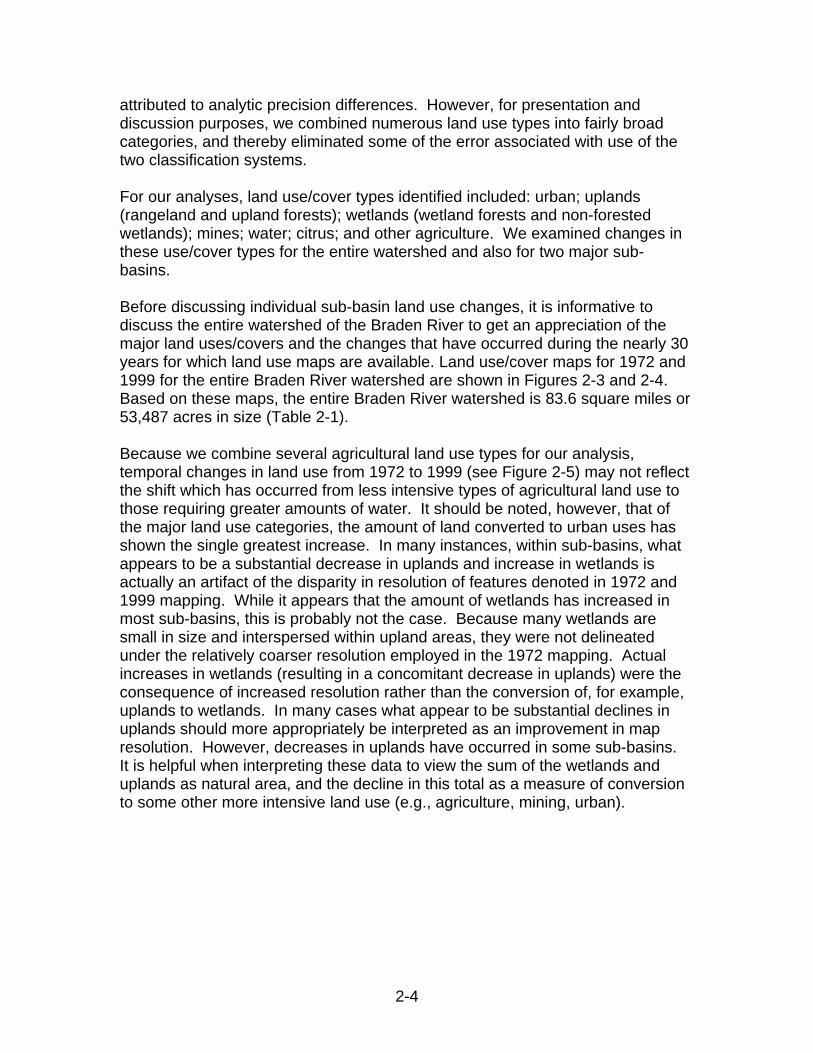
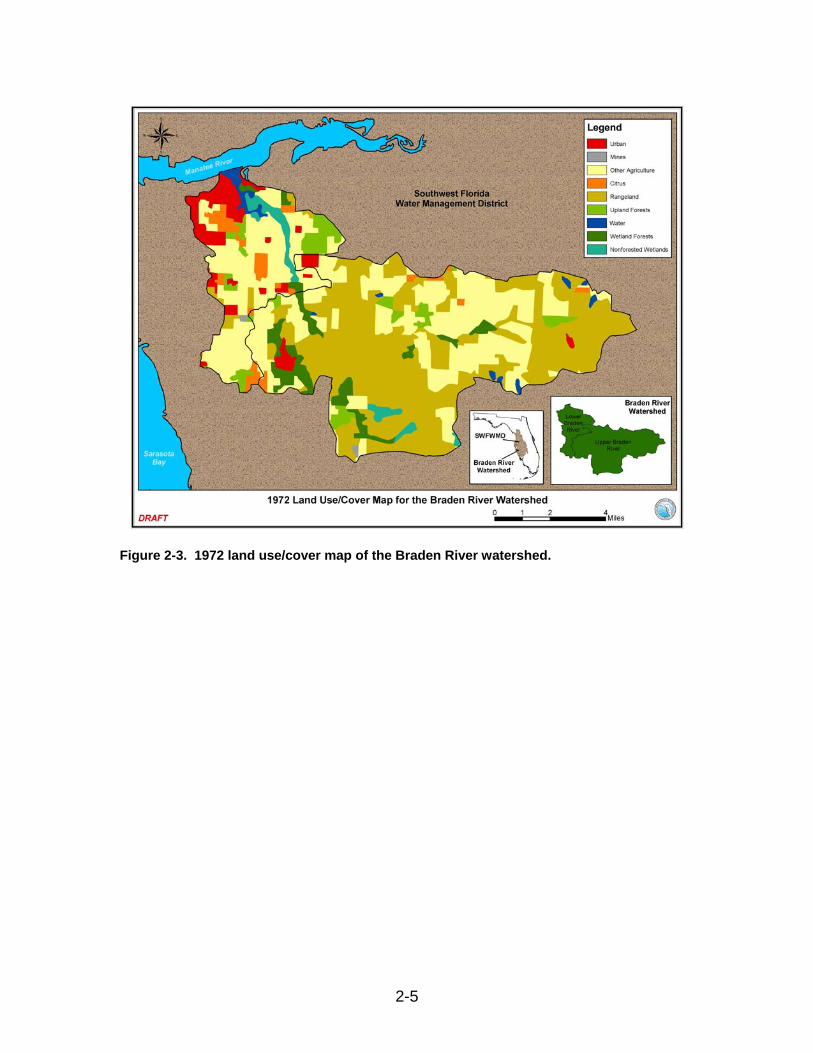
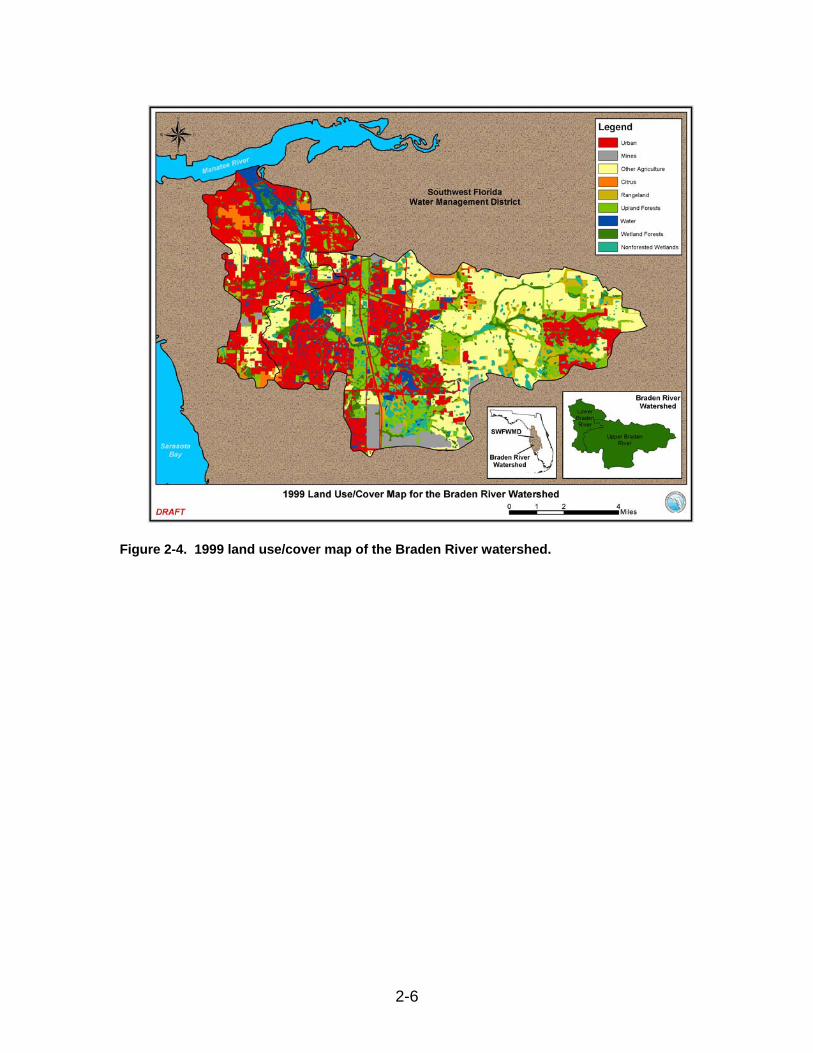
Figure 2-3. 1972 land use/cover map of the Braden River watershed. .............2-5 Figure 2-4. 1999 land use/cover map of the Braden River watershed. .............2-6 Figure 2-5. Land use/cover acreage in the Braden River watershed in 1972,
1990 and 1999............................................................................................2-7 Figure 2-6. Land use/cover acreage in the upper Braden River sub-basin in
1972, 1990 and 1999..................................................................................2-8 Figure 2-7. 1972 Land use/cover map of the upper Braden River sub-basin....2-9 Figure 2-8. 1999 Land use/cover map of the upper Braden River sub-basin..2-10 Figure 2-9. Land use/ cover in the lower Braden River sub-basin in 1972, 1990
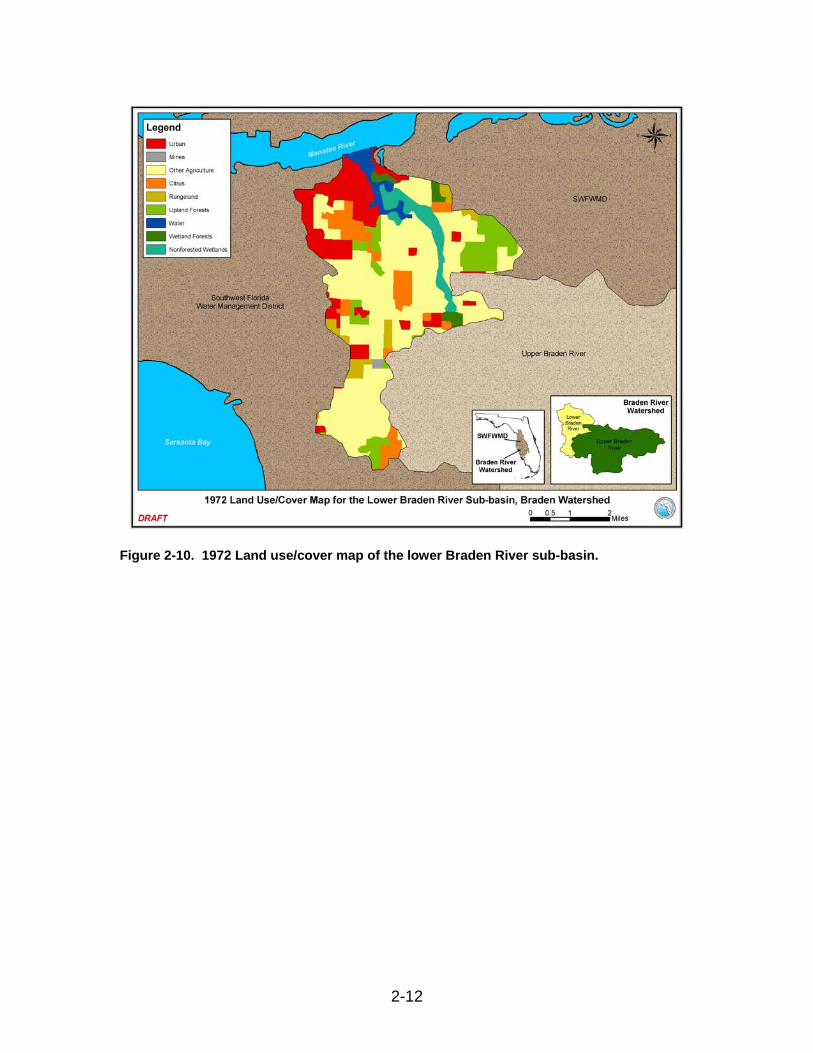
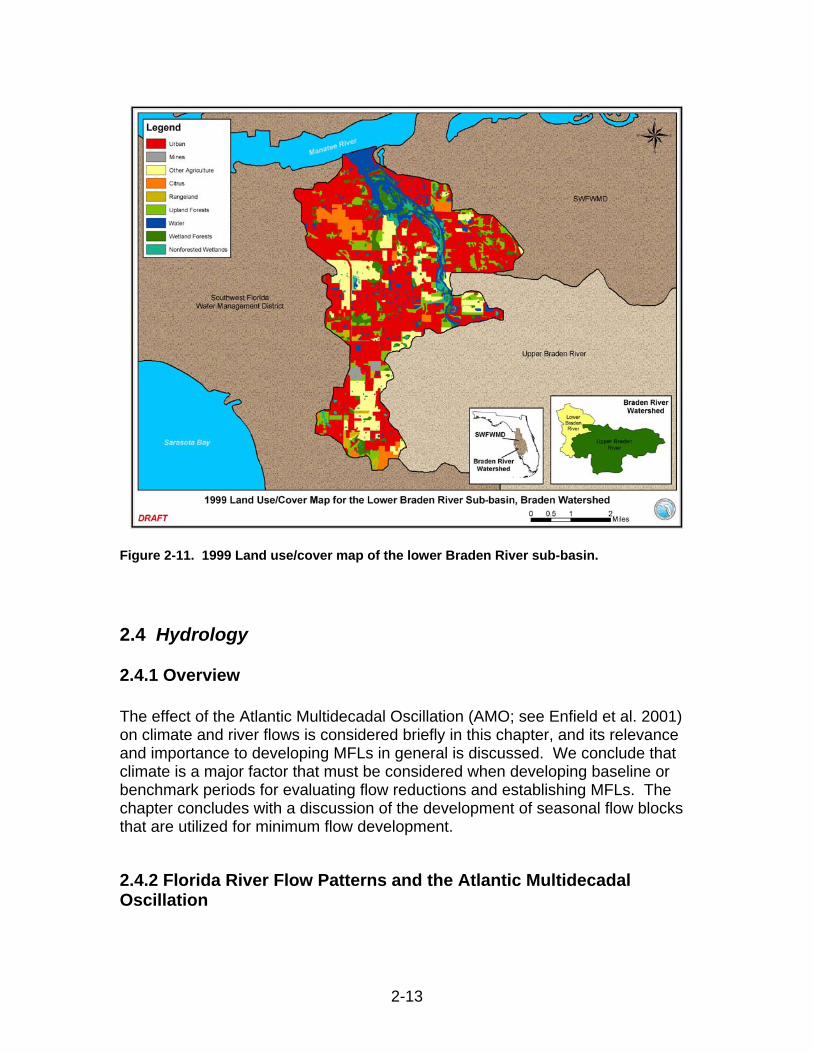
and 1999...................................................................................................2-11 Figure 2-10. 1972 Land use/cover map of the lower Braden River sub-basin.2-12 Figure 2-11. 1999 Land use/cover map of the lower Braden River sub-basin.2-13 Figure 2-12. Examples of three river flow patterns: the Southern River Pattern
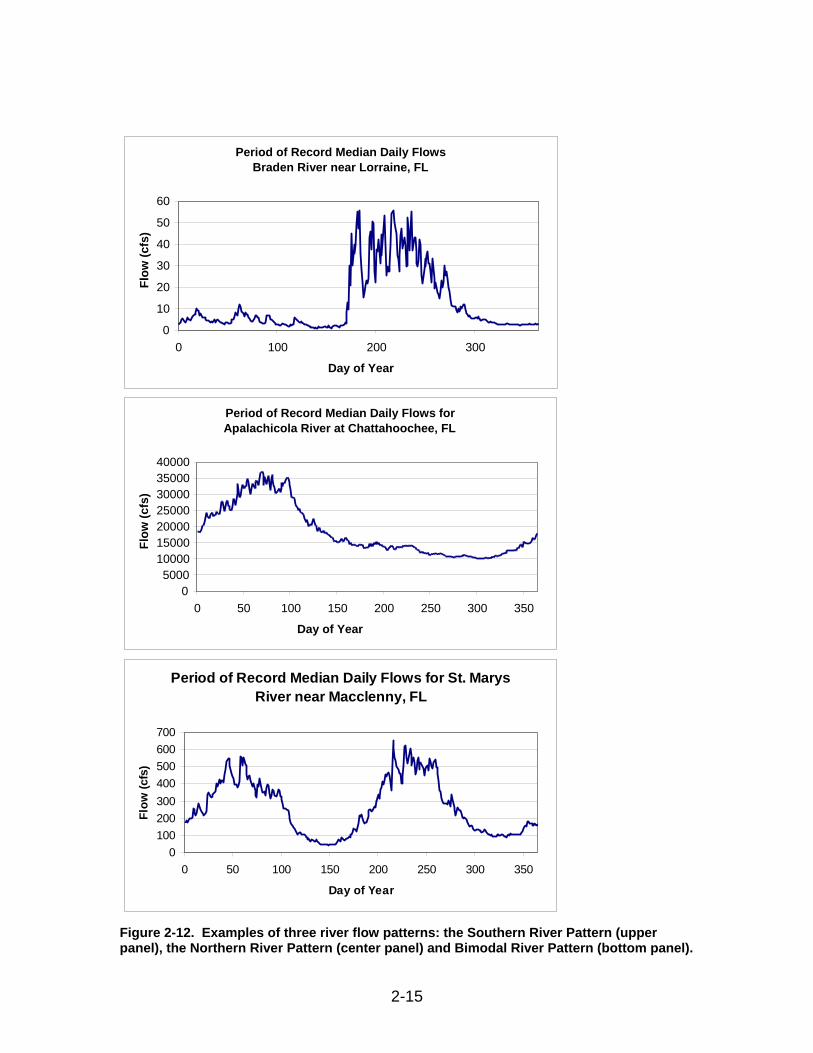
(upper panel), the Northern River Pattern (center panel) and Bimodal River Pattern (bottom panel). .............................................................................2-15
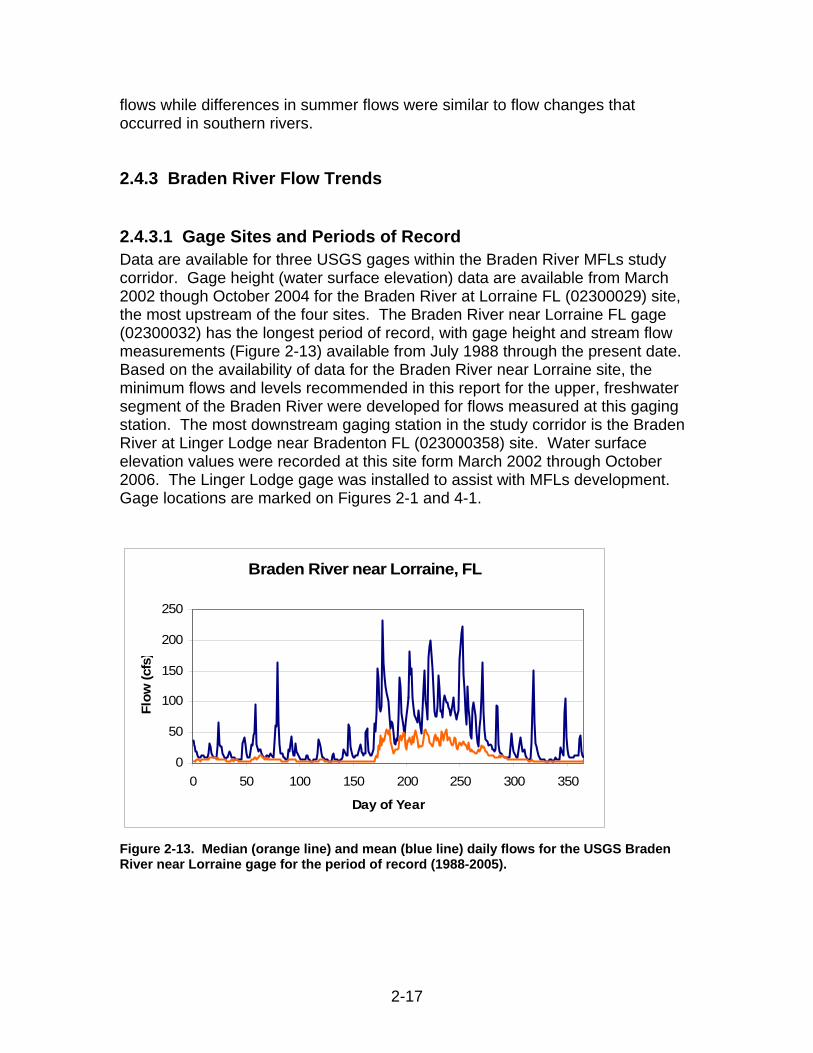
Figure 2-13. Median (orange line) and mean (blue line) daily flows for the USGS Braden River near Lorraine gage for the period of record (1988-2005). ...2-17
Figure 2-14. Graphical results of Kendall's tau test of mean annual flows for the Peace River at Arcadia for the period 1940 to 1999 (upper panel), 1940 to 1969 (middle panel), and 1970 to 1999 (lower panel). The red line is the Ordinary Least Squares line, and the blue line is the Kendall's tau Theil line...................................................................................................................2-19
Figure 2-15. Median daily flows for the Braden River near Lorraine gage site for two benchmark periods (1988 to 1994 and 1995 to 2005)........................2-23
Figure 2-16. Median daily flows for 1988 through 2005 at the USGS Braden River near Lorraine gage site and seasonal flow blocks (Blocks 1, 2 and 3) for the upper Braden River........................................................................2-25
Figure 2-17. Phosphorus concentrations in water samples collected by the USGS at the Braden River near Lorraine gage. Upper plot is time series plot; middle plot is time series plot with shorter time scale, and bottom plot is concentration versus flow. ........................................................................2-28
Figure 2-18. Nitrate or Nitrate/Nitrite concentrations in water samples collected by the USGS at the Braden River near Lorraine gage. Upper plot is time series plot; middle plot is time series plot with shorter time scale, and bottom plot is concentration versus flow. ..............................................................2-29
v
Figure 2-19. Potassium concentrations in water samples collected by the USGS at the Peace River at Arcadia gage. Upper plot is time series plot; middle plot is concentration versus flow; and the bottom plot is time series plot of residuals of phosphorus concentration regressed against flow.................2-30
Figure 2-20. Potassium concentrations in water samples collected by the USGS at the Braden River near Lorraine gage. Upper plot is time series plot; middle plot is time series plot with shorter time scale, and bottom plot is concentration versus flow. ........................................................................2-31
Figure 3-1. Example of low flow in a riffle or shoal area. Many potential in-stream habitats such as limerock (foreground), snags, sandbars, and exposed roots are not inundated under low flow conditions. ......................3-8
Figure 4-1. Braden River watershed and location of USGS streamflow gaging stations. The USGS Braden River at Linger Lodge near Bradenton FL gage represented the most downstream extent of the MFLs study area. ............4-2
Figure 4-2. Upstream vegetation cross-section locations and NWI classes on the Braden River (reprinted from PBS&J 2006). Transect 7 served as the most upstream or upper PHABSIM study site. ....................................................4-6
Figure 4-3. Downstream vegetation cross-section locations and NWI classes on the Braden River (reprinted from PBS&J 2006). The downstream or lower PHABSIM study site is located near Transect 11. ......................................4-7
Figure 4-4. Weighted usable area (WUA) versus discharge for three life history stages (fry, juvenile, adult) and spawning activity of spotted sunfish at the upstream PHABSIM site in the Braden River............................................4-11
Figure 4-5. Example plot of habitat gain/loss relative to flow reductions of 10, 20, 30, and 40%. Habitat loss is shown for spotted sunfish adults at the upstream Braden River site based on historic flow records from 1989 to 1993..........................................................................................................4-12
Figure 4-6. Percent-of-flow reductions that result in a 15% reduction in the number of days that flows on the Alafia, middle Peace, and Myakka rivers are reached. Horizontal lines represent the flow reduction standards identified by the District for specific flow ranges in each river. Graphs are adapted from Kelly et al. 2005a, b, and c. ................................................4-15
Figure 4-7. Wetted perimeter versus discharge at HEC-RAS transect number 44.9 in the Braden River. Wetted perimeter values for modeled flows up to 25 cfs are shown and the lowest wetted perimeter inflection point for this cross-section is identified..........................................................................4-18
Figure 5-1. Plot of flow required at the Braden River near Lorraine gage to inundate the deepest part of the channel at twenty HEC-RAS cross-sections in the Braden River to a depth of 0.6 ft. Cross-sections associated with the USGS Braden River near Lorraine, Braden River at Linger Lodge near Bradenton, and Braden River at Lorraine gage sites are indicated. Note that the scale of the x-axis is not linear..............................................................5-2
Figure 5-2. Plot of local flow at the Braden River near Lorraine gage required to inundate the lowest wetted perimeter inflection point at twenty HEC-RAS cross-sections in the Braden River. Cross-sections associated with the USGS Braden River near Lorraine FL Braden River at Lorraine and Braden
vi
River at Linger Lodge near Bradenton gage sites are indicated. Note that the scale of the x-axis is not linear..............................................................5-3
Figure 5-3. Summary results for the "upper" Braden River PHABSIM site for May and June. Descriptive statistics (N, mean, minimum and maximum) for percent-of-flow reductions associated with a 15% reduction in available habitat for selected biota are shown, based on review of ten, twenty, thirty and forty percent reductions in flows measured at the Braden River near Lorraine gage for two time periods (1988 through 1994 and 1995 through 2005). .........................................................................................................5-5
Figure 5-4. Summary results for the "lower" Braden River PHABSIM site for May and June. Descriptive statistics (N, mean, minimum and maximum) for percent-of-flow reductions associated with a 15% reduction in available habitat for selected biota are shown, based on review of ten, twenty, thirty and forty percent reductions in flows measured at the Braden River near Lorraine gage for two time periods (1988 through 1994 and 1995 through 2005). .........................................................................................................5-5
Figure 5-5. Elevation (Feet above NGVD) profile for floodplain vegetation/soils cross-section (transect) 2. Distances (cumulative length) are shown centered on the middle of the river channel...............................................................5-7
Figure 5-6. Floodplain wetted perimeter versus elevation at floodplain vegetation/soils cross-section (Transect) 15. Vertical bars indicate mean elevations of two floodplain vegetation classes observed at the site. .........5-9
Figure 5-7. Median elevations of vegetation classes at floodplain vegetation/soils transects along the Braden River..............................................................5-13
Figure 5-8. Percent-of-flow reductions that result in a 15% reduction in the number of days flow are achieved, based on period of record (1988-2005) flow records from the USGS Braden River near Lorraine gage. ...............5-17
Figure 5-9. Summary results for the "upper" Braden River PHABSIM site for October through April. Descriptive statistics (N, mean, minimum and maximum) for percent-of-flow reductions associated with a 15% reduction in available habitat for selected biota are shown, based on review of ten, twenty, thirty and forty percent reductions in flows measured at the Braden River near Lorraine gage for two time periods (1988 through 1994 and 1995 through 2005). ..........................................................................................5-19
Figure 5-10. Summary results for the "lower" Braden River PHABSIM site for October through April. Descriptive statistics (N, mean, minimum and maximum) for percent-of-flow reductions associated with a 15% reduction in available habitat for selected biota are shown, based on review of ten, twenty, thirty and forty percent reductions in flows measured at the Braden River near Lorraine gage for two time periods (1988 through 1994 and 1995 through 2005). ..........................................................................................5-20
Figure 5-11. Percent dominance of instream habitats based on linear extent of the habitats along fourteen cross-sections in the Braden River. ...............5-21
Figure 5-12. Mean elevations of instream habitats at fourteen cross-section sites on the Braden River..................................................................................5-22
vii
Figure 5-13. Median daily flow at the USGS Braden River near Lorraine gage site plotted for each day of the Braden River Pattern Water Year with short-term compliance standards for Blocks 1, 2 and, 3. The orange line is the natural flow. The blue line represents the natural flow, reduced by the maximum allowable withdrawal, without violating the proposed MFLs. The two red lines are the Low-Flow Threshold and the High-Flow Step. .........5-25
viii
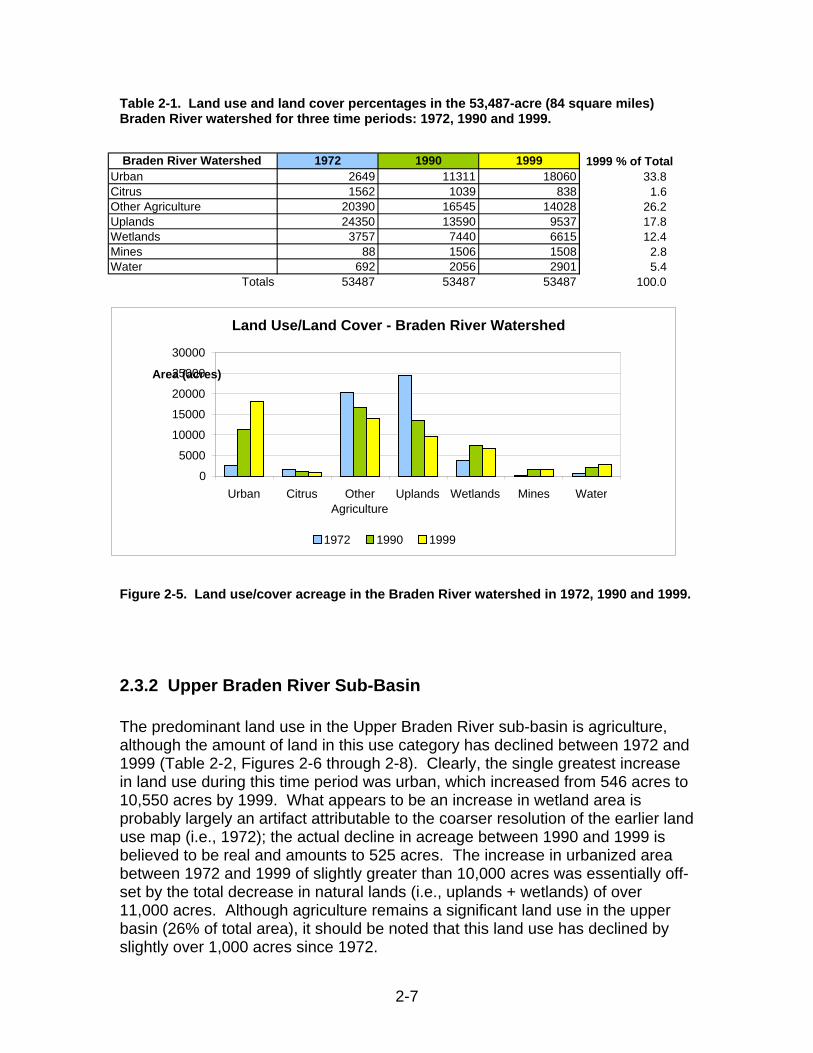
List of Tables Table 2-1. Land use and land cover percentages in the 53,487-acre (84 square
miles) Braden River watershed for three time periods: 1972, 1990 and 1999.....................................................................................................................2-7
Table 2-2. Land use/cover and land cover percentages in the upper Braden River sub-basin for three time periods: 1972, 1990 and 1999. ...................2-8
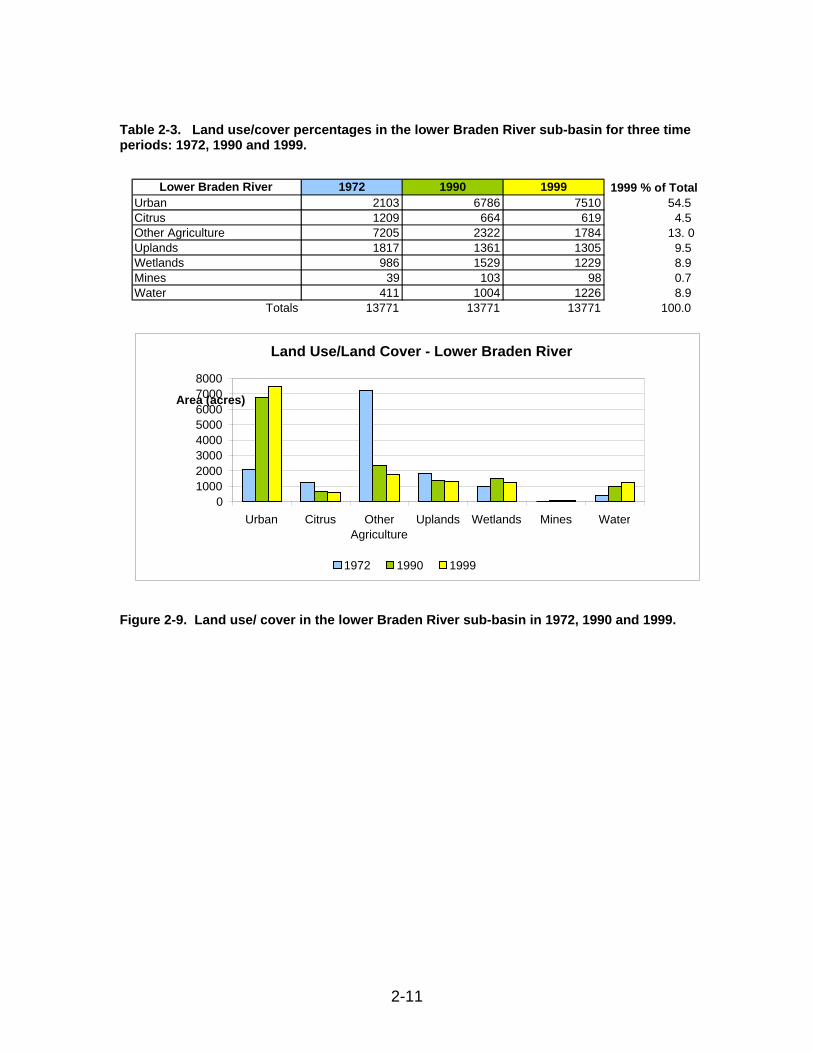
Table 2-3. Land use/cover percentages in the lower Braden River sub-basin for three time periods: 1972, 1990 and 1999. ................................................2-11
Table 2-4. Results of Kendall's tau test of mean annual (XAnnQ) and median annual (MedAnnQ) flows for selected Florida streamflow gage sites and selected time periods. P values < 0.1 are highlighted in bold; those associated with flow decreases are shaded yellow, those that indicate flow increases are shaded blue. Table is an excerpt from a table in Kelly (2004)...................................................................................................................2-20
Table 2-5. Results of Mann-Whitney tests for flow differences between mean annual flows at selected gage sites for two multidecadal time periods (1940 to 1969 and 1970 to 1999). P values of 0.1 or less are highlighted in bold; p values that indicate a flow decrease between periods are shaded yellow. Excerpt of table from Kelly (2004).............................................................2-21
Table 2-6. Beginning Julian days for seasonal periods of low and high-flow (Blocks 1 and 3) and ending date for the high flow period at five different gage stations in the SWFWMD. Mean values including and excluding the values for the Withlacoochee River are also listed. ..................................2-24
Table 2-7. Beginning and ending calendar dates for annual flow Blocks 1, 2, and 3 for the Braden River for non-leap years. Calendar dates apply for both non-leap years and leap years..................................................................2-25
Table 2-8. Summary statistics for Braden, Alafia, Peace, Myakka and Withlacoochee Rivers water quality data and comparative values reported for Florida streams (Friedemann and Hand 1989). ...................................2-32
Table 4-1. Beginning and ending calendar dates (and Julian days) for seasonal flow Blocks 1, 2, and 3 for the upper Braden River...................................4-16
Table 5-1. Recommended percent flow reductions based on PHABSIM analyses for two sites in the Braden River for the two month included in Block 1......5-4
Table 5-2. Elevations and lengths of floodplain vegetation/soils cross-sections (transects) along the Braden River. N is the number of elevation measurements made along each transect. Median relative elevations are the vertical distance between the channel bottom and median elevations. 5-8
Table 5-3. Mean (±SD) flows at the Braden River near Lorraine gage required for inundation of median elevation of wetland (muck and hydric) soils, vegetation classes and selected geomorphological features at 15 floodplain vegetation/soils transects. Percent-of-flow reductions associated with up to a 15% reduction in the number of days of flow sufficient to inundate the
ix
mean feature elevations are listed for two benchmark periods, 1988 through 1994 and 1995 through 2005....................................................................5-11
Table 5-4. Vegetation class percent composition of Braden River floodplain vegetation/soil transects. ..........................................................................5-12
Table 5-5. Median relative elevations (height in feet above the river channel bottom), of vegetation classes at floodplain vegetation/soils transects along the Braden River.......................................................................................5-13
Table 5-6. Median elevations in feet above NGVD of hydric and other soil characteristics along floodplain vegetation/soils transects on the Braden River. ........................................................................................................5-14
Table 5-7. Median elevations, in feet above NGVD, and relative elevations (height in feet above the river channel bottom) of hydric and non-hydric soils in vegetation classes occurring along the floodplain vegetation/soils transects on the Braden River. .................................................................5-15
Table 5-8. Recommended percent flow reductions based on PHABSIM analyses for two sites in the Braden River for the seven months included in Block 2. .5-19
Table 5-9. Mean elevation of instream woody habitats (exposed roots and snags) at fourteen instream habitat cross-section sites, corresponding flows at the USGS Braden River near Lorraine gage site required for inundation of the mean elevations, and maximum percent-of-flow reductions associated with less than a 15% reduction in the number of days flow sufficient to inundate the mean habitat elevations for two benchmark periods.. ..........5-23
Table 5-10. Proposed Minimum Flows for the upper, freshwater segment of the Braden River, including short-term and long-term compliance standards for the USGS Braden River near Lorraine FL gage site.................................5-27
x
Executive Summary The Southwest Florida Water Management District, by virtue of its responsibility to permit the consumptive use of water and a legislative mandate to protect water resources from “significant harm," has been directed to establish minimum flows and levels (MFLs) for streams and rivers within its boundaries (Section 373.042, Florida Statutes). As currently defined by statute, "the minimum flow for a given watercourse shall be the limit at which further withdrawals would be significantly harmful to the water resources or ecology of the area." In this report, minimum flows are proposed for the upper or fresh water segment of the Braden River, defined as the stretch of the river from the United States Geological Survey (USGS) Braden River at Lorraine gage site, downstream to the USGS Braden River at Linger Lodge near Bradenton gage. Fundamental to the approach used for development of minimum flows and levels is the realization that a flow regime is necessary to protect the ecology of the river system. The initial step in this process requires an understanding of historic and current flow conditions to assess to what extent withdrawals or other anthropogenic factors have affected flows. To accomplish this task the District has evaluated the effects of climatic oscillations on regional river flows and has identified two benchmark periods for evaluating flows. For development of MFLs for the Braden River, the District identified seasonal blocks corresponding to periods of low, medium and high flows. Short-term minimum flow compliance standards for the Braden River near Lorraine gage site were developed for each of these seasonal periods using a "building block" approach. The compliance standards include prescribed flow reductions based on limiting potential changes in aquatic and wetland habitat availability that may be associated with seasonal changes in flow. A low flow threshold, based on fish passage depth and wetted perimeter inflection points is also incorporated into the short-term compliance standards. The low flow threshold is defined to be a flow that serves to limit withdrawals, with no surface water withdrawals permitted unless the threshold is exceeded. For the Braden River near Lorraine gage site, the low flow threshold was determined to be 7 cubic feet per second. A prescribed flow reduction for the low flow period (Block 1, which runs from May 7 through June 19) was based on review of limiting factors developed using the Physical Habitat Simulation Model (PHABSIM) to evaluate flow related changes in habitat availability for several fish species and macroinvertebrate diversity. It was determined using PHABSIM that the most restrictive limiting factor was the loss of habitat for adult and spawning spotted sunfish. Adult and spawning spotted sunfish exhibit a 15% loss of habitat when flows are reduced by 10%. This determination was based on two PHABSIM sites on the Braden River and historic flow records from the Braden River near Lorraine gage.
xi
For the high flow season of the year (Block 3, which runs from June 20 to October 24), a prescribed flow reduction was based on review of limiting factors developed using the HEC-RAS floodplain model and long-term inundation analyses to evaluate percent of flow reductions associated with changes in the number of days of inundation of floodplain features. It was determined that stepped flow reductions of 19% and 10% of historic flows, with the step occurring at the 15% exceedance flow (54 cfs) resulted in a decrease of 15% or more in the number of days that flows would inundate floodplain features as measured at the Braden River near Lorraine gage. For the medium flow period (Block 2, which runs from October 25 of one year to May 6 of the next), PHABSIM analyses were used to model flows associated with potential changes in habitat availability for several fish species and macroinvertebrate diversity. In addition, flows associated with inundation of instream woody habitats were evaluated using a HEC-RAS model and long-term inundation analyses. Using the more conservative of the two resulting flows, it was determined that PHABSIM results would define the percent flow reduction for Block 2. Results from the PHABSIM analyses indicated that more than 15% of historically available habitat would be lost for specific species life-stages if flows were reduced by more than 11% as measured at the Braden River near Lorraine gage site during the medium flow period. Because minimum flows are intended to protect the water resources or ecology of an area, and because climatic variation can influence river flow regimes, we developed long-term compliance standards for the Braden River near Lorraine gage site. The standards are hydrologic statistics that represent flows that may be expected to occur during long-term periods when short-term compliance standards are being met. The long-term compliance standards were generated using historic flow records that were altered under the assumption that allowable withdrawals identified by the short-term compliance standards actually occurred throughout the entire period of record. Hydrologic statistics for the altered flow data sets, including five and ten-year mean and median flows were determined and identified as long-term compliance standards. Because these long-term standards were developed using the short-term compliance standards and historic flow records that were altered to reflect allowable withdrawals, it may be expected that the long-term standards will be met if compliance with short-term standards is achieved. Collectively, the short and long-term compliance standards proposed for the USGS Braden River near Lorraine gage site comprise the District's proposed minimum flows and levels for the upper or freshwater segment of the Braden River. The standards are intended to prevent significant harm to the water resources or ecology of the river that may result from water use. Since future structural alterations could potentially affect surface water or groundwater flow characteristics within the watershed and additional information pertaining to

xii
minimum flows development may become available, the District is committed to revision of the proposed levels as necessary.
xiii
Acknowledgements The authors would like to thank Richard Gant, Lisa Henningsen, Jason Hood, and Michelle Dachsteiner of the Southwest Florida Water Management District for their assistance in data collection. We also thank Lisa Henningsen and Frank Sargent, also with the District, for assistance with development of land-use maps. Dr. James Gore of the University of South Florida performed all PHABSIM modeling and consulted frequently on the application of PHABSIM analyses.
1-1
Chapter 1 Minimum Flows and Levels
"There is no universally accepted method or combination of methods that is appropriate for establishing instream flow regimes on all rivers or streams. Rather, the combination or adaptation of methods should be determined on a case-by-case basis; . . . In a sense, there are few bad methods – only improper applications of methods. In fact, most . . . assessment tools . . . can afford adequate instream flow protection for all of a river's needs when they are used in conjunction with other techniques in ways that provide reasonable answers to specific questions asked for individual rivers and river segments. Therefore, whether a particular method 'works' is not based on its acceptance by all parties but whether it is based on sound science, basic ecological principles, and documented logic that address a specific need" (Instream Flow Council 2002).
1.1 Overview and Legislative Direction The Southwest Florida Water Management District (District or SWFWMD), by virtue of its responsibility to permit the consumptive use of water and a legislative mandate to protect water resources from “significant harm”, has been directed to establish minimum flows and levels (MFLs) for streams and rivers within its boundaries (Section 373.042, Florida Statutes). As currently defined by statute, “the minimum flow for a given watercourse shall be the limit at which further withdrawals would be significantly harmful to the water resources or ecology of the area.” Development or adoption of a minimum flow or level does not in itself protect a water body from significant harm. However, protection, recovery or regulatory compliance can be gauged and achieved once a standard has been established. The District's purpose in establishing MFLs is to create a yardstick against which permitting and/or planning decisions regarding water withdrawals, either surface or groundwater, can be made. Should an amount of withdrawal requested cause “significant harm”, then a permit cannot be issued. If it is determined that a system is either not in compliance, or expected not to be in compliance during next 20 years, as a result of withdrawals, then a recovery plan is developed and implemented. According to state law, minimum flows and levels are to be established based upon the best available information (Section 373.042, F.S.), and shall be developed with consideration of “...changes and structural alterations to watersheds, surface waters and aquifers and the effects such changes or alterations have had, and the constraints such changes or alterations have placed, on the hydrology of the affected watershed, surface water, or aquifer...” (Section 373.0421, F.S.). Changes, alterations and constraints associated with water withdrawals are not to be considered when developing minimum flows and levels. However, according to the State Water Resources Implementation Rule (Chapter 62-40.473, Florida Administrative Code), “consideration shall be given to the protection of water resources, natural seasonal
1-2
fluctuations in water flows or levels, and environmental values associated with coastal, estuarine, aquatic and wetlands ecology, including:
1) Recreation in and on the water; 2) Fish and wildlife habitats and the passage of fish; 3) Estuarine resources; 4) Transfer of detrital material; 5) Maintenance of freshwater storage and supply; 6) Aesthetic and scenic attributes; 7) Filtration and absorption of nutrients and other pollutants; 8) Sediment loads; 9) Water quality; and 10) Navigation.
Because minimum flows are used for long-range planning and since the setting of minimum flows can potentially restrict the use and allocation of water, establishment of minimum flows will not go unnoticed or unchallenged. The science upon which a minimum flow is based, the assumptions made, and the policy used must, therefore, be clearly defined as each minimum flow is developed.
1.2 Historical Perspective For freshwater streams and rivers, the development of instream flow legislation can be traced to recent work by fisheries biologists, dating back not much more than 35 to 40 years. Florida has had minimum flow and levels incorporated into its Water Resource Act since its enactment in 1972. However, it was not until 1997 that the role of minimum flows and levels were clearly defined by the state (Munson et al. 2005). A survey completed in 1986 (Reiser et al. 1989) indicated that at that time only 15 states had legislation explicitly recognizing that fish and other aquatic resources required a certain level of instream flow for their protection. Nine of the 15 states were western states “where the concept for and impetus behind the preservation of instream flows for fish and wildlife had its origins” (Reiser et al. 1989). Stalnaker et al. (1995) have summarized the minimum flows approach as one of standards development, stating that, “[f]ollowing the large reservoir and water development era of the mid-twentieth century in North America, resource agencies became concerned over the loss of many miles of riverine fish and wildlife resources in the arid western United States. Consequently, several western states began issuing rules for protecting existing stream resources from future depletions caused by accelerated water development. Many assessment methods appeared during the 1960s and early 1970s. These techniques were based on hydrologic analysis of the water supply and hydraulic considerations of critical stream channel segments, coupled with empirical observations of habitat quality and an understanding of riverine fish ecology. Application of these methods usually resulted in a single threshold or ‘minimum’ flow value for a specified stream reach.”
1-3
1.3 The Flow Regime The idea that a single minimum flow is not satisfactory for maintaining a river ecosystem was most emphatically stated by Stalnaker (1990) who declared that “minimum flow is a myth”. The purpose of his paper was to argue “multiple flow regimes are needed to maintain biotic and abiotic resources within a river ecosystem” (Hill et al. 1991). The logic is that “maintenance of stream ecosystems rests on streamflow management practices that protect physical processes which, in turn, influence biological systems.” Hill et al. (1991) identified four types of flows that should be considered when examining river flow requirements, including:
1) flood flows that determine the boundaries of and shape floodplain and valley features;
2) overbank flows that maintain riparian habitats; 3) in-channel flows that keep immediate streambanks and channels functioning;
and 4) in-stream flows that meet critical fish requirements.
As emphasized by Hill et al. (1991), minimum flow methodologies should involve more than a consideration of immediate fish needs or the absolute minimum required to sustain a particular species or population of animals, and should take into consideration “how streamflows affect channels, transport sediments, and influence vegetation.” Although, not always appreciated, it should also be noted, “that the full range of natural intra- and inter-annual variation of hydrologic regimes is necessary to [fully] sustain the native biodiversity” (Richter et al. 1996). Successful completion of the life-cycle of many aquatic species is dependant upon a range of flows, and alterations to the flow regime may negatively impact these organisms as a result of changes in physical, chemical and biological factors associated with particular flow conditions. Recently, South African researchers, as cited by Postel and Richter (2003), listed eight general principles for managing river flows:
1) "A modified flow regime should mimic the natural one, so that the natural timing of different kinds of flows is preserved.
2) A river's natural perenniality or nonperenniality should be retained. 3) Most water should be harvested from a river during wet months; little should
be taken during the dry months. 4) The seasonal pattern of higher baseflows in wet season should be retained. 5) Floods should be present during the natural wet season. 6) The duration of floods could be shortened, but within limits. 7) It is better to retain certain floods at full magnitude and to eliminate others
entirely than to preserve all or most floods at diminished levels. 8) The first flood (or one of the first) of the wet season should be fully retained."
1-4
Common to this list and the flow requirements identified by Hill et al. (1991) is the recognition that in-stream flows and out of bank flows are important for ecosystem functioning, and that seasonal variability of flows should be maintained. Based on these concepts, the preconception that minimum flows (and levels) are a single value or the absolute minimum required to maintain ecologic health in most systems has been abandoned in recognition of the important ecologic and hydrologic functions of streams and rivers that are maintained by a range of flows. And while the term “minimum flows” is still used, the concept has evolved to one that recognizes the need to maintain a “minimum flow regime”. In Florida, for example, the St. Johns River Water Management District typically develops multiple flow requirements when establishing minimum flows and levels (Chapter 40-C8, F.A.C) and for the Wekiva River noted that, “[s]etting multiple minimum levels and flows, rather than a single minimum level and flow, recognizes that lotic [running water] systems are inherently dynamic” (Hupalo et al. 1994). Also, in 2005, changes that acknowledge the importance of retaining the hydrologic regime were made to the Florida Administrative Code. Specifically, Chapter 62-40.473(2) of the State Water Resources Implementation Rule currently directs that "minimum flows and levels should be expressed as multiple flows or levels defining a minimum hydrologic regime". This change was intended to protect variation in water flows and levels that contributes to significant functions of ecosystems.
1.4 Ecosystem Integrity and Significant Harm “A goal of ecosystem management is to sustain ecosystem integrity by protecting native biodiversity and the ecological (and evolutionary) processes that create and maintain that diversity. Faced with the complexity inherent in natural systems, achieving that goal will require that resource managers explicitly describe desired ecosystem structure, function, and variability; characterize differences between current and desired conditions; define ecologically meaningful and measurable indicators that can mark progress toward ecosystem management and restoration goals; and incorporate adaptive strategies into resource management plans” (Richter et al. 1996). Although it is clear that multiple flows are needed to maintain the ecological systems that encompass streams, riparian zones and valleys, much of the fundamental research needed to quantify the ecological links between the instream and out of bank resources, because of expense and complexity, remains to be done. This research is needed to develop more refined methodologies, and will require a multi-disciplinary approach involving hydrologists, geomorphologists, aquatic and terrestrial biologists, and botanists (Hill et al. 1991). To justify adoption of a minimum flow for purposes of maintaining ecologic integrity, it is necessary to demonstrate with site-specific information the ecological effects associated with flow alterations and to also identify thresholds for determining whether these effects constitute significant harm. As described in Florida’s legislative requirement to develop minimum flows, the minimum flow is to prevent “significant harm” to the state’s rivers and streams. Not only must “significant harm” be defined so that it can be measured, it is also implicit that some deviation from the purely natural or existing long-term
1-5
hydrologic regime may occur before significant harm occurs. The goal of a minimum flow would, therefore, not be to preserve a hydrologic regime without modification, but rather to establish the threshold(s) at which modifications to the regime begin to affect the aquatic resource and at what level significant harm occurs. If recent changes have already “significantly harmed” the resource, or are expected to do so in the next twenty years, it will be necessary to develop a recovery or prevention plan.
1.5 Summary of the SWFWMD Approach for Developing Minimum Flows As noted by Beecher (1990), “it is difficult [in most statutes] to either ascertain legislative intent or determine if a proposed instream flow regime would satisfy the legislative purpose”, but according to Beecher as cited by Stalnaker et al. (1995), an instream flow standard should include the following elements:
1) a goal (e.g., non-degradation or, for the District’s purpose, protection from “significant harm”);
2) identification of the resources of interest to be protected; 3) a unit of measure (e.g., flow in cubic feet per second, habitat in usable area,
inundation to a specific elevation for a specified duration); 4) a benchmark period; and 5) a protection standard statistic.
The District's approach for minimum flows development incorporates the five elements listed by Beecher (1990). The goal of a MFLs determination is to protect the resource from significant harm due to withdrawals and was broadly defined in the enacting legislation as "the limit at which further withdrawals would be significantly harmful to the water resources or ecology of the area." What constitutes "significant harm" was not defined. Impacts on the water resources or ecology are evaluated based on an identified subset of potential resources of interest. Ten potential resources were listed in Section 1.1. They are: recreation in and on the water; fish and wildlife habitats and the passage of fish; estuarine resources; transfer of detrital material; maintenance of freshwater storage and supply; aesthetic and scenic attributes; filtration and absorption of nutrients and other pollutants; water quality and navigation. The approach outlined in this report identifies specific resources of interest and identifies when it is important seasonally to consider these resources. While the main unit of measure used by the District for defining minimum flows is flow or discharge (in cubic feet per second), it will become evident that several different measures of habitat, along with elevations in feet above the National Geodetic Vertical Datum of 1929 (NGVD 1929) associated with these habitats were employed. Ultimately, however, these different measures of habitat and inundation elevations were related to flows in order to derive the minimum flow recommendations.
1-6
Fundamental to the approach used for development of minimum flows and levels is the realization that a flow regime is necessary to protect the ecology of the river system. The initial step in this process requires an understanding of historic and current flow conditions to determine if current flows reflect past conditions. If this is the case, the development of minimum flows and levels becomes a question of what can be allowed in terms of withdrawals before significant harm occurs. If there have been changes to the flow regime of a river, these must be assessed to determine if significant harm has already occurred. If significant harm has occurred, recovery becomes an issue. The District has adopted an approach for establishing benchmark flow periods that involves consideration of the effects of multidecadal climatic oscillations on river flow patterns. The approach, which led to identification of separate benchmark periods for flow records collected prior to and after 1970, was used for development of MFLs for the freshwater segment of the Alafia River, middle Peace River, and the Myakka River (Kelly et al. 2005a, Kelly et al. 2005b, Kelly et al. 2005c). This is not the case on the Braden River where the period of record on the longest term gage site date back only to the late nineteen-eighties. Following assessment of historic and current flow regimes and the factors that have affected their development, the District develops protection standard statistics or criteria for preventing significant harm to the water resource. For the upper segment of the Peace River, criteria associated with fish passage in the river channel and maximization of the wetted perimeter were used to recommend a minimum low flow (SWFWMD 2002). Criteria associated with medium and higher flows that result in the inundation of woody habitats associated with the river channel and vegetative communities on the floodplain were described. These criteria were not, however, used to develop recommended levels, due to an inability to separate water withdrawal impacts on river flow from those associated with structural alterations within the watershed. For the middle segment of the Peace River, Alafia River, and the upper segment of the Myakka River, the District has used fish passage, wetted perimeter and other criteria to protect low flows and applied approaches associated with development of medium to high flow criteria per recommendations contained in the peer review of the proposed upper Peace River minimum flows (Gore et al. 2002). These efforts have included collection and analyses of in-stream fish and macroinvertebrate habitat data using the Physical Habitat Simulation (PHABSIM) model, and evaluation of inundation characteristics of floodplain habitats.
1.5.1 A Building Block Approach The peer-review report on proposed MFLs for the upper segment of the Peace River (Gore et al. 2002) identified a "building block" approach as "a way to more closely mirror original hydrologic and hydroperiodic conditions in the basin". Development of regulatory flow requirements using this type of approach typically involves description of the natural flow regime, identification of building blocks associated with flow needs for ecosystem specific functions, biological assemblages or populations, and assembly of
1-7
the blocks to form a flow prescription (Postel and Richter 2003). As noted by the panelists comprising the Upper Peace River MFLs review panel, "assumptions behind building block techniques are based upon simple ecological theory; that organisms and communities occupying that river have evolved and adapted their life cycles to flow conditions over a long period of pre-development history (Stanford et al. 1996). Thus with limited biological knowledge of flow requirements, the best alternative is to recreate the hydrographic conditions under which communities have existed prior to disturbance of the flow regime." Although in most cases, the District does not expect to recreate pre-disturbance hydrographic conditions through MFLs development and implementation, the building block approach is viewed as a reasonable means for ensuring the maintenance of similar, although dampened, natural hydrographic conditions. For development of minimum flows and levels for the upper, freshwater segment of the Braden River, the District has explicitly identified three building blocks in its approach. The blocks correspond to seasonal periods of low, medium and high flows. The three distinct flow periods are evident in hydrographs of mean or median daily flows for the river (Figure 1-1). Lowest flows occur during Block 1, a 66-day period that extends from April 20 to June 25 (Julian day 110 to 176). Highest flows occur during Block 3, the 123-day period that immediately follows the dry season (June 26 to October 26). This is the period when the floodplain is most likely to be inundated on an annual basis; although high flows can occur in early to mid-March. The remaining 176 days constitute an intermediate or medium flow period, which is referred to as Block 2.
1-8
0
50
100
150
200
250
300
0 100 200 300
Braden River Pattern Water Year Day
Flow
s (c
fs)
Block 1 Block 3 Block 2
0
50
100
150
200
250
300
0 100 200 300
Braden River Pattern Water Year Day
Flow
s (c
fs)
Block 1 Block 3 Block 2
Figure 1-1. Mean (blue) and median (orange) daily flows for the USGS Braden River near Lorraine gage site and seasonal flow blocks (Blocks 1, 2 and 3) for the upper Braden River.
1.6 Flows and Levels Although somewhat semantic, there is a distinction between flows, levels and volumes that should be appreciated when considering MFLs development. The term “flow” may most legitimately equate to water velocity; which is typically measured by a flow meter. A certain velocity of water may be required to physically move particles heavier than water; for example, periodic higher velocities will transport sand from upstream to downstream; higher velocities will move gravel; and still higher velocities will move rubble or even boulders. Flows may also serve as a cue for some organisms; for example, certain fish species search out areas of specific flow for reproduction and may move against flow or into areas of reduced or low flow to spawn. Certain macroinvertebrates drift or release from stream substrates in response to changes in flow. This release and drift among other things allows for colonization of downstream areas. One group of macroinvertebrates, the caddisflies, spin nets in the stream to catch organisms and detritus carried downstream, and their success in gathering/filtering prey is at least partially a function of flow. Other aquatic species have specific morphologies that allow them to inhabit and exploit specialized niches located in flowing water; their bodies may be flattened (dorsally-ventrally compressed) to allow them to live under rocks or in crevices; they may have special holdfast structures such as hooks or even secrete a glue that allows them to attach to submerged objects. Discharge refers to the volume of water moving past a point per unit time, and depending on the size of the stream (cross sectional area), similar volumes of water can be moved with quite large differences in the velocity. The volume of water moved
1-9
through a stream can be particularly important to an estuary. It is the volume of freshwater that mixes with salt water that determines, to a large extent, what the salinity in a fixed area of an estuary will be. This is especially important for organisms that require a certain range of salinity. The volumes of fresh and marine water determine salinity, not the flow rate per se; therefore, volume rather than flow is the important variable to this biota. For the purpose of developing and evaluating minimum flows, the District identifies discharge in cubic feet per second for field-sampling sites and specific streamflow gaging stations. In some cases, the water level or the elevation of the water above a certain point is the critical issue to dependent biota. For example, the wetland fringing a stream channel is dependent on a certain hydroperiod or seasonal pattern of inundation. On average, the associated wetland requires a certain level and frequency of inundation. Water level and the duration that it is maintained will determine to a large degree the types of vegetation that can occur in an area. Flow and volume are not the critical criteria that need to be met, but rather water surface elevation or level. There is a distinction between volumes, levels and velocities that should be appreciated. Although levels can be related to flows and volumes in a given stream (stream gaging, in fact, depends on the relationship between stream stage or level and discharge), the relationship varies between streams and as one progresses from upstream to downstream in the same system. Because relationships can be empirically determined between levels, flows and volumes, it is possible to speak in terms of, for example, minimum flows for a particular site (discharge in cubic feet per second); however, one needs to appreciate that individual species and many physical features may be most dependent on a given flow, level or volume or some combination of the three for their continued survival or occurrence. The resultant ecosystem is dependent on all three.
1.7 Content of Remaining Chapters In this chapter, we have summarized the requirements and rationale for developing minimum flows and levels in general and introduced the need for protection of the flow regime rather than protection of a single minimum flow. The remainder of this document considers the development of minimum flows and levels specific to the upper Braden River, which is defined as the river corridor upstream of the USGS Braden River at Linger Lodge near Bradenton FL gage site. In Chapter 2, we provide a short description of the river basin and its hydrogeologic setting, and consider historic and current river flows and the factors that have influenced the flow regimes. Identification of benchmark periods of flow, resulting from natural climatic oscillations is noted and seasonal blocks corresponding to low, medium and high flows are identified. Water quality changes related to flow are also summarized in Chapter 2 to enhance understanding of historical flow changes in the watershed. Chapter 3 includes a discussion of the resources of concern and key habitat indicators used for developing minimum flows. Specific methodologies and tools used to develop the minimum flows
1-10
are outlined in Chapter 4. In Chapter 5, we present results of our analyses and provide flow prescriptions that were used to develop short and long-term compliance standards that comprise the minimum flows for the USGS Braden River near Lorraine FL gage site on the upper Braden River. The report concludes with recommendations for evaluating compliance with the proposed minimum flows, based on the short and long-term compliance standards.
2-1
Chapter 2 BASIN DESCRIPTION WITH EMPHASIS ON LAND USE, HYDROLOGY AND WATER QUALITY
2.1 Overview This chapter includes a brief description of the Braden River watershed and is followed by a presentation and discussion of land use, hydrology, and water quality data relevant to the development of MFLs on the upper, freshwater segment of the Braden River above the USGS Braden River at Linger Lodge near Bradenton FL gage site (or alternatively above the Bill Evers Reservoir). Land use changes within the basin are evaluated to support the hydrology discussion that follows and to address the potential impact of land use changes on river flow volumes. Flow trends and their potential causes are discussed for the Braden River and compared with other regional rivers to provide a basis for identifying benchmark periods and seasonal flow blocks that are used for a building block approach in the establishment of minimum flows. Water chemistry changes are discussed to illustrate how land use changes may have affected observed trends in certain water quality parameters, and to demonstrate how these trends are useful in interpreting flow changes over time.
2.2 Watershed Description (material in this section was taken largely from DelCharco and Lewelling, 1997).
2.2.1 Geographic Location The Braden River is the largest tributary to the Manatee River, which empties into the southern portion of Tampa Bay (Figure 2-1). In 1936, the Braden River was dammed approximately six miles upstream from its mouth with a weir structure, named the John Ward Dam, to provide a freshwater source for the City of Bradenton. The initial dam was a 838-foot broad-crested weir which created a backwater effect extending approximately 6 miles upstream. The resulting 167-acre reservoir was named Ward Lake and stored approximately 585 million gallons. The reservoir was expanded in 1985 to 359 acres and storage capacity was increased to 1,400 million gallons by dredging the channel and surrounding riverbank upstream of the weir. Ward Lake was renamed the Bill Evers Reservoir at that time. Approximately 90 percent of the 83 square mile watershed lies within Manatee County, and the remaining 10 percent lies in northern Sarasota County. DelCharco and Lewelling (1997) identified three segments to the Braden River; the lower, middle and upper. The lower segment is the area downstream of the Evers Reservoir and is the estuarine portion of the river. The middle segment is essentially the reservoir, and the upper segment was identified as an incised channel free of any backwater effect. For the establishment of MFLs outlined in this report, the upper Braden River is defined
2-2
as the freshwater segment upstream of the USGS Braden River at Linger Lodge, near Bradenton gage site. For practical purposes, this is equivalent to the portion of the river upstream from the Bill Evers Reservoir. Development of MFLs, applicable to the estuarine segment of the Braden River, will be addressed as part of the Manatee River estuary system.
Figure 2-1. Map of the Braden River watershed showing the Braden River main-stem and tributaries, sub-basins and USGS gage site locations.
2.2.2 Climate The climate of the watershed is characterized as subtropical with high average annual rainfall and temperatures. For the period of record (1911 to 2004), rainfall has averaged 54.9 inches with 61% occurring in the typical rainy season which extends from June through September (Figure 2-2). November is typically the driest month (averaging approximately 2 inches) and September the wettest (averaging 9.5 inches). Periodic cold fronts account for most of the rainfall from December through March, while heavy rainfall is often associated with tropical storms and hurricanes that typically occur between June and November. Annual air temperature averages 72ºF. Evaporation in Manatee County has been estimated at about 39 inches per year (Cherry et al. 1970), while average lake evaporation is reported to average about 52 inches per year (Kohler et al. 1959).
2-3
Average Monthly Rainfall at Bradenton Experimental Station for Period 1911 to 2004
0
2
4
6
8
10
Jan Feb Mar Apr May Jun Jul Aug Sep Oct Nov Dec
Rain
fall
(inch
es)
Figure 2-2. Average monthly rainfall at the Bradenton Experimental Station for the period from 1911 through 2004.
2.3 Land Use Changes in the Braden River Watershed
2.3.1 Braden River Watershed A series of maps, tables and figures were generated for the entire Braden River watershed for three specific years (1972, 1990 and 1999) for purposes of reviewing land use changes that have occurred during the last several decades. The 1972 maps, tables, and figures represent land use and land cover generated using the USGS classification system (Anderson et al. 1976). The USGS classification system incorporates a minimum mapping unit of 10 acres for man-made features with a minimum width of 660 feet. The minimum mapping unit for non-urban and natural features is 40 acres with a minimum width of 1,320 feet. The 1990 and 1999 maps and data represent land use and land cover information developed using the Florida Department of Transportation's (1999) Florida Land Use, Cover and Forms Classification System (FLUCCS). The FLUCCS system is more detailed than the USGS system, with minimum mapping units of 5 acres for uplands and 0.5 acres for wetlands. Some differences in land-use estimates for the three periods may therefore be
2-4
attributed to analytic precision differences. However, for presentation and discussion purposes, we combined numerous land use types into fairly broad categories, and thereby eliminated some of the error associated with use of the two classification systems. For our analyses, land use/cover types identified included: urban; uplands (rangeland and upland forests); wetlands (wetland forests and non-forested wetlands); mines; water; citrus; and other agriculture. We examined changes in these use/cover types for the entire watershed and also for two major sub-basins. Before discussing individual sub-basin land use changes, it is informative to discuss the entire watershed of the Braden River to get an appreciation of the major land uses/covers and the changes that have occurred during the nearly 30 years for which land use maps are available. Land use/cover maps for 1972 and 1999 for the entire Braden River watershed are shown in Figures 2-3 and 2-4. Based on these maps, the entire Braden River watershed is 83.6 square miles or 53,487 acres in size (Table 2-1). Because we combine several agricultural land use types for our analysis, temporal changes in land use from 1972 to 1999 (see Figure 2-5) may not reflect the shift which has occurred from less intensive types of agricultural land use to those requiring greater amounts of water. It should be noted, however, that of the major land use categories, the amount of land converted to urban uses has shown the single greatest increase. In many instances, within sub-basins, what appears to be a substantial decrease in uplands and increase in wetlands is actually an artifact of the disparity in resolution of features denoted in 1972 and 1999 mapping. While it appears that the amount of wetlands has increased in most sub-basins, this is probably not the case. Because many wetlands are small in size and interspersed within upland areas, they were not delineated under the relatively coarser resolution employed in the 1972 mapping. Actual increases in wetlands (resulting in a concomitant decrease in uplands) were the consequence of increased resolution rather than the conversion of, for example, uplands to wetlands. In many cases what appear to be substantial declines in uplands should more appropriately be interpreted as an improvement in map resolution. However, decreases in uplands have occurred in some sub-basins. It is helpful when interpreting these data to view the sum of the wetlands and uplands as natural area, and the decline in this total as a measure of conversion to some other more intensive land use (e.g., agriculture, mining, urban).
2-5
Figure 2-3. 1972 land use/cover map of the Braden River watershed.
2-6
Figure 2-4. 1999 land use/cover map of the Braden River watershed.
2-7
Table 2-1. Land use and land cover percentages in the 53,487-acre (84 square miles) Braden River watershed for three time periods: 1972, 1990 and 1999.
Figure 2-5. Land use/cover acreage in the Braden River watershed in 1972, 1990 and 1999.
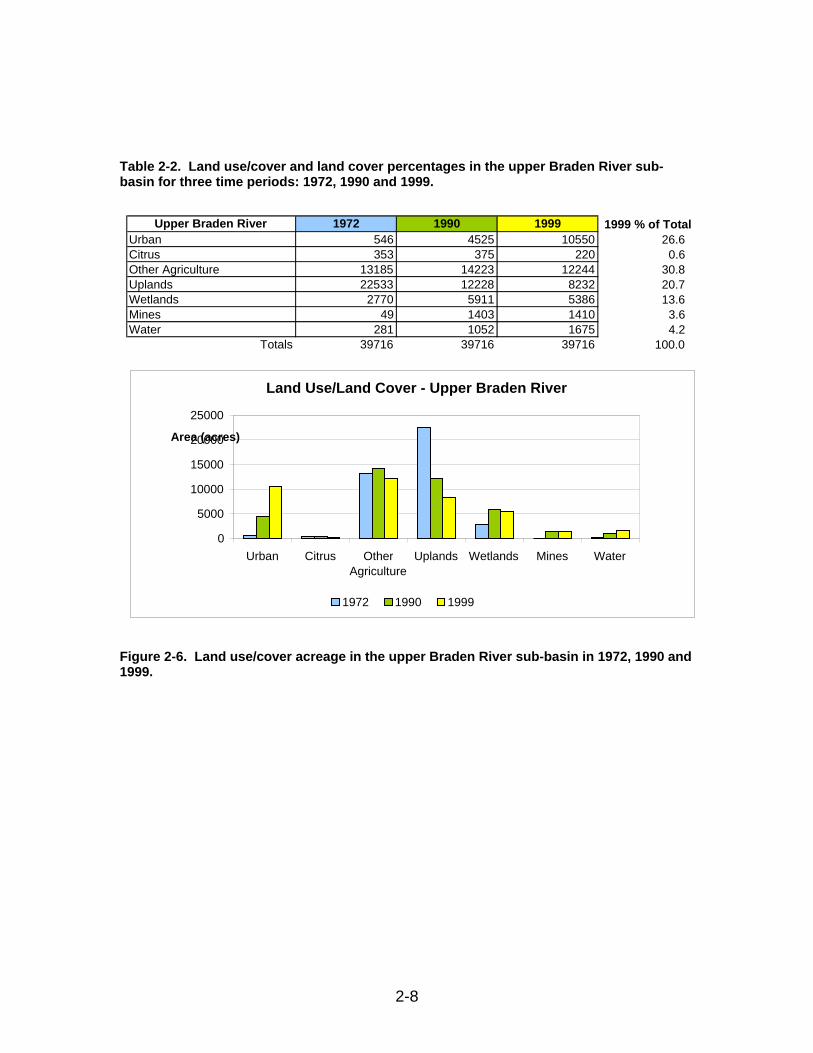
2.3.2 Upper Braden River Sub-Basin The predominant land use in the Upper Braden River sub-basin is agriculture, although the amount of land in this use category has declined between 1972 and 1999 (Table 2-2, Figures 2-6 through 2-8). Clearly, the single greatest increase in land use during this time period was urban, which increased from 546 acres to 10,550 acres by 1999. What appears to be an increase in wetland area is probably largely an artifact attributable to the coarser resolution of the earlier land use map (i.e., 1972); the actual decline in acreage between 1990 and 1999 is believed to be real and amounts to 525 acres. The increase in urbanized area between 1972 and 1999 of slightly greater than 10,000 acres was essentially off-set by the total decrease in natural lands (i.e., uplands + wetlands) of over 11,000 acres. Although agriculture remains a significant land use in the upper basin (26% of total area), it should be noted that this land use has declined by slightly over 1,000 acres since 1972.
Braden River Watershed 1972 1990 1999 1999 % of TotalUrban 2649 11311 18060 33.8 Citrus 1562 1039 838 1.6Other Agriculture 20390 16545 14028 26.2Uplands 24350 13590 9537 17.8Wetlands 3757 7440 6615 12.4Mines 88 1506 1508 2.8Water 692 2056 2901 5.4
Totals 53487 53487 53487 100.0
Land Use/Land Cover - Braden River Watershed
0 5000
10000 15000 20000 25000 30000
Urban Citrus OtherAgriculture
Uplands Wetlands Mines Water
Area (acres)
1972 1990 1999
2-8
Table 2-2. Land use/cover and land cover percentages in the upper Braden River sub-basin for three time periods: 1972, 1990 and 1999.
Figure 2-6. Land use/cover acreage in the upper Braden River sub-basin in 1972, 1990 and 1999.
Upper Braden River 1972 1990 1999 1999 % of TotalUrban 546 4525 10550 26.6 Citrus 353 375 220 0.6Other Agriculture 13185 14223 12244 30.8Uplands 22533 12228 8232 20.7 Wetlands 2770 5911 5386 13.6Mines 49 1403 1410 3.6Water 281 1052 1675 4.2
Totals 39716 39716 39716 100.0
Land Use/Land Cover - Upper Braden River
0 5000
10000 15000 20000 25000
Urban Citrus OtherAgriculture
Uplands Wetlands Mines Water
Area (acres)
1972 1990 1999
2-9
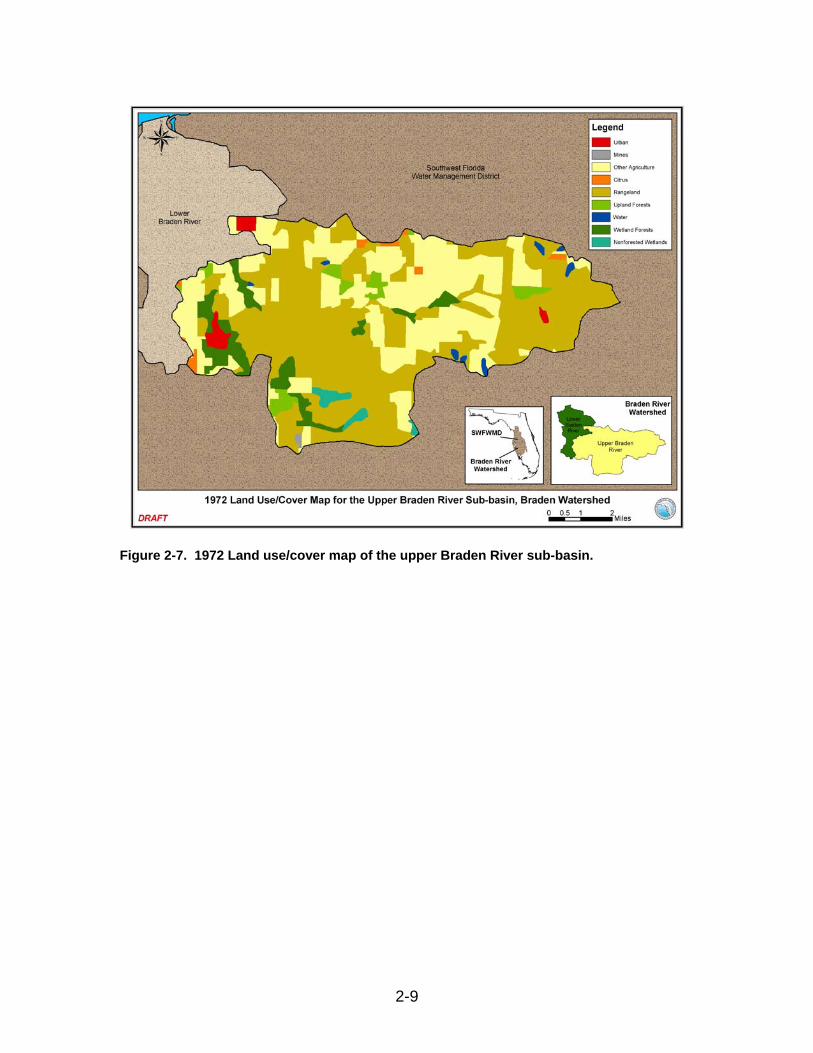
Figure 2-7. 1972 Land use/cover map of the upper Braden River sub-basin.
2-10
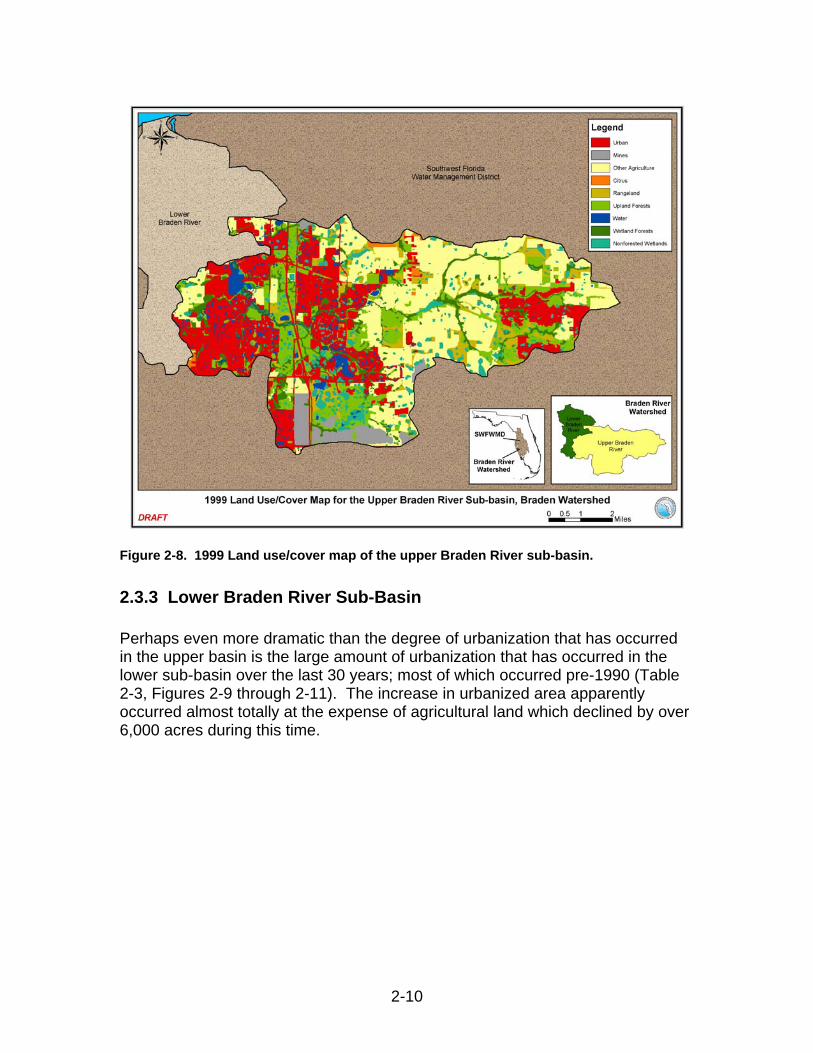
Figure 2-8. 1999 Land use/cover map of the upper Braden River sub-basin.
2.3.3 Lower Braden River Sub-Basin Perhaps even more dramatic than the degree of urbanization that has occurred in the upper basin is the large amount of urbanization that has occurred in the lower sub-basin over the last 30 years; most of which occurred pre-1990 (Table 2-3, Figures 2-9 through 2-11). The increase in urbanized area apparently occurred almost totally at the expense of agricultural land which declined by over 6,000 acres during this time.
2-11
Table 2-3. Land use/cover percentages in the lower Braden River sub-basin for three time periods: 1972, 1990 and 1999.
Figure 2-9. Land use/ cover in the lower Braden River sub-basin in 1972, 1990 and 1999.
Lower Braden River 1972 1990 1999 1999 % of TotalUrban 2103 6786 7510 54.5 Citrus 1209 664 619 4.5Other Agriculture 7205 2322 1784 13. 0Uplands 1817 1361 1305 9.5Wetlands 986 1529 1229 8.9Mines 39 103 98 0.7 Water 411 1004 1226 8.9
Totals 13771 13771 13771 100.0
Land Use/Land Cover - Lower Braden River
0 1000 2000 3000 4000 5000 6000 7000 8000
Urban Citrus OtherAgriculture
Uplands Wetlands Mines Water
Area (acres)
1972 1990 1999
2-12
Figure 2-10. 1972 Land use/cover map of the lower Braden River sub-basin.
2-13
Figure 2-11. 1999 Land use/cover map of the lower Braden River sub-basin.
2.4 Hydrology
2.4.1 Overview The effect of the Atlantic Multidecadal Oscillation (AMO; see Enfield et al. 2001) on climate and river flows is considered briefly in this chapter, and its relevance and importance to developing MFLs in general is discussed. We conclude that climate is a major factor that must be considered when developing baseline or benchmark periods for evaluating flow reductions and establishing MFLs. The chapter concludes with a discussion of the development of seasonal flow blocks that are utilized for minimum flow development.
2.4.2 Florida River Flow Patterns and the Atlantic Multidecadal Oscillation
2-14
Smith and Stopp (1978) note that "it would be reasonable to assume that given a fairly constant climate, the amount of water flowing down a river's course each year would vary evenly about an average value." Statements such as this represent the historic paradigm with respect to the impact of climate on river flow. As a result, little attention has been paid to the potential for a climate change (oscillation) to affect river flows, and thus any change (trend) in flow other than expected annual variability has typically been assumed to be anthropogenic. While much of Florida has a summer monsoon, the north to northwest portion of the state experiences higher flows in the spring similar to most of the southeast United States. Spatial and temporal differences in flows for southeastern rivers were reviewed by Kelly (2004). By constructing plots of median daily flows (in cubic feet per second), seasonal flow patterns were clearly identified, and by dividing mean daily flows by the upstream watershed area, flows could be compared between watersheds of varying size. One of the more interesting features evident from this analysis was the existence of a distinctly bimodal flow pattern (Figure 2-12, bottom panel) which characterizes a number of streams in a rather narrow geographic band that extends from the Georgia-Florida border in the northeastern part of the state where the St. Marys River discharges into the Atlantic Ocean towards the mouth of the Suwannee River in the Big Bend area. Rivers south of this line (most of peninsular Florida) exhibit highest flows in the summer (Figure 2-12, top panel), while those north of the line exhibit highest flows in the spring (Figure 2-12, middle panel).
2-15
Period of Record Median Daily Flows for St. Marys River near Macclenny, FL
0100200300400500600700
0 50 100 150 200 250 300 350
Day of Year
Flow
(cfs
)
Figure 2-12. Examples of three river flow patterns: the Southern River Pattern (upper panel), the Northern River Pattern (center panel) and Bimodal River Pattern (bottom panel).
Period of Record Median Daily Flows forApalachicola River at Chattahoochee, FL
0 5000
10000 15000 20000 25000 30000 35000 40000
0 50 100 150 200 250 300 350
Day of Year
Flow
(cfs
)Period of Record Median Daily Flows
Braden River near Lorraine, FL
0 10 20 30 40 50 60
0 100 200 300
Day of Year
Flow
(cfs
)
2-16
2.4.2.1 Multidecadal Periods of High and Low Flows Citing Enfield et al. (2001), Basso and Schultz (2003) noted that the Atlantic Multidecadal Oscillation (AMO) offered an apparent explanation for observed rainfall deficits throughout central Florida. Although the District and others (Hammett 1990, Hickey 1998) have discussed the lack of tropical storm activity and deficit rainfall in recent decades, the mechanism or mechanisms that would account for such differences were unknown. Based on an emerging body of research, climatologists now believe that multidecadal periods of warming and cooling of the North Atlantic Ocean's surface waters ultimately affect precipitation patterns across much of the United States. What is particularly interesting is that unlike most of the continental United States, there is for most of Florida a positive (rather than negative) correlation between rainfall and prolonged periods of North Atlantic Ocean sea surface warming (Enfield et al. 2001). While periods of warmer ocean temperature generally resulted in less rainfall over most of the United States, there are some areas, including peninsular Florida, where rainfall increased. Since river flows are largely rainfall dependent, variation in rainfall should result in variations in river flows. To be consistent with Enfield et al.'s (2001) conclusions regarding the AMO and rainfall and with Basso and Schultz (2003), who examined long-term variations in rainfall in west-central Florida, Kelly (2004) reasoned that in Florida, flows would be highest at streamflow gage sites when sea surface temperatures in the North Atlantic are in a warm period (i.e., positively correlated). At the same time, most of the continental United States would be expected to be in a period of lower flows. Conversely, the majority of continental gage sites would be expected to exhibit higher flows during AMO cool periods and much of peninsular Florida would be expected to be in a period of low flows.
Based on these hypotheses, Kelly (2004) examined flow records for multidecadal periods corresponding to warming and cooling phases of the AMO for numerous gage sites within the District, the state, and the southeastern United States to discern if increases and decreases in river flows were consistent with AMO phases. He concluded that flow decreases and increases in the northern part of the state and flow increases and decreases in peninsular Florida are consistent with the AMO and the reported relationship with rainfall. When rivers in peninsular Florida were in a multidecadal period of higher flows (1940 to 1969), rivers in the north to northwestern part of the state were in a low-flow period. Conversely rivers in peninsular Florida exhibited generally lower flows (1970 to 1999) when rivers in the northern portion of the state exhibited higher flows. Examination of streams with a bi-modal flow pattern offered particularly strong supporting evidence for a distinct difference in flows between northern and southern rivers, since differences between pre- and post 1970 flows that occurred during the spring were similar to differences noted for northern river
2-17
flows while differences in summer flows were similar to flow changes that occurred in southern rivers.
2.4.3 Braden River Flow Trends
2.4.3.1 Gage Sites and Periods of Record Data are available for three USGS gages within the Braden River MFLs study corridor. Gage height (water surface elevation) data are available from March 2002 though October 2004 for the Braden River at Lorraine FL (02300029) site, the most upstream of the four sites. The Braden River near Lorraine FL gage (02300032) has the longest period of record, with gage height and stream flow measurements (Figure 2-13) available from July 1988 through the present date. Based on the availability of data for the Braden River near Lorraine site, the minimum flows and levels recommended in this report for the upper, freshwater segment of the Braden River were developed for flows measured at this gaging station. The most downstream gaging station in the study corridor is the Braden River at Linger Lodge near Bradenton FL (023000358) site. Water surface elevation values were recorded at this site form March 2002 through October 2006. The Linger Lodge gage was installed to assist with MFLs development. Gage locations are marked on Figures 2-1 and 4-1.
Braden River near Lorraine, FL
0
50
100
150
200
250
0 50 100 150 200 250 300 350
Day of Year
Flow
(cfs
)
Figure 2-13. Median (orange line) and mean (blue line) daily flows for the USGS Braden River near Lorraine gage for the period of record (1988-2005).
2-18
2.4.3.2 Step Trend in River Flows Kelly (2004) argued, similarly to McCabe and Wolock (2002), that there was a step change in Florida river flow volumes related to climatic change associated with the Atlantic Multidecadal Oscillation (AMO). This is shown graphically for the USGS Peace River at Arcadia FL gage site in Figure 2-14. The upper panel of the figure shows the results of a Kendall's tau regression of mean annual flows at the site versus time for the period 1940 to 1999. The Kendall's tau p-value was 0.0269 with a slope of –8.825 cfs/yr indicating a statistically significant declining trend. However, using 1970 as a break-point and repeating the analysis for the periods from 1940 to 1969 and 1970 to 1999 (periods corresponding to warm and cool-water phases of the AMO) indicated that there were no significant trends for either period. As can be seen in the middle panel of Figure 2-14, there was not a statistically significant trend in mean annual flows for the period 1940 to 1969; p = 0.8028, slope = –1.947. In the lower panel, Kendall's tau regression for the period 1970 to 1999 also showed no significant trend; p = 0.5680, slope = 3.759. A Mann-Whitney U Test for differences between mean annual flows for the two multidecadal time periods indicated that flows at the Arcadia gage site were significantly greater (p=0.0035) during the earlier period (1940 to 1969) as compared to the more recent period (1970 to 1999). Similar results were found for other area rivers and are noted (Tables 2-4 and 2-5), providing evidence for a step change in Peace River flows rather than a monotonic trend as suggested by Hammett (1990). To paraphrase slightly McCabe and Wolock (2002), the identification of an abrupt decrease in peninsular Florida streamflow rather than a gradual decreasing trend is important because the implications of a gradual trend is that the trend is likely to continue into the future whereas the interpretation of a step change is that the climate system has shifted to a new regime that will likely remain relatively constant until a new shift or step change occurs.
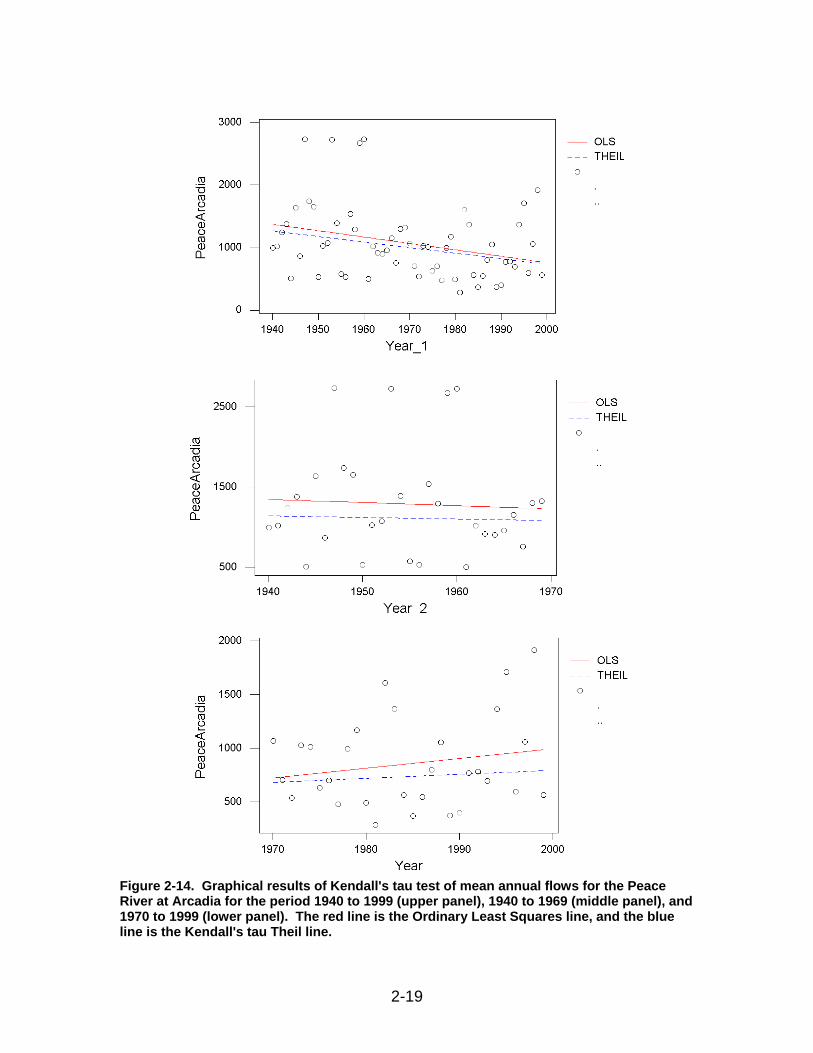
2-19
Figure 2-14. Graphical results of Kendall's tau test of mean annual flows for the Peace River at Arcadia for the period 1940 to 1999 (upper panel), 1940 to 1969 (middle panel), and 1970 to 1999 (lower panel). The red line is the Ordinary Least Squares line, and the blue line is the Kendall's tau Theil line.
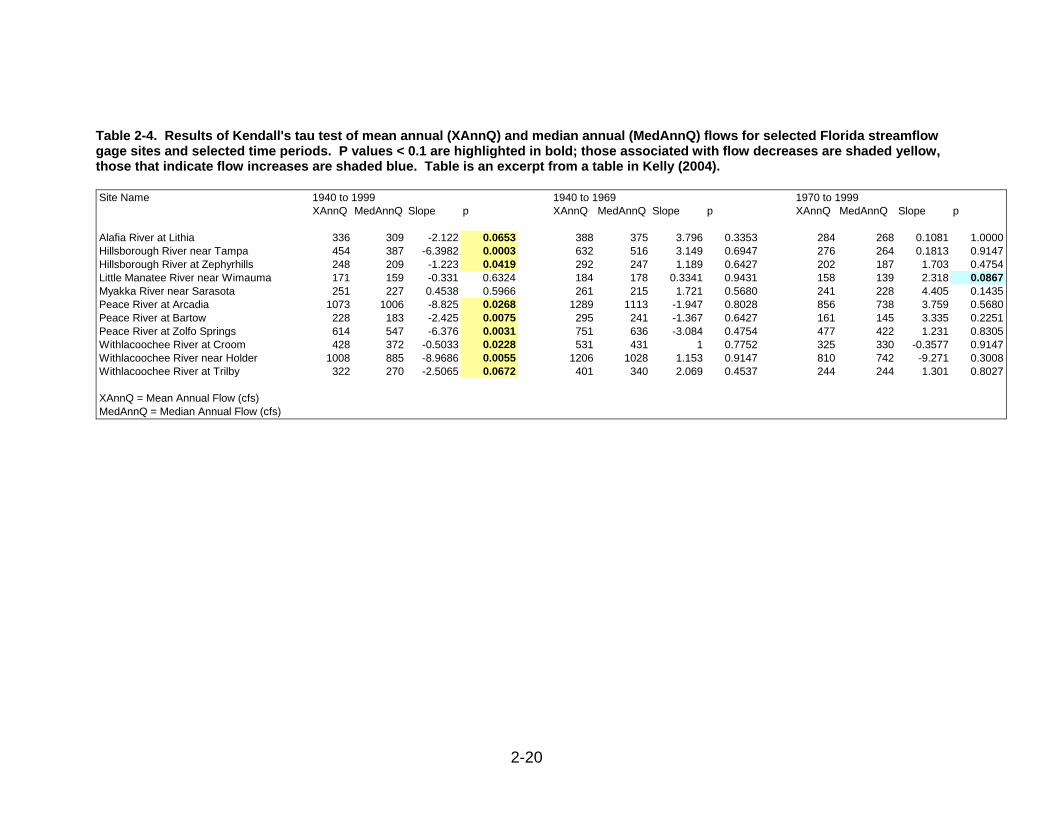
2-20
Table 2-4. Results of Kendall's tau test of mean annual (XAnnQ) and median annual (MedAnnQ) flows for selected Florida streamflow gage sites and selected time periods. P values < 0.1 are highlighted in bold; those associated with flow decreases are shaded yellow, those that indicate flow increases are shaded blue. Table is an excerpt from a table in Kelly (2004).
Site Name 1940 to 1999 1940 to 1969 1970 to 1999 XAnnQ MedAnnQ Slope p XAnnQ MedAnnQ Slope p XAnnQ MedAnnQ Slope p
Alafia River at Lithia 336 309 -2.122 0.0653 388 375 3.796 0.3353 284 268 0.1081 1.0000Hillsborough River near Tampa 454 387 -6.3982 0.0003 632 516 3.149 0.6947 276 264 0.1813 0.9147Hillsborough River at Zephyrhills 248 209 -1.223 0.0419 292 247 1.189 0.6427 202 187 1.703 0.4754Little Manatee River near Wimauma 171 159 -0.331 0.6324 184 178 0.3341 0.9431 158 139 2.318 0.0867Myakka River near Sarasota 251 227 0.4538 0.5966 261 215 1.721 0.5680 241 228 4.405 0.1435Peace River at Arcadia 1073 1006 -8.825 0.0268 1289 1113 -1.947 0.8028 856 738 3.759 0.5680Peace River at Bartow 228 183 -2.425 0.0075 295 241 -1.367 0.6427 161 145 3.335 0.2251Peace River at Zolfo Springs 614 547 -6.376 0.0031 751 636 -3.084 0.4754 477 422 1.231 0.8305Withlacoochee River at Croom 428 372 -0.5033 0.0228 531 431 1 0.7752 325 330 -0.3577 0.9147Withlacoochee River near Holder 1008 885 -8.9686 0.0055 1206 1028 1.153 0.9147 810 742 -9.271 0.3008Withlacoochee River at Trilby 322 270 -2.5065 0.0672 401 340 2.069 0.4537 244 244 1.301 0.8027
XAnnQ = Mean Annual Flow (cfs)MedAnnQ = Median Annual Flow (cfs)
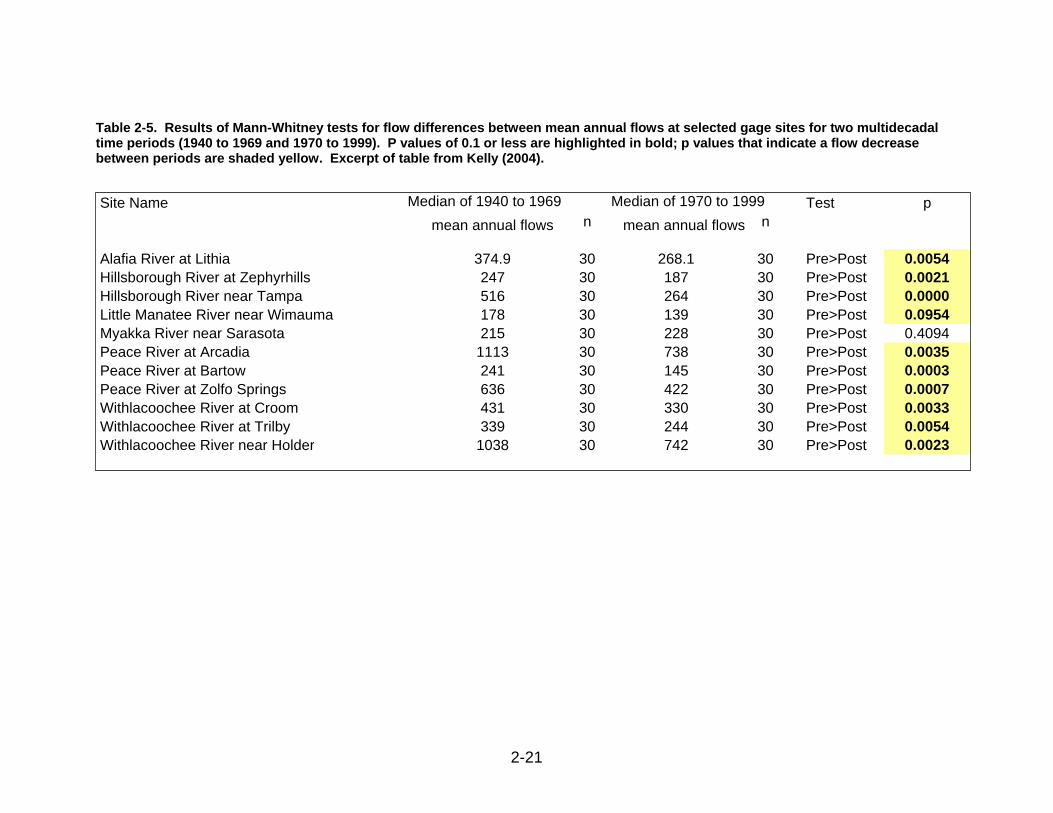
2-21
Table 2-5. Results of Mann-Whitney tests for flow differences between mean annual flows at selected gage sites for two multidecadal time periods (1940 to 1969 and 1970 to 1999). P values of 0.1 or less are highlighted in bold; p values that indicate a flow decrease between periods are shaded yellow. Excerpt of table from Kelly (2004).
Site Name Median of 1940 to 1969 Median of 1970 to 1999 Test pmean annual flows n mean annual flows n
Alafia River at Lithia 374.9 30 268.1 30 Pre>Post 0.0054Hillsborough River at Zephyrhills 247 30 187 30 Pre>Post 0.0021Hillsborough River near Tampa 516 30 264 30 Pre>Post 0.0000Little Manatee River near Wimauma 178 30 139 30 Pre>Post 0.0954Myakka River near Sarasota 215 30 228 30 Pre>Post 0.4094Peace River at Arcadia 1113 30 738 30 Pre>Post 0.0035Peace River at Bartow 241 30 145 30 Pre>Post 0.0003Peace River at Zolfo Springs 636 30 422 30 Pre>Post 0.0007Withlacoochee River at Croom 431 30 330 30 Pre>Post 0.0033Withlacoochee River at Trilby 339 30 244 30 Pre>Post 0.0054Withlacoochee River near Holder 1038 30 742 30 Pre>Post 0.0023
2-22
2.4.4 Benchmark Periods Climate-based differences in flows associated with ocean warming and cooling phases of the AMO and identification of step-trends for Florida river flows suggest that separate benchmark periods should be utilized for evaluating minimum flow criteria. For peninsular Florida, a benchmark period from 1940 through 1969 corresponds to a warm phase of the AMO, and is correlated with a multidecadal period of higher rainfall and increased river flows; the period from 1970 through 1994 corresponds to a cool phase of the AMO, and is correlated with a multidecadal period of lower rainfall and lower river flows. An apparent shift to a warmer AMO phase in the mid-1990s has recently been identified (e.g., see Goldenberg et al. 2001, Sutton and Hodson 2005), suggesting that consideration of at least three benchmark periods may be appropriate for development of minimum flows and levels. Several approaches could be used to develop minimum flows and levels given that high and low flow benchmark periods have been identified. If permitting or allowing consumptive water use is conducted on a fixed-quantity basis (e.g., 50 million gallons per day) a conservative approach for protecting the ecology and aquatic resources of river systems would be to use the drier period as the benchmark period, since this would yield the lowest withdrawal recommendation. This approach would prevent significant harm from withdrawals during the low flow benchmark period, and provide greater protection during the period of higher flows. If, however, permits are issued on a percent-of-flow basis (e.g., 10% of the preceding day's flow is available for use), the most conservative approach would be to base permitting on the benchmark period that produces the lower percent-of-flow reduction associated with the criterion or key resources identified for protection from significant harm. This would allow the recommended percent-of-flow reduction to be used in either benchmark period while affording protection to the key resource(s) during both flow periods. A third option would be to adjust either the fixed quantity or percent-of-flow withdrawal restrictions according to the current AMO period or phase. From a water supply perspective, this would probably be the most desirable approach, since it would allow the maximum amount of water to be withdrawn irrespective of the multidecadal phasing of the AMO. This option, however, would be difficult to apply since there is currently no method for determining when a step change to a new climatic regime has occurred, except in hindsight. Based on the difficulty of determining when a step change in flows has occurred and given that there are several advantages to the "percent-of-flow" approach (e.g., maintenance of the seasonality and distribution of flows in the natural flow regime) over the fixed-quantity approach, we have developed minimum flow criteria that are based on percent-of-flow reductions. Under most circumstances we anticipate that for most rivers, these criteria will be based on the most restrictive flow reductions associated with analyses involving two benchmark
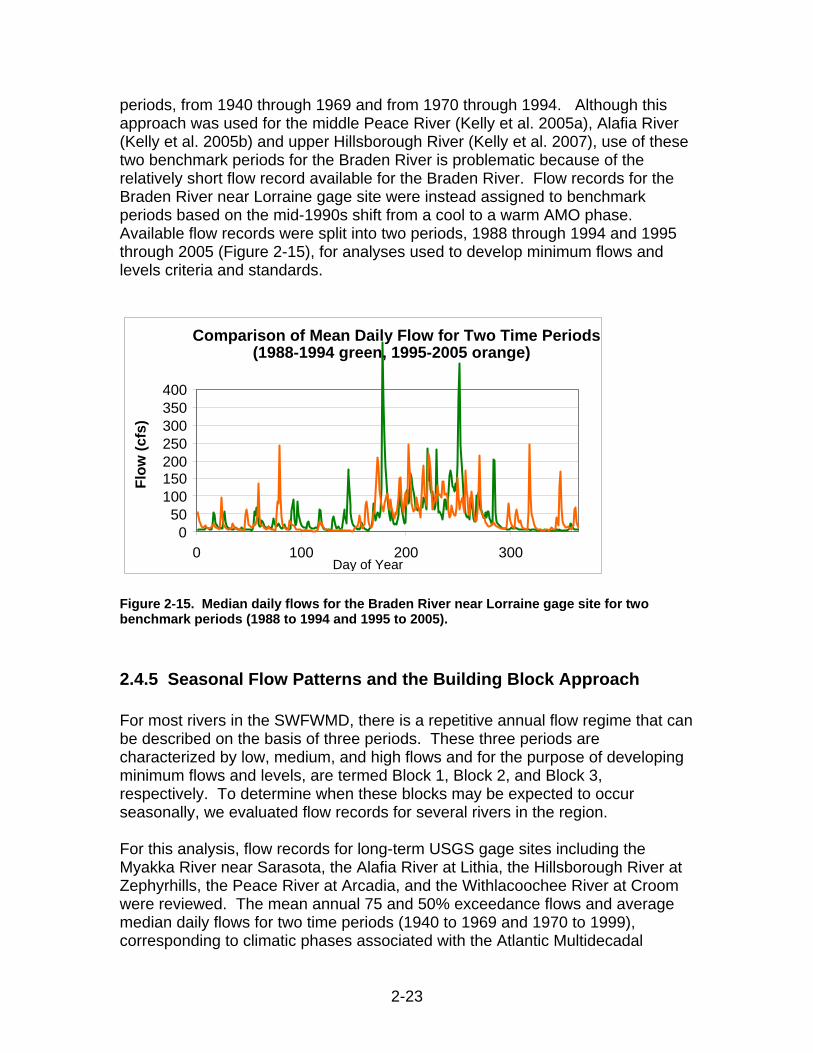
2-23
periods, from 1940 through 1969 and from 1970 through 1994. Although this approach was used for the middle Peace River (Kelly et al. 2005a), Alafia River (Kelly et al. 2005b) and upper Hillsborough River (Kelly et al. 2007), use of these two benchmark periods for the Braden River is problematic because of the relatively short flow record available for the Braden River. Flow records for the Braden River near Lorraine gage site were instead assigned to benchmark periods based on the mid-1990s shift from a cool to a warm AMO phase. Available flow records were split into two periods, 1988 through 1994 and 1995 through 2005 (Figure 2-15), for analyses used to develop minimum flows and levels criteria and standards.
Figure 2-15. Median daily flows for the Braden River near Lorraine gage site for two benchmark periods (1988 to 1994 and 1995 to 2005).
2.4.5 Seasonal Flow Patterns and the Building Block Approach For most rivers in the SWFWMD, there is a repetitive annual flow regime that can be described on the basis of three periods. These three periods are characterized by low, medium, and high flows and for the purpose of developing minimum flows and levels, are termed Block 1, Block 2, and Block 3, respectively. To determine when these blocks may be expected to occur seasonally, we evaluated flow records for several rivers in the region. For this analysis, flow records for long-term USGS gage sites including the Myakka River near Sarasota, the Alafia River at Lithia, the Hillsborough River at Zephyrhills, the Peace River at Arcadia, and the Withlacoochee River at Croom were reviewed. The mean annual 75 and 50% exceedance flows and average median daily flows for two time periods (1940 to 1969 and 1970 to 1999), corresponding to climatic phases associated with the Atlantic Multidecadal
Comparison of Mean Daily Flow for Two Time Periods (1988-1994 green, 1995-2005 orange)
050
100150200250300350400
0 100 200 300
Flow
(cfs
)
Day of Year
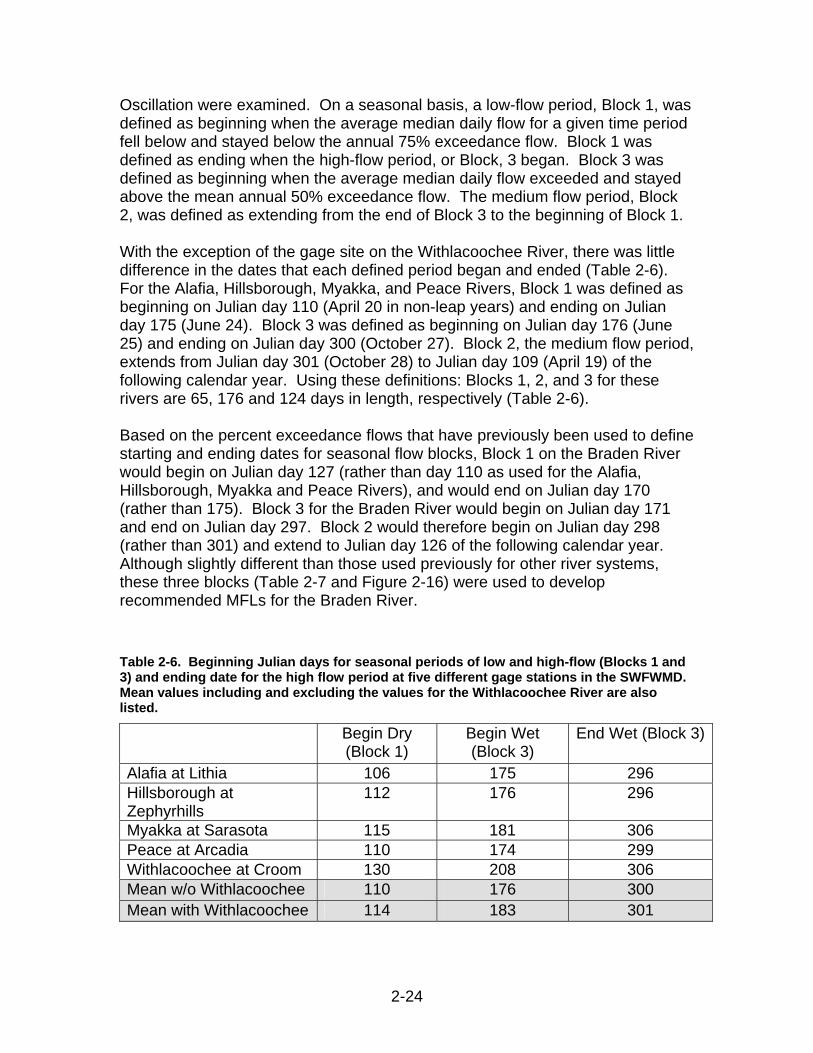
2-24
Oscillation were examined. On a seasonal basis, a low-flow period, Block 1, was defined as beginning when the average median daily flow for a given time period fell below and stayed below the annual 75% exceedance flow. Block 1 was defined as ending when the high-flow period, or Block, 3 began. Block 3 was defined as beginning when the average median daily flow exceeded and stayed above the mean annual 50% exceedance flow. The medium flow period, Block 2, was defined as extending from the end of Block 3 to the beginning of Block 1. With the exception of the gage site on the Withlacoochee River, there was little difference in the dates that each defined period began and ended (Table 2-6). For the Alafia, Hillsborough, Myakka, and Peace Rivers, Block 1 was defined as beginning on Julian day 110 (April 20 in non-leap years) and ending on Julian day 175 (June 24). Block 3 was defined as beginning on Julian day 176 (June 25) and ending on Julian day 300 (October 27). Block 2, the medium flow period, extends from Julian day 301 (October 28) to Julian day 109 (April 19) of the following calendar year. Using these definitions: Blocks 1, 2, and 3 for these rivers are 65, 176 and 124 days in length, respectively (Table 2-6). Based on the percent exceedance flows that have previously been used to define starting and ending dates for seasonal flow blocks, Block 1 on the Braden River would begin on Julian day 127 (rather than day 110 as used for the Alafia, Hillsborough, Myakka and Peace Rivers), and would end on Julian day 170 (rather than 175). Block 3 for the Braden River would begin on Julian day 171 and end on Julian day 297. Block 2 would therefore begin on Julian day 298 (rather than 301) and extend to Julian day 126 of the following calendar year. Although slightly different than those used previously for other river systems, these three blocks (Table 2-7 and Figure 2-16) were used to develop recommended MFLs for the Braden River. Table 2-6. Beginning Julian days for seasonal periods of low and high-flow (Blocks 1 and 3) and ending date for the high flow period at five different gage stations in the SWFWMD. Mean values including and excluding the values for the Withlacoochee River are also listed.
Begin Dry (Block 1)
Begin Wet (Block 3)
End Wet (Block 3)
Alafia at Lithia 106 175 296 Hillsborough at Zephyrhills
112 176 296
Myakka at Sarasota 115 181 306 Peace at Arcadia 110 174 299 Withlacoochee at Croom 130 208 306 Mean w/o Withlacoochee 110 176 300 Mean with Withlacoochee 114 183 301
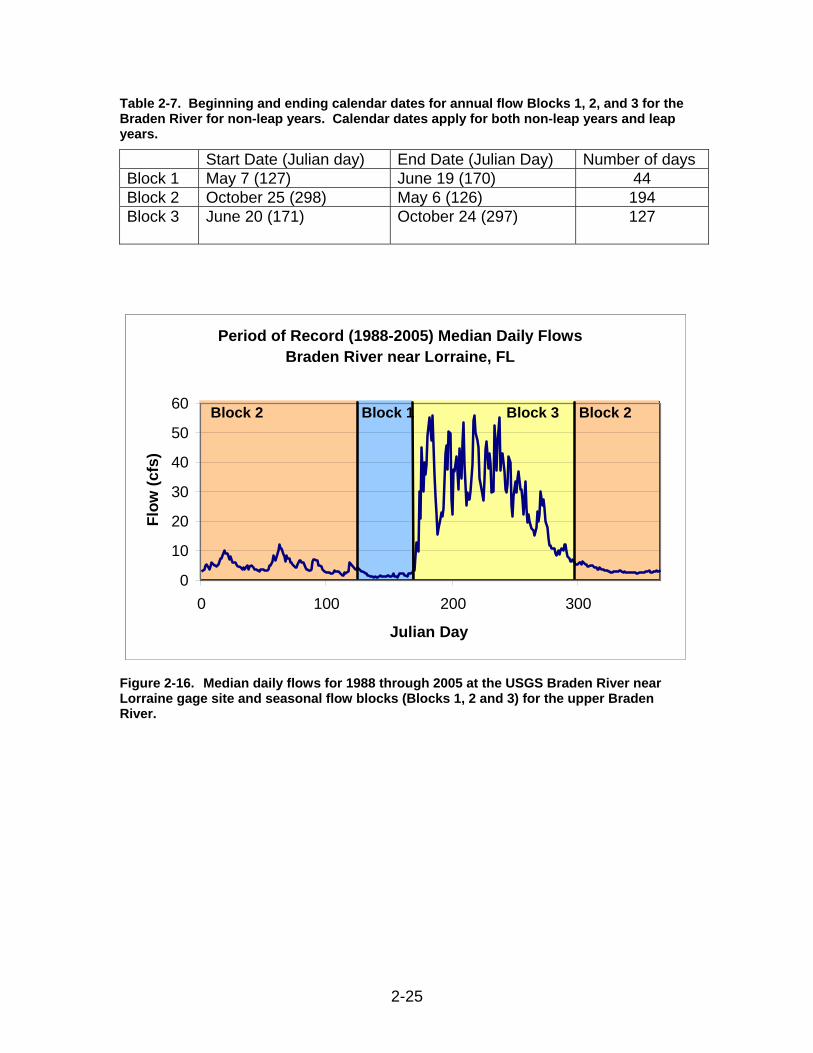
2-25
Table 2-7. Beginning and ending calendar dates for annual flow Blocks 1, 2, and 3 for the Braden River for non-leap years. Calendar dates apply for both non-leap years and leap years.
Start Date (Julian day) End Date (Julian Day) Number of days Block 1 May 7 (127) June 19 (170) 44 Block 2 October 25 (298) May 6 (126) 194 Block 3 June 20 (171) October 24 (297) 127
Period of Record (1988-2005) Median Daily FlowsBraden River near Lorraine, FL
0
10
20
30
40
50
60
0 100 200 300
Julian Day
Flow
(cfs
)
Block 2 Block 2Block 3Block 1
Period of Record (1988-2005) Median Daily FlowsBraden River near Lorraine, FL
0
10
20
30
40
50
60
0 100 200 300
Julian Day
Flow
(cfs
)
Block 2 Block 2Block 3Block 1
Figure 2-16. Median daily flows for 1988 through 2005 at the USGS Braden River near Lorraine gage site and seasonal flow blocks (Blocks 1, 2 and 3) for the upper Braden River.
2-26
Water Chemistry
2.4.6 Water Quality Data Although flow can affect water quality, it is not expected that the adoption and achievement of minimum flows in the upper Braden River will necessarily lead to substantial changes in water quality. However, as part of the MFLs development process, available USGS water quality data for the Braden River were reviewed for identification of potential relationships between flow and water chemistry. For the following analyses, water quality data for the Braden River near Lorraine, FL gage were retrieved from the USGS on-line database. While some data are available on a number of water quality parameters, analysis was restricted to those parameters for which trends have been evaluated on other rivers for which MFLs have been developed. The USGS has long-term flow and water quality data for a number of gage sites throughout the District. Flow records at many sites exceed 50 to 60 years, and some of these have water quality records of 40 years or more. Except for special studies of relatively short duration, water quality at most USGS sites was typically monitored on a quarterly basis at best. Unfortunately, the water quality record for the Braden River is not as extensive as that for many other rivers in the District. Data for each parameter discussed in the following sections of this chapter are typically presented in three plots, including two time-series plot and a plot of the parameter versus flow. Unlike previous studies (e.g., Kelly et al. 2005a, 2005b, and 2007), we have not presented plots of the residuals obtained from a LOWESS regression of the parameter versus flow simply because the flow and water quality record were not sufficient for such an analysis.
2.4.7 Phosphorus Phosphorus has over the years been variously reported by the USGS as total phosphorus, dissolved phosphate, and as ortho-phosphate. For our analyses, it was assumed that dissolved phosphate and ortho-phosphate are essentially equivalent. Although some of the older data were reported as mg/l phosphate, all values were converted and expressed as mg/l phosphorus (P). Friedemann and Hand (1989) determined the typical ranges of various constituents found in Florida lakes, streams and estuaries. Based on their finding, 90% of all Florida streams exhibited total phosphorus concentrations less than 0.87 mg/l P. Although the record is not extensive, phosphorus concentrations in the upper Braden River (Figure 2-17) appear comparable to those observed in the upper Myakka River (see Table 2-8) and do not appear
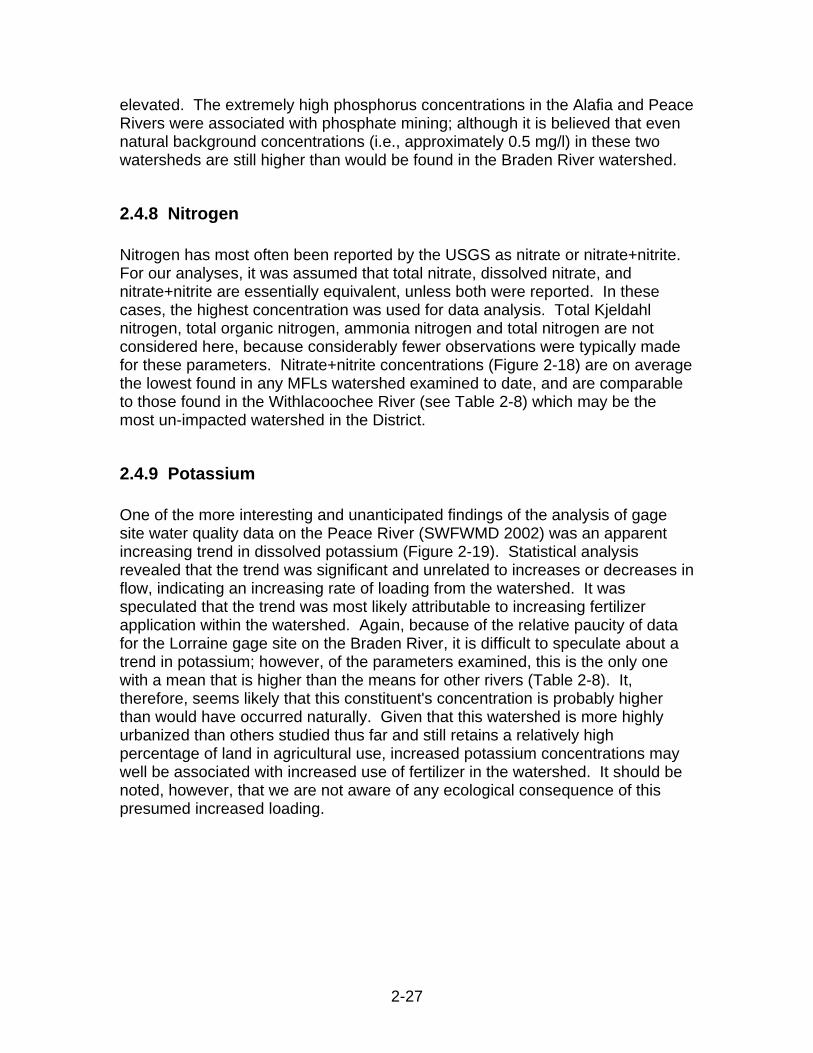
2-27
elevated. The extremely high phosphorus concentrations in the Alafia and Peace Rivers were associated with phosphate mining; although it is believed that even natural background concentrations (i.e., approximately 0.5 mg/l) in these two watersheds are still higher than would be found in the Braden River watershed.
2.4.8 Nitrogen Nitrogen has most often been reported by the USGS as nitrate or nitrate+nitrite. For our analyses, it was assumed that total nitrate, dissolved nitrate, and nitrate+nitrite are essentially equivalent, unless both were reported. In these cases, the highest concentration was used for data analysis. Total Kjeldahl nitrogen, total organic nitrogen, ammonia nitrogen and total nitrogen are not considered here, because considerably fewer observations were typically made for these parameters. Nitrate+nitrite concentrations (Figure 2-18) are on average the lowest found in any MFLs watershed examined to date, and are comparable to those found in the Withlacoochee River (see Table 2-8) which may be the most un-impacted watershed in the District.
2.4.9 Potassium One of the more interesting and unanticipated findings of the analysis of gage site water quality data on the Peace River (SWFWMD 2002) was an apparent increasing trend in dissolved potassium (Figure 2-19). Statistical analysis revealed that the trend was significant and unrelated to increases or decreases in flow, indicating an increasing rate of loading from the watershed. It was speculated that the trend was most likely attributable to increasing fertilizer application within the watershed. Again, because of the relative paucity of data for the Lorraine gage site on the Braden River, it is difficult to speculate about a trend in potassium; however, of the parameters examined, this is the only one with a mean that is higher than the means for other rivers (Table 2-8). It, therefore, seems likely that this constituent's concentration is probably higher than would have occurred naturally. Given that this watershed is more highly urbanized than others studied thus far and still retains a relatively high percentage of land in agricultural use, increased potassium concentrations may well be associated with increased use of fertilizer in the watershed. It should be noted, however, that we are not aware of any ecological consequence of this presumed increased loading.
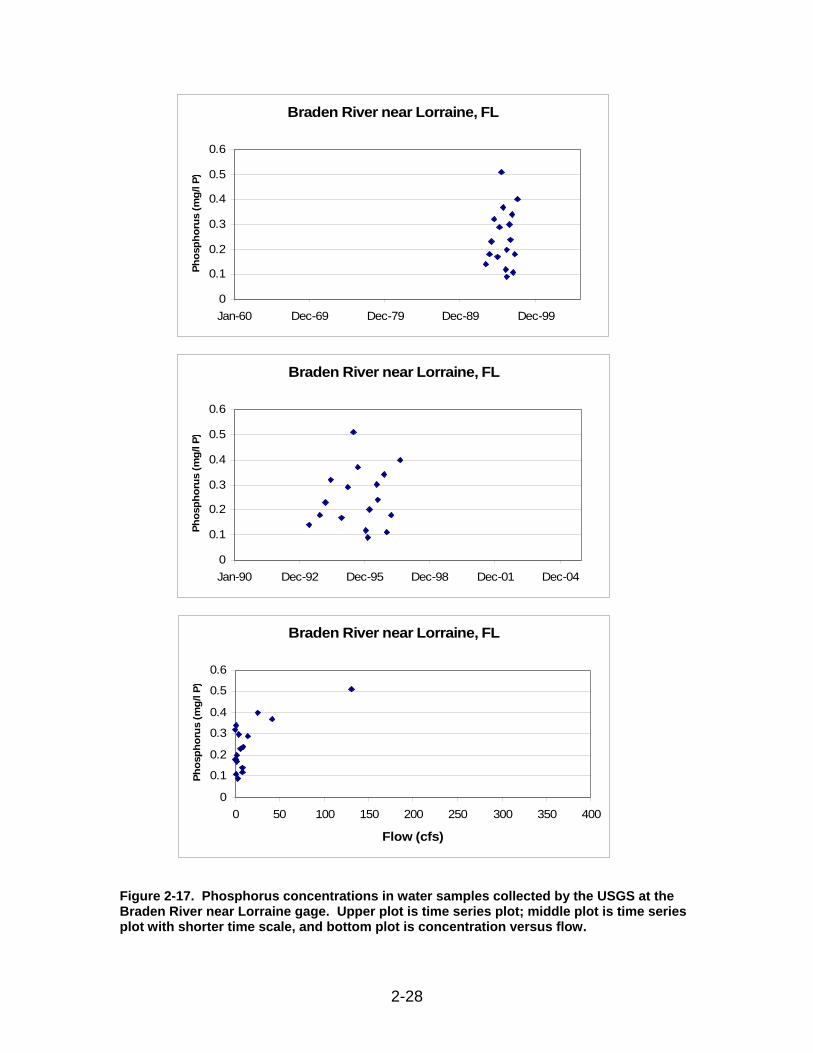
2-28
Figure 2-17. Phosphorus concentrations in water samples collected by the USGS at the Braden River near Lorraine gage. Upper plot is time series plot; middle plot is time series plot with shorter time scale, and bottom plot is concentration versus flow.
Braden River near Lorraine, FL
0
0.1
0.2
0.3
0.4
0.5
0.6
Jan-60 Dec-69 Dec-79 Dec-89 Dec-99
Phos
phor
us (m
g/l P
)
Braden River near Lorraine, FL
0
0.1
0.2
0.3
0.4
0.5
0.6
Jan-90 Dec-92 Dec-95 Dec-98 Dec-01 Dec-04
Phos
phor
us (m
g/l P
)
Braden River near Lorraine, FL
0
0.1
0.2
0.3
0.4
0.5
0.6
0 50 100 150 200 250 300 350 400
Flow (cfs)
Phos
phor
us (m
g/l P
)
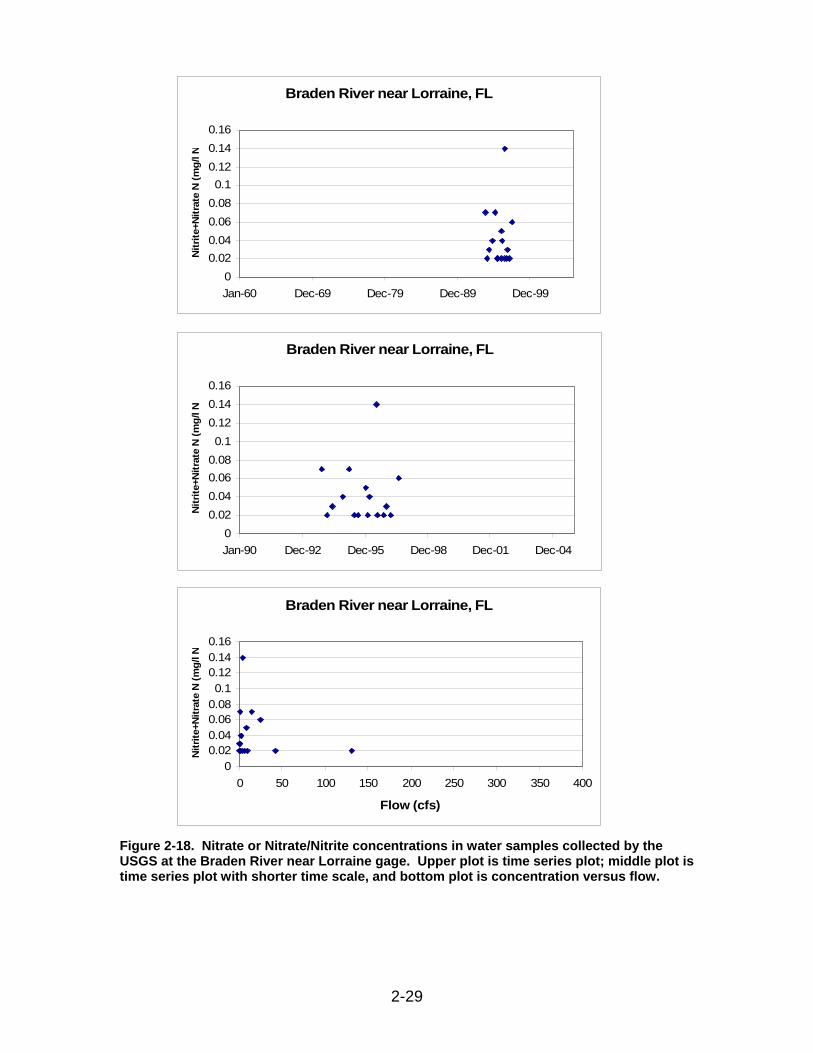
2-29
Figure 2-18. Nitrate or Nitrate/Nitrite concentrations in water samples collected by the USGS at the Braden River near Lorraine gage. Upper plot is time series plot; middle plot is time series plot with shorter time scale, and bottom plot is concentration versus flow.
Braden River near Lorraine, FL
00.020.040.060.080.1
0.120.140.16
Jan-60 Dec-69 Dec-79 Dec-89 Dec-99
Nitr
ite+N
itrat
e N
(mg/
l N
Braden River near Lorraine, FL
00.020.040.060.080.1
0.120.140.16
Jan-90 Dec-92 Dec-95 Dec-98 Dec-01 Dec-04
Nitr
ite+N
itrat
e N
(mg/
l N
Braden River near Lorraine, FL
00.020.040.060.080.1
0.120.140.16
0 50 100 150 200 250 300 350 400
Flow (cfs)
Nitr
ite+N
itrat
e N
(mg/
l N
2-30
Peace River at Arcadia, FL
0
2
4
6
8
10
Jan-50 Jan-60 Jan-70 Jan-80 Jan-90 Feb-00 Feb-10
Pot
assi
um (m
g/l)
Peace River at Arcadia, FL
0
2
4
6
8
10
0 5000 10000 15000 20000
Flow (cfs)
Pot
assi
um (m
g/l)
Potassium Residuals over Time for Peace River at Arcadia, FL
-4-202468
Jan-50 Jan-60 Jan-70 Jan-80 Jan-90 Feb-00Par
amet
er R
esid
uals
(mg/
l)
Figure 2-19. Potassium concentrations in water samples collected by the USGS at the Peace River at Arcadia gage. Upper plot is time series plot; middle plot is concentration versus flow; and the bottom plot is time series plot of residuals of phosphorus concentration regressed against flow.
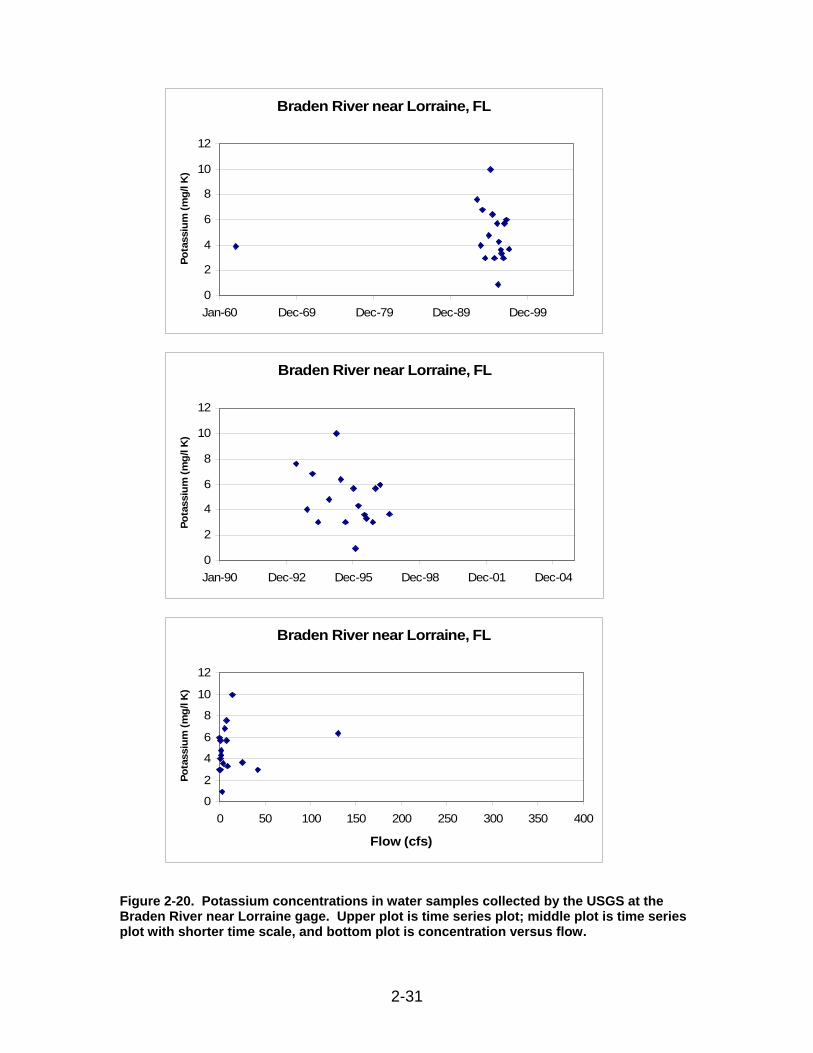
2-31
Figure 2-20. Potassium concentrations in water samples collected by the USGS at the Braden River near Lorraine gage. Upper plot is time series plot; middle plot is time series plot with shorter time scale, and bottom plot is concentration versus flow.
Braden River near Lorraine, FL
0
2
4
6
8
10
12
Jan-60 Dec-69 Dec-79 Dec-89 Dec-99
Pota
ssiu
m (m
g/l K
)
Braden River near Lorraine, FL
0
2
4
6
8
10
12
Jan-90 Dec-92 Dec-95 Dec-98 Dec-01 Dec-04
Pota
ssiu
m (m
g/l K
)
Braden River near Lorraine, FL
0
2
4
6
8
10
12
0 50 100 150 200 250 300 350 400
Flow (cfs)
Pota
ssiu
m (m
g/l K
)
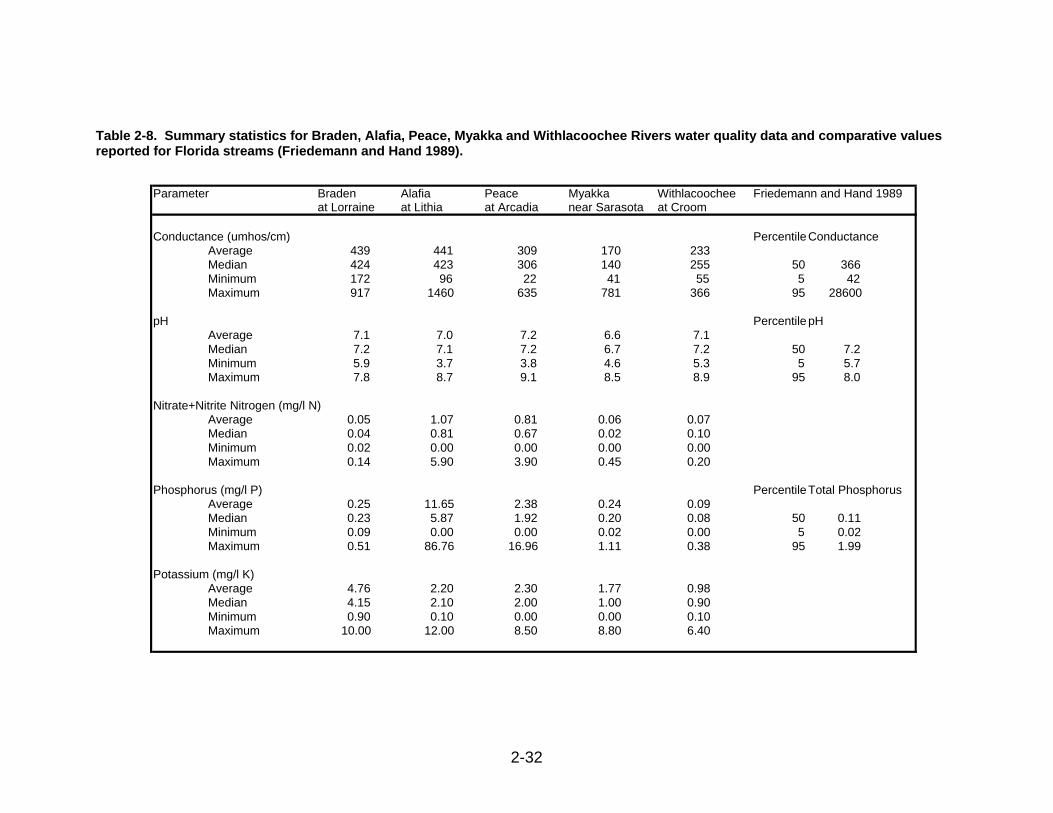
2-32
Table 2-8. Summary statistics for Braden, Alafia, Peace, Myakka and Withlacoochee Rivers water quality data and comparative values reported for Florida streams (Friedemann and Hand 1989).
Parameter Braden Alafia Peace Myakka Withlacoochee Friedemann and Hand 1989
at Lorraine at Lithia at Arcadia near Sarasota at Croom
Conductance (umhos/cm) PercentileConductanceAverage 439 441 309 170 233Median 424 423 306 140 255 50 366Minimum 172 96 22 41 55 5 42Maximum 917 1460 635 781 366 95 28600
pH PercentilepHAverage 7.1 7.0 7.2 6.6 7.1Median 7.2 7.1 7.2 6.7 7.2 50 7.2Minimum 5.9 3.7 3.8 4.6 5.3 5 5.7Maximum 7.8 8.7 9.1 8.5 8.9 95 8.0
Nitrate+Nitrite Nitrogen (mg/l N)Average 0.05 1.07 0.81 0.06 0.07Median 0.04 0.81 0.67 0.02 0.10Minimum 0.02 0.00 0.00 0.00 0.00Maximum 0.14 5.90 3.90 0.45 0.20
Phosphorus (mg/l P) PercentileTotal PhosphorusAverage 0.25 11.65 2.38 0.24 0.09Median 0.23 5.87 1.92 0.20 0.08 50 0.11Minimum 0.09 0.00 0.00 0.02 0.00 5 0.02Maximum 0.51 86.76 16.96 1.11 0.38 95 1.99
Potassium (mg/l K) Average 4.76 2.20 2.30 1.77 0.98Median 4.15 2.10 2.00 1.00 0.90Minimum 0.90 0.10 0.00 0.00 0.10Maximum 10.00 12.00 8.50 8.80 6.40
3-1
Chapter 3 Goals, Ecological Resources of Concern and Key Habitat Indicators
3.1 Goal – Preventing Significant Harm The goal of a MFLs determination is to protect the resource from significant harm due to withdrawals and was broadly defined in the enacting legislation as "the limit at which further withdrawals would be significantly harmful to the water resources or ecology of the area." What constitutes "significant harm" was not defined. The District has identified loss of flows associated with fish passage and maximization of stream bottom habitat with the least amount of flow as significantly harmful to river ecosystems. Also, based upon consideration of a recommendation of the peer review panel for the upper Peace River MFLs (Gore et al. 2002), significant harm in many cases can be defined as quantifiable reductions in habitat. In their peer review report on the upper Peace River, Gore et al. (2002) stated, "[i]n general, instream flow analysts consider a loss of more than 15% habitat, as compared to undisturbed or current conditions, to be a significant impact on that population or assemblage." This recommendation was made in consideration of employing the Physical Habitat Simulation Model (PHABSIM) for analyzing flow, water depth and substrate preferences that define aquatic species habitats. With some exceptions (e.g., loss of fish passage or wetted perimeter inflection point), there are few "bright lines" which can be relied upon to judge when "significant harm" occurs. Rather loss of habitat in many cases occurs incrementally as flows decline, often without a clear inflection point or threshold. Based on Gore et al. (2002) comments regarding significant impacts of habitat loss, we recommend use of a 15% change in habitat availability as a measure of significant harm for the purpose of MFLs development. Although we recommend a 15% change in habitat availability as a measure of unacceptable loss, it is important to note that percentage changes employed for other instream flow determinations have ranged from 10% to 33%. For example, Dunbar et al. (1998), in reference to the use of PHABSIM, noted, "an alternative approach is to select the flow giving 80% habitat exceedance percentile," which is equivalent to a 20% decrease. Jowett (1993) used a guideline of one-third loss (i.e., retention of two-thirds) of existing habitat at naturally occurring low flows, but acknowledged that "[n]o methodology exists for the selection of a percentage loss of "natural" habitat which would be considered acceptable."
3-2
3.2 Resources and Area of Concern The resources addressed by the District's minimum flows and levels analyses include the surface waters and biological communities associated with the river system, including the river channel and its floodplain. A river system is physiographically complex, with a meandering channel and associated floodplain wetlands. This hydrologic and physical setting provides habitat for a diverse array of plant and animal populations. Because "[a]quatic species have evolved life history strategies primarily in direct response to the natural flow regimes" (Bunn and Arthington 2002), a primary objective of minimum flows and levels analysis is to provide for the hydrologic requirements of biological communities associated with the river system. Human uses of the natural resources are also an important consideration for the establishment of minimum flows and levels. Such uses include fishing, swimming, wildlife observation, aesthetic enjoyment, and boating.
3.3 Resource Management Goals and Key Habitat Indicators The District approach for setting minimum flows and levels is habitat-based. Because river systems include a variety of aquatic and wetland habitats that support a diversity of biological communities, it is necessary to identify key habitats for consideration, and, when possible, determine the hydrologic requirements for the specific biotic assemblages associated with the habitats. It is assumed that addressing these management goals will also provide for other ecological functions of the river system that are more difficult to quantify, such as organic matter transport and the maintenance of river channel geomorphology. Resource management goals for the Braden River addressed by our minimum flows analysis include:
1) maintenance of minimum water depths in the river channel for fish passage and recreational use;
2) maintenance of water depths above inflection points in the wetted perimeter of the river channel to maximize aquatic habitat with the least amount of flow;
3) protection of in-channel habitat for selected fish species and macroinvertebrate assemblages;
4) inundation of woody habitats including snags and exposed roots in the stream channel; and
5) maintenance of seasonal hydrologic connections between the river channel and floodplain to ensure persistence of floodplain structure and function.
These goals are consistent with management goals identified by other researchers as discussed in Chapter 1. The rationale for identifying these goals
3-3
and the habitats and ecological indicators associated with the goals are addressed in subsequent sections of this chapter. Field and analytical methods used to assess hydrologic requirements associated with the habitats and indicators are presented in Chapter 4, and results of the minimum flows and levels analyses are presented in Chapter 5.
3.3.1 Fish Passage and Recreational Use Ensuring sufficient flows for the passage or movement of fishes is an important component of the development of minimum flows. Maintenance of these flows is expected to ensure continuous flow within the channel or river segment, allow for recreational navigation (e.g., canoeing), improve aesthetics, and avoid or lessen potential negative effects associated with pool isolation (e.g., high water temperatures, low dissolved oxygen concentrations, localized phytoplankton blooms, and increased predatory pressure resulting from loss of habitat/cover). Tharme and King (1998, as cited by Postel and Richter 2003), in developing a "building block" approach for South African rivers, listed the retention of a river's natural perenniality or nonperenniality as one of eight general principles for managing river flows. For many rivers within the District, flows and corresponding water depths adequate for fish passage are currently or were historically maintained by baseflow during the dry season (Figure 3-1). For example, in the upper Peace River, historical flows were sufficient for maintaining a naturally perennial system and flow was sufficiently high during the low-flow season to permit passage of fish along most of the river segment (SWFWMD 2002). Recent flows in the upper Peace River have not, however, been sufficient for fish passage much of the time. Historic flows in other District rivers, such as the Myakka River were probably intermittent, historically, but have increased in recent years. Evaluation of flows sufficient for fish in support of minimum flows development may, therefore, involve consideration of historic or recent flow conditions with respect to perenniality and the likelihood of fish passage being maintained naturally (i.e., in the absence of consumptive water use).
3.3.2 Wetted Perimeter Inflection Point A useful technique for evaluating the relation between the quantity of stream habitat and the rate of streamflow involves an evaluation of the "wetted perimeter" of the stream bottom. Wetted perimeter is defined as the distance along the stream bed and banks at a cross section where there is contact with water. According to Annear and Conder (1984), wetted perimeter methods for evaluating streamflow requirements assume that there is a direct relationship between wetted perimeter and fish habitat. Studies on streams in the southeast have demonstrated that the greatest amount of macroinvertebrate biomass per unit reach of stream occurs on the stream bottom (e.g., Benke et al. 1985). Although production on a unit area basis may be greater on snag and root
3-4
habitat, the greater area of stream bottom along a reach makes it the most productive habitat under low flow conditions. By plotting the response of wetted perimeter to incremental changes in discharge, an inflection can be identified in the resulting curve where small decreases in flow result in increasingly greater decreases in wetted perimeter. This point on the curve represents a flow at which the water surface recedes from stream banks and fish habitat is lost at an accelerated rate. Stalnaker et al. (1995) describe the wetted perimeter approach as a technique for using "the break" or inflection point in the stream's wetted perimeter versus discharge relation as a surrogate for minimally acceptable habitat. They note that when this approach is applied to riffle (shoal) areas, "the assumption is that minimum flow satisfies the needs for food production, fish passage and spawning." We view the wetted perimeter approach as an important technique for evaluating minimum flows and levels near the low end of the flow regime. The wetted perimeter inflection point in the channel provides for large increases in bottom habitat for relatively small increases of flow. This point is defined as the "lowest wetted perimeter inflection point". It is not assumed that flows associated with the lowest wetted perimeter inflection point meet fish passage needs or address other wetted perimeter inflection points outside the river channel. However, identification of the lowest wetted perimeter inflection point permits evaluation of flows that provide the greatest amount of inundated bottom habitat in the river channel on a per-unit flow basis.
3.3.3 In-Channel Habitats for Fish and Macroinvertebrates Maintenance of flows greater than those allowing for fish passage and maximization of wetted perimeter are needed to provide aquatic biota with sufficient resources for persistence within a river segment. Feeding, reproductive and cover requirements of riverine species have evolved in response to natural flow regimes, and these life history requirements can be used to develop protective minimum flows. To achieve this goal, Physical Habitat Simulation (PHABSIM) protocols are included in the District's approach for establishing minimum flows for river systems. PHABSIM provides a means to quantify changes in habitat that are associated with changes in stream flow. PHABSIM is the single most widely used methodology for establishing "minimum flows" on rivers (Postel and Richter 2003), and its use was recommended in the peer review of proposed MFLs for the upper Peace River (Gore et al. 2002). The technique has, however, been criticized, because it is based on the specific requirements of a few select species (typically fish of economic or recreational value), and it is argued that such an approach ignores many ecosystem components. This criticism is overcome in the current District approach for MFLs development, since PHABSIM represents only one of several tools used to evaluate flow
3-5
requirements. Results of PHABSIM analyses are used to assess flow needs during periods of low to medium flows.
3.3.4 Woody Habitats Stream ecosystem theory emphasizes the role of instream habitats in maintaining ecosystem integrity. These habitats form a mosaic of geomorphically defined substrate patches (Brussock et al. 1985), each with characteristic disturbance regimes and macroinvertebrate assemblages (Huryn and Wallace 1987). For instance, invertebrate community composition and production in a blackwater river varies greatly among different habitat types, where the habitats are distinguished by substrates of different stability (e.g., sand, mud and woody debris) (Benke et al. 1984, Smock et al. 1985, Smock and Roeding 1986). Ecosystem dynamics are influenced by the relative abundance of these different habitat types. Changes in community composition and function occurring along the river continuum are in part a consequence of the relative abundance of different habitat patches, which are under the control of channel geomorphology and flow. For determining MFLs, we identify key habitats and features that play a significant role in the ecology of a river system using a habitat-based approach that includes a combination of best available data and site-specific field work. Among the various instream habitats that can be influenced by different flow conditions, woody habitats (snags and exposed roots) are especially important. In low-gradient streams of the southeastern U.S.A. coastal plain, wood is recognized as important habitat (Cudney and Wallace 1980; Benke et al. 1984, Wallace and Benke 1984; Thorp et al. 1990; Benke and Wallace 1990). Wood habitats harbor the most biologically diverse instream fauna and are the most productive habitat on a per unit area basis (Benke et al. 1985). Comparisons of different instream habitats in a southeastern stream indicates that production on snags is at least twice as high as that found in any other habitat (Smock et al. 1985). Wood provides advantages as habitat, as it is relatively stable and long lived compared to sand substrata, which constantly shift (Edwards and Meyer 1987). Even bedrock substrates, though the most stable of all, are susceptible to smothering by shifting sand and silt. Wood is a complex structural habitat with microhabitats (such as interstices that increase surface area) that provide cover for a variety of invertebrates. As an organic substrate, wood is also a food resource for utilization by microbial food chains, which in turn supports colonization and production of macroinvertebrates. As physical impediments to flow, woody structures enhance the formation of leaf packs and larger debris dams. These resulting habitats provide the same functions as woody substrata in addition to enhancing habitat diversity instream. Organisms in higher trophic
3-6
levels such as fish have been shown to also depend on woody structures either for cover, as feeding grounds, or as nesting areas. Since woody habitats are potentially the most important instream habitat for macroinvertebrate production, inundation of these habitats for sufficient periods is considered critical to secondary production (including fish and other wildlife) and the maintenance of aquatic food webs. Not only is inundation considered important, but sustained inundation prior to colonization by invertebrates is necessary to allow for microbial conditioning and periphyton development. Without this preconditioning, the habitat offered by snags and wood is essentially a substrate for attachment without associated food resources. The development of food resources (microbes) on the substrate is needed by the assemblage of macroinvertebrates that typically inhabit these surfaces. After the proper conditioning period, continuous inundation is required for many species to complete development. The inundated woody substrate (both snags and exposed roots) within the stream channel is viewed as an important riverine habitat and it is assumed that withdrawals or diversions of river flow could significantly decrease the availability of this habitat under medium to high flow conditions.
3.3.5 Hydrologic Connections Between the River Channel and Floodplain A goal of the District's minimum flows and levels approach is to ensure that the hydrologic requirements of biological communities associated with the river floodplain are met during seasonally predictable wet periods. Periodic inundation of riparian floodplains by high flows is closely linked with the overall biological productivity of river ecosystems (Crance 1988, Junk et al., 1989). Many fish and wildlife species associated with rivers utilize both instream and floodplain habitats, and inundation of the river floodplains greatly expands the habitat and food resources available to these organisms (Wharton et al. 1982, Ainsle et al. 1999, Hill and Cichra 2002). Inundation during high flows also provides a subsidy of water and nutrients that supports high rates of primary production in river floodplains (Conner and Day 1979, Brinson et al. 1981). This primary production yields large amounts of organic detritus, which is critical to food webs on the floodplain and within the river channel (Vannote et al. 1980, Gregory et al. 1991). Floodplain inundation also contributes to other physical-chemical processes that can affect biological production, uptake and transformation of macro-nutrients (Kuensler 1989, Walbridge and Lockaby 1994). Soils in river floodplains exhibit physical and chemical properties that are important to the overall function of the river ecosystem (Wharton et al. 1982, Stanturf and Schenholtz 1998). Anaerobic soil conditions can persist in areas where river flooding or soil saturation is of sufficient depth and duration. The decomposition of organic matter is much slower in anaerobic environments, and
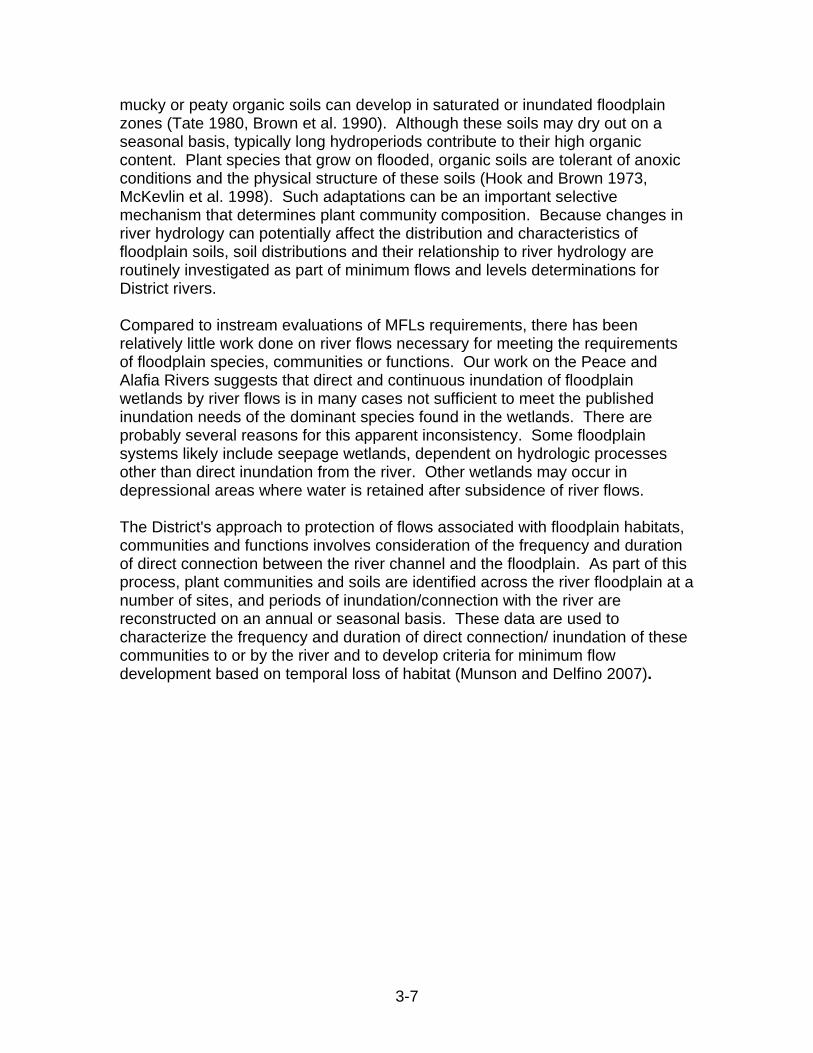
3-7
mucky or peaty organic soils can develop in saturated or inundated floodplain zones (Tate 1980, Brown et al. 1990). Although these soils may dry out on a seasonal basis, typically long hydroperiods contribute to their high organic content. Plant species that grow on flooded, organic soils are tolerant of anoxic conditions and the physical structure of these soils (Hook and Brown 1973, McKevlin et al. 1998). Such adaptations can be an important selective mechanism that determines plant community composition. Because changes in river hydrology can potentially affect the distribution and characteristics of floodplain soils, soil distributions and their relationship to river hydrology are routinely investigated as part of minimum flows and levels determinations for District rivers. Compared to instream evaluations of MFLs requirements, there has been relatively little work done on river flows necessary for meeting the requirements of floodplain species, communities or functions. Our work on the Peace and Alafia Rivers suggests that direct and continuous inundation of floodplain wetlands by river flows is in many cases not sufficient to meet the published inundation needs of the dominant species found in the wetlands. There are probably several reasons for this apparent inconsistency. Some floodplain systems likely include seepage wetlands, dependent on hydrologic processes other than direct inundation from the river. Other wetlands may occur in depressional areas where water is retained after subsidence of river flows. The District's approach to protection of flows associated with floodplain habitats, communities and functions involves consideration of the frequency and duration of direct connection between the river channel and the floodplain. As part of this process, plant communities and soils are identified across the river floodplain at a number of sites, and periods of inundation/connection with the river are reconstructed on an annual or seasonal basis. These data are used to characterize the frequency and duration of direct connection/ inundation of these communities to or by the river and to develop criteria for minimum flow development based on temporal loss of habitat (Munson and Delfino 2007).
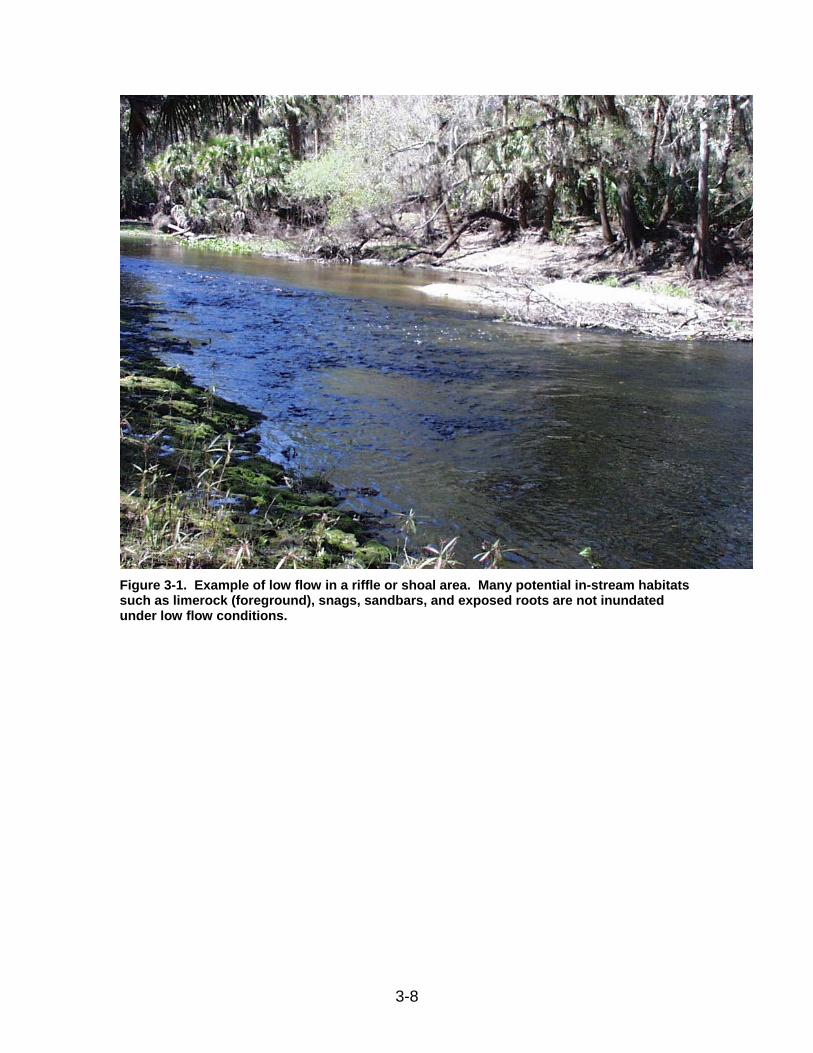
3-8
Figure 3-1. Example of low flow in a riffle or shoal area. Many potential in-stream habitats such as limerock (foreground), snags, sandbars, and exposed roots are not inundated under low flow conditions.
4-1
Chapter 4 Technical Approach for Establishing Minimum Flows and Levels for the Upper Braden River
4.1 Overview A number of methods were used to determine the minimum flow requirements for the upper, fresh water segment of the Braden River. The approach outlined for the river involves identification of a low flow threshold and development of prescribed flow reductions for periods of low, medium and high flows (Blocks 1, 2 and 3). The low flow threshold is used to identify a minimum flow condition and is expected to be applicable to river flows throughout the year. The prescribed flow reductions are based on limiting potential changes in aquatic and wetland habitat availability that may be associated with changes in river flow during Blocks 1, 2 and 3.
4.2 Transect Locations and Field Sampling of Instream and Floodplain Habitats The Braden River is the largest tributary to the Manatee River (Trommer et al. 1999) and is a source of freshwater supply for the City of Bradenton, Florida. The river flows for approximately 22 miles in south-central Manatee County and northern Sarasota County to the Manatee River and includes an 83 square mile watershed. The river segment delineated for MFLs determination was confined to areas upstream of the USGS Braden River at Linger Lodge near Bradenton gage site, which is located approximately 0.5 miles east of Interstate 75. This river segment includes 8.6 miles of relatively straight, naturally incised channel that drains 26 square miles of headwaters that are unaffected by backwater effects from Bill Evers Reservoir (Figure 4-1). Bill Evers Reservoir was created in 1985 through excavation of Ward Lake to increase storage capacity in the basin to 1.4 billion gallons of water. Permanent backwater conditions extend upstream from the reservoir dam for approximately six miles and the lower reaches of its tributaries are also affected. Field sampling in support of MFLs development for the upper Braden River involved characterization of cross-sectional physical, hydrologic and habitat features. Four types of cross-sectional information were collected, including data used for HEC-RAS modeling, Physical Habitat Simulation (PHABSIM) modeling, instream habitat assessment, and floodplain vegetation/soils assessments. HEC-RAS cross-sections were established to develop flow and inundation statistics for the other cross-section sites based on existing flow records for the
4-2
USGS Braden River near Lorraine gage site which is located near Lorraine Road.
Figure 4-1. Braden River watershed and location of USGS streamflow gaging stations. The USGS Braden River at Linger Lodge near Bradenton FL gage represented the most downstream extent of the MFLs study area.
4.2.1 HEC-RAS Cross-Sections Cross-section channel geometry data used to generate a HEC-RAS model for the upper Braden River were developed from 15 transects that included the river channel and floodplain (Figures 4-2 and 4-3). Transect elevation data relative to the National Geodetic Vertical Datum of 1929 were obtained by District surveyors, and were subsequently converted to elevations relative to the North American Vertical Datum of 1988 based on conversion factors obtained from USGS. Further refinement of the HEC-RAS model included the use of additional channel elevation data (relative to the North American Vertical Datum of 1988) derived from airborne LiDAR mapping data of the watershed (see discussion in Modeling Approaches below). All or some of the 15 HEC-RAS transect sites were also used as locations for data collection in support of PHABSIM analyses, instream habitat evaluations, and for floodplain vegetation/soils characterization.
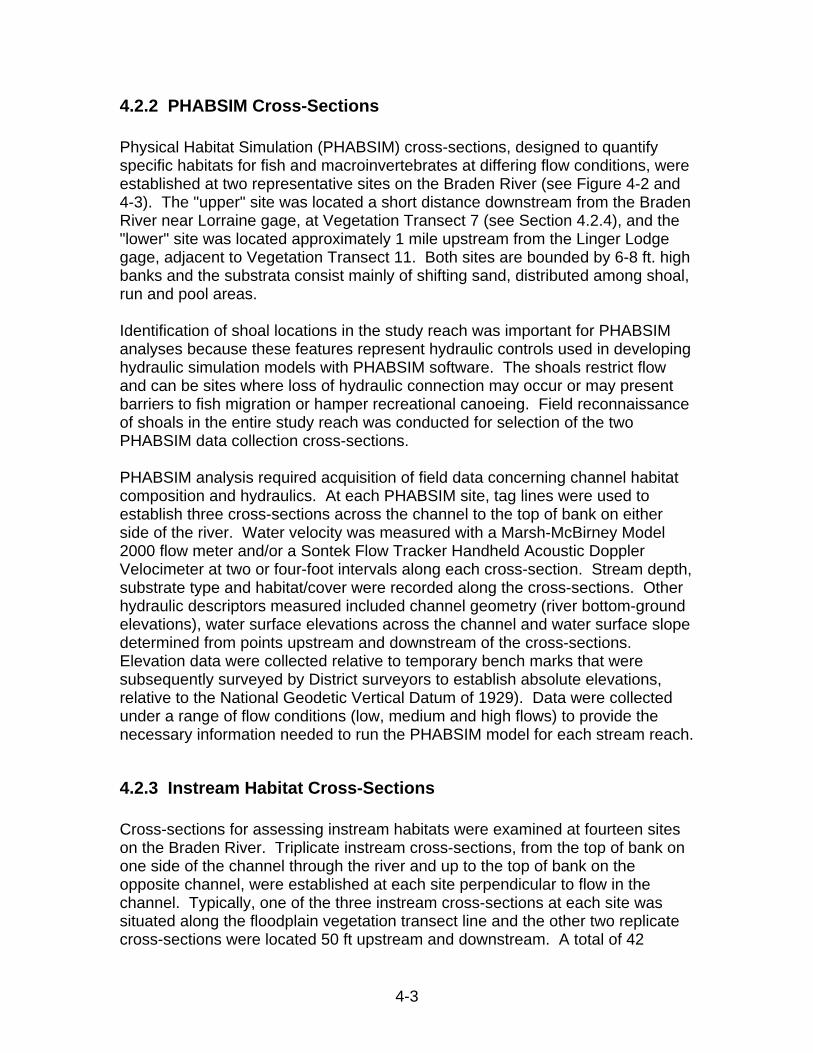
4-3
4.2.2 PHABSIM Cross-Sections Physical Habitat Simulation (PHABSIM) cross-sections, designed to quantify specific habitats for fish and macroinvertebrates at differing flow conditions, were established at two representative sites on the Braden River (see Figure 4-2 and 4-3). The "upper" site was located a short distance downstream from the Braden River near Lorraine gage, at Vegetation Transect 7 (see Section 4.2.4), and the "lower" site was located approximately 1 mile upstream from the Linger Lodge gage, adjacent to Vegetation Transect 11. Both sites are bounded by 6-8 ft. high banks and the substrata consist mainly of shifting sand, distributed among shoal, run and pool areas. Identification of shoal locations in the study reach was important for PHABSIM analyses because these features represent hydraulic controls used in developing hydraulic simulation models with PHABSIM software. The shoals restrict flow and can be sites where loss of hydraulic connection may occur or may present barriers to fish migration or hamper recreational canoeing. Field reconnaissance of shoals in the entire study reach was conducted for selection of the two PHABSIM data collection cross-sections. PHABSIM analysis required acquisition of field data concerning channel habitat composition and hydraulics. At each PHABSIM site, tag lines were used to establish three cross-sections across the channel to the top of bank on either side of the river. Water velocity was measured with a Marsh-McBirney Model 2000 flow meter and/or a Sontek Flow Tracker Handheld Acoustic Doppler Velocimeter at two or four-foot intervals along each cross-section. Stream depth, substrate type and habitat/cover were recorded along the cross-sections. Other hydraulic descriptors measured included channel geometry (river bottom-ground elevations), water surface elevations across the channel and water surface slope determined from points upstream and downstream of the cross-sections. Elevation data were collected relative to temporary bench marks that were subsequently surveyed by District surveyors to establish absolute elevations, relative to the National Geodetic Vertical Datum of 1929). Data were collected under a range of flow conditions (low, medium and high flows) to provide the necessary information needed to run the PHABSIM model for each stream reach.
4.2.3 Instream Habitat Cross-Sections Cross-sections for assessing instream habitats were examined at fourteen sites on the Braden River. Triplicate instream cross-sections, from the top of bank on one side of the channel through the river and up to the top of bank on the opposite channel, were established at each site perpendicular to flow in the channel. Typically, one of the three instream cross-sections at each site was situated along the floodplain vegetation transect line and the other two replicate cross-sections were located 50 ft upstream and downstream. A total of 42
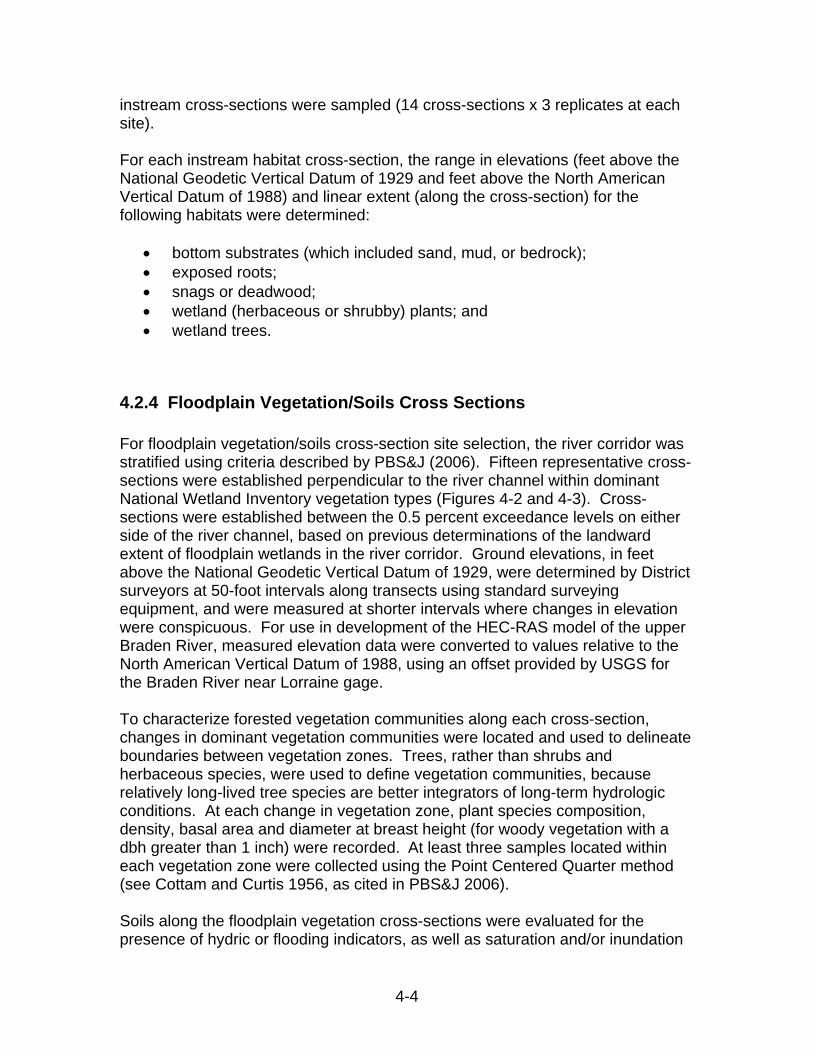
4-4
instream cross-sections were sampled (14 cross-sections x 3 replicates at each site). For each instream habitat cross-section, the range in elevations (feet above the National Geodetic Vertical Datum of 1929 and feet above the North American Vertical Datum of 1988) and linear extent (along the cross-section) for the following habitats were determined:
• bottom substrates (which included sand, mud, or bedrock); • exposed roots; • snags or deadwood; • wetland (herbaceous or shrubby) plants; and • wetland trees.
4.2.4 Floodplain Vegetation/Soils Cross Sections For floodplain vegetation/soils cross-section site selection, the river corridor was stratified using criteria described by PBS&J (2006). Fifteen representative cross-sections were established perpendicular to the river channel within dominant National Wetland Inventory vegetation types (Figures 4-2 and 4-3). Cross-sections were established between the 0.5 percent exceedance levels on either side of the river channel, based on previous determinations of the landward extent of floodplain wetlands in the river corridor. Ground elevations, in feet above the National Geodetic Vertical Datum of 1929, were determined by District surveyors at 50-foot intervals along transects using standard surveying equipment, and were measured at shorter intervals where changes in elevation were conspicuous. For use in development of the HEC-RAS model of the upper Braden River, measured elevation data were converted to values relative to the North American Vertical Datum of 1988, using an offset provided by USGS for the Braden River near Lorraine gage. To characterize forested vegetation communities along each cross-section, changes in dominant vegetation communities were located and used to delineate boundaries between vegetation zones. Trees, rather than shrubs and herbaceous species, were used to define vegetation communities, because relatively long-lived tree species are better integrators of long-term hydrologic conditions. At each change in vegetation zone, plant species composition, density, basal area and diameter at breast height (for woody vegetation with a dbh greater than 1 inch) were recorded. At least three samples located within each vegetation zone were collected using the Point Centered Quarter method (see Cottam and Curtis 1956, as cited in PBS&J 2006). Soils along the floodplain vegetation cross-sections were evaluated for the presence of hydric or flooding indicators, as well as saturation and/or inundation
4-5
condition. At least three soil cores were examined to a minimum depth of 20 inches within each vegetation zone at each cross section. Soils were classified as upland (non-hydric), hydric or non-hydric with the presence of flooding indicators. Special consideration was placed on locating elevations of the upper and lower extent of muck soils (> 12 inches in thickness) at cross-sections where they occurred. Key physical indicators of historic inundation were identified, including: cypress buttress inflection elevations; cypress knees; lichen and/or moss lines; hypertrophied lenticels; stain lines; and scarps. The number of physical indicators of historic inundation varied by transect, depending on availability and reproducibility. Ground elevation data were used to compare vegetation and soils within and among cross-sections. For some comparisons, vegetation elevations were normalized to the lowest channel elevations at the cross-section to account for differences in absolute elevations among the cross-sections. Wetted perimeter was calculated for vegetation classes in the study corridor to evaluate the potential change in inundated habitat that may be anticipated due to changes in river stage. The wetted perimeter for a vegetation class is the linear distance inundated along a transect, below a particular elevation or water level (river stage). Consequently, as distance from the river channel increases, the total wetted perimeter also increases, but can vary among vegetation classes. The HEC-RAS floodplain model (see Section 4.2.1) was used to determine corresponding flows at the Braden River near Lorraine gage that would be necessary to inundate specific floodplain elevations (e.g., median vegetation zone and soils elevations).
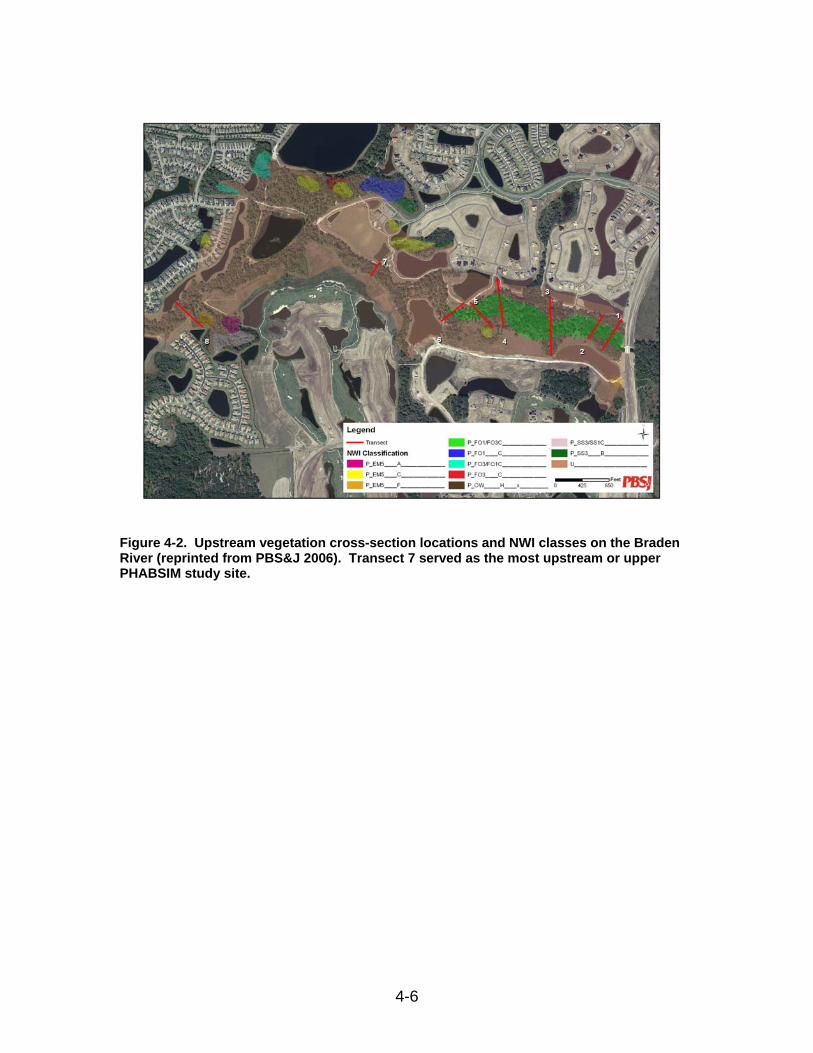
4-6
Figure 4-2. Upstream vegetation cross-section locations and NWI classes on the Braden River (reprinted from PBS&J 2006). Transect 7 served as the most upstream or upper PHABSIM study site.
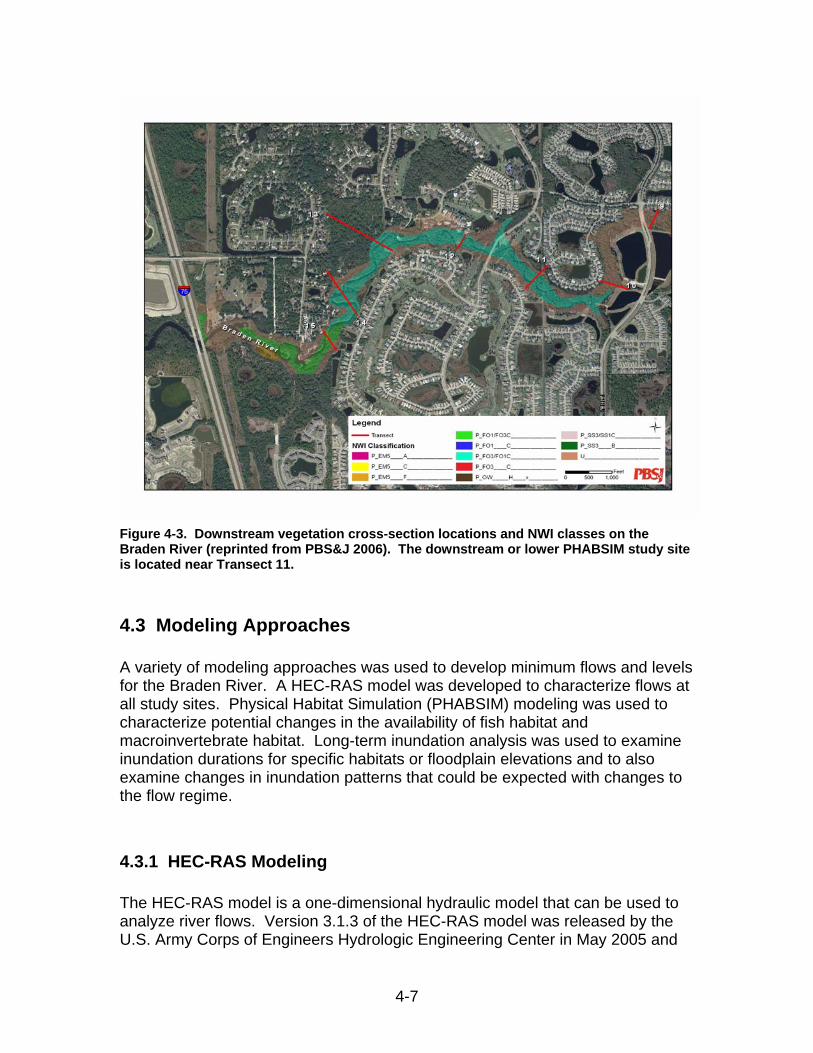
4-7
Figure 4-3. Downstream vegetation cross-section locations and NWI classes on the Braden River (reprinted from PBS&J 2006). The downstream or lower PHABSIM study site is located near Transect 11.
4.3 Modeling Approaches A variety of modeling approaches was used to develop minimum flows and levels for the Braden River. A HEC-RAS model was developed to characterize flows at all study sites. Physical Habitat Simulation (PHABSIM) modeling was used to characterize potential changes in the availability of fish habitat and macroinvertebrate habitat. Long-term inundation analysis was used to examine inundation durations for specific habitats or floodplain elevations and to also examine changes in inundation patterns that could be expected with changes to the flow regime.
4.3.1 HEC-RAS Modeling The HEC-RAS model is a one-dimensional hydraulic model that can be used to analyze river flows. Version 3.1.3 of the HEC-RAS model was released by the U.S. Army Corps of Engineers Hydrologic Engineering Center in May 2005 and
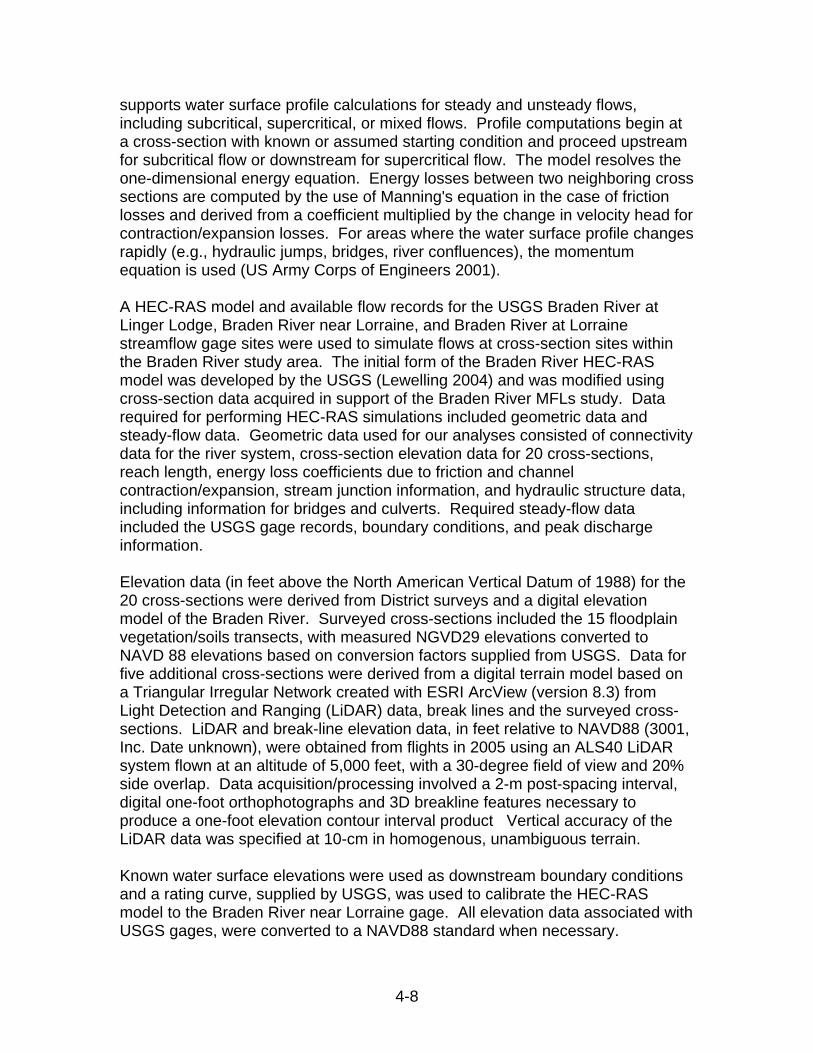
4-8
supports water surface profile calculations for steady and unsteady flows, including subcritical, supercritical, or mixed flows. Profile computations begin at a cross-section with known or assumed starting condition and proceed upstream for subcritical flow or downstream for supercritical flow. The model resolves the one-dimensional energy equation. Energy losses between two neighboring cross sections are computed by the use of Manning's equation in the case of friction losses and derived from a coefficient multiplied by the change in velocity head for contraction/expansion losses. For areas where the water surface profile changes rapidly (e.g., hydraulic jumps, bridges, river confluences), the momentum equation is used (US Army Corps of Engineers 2001). A HEC-RAS model and available flow records for the USGS Braden River at Linger Lodge, Braden River near Lorraine, and Braden River at Lorraine streamflow gage sites were used to simulate flows at cross-section sites within the Braden River study area. The initial form of the Braden River HEC-RAS model was developed by the USGS (Lewelling 2004) and was modified using cross-section data acquired in support of the Braden River MFLs study. Data required for performing HEC-RAS simulations included geometric data and steady-flow data. Geometric data used for our analyses consisted of connectivity data for the river system, cross-section elevation data for 20 cross-sections, reach length, energy loss coefficients due to friction and channel contraction/expansion, stream junction information, and hydraulic structure data, including information for bridges and culverts. Required steady-flow data included the USGS gage records, boundary conditions, and peak discharge information. Elevation data (in feet above the North American Vertical Datum of 1988) for the 20 cross-sections were derived from District surveys and a digital elevation model of the Braden River. Surveyed cross-sections included the 15 floodplain vegetation/soils transects, with measured NGVD29 elevations converted to NAVD 88 elevations based on conversion factors supplied from USGS. Data for five additional cross-sections were derived from a digital terrain model based on a Triangular Irregular Network created with ESRI ArcView (version 8.3) from Light Detection and Ranging (LiDAR) data, break lines and the surveyed cross-sections. LiDAR and break-line elevation data, in feet relative to NAVD88 (3001, Inc. Date unknown), were obtained from flights in 2005 using an ALS40 LiDAR system flown at an altitude of 5,000 feet, with a 30-degree field of view and 20% side overlap. Data acquisition/processing involved a 2-m post-spacing interval, digital one-foot orthophotographs and 3D breakline features necessary to produce a one-foot elevation contour interval product Vertical accuracy of the LiDAR data was specified at 10-cm in homogenous, unambiguous terrain. Known water surface elevations were used as downstream boundary conditions and a rating curve, supplied by USGS, was used to calibrate the HEC-RAS model to the Braden River near Lorraine gage. All elevation data associated with USGS gages, were converted to a NAVD88 standard when necessary.
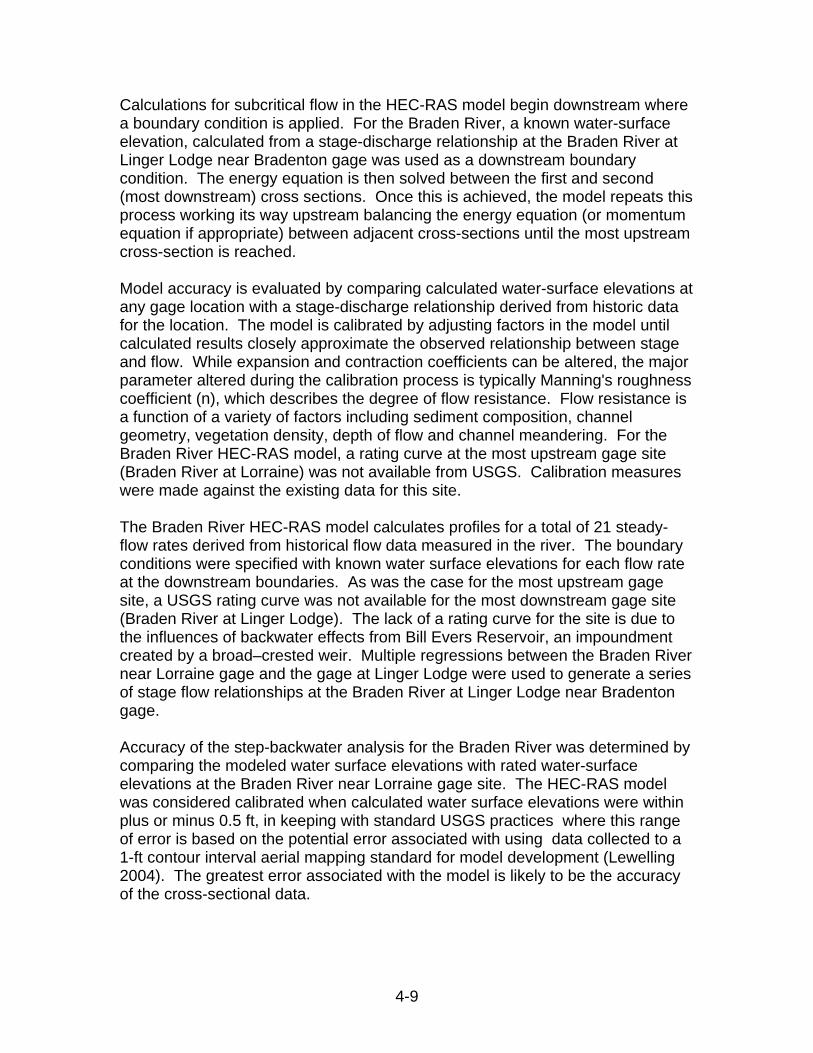
4-9
Calculations for subcritical flow in the HEC-RAS model begin downstream where a boundary condition is applied. For the Braden River, a known water-surface elevation, calculated from a stage-discharge relationship at the Braden River at Linger Lodge near Bradenton gage was used as a downstream boundary condition. The energy equation is then solved between the first and second (most downstream) cross sections. Once this is achieved, the model repeats this process working its way upstream balancing the energy equation (or momentum equation if appropriate) between adjacent cross-sections until the most upstream cross-section is reached. Model accuracy is evaluated by comparing calculated water-surface elevations at any gage location with a stage-discharge relationship derived from historic data for the location. The model is calibrated by adjusting factors in the model until calculated results closely approximate the observed relationship between stage and flow. While expansion and contraction coefficients can be altered, the major parameter altered during the calibration process is typically Manning's roughness coefficient (n), which describes the degree of flow resistance. Flow resistance is a function of a variety of factors including sediment composition, channel geometry, vegetation density, depth of flow and channel meandering. For the Braden River HEC-RAS model, a rating curve at the most upstream gage site (Braden River at Lorraine) was not available from USGS. Calibration measures were made against the existing data for this site. The Braden River HEC-RAS model calculates profiles for a total of 21 steady-flow rates derived from historical flow data measured in the river. The boundary conditions were specified with known water surface elevations for each flow rate at the downstream boundaries. As was the case for the most upstream gage site, a USGS rating curve was not available for the most downstream gage site (Braden River at Linger Lodge). The lack of a rating curve for the site is due to the influences of backwater effects from Bill Evers Reservoir, an impoundment created by a broad–crested weir. Multiple regressions between the Braden River near Lorraine gage and the gage at Linger Lodge were used to generate a series of stage flow relationships at the Braden River at Linger Lodge near Bradenton gage. Accuracy of the step-backwater analysis for the Braden River was determined by comparing the modeled water surface elevations with rated water-surface elevations at the Braden River near Lorraine gage site. The HEC-RAS model was considered calibrated when calculated water surface elevations were within plus or minus 0.5 ft, in keeping with standard USGS practices where this range of error is based on the potential error associated with using data collected to a 1-ft contour interval aerial mapping standard for model development (Lewelling 2004). The greatest error associated with the model is likely to be the accuracy of the cross-sectional data.
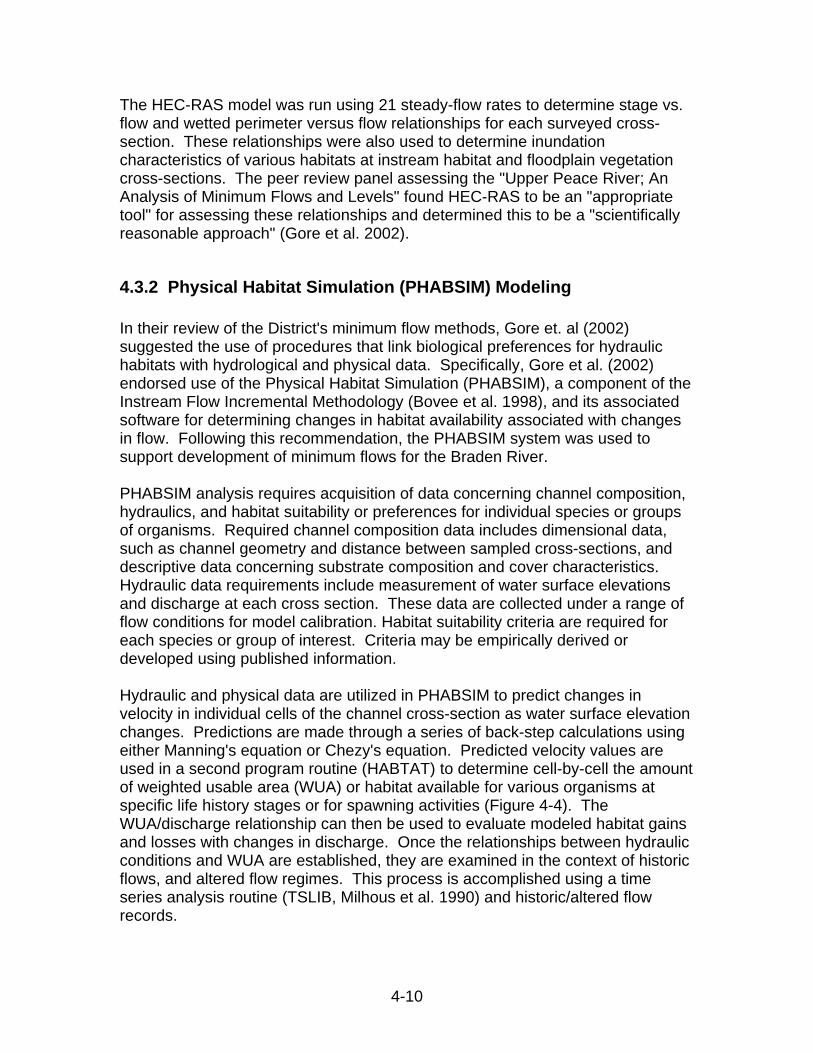
4-10
The HEC-RAS model was run using 21 steady-flow rates to determine stage vs. flow and wetted perimeter versus flow relationships for each surveyed cross-section. These relationships were also used to determine inundation characteristics of various habitats at instream habitat and floodplain vegetation cross-sections. The peer review panel assessing the "Upper Peace River; An Analysis of Minimum Flows and Levels" found HEC-RAS to be an "appropriate tool" for assessing these relationships and determined this to be a "scientifically reasonable approach" (Gore et al. 2002).
4.3.2 Physical Habitat Simulation (PHABSIM) Modeling In their review of the District's minimum flow methods, Gore et. al (2002) suggested the use of procedures that link biological preferences for hydraulic habitats with hydrological and physical data. Specifically, Gore et al. (2002) endorsed use of the Physical Habitat Simulation (PHABSIM), a component of the Instream Flow Incremental Methodology (Bovee et al. 1998), and its associated software for determining changes in habitat availability associated with changes in flow. Following this recommendation, the PHABSIM system was used to support development of minimum flows for the Braden River. PHABSIM analysis requires acquisition of data concerning channel composition, hydraulics, and habitat suitability or preferences for individual species or groups of organisms. Required channel composition data includes dimensional data, such as channel geometry and distance between sampled cross-sections, and descriptive data concerning substrate composition and cover characteristics. Hydraulic data requirements include measurement of water surface elevations and discharge at each cross section. These data are collected under a range of flow conditions for model calibration. Habitat suitability criteria are required for each species or group of interest. Criteria may be empirically derived or developed using published information. Hydraulic and physical data are utilized in PHABSIM to predict changes in velocity in individual cells of the channel cross-section as water surface elevation changes. Predictions are made through a series of back-step calculations using either Manning's equation or Chezy's equation. Predicted velocity values are used in a second program routine (HABTAT) to determine cell-by-cell the amount of weighted usable area (WUA) or habitat available for various organisms at specific life history stages or for spawning activities (Figure 4-4). The WUA/discharge relationship can then be used to evaluate modeled habitat gains and losses with changes in discharge. Once the relationships between hydraulic conditions and WUA are established, they are examined in the context of historic flows, and altered flow regimes. This process is accomplished using a time series analysis routine (TSLIB, Milhous et al. 1990) and historic/altered flow records.
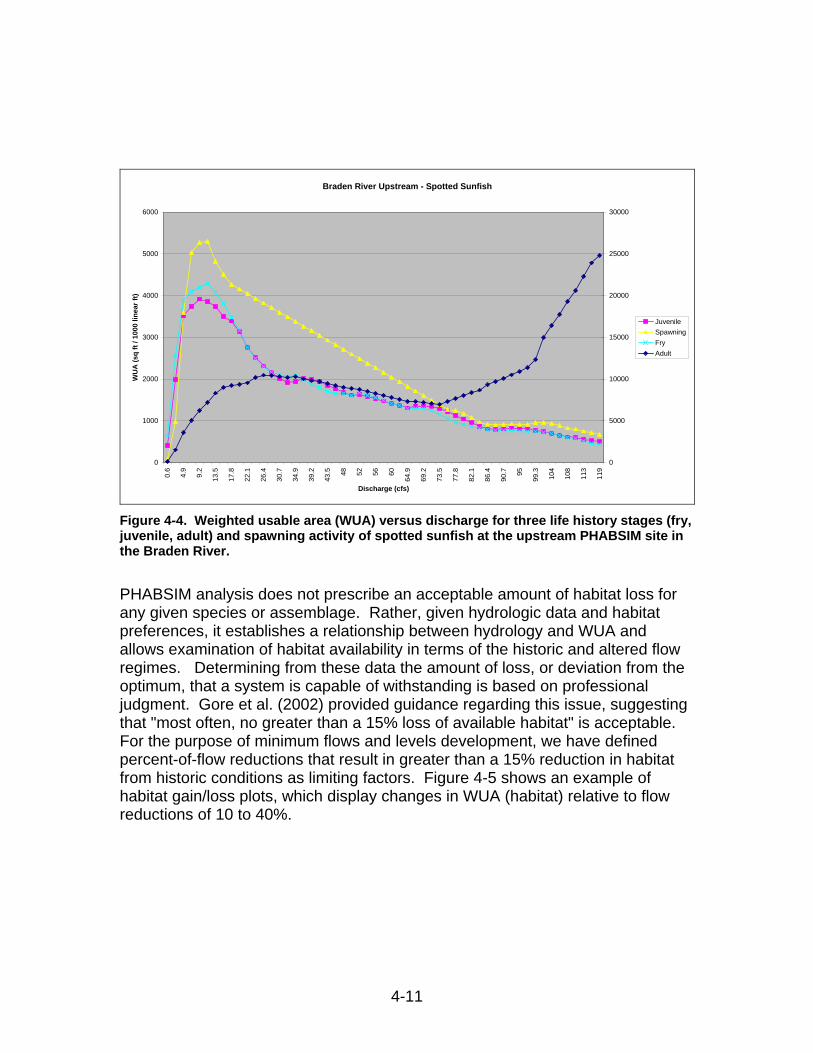
4-11
Braden River Upstream - Spotted Sunfish
0
1000
2000
3000
4000
5000
6000
0.6
4.9
9.2
13.5
17.8
22.1
26.4
30.7
34.9
39.2
43.5 48 52 56 60
64.9
69.2
73.5
77.8
82.1
86.4
90.7 95
99.3
104
108
113
119
Discharge (cfs)
WU
A (s
q ft
/ 100
0 lin
ear f
t)
0
5000
10000
15000
20000
25000
30000
JuvenileSpawningFryAdult
Figure 4-4. Weighted usable area (WUA) versus discharge for three life history stages (fry, juvenile, adult) and spawning activity of spotted sunfish at the upstream PHABSIM site in the Braden River.
PHABSIM analysis does not prescribe an acceptable amount of habitat loss for any given species or assemblage. Rather, given hydrologic data and habitat preferences, it establishes a relationship between hydrology and WUA and allows examination of habitat availability in terms of the historic and altered flow regimes. Determining from these data the amount of loss, or deviation from the optimum, that a system is capable of withstanding is based on professional judgment. Gore et al. (2002) provided guidance regarding this issue, suggesting that "most often, no greater than a 15% loss of available habitat" is acceptable. For the purpose of minimum flows and levels development, we have defined percent-of-flow reductions that result in greater than a 15% reduction in habitat from historic conditions as limiting factors. Figure 4-5 shows an example of habitat gain/loss plots, which display changes in WUA (habitat) relative to flow reductions of 10 to 40%.
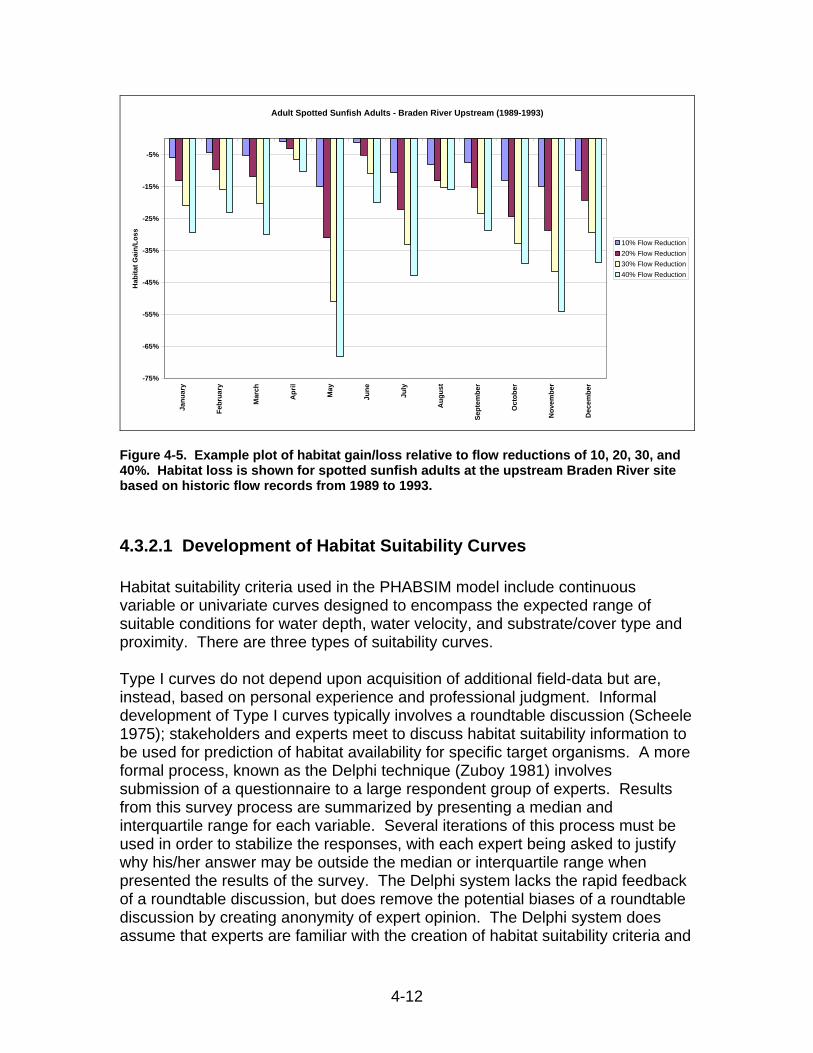
4-12
Adult Spotted Sunfish Adults - Braden River Upstream (1989-1993)
-75%
-65%
-55%
-45%
-35%
-25%
-15%
-5%
Janu
ary
Febr
uary
Mar
ch
Apr
il
May
June
July
Aug
ust
Sept
embe
r
Oct
ober
Nov
embe
r
Dec
embe
r
Hab
itat G
ain/
Loss
10% Flow Reduction20% Flow Reduction30% Flow Reduction40% Flow Reduction
Figure 4-5. Example plot of habitat gain/loss relative to flow reductions of 10, 20, 30, and 40%. Habitat loss is shown for spotted sunfish adults at the upstream Braden River site based on historic flow records from 1989 to 1993.
4.3.2.1 Development of Habitat Suitability Curves Habitat suitability criteria used in the PHABSIM model include continuous variable or univariate curves designed to encompass the expected range of suitable conditions for water depth, water velocity, and substrate/cover type and proximity. There are three types of suitability curves.
Type I curves do not depend upon acquisition of additional field-data but are, instead, based on personal experience and professional judgment. Informal development of Type I curves typically involves a roundtable discussion (Scheele 1975); stakeholders and experts meet to discuss habitat suitability information to be used for prediction of habitat availability for specific target organisms. A more formal process, known as the Delphi technique (Zuboy 1981) involves submission of a questionnaire to a large respondent group of experts. Results from this survey process are summarized by presenting a median and interquartile range for each variable. Several iterations of this process must be used in order to stabilize the responses, with each expert being asked to justify why his/her answer may be outside the median or interquartile range when presented the results of the survey. The Delphi system lacks the rapid feedback of a roundtable discussion, but does remove the potential biases of a roundtable discussion by creating anonymity of expert opinion. The Delphi system does assume that experts are familiar with the creation of habitat suitability criteria and
4-13
can respond with sufficient detail to allow development of appropriate mathematical models of habitat use. Type II curves are based upon frequency distributions for use of certain variables (e.g., flow), which are measured at locations utilized by the target species. Curves for numerous species have been published by the U.S. Fish and Wildlife Service or the U.S. Geological Survey and are commonly referred to as “blue book” criteria.
Type III curves are derived from direct observation of the utilization and/or preference of target organisms for a range of environmental variables (Manly et al. 1993). These curves are weighted by actual distribution of available environmental conditions in the stream (Bovee et al. 1998). Type III curves assume that the optimal conditions will be “preferred” over all others if individuals are presented equal proportions of less favorable conditions (Johnson 1980). Based on dominance of the spotted sunfish (Lepomis punctatus) in rivers within the District, a habitat suitability curve was created for this species. Since most of the regional experts in fish ecology were unfamiliar with development of habitat suitability criteria, a hybrid of the roundtable and Delphi techniques was used to develop a Type I curve. For this effort, a proposed working model of habitat suitability criteria was provided to 14 experts for initial evaluation. The proposed suitability curves were based on flow criteria for redbreast sunfish (Lepomis auritus) (Aho and Terrell 1986) modified according to published literature on the biology of spotted sunfish. Respondents were given approximately 30 days to review the proposed habitat suitability criteria and to suggest modifications. Six of the 14 experts provided comments. In accordance with Delphi techniques, the suggested modifications were incorporated into the proposed curves. Suggested modifications that fell outside of the median and 25% interquartile range of responses were not considered unless suitable justification could be provided. Modified Type II habitat suitability criteria for the largemouth bass (Micropterus salmoides) and bluegill (Lepomis macrochirus), two other common fish species in the Braden River, were established using USFWS/USGS “blue book” criteria (Stuber et al. 1982). Curves for these species have been widely used in PHABSIM applications.
Type III habitat suitability criteria for macroinvertebrate community diversity were established based on suitability curves published by Gore et al. (2001). Modified substrate and cover codes used for criteria development were established through consultation with District and Florida Fish and Wildlife Conservation Commission staff. For this effort, emphasis was placed on invertebrate preference for macrophytes, inundated woody snags and exposed root habitats. Per recommendation of the peer review panel for the middle Peace River, the District intends to evaluate and develop additional habitat suitability curves for
4-14
species of interest. For example curves could be refined for the spotted sunfish, new curves could be developed for species representative of feeding guilds, wading birds, and listed species.
4.3.3 Long-term Inundation Analyses Long-term inundation analysis is used to identify the number of days during a defined period of record that a specific flow or level (elevation) was equaled or exceeded at individual river cross-sections, including streamflow gaging sites. For the analyses, spreadsheets and associated plots are developed using measured elevations for habitats or other features (that were converted from a NGVD29 to a NAVD88 standard), HEC-RAS model output and available flow records. For the purpose of developing minimum flows and levels, percent-of-flow reductions that result in greater than a 15% reduction in the number of days of inundation from historic conditions are determined. In addition to identifying these flow reduction thresholds for specific target elevations (e.g., mean elevations of floodplain vegetation classes), flow reductions are also calculated for flows throughout the natural flow range and results are plotted (e.g., see Figure 4-6). Inspection of the plots allows identification of percent-of-flow reductions that can be associated with specific ranges of flow. These flow reductions identify potentially acceptable temporal habitat losses and also provide for wetland habitat protection on a spatial basis (Munson and Delfino 2007).
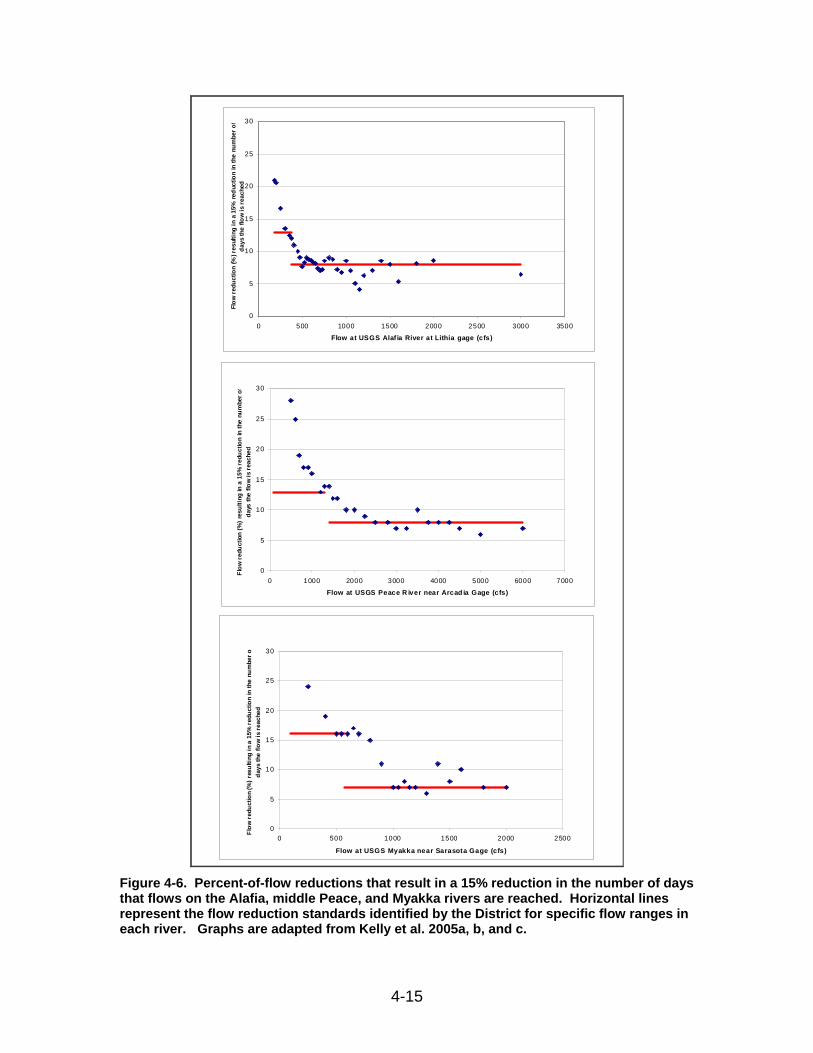
4-15
0
5
10
15
20
25
30
0 500 1000 1500 2000 2500
Flow at USGS Myakka near Sarasota Gage (cfs)
Flow
redu
ctio
n (%
) res
ultin
g in
a 1
5% re
duct
ion
in th
e nu
mbe
r oda
ys th
e flo
w is
reac
hed
0
5
10
15
20
25
30
0 500 1000 1500 2000 2500 3000 3500
Flow at USGS Alaf ia River at Lithia gage (cfs)
Flow
redu
ctio
n (%
) res
ultin
g in
a 1
5% re
duct
ion
in th
e nu
mbe
r of
days
the
flow
is re
ache
d
0
5
10
15
20
25
30
0 1000 2000 3000 4000 5000 6000 7000
Flow at USGS Peace R iver near Arcad ia Gage (cfs)
Flow
redu
ctio
n (%
) res
ultin
g in
a 1
5% re
duct
ion
in th
e nu
mbe
r of
days
the
flow
is re
ache
d
Figure 4-6. Percent-of-flow reductions that result in a 15% reduction in the number of days that flows on the Alafia, middle Peace, and Myakka rivers are reached. Horizontal lines represent the flow reduction standards identified by the District for specific flow ranges in each river. Graphs are adapted from Kelly et al. 2005a, b, and c.
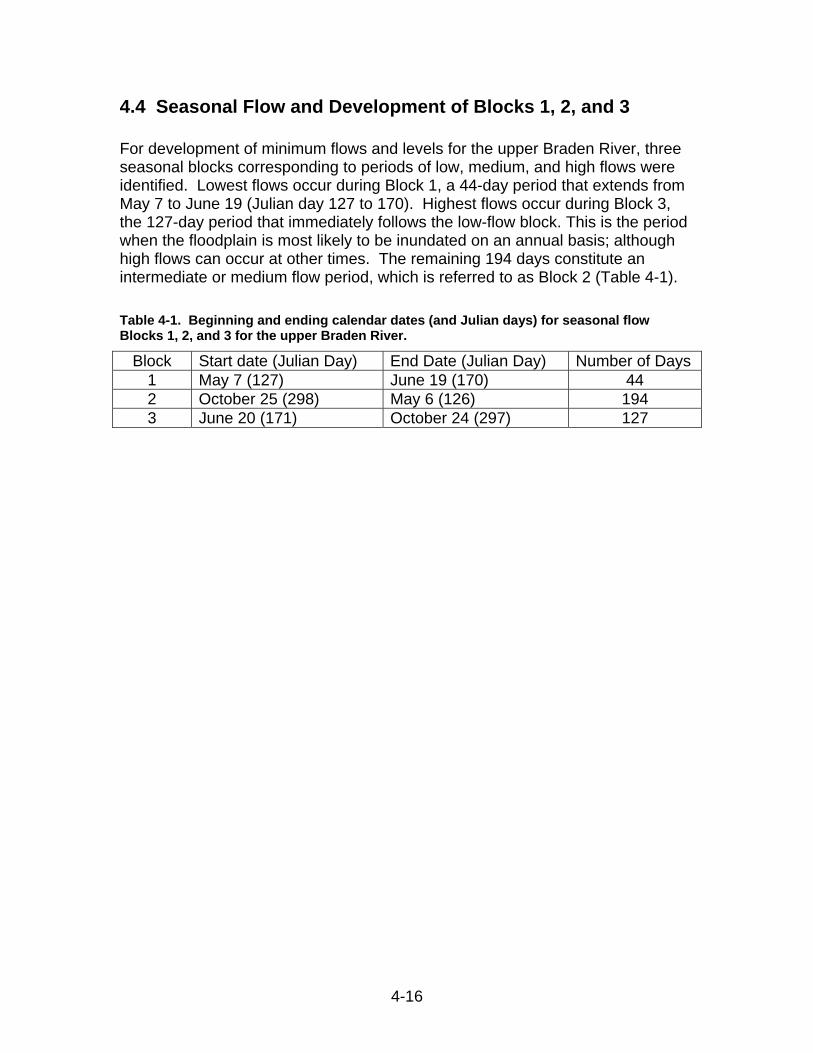
4-16
4.4 Seasonal Flow and Development of Blocks 1, 2, and 3 For development of minimum flows and levels for the upper Braden River, three seasonal blocks corresponding to periods of low, medium, and high flows were identified. Lowest flows occur during Block 1, a 44-day period that extends from May 7 to June 19 (Julian day 127 to 170). Highest flows occur during Block 3, the 127-day period that immediately follows the low-flow block. This is the period when the floodplain is most likely to be inundated on an annual basis; although high flows can occur at other times. The remaining 194 days constitute an intermediate or medium flow period, which is referred to as Block 2 (Table 4-1). Table 4-1. Beginning and ending calendar dates (and Julian days) for seasonal flow Blocks 1, 2, and 3 for the upper Braden River.
Block Start date (Julian Day) End Date (Julian Day) Number of Days 1 May 7 (127) June 19 (170) 44 2 October 25 (298) May 6 (126) 194 3 June 20 (171) October 24 (297) 127
4-17
4.5 Low-Flow Threshold Protection of aquatic resources associated with low flows is an important component of minimum flows and levels implementation. To accomplish this goal, it is necessary to develop a low-flow threshold, which identifies flows that are to be protected in their entirety (i.e., flows that are not available for consumptive-use). To determine this threshold, two low-flow criteria are developed. One is based on the lowest wetted perimeter inflection point; the other is based on maintaining fish passage along the river corridor. The low-flow threshold is established at the higher of the two low-flow criteria, provided that comparison of that criterion with historic flow records indicates that the criterion is reasonable. Although flows less than the low-flow threshold may be expected to occur throughout the year, they are most likely to occur during Block 1.
4.5.1 Wetted Perimeter Output from multiple runs of the HEC-RAS model was used to generate a wetted perimeter versus flow plot for each HEC-RAS cross-section of the Braden River corridor (see Figure 4-7 for an example and Appendix WP for all plots). Plots were visually examined for inflection points, which identify flow ranges that are associated with relatively large changes in wetted perimeter. The lowest wetted perimeter inflection point for flows up to 25 cfs was identified for each cross-section. Inflection points for flows higher than 25 cfs were disregarded since the goal was to identify the lowest wetted perimeter infection point for flows contained within the stream channel. Many cross-section plots displayed no apparent inflection points between the lowest modeled flow and 25 cfs. These cross-sections were located in pool areas, where the water surface elevation may exceed the lowest wetted perimeter inflection point even during low flow periods. For these cross-sections, the lowest wetted perimeter inflection point was established at the lowest modeled flow. The lowest wetted perimeter inflection point flows at each HEC-RAS cross-section were used to develop a wetted perimeter criterion for the Braden River near Lorraine gage site.
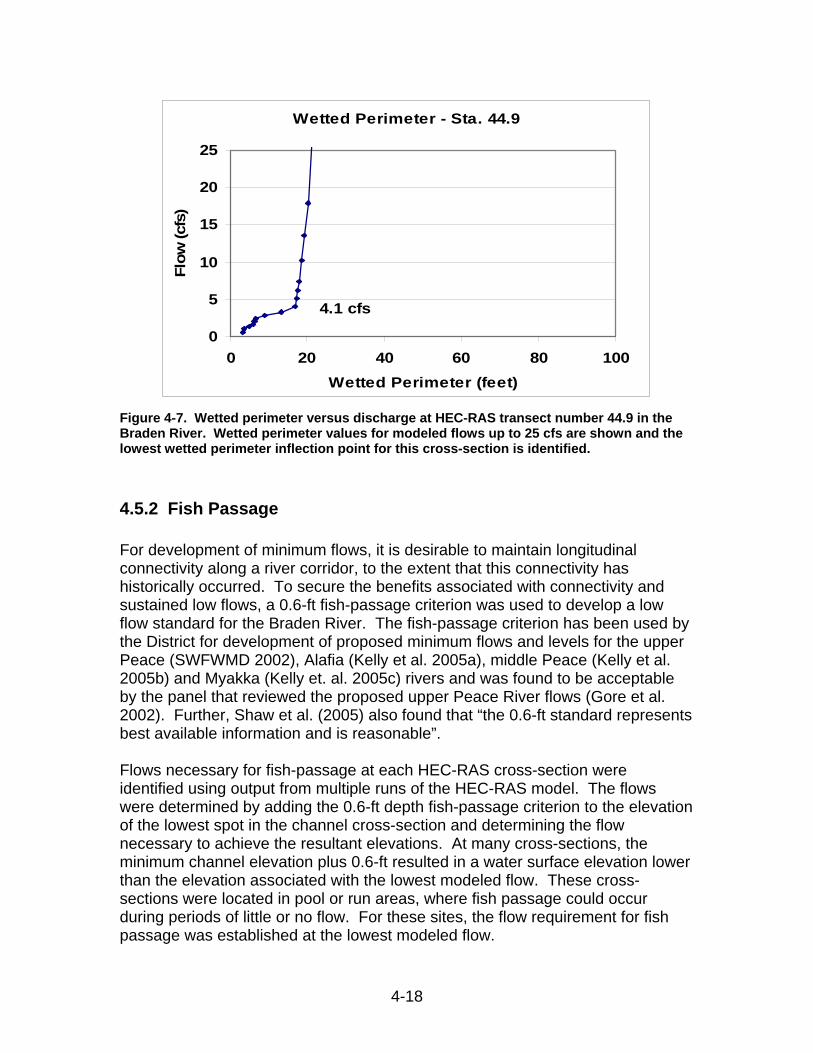
4-18
Wetted Perimeter - Sta. 44.9
0
5
10
15
20
25
0 20 40 60 80 100Wetted Perimeter (feet)
Flow
(cfs
)
4.1 cfs
Figure 4-7. Wetted perimeter versus discharge at HEC-RAS transect number 44.9 in the Braden River. Wetted perimeter values for modeled flows up to 25 cfs are shown and the lowest wetted perimeter inflection point for this cross-section is identified.
4.5.2 Fish Passage For development of minimum flows, it is desirable to maintain longitudinal connectivity along a river corridor, to the extent that this connectivity has historically occurred. To secure the benefits associated with connectivity and sustained low flows, a 0.6-ft fish-passage criterion was used to develop a low flow standard for the Braden River. The fish-passage criterion has been used by the District for development of proposed minimum flows and levels for the upper Peace (SWFWMD 2002), Alafia (Kelly et al. 2005a), middle Peace (Kelly et al. 2005b) and Myakka (Kelly et. al. 2005c) rivers and was found to be acceptable by the panel that reviewed the proposed upper Peace River flows (Gore et al. 2002). Further, Shaw et al. (2005) also found that “the 0.6-ft standard represents best available information and is reasonable”. Flows necessary for fish-passage at each HEC-RAS cross-section were identified using output from multiple runs of the HEC-RAS model. The flows were determined by adding the 0.6-ft depth fish-passage criterion to the elevation of the lowest spot in the channel cross-section and determining the flow necessary to achieve the resultant elevations. At many cross-sections, the minimum channel elevation plus 0.6-ft resulted in a water surface elevation lower than the elevation associated with the lowest modeled flow. These cross-sections were located in pool or run areas, where fish passage could occur during periods of little or no flow. For these sites, the flow requirement for fish passage was established at the lowest modeled flow.
4-19
Linear interpolation between modeled flows was used to determine flows at the Braden River near Lorraine gage that corresponded to the target fish-passage elevation at the cross sections. This approach was used rather than a more typical linear regression approach because the Braden River study reach is short enough that the reach was modeled with no inflow between the upstream and downstream gage. The flow at the Braden River near Lorraine gage that was sufficient to provide for fish passage at all HEC-RAS cross sections was used to define the fish passage criterion.
4.6 Prescribed Flow Reduction for Block 1 When flows exceed the low-flow threshold during Block 1, it may be that some portion of the flows can be withdrawn for consumptive use without causing significant harm. To identify these quantities, the availability of aquatic habitat for selected fish species and macroinvertebrate populations for low flow periods can be estimated using the Physical Habitat Simulation Model (PHABSIM).
4.6.1 PHABSIM – Application for Block 1 PHABSIM was used to evaluate potential changes in habitat associated with variation in low flows in the upper Braden River. For the analyses, historic time series data from the Braden River near Lorraine gage site were used to model changes in habitat at two representative sites. Flows for two benchmark periods, from 1988-1994 and from 1995-2005, were used for the analyses. Simulations were conducted for various life-history stages of spotted sunfish, largemouth bass, bluegill, and for macroinvertebrate diversity at both sites on the Braden River. Flow reductions during Block 1, (i.e., from May 7 to June 19) that resulted in no more than a 15% reduction in habitat from historic conditions for either benchmark period were determined to be limiting factors. These factors were used to derive prescribed flow reductions, which identify acceptable flow requirements for the Braden River near Lorraine gage site during Block 1 when flows exceed the low-flow threshold.
4.7 Prescribed Flow Reduction for Block 2 During Block 2, flows are typically higher than in Block 1, but are typically contained within the channel. Minimum flows and levels are established for Block 2 for flows that exceed the low-flow threshold using PHABSIM to evaluate potential habitat losses, and through the use of HEC-RAS model output and long-term inundation analyses to evaluate potential changes in the wetting of woody habitats. Results from the two modeling approaches define limiting
4-20
factors, the most conservative of which is used to develop a prescribed flow reduction for Block 2.
4.7.1 PHABSIM – Application for Block 2 PHABSIM was used to evaluate potential changes in habitat associated with variation in medium flows. For the analyses, historic time series data from the Braden River near Lorraine gage site were used. The two benchmark periods, utilized for PHABSIM, ran from 1988-1993 and from 1994-2005. Simulations were conducted for various life-history stages of spotted sunfish, largemouth bass, bluegill, and macroinvertebrate diversity at two representative sites on the Braden River. Maximum flow reductions that resulted in no more than a 15% reduction in habitat from historic conditions during Block 2, which runs from October 25 of one year to May 6 of the following calendar year, were determined to be limiting factors. These factors were used to derive prescribed flow reductions, which identify acceptable flow requirements for the Braden River near Lorraine gage site during Block 2, when flows exceed the low flow thresholds.
4.7.2 Snag and Exposed Root Habitat Analyses – Application for Block 2 Mean elevations of snag and exposed root habitats were determined for fourteen instream habitat cross-section sites in the Braden River. Flows at the cross-section sites and corresponding flows at the Braden River near Lorraine gage that would result in inundation of the mean habitat elevations at each cross-section were determined using the HEC-RAS model. Long-term inundation analyses was used to determine the number of days that the mean elevations for the snag or root habitat were inundated. Flow records from two benchmark periods (1988 through 1994 and from 1995 through 2005) were examined to identify percent-of-flow reductions that would result in no more than a 15% loss of habitat defined as a reduction of no more than 15% of the number of days of inundation from direct river flow for the entire year, after prescribed flow reductions for Blocks 1 and 3 were applied. Although we acknowledge that a 15% change in habitat availability based on a reduction in spatial extent of habitat may not be equivalent to a 15% change in habitat availability based on number of days a particular habitat is inundated (Munson and Delfino 2007), the peer review panel for the middle Peace River MFLs noted, “that the 15% threshold selected for preventing significant harm is appropriate” (Shaw et al. 2005). Loss of days of direct connection with river flows was evaluated for the entire year since woody habitats in the river are expected to be inundated during
4-21
periods of high flow (Block 3) and may also be inundated by flows occurring during Block 1 in some years. The percent-of-flow reductions derived for Block 2 flows at the gage site were considered to be limiting factors and evaluated for development of prescribed flow reductions for Block 2 for the Braden River near Lorraine gage site when flows exceed the low-flow threshold.
4.8 Prescribed Flow Reduction for Block 3 Junk et al. (1989) note that the “driving force responsible for the existence, productivity, and interactions of the major river-floodplain systems is the flood pulse”. Floodplain vegetation development and persistence does not, however, necessarily depend wholly on inundation from the river channel. Groundwater seepage, hyporheic inputs, discharge from local tributaries, and precipitation can also lead to floodplain inundation (Mertes 1997). However, because river channel-floodplain connections are important, can be influenced by water use, and may be a function of out-of-bank flows, it is valuable to characterize this connectivity for development of minimum flows and levels. Highest flows, including out-of-bank flows, are most likely to occur during Block 3, which for the Braden River extends from June 20 to October 24. Minimum flows developed for this period are intended to protect ecological resources and values associated with the floodplain by maintaining hydrologic connections between the river channel and the floodplain and maintaining the natural variability of the flow regime. This goal is accomplished through HEC-RAS modeling and use of long-term inundation analyses to evaluate floodplain feature inundation patterns associated with channel-floodplain connectivity. Based on these analyses, a prescribed flow reduction for Block 3 can be developed.
4.8.1 Floodplain Connection Analyses – Application for Block 3 HEC-RAS model output and long-term inundation analyses were used to evaluate floodplain inundation patterns associated with river flows at the 15 floodplain vegetation cross-sections and associated flows at the Braden River near Lorraine gage site. Inundation of elevations associated with floodplain features, including vegetation classes and soils, was evaluated to establish percent-of-flow reductions that would result in no more than a 15% reduction in the number of days of inundation during Block 3, based on flows during two benchmark periods (1989 through 1993 and from 1994 through 2005). The percent-of-flow reductions were considered to be limiting factors and used for development of prescribed flow reductions for the Braden River near Lorraine gage site during Block 3.
5-1
Chapter 5 Results and Recommended Minimum Flows
5.1 Overview Results from modeling and field investigations on the Braden River were assessed to develop minimum flow criteria/standards for ensuring that ecological functions associated with various flows and levels are protected from significant harm. A low-flow threshold based on historic flows is recommended for the USGS Braden River near Lorraine FL gage site, along with prescribed flow reductions for Blocks 1, 2, and 3. Based on the low-flow threshold and prescribed flow reductions, short-term and long-term compliance standards are identified for establishing minimum flows and levels for the upper Braden River.
5.2 Low-Flow Threshold The low-flow threshold defines flows that are to be protected throughout the year. The low-flow threshold is established at the higher of two flow criteria, which are based on maintaining fish passage and maximizing wetted perimeter for the least amount of flow in the river channel. The low flow must also be historically appropriate. For the upper Braden River, the low-flow threshold was developed for the USGS Braden River near Lorraine gage site.
5.2.1 Fish Passage Criteria Flows necessary to reach a maximum water depth of 0.6 foot to allow for fish passage at each cross-section in the HEC-RAS model of the Braden River between the USGS Braden River at Linger Lodge and Braden River at Lorraine gage sites are shown in Figure 5-1. At most cross-sections, the minimum water surface elevation that would allow for fish passage was lower than the elevation associated with the lowest modeled flow. These cross-sections were located in pool or run areas, where fish passage would be possible during low-flow periods. Inspection of the data indicated that flows equal to or greater than 7.4 cfs at the Braden River near Lorraine gage would be sufficient for fish passage at all sampled sites. The fish passage criterion for the Braden River was, therefore, established at 7.4 cfs.
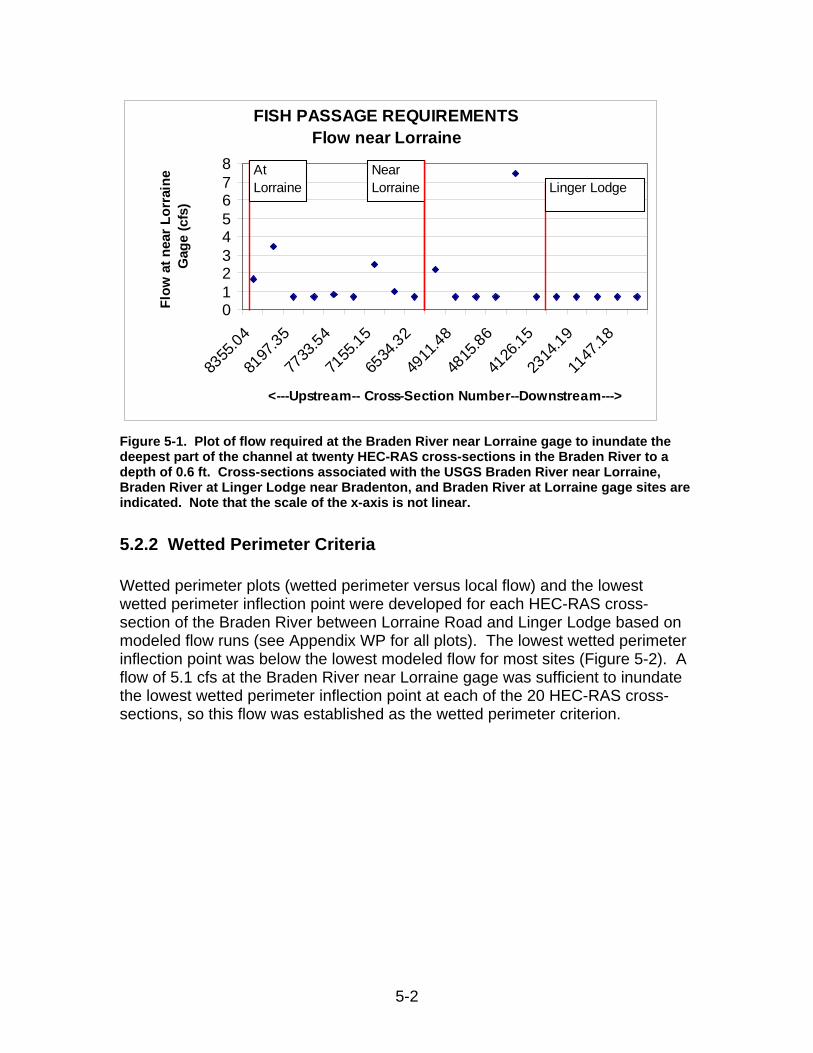
5-2
FISH PASSAGE REQUIREMENTSFlow near Lorraine
012345678
8355
.04
8197
.35
7733
.54
7155
.15
6534
.32
4911
.48
4815
.86
4126
.15
2314
.19
1147
.18
<---Upstream-- Cross-Section Number--Downstream--->
Flow
at n
ear L
orra
ine
Gag
e (c
fs)
Linger LodgeNear Lorraine
At Lorraine
Figure 5-1. Plot of flow required at the Braden River near Lorraine gage to inundate the deepest part of the channel at twenty HEC-RAS cross-sections in the Braden River to a depth of 0.6 ft. Cross-sections associated with the USGS Braden River near Lorraine, Braden River at Linger Lodge near Bradenton, and Braden River at Lorraine gage sites are indicated. Note that the scale of the x-axis is not linear.
5.2.2 Wetted Perimeter Criteria Wetted perimeter plots (wetted perimeter versus local flow) and the lowest wetted perimeter inflection point were developed for each HEC-RAS cross-section of the Braden River between Lorraine Road and Linger Lodge based on modeled flow runs (see Appendix WP for all plots). The lowest wetted perimeter inflection point was below the lowest modeled flow for most sites (Figure 5-2). A flow of 5.1 cfs at the Braden River near Lorraine gage was sufficient to inundate the lowest wetted perimeter inflection point at each of the 20 HEC-RAS cross-sections, so this flow was established as the wetted perimeter criterion.
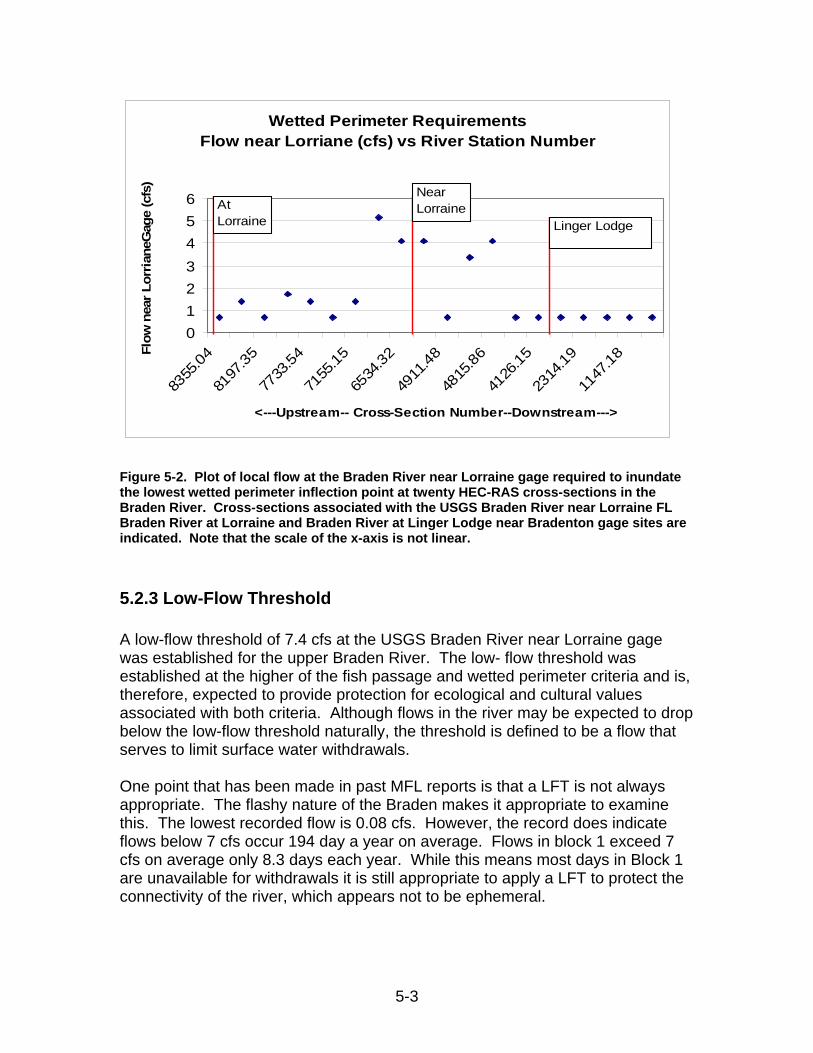
5-3
Wetted Perimeter RequirementsFlow near Lorriane (cfs) vs River Station Number
0123456
8355
.04
8197
.35
7733
.54
7155
.15
6534
.32
4911
.48
4815
.86
4126
.15
2314
.19
1147
.18
<---Upstream-- Cross-Section Number--Downstream--->
Flow
nea
r Lor
riane
Gag
e (c
fs)
Near Lorraine
Linger Lodge
At Lorraine
Figure 5-2. Plot of local flow at the Braden River near Lorraine gage required to inundate the lowest wetted perimeter inflection point at twenty HEC-RAS cross-sections in the Braden River. Cross-sections associated with the USGS Braden River near Lorraine FL Braden River at Lorraine and Braden River at Linger Lodge near Bradenton gage sites are indicated. Note that the scale of the x-axis is not linear.
5.2.3 Low-Flow Threshold A low-flow threshold of 7.4 cfs at the USGS Braden River near Lorraine gage was established for the upper Braden River. The low- flow threshold was established at the higher of the fish passage and wetted perimeter criteria and is, therefore, expected to provide protection for ecological and cultural values associated with both criteria. Although flows in the river may be expected to drop below the low-flow threshold naturally, the threshold is defined to be a flow that serves to limit surface water withdrawals. One point that has been made in past MFL reports is that a LFT is not always appropriate. The flashy nature of the Braden makes it appropriate to examine this. The lowest recorded flow is 0.08 cfs. However, the record does indicate flows below 7 cfs occur 194 day a year on average. Flows in block 1 exceed 7 cfs on average only 8.3 days each year. While this means most days in Block 1 are unavailable for withdrawals it is still appropriate to apply a LFT to protect the connectivity of the river, which appears not to be ephemeral.
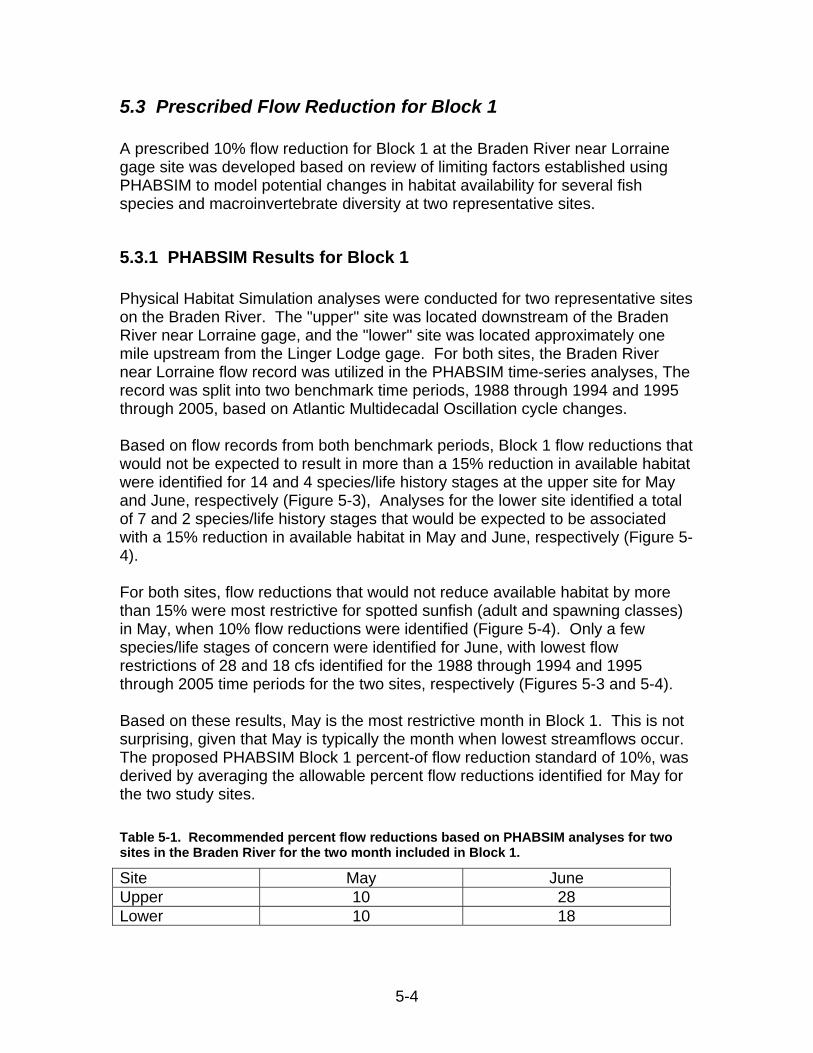
5-4
5.3 Prescribed Flow Reduction for Block 1 A prescribed 10% flow reduction for Block 1 at the Braden River near Lorraine gage site was developed based on review of limiting factors established using PHABSIM to model potential changes in habitat availability for several fish species and macroinvertebrate diversity at two representative sites.
5.3.1 PHABSIM Results for Block 1 Physical Habitat Simulation analyses were conducted for two representative sites on the Braden River. The "upper" site was located downstream of the Braden River near Lorraine gage, and the "lower" site was located approximately one mile upstream from the Linger Lodge gage. For both sites, the Braden River near Lorraine flow record was utilized in the PHABSIM time-series analyses, The record was split into two benchmark time periods, 1988 through 1994 and 1995 through 2005, based on Atlantic Multidecadal Oscillation cycle changes. Based on flow records from both benchmark periods, Block 1 flow reductions that would not be expected to result in more than a 15% reduction in available habitat were identified for 14 and 4 species/life history stages at the upper site for May and June, respectively (Figure 5-3), Analyses for the lower site identified a total of 7 and 2 species/life history stages that would be expected to be associated with a 15% reduction in available habitat in May and June, respectively (Figure 5-4). For both sites, flow reductions that would not reduce available habitat by more than 15% were most restrictive for spotted sunfish (adult and spawning classes) in May, when 10% flow reductions were identified (Figure 5-4). Only a few species/life stages of concern were identified for June, with lowest flow restrictions of 28 and 18 cfs identified for the 1988 through 1994 and 1995 through 2005 time periods for the two sites, respectively (Figures 5-3 and 5-4). Based on these results, May is the most restrictive month in Block 1. This is not surprising, given that May is typically the month when lowest streamflows occur. The proposed PHABSIM Block 1 percent-of flow reduction standard of 10%, was derived by averaging the allowable percent flow reductions identified for May for the two study sites. Table 5-1. Recommended percent flow reductions based on PHABSIM analyses for two sites in the Braden River for the two month included in Block 1.
Site May June Upper 10 28 Lower 10 18
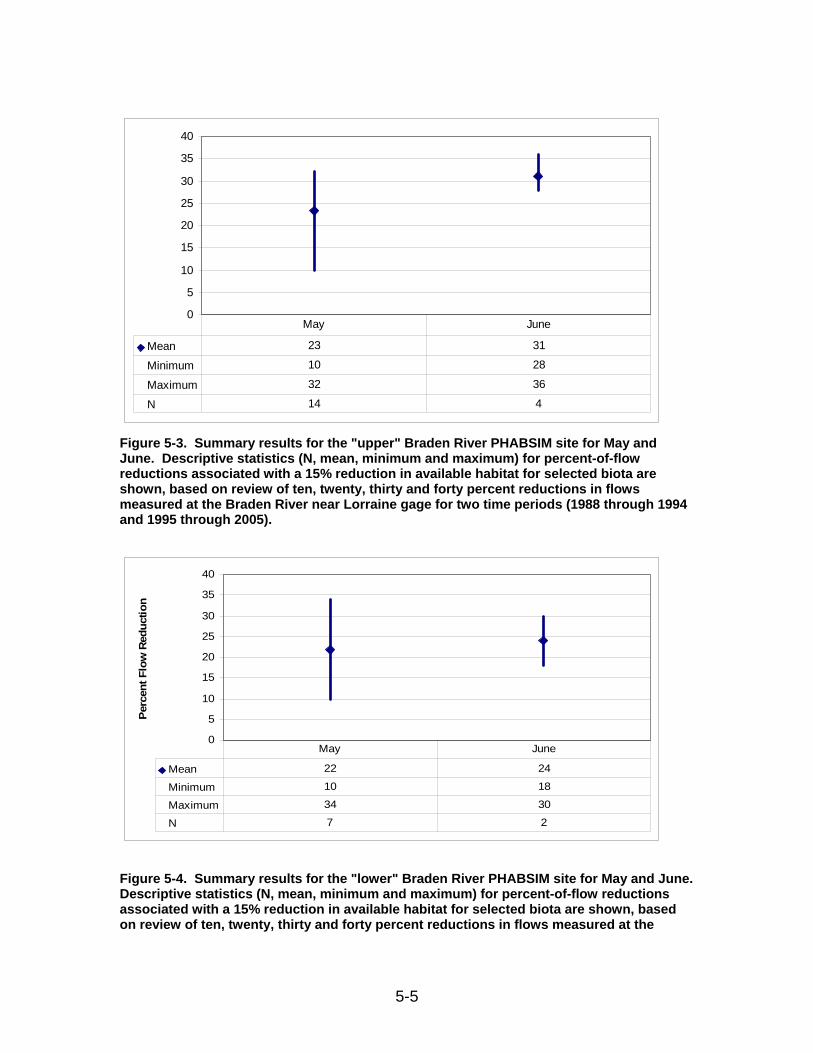
5-5
0
5
10
15
20
25
30
35
40
Mean 23 31
Minimum 10 28
Maximum 32 36
N 14 4
May June
Figure 5-3. Summary results for the "upper" Braden River PHABSIM site for May and June. Descriptive statistics (N, mean, minimum and maximum) for percent-of-flow reductions associated with a 15% reduction in available habitat for selected biota are shown, based on review of ten, twenty, thirty and forty percent reductions in flows measured at the Braden River near Lorraine gage for two time periods (1988 through 1994 and 1995 through 2005).
0
5
10
15
20
25
30
35
40
Perc
ent F
low
Red
uctio
n
Mean 22 24
Minimum 10 18
Maximum 34 30
N 7 2
May June
Figure 5-4. Summary results for the "lower" Braden River PHABSIM site for May and June. Descriptive statistics (N, mean, minimum and maximum) for percent-of-flow reductions associated with a 15% reduction in available habitat for selected biota are shown, based on review of ten, twenty, thirty and forty percent reductions in flows measured at the
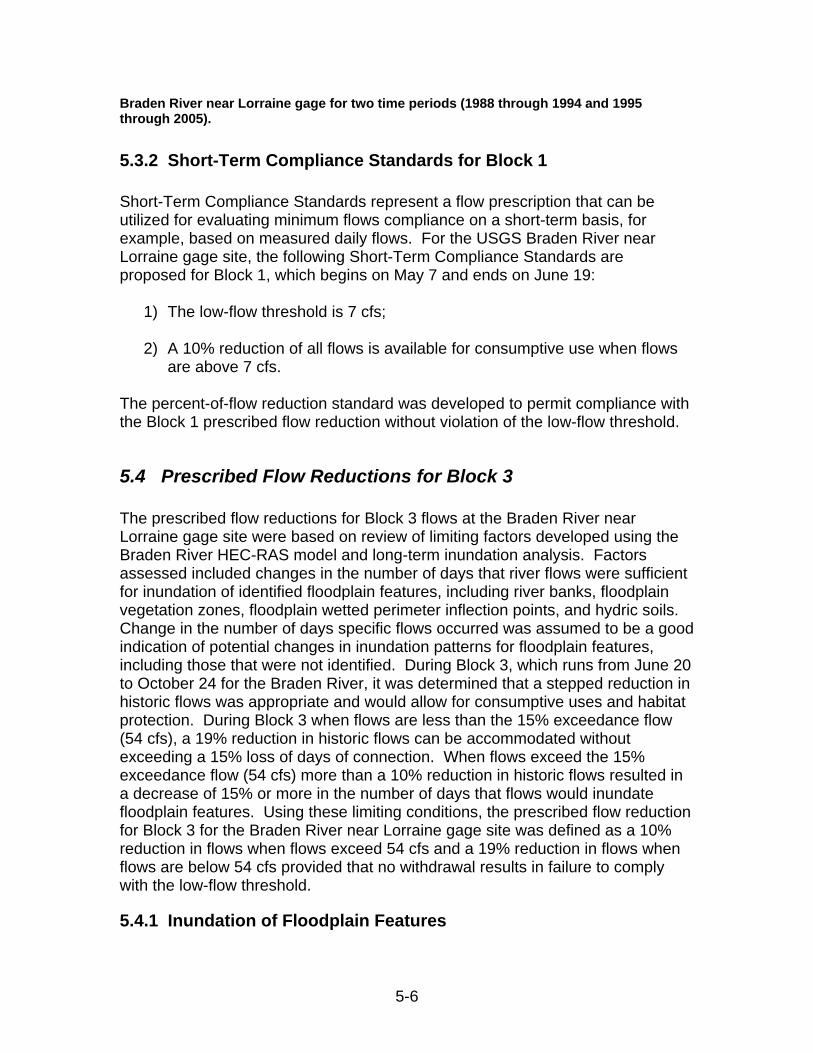
5-6
Braden River near Lorraine gage for two time periods (1988 through 1994 and 1995 through 2005).
5.3.2 Short-Term Compliance Standards for Block 1 Short-Term Compliance Standards represent a flow prescription that can be utilized for evaluating minimum flows compliance on a short-term basis, for example, based on measured daily flows. For the USGS Braden River near Lorraine gage site, the following Short-Term Compliance Standards are proposed for Block 1, which begins on May 7 and ends on June 19:
1) The low-flow threshold is 7 cfs;
2) A 10% reduction of all flows is available for consumptive use when flows are above 7 cfs.
The percent-of-flow reduction standard was developed to permit compliance with the Block 1 prescribed flow reduction without violation of the low-flow threshold.
5.4 Prescribed Flow Reductions for Block 3 The prescribed flow reductions for Block 3 flows at the Braden River near Lorraine gage site were based on review of limiting factors developed using the Braden River HEC-RAS model and long-term inundation analysis. Factors assessed included changes in the number of days that river flows were sufficient for inundation of identified floodplain features, including river banks, floodplain vegetation zones, floodplain wetted perimeter inflection points, and hydric soils. Change in the number of days specific flows occurred was assumed to be a good indication of potential changes in inundation patterns for floodplain features, including those that were not identified. During Block 3, which runs from June 20 to October 24 for the Braden River, it was determined that a stepped reduction in historic flows was appropriate and would allow for consumptive uses and habitat protection. During Block 3 when flows are less than the 15% exceedance flow (54 cfs), a 19% reduction in historic flows can be accommodated without exceeding a 15% loss of days of connection. When flows exceed the 15% exceedance flow (54 cfs) more than a 10% reduction in historic flows resulted in a decrease of 15% or more in the number of days that flows would inundate floodplain features. Using these limiting conditions, the prescribed flow reduction for Block 3 for the Braden River near Lorraine gage site was defined as a 10% reduction in flows when flows exceed 54 cfs and a 19% reduction in flows when flows are below 54 cfs provided that no withdrawal results in failure to comply with the low-flow threshold.
5.4.1 Inundation of Floodplain Features
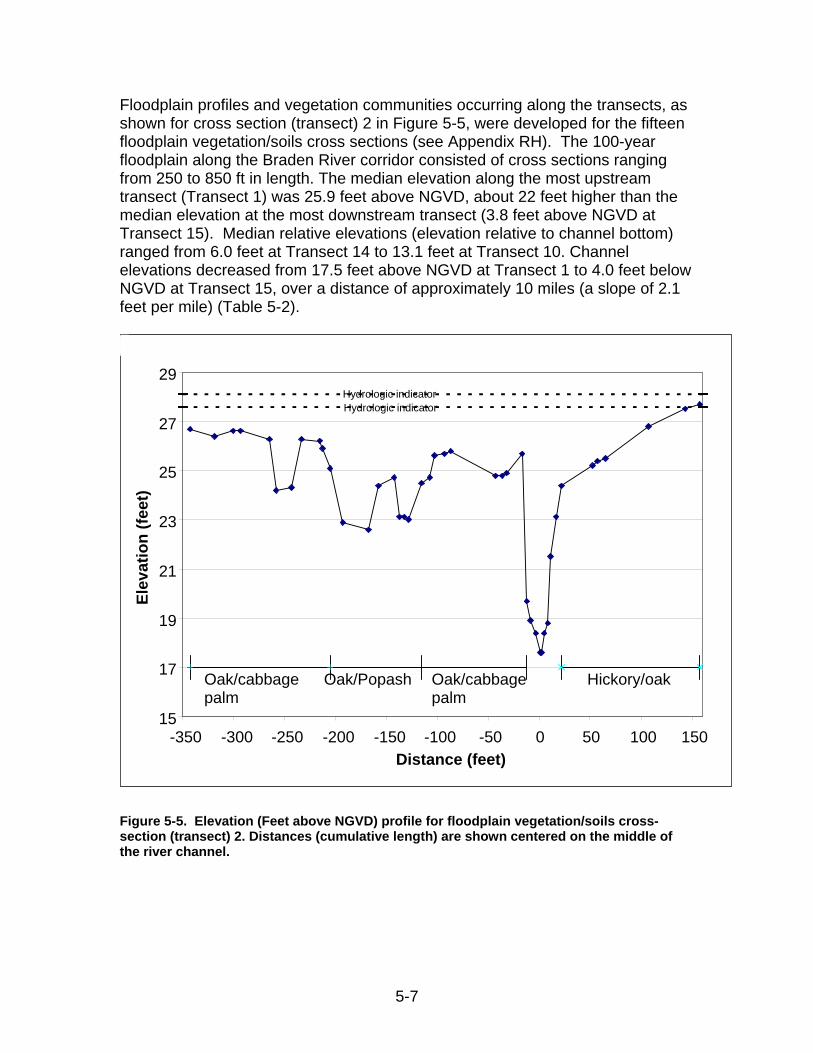
5-7
Floodplain profiles and vegetation communities occurring along the transects, as shown for cross section (transect) 2 in Figure 5-5, were developed for the fifteen floodplain vegetation/soils cross sections (see Appendix RH). The 100-year floodplain along the Braden River corridor consisted of cross sections ranging from 250 to 850 ft in length. The median elevation along the most upstream transect (Transect 1) was 25.9 feet above NGVD, about 22 feet higher than the median elevation at the most downstream transect (3.8 feet above NGVD at Transect 15). Median relative elevations (elevation relative to channel bottom) ranged from 6.0 feet at Transect 14 to 13.1 feet at Transect 10. Channel elevations decreased from 17.5 feet above NGVD at Transect 1 to 4.0 feet below NGVD at Transect 15, over a distance of approximately 10 miles (a slope of 2.1 feet per mile) (Table 5-2).
Figure 5-5. Elevation (Feet above NGVD) profile for floodplain vegetation/soils cross-section (transect) 2. Distances (cumulative length) are shown centered on the middle of the river channel.
Oak/Popash
Hydrologic indicator
Hydrologic indicator
Hickory/oakOak/cabbage palm
Oak/cabbage palm
15
17
19
21
23
25
27
29
-350 -300 -250 -200 -150 -100 -50 0 50 100 150Distance (feet)
Elev
atio
n (fe
et)
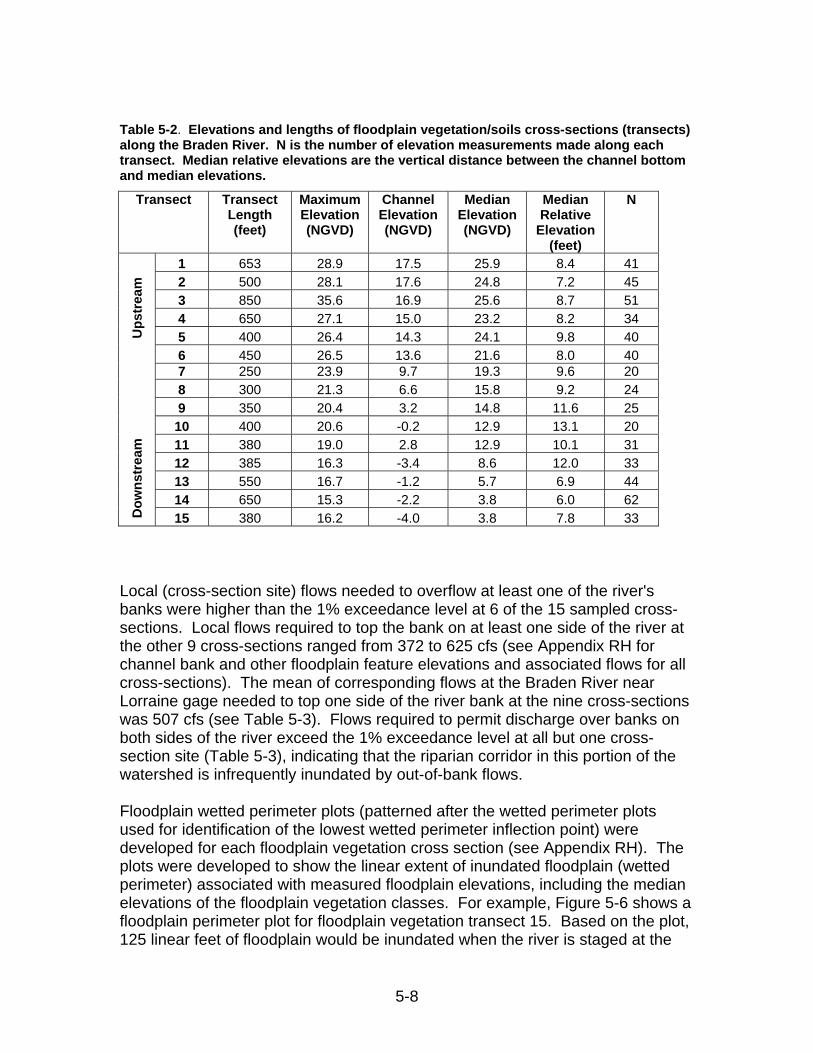
5-8
Table 5-2. Elevations and lengths of floodplain vegetation/soils cross-sections (transects) along the Braden River. N is the number of elevation measurements made along each transect. Median relative elevations are the vertical distance between the channel bottom and median elevations.
Transect Transect Length (feet)
Maximum Elevation (NGVD)
Channel Elevation (NGVD)
Median Elevation (NGVD)
Median Relative
Elevation (feet)
N
1 653 28.9 17.5 25.9 8.4 41 2 500 28.1 17.6 24.8 7.2 45 3 850 35.6 16.9 25.6 8.7 51 4 650 27.1 15.0 23.2 8.2 34 5 400 26.4 14.3 24.1 9.8 40 6 450 26.5 13.6 21.6 8.0 40 7 250 23.9 9.7 19.3 9.6 20 8 300 21.3 6.6 15.8 9.2 24 9 350 20.4 3.2 14.8 11.6 25 10 400 20.6 -0.2 12.9 13.1 20 11 380 19.0 2.8 12.9 10.1 31 12 385 16.3 -3.4 8.6 12.0 33 13 550 16.7 -1.2 5.7 6.9 44 14 650 15.3 -2.2 3.8 6.0 62
Dow
nstr
eam
U
pstr
eam
15 380 16.2 -4.0 3.8 7.8 33 Local (cross-section site) flows needed to overflow at least one of the river's banks were higher than the 1% exceedance level at 6 of the 15 sampled cross-sections. Local flows required to top the bank on at least one side of the river at the other 9 cross-sections ranged from 372 to 625 cfs (see Appendix RH for channel bank and other floodplain feature elevations and associated flows for all cross-sections). The mean of corresponding flows at the Braden River near Lorraine gage needed to top one side of the river bank at the nine cross-sections was 507 cfs (see Table 5-3). Flows required to permit discharge over banks on both sides of the river exceed the 1% exceedance level at all but one cross-section site (Table 5-3), indicating that the riparian corridor in this portion of the watershed is infrequently inundated by out-of-bank flows. Floodplain wetted perimeter plots (patterned after the wetted perimeter plots used for identification of the lowest wetted perimeter inflection point) were developed for each floodplain vegetation cross section (see Appendix RH). The plots were developed to show the linear extent of inundated floodplain (wetted perimeter) associated with measured floodplain elevations, including the median elevations of the floodplain vegetation classes. For example, Figure 5-6 shows a floodplain perimeter plot for floodplain vegetation transect 15. Based on the plot, 125 linear feet of floodplain would be inundated when the river is staged at the
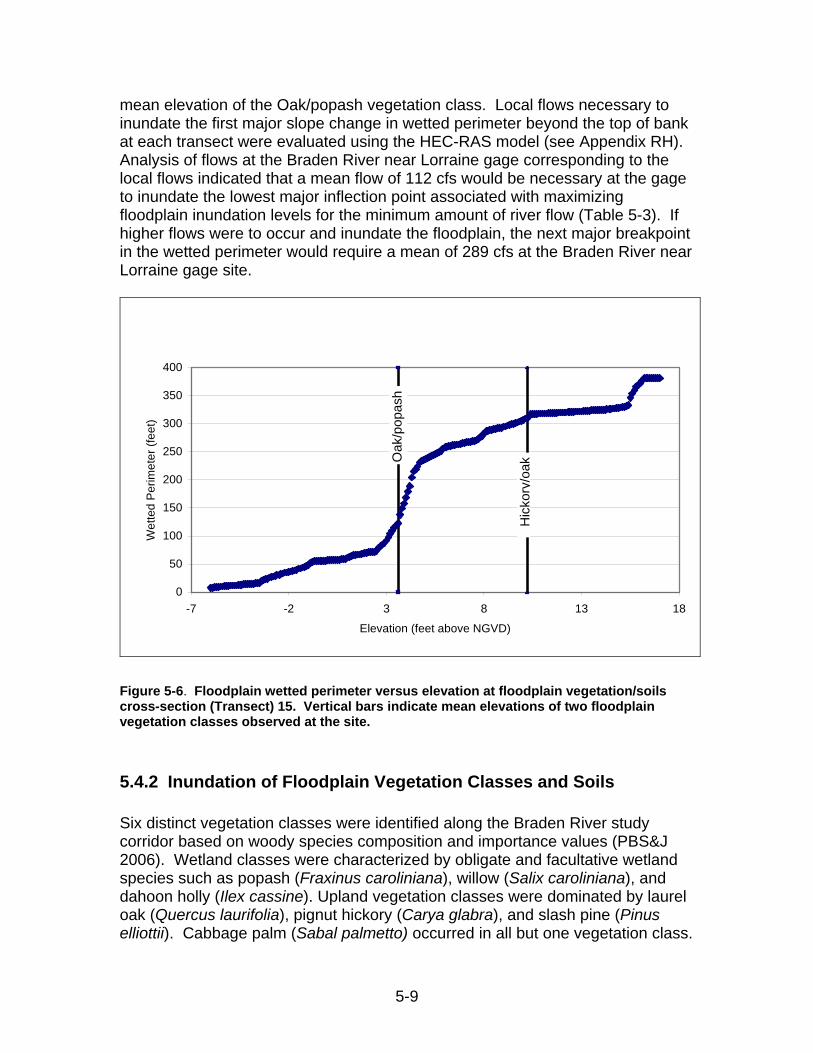
5-9
mean elevation of the Oak/popash vegetation class. Local flows necessary to inundate the first major slope change in wetted perimeter beyond the top of bank at each transect were evaluated using the HEC-RAS model (see Appendix RH). Analysis of flows at the Braden River near Lorraine gage corresponding to the local flows indicated that a mean flow of 112 cfs would be necessary at the gage to inundate the lowest major inflection point associated with maximizing floodplain inundation levels for the minimum amount of river flow (Table 5-3). If higher flows were to occur and inundate the floodplain, the next major breakpoint in the wetted perimeter would require a mean of 289 cfs at the Braden River near Lorraine gage site.
0
50
100
150
200
250
300
350
400
-7 -2 3 8 13 18
Elevation (feet above NGVD)
Wet
ted
Per
imet
er (f
eet)
Oak
/pop
ash
Hic
kory
/oak
Figure 5-6. Floodplain wetted perimeter versus elevation at floodplain vegetation/soils cross-section (Transect) 15. Vertical bars indicate mean elevations of two floodplain vegetation classes observed at the site.
5.4.2 Inundation of Floodplain Vegetation Classes and Soils Six distinct vegetation classes were identified along the Braden River study corridor based on woody species composition and importance values (PBS&J 2006). Wetland classes were characterized by obligate and facultative wetland species such as popash (Fraxinus caroliniana), willow (Salix caroliniana), and dahoon holly (Ilex cassine). Upland vegetation classes were dominated by laurel oak (Quercus laurifolia), pignut hickory (Carya glabra), and slash pine (Pinus elliottii). Cabbage palm (Sabal palmetto) occurred in all but one vegetation class.
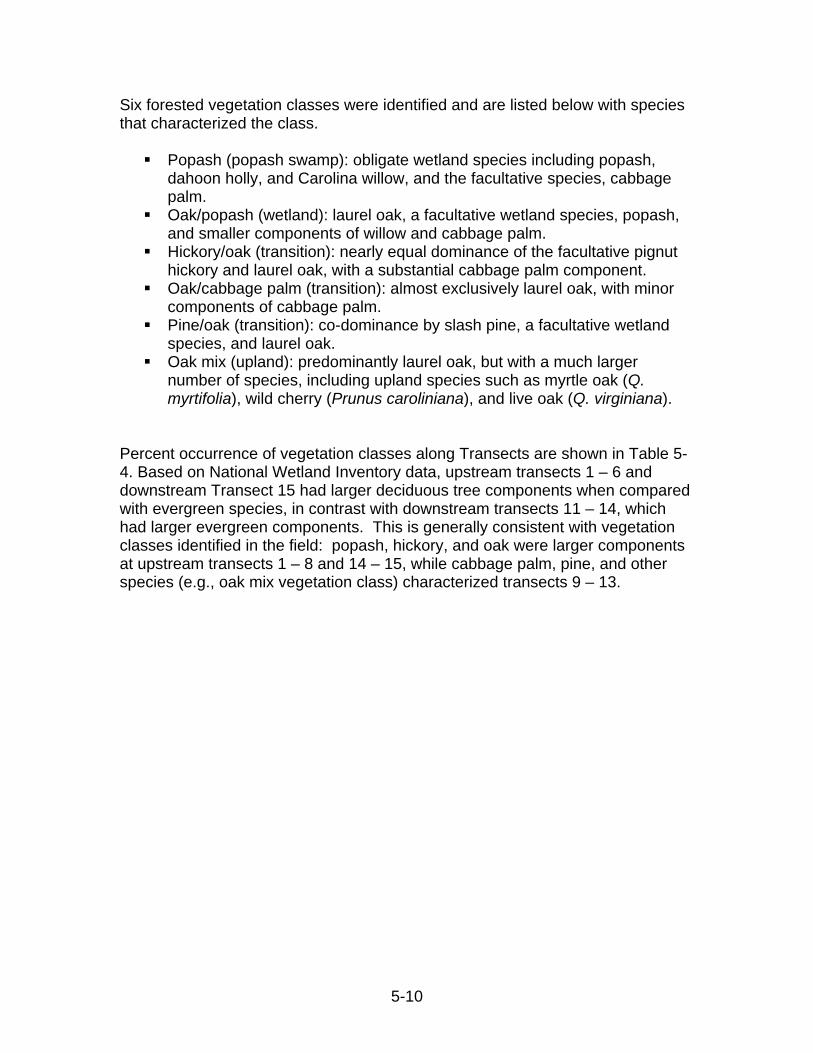
5-10
Six forested vegetation classes were identified and are listed below with species that characterized the class.
Popash (popash swamp): obligate wetland species including popash, dahoon holly, and Carolina willow, and the facultative species, cabbage palm.
Oak/popash (wetland): laurel oak, a facultative wetland species, popash, and smaller components of willow and cabbage palm.
Hickory/oak (transition): nearly equal dominance of the facultative pignut hickory and laurel oak, with a substantial cabbage palm component.
Oak/cabbage palm (transition): almost exclusively laurel oak, with minor components of cabbage palm.
Pine/oak (transition): co-dominance by slash pine, a facultative wetland species, and laurel oak.
Oak mix (upland): predominantly laurel oak, but with a much larger number of species, including upland species such as myrtle oak (Q. myrtifolia), wild cherry (Prunus caroliniana), and live oak (Q. virginiana).
Percent occurrence of vegetation classes along Transects are shown in Table 5-4. Based on National Wetland Inventory data, upstream transects 1 – 6 and downstream Transect 15 had larger deciduous tree components when compared with evergreen species, in contrast with downstream transects 11 – 14, which had larger evergreen components. This is generally consistent with vegetation classes identified in the field: popash, hickory, and oak were larger components at upstream transects 1 – 8 and 14 – 15, while cabbage palm, pine, and other species (e.g., oak mix vegetation class) characterized transects 9 – 13.
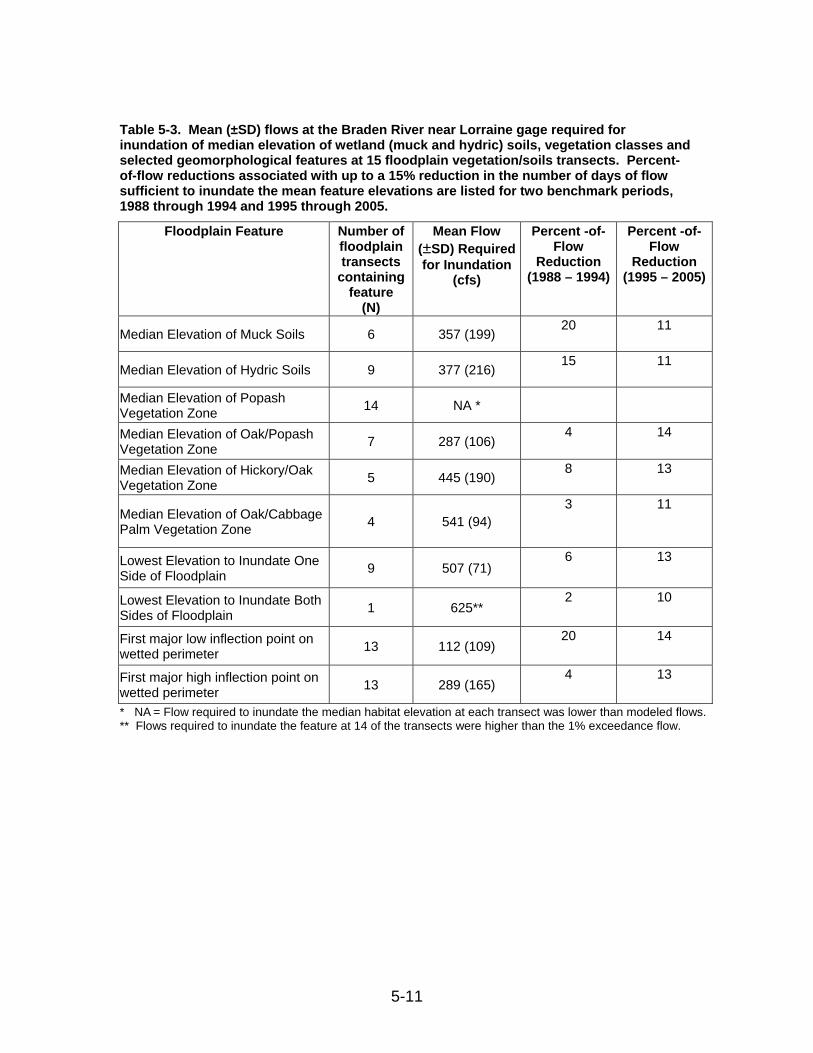
5-11
Table 5-3. Mean (±SD) flows at the Braden River near Lorraine gage required for inundation of median elevation of wetland (muck and hydric) soils, vegetation classes and selected geomorphological features at 15 floodplain vegetation/soils transects. Percent-of-flow reductions associated with up to a 15% reduction in the number of days of flow sufficient to inundate the mean feature elevations are listed for two benchmark periods, 1988 through 1994 and 1995 through 2005.
Floodplain Feature Number of floodplain transects
containing feature
(N)
Mean Flow (±SD) Required for Inundation
(cfs)
Percent -of- Flow
Reduction (1988 – 1994)
Percent -of- Flow
Reduction (1995 – 2005)
Median Elevation of Muck Soils 6 357 (199) 20 11
Median Elevation of Hydric Soils 9 377 (216) 15 11
Median Elevation of Popash Vegetation Zone 14 NA *
Median Elevation of Oak/Popash Vegetation Zone 7 287 (106)
4 14
Median Elevation of Hickory/Oak Vegetation Zone 5 445 (190)
8 13
Median Elevation of Oak/Cabbage Palm Vegetation Zone 4 541 (94)
3 11
Lowest Elevation to Inundate One Side of Floodplain 9 507 (71)
6 13
Lowest Elevation to Inundate Both Sides of Floodplain 1 625**
2 10
First major low inflection point on wetted perimeter 13 112 (109)
20 14
First major high inflection point on wetted perimeter 13 289 (165)
4 13
* NA = Flow required to inundate the median habitat elevation at each transect was lower than modeled flows.** Flows required to inundate the feature at 14 of the transects were higher than the 1% exceedance flow.
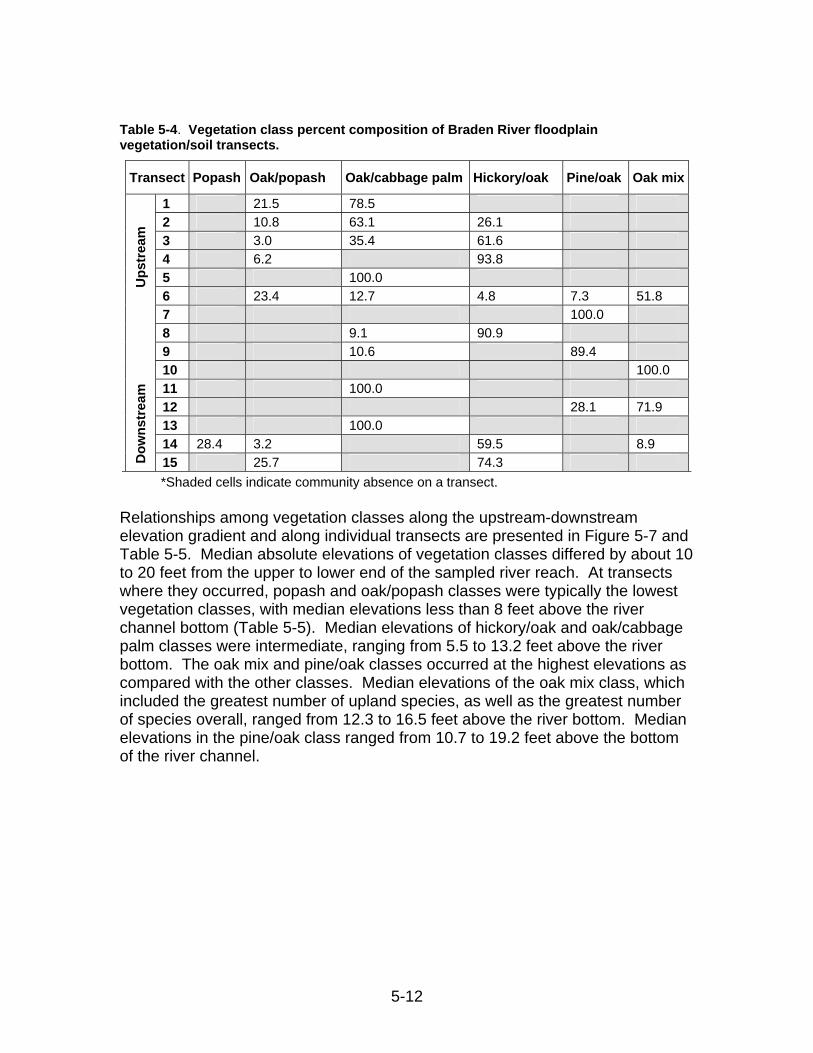
5-12
Table 5-4. Vegetation class percent composition of Braden River floodplain vegetation/soil transects.
Transect Popash Oak/popash Oak/cabbage palm Hickory/oak Pine/oak Oak mix
1 21.5 78.5 2 10.8 63.1 26.1 3 3.0 35.4 61.6 4 6.2 93.8 5 100.0 6 23.4 12.7 4.8 7.3 51.8 7 100.0 8 9.1 90.9 9 10.6 89.4 10 100.0 11 100.0 12 28.1 71.9 13 100.0 14 28.4 3.2 59.5 8.9
Dow
nstr
eam
Ups
trea
m
15 25.7 74.3 *Shaded cells indicate community absence on a transect. Relationships among vegetation classes along the upstream-downstream elevation gradient and along individual transects are presented in Figure 5-7 and Table 5-5. Median absolute elevations of vegetation classes differed by about 10 to 20 feet from the upper to lower end of the sampled river reach. At transects where they occurred, popash and oak/popash classes were typically the lowest vegetation classes, with median elevations less than 8 feet above the river channel bottom (Table 5-5). Median elevations of hickory/oak and oak/cabbage palm classes were intermediate, ranging from 5.5 to 13.2 feet above the river bottom. The oak mix and pine/oak classes occurred at the highest elevations as compared with the other classes. Median elevations of the oak mix class, which included the greatest number of upland species, as well as the greatest number of species overall, ranged from 12.3 to 16.5 feet above the river bottom. Median elevations in the pine/oak class ranged from 10.7 to 19.2 feet above the bottom of the river channel.
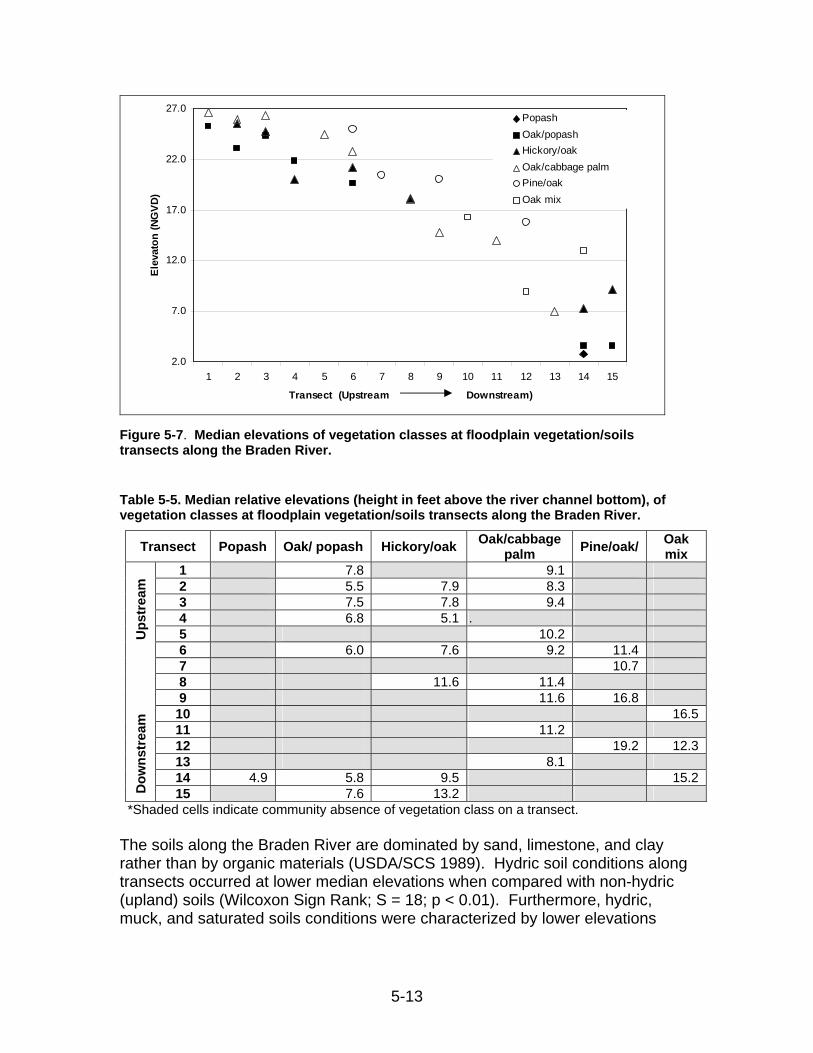
5-13
2.0
7.0
12.0
17.0
22.0
27.0
1 2 3 4 5 6 7 8 9 10 11 12 13 14 15
Transect (Upstream Downstream)
Elev
aton
(NG
VD)
PopashOak/popashHickory/oakOak/cabbage palmPine/oakOak mix
Figure 5-7. Median elevations of vegetation classes at floodplain vegetation/soils transects along the Braden River.
Table 5-5. Median relative elevations (height in feet above the river channel bottom), of vegetation classes at floodplain vegetation/soils transects along the Braden River.
Transect Popash Oak/ popash Hickory/oak Oak/cabbage palm Pine/oak/ Oak
mix 1 7.8 9.1 2 5.5 7.9 8.3 3 7.5 7.8 9.4 4 6.8 5.1 . 5 10.2 6 6.0 7.6 9.2 11.4 7 10.7 8 11.6 11.4 9 11.6 16.8
10 16.5 11 11.2 12 19.2 12.3 13 8.1 14 4.9 5.8 9.5 15.2
Dow
nstr
eam
Ups
trea
m
15 7.6 13.2 *Shaded cells indicate community absence of vegetation class on a transect.
The soils along the Braden River are dominated by sand, limestone, and clay rather than by organic materials (USDA/SCS 1989). Hydric soil conditions along transects occurred at lower median elevations when compared with non-hydric (upland) soils (Wilcoxon Sign Rank; S = 18; p < 0.01). Furthermore, hydric, muck, and saturated soils conditions were characterized by lower elevations
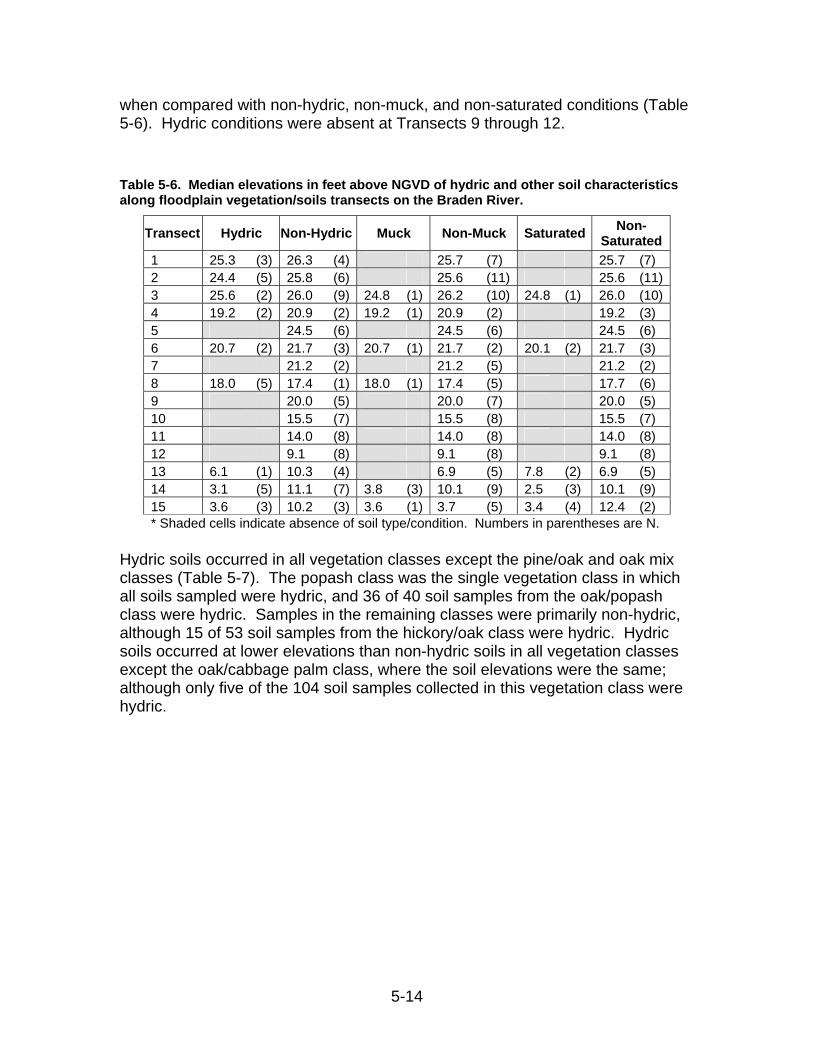
5-14
when compared with non-hydric, non-muck, and non-saturated conditions (Table 5-6). Hydric conditions were absent at Transects 9 through 12. Table 5-6. Median elevations in feet above NGVD of hydric and other soil characteristics along floodplain vegetation/soils transects on the Braden River.
Transect Hydric Non-Hydric Muck Non-Muck Saturated Non- Saturated
1 25.3 (3) 26.3 (4) 25.7 (7) 25.7 (7) 2 24.4 (5) 25.8 (6) 25.6 (11) 25.6 (11)3 25.6 (2) 26.0 (9) 24.8 (1) 26.2 (10) 24.8 (1) 26.0 (10)4 19.2 (2) 20.9 (2) 19.2 (1) 20.9 (2) 19.2 (3) 5 24.5 (6) 24.5 (6) 24.5 (6) 6 20.7 (2) 21.7 (3) 20.7 (1) 21.7 (2) 20.1 (2) 21.7 (3) 7 21.2 (2) 21.2 (5) 21.2 (2) 8 18.0 (5) 17.4 (1) 18.0 (1) 17.4 (5) 17.7 (6) 9 20.0 (5) 20.0 (7) 20.0 (5) 10 15.5 (7) 15.5 (8) 15.5 (7) 11 14.0 (8) 14.0 (8) 14.0 (8) 12 9.1 (8) 9.1 (8) 9.1 (8) 13 6.1 (1) 10.3 (4) 6.9 (5) 7.8 (2) 6.9 (5) 14 3.1 (5) 11.1 (7) 3.8 (3) 10.1 (9) 2.5 (3) 10.1 (9) 15 3.6 (3) 10.2 (3) 3.6 (1) 3.7 (5) 3.4 (4) 12.4 (2) * Shaded cells indicate absence of soil type/condition. Numbers in parentheses are N.
Hydric soils occurred in all vegetation classes except the pine/oak and oak mix classes (Table 5-7). The popash class was the single vegetation class in which all soils sampled were hydric, and 36 of 40 soil samples from the oak/popash class were hydric. Samples in the remaining classes were primarily non-hydric, although 15 of 53 soil samples from the hickory/oak class were hydric. Hydric soils occurred at lower elevations than non-hydric soils in all vegetation classes except the oak/cabbage palm class, where the soil elevations were the same; although only five of the 104 soil samples collected in this vegetation class were hydric.
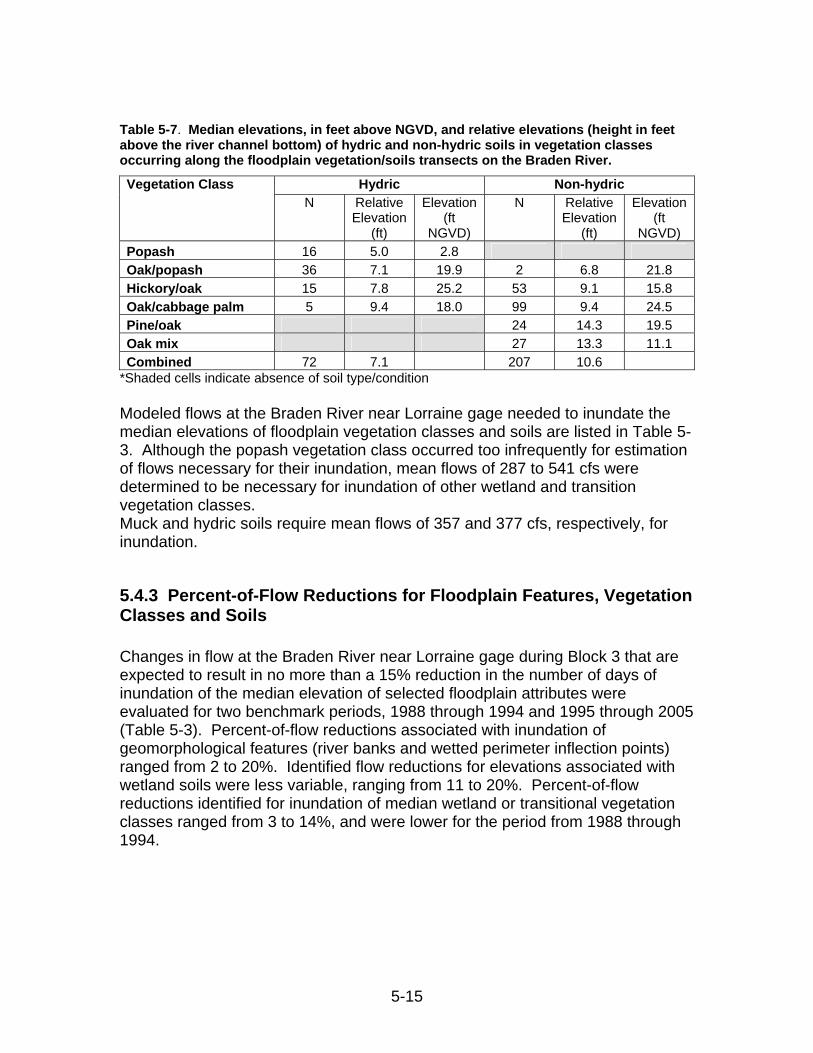
5-15
Table 5-7. Median elevations, in feet above NGVD, and relative elevations (height in feet above the river channel bottom) of hydric and non-hydric soils in vegetation classes occurring along the floodplain vegetation/soils transects on the Braden River.
Hydric Non-hydric Vegetation Class N Relative
Elevation (ft)
Elevation (ft
NGVD)
N Relative Elevation
(ft)
Elevation (ft
NGVD) Popash 16 5.0 2.8 Oak/popash 36 7.1 19.9 2 6.8 21.8 Hickory/oak 15 7.8 25.2 53 9.1 15.8 Oak/cabbage palm 5 9.4 18.0 99 9.4 24.5 Pine/oak 24 14.3 19.5 Oak mix 27 13.3 11.1 Combined 72 7.1 207 10.6
*Shaded cells indicate absence of soil type/condition Modeled flows at the Braden River near Lorraine gage needed to inundate the median elevations of floodplain vegetation classes and soils are listed in Table 5-3. Although the popash vegetation class occurred too infrequently for estimation of flows necessary for their inundation, mean flows of 287 to 541 cfs were determined to be necessary for inundation of other wetland and transition vegetation classes. Muck and hydric soils require mean flows of 357 and 377 cfs, respectively, for inundation.
5.4.3 Percent-of-Flow Reductions for Floodplain Features, Vegetation Classes and Soils Changes in flow at the Braden River near Lorraine gage during Block 3 that are expected to result in no more than a 15% reduction in the number of days of inundation of the median elevation of selected floodplain attributes were evaluated for two benchmark periods, 1988 through 1994 and 1995 through 2005 (Table 5-3). Percent-of-flow reductions associated with inundation of geomorphological features (river banks and wetted perimeter inflection points) ranged from 2 to 20%. Identified flow reductions for elevations associated with wetland soils were less variable, ranging from 11 to 20%. Percent-of-flow reductions identified for inundation of median wetland or transitional vegetation classes ranged from 3 to 14%, and were lower for the period from 1988 through 1994.
5-16
To further investigate limiting factors associated with the Braden River floodplain, percent-of-flow reductions that would result in a 15% loss of the number of days river flows reached a range of flows were identified for the Braden River near Lorraine gage, using flow records for the period of record (Figure 5-8). The low end of the flow range examined reflects the approximate 50% exceedance flow for the period of record (6 cfs), a flow which defines the beginning of Block 3. The high end of the plotted flow range was selected to exclude rare flow events (approximately the 1% exceedance) that would be expected to occur for relatively short durations; durations for which 15% changes would be difficult to evaluate. Figure 5-8 indicates that for flows of approximately 100 cfs or greater, flow reductions that result in a 15% reduction in the number of days the flow is achieved, tend to stabilize around 10% for Braden River near Lorraine gage site. This percent-of-flow reduction is comparable to the flow reduction values derived for mean flows that would inundate dominant wetland vegetation classes, mucky soils, and top of bank elevations (Table 5-3). Collectively, these data indicate that up to a 10% reduction in the flows necessary to inundate floodplain features of the Braden River, including those we have not identified, will result in a 15% or less reduction in the number of days the features are inundated. However, Figure 5-8 also shows that there is a range of flows that occur during Block 3 which do not require flow reductions to be limited to 10% to avoid a 15% reduction in the number of days the flows are achieved. Using the period of record 15% exceedance flow of approximately 54 cfs at the Braden River near Lorraine gage as a cutoff for this range of flows, we can apply a stepped prescription, which allows a 10% reduction in flows when flow exceeds 54 cfs, and a 19% reduction in flows when the flow is below 54 cfs (Figure 5-8). While additional flow reduction steps or percentages could be identified, or an algorithm applied to determine allowable percent-of-flow reductions, the single step approach provides a conservative means for assuring that unidentified factors are likely to be protected and that flows not necessary for prevention of significant harm are available for consumptive use. Unidentified factors could include vegetative classes or species that we did not examine, or inundation of vegetative classes to specified depths.
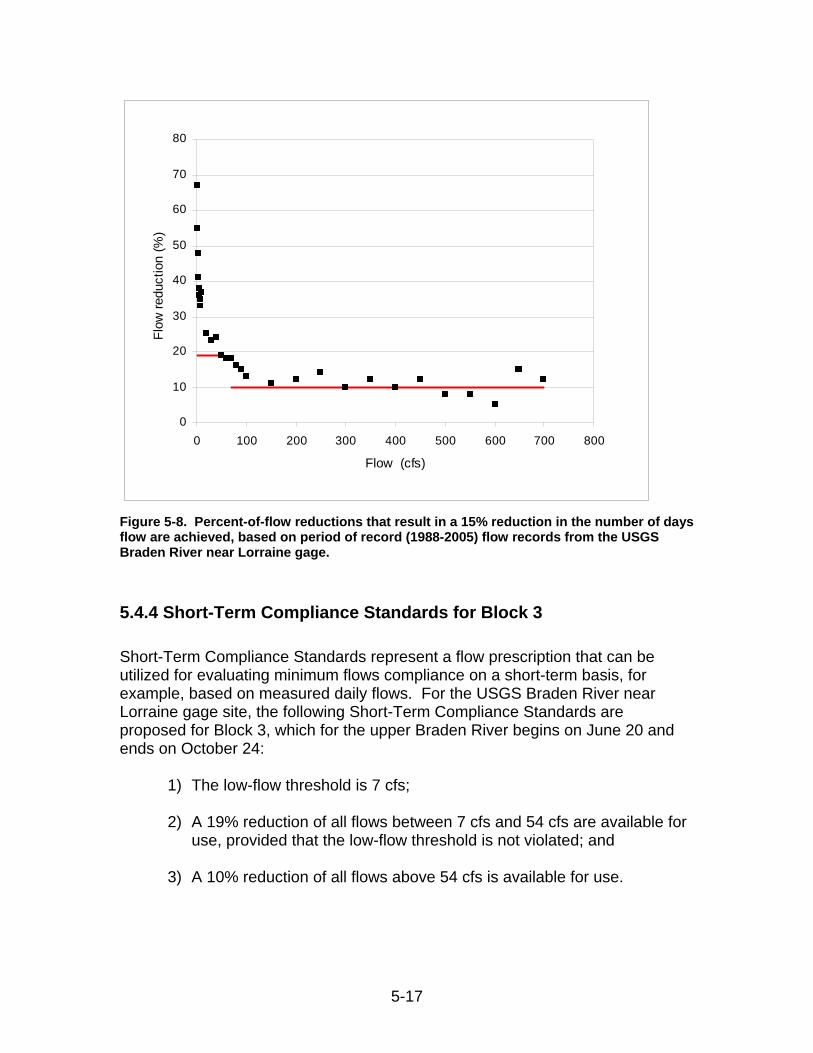
5-17
0
10
20
30
40
50
60
70
80
0 100 200 300 400 500 600 700 800
Flow (cfs)
Flow
redu
ctio
n (%
)
Figure 5-8. Percent-of-flow reductions that result in a 15% reduction in the number of days flow are achieved, based on period of record (1988-2005) flow records from the USGS Braden River near Lorraine gage.
5.4.4 Short-Term Compliance Standards for Block 3 Short-Term Compliance Standards represent a flow prescription that can be utilized for evaluating minimum flows compliance on a short-term basis, for example, based on measured daily flows. For the USGS Braden River near Lorraine gage site, the following Short-Term Compliance Standards are proposed for Block 3, which for the upper Braden River begins on June 20 and ends on October 24:
1) The low-flow threshold is 7 cfs; 2) A 19% reduction of all flows between 7 cfs and 54 cfs are available for
use, provided that the low-flow threshold is not violated; and
3) A 10% reduction of all flows above 54 cfs is available for use.
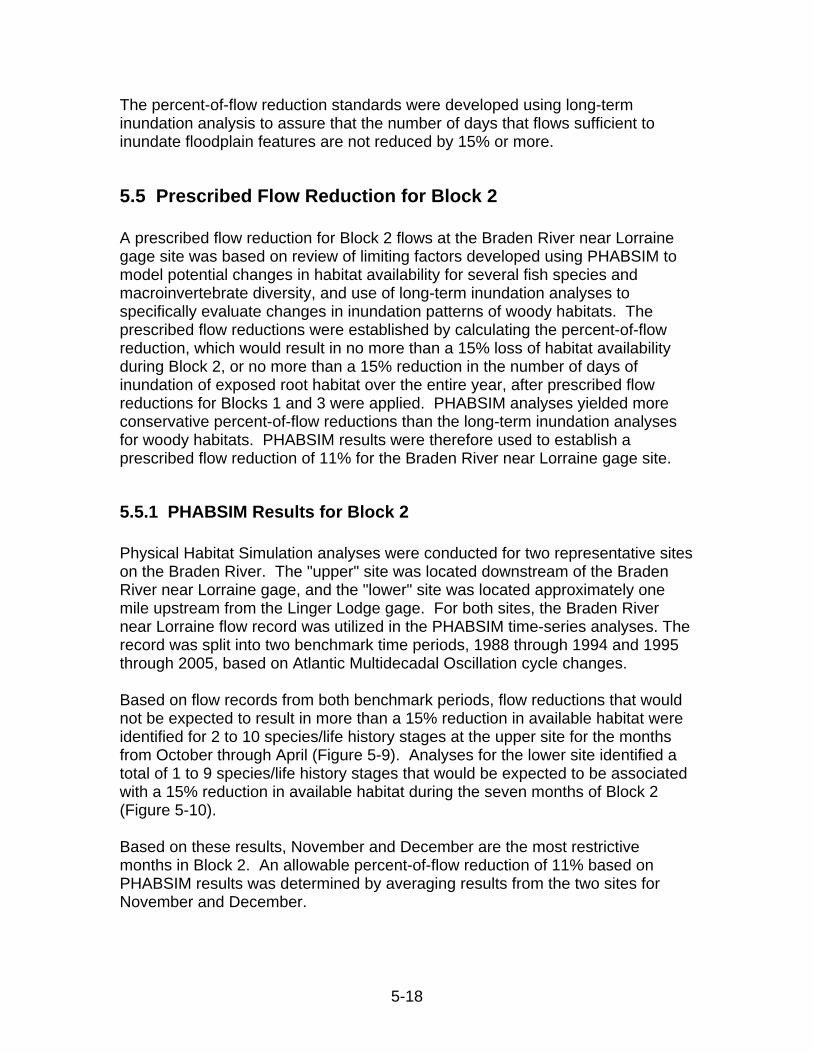
5-18
The percent-of-flow reduction standards were developed using long-term inundation analysis to assure that the number of days that flows sufficient to inundate floodplain features are not reduced by 15% or more.
5.5 Prescribed Flow Reduction for Block 2 A prescribed flow reduction for Block 2 flows at the Braden River near Lorraine gage site was based on review of limiting factors developed using PHABSIM to model potential changes in habitat availability for several fish species and macroinvertebrate diversity, and use of long-term inundation analyses to specifically evaluate changes in inundation patterns of woody habitats. The prescribed flow reductions were established by calculating the percent-of-flow reduction, which would result in no more than a 15% loss of habitat availability during Block 2, or no more than a 15% reduction in the number of days of inundation of exposed root habitat over the entire year, after prescribed flow reductions for Blocks 1 and 3 were applied. PHABSIM analyses yielded more conservative percent-of-flow reductions than the long-term inundation analyses for woody habitats. PHABSIM results were therefore used to establish a prescribed flow reduction of 11% for the Braden River near Lorraine gage site.
5.5.1 PHABSIM Results for Block 2 Physical Habitat Simulation analyses were conducted for two representative sites on the Braden River. The "upper" site was located downstream of the Braden River near Lorraine gage, and the "lower" site was located approximately one mile upstream from the Linger Lodge gage. For both sites, the Braden River near Lorraine flow record was utilized in the PHABSIM time-series analyses. The record was split into two benchmark time periods, 1988 through 1994 and 1995 through 2005, based on Atlantic Multidecadal Oscillation cycle changes. Based on flow records from both benchmark periods, flow reductions that would not be expected to result in more than a 15% reduction in available habitat were identified for 2 to 10 species/life history stages at the upper site for the months from October through April (Figure 5-9). Analyses for the lower site identified a total of 1 to 9 species/life history stages that would be expected to be associated with a 15% reduction in available habitat during the seven months of Block 2 (Figure 5-10). Based on these results, November and December are the most restrictive months in Block 2. An allowable percent-of-flow reduction of 11% based on PHABSIM results was determined by averaging results from the two sites for November and December.
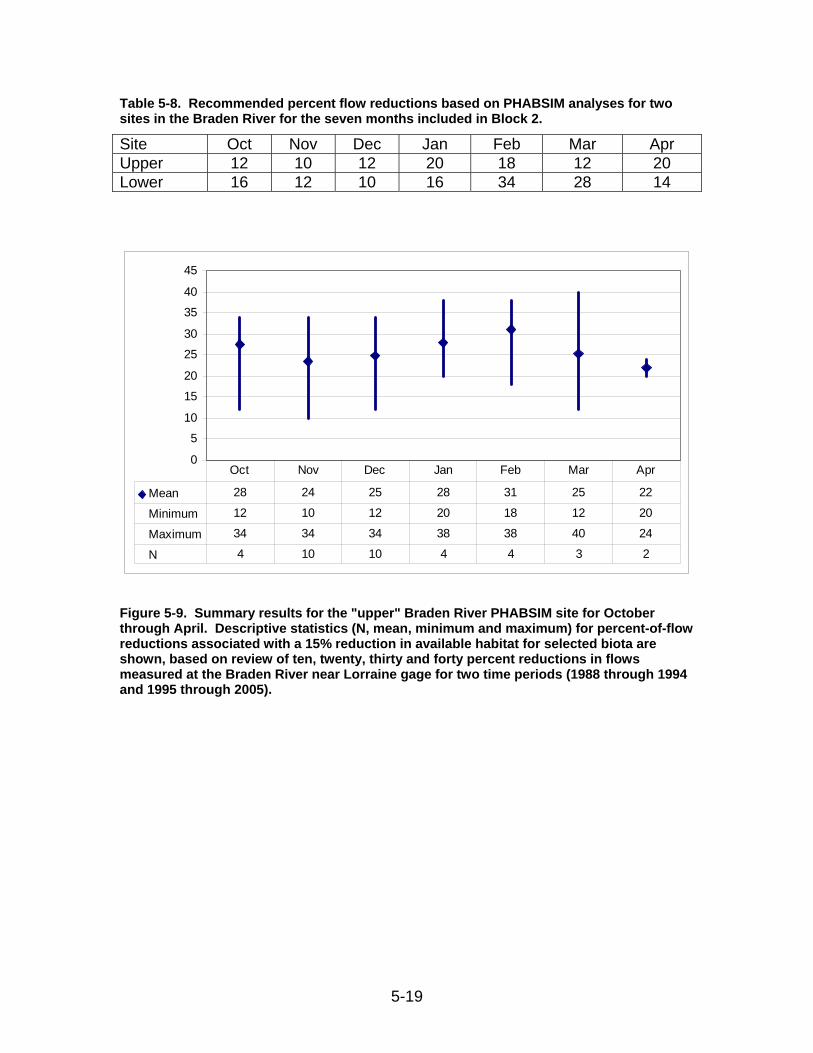
5-19
Table 5-8. Recommended percent flow reductions based on PHABSIM analyses for two sites in the Braden River for the seven months included in Block 2.
Site Oct Nov Dec Jan Feb Mar Apr Upper 12 10 12 20 18 12 20 Lower 16 12 10 16 34 28 14
0
5
10
15
20
25
30
35
40
45
Mean 28 24 25 28 31 25 22
Minimum 12 10 12 20 18 12 20
Maximum 34 34 34 38 38 40 24
N 4 10 10 4 4 3 2
Oct Nov Dec Jan Feb Mar Apr
Figure 5-9. Summary results for the "upper" Braden River PHABSIM site for October through April. Descriptive statistics (N, mean, minimum and maximum) for percent-of-flow reductions associated with a 15% reduction in available habitat for selected biota are shown, based on review of ten, twenty, thirty and forty percent reductions in flows measured at the Braden River near Lorraine gage for two time periods (1988 through 1994 and 1995 through 2005).
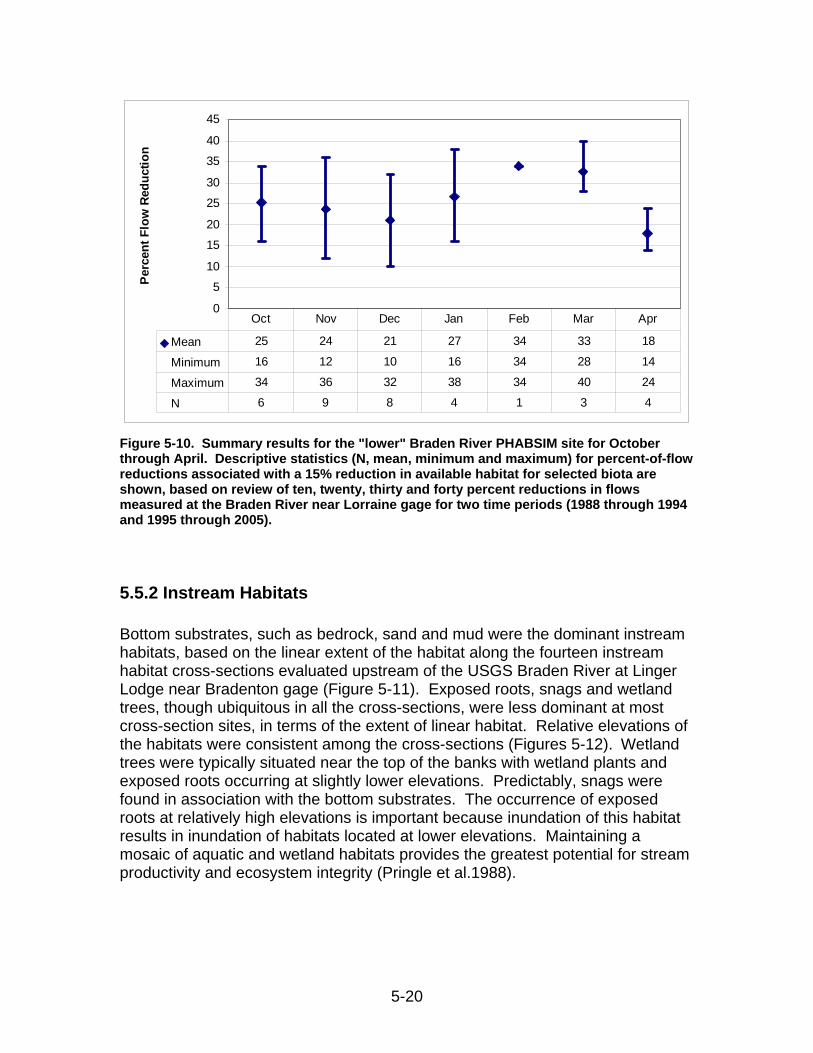
5-20
0
5
10
15
20
25
30
35
40
45
Perc
ent F
low
Red
uctio
n
Mean 25 24 21 27 34 33 18
Minimum 16 12 10 16 34 28 14
Maximum 34 36 32 38 34 40 24
N 6 9 8 4 1 3 4
Oct Nov Dec Jan Feb Mar Apr
Figure 5-10. Summary results for the "lower" Braden River PHABSIM site for October through April. Descriptive statistics (N, mean, minimum and maximum) for percent-of-flow reductions associated with a 15% reduction in available habitat for selected biota are shown, based on review of ten, twenty, thirty and forty percent reductions in flows measured at the Braden River near Lorraine gage for two time periods (1988 through 1994 and 1995 through 2005).
5.5.2 Instream Habitats Bottom substrates, such as bedrock, sand and mud were the dominant instream habitats, based on the linear extent of the habitat along the fourteen instream habitat cross-sections evaluated upstream of the USGS Braden River at Linger Lodge near Bradenton gage (Figure 5-11). Exposed roots, snags and wetland trees, though ubiquitous in all the cross-sections, were less dominant at most cross-section sites, in terms of the extent of linear habitat. Relative elevations of the habitats were consistent among the cross-sections (Figures 5-12). Wetland trees were typically situated near the top of the banks with wetland plants and exposed roots occurring at slightly lower elevations. Predictably, snags were found in association with the bottom substrates. The occurrence of exposed roots at relatively high elevations is important because inundation of this habitat results in inundation of habitats located at lower elevations. Maintaining a mosaic of aquatic and wetland habitats provides the greatest potential for stream productivity and ecosystem integrity (Pringle et al.1988).
5-21
12
34
56
78
910
1213
1415
0
10
20
30
40
50
60
70
80
90
100%
DO
MIN
AN
CE
WETLAND TREES
WETLAND PLANTS
EXPOSED ROOTS
SNAGS
BOTTOMSUBSTRATES
SITES
Figure 5-11. Percent dominance of instream habitats based on linear extent of the habitats along fourteen cross-sections in the Braden River.
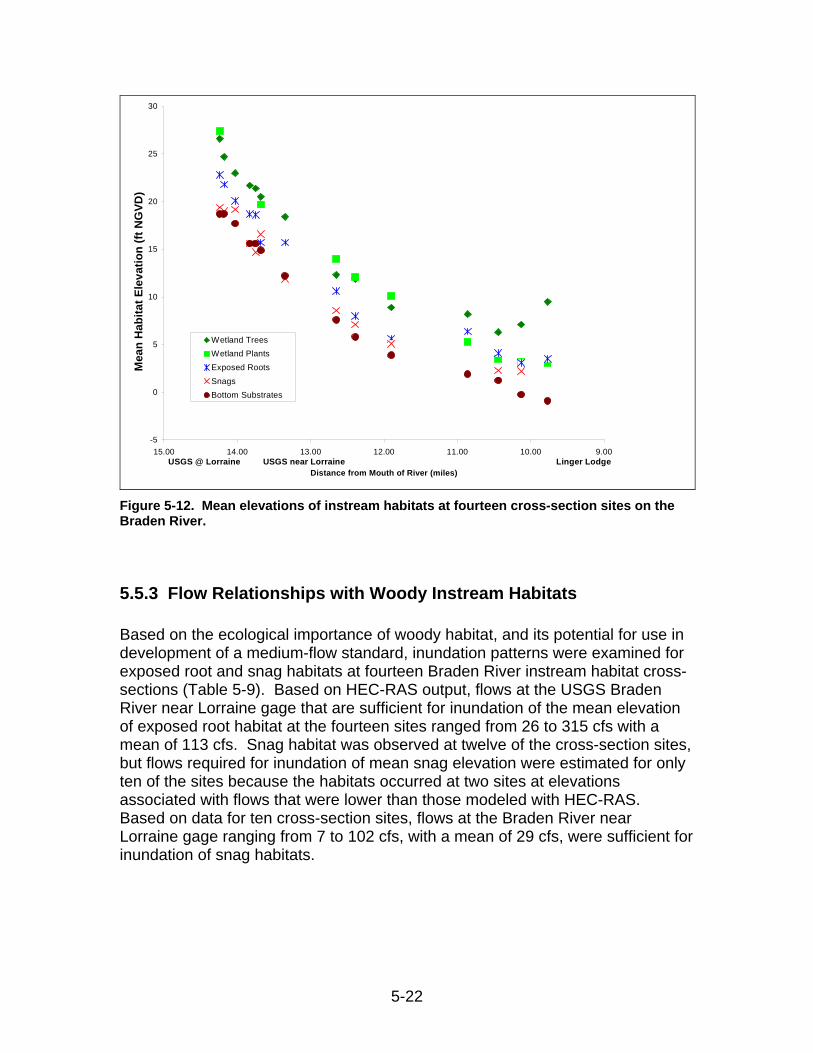
5-22
-5
0
5
10
15
20
25
30
9.0010.0011.0012.0013.0014.0015.00
Distance from Mouth of River (miles)
Mea
n H
abita
t Ele
vatio
n (ft
NG
VD)
Wetland TreesWetland PlantsExposed RootsSnagsBottom Substrates
Linger LodgeUSGS @ Lorraine USGS near Lorraine
Figure 5-12. Mean elevations of instream habitats at fourteen cross-section sites on the Braden River.
5.5.3 Flow Relationships with Woody Instream Habitats Based on the ecological importance of woody habitat, and its potential for use in development of a medium-flow standard, inundation patterns were examined for exposed root and snag habitats at fourteen Braden River instream habitat cross-sections (Table 5-9). Based on HEC-RAS output, flows at the USGS Braden River near Lorraine gage that are sufficient for inundation of the mean elevation of exposed root habitat at the fourteen sites ranged from 26 to 315 cfs with a mean of 113 cfs. Snag habitat was observed at twelve of the cross-section sites, but flows required for inundation of mean snag elevation were estimated for only ten of the sites because the habitats occurred at two sites at elevations associated with flows that were lower than those modeled with HEC-RAS. Based on data for ten cross-section sites, flows at the Braden River near Lorraine gage ranging from 7 to 102 cfs, with a mean of 29 cfs, were sufficient for inundation of snag habitats.
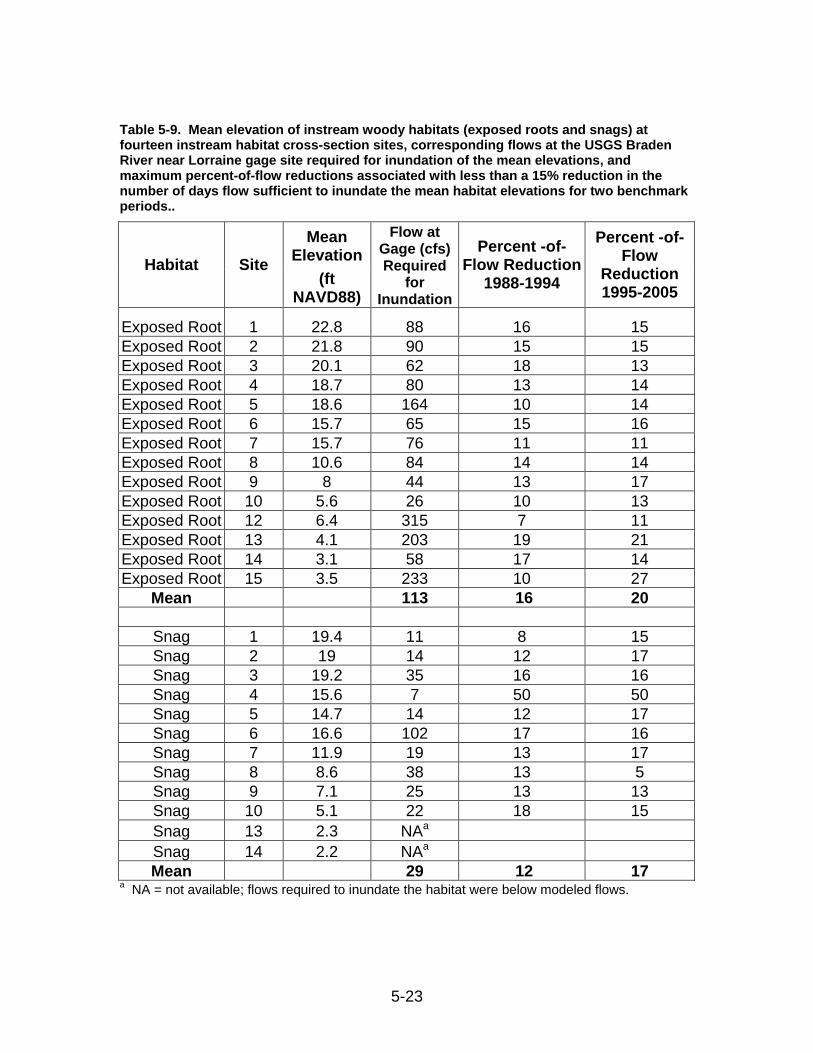
5-23
Table 5-9. Mean elevation of instream woody habitats (exposed roots and snags) at fourteen instream habitat cross-section sites, corresponding flows at the USGS Braden River near Lorraine gage site required for inundation of the mean elevations, and maximum percent-of-flow reductions associated with less than a 15% reduction in the number of days flow sufficient to inundate the mean habitat elevations for two benchmark periods..
Mean ElevationHabitat Site
(ft NAVD88)
Flow at Gage (cfs) Required
for Inundation
Percent -of- Flow Reduction
1988-1994
Percent -of- Flow
Reduction 1995-2005
Exposed Root 1 22.8 88 16 15 Exposed Root 2 21.8 90 15 15 Exposed Root 3 20.1 62 18 13 Exposed Root 4 18.7 80 13 14 Exposed Root 5 18.6 164 10 14 Exposed Root 6 15.7 65 15 16 Exposed Root 7 15.7 76 11 11 Exposed Root 8 10.6 84 14 14 Exposed Root 9 8 44 13 17 Exposed Root 10 5.6 26 10 13 Exposed Root 12 6.4 315 7 11 Exposed Root 13 4.1 203 19 21 Exposed Root 14 3.1 58 17 14 Exposed Root 15 3.5 233 10 27
Mean 113 16 20
Snag 1 19.4 11 8 15 Snag 2 19 14 12 17 Snag 3 19.2 35 16 16 Snag 4 15.6 7 50 50 Snag 5 14.7 14 12 17 Snag 6 16.6 102 17 16 Snag 7 11.9 19 13 17 Snag 8 8.6 38 13 5 Snag 9 7.1 25 13 13 Snag 10 5.1 22 18 15 Snag 13 2.3 NAa Snag 14 2.2 NAa Mean 29 12 17
a NA = not available; flows required to inundate the habitat were below modeled flows.
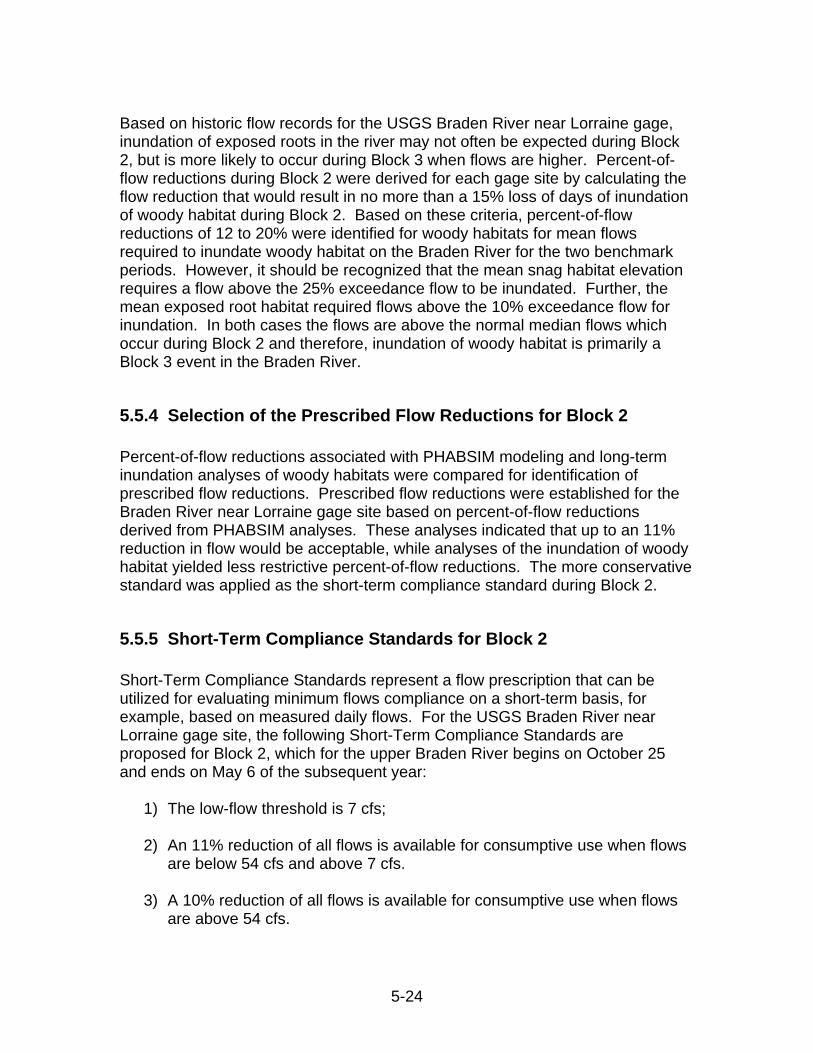
5-24
Based on historic flow records for the USGS Braden River near Lorraine gage, inundation of exposed roots in the river may not often be expected during Block 2, but is more likely to occur during Block 3 when flows are higher. Percent-of-flow reductions during Block 2 were derived for each gage site by calculating the flow reduction that would result in no more than a 15% loss of days of inundation of woody habitat during Block 2. Based on these criteria, percent-of-flow reductions of 12 to 20% were identified for woody habitats for mean flows required to inundate woody habitat on the Braden River for the two benchmark periods. However, it should be recognized that the mean snag habitat elevation requires a flow above the 25% exceedance flow to be inundated. Further, the mean exposed root habitat required flows above the 10% exceedance flow for inundation. In both cases the flows are above the normal median flows which occur during Block 2 and therefore, inundation of woody habitat is primarily a Block 3 event in the Braden River.
5.5.4 Selection of the Prescribed Flow Reductions for Block 2 Percent-of-flow reductions associated with PHABSIM modeling and long-term inundation analyses of woody habitats were compared for identification of prescribed flow reductions. Prescribed flow reductions were established for the Braden River near Lorraine gage site based on percent-of-flow reductions derived from PHABSIM analyses. These analyses indicated that up to an 11% reduction in flow would be acceptable, while analyses of the inundation of woody habitat yielded less restrictive percent-of-flow reductions. The more conservative standard was applied as the short-term compliance standard during Block 2.
5.5.5 Short-Term Compliance Standards for Block 2 Short-Term Compliance Standards represent a flow prescription that can be utilized for evaluating minimum flows compliance on a short-term basis, for example, based on measured daily flows. For the USGS Braden River near Lorraine gage site, the following Short-Term Compliance Standards are proposed for Block 2, which for the upper Braden River begins on October 25 and ends on May 6 of the subsequent year:
1) The low-flow threshold is 7 cfs; 2) An 11% reduction of all flows is available for consumptive use when flows
are below 54 cfs and above 7 cfs.
3) A 10% reduction of all flows is available for consumptive use when flows are above 54 cfs.
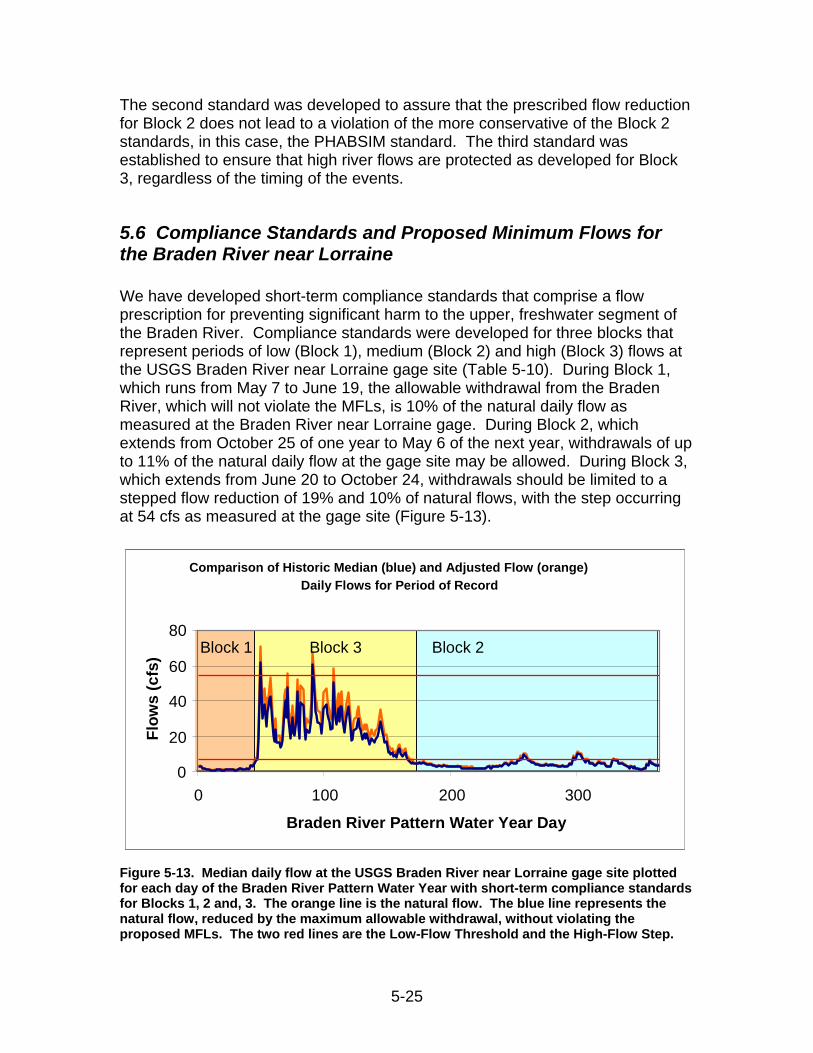
5-25
The second standard was developed to assure that the prescribed flow reduction for Block 2 does not lead to a violation of the more conservative of the Block 2 standards, in this case, the PHABSIM standard. The third standard was established to ensure that high river flows are protected as developed for Block 3, regardless of the timing of the events.
5.6 Compliance Standards and Proposed Minimum Flows for the Braden River near Lorraine We have developed short-term compliance standards that comprise a flow prescription for preventing significant harm to the upper, freshwater segment of the Braden River. Compliance standards were developed for three blocks that represent periods of low (Block 1), medium (Block 2) and high (Block 3) flows at the USGS Braden River near Lorraine gage site (Table 5-10). During Block 1, which runs from May 7 to June 19, the allowable withdrawal from the Braden River, which will not violate the MFLs, is 10% of the natural daily flow as measured at the Braden River near Lorraine gage. During Block 2, which extends from October 25 of one year to May 6 of the next year, withdrawals of up to 11% of the natural daily flow at the gage site may be allowed. During Block 3, which extends from June 20 to October 24, withdrawals should be limited to a stepped flow reduction of 19% and 10% of natural flows, with the step occurring at 54 cfs as measured at the gage site (Figure 5-13).
Comparison of Historic Median (blue) and Adjusted Flow (orange) Daily Flows for Period of Record
0
20
40
60
80
0 100 200 300
Braden River Pattern Water Year Day
Flow
s (c
fs) Block 1 Block 3 Block 2
Comparison of Historic Median (blue) and Adjusted Flow (orange) Daily Flows for Period of Record
0
20
40
60
80
0 100 200 300
Braden River Pattern Water Year Day
Flow
s (c
fs) Block 1 Block 3 Block 2
Figure 5-13. Median daily flow at the USGS Braden River near Lorraine gage site plotted for each day of the Braden River Pattern Water Year with short-term compliance standards for Blocks 1, 2 and, 3. The orange line is the natural flow. The blue line represents the natural flow, reduced by the maximum allowable withdrawal, without violating the proposed MFLs. The two red lines are the Low-Flow Threshold and the High-Flow Step.
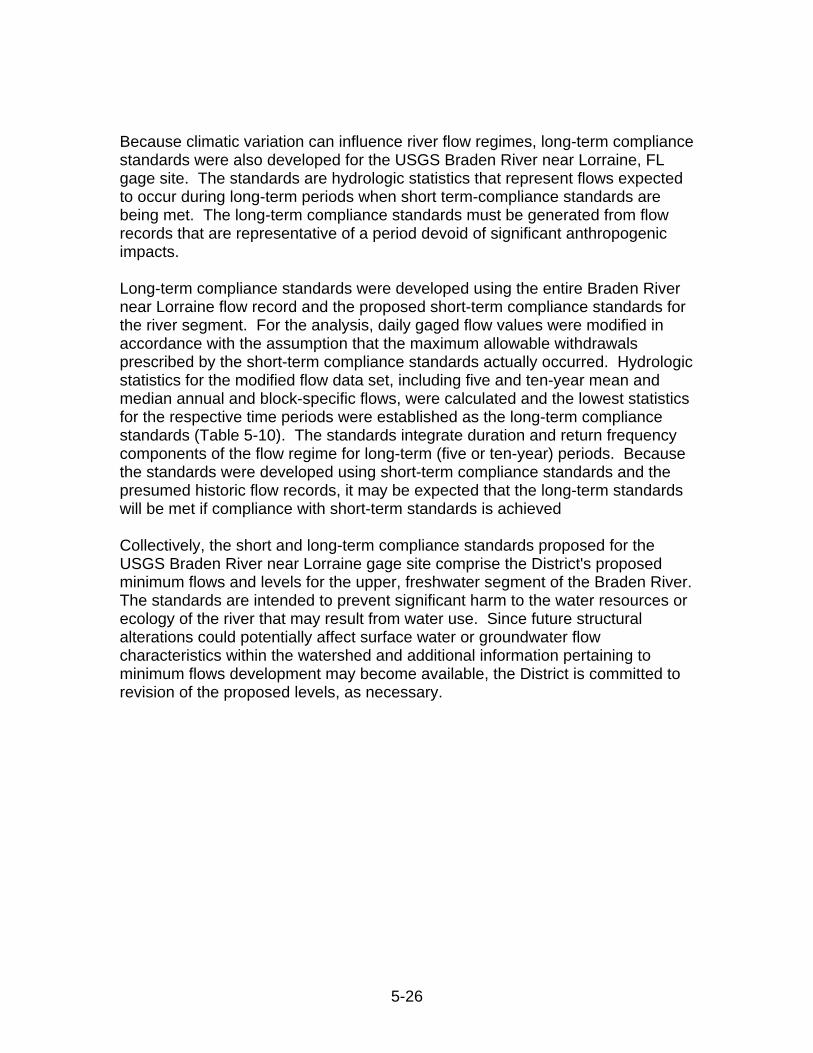
5-26
Because climatic variation can influence river flow regimes, long-term compliance standards were also developed for the USGS Braden River near Lorraine, FL gage site. The standards are hydrologic statistics that represent flows expected to occur during long-term periods when short term-compliance standards are being met. The long-term compliance standards must be generated from flow records that are representative of a period devoid of significant anthropogenic impacts. Long-term compliance standards were developed using the entire Braden River near Lorraine flow record and the proposed short-term compliance standards for the river segment. For the analysis, daily gaged flow values were modified in accordance with the assumption that the maximum allowable withdrawals prescribed by the short-term compliance standards actually occurred. Hydrologic statistics for the modified flow data set, including five and ten-year mean and median annual and block-specific flows, were calculated and the lowest statistics for the respective time periods were established as the long-term compliance standards (Table 5-10). The standards integrate duration and return frequency components of the flow regime for long-term (five or ten-year) periods. Because the standards were developed using short-term compliance standards and the presumed historic flow records, it may be expected that the long-term standards will be met if compliance with short-term standards is achieved Collectively, the short and long-term compliance standards proposed for the USGS Braden River near Lorraine gage site comprise the District's proposed minimum flows and levels for the upper, freshwater segment of the Braden River. The standards are intended to prevent significant harm to the water resources or ecology of the river that may result from water use. Since future structural alterations could potentially affect surface water or groundwater flow characteristics within the watershed and additional information pertaining to minimum flows development may become available, the District is committed to revision of the proposed levels, as necessary.
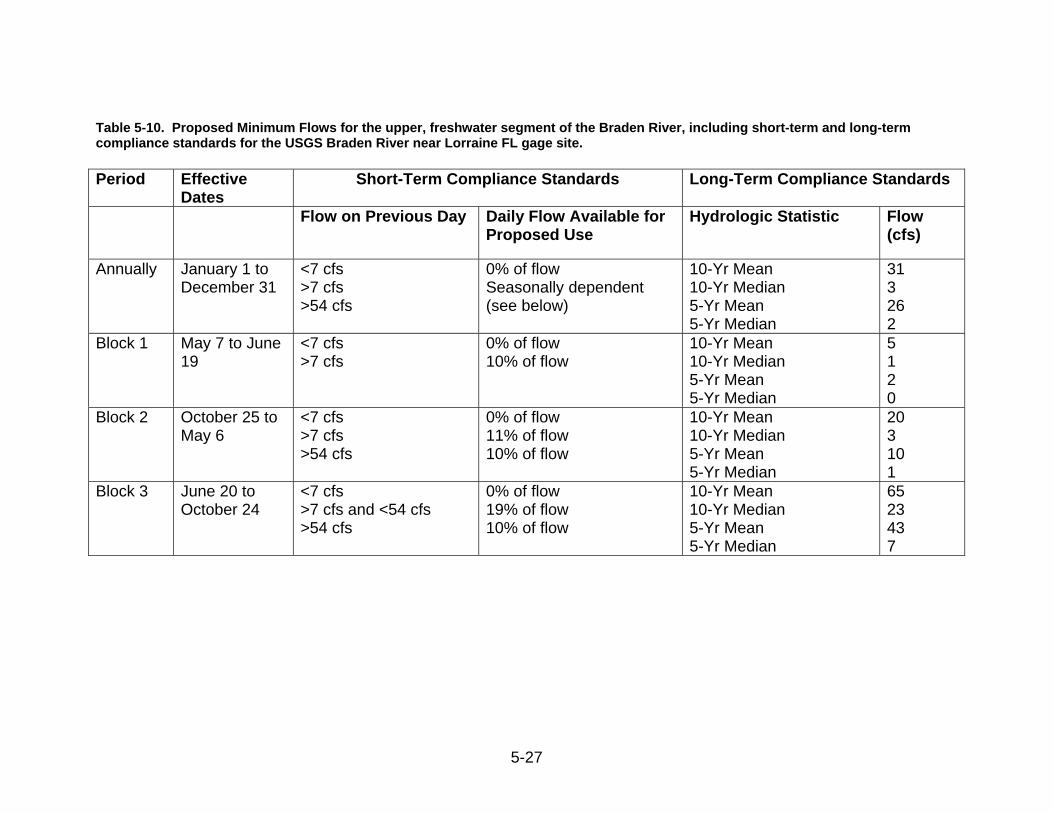
5-27
Table 5-10. Proposed Minimum Flows for the upper, freshwater segment of the Braden River, including short-term and long-term compliance standards for the USGS Braden River near Lorraine FL gage site.
Period Effective Dates
Short-Term Compliance Standards Long-Term Compliance Standards
Flow on Previous Day Daily Flow Available for Proposed Use
Hydrologic Statistic Flow (cfs)
Annually January 1 to December 31
<7 cfs >7 cfs >54 cfs
0% of flow Seasonally dependent (see below)
10-Yr Mean 10-Yr Median 5-Yr Mean 5-Yr Median
31 3 26 2
Block 1 May 7 to June 19
<7 cfs >7 cfs
0% of flow 10% of flow
10-Yr Mean 10-Yr Median 5-Yr Mean 5-Yr Median
5 1 2 0
Block 2
October 25 to May 6
<7 cfs >7 cfs >54 cfs
0% of flow 11% of flow 10% of flow
10-Yr Mean 10-Yr Median 5-Yr Mean 5-Yr Median
20 3 10 1
Block 3 June 20 to October 24
<7 cfs >7 cfs and <54 cfs >54 cfs
0% of flow 19% of flow 10% of flow
10-Yr Mean 10-Yr Median 5-Yr Mean 5-Yr Median
65 23 43 7
6-1
Chapter 6 Literature Cited 3001, Inc. Date Unknown. Manatee County LiDAR data. Fairfax, Virginia. Available from the Mapping and GIS Section of the Southwest Florida Water Management District. Brooksville, Florida. Aho, J.M and J.W. Terrell. 1986. Habitat suitability index models and instream flow suitability curves: Redbreast sunfish. U.S. Fish and Wildlife Service Biological Report. 82(10.119). Ainsle, W.B., B.A. Pruitt, R.D. Smith, T.H. Roberts, E.J. Sparks, and M. Miller. 1999. A regional guidebook for assessing the functions of low gradient riverine wetlands in western Kentucky. U.S. Army Corps of Engineers Waterways Experiment Station. Technical Report WRP-DE-17. Vicksburg, MS. Anderson, J., E. Hardy, J. Roach, and R. Witmer. 1976. A land use and land cover classification system for use with remote sensor data. Geological Survey Professional Paper 964. United States Government Printing Office, Washington, D.C. Annear, T.C. and A.L. Condor. 1984. Relative bias of several fisheries instream flow methods. North American Journal of Fisheries Management. 4:531- 539. Basso, R. and R. Schultz. 2003. Long-term variation in rainfall and its effect on Peace River flow in West-Central Florida. Hydrologic Evaluation Section, Southwest Florida Water Management District. Brooksville, FL. 33 pp. Beecher, H. 1990. Standards for instream flows. Rivers 1(2): 97-109. Benke, A.C., R.L Henry III, D.M. Gillespie, and R.J. Hunter. 1985. Importance of the snag habitat for animal production in a Southeastern stream. Fisheries 10: 8 -13. Benke, A.C. and J.B. Wallace. 1990. Wood dynamics in coastal plain blackwater streams. Canadian Journal of Fisheries and Aquatic Sciences 47: 92-99. Benke, A.C., T.C. Van Arsdall Jr., D.M. Gillespie, and F.K. Parrish. 1984. Invertebrate productivity in a subtropical blackwater river: the importance of habitat and life history. Ecological Monographs 54: 25-63. Bovee, K.D., B.L. Lamb, J.M. Bartholow, C.B. Stalnaker, J. Taylor, and J. Hendrickson. 1998. Stream habitat analysis using the instream flow incremental methodology. U.S. Geological Survey, Biological Resources
6-2
Division Information and Technology Report USGS/BRD-1998-0004. Brinson, M.M., B.L. Swift, R.C. Plantico, and J.S. Barclay. 1981. Riparian ecosystems: their ecology and status. U.S. Fish and Wildlife Service, Biological Services Program Report FWS/OBS-81/17. Washington, D.C. Brown, M.T., J.M. Schaefer, and K.H. Brandt. 1990. Buffer zones for water, wetlands and wildlife in East Central Florida. CFW Publication #89-07. Florida Agricultural Experiment Stations Journal Series No. T-00061. East Central Florida Regional Planning Council. Brussock , P.P., A.V. Brown, and J.C. Dixon. 1985. Channel form and stream ecosystem models. Water Resources Bulletin 21: 859-866. Bunn, S.E. and A.H. Arthington. 2002. Basic principles and ecological consequences of altered flow regimes for aquatic biodiversity. Environmental Management 30: 492-507. Cherry, R.N., Stewart, J.W., and J.A. Mann. 1970. General hydrology of the Middle Gulf area: Tallahassee, Florida Bureau of Geology, Report of Investigations no. 56, 96 pp. Conner, W.H. and J.W. Day. 1976. Productivity and composition of a bald cypress-water tupelo site and a bottomland hardwood site in a Louisiana swamp. American Journal of Botany 63: 1354-1364. Cottam, G. and J.T. Curtis. 1956. The use of distance measures in phytosociological sampling. Ecology 37(3): 451-460. Crance, J.H. 1988. Relationships between palustrine forested wetlands of forested riparian floodplains and fishery resources: a review. Biological Report 88(32). U.S. Fish and Wildlife Service. Washington, D.C. Cudney, M.D. and J.D. Wallace. 1980. Life cycles, microdistribution and production dynamics of six net-spinning caddisflies in a large southeastern (USA) river. Holartic Ecology 3: 169-182. DelCharco, M. J. and B. R. Lewelling. 1997. Hydrologic description of the Braden River watershed, west-central Florida. USGS open file report 96-634, Tallahassee, Florida. 30 pp Dunbar, M.J., A. Gustard, M.C. Acreman, and C.R. Elliott. 1998. Overseas approaches to setting river flow objectives. Institute of Hydrology. R&D Technical Report W6-161. Oxon, England. 83 pp.
6-3
Edwards, R.T. and J. L. Meyer. 1987. Metabolism of a sub-tropical low gradient blackwater river. Freshwater Biology 17: 251-263. Enfield, D., A. Mestas-Nunez, and P. Trimble. 2001. The Atlantic Multidecadal Oscillation and its relation to rainfall and river flows in the continental U.S. Geophysical Research Letters 28(10): 2077-2080. Friedemann, M. and J. Hand. 1989. Typical water quality values for Florida’s lakes, streams, and estuaries. Department of Environmental Regulation. State of Florida. Tallahassee, FL. 23 pp.+ appendices. Goldenberg, S.B., C.W. Landsea, A.M. Mestas-Nunez, and W.M. Gray. The recent increase in Atlantic hurricane activity: causes and implications. Science 293: 474-479. Gore, J. A., C. Dahm, and C. Klimas. 2002. A review of "Upper Peace River: an analysis of minimum flows and levels". Prepared for the Southwest Florida Water Management District. Brooksville, FL. Gore, J.A., J.B. Layzer, and J. Mead. 2001. Macroinvertebrate instream flow studies after 20 years: a role in stream and river restoration. Regulated Rivers 17: 527-542. Gregory, S.V., F.J. Swanson, W.A. McKee, and K.W. Cummins. 1991. An ecosystem perspective on riparian zones. Bioscience 41: 540-551. Hammett, K. 1990. Land use, water use, streamflow characteristics, and water-quality characteristics of the Charlotte Harbor inflow area, Florida. United States Geological Survey Water-Supply Paper 2359. Prepared in cooperation with the Florida Department of Environmental Regulation. Tallahassee, FL. 64 pp. Hickey, J. 1998. Analysis of stream flow and rainfall at selected sites in west-central Florida. SDI Environmental Services. Tampa, Florida. 53 pp. Hill, J. E. and C.E. Cichra. 2002. Minimum flows and levels criteria development. Evaluation of the importance of water depth and frequency of water levels / flows on fish population dynamics, literature review and summary: the effects of water levels on fish populations. Institute of Food and Agricultural Sciences, Department of Fisheries and Aquatic Sciences. University of Florida. Gainesville, FL. 40 pp. Hill, M.T., W.S. Platts, and R.L. Beschta. 1991. Ecological and geological concepts for instream and out-of-channel flow requirements. Rivers 2: 198-210. Hook, D.D. and C.L. Brown. 1973. Root adaptations and relative flood tolerance of five hardwood species. Forest Science 19(3): 225-229.
6-4
Hupalo, R., C. Neubauer, L. Keenan, D. Clapp and E. Lowe. 1994. Establishment of minimum flows and levels for the Wekiva River system. Technical Publication SJ94-1. St. Johns River Water Management District. Palatka, FL. Huryn, A.D. and J.B. Wallace. 1987. Local geomorphology as a determinant of macrofaunal production in a mountain stream. Ecology 68: 1932-1942. Instream Flow Council. 2002. Instream Flows for Riverine Resource Stewardship. Instream Flow Council. 411 pp. Johnson, D.H. 1980. The comparison of usage and availability measurements for evaluating resource preference. Ecology 69: 125-134. Jowett, I.G. 1993. Minimum flow requirements for instream habitat in Welllington rivers. NZ Freshwater Miscellaneous Report No. 63. National Institute of Water and Atmospheric Research, Christchurch. 33 pp. Junk, W. P., P.B. Bayley, and R.E. Sparks. 1989. The flood pulse concept in river-floodplain systems. Pp. 110-127 in D.P. Dodge (ed.), Proceedings of the International Large River Symposium. Special Publication of the Canadian Journal of Fisheries and Aquatic Sciences 106. Kelly, M.H. 2004. Florida river flow patterns and the Atlantic Multidecadal Oscillation. Draft report. Ecologic Evaluation Section. Southwest Florida Water Management District. Brooksville, FL. 80 pp. + appendix. Kelly, M. H., A. B. Munson, J. Morales, and D. A. Leeper. 2005a. Proposed minimum flows for the middle segment of the Peace River, from Zolfo Springs to Arcadia. Ecologic Evaluation Section. Southwest Florida Water Management District. Brooksville, FL . 165 pp + appendix Kelly, M. H., A. B. Munson, J. Morales, and D. A. Leeper. 2005b. Alafia River minimum flows and levels; freshwater segment including Lithia and Buckhorn Springs. Ecologic Evaluation Section. Southwest Florida Water Management District. Brooksville, FL . 235 pp + appendix Kelly, M. H., A. B. Munson, J. Morales, and D. A. Leeper. 2005c. Proposed minimum flows and levels for the upper segment of the Myakka River, from Myakka City to SR 72. Ecologic Evaluation Section. Southwest Florida Water Management District. Brooksville, FL . 164 pp + appendix Kelly, M. H., A. B. Munson, J. Morales, and D. Leeper. 2007. Proposed minimum flows and levels for the upper segment of the Hillsborough River, from Crystal Springs to Morris Bridge, and Crystal Springs. Ecologic Evaluation Section.
6-5
Southwest Florida Water Management District. Brooksville, FL. 227 pp + appendix Kohler, M.A., Nordenson, and Baker, 1959. Evaporation maps for the United States, U.S. Weather Bureau Technical Paper 37, 13 pp. Kuensler, E.J. 1989. Values of forested wetlands as filters for sediments and nutrients. Pp. 85-96 in D.D. Hook and R. Lea (eds.), Proceedings of the Symposium: The Forested Wetlands of the United States. USDA Forest Service, Southeastern Forest Experimental Station, General Technical Report SE-50. Lewelling, B.R. 2004. Extent of areal inundation of riverine wetlands along five river systems in the upper Hillsborough River watershed, west-central Florida. U.S. Geological Survey Water Resources Investigations Report 2004-5133. 76 pp. Manly, B.F.J., L.L. McDonald, and D.L. Thomas. 1993. Resource Selection by Animals: tatistical design and analysis for field studies. Chapman and Hall, London. McCabe, G. and D. Wolock. 2002. A step increase in streamflow in the conterminous United States. Geophysical Research Letters 29: 2185-2188. McKevlin, M.R., D.D. Hook, and A. A. Rozelle. 1998. Adaptations of plants to flooding and soil waterlogging. Pp 173 - 204. In Messina, M. G. and W H. Conner (eds.). Southern Forested Wetlands: Ecology and Management. Lewis Publishers. Mertes, L. A. K. 1997. Documentation and significance of the perirheic zone on inundated floodplains. Water Resources Research 33(7): 1749-1762. Milhous, R.T., J.M. Bartholow, M.A. Updike, and A.R.Moos. 1990. Reference manual for generation and analysis of habit time series – version II. U.S. Fish and Wildlife Service, Biol. Rpt. 90(16). Munson, A. B., J. J. Delfino, and D. A. Leeper. 2005. Determining minimum levels: the Florida experience. Journal of the American Water Resources Association. 41(1):1-10. Munson, A. B. and J. J. Delfino. 2007. Minimum wet-season flows and levels in southwest Florida rivers. Journal of the American Water Resources Association. 43(2): 522-532. PBS&J . 2006. Characterization of woody wetland vegetation communities along the Braden River - Volume II of characterization of wetland vegetation
6-6
communities in the corridors of the Myakka and Braden Rivers. PBS&J, Tampa, Florida. Postel, S. and B. Richter. 2003. Rivers for life: managing water for people and nature. Island Press. Washington, D.C. 253 pp. Pringle, C.M., R. Naiman, G. Bretchko, J. Karr, M. Oswood, J. Webster, R. Welcomme, and M.J. Winterbourn. 1988. Patch dynamics in lotic ecosystems: the stream as a mosaic. Journal of the North American Benthological Society 7: 503-524. Reiser, D.W., T.A. Wesche, and C. Estes. 1989. Status of instream flow legislation and practices in North America. Fisheries 14: 22-29. Richter, B.D. , J.V. Baumgartner, J. Powell, and D.P. Braun. 1996. A method for assessing hydrologic alteration within ecosystems. Conservation Biology 10: 1163-1174. Scheele, D.S. 1975. Reality construction as a product of Delphi interaction. Pp. 37-41 in H.A. Linstone and M. Turoff (eds.), The Delphi method: techniques and applications. Addison-Wesley, Reading, MA. Shaw, D. T., C. N. Dahm, and S. W. Golladay. 2005. A review of "Proposed minimum flows and levels for the middle segment of the Peace River, from Zolfo Springs to Arcadia". Southwest Florida Water Management District, Brooksville, FL. 23 pp. Smith, D.L. and P. Stopp. 1978. The River Basin: an introduction to the study of hydrology. Cambridge University Press. London, England. 120 pp. Smock, L.A., E. Gilinsky, and D.L. Stoneburner. 1985. Macroinvertebrate production in a southeastern U.S. blackwater stream. Ecology 66: 1491- 1503. Smock, L.A. and C.E. Roeding. 1986. The trophic basis of production of the macroinvertebrate community of a southeastern U.S.A. blackwater stream. Holarctic Ecology 9: 165-174. Southwest Florida Water Management District. 2002. Upper Peace River: an analysis of minimum flows and levels, Draft. Ecologic Evaluation Section. Resource Conservation and Development Department. Brooksville, FL. Stalnaker, C.B. 1990. Minimum flow is a myth. Pp. 31-33 in M.B. Bain (ed.), Ecology and assessment of warmwater streams: workshop synopsis. Biological Report 90(5). U.S. Fish and Wildlife Service. Washington, D.C.
6-7
Stanturf, J.A. and S.H. Schoenholtz. 1998. Soils and landform. P. 123-147. In M.G. Messina and W.H. Conner (eds.) Southern Forested Wetlands: Ecology and Management. Lewis Publishers, Boca Raton, FL. Stalnaker, C., B.L. Lamb, J. Henriksen, K. Bovee, and J. Bartholow. 1995. The Instream Flow Incremental Methodology: a primer for IFIM. Biological Report 29. U.S. Department of the Interior. National Biological Service. Washington, D.C. 46 pp. Stuber, R.J., G. Gebhardt, and O.E. Maughan. 1982. Habitat suitability index models: Largemouth bass. U.S. Fish and Wildlife Service, FWS/OBS-82/10.16. Sutton, R.T. and D.L.R. Hodson. 2005. Atlantic Ocean forcing of North American and European summer climate. Science 309: 115-118. Tate, R.L. III. 1980. Microbial oxidation of organic matter in Histosols. Advances in Microbial Ecology 4: 169-201. Tharme, R.E. and J.M. King. 1998. Development of the building block methodology for instream flow assessments and supporting research on the effects of different magnitude flows on riverine ecosystems. Cape Town, South Africa Water Research Commission. Thorp, J.H., E.M. McEwan, M.F. Flynn, and F.R. Hauer. 1990. Invertebrate colonization of submerged wood in a cypress-tupelo swamp and blackwater stream. American Midland Naturalist 113: 56-68. Trommer, J.T., M.J. DelCharco, and B.R. Lewelling. 1999. Water budget and water quality of Ward Lake, flow and water-quality characteristics of the Braden River estuary, and the effects of Ward Lake on the hydrologic system, West-Central Florida. U.S. Geological Survey, Water-Resources Investigations Report 98-425. Tallahassee, Florida. U.S. Army Corps of Engineers 2001. HEC-RAS river analysis system user's manual. US Army Corps of Engineers, Davis, CA. Vannote, R.L., G.W. Minshall, K.W. Cummins, J.R. Sedell, and C.E. Cushing. 1980. The river continuum concept. Canadian Journal of Fisheries and Aquatic Sciences 37: 130-137. Walbridge, M.R. and B.G. Lockaby. 1994. Effect of forest management of biogeochemical functions in southern forested wetlands. Wetlands 11: 417-439. Wallace, J.B. and A.C. Benke. 1984. Quantification of wood habitat in subtropical Coastal Plain streams. Canadian Journal of Fisheries and Aquatic Sciences 41: 1643-1652.

6-8
Wharton, C.H., W.M. Kitchens, E.C. Pendleton, and T.W. Sipe. 1982. The ecology of bottomland hardwood swamps of the southeast: a community profile. U.S. Fish and Wildlife Service FWX/OBS-81/37. 133 pp. Zuboy, J.R. 1981. A new tool for fisheries managers: the Delphi technique. North American Journal of Fisheries Management 1: 55-59.
7-1
Chapter 7 Glossary of Terms Algae – Mostly single celled, colonial, or multi-celled plants containing chlorophyll and lacking roots, stems and leaves. Atlantic Multidecadal Oscillation (AMO) – A natural multidecadal cyclic variation in large-scale atmospheric flow and ocean currents in the North Atlantic Ocean that combine to alternately increase and decrease Atlantic sea surface temperatures. The cool and warm phases last for 25-45 years at a time, with a difference of about 1°F (0.6°C) between extremes. Aquifer – An underground geologic formation that contains sufficient saturated permeable material to yield significant quantities of water to wells or springs. Base Flow – Is flow in a channel sustained by ground-water discharge in the absence of direct runoff. Benchmark Period – A fixed, more or less permanent reference point in time expressed as a period of years where flows are thought to reflect conditions in the absences of withdrawals. Benthic – Associated with the bottom of a body of water. Biotic – Of or pertaining to the living components of an ecosystem. Block 1 – A time period in which recorded flows are at their lowest annually, defined as beginning when the average median daily flow falls below and stays below the annual 75% exceedance flow. Block 2 – A time period in which recorded flows are at their medium level annually. Usually seen when mean annual exceedance flows range between 50-75% exceedance flows. Block 3 – A time period in which recorded flows are at their highest annually, defined as beginning when the average median daily flow exceeds and stays above the mean annual 50% exceedance flow. Braden River Water Pattern Year – An annualized median daily flow hydrograph specific to the Braden River where the first day flow starts at the beginning of Block 1 and run through Block 3 and ends on the last day of Block 2. cfs – Cubic feet per second is a measure of streamflow or discharge.
7-2
Confined Aquifer – A term used to describe an aquifer containing water between relatively impermeable boundaries. The water level in a well tapping a confined aquifer stands above the top of the confined aquifer and can be higher or lower than the water table that may be present in the material above it. Cross section – A plane across the stream channel perpendicular to the direction of water flow. Diameter at Breast Height (DBH) – The width of a plant stem as measured at 4.5 ft. above the ground surface. Discharge – The rate of streamflow or the volume of water flowing at a location within a specified time interval. Usually expressed as cubic meters per second (cms) or cubic feet per second (cfs). Diversity – That attribute of a biotic (or abiotic) system describing the richness of plant or animal species or complexity of habitat. Ecosystem – Any complex of living organisms interacting with non-living chemical and physical components that form and function as a natural environmental unit. Emergent Plant – A rooted herbaceous plant species that has parts extending above a water surface. Exceedance – That probability of at least a minimal expectation being met, often measured in terms of annual probability of occurrence. Exposed Roots – Living root associated with riparian vegetation (shrubs and trees) exposed along stream banks that provide structural habitat to instream biota. Fish Passage – Refers to a flow depth that is deep enough to allow for fish to migrate upstream and downstream in the river. The District has routinely used 6/10th of one foot as the depth that allows for passage of most fish. Floodplain – 1. The area along waterways that is subject to periodic inundation by out-of-bank flows. 2. Land beyond a stream channel that forms the perimeter for the maximum probability flood. Floodplain Wetted Perimeter –The cross-sectional distance along the stream bed, its banks and adjacent floodplains that is in contact with water seen during flooding events where stream banks are breached by high water flow.
7-3
Flow Regime – The variable pattern (magnitude and frequency) of high and low flows exhibited by rivers and streams that are critical to the integrity of river ecosystems. Gage Height – The water surface elevation referenced to the gage datum. Gage height is often used interchangeably with the more general term "stage". Although gage height is more appropriate when used with a reading of a gage. Groundwater – In general, all subsurface water that is distinct from surface water, specifically, that part which is in the saturated zone of a defined aquifer. Habitat – The physical and biological surroundings in which an organism or population (living and non-living) lives; includes life requirements such as food or shelter. Habitat Suitability Curves – An input to the PHABSIM model where continuous variable or univariate curves designed to encompass the expected range of suitable conditions for water depth, water velocity and substrate/cover type unique to a given target species at a specific life stage is exhibited. HEC-RAS – The model acronym for Hydraulic Engineering Center-River Analysis System. It is a water-surface profile model for river simulation. In this report it is utilized to evaluate steady, one-dimensional, gradually varied flow. High Flow Step –.The high flow step is designed to assure that when out-of-bank flows occur they are protected by criterion specific to high flow conditions, rather then by criterion developed to protect in-channel features. The high flow step is therefore, a flow, often the 15% exceedance flow, above which the more restrictive of the seasonally specific percent-of-flow reduction is used, or the high flow percent-of-reduction, developed to protect floodplain inundation during block three. Hydric Soils – Any one of a class of soils usually formed under conditions of saturation, flooding, or ponding long enough during the growing season to develop anaerobic conditions in the upper part that favor the growth and regeneration of hydrophytic vegetation. Hydrophytic Vegetation – The sum total of macrophytic plant life growing in water or on a substrate that is at least periodically deficient in oxygen as a result of excessive water content. Hypertrophied Lenticels – An exaggerated (oversized) pore on the surface of stems of woody plants through which gases are exchanged between the plant and the atmosphere. The enlarged lenticels serve as a mechanism for increasing oxygen to plant roots during periods of inundation and/or saturated soils.
7-4
Instream Habitats – A specific type of area bounded within a stream's banks and its' associated (i.e., biological, chemical, or physical) characteristics used by an aquatic organism, population or community. Inundation – A condition in which water from any source temporarily or permanently covers a land surface. Invertebrate – All animals without a vertebral column or backbone; for example, aquatic insects. Julian Day – Is the term for a day corresponding to the Julian calendar in which days are numbered consecutively. In the context of this report days are number from 1 to 356 (or 366) each year. Life Stage – A qualitative age classification of an organism into categories related to body morphology and reproductive potential, such as spawning, larva or fry, juvenile, and adult. Long-term Compliance Standards – Represents a flow prescription that can be utilized for evaluating minimum flows compliance on a long-term basis, for instance, based on measured daily flows expressed over 5 or 10 years. Long-term Inundation Analyses – Process used to identify the number of days during a defined period of record that a specific flow or level (elevation) was equaled or exceeded at a specified location. Low Flow Threshold (LFT) – The lowest flow that serves to limit withdrawals. Main stem – The main channel of the river as opposed to tributary streams and smaller rivers that feed into it. Macroinvertebrates – Any of the various fauna characterized without a backbone that can be seen without magnification. Mean Annual Flows – The arithmetic mean of the individual daily mean discharges for the year noted. Median Daily Flow – The middle flow value in a sequence of daily flow values, having as many above and below a certain daily flow value. If there is an even number of flow values, the median is the average of the two middle flow values. Minimum Flows – The point(s) or level(s) on a watercourse at which further withdrawals would be significantly harmful to the water resources or ecology of the area.
7-5
Muck Soils – Type of organic soil consisting mainly of highly decomposed remains of plant material and other organisms. National Wetlands Inventory (NWI) – A research program of the U.S. Fish and Wildlife Service aimed at producing and providing information on the characteristics, extent and status of U.S. wetlands, deep water habitats and other wildlife habitats. Natural Flow – A flow condition where variation in discharge (or river stage) exists in the absence of any human alteration or would occur under completely unregulated conditions; that is not subjected to reservoirs, diversions, or other human works, over a specific time period. Non-hydric Soil – A soil that has developed under predominantly aerobic soil conditions. Percent Dominance – A quantitative descriptor of habitat, expressed as a percent, of the relative size or cover of instream habitats in a cross-sectional transect. Percent-of-Flow Reductions – The percent-of-flow approach is a means of regulation in which a percent of the previous days natural flow is allocated as available for use. Period of Record – The length of time for which data for a variable has been collected on a regular and continuous basis. Physical Habitat Simulation Model (PHABSIM) – 1. A specific model designed to calculate an index to the amount of microhabitat available for different faunal life stages at different flow levels. PHABSIM has two major analytical components: stream hydraulics and life stage-specific habitat requirements. 2. This extensive set of programs is designed to predict the micro-habitat (depth, velocities, and channel indices) conditions in rivers as a function of streamflow, and the relative suitability of those conditions to aquatic life. Pool – Part of a stream with reduced velocity, often with water deeper than the surrounding areas, which is usable by fish for resting and cover. Prescribed Flow Reduction – A set of minimum flow rules tailored to seasonal blocks that summarize the extent of allowable flow reductions based on ecological criteria and maximum extent of loss allowed before significant harm takes place. Recharge – Process by which water is added to the zone of saturation as recharge of an aquifer.
7-6
Riffle – A relatively shallow reach of stream in which the water flows swiftly and the water surface is broken into waves by obstructions that are completely or partially submersed. In this report riffle is synonymous with the term shoal. Riparian Vegetation – Vegetation that is dependent upon an excess of moisture during a portion of the growing season on a site that is perceptively moister than the surrounding areas. Riparian Zone – The transitional zone or area between a body of water and the adjacent upland identified by soil characteristics and distinctive vegetation that requires an excess of water. It includes wetlands and those portions of floodplains that support riparian vegetation. Run – A portion of a stream with low surface turbulence that approximates uniform flow, and in which the slope of the water surface is roughly parallel to the overall gradient of the stream reach. Seasonal Blocks – Any one of three time periods where flow conditions among Southwest Florida rivers or streams exhibit similar frequency, duration and magnitude in flow patterns that typically are linked to prevailing annual precipitation patterns. Currently differentiated into low (Block 1), medium (Block 2) and high (Block 3) flows. Short-Term Compliance Standard – Represents a block-specific flow prescription that can be utilized for evaluating minimum flows compliance on a short-term basis, for instance, based on measured daily flows. Short-term compliance standards are typically defined as a percent of the previous days natural flow. Snags – Dead or decaying woody debris material found lying along stream banks or in the channel and serve as structural habitats for instream biota. Stage – The distance of the water surface in a river above a known datum. Substrate – The material on the bottom of the stream channel, such as rock, sand, mud or vegetation. Thalweg – A longitudinal profile of the lowest elevations of a sequential series of cross-sections. Transect – A line on the ground along which observations are made at some interval. Tributary – A stream that feeds, joins or flows into a larger stream (at any point along its course or into a lake).
7-7
Upland – Any area that does not qualify as a wetland because the associated hydrologic regime is not sufficiently wet to elicit development of vegetation, soils and/or hydrologic characteristics associated with wetlands. Watershed – The total topographic region or area bounded peripherally by a divide and draining ultimately to a particular watercourse or body of water; also called catchment area, drainage area, and basin. Weighted Usable Area (WUA) – A component of PHABSIM which is an indicator of the net suitability of use of a given stream reach by a certain life stage of a certain species. Wetlands – Those areas that are inundated or saturated by surface or groundwater at a frequency and duration sufficient to support, and that under normal circumstances do support a prevalence of vegetation typically adapted for life in saturated soil conditions. Wetlands generally include swamps, marshes, bogs and similar areas. Wetland Soils – A soil that has characteristics developed in a reducing atmosphere, which exists when periods of prolonged soil saturation results in anaerobic conditions. Wetland Vegetation – The sum total of macrophytic plant life that occurs in areas where the frequency and duration of inundation or soil saturation produce permanently or periodically saturated soils of sufficient duration to exert a controlling influence on the plant species present. Wetted Perimeter – The cross-sectional distance along the stream bed and banks that is in contact with water. Wetted Perimeter Inflection Point – A point on a curve relating wetted perimeter vs. discharge at which the slope of the line changes from convex to concave or vice versa. Woody Habitats – Any of the various living (e.g., exposed roots) or dead/decaying (e.g., snags) substrata composed of wood, usually originating from riparian vegetation that serve as habitation for various instream biota.
8-1
Chapter 8 Appendix A
A Review of
“Proposed Minimum Flows and Levels for the Upper Segment of the Braden River, from Linger Lodge to Lorraine
Road”
May 18, 2007 Peer Review Draft Revised
by
Ecological Evaluation Section Resource Conservation and Development Department
Southwest Florida Water Management District
Prepared by: Peer Review Panel:
Charles E. Cichra, Ph.D. Clifford N. Dahm, Ph.D.
Allan Locke, M.S.
September 2007
8-2
EXECUTIVE SUMMARY This is a summary of the Scientific Peer Review Panel’s (“Panel”) evaluation of the scientific and technical data, assumptions, and methodologies used by the Southwest Florida Water Management District (District) in the development of proposed minimum flows and levels (MFLs) for the upper Braden River, from Linger Lodge to Lorraine Road. The approach used in setting MFLs for the upper Braden River follows the established protocols that have been effectively used by the District in the past. The Panel continues to endorse the District’s overall approach for setting MFLs in riverine ecosystems and finds particularly merit in the use of seasonal building blocks, multiple benchmark periods based on multi-decadal climate variability, the use of multiple analysis tools for protecting both low and high-flow regimes, and the expression of MFLs as percent flow reductions. The application of this approach for the upper Braden River is thorough and defensible. The methodology is sound, the data are appropriate for the task, and the findings are based on best available science. The assumptions, that are inherent in the scientific approaches that are employed, are well documented and represent current understanding of how best to protect healthy aquatic ecosystems. The derived MFLs are reasonable and likely to sustain the ecological health of the Upper Braden River. Overall, the Panel finds the methodologies used are appropriate, even innovative. The District has added two new techniques for data acquisition and presentation (the Light Detection and Ranging (LiDAR) method to collect transect data for the HEC-RAS models and statistical medians to present historical flow data). District staff members have clearly spent a great deal of time and effort trying to arrive at a scientifically reasonable set of recommendations and have largely succeeded. The authors are to be commended for addressing one of the most difficult issues when carrying out these types of studies, trying to interpret exactly the intention of the legislators when they drafted the legislation. The discussion, relating a good instream flow standard in the context of the legislation to prevent significant harm, is well thought out and articulate. However, the Panel continues to believe that the adequacy of the low-flow threshold and the use of a de facto significant-harm criterion, based on a 15% reduction in habitat availability, has not been rigorously demonstrated and will remain presumptive until such time as the District commits to the monitoring and assessment necessary to determine whether these criteria are truly protective of the resource. We are concerned that the District, to date, has taken no visible
8-3
steps to reduce the uncertainty and subjectivity associated with these criteria and urge them to move forward quickly to develop and implement an adaptive management framework that that will facilitate such assessments.
INTRODUCTION The Southwest Florida Water Management District (SWFWMD) under Florida statutes provides for peer review of methodologies and studies that address the management of water resources within the jurisdiction of the District. The SWFWMD has been directed to establish minimum flows and levels (designated as MFLs) for priority water bodies within its boundaries. This directive is by virtue of SWFWMD’s obligation to permit consumptive use of water and a legislative mandate to protect water resources from significant harm. According to the Water Resources Act of 1972, minimum flows are defined as “the minimum flow for a given watercourse shall be the limit at which further withdrawals would be significantly harmful to the water resources or ecology of the area” (Section 373.042 F.S.). A minimum level is defined as “the level of groundwater in an aquifer and the level of surface water at which further withdrawals would be significantly harmful to the water resources of the area.” Statutes provide that MFLs shall be calculated using the best available information. The process of analyzing minimum flows and levels for the upper segment of the Braden River is built upon the analyses previously performed on the upper Peace River (SWFWMD 2002), peer reviewed by Gore et al. (2002), the middle Peace River (SWFWMD, 2005a), peer reviewed by Shaw et al. (2005), the Alafia and Myakka Rivers (SWFWMD, 2005b, c), peer reviewed by Cichra et al. (2005), and the upper Hillsborough River (SWFWMD 2007), peer reviewed by Cichra et al. (2007). The upper Braden River MFL methodologies incorporate many of the recommendations of these earlier peer reviews, as well as key improvements developed by District staff. Establishment of minimum flows and levels generally is designed to define thresholds at which further withdrawals would produce significant harm to existing water resources and ecological conditions, if these thresholds were exceeded in the future.
This review follows the organization of the Charge to the Peer Review Panel and the structure of the draft report. It is the job of the Peer Review Panel to assess the strengths and weaknesses of the overall approach, its conclusions, and recommendations. This review is provided to the District with our encouragement to continue to enhance the scientific basis that is firmly established for the decision-making process by the SWFWMD. Extensive editorial comments and errata for the upper Braden River MFL draft report are provided as an Appendix.
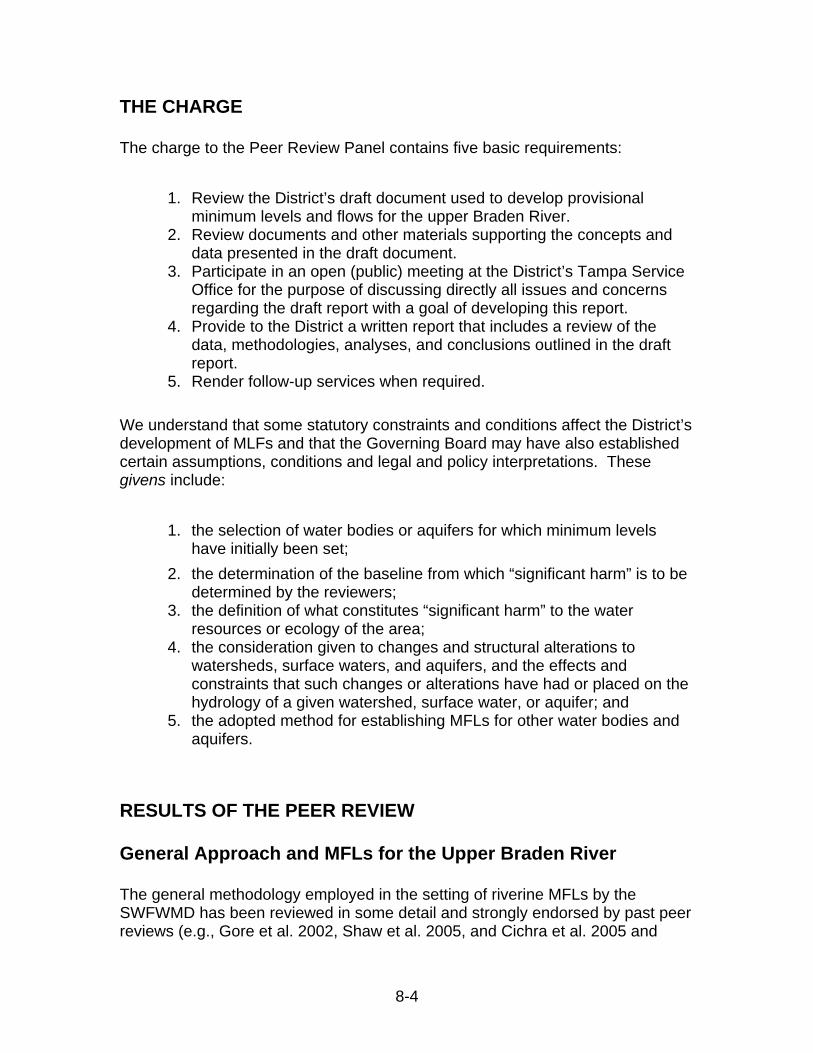
8-4
THE CHARGE The charge to the Peer Review Panel contains five basic requirements:
1. Review the District’s draft document used to develop provisional minimum levels and flows for the upper Braden River.
2. Review documents and other materials supporting the concepts and data presented in the draft document.
3. Participate in an open (public) meeting at the District’s Tampa Service Office for the purpose of discussing directly all issues and concerns regarding the draft report with a goal of developing this report.
4. Provide to the District a written report that includes a review of the data, methodologies, analyses, and conclusions outlined in the draft report.
5. Render follow-up services when required. We understand that some statutory constraints and conditions affect the District’s development of MLFs and that the Governing Board may have also established certain assumptions, conditions and legal and policy interpretations. These givens include:
1. the selection of water bodies or aquifers for which minimum levels have initially been set;
2. the determination of the baseline from which “significant harm” is to be determined by the reviewers;
3. the definition of what constitutes “significant harm” to the water resources or ecology of the area;
4. the consideration given to changes and structural alterations to watersheds, surface waters, and aquifers, and the effects and constraints that such changes or alterations have had or placed on the hydrology of a given watershed, surface water, or aquifer; and
5. the adopted method for establishing MFLs for other water bodies and aquifers.
RESULTS OF THE PEER REVIEW General Approach and MFLs for the Upper Braden River The general methodology employed in the setting of riverine MFLs by the SWFWMD has been reviewed in some detail and strongly endorsed by past peer reviews (e.g., Gore et al. 2002, Shaw et al. 2005, and Cichra et al. 2005 and
8-5
2007). In addition, the approach used by the SWFWMD has now been published in a peer-reviewed journal (Munson et al. 2005; Munson and Delfino 2007), and these papers add further credibility to the procedures employed by the SWFWMD. The efficacy of the approach has been well received in past peer reviews. Thus in this peer review, the Panel has chosen to focus on new elements unique to the upper Braden River MFLs, new insights on the District’s approach, and increased elaboration or emphasis on key findings from past peer reviews. MFL Benchmarks and Resource Protection Goals Benchmarks and the Atlantic Multidecadal Oscillation (AMO) Chapter 2 provides a thorough and lengthy overview of the basin. Background information on geographic location, climate, land use, hydrology, and aquatic chemistry is provided. The placing of the hydrology into the context of the Atlantic Multi-decadal Oscillation (AMO) is particularly forward thinking in terms of setting MFLs in systems throughout Florida, where state changes characterized by thresholds and step changes are a very real characteristic of these ecosystems in the past and may well be characteristic in the future. The Panel continues to endorse and applaud the District’s use of multiple benchmark periods for setting MFLs based on multi-decadal climate variability. Although the role of the AMO in influencing various ecological and climate phenomena (e.g., tropical storm frequency) continues to be debated, the District’s thorough analysis of climate-streamflow relationships in Florida (SWFWMD 2004) provides a firm foundation for applying these concepts to the development of MFLs for Florida’s rivers. As with previous riverine MFLs, beginning with those for the Middle Peace River (SWFWMD 2005a), the District has fully embraced the climate-streamflow issue in developing the MFLs for the upper Braden River by evaluating and identifying limiting flow conditions for two separate benchmark periods based on different climate phases. Use of these two benchmark periods for the Braden River is somewhat problematic because of the relatively short flow record available for the Braden River. Flow records for the Braden River near Lorraine gage site were instead assigned to benchmark periods based on the mid-1990s shift from a cool to a warm AMO phase. Available flow records were split into two periods, 1988 through 1994 and 1995 through 2005 (Figure 2-15 on page 2-23), for analyses used to develop minimum flows and levels criteria and standards. Recommended low-flow thresholds and percent flow reduction criteria are based on the most conservative of these benchmark periods to ensure adequate protection during periods when less rainfall and lower streamflow prevail. The analysis of stream flows in Chapter 2 also does a good job of placing the hydrology of the Braden River and other streams in the context of climate variability and clearly illustrates how such variability is revealed in the data as thresholds or step changes. The peer review panel strongly endorses this approach and recommends that similar approaches
8-6
should routinely be incorporated when setting MFLs for all rivers in Florida. To our knowledge, SWFWMD is the only water management entity to have adopted such a sophisticated and forward-thinking approach for incorporating climate variability into instream flow determinations. The Panel feels that streams within the SWFWMD clearly have “lower-flow” and “higher-flow” periods that persist for decades, and previous peer-reviewed work by the District make a strong case that such long-term variability is linked to different phases of the AMO (SWFWMD, 2004; Shaw et al., 2004). The decision to use the lower-flow period to set MFLs is appropriate, as this is conservative, and means that it is not necessary to try to predict the current or future climate cycle. However, the AMO label is not necessary to the analysis or the determination of the MFLs considered here, and pinning the MFL determination on a particular climate cycle potentially leaves the MFL determination open to challenge. We suggest simply referencing earlier District documents that propose the AMO link, and not making a big deal of it in the report. The hypothesized link with AMO has explanatory power, but no real predictive power. Although we are suggesting de-emphasizing the narrative connection with AMO, the panel strongly believes the idea of multidecadal variations in streamflow is valid. The period of hydrologic record is significantly shorter for the upper Braden River, compared to other river ecosystems where MFLs have been proposed by the SWFWMD in the past, and we feel that uncertainties associated with the limited hydrological record should be carefully acknowledged. On page 2-17, it is stated, “Based on the availability of data for the Braden River near Lorraine site, the minimum flows and levels recommended in this report for the upper, freshwater segment of the Braden River were developed for flows measured at this gaging station.” and on pages 4-19 and 4-20, it is stated, “historic time series data from the Braden River near Lorraine gage site was used to model changes in habitat at two representative sites”. It would be helpful to the reader if definitions for “natural”, “recorded” and “historic” flows were provided. If there are differences between historic and natural flows, then this should be clearly stated. Seasonal Building Blocks The SWFWMD has continued to employ a seasonal building block approach (e.g., Postel and Richter 2003) in establishing MFLs for the upper Braden River. The assumptions behind building block methods are based upon simple ecological theory. Organisms and communities, occupying a river, have evolved and adapted their life cycles to flow conditions over a long period of pre-development history (Stanford et al. 1996, Bunn and Arthington 2002). Thus,
8-7
with limited biological knowledge of specific flow requirements, the best alternative is to maintain or recreate the hydrological conditions under which communities had existed prior to disturbance of the flow regime or allocation of instream flows. Building-block models are the "first-best-approximation" of adequate conditions to meet ecological needs. More often than not, resource agencies have hydrographic records for long periods of time, while little or no biological data are available. Seasonal hydrological variability is a critical component of the flow regime, and three blocks are defined in the report from the average long-term annual hydrograph. Block 1 considers the low-flow period that occurs during the spring dry season, Block 2 considers the base-flow period during the cooler portion of the year when evapotranspiration rates are often at their lowest levels, and Block 3 considers the high-flow period during the summer/fall wet season. This is a valid approach for setting MFLs because it accounts for expected seasonal variability during a typical year. By contrast, MFLs focused solely upon low flow conditions are inadequate for protecting important river and riparian ecosystem functions that occur at other times of the year, and which are often critical to the viability of aquatic organisms. In response to previous peer review comments (e.g., Shaw et al. 2005), the District now applies the low-flow threshold developed for block 1 year-round, recognizing that low flow conditions can occur at any time. The building block approach is based upon predictably varying hydrological conditions and is a rigorous and defensible approach for the establishment of protective MFLs for the upper Braden River. It also has the advantage of insuring a flow regime with the range of variability essential to the maintenance of stream and river structure and function. Seasonal building blocks also remain a useful conceptual device for communicating MFLs to the public. The Panel continues to endorse this approach by the District. Nevertheless, as the District’s methodology for setting riverine MFLs has evolved, the need for pre-defined seasonal blocks has become less clear. The Panel wonders whether applying all of the tools used to set MFLs, described in the draft report, to all weeks of the year, and using the approach, that has been employed in this and prior studies, of basing compliance standards on the most conservative, or protective, factor would eliminate the need to pre-assign flow blocks. In Chapter 1, the presentation of medians, in addition to averages, for the flow patterns of the upper Braden River, throughout the period of record (Figure 1.1 on page 1-8) is an informative additional way to summarize the hydrological data. The Panel encourages personnel of the Ecologic Evaluation Section of the SWFWMD to provide both the mean and median of historical flows in all future reports for setting MFLs.
8-8
One aspect of Chapter 2 should be expanded. It appears that the upper Braden River may be prone to intermittency. This appears to be a natural condition and one for which the biota are likely adapted. There is, however, no specific spelling out of the very low flows and zero flows that have occurred during the period of record. Block 1 appears to be the period in which very low-flow or no-flow conditions occur reasonably regularly. How many days of zero flow or < 7 cfs flow occur in the three blocks? What is the range of zero flow or < 7 cfs flow days each year during the period of record? This is a river prone to very low flows and possible intermittency, and the Panel thinks that the details of these conditions for the period of record should be clearly spelled out. The “building block” approach is most acceptable and is an excellent way to address the issue that flows vary significantly throughout the year and different tools need to be applied. For future studies, we encourage the District to explore the possibility of using alternative approaches. For example, develop hydrology data so that the flows for each week can be analyzed using all appropriate tools for that time of year and for that particular range of flows. Specifically, there may be some biological rationale for moving to a weekly time step instead of using a monthly time step when applying the PHABSIM models. With commercial spreadsheet software, analysis can easily be carried out on a weekly time step, or shorter if appropriate, and there may be some valuable knowledge gained. In essence, the District could test an infinite number of habitat evaluation metrics that could prove to be useful for their specific studies. Resource Protection Goals Chapter 3 clearly lays out the goals, ecological resources of concern, and key habitat indicators for setting MFLs on the upper Braden River. This discussion is appropriately drawn from past MFLs developed by the District and citations from a wide array of ecological literature. Emphasis here, as in other riverine MFLs in the SWFWMD, is on fish and invertebrate habitat and hydrologic connectivity, both upstream-downstream and laterally between channel and floodplain. Though these characteristics of the river ecosystem are clearly important, they are but a subset of the factors specifically listed in Florida Statutes that should be considered when setting MFLs (62-40.473 F.A.C.). The list (reproduced in Chapter 1 of the draft report) includes recreation, fish and wildlife habitat and fish passage, estuarine resources, transfer of detrital material, maintenance of freshwater storage and supply, aesthetic and scenic attributes, filtration and absorption of nutrients and other pollutants, sediment loads, water quality and navigation. The draft report includes a clear and well-justified argument for preserving ecologically meaningful elements of the flow regime, and at least some mention is made of setting low-flow thresholds to protect passive recreation uses such as canoeing. However, the report never completely addresses how the proposed MFL or the District’s approach addresses any of
8-9
the other factors listed above or why only certain factors were selected for this water body. (Note that in at least one other water management district in Florida, draft MFLs are developed based on one or a few resource protection goals, then a separate assessment is conducted to evaluate how well the draft flows and levels address the protection needs of other factors such as recreation, water quality and sediment loads). The Panel suggests that, for the upper Braden River and other rivers of Florida, there may be other important ecosystem processes or physical/chemical thresholds from the list that merit consideration by the District in setting MFLs. For example, should there be concern for maintaining a minimum dissolved oxygen level or sustaining temperature below some threshold? Such factors may be especially important in relation to setting the low-flow threshold, which is presently based solely on a presumptive fish passage criterion and an analysis of wetted perimeter. These may be particularly important for streams and rivers that have very low flow or periods of intermittency, such as the Braden River. Preventing Significant Harm – 15% Change in Habitat Availability The draft report describes the metrics used to define “the limit at which further withdrawals would be significantly harmful to the water resources or ecology of the area” as stated in Florida statutes. The authors note that “significant harm” was not defined in statute. The District chose to interpret significant harm as “the loss of flows associated with fish passage and maximization of stream bottom habitat with the least amount of flow and quantifiable reductions in habitat.” Overall, this is a reasonable approach from an ecological perspective and likely satisfies the intent of the statute. The authors state that, “[in] general, instream flow analysts consider a loss of more than 15% habitat, as compared to undisturbed or current conditions, to be a significant impact on that population or assemblage.” The authors further note, in our opinion, correctly, that “there are few ‘bright lines’ which can be relied upon to judge when ‘significant harm’ occurs. Rather loss of habitat in many cases occurs incrementally as flow decline, often without a clear inflection point or threshold.” Nevertheless, the 15% habitat loss criterion remains one of the least rigorous, most subjective aspects of the District’s approach to setting MFLs. Justification for this threshold is based on common professional practice in interpreting the results of PHABSIM analyses (Gore at al. 2002), a review of relevant literature where reported percentage changes ranged from 10 to 33%, and on previous peer reviews that found the 15% threshold to be “reasonable and prudent, especially given the absence of clear guidance in the statute or in the scientific literature on levels of change that would constitute significant harm…” (e.g., Shaw et al. 2005).
8-10
The draft upper Braden report continues the District’s practice of using a 15% change in habitat availability as the threshold for defining significant harm and now applies this threshold broadly to include both spatial and temporal loss of habitat or connectivity. The Panel again acknowledges that the use of this criterion is rational and pragmatic, but also recognizes that the specific value of 15% is subjective and has only modest validation or support from the primary literature. Arguments can and likely will be made for both lower and higher percentages of habitat loss to be used for defining significant ecological harm. Other work has been done, in addition to the literature that is already cited, and the Panel believes it would be prudent to expand the literature review to gather as much additional supporting documentation as possible, much of which will be gray literature. Where lower or higher percentages have been used elsewhere, it would be illuminating to understand the rationale for these decisions (e.g., lower percentages used where imperiled or more sensitive species are concerned, higher percentages for more degraded systems, etc.). What happens if you use a 5% or a 33% reduction in habitat in your analyses? How would these values affect the recommendations for MFLs for an ecosystem like the upper Braden River? The Panel is not advocating doing the analyses on all rivers with multiple values for acceptable habitat loss, but it would be informative to do such a sensitivity analysis for a less difficult river like the upper Braden River. Such an analysis of the sensitivity of the MFLs to setting different thresholds of habitat loss where significant harm occurs would assist in the discussion of why a specific value (e.g., 15%) has been chosen. More importantly, however, is the need for the District to commit the resources necessary to validate the presumption, that a 15% decrease in spatial or temporal habitat availability or a 15% increase in violations of the low-flow threshold, does not cause significant harm. The District would appear to be in an excellent position to implement monitoring, natural experiments, and other analyses necessary to evaluate the effectiveness of this threshold and establish a framework for adaptive management. Several riverine MFLs
8-11
have now been developed and adopted by the District using the same or similar criteria, and the infrastructure for field work used to develop these MFLs is still in place. The present drought conditions that prevail over most of Florida as this peer review is written would seem to make for ideal conditions for testing and evaluating assumptions regarding minimum flows. Several previous peer reviews have called on the District to collect additional site-specific data to validate and refine assumptions used in the development of MFLs (Cichra et al. 2005 and 2007; Gore et al. 2002; Shaw et al. 2005), and the District has committed to periodic re-evaluation of its MFLs as structural changes or changes in the watershed warrant. Despite this, the Panel has seen little evidence so far that the District is moving rapidly to implement the needed monitoring or assessment. The Panel strongly believes that without such follow-up, the 15% threshold remains a presumptive criterion vulnerable to legal and scientific challenge. Analytical Tools Used to Develop MFLs PHABSIM Previous peer review reports have discussed at length and affirmed the District’s use of the Instream Flow Incremental Methodology (IFIM) and the related Physical Habitat Simulation (PHABSIM) software (Cichra et al. 2005 and 2007; Gore et al. 2002; Shaw et al. 2005). The District likewise employs this methodology to the upper Braden River, using habitat suitability curves for the same suite of three common Centrarchid (sunfish) fish species, plus invertebrates that were used in developing MFLs for the Middle Peace, Myakka, Alafia, and upper Hillsborough Rivers. Overall, the District’s use of the methodology and its description of the development of habitat suitability curves are consistent with standard practice and follow the recommendations of previous peer reviews. Habitat suitability curves were developed for spotted sunfish (Lepomis punctatus), largemouth bass (Micropterus salmoides), bluegill (Lepomis macrochirus), and macroinvertebrate community diversity (Gore et al. 2001, Stuber et al. 1982). These are appropriate species for consideration in rivers of the southern Florida peninsula, and their selection is validated by reported fish abundance data for these rivers. However, the Panel notes that both bluegill and largemouth bass are habitat generalists and are not especially sensitive to changes in hydrologic regime. As such, they may be rather poor choices for use in establishing MFLs, despite the merits of the IFIM/PHABSIM methodology. In keeping with previous peer reviews, the Panel recommends that the District invest the resources necessary to evaluate whether additional habitat suitability curves should be developed and PHABSIM analyses be conducted for other species that may be more sensitive to hydrological change than those used here.
8-12
Of particular concern would be any listed, imperiled, or endemic species, species tracked by the Florida Natural Areas Inventory (FNAI), wading birds, and fish species with preferences for stream edges or banks that might be the first places to feel the effects of reduced flows. The description of the PHABSIM transect(s) location and, in particular, the number of transects should be made more clear. It is not until the third paragraph of section 4.2.2, where it is stated, “…At each PHABSIM site, tag lines were used to establish three cross-sections…” The discussion about transects should clearly indicate the number of transects, in this case three, and it would be beneficial to the reader to have an accompanying schematic that shows the exact location of these transects, along with some basic habitat descriptions (see comment below). There are some commonly accepted “guidelines” for applying PHABSIM, however, it is quite acceptable to deviate from these guidelines given site-specific circumstances. For example, it is generally accepted that 5-7 transects are required to describe a riffle – pool sequence. However, given the upper Braden River has an extremely low gradient (it is basically a simple “U” shaped sand bed channel), there are no sudden changes in cover or substrate, the river has very subtle transitions from pools to runs and, the channel is very homogeneous in terms of habitat types, it is not necessary to have more than three transects to describe the available habitat in the river for the species of interest. Adding more transects would not add to the accuracy of the model output. Putting this rationale in the report would be beneficial to the reader.
In Section 4.2.2, there should also be a description on the ratio of habitat types (riffle / run / pool) that are represented in the study site by the three transects. It should also be described somewhere in the report that the ratio of habitat types in the study site is equal to the ratio of these habitat types in the entire reach of the river that the study site represents. A general rule of thumb when using the PHABSIM models is the study site should include at least two entire cycles of riffles and pools or meanders and crossing bars to describe the relative proportions of each feature. It is generally acknowledged these cycles are repeated at 5 to 7 times the width of the channel. Therefore, a representative study site should have a length that at a minimum is 10 to 14 times the channel width. Once again, it is quite acceptable to have a different length for the study site, since this is a “guideline” or “rule-of-thumb”, however, it would be beneficial to the reader to state the reasons for the departure from the general guidance.
As mentioned above, having a schematic showing transects and some general features is informative to the reader (see figure below). It is highly recommended to include these diagrams in future reports.
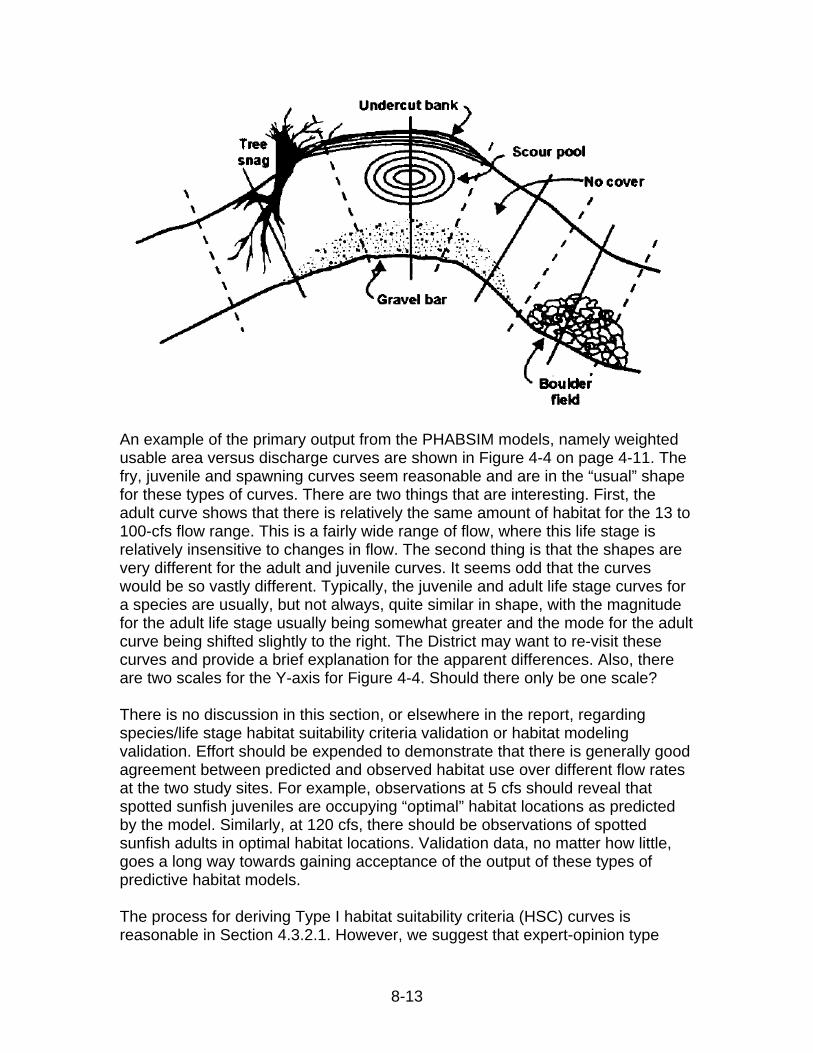
8-13
An example of the primary output from the PHABSIM models, namely weighted usable area versus discharge curves are shown in Figure 4-4 on page 4-11. The fry, juvenile and spawning curves seem reasonable and are in the “usual” shape for these types of curves. There are two things that are interesting. First, the adult curve shows that there is relatively the same amount of habitat for the 13 to 100-cfs flow range. This is a fairly wide range of flow, where this life stage is relatively insensitive to changes in flow. The second thing is that the shapes are very different for the adult and juvenile curves. It seems odd that the curves would be so vastly different. Typically, the juvenile and adult life stage curves for a species are usually, but not always, quite similar in shape, with the magnitude for the adult life stage usually being somewhat greater and the mode for the adult curve being shifted slightly to the right. The District may want to re-visit these curves and provide a brief explanation for the apparent differences. Also, there are two scales for the Y-axis for Figure 4-4. Should there only be one scale? There is no discussion in this section, or elsewhere in the report, regarding species/life stage habitat suitability criteria validation or habitat modeling validation. Effort should be expended to demonstrate that there is generally good agreement between predicted and observed habitat use over different flow rates at the two study sites. For example, observations at 5 cfs should reveal that spotted sunfish juveniles are occupying “optimal” habitat locations as predicted by the model. Similarly, at 120 cfs, there should be observations of spotted sunfish adults in optimal habitat locations. Validation data, no matter how little, goes a long way towards gaining acceptance of the output of these types of predictive habitat models. The process for deriving Type I habitat suitability criteria (HSC) curves is reasonable in Section 4.3.2.1. However, we suggest that expert-opinion type
8-14
curves can benefit greatly from even a few observed “use” data. Perhaps, it was not feasible for this study, however, the District should make collecting “use” data for the species of interest a regular program element. It is always reassuring to plot even a few data points to see they fall within the range of the experts’ opinions. There is no substitute for real data. It is noted the authors recognize this when they state, “the District intends to evaluate and develop additional habitat suitability curves for species of interest.” Again, actual biological field data are most valuable.
Using Type II HSC curves from another source has been a fairly common practice. There have been issues raised in the past with the application of “blue book” curves in other PHABSIM applications. Given that HSC curves account for the majority of what the weighted usable area (WUA) curve will be, it is prudent to provide good rationale for using “blue book” curves. Once again, having at least a few actual data points to show the “blue book” HSC curves are applicable, increases the credibility of the output. Habitat Criteria and Characterization Methods Used to Develop MFLs FISH PASSAGE The approach of defining a threshold for loss of fish habitat in terms of percent reduction of fish habitat and setting a low-flow threshold based on fish passage is consistent with today’s understanding of maintaining self sufficient populations of fish that are able to move upstream and downstream and between different kinds of aquatic habitat. Fish passage was used to estimate flows sufficient to permit fish movement throughout the upper Braden River. Flows of this magnitude would also likely permit recreation (i.e., canoeing), though this is not substantiated in the draft report. A fish passage criterion of 0.6 ft was used based in part on size data from large-bodied fishes in Florida streams and minimum fish passage depths used in other instream flow settings elsewhere in the U.S. This criterion has been used to develop previous MFLs (SWFWMD 2002, 2005a, b, c, and 2007) and has been found acceptable by previous peer reviewers (Gore et al. 2002; Cichra et al. 2005 and 2007; Shaw et al. 2005). This notwithstanding, fish passage depths in the range of 0.5-0.8 ft were originally derived from requirements of migratory salmonids in cool, well-oxygenated waters of the western U.S. The adequacy of these standards for use in Florida’s warmwater streams has been questioned by resource managers and peer reviewers. Although no definitive research has yet been conducted on this issue (Hill and Cichra 2002), it is an emerging consensus that minimum depth criteria used in Florida need to be evaluated to ensure that they adequately
8-15
prevent negative effects associated with low flows in warmwater ecosystems. These include high water temperatures, low dissolved oxygen, algal blooms, increased aquatic plant growth, and increased predatory pressure, in addition to mere physical passage of fish. If flows were to be lowered due to consumptive use of water to a depth of 0.6 ft, when depths would under natural-flow conditions be much greater, would water quality issues arise? Of concern would be dissolved oxygen (DO) and temperature conditions near the limit of tolerance for fish and other aquatic life. If these questions cannot be answered at this point, then the Panel strongly suggests the District commit to studying what the fish passage criterion set as the low-flow threshold means to the aquatic ecosystem (e.g., flow versus DO relationships, fish survival in pools, etc.). Similar to the 15% habitat-loss threshold discussed above, the minimum fish-passage depth, used by the District in this and previous MFLs, is merely a presumptive criterion absent site-specific follow-up studies to evaluate ecological conditions under such a low-flow scenario. To ensure that there is 0.6 ft of water depth along the thalweg in the entire river reach being addressed, the authors would need to demonstrate that they have undertaken the necessary work to identify the most critical hydraulic control points in the river. This would presumably require a detailed survey of the thalweg for the entire river reach in question in order to determine this critical point of elevation. As the authors note, transects in pools or runs would not be in locations where this critical fish passage point is located. It would be on a rock ledge or other similar natural hydraulic control point. These are “critical” transects and are areas that go dry first as flows are lowered. Longitudinal studies of the thalweg may indeed have been conducted, but the Panel seeks assurances that the identification of hydraulic control points was done systematically, as there is no documentation in the draft report of how control points were selected. On page 4-18, in the last paragraph, it is stated, “The flows were determined by adding the 0.6-ft depth fish-passage criterion to the elevation of the lowest spot in the channel and determining the flow necessary to achieve the resultant elevations.” It would be helpful to the reader if the determination of “…the lowest spot in the channel…” was more thoroughly described in the report. WETTED PERIMETER The biological rationale for using the wetted perimeter, “…the greatest amount of macroinvertebrate biomass per unit reach of stream occurs on the stream bottom…” is sound, and it is widely accepted that a break point in the slope of the line represents the point at which there is an accelerated loss of habitat relative to reductions in flow. The authors also clearly point out that one of the difficulties in using this method is that there are no well-defined break points on the line. On page 4-17, it is stated, “Many cross-section plots displayed no apparent inflection
8-16
points between the lowest modeled flow and 25 cfs. These cross-sections were located in pool areas, where the water surface elevation may exceed the lowest wetted perimeter inflection point even during low flow periods. For these cross-sections, the lowest wetted perimeter inflection point was established at the lowest modeled flow.” Given that this method should only be applied in shallows, riffles or ledges, it is not clear why the authors choose to establish the “…wetted perimeter inflection point at the lowest modeled flow.” Perhaps, it would be better to simply eliminate these transects from the analysis since transects through pools should not be used. The difficulties encountered by the authors raise the question of how appropriate the use of the wetted-perimeter method is in a river like the upper Braden River. As shown in Figure 5-2 on page 5-3, a flow of 5.1 cfs is required to inundate the lowest wetted perimeter inflection point at each of the 20 transects. Perhaps, it would be better to present only those transects that are in known shallow areas, and to not present those transects in pools or runs. The Instream Flow Council recommends this method should only be used in riffle mesohabitat types (Annear et al. 2004). If the transects are located in riffles, that are representative of food producing riffles in the river, then the basis for using the method should be adequate for this river. DAYS OF FLOODPLAIN INUNDATION Low-gradient rivers, like the upper Braden River, have extensive floodplains. Floodplains support complex and diverse plant communities, whose distribution is determined by small changes in microtopography and average length of annual inundation or hydroperiod. Plant communities are often adapted to the average annual flow regime and decline if flood frequency is altered. Extensive floodplains are often critical to many forms of aquatic life. For example, river biota migrate onto floodplains for foraging and spawning during floods. In addition, periodic flooding stimulates biogeochemical transformations in floodplain soils, which benefit both floodplain and riverine productivity. The District has recognized the critical role of floods in proposing minimum flows for the upper Braden River. Extensive vegetation and elevation surveys were used to characterize the structure and floristic composition of floodplains. HEC-RAS modeling was used to determine floodplain inundation patterns based on historical benchmark periods. Results of the models were then used to estimate percent-of-flow reductions for Block 3 that would result in no more than a 15% reduction in the number of days of floodplain inundation. The Panel feels that consideration of high flows and patterns of floodplain inundation is commendable and documentation of methods in the draft report is excellent. The District incorporated the use of LiDAR (Light Detection and Ranging) data to increase the number of cross-sections used in the HEC-RAS modeling. It is commendable that the District continues to incorporate new
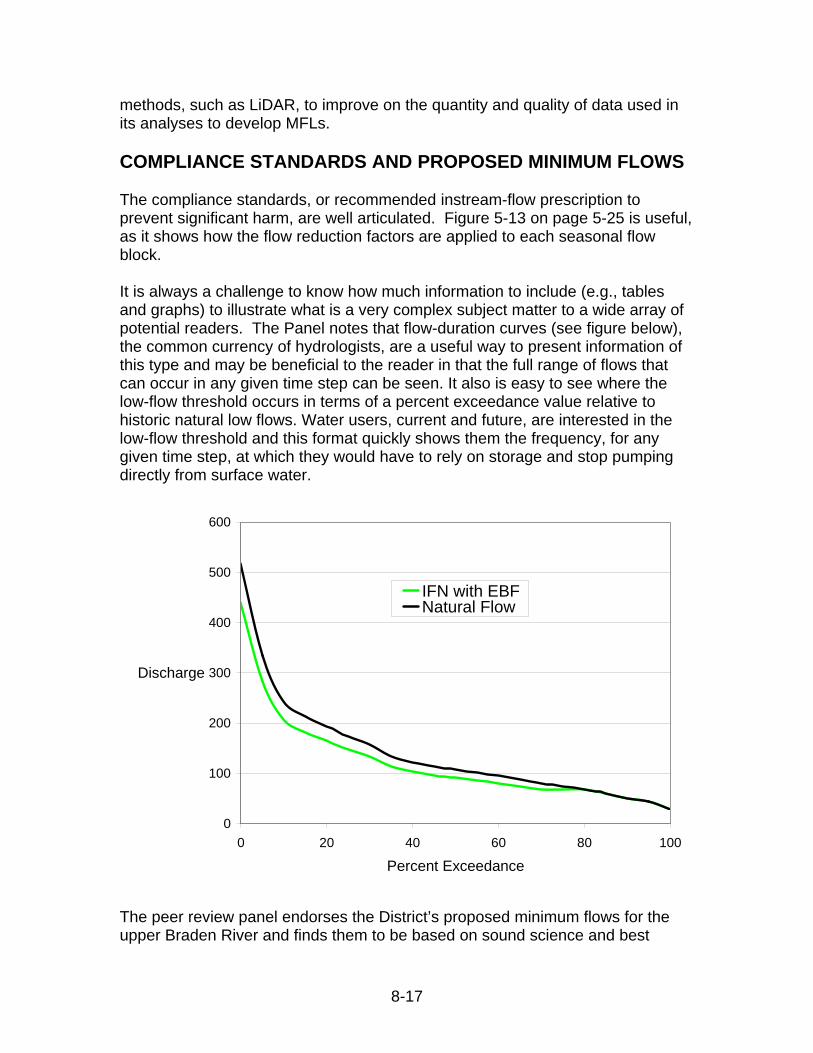
8-17
methods, such as LiDAR, to improve on the quantity and quality of data used in its analyses to develop MFLs. COMPLIANCE STANDARDS AND PROPOSED MINIMUM FLOWS The compliance standards, or recommended instream-flow prescription to prevent significant harm, are well articulated. Figure 5-13 on page 5-25 is useful, as it shows how the flow reduction factors are applied to each seasonal flow block. It is always a challenge to know how much information to include (e.g., tables and graphs) to illustrate what is a very complex subject matter to a wide array of potential readers. The Panel notes that flow-duration curves (see figure below), the common currency of hydrologists, are a useful way to present information of this type and may be beneficial to the reader in that the full range of flows that can occur in any given time step can be seen. It also is easy to see where the low-flow threshold occurs in terms of a percent exceedance value relative to historic natural low flows. Water users, current and future, are interested in the low-flow threshold and this format quickly shows them the frequency, for any given time step, at which they would have to rely on storage and stop pumping directly from surface water.
0
100
200
300
400
500
600
0 20 40 60 80 100
Percent Exceedance
Discharge
IFN with EBFNatural Flow
The peer review panel endorses the District’s proposed minimum flows for the upper Braden River and finds them to be based on sound science and best
8-18
available information, subject to our comments and recommendations, as noted above. We believe that the consideration of two separate benchmark periods based on climate regimes and multiple assessment methods and habitat criteria for identifying the limiting-flow reductions in each seasonal block represents best practice for determining instream-flow needs and demonstrates a commitment to a comprehensive aquatic ecosystem approach to this very challenging issue. We again commend the District for specifying minimum flows in terms of allowable percent flow reductions for different seasonal blocks and a low-flow threshold applicable at all times of the year. This “percent-of-flow approach,” combined with seasonal building blocks, has been recognized as one of the best ways of protecting multiple functions and values of river systems under a wide range of flow conditions (Postel and Richter 2003). The proposed short and long-term compliance standards proposed in the report are pragmatic and logical means of implementing the findings of the report in a regulatory context. It is interesting to note that ecosystem functions requiring higher flows tolerate a lower percent reduction than those for low flows, perhaps due to differences in the way the 15% habitat loss threshold is interpreted for different metrics (e.g., temporal loss of habitat with floodplain functions vs. spatial loss of habitat for PHABSIM). The recommended percent-of-flow reductions for the upper Braden River appear to be quite consistent with those prescribed for other rivers in the SWFWMD. In fact, a table comparing the flow reduction values for upper Braden River with those of other rivers in the SWFWMD, with proposed or adopted MFLs, might be useful to include in the report. The specific recommendations for MFLs for the upper Braden River presented in Chapter 5 are reasonable and defensible. The approach presented in detail in the draft document is scientifically well justified and applies multiple metrics in making the recommendations for the MFLs. We endorse the derived recommendations within the report and believe that they provide adequate protection to the river, while permitting some human use of river water throughout the annual hydrograph, except under minimal-flow conditions (a low-flow threshold of 7 cfs). It would be informative to have additional hydrological information presented in Chapter 2 that allows the reader to place the low-flow threshold of 7 cfs into an historical context of flows that have occurred in the upper Braden River during the period of river gauging. Evaluating Assumptions and Adaptive Management We applaud the District’s commitment to periodic reassessment of the MFLs for the upper Braden River and other water bodies as structural alterations or substantial changes in watershed conditions occur. However, the Panel thinks that this commitment does not go far enough, and we are concerned that the District has so far taken no visible steps to assess some of the more uncertain and subjective elements of its MFL approach, namely the adequacy of the 15%
8-19
habitat reduction criterion and the low-flow threshold. We strongly recommend that the District begin now to develop and implement the process and methodology by which such assessment would occur. We recommend that an adaptive management framework be adopted for evaluating the effectiveness of the proposed MFLs for the upper Braden River and other rivers, where similar MFLs have already been adopted. Such a framework should include ongoing evaluation of the effectiveness of the MFLs based on long-term monitoring of key ecosystem and water resource values, specifically focusing on ecological conditions that occur at or near the low-flow threshold and 15% habitat reduction scenarios. Glossary of Terms The District is to be commended for using an inter-disciplinary team approach to setting MFLs in the upper Braden River. Addressing the varying flow ranges, extremely low flows to high flows that inundate the associated wetlands, while using a variety of tools is commendable. When an inter-disciplinary team is assembled, one of the challenges is to ensure everyone has the same understanding of the many terms that are used in such studies. For example, the term “historical” flow can have different interpretations across disciplines. Also, if the intended audience for the report is other District staff, colleagues, Board Members and the public, then having a glossary would help the reader to better understand the many terms that are common to such studies. Studies of this nature are inherently complex, they are never simple, so having a glossary helps to clarify the many terms that are used.
8-20
REFERENCES Annear, T., I. Chisholm, H. Beecher, A. Locke, and 13 other authors. 2004.
Instream flows for riverine resource stewardship, revised edition. Instream Flow Council, Cheyenne, WY. 268 pp.
Bunn, S.E., and A.H. Arthington. 2002. Basic principles and ecological consequences of altered flow regimes for aquatic biodiversity. Environmental Management 30: 492-507.
Bovee, K.D., B.L. Lamb, J.M. Bartholow, C.B. Stalnaker, J. Taylor, and J. Henriksen. 1998. Stream habitat analysis using the instream flow incremental methodology. U.S. Geological Survey, Biol. Res. Div., Info. and Tech. Rpt. USGS/BRD-1998-004.
Cichra, C.E., C.N. Dahm, and D.T. Shaw. 2005. A Review of “Alafia River Minimum Flows and Levels Freshwater Segment including Lithia and Buckhorn Springs” March 21, 2005 Draft, and “Proposed Minimum Flows and Levels for the Upper Segment of the Myakka River, from Myakka City to SR72” August 10, 2005 Draft. 33 pp.
Cichra, C.E., C.N. Dahm, A. Locke, D.T. Shaw, and M. Stewart. 2007. A Review of “Proposed Minimum Flows and Levels for the Upper Segment of the Hillsborough River, from Crystal Springs to Morris Bridge, and Crystal Springs” January 20, 2007 Draft. 37 pp.
Davies, B.R., M.C. Thoms, K.F. Walker, J.H. O'Keeffe, and J.A. Gore. 1994. Dryland rivers: their ecology, conservation, and management. Pp. 484-511 in: P. Calow and G.E. Petts (eds.) The Rivers Handbook. Volume 2. Blackwell Scientific Publishers, London.
Enfield, D.B., A.M. Mestas-Nuñez, and P.J. Trimble. 2001. The Atlantic multidecadal oscillation and its relation to rainfall and river flows in the continental U.S. Geophysical Research Letters 28: 2077-2080.
Gore, J.A., and R.M. Bryant, Jr. 1990. Temporal shifts in physical habitat of the crayfish, Orconectes neglectus (Faxon). Hydrobiologia 199: 131-142.
Gore, J.A., J.B. Layzer, and J. Mead. 2001. Macroinvertebrate instream flow studies after 20 years: a role in stream and river restoration. Regulated Rivers 17: 527-542.
Gore, J.A., and J. Mead. 2002. The benefits and dangers of ecohydrological models to water resource management decisions. In: Ecohydrology: A New Paradigm, United Nations/UNESCO, Geneva and Cambridge University Press.
Gore, J.A., and J.M. Nestler. 1988. Instream flow studies in perspective. Regulated Rivers 2: 93-101.
Gore, J.A., C. Dahm, and C. Klimas. 2002. A review of “Upper Peace River: an analysis of minimum flows and levels”. August 25, 2002 Draft. Prepared for the Southwest Florida Water Management District. Brooksville, FL. 30 pp.
Hill, J.E., and C.E. Cichra. 2002. Minimum Flows and Levels Criteria Development, Evaluation of the Importance of Water Depth and Frequency of Water Levels/Flows on Fish Population Dynamics: Literature Review and
8-21
Summary, Special Publication SJ2002-SP1, St. Johns River Water Management District, Palatka, Florida, February 2002. 40 pp
HSW Engineering, Inc. 2004. Evaluation of the Effects of the Proposed Minimum Flows and Levels Regime on Water Resource Values on the St. Johns River between SR528 and SR46, Report prepared for St. Johns River Water Management District, Palatka, Florida, November 2004, 159 pp.
Munson, A.B., J.J. Delfino, and D.A. Leeper. 2005. Determining minimum levels: The Florida experience. Journal of the American Water Resources Association 41:1-10.
Munson, A.B., and J.J. Delfino. 2007. Minimum wet season flows and levels in southwest Florida Rivers. Journal of the American Water Resources Association 43:522 532.
Odum, H.T. 1957. Trophic structure and productivity of Silver Spring, Florida. Ecological Monographs 27: 55-112.
Poff, N.L., and J.V. Ward. 1989. Implications of streamflow variability and predictability for lotic community structure: a regional analysis of streamflow patterns. Canadian Journal of Fisheries and Aquatic Sciences 46: 1805-1818.
Postel, S., and B. Richter. 2003. Rivers for Life: Managing Water for People and Nature. Island Press. Washington D.C. 253 pp.
Resh, V.H., A.V. Brown, A.P. Covich, M.E. Gurtz, H.W. Li, G.W. Minshall, S.R. Reice, A.L. Sheldon, J.B. Wallace, and R. Wissmar. 1988. The role of disturbance in stream ecology. Journal of the North American Benthological Society 7: 433-455.
Richter, B.D., J.V. Baumgartner, J. Powell, and D.P. Braun. 1996. A method for assessing hydrologic alteration within ecosystems. Conservation Biology 10: 1163-1174.
Richter, B.D., J.V. Baumgartner, R. Wiggington, and D.P. Braun. 1997. How much water does a river need? Freshwater Biology 37: 231-249.
Shaw, D.T., D.S. Gutzler, and C.N. Dahm. 2004. Peer Review Comments on “Florida River Flow Patterns and the Atlantic Multidecadal Oscillation” Report prepared for Southwest Florida Water Management District, December 2004, 10 pp.
Shaw, D.T., C.N. Dahm, and S.W. Golladay. 2005. A Review of “Proposed Minimum Flows and Levels for the Middle Segment of the Peace River, from Zolfo Springs to Arcadia.” Report prepared for Southwest Florida Water Management District, June 2005, 23 pp.
Southwest Florida Water Management District. 2007. Proposed Minimum Flows and Levels for the Upper Segment of the Hillsborough River, from Crystal Springs to Morris Bridge, and Crystal Springs. Peer Review Draft, January 30, 2007. Ecologic Evaluation Section, Resource Conservation and Development Department. Brooksville, FL.
Southwest Florida Water Management District. 2005a. Proposed minimum flows and levels for the middle segment of the Peace River, from Zolfo Springs to Arcadia. Draft. Ecologic Evaluation Section. Resource Conservation and Development Department. Brooksville, FL.
8-22
Southwest Florida Water Management District. 2005b. Alafia River Minimum Flows and Levels Freshwater Segment including Lithia and Buckhorn Springs. Draft – March 21, 2005. Ecologic Evaluation Section, Resource Conservation and Development Department. Brooksville, FL.
Southwest Florida Water Management District, 2005c. Proposed Minimum Flows and Levels for the Upper Segment of the Myakka River, from Myakka City to SR 72. Draft – August 10, 2005. Ecologic Evaluation Section, Resource Conservation and Development Department. Brooksville, FL.
Southwest Florida Water Management District 2004. Florida river flow patterns and the Atlantic Multidecadal Oscillation. Draft. Ecologic Evaluation Section. Resource Conservation and Development Department. Brooksville, FL.
Southwest Florida Water Management District 2002. Upper Peace River: an analysis of minimum flows and levels. Draft. Ecologic Evaluation Section. Resource Conservation and Development Department. Brooksville, FL.
Stanford, J.A., J.V. Ward, W.J. Liss, C.A. Frissell, R.N. Williams, J.A. Lichatowich, and C.C. Coutant. 1996. A general protocol for restoration of regulated rivers. Regulated Rivers 12: 391-413.
Statzner, B., J.A. Gore, and V.H. Resh. 1988. Hydraulic stream ecology: observed patterns and potential applications. Journal of the North American Benthological Society 7: 307-360.
Stuber, R.J., G. Gebhardt, and O.E. Maughan. 1982. Habitat suitability index models: largemouth bass. U.S. Fish and Wildlife Service. FWS/OBS – 82/10.16. U.S. Government Printing Office. Washington D.C.
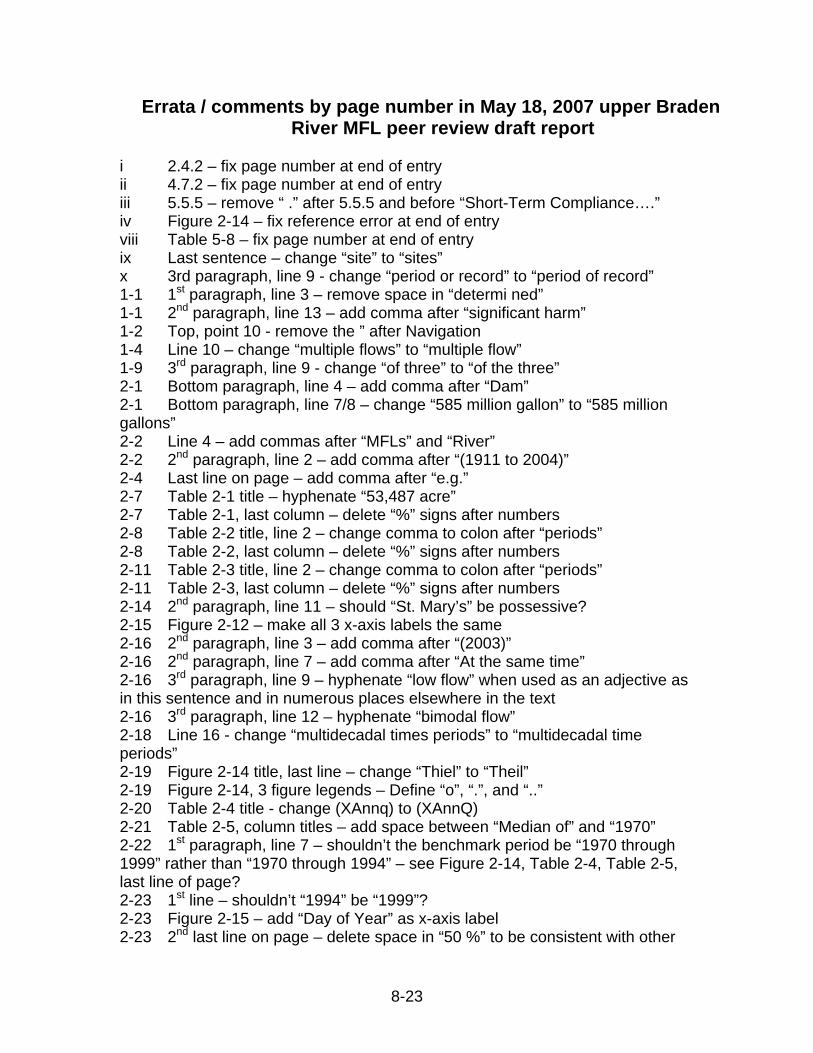
8-23
Errata / comments by page number in May 18, 2007 upper Braden River MFL peer review draft report
i 2.4.2 – fix page number at end of entry ii 4.7.2 – fix page number at end of entry iii 5.5.5 – remove “ .” after 5.5.5 and before “Short-Term Compliance….” iv Figure 2-14 – fix reference error at end of entry viii Table 5-8 – fix page number at end of entry ix Last sentence – change “site” to “sites” x 3rd paragraph, line 9 - change “period or record” to “period of record” 1-1 1st paragraph, line 3 – remove space in “determi ned” 1-1 2nd paragraph, line 13 – add comma after “significant harm” 1-2 Top, point 10 - remove the ” after Navigation 1-4 Line 10 – change “multiple flows” to “multiple flow” 1-9 3rd paragraph, line 9 - change “of three” to “of the three” 2-1 Bottom paragraph, line 4 – add comma after “Dam” 2-1 Bottom paragraph, line 7/8 – change “585 million gallon” to “585 million gallons” 2-2 Line 4 – add commas after “MFLs” and “River” 2-2 2nd paragraph, line 2 – add comma after “(1911 to 2004)” 2-4 Last line on page – add comma after “e.g.” 2-7 Table 2-1 title – hyphenate “53,487 acre” 2-7 Table 2-1, last column – delete “%” signs after numbers 2-8 Table 2-2 title, line 2 – change comma to colon after “periods” 2-8 Table 2-2, last column – delete “%” signs after numbers 2-11 Table 2-3 title, line 2 – change comma to colon after “periods” 2-11 Table 2-3, last column – delete “%” signs after numbers 2-14 2nd paragraph, line 11 – should “St. Mary’s” be possessive? 2-15 Figure 2-12 – make all 3 x-axis labels the same 2-16 2nd paragraph, line 3 – add comma after “(2003)” 2-16 2nd paragraph, line 7 – add comma after “At the same time” 2-16 3rd paragraph, line 9 – hyphenate “low flow” when used as an adjective as in this sentence and in numerous places elsewhere in the text 2-16 3rd paragraph, line 12 – hyphenate “bimodal flow” 2-18 Line 16 - change “multidecadal times periods” to “multidecadal time periods” 2-19 Figure 2-14 title, last line – change “Thiel” to “Theil” 2-19 Figure 2-14, 3 figure legends – Define “o”, “.”, and “..” 2-20 Table 2-4 title - change (XAnnq) to (XAnnQ) 2-21 Table 2-5, column titles – add space between “Median of” and “1970” 2-22 1st paragraph, line 7 – shouldn’t the benchmark period be “1970 through 1999” rather than “1970 through 1994” – see Figure 2-14, Table 2-4, Table 2-5, last line of page? 2-23 1st line – shouldn’t “1994” be “1999”? 2-23 Figure 2-15 – add “Day of Year” as x-axis label 2-23 2nd last line on page – delete space in “50 %” to be consistent with other
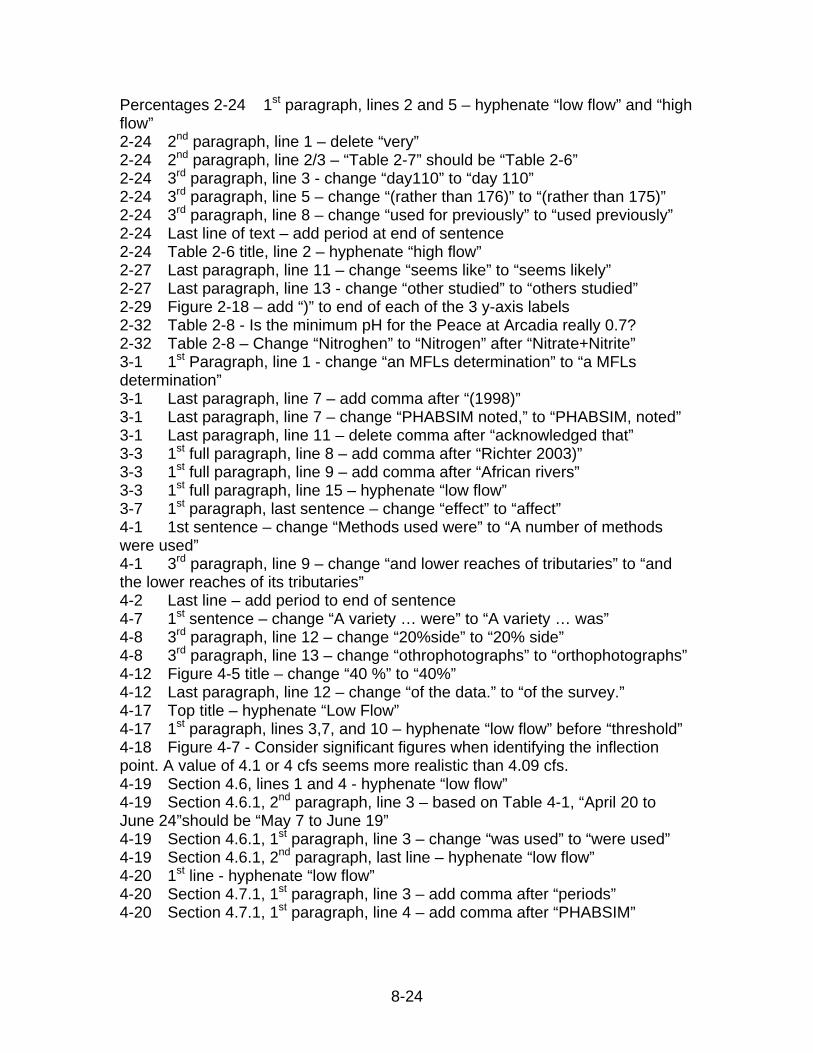
8-24
Percentages 2-24 1st paragraph, lines 2 and 5 – hyphenate “low flow” and “high flow” 2-24 2nd paragraph, line 1 – delete “very” 2-24 2nd paragraph, line 2/3 – “Table 2-7” should be “Table 2-6” 2-24 3rd paragraph, line 3 - change “day110” to “day 110” 2-24 3rd paragraph, line 5 – change “(rather than 176)” to “(rather than 175)” 2-24 3rd paragraph, line 8 – change “used for previously” to “used previously” 2-24 Last line of text – add period at end of sentence 2-24 Table 2-6 title, line 2 – hyphenate “high flow” 2-27 Last paragraph, line 11 – change “seems like” to “seems likely” 2-27 Last paragraph, line 13 - change “other studied” to “others studied” 2-29 Figure 2-18 – add “)” to end of each of the 3 y-axis labels 2-32 Table 2-8 - Is the minimum pH for the Peace at Arcadia really 0.7? 2-32 Table 2-8 – Change “Nitroghen” to “Nitrogen” after “Nitrate+Nitrite” 3-1 1st Paragraph, line 1 - change “an MFLs determination” to “a MFLs determination” 3-1 Last paragraph, line 7 – add comma after “(1998)” 3-1 Last paragraph, line 7 – change “PHABSIM noted,” to “PHABSIM, noted” 3-1 Last paragraph, line 11 – delete comma after “acknowledged that” 3-3 1st full paragraph, line 8 – add comma after “Richter 2003)” 3-3 1st full paragraph, line 9 – add comma after “African rivers” 3-3 1st full paragraph, line 15 – hyphenate “low flow” 3-7 1st paragraph, last sentence – change “effect” to “affect” 4-1 1st sentence – change “Methods used were” to “A number of methods were used” 4-1 3rd paragraph, line 9 – change “and lower reaches of tributaries” to “and the lower reaches of its tributaries” 4-2 Last line – add period to end of sentence 4-7 1st sentence – change “A variety … were” to “A variety … was” 4-8 3rd paragraph, line 12 – change “20%side” to “20% side” 4-8 3rd paragraph, line 13 – change “othrophotographs” to “orthophotographs” 4-12 Figure 4-5 title – change “40 %” to “40%” 4-12 Last paragraph, line 12 – change “of the data.” to “of the survey.” 4-17 Top title – hyphenate “Low Flow” 4-17 1st paragraph, lines 3,7, and 10 – hyphenate “low flow” before “threshold” 4-18 Figure 4-7 - Consider significant figures when identifying the inflection point. A value of 4.1 or 4 cfs seems more realistic than 4.09 cfs. 4-19 Section 4.6, lines 1 and 4 - hyphenate “low flow” 4-19 Section 4.6.1, 2nd paragraph, line 3 – based on Table 4-1, “April 20 to June 24”should be “May 7 to June 19” 4-19 Section 4.6.1, 1st paragraph, line 3 – change “was used” to “were used” 4-19 Section 4.6.1, 2nd paragraph, last line – hyphenate “low flow” 4-20 1st line - hyphenate “low flow” 4-20 Section 4.7.1, 1st paragraph, line 3 – add comma after “periods” 4-20 Section 4.7.1, 1st paragraph, line 4 – add comma after “PHABSIM”
8-25
4-20 Section 4.7.1, 1st paragraph, line 4 – shouldn’t “1988-1993 and from 1994-2005”read “1988-1994 and from 1995-2005”? 4-20 Section 4.7.1, 2nd paragraph, line 5 – based on Table 4-1, “October 28 of
one year to April 19” should be “October 25 of one year to May 6” 4-20 Section 4.7.1, 2nd paragraph, line 8 – add comma after “Block 2” 4-21 1st full paragraph, last line – hyphenate “low flow” 4-21 Section 4.8, 2nd paragraph, line 2 - based on Table 4-1, “June 25 to
October 27” Should be “June 20 to October 24”
4-22 Section 4.8.1, line 8 – shouldn’t “1989 through 1993 and from 1994 through 2005” read “1988 through 1994 and from 1995 through 2005”?
4-22 1st line - change “Loraine” to “Lorraine” 5-1 1st 2 paragraphs – hyphenate “low flow” when used before “threshold” (5 places) 5-1 Section 5.2, heading - hyphenate “low flow” 5-1 Section 5.2.1, line 7 – hyphenate “low flow” before “periods” 5-2 Figure 5-1 title, line 3 – delete space after “Lorraine” and before “,” 5-3 Section 5.2.3, heading - hyphenate “low flow” 5-3 1st paragraph – hyphenate “low flow” when used before “threshold” (3 places) 5-4 3rd paragraph, line 3 – delete “the month of” 5-4 3rd paragraph, line 6 – change “time periods, respectively” to “time periods for the two sites, respectively” 5-6 1st 2 lines - move to bottom of page 5-5 5-6 Section 5.3.2, point 1 - hyphenate “low flow” 5-6 Section 5.3.2, last sentence - change “percent-of flow” to “percent-of-flow” 5-6 Section 5.3.2, last sentence, last line - hyphenate “low flow” 5-6 Section 5.4, line 3 - change “Long-term” to “long-term” 5-6 Section 5.4, line 6 – add comma after “inflection points” 5-6 Section 5.4, last line – hyphenate “low flow” 5-8 Table 5-2 title, line 1 – delete extra space between “of” and “floodplain” 5-8 Why reference Table 5-7 before Tables 5-3, 5-4, 5-5, and 5-6? Move contents of
Table 5-7 to Table 5-3 and shifts contents of Tables 5-3 to 5-6 back one table 5-10 Last paragraph – capitalize “transects” in 4 places (?) 5-12 Last paragraph, lines 2 and 5 - change “soils conditions” to “soil conditions” 5-13 1st line – change “not saturated” to “non-saturated” 5-13 2nd line - capitalize “transects” 5-13 Table 5-5, last column heading – change “Not Saturated” to “Non-Saturated” 5-14 1st paragraph, line 3 - change “too low” to “too infrequently” 5-14 Last paragraph, line 6 - change “geomorhpological” to “geomorphological”
8-26
5-14 Last paragraph, last line - change “through1994” to “through 1994” 5-15 Table 5-7 title - change “geomorhpological” to “geomorphological” 5-15 Table 5-7 last footnote – change “Flows required at to inundate” to “Flows required to inundate” 5-15 Table 5-7 last footnote – change “transect” to “transects” 5-15 Table 5-7 last footnote – delete extra space between “than” and “the 1%” 5-15 Last paragraph, line 6 - change “Block3” to “Block 3” 5-15 Last paragraph, line 8 – change “1 %” “1%” 5-16 Line 2 – add comma after “reductions” 5-16 Line 3 – add comma after “achieved” 5-16 Line 10 - change “also show that” to “also shows that” 5-17 Figure 5-8 title, line 2 – change “from at the USGS” to “from the USGS” 5-17 Section 5.4.4, point 1 – hyphenate “low flow” 5-17 Section 5.4.4, point 2 – hyphenate “low flow” 5-17 Section 5.4.4, point 3 – change “flow above 54” to “flows above 54” 5-18 Section 5.5.1, 1st paragraph, line 5 – change “,” to “.” after “time-series analyses” 5-18 Section 5.5.1, 2nd paragraph, line 4 – change “,” to “.” after “(Figure 5-9)” 5-20 Last line – delete extra space between “Pringle et al.” and “1988” 5-22 Line 2 – hyphenate “medium flow” 5-24 Section 5.5.5, point 1 - hyphenate “low flow” 5-25 Section 5.6, line 7 – add comma after “River” and “MFLs” 5-25 Figure 5-13 title, line 4 – add comma after “natural flow” 5-25 Figure 5-13 title, line 4 – add “withdrawal,” after “maximum allowable” 5-25 Figure 5-13 title, line 5 – hyphenate “Low Flow” and “High Flow” 6-2 Brussock et al. – add comma after “Brown” 6-2 Bunn and Arthington - remove period after “Management” 6-2 Cherry et al. – change “96 p” to “96 pp.” 6-3 Goldenberg et al. - change “Nestas-Nunez” to “Mestas-Nunez” 6-4 Junk et al. – add comma after “Bayley” 6-4 All 3 Kelly et al. MFL reports are listed as “165 pp + appendix” – check for accuracy 6-5 1st line – delete space between “FL” and “.” 6-5 Kohler et al. – missing initials for Nordenson and Baker 6-5 Kohler et al. – change “13 p” to “13 pp.” 6-5 Kuensler - capitalize the book title 6-5 Manly et al. - capitalize book title 6-5 Munson and Delfino (2007) - add page numbers for the reference (522-532), and Place the journal article title in lower case 6-6 Shaw et al. - change “23pp” to “23 pp” 6-6 Smith and Stopp - capitalize the book title 6-7 Stuber et al. – add comma after “Gebhardt” 6-7 Trommer et al. – add comma after “DelCharco”
9-1
Chapter 9 Appendix B – Staff Response to the Peer Review Report
Staff Response to
"A Review of 'Proposed Minimum Flows and Levels
for the Upper Segment of the Braden River, from Linger Lodge to Lorraine Road'"
Specific comments identified by the peer review panel are reproduced below along with staff responses. Comments are organized under section headings used in the peer review report.
9-2
MFL Benchmarks and Resource Protection Goals Benchmarks and the Atlantic Multidecadal Oscillation (AMO)
1) The panel continues to "endorse and applaud" the use of the multiple benchmark periods, based on multidecadal climate variability, for MFL determinations. They, however, suggest removing more than a reference to the link between the variability in stream flow and the Atlantic Multi-decadal Oscillation (AMO). As they state: "Although we are suggesting de-emphasizing the narrative connection with AMO, the panel strongly believes the idea of multidecadal variations in streamflow is valid."
Staff agrees that the link between streamflow and the AMO offers no predictive power. However, it does offer a mechanistic hypothesis for explaining long-term streamflow variability. Staff believes that dividing the flow record into periods of relatively high and low flows without offering some explanation for why we might expect continued phasing of these flow conditions reduces the value of observing past variations in stream flow. Though the AMO offers no predictive power in terms of when we might expect a change in flow conditions, the argument made by the District, which the panel terms "a strong case", is that future cycles can be expected, and that the shifts observed in the past, are not random or one-time steps but rather indicative of cyclic events. If there is not a case for linking the stream flow variations to a cyclic mechanism, then there is not necessarily any reason to use multiple benchmarks for developing minimum flows. Staff does however, agree that after publication of multiple peer reviewed MFLs documents, discussion of the AMO in subsequent reports can be minimized.
9-3
2) The panel notes that the period of hydrologic record is significantly shorter for the upper Braden River, compared to other river ecosystems where MFLs have been proposed by the SWFWMD, and they feel that uncertainties associated with the limited hydrological record should be carefully acknowledged. They note that on page 2-17, it is stated, “Based on the availability of data for the Braden River near Lorraine site, the minimum flows and levels recommended in this report for the upper, freshwater segment of the Braden River were developed for flows measured at this gaging station.” and on pages 4-19 and 4-20, it is stated, “historic time series data from the Braden River near Lorraine gage site was used to model changes in habitat at two representative sites”. It would be helpful to the reader if definitions for “natural”, “recorded” and “historic” flows were provided. If there are differences between historic and natural flows, then this should be clearly stated.
Staff agrees with the panel's recommendations outlined above and has adopted their suggestions by providing a glossary of terms in the revised version of the Braden River MFLs report, and plans to also include a glossary in future MFLs reports. In the case of the Braden River, no changes to the recorded or historic flow record were necessary for the MFLs analyses, so the record is also considered to be the natural flow record, i.e., the flow record expected in the absence of water withdrawal impacts. It should be noted that the natural flow record for MFLs determinations may not be the same as the flow record that would have been expected in the absence of land use changes or other non-withdrawal anthropogenic effects.
9-4
Seasonal Building Blocks
3) The peer review panel wonders if flow blocks need to be pre-assigned or could all the tools used in the approach be applied to all weeks of the year and then the most conservative, or protective, factor be applied. "For example, develop hydrology data so that the flows for each week can be analyzed using all appropriate tools for that time of year and for that particular range of flows. Specifically, there may be some biological rationale for moving to a weekly time step instead of using a monthly time step when applying the PHABSIM models. With commercial spreadsheet software, analysis can easily be carried out on a weekly time step, or shorter if appropriate, and there may be some valuable knowledge gained."
Staff agree that pre-assigned flow blocks based on regional river systems are no longer necessary and for the Braden River and other river systems for which MFLs are currently being established, has developed flow blocks based on river-specific flow records . Staff believes that use of a seasonal or flow-block approach is reasonable, given the presumed adaptation of stream-dependent biota to seasonal flow variability. However, staff acknowledges that the addition of flow-range specific tools may be appropriate for MFLs development. Staff will also examine the use of weekly time-steps in subsequent modeling efforts supporting MFLs development and will compare these results with seasonally based time-steps to determine whether the current approach should be modified.
9-5
4) One aspect of Chapter 2 should be expanded. It appears that the upper Braden River may be prone to intermittency. There is, however, no specific spelling out of the very low flows and zero flows that have occurred during the period of record. How many days of zero flow or < 7 cfs flow occur in the three blocks? What is the range of zero flow or < 7 cfs flow days each year during the period of record? This is a river prone to very low flows and possible intermittency, and the Panel thinks that the details of these conditions for the period of record should be clearly spelled out.
The lowest recorded flow is 0.08 cfs. The record does indicate flows below 7 cfs occurred 194 day a year on average. Flows in block 1 exceed 7 cfs on average only 8.3 days each year. These facts and a brief discussion of low flow conditions were added to page 5-3 of the revised report. Resource Protection Goals
9-6
5) The panel suggests that the District has not fully addressed the
subset of factors listed in the Florida Administrative Code (Rule 62-40.473 F.A.C) that are to be considered when setting MFLs. Specifically, they note that there should be concern from the District for maintaining a minimum dissolved oxygen level and sustaining temperature below some undefined threshold.
Not every one of the ten factors listed in Rule 62-40.473, F.A.C. is expressly addressed in the MFLs documents generated by the District. Staff does believe, however, that the percent-of-flow approach to surface water regulation provides protection for each of the listed factors. Staff have not interpreted the F.A.C. directive to consider the listed factors to mean that each must be expressly studied on each river, when it is reasonable to assume that other factors examined would be expected to afford protection to the factors not explicitly studied. With respect to this position, the panel notes that another state water management districts has developed reports in which it has been concluded that many of the factors listed in the F.A.C are not applicable to specific water bodies. The District has engaged external expertise during the Rainbow River MFL process to evaluate the efficacy of such studies. Staff agree with the panel's specific comment that dissolved oxygen and water temperature should be considered when developing minimum flows. To address this issue, staff has recently concluded a study examining the effects of flow variability across river shoals on temperature and dissolved oxygen. Details on the study were not included in the Braden River MFLs report because they were not used in the generation of the recommended Braden River MFLs.
9-7
Preventing Significant Harm – 15% Change n Habitat Availability
6) The authors of the peer review report state that the 15% habitat loss criterion remains one of the most subjective aspects of the District's approach. They do, however, note that staff correctly points out that there are few thresholds or "bright lines" which can be identified for establishing MFLs, and that previous peer review panels found the criterion to be "reasonable and prudent." The panel acknowledges that the use of the criterion is rational and pragmatic, but claims that the specific value of 15% is subjective.
Staff agrees that the use of the15% habitat loss criterion for establishing MFLs may be considered subjective. The criterion was, however, developed based on review of threshold values used for other minimum flow determinations reported in the literature and a previous peer review recommendation. Staff acknowledges that additional documentation could be gathered and reviewed to support or potentially refine use of a percentage-based habitat-loss criterion for MFLs development, and plans to hire a consultant to complete this effort. Staff has also engaged the peer review panel in discussions concerning a potential study for validating and refining the assumptions associated with use of the 15% habitat-loss criterion.
9-8
Analytical Tools Used to Develop MFLs PHABSIM
7) The peer review report notes that bluegill and largemouth bass are
generalist and not especially sensitive to change in hydrologic regime and may, therefore, be inappropriate species for use in the PHABSIM analyses used to develop MFLs. The review panel suggests that the District generate habitat suitability curves (for use in the PHABSIM system) for species that are more sensitive to changes in flow and also suggests that it may be appropriate to incorporate species or community types tracked by the Florida Natural Areas Inventory (e.g., peninsular floater, ironcolor shiner, Chapman's sedge. bald eagle, and hydric hammock) into the modeling effort.
Staff agrees that development of additional habitat suitability curves, or refinement of existing curves would be a means of improving the PHABSIM analysis used in the MFLs process. The District has contracted Dr. James Gore of the University of South Florida to complete this work. To date Dr. Gore has developed and used Florida-specific data to refine about half of the curves currently used for District MFLs analyses,. Staff continues to work with Dr. Gore to identify the most practical and useful candidates for development of new habitat suitability indeces or curves. Staff notes that it may be possible to incorporate species or community types tracked through the Florida Natural Areas Inventory program into the District's PHABSIM modeling efforts. With respect to the specific taxa and community identified by the panel, staff consulted with Dr. James Gore on the potential for developing data sets that could be used for PHABSIM analyses supporting MFLs development. Comments provided by Dr. Gore are summarized below. (1) Ironcolor shiner (Notropis chalybaeus) - Indices or curves for this small fish species could be developed if it is possible to identify this shiner in the field during electrofishing. Field identification of minnow species is typically difficult, however, and the ironcolor shiner is a relatively nondescript minnow. Use of a recently developed habitat suitability curves for "forage fish" a collection of small fish species, may be an appropriate substitute for species-specific curves for small fish taxa and will be used in future river MFLs studies. (2) Peninsular floater (Utterbackia peninsularis) – Development of habitat suitability curves for this mussel species would be problematic at best since mussels do not "respond" to changing flows in the same way that fish and mobile invertebrates do - their only choice is to either starve to death slowly because
9-9
they aren't getting enough particulates delivered to them or they dry up and die Use of PHABSIM analyses is not appropriate for relatively stationary species. This issue is discussed in greater detail in the published paper listed below, which proposes an alternative way to address mussels and instream flows. Basically, the recommended approach would be to map mussel beds in river segments and use the PHABSIM modeling system to examine changes in inundation depths and flow velocities with changes in river flows. This can be an arduous process but has been accomplished for a couple of streams in Tennessee and Alabama. Gore, J.A., J.B. Layzer, and J. Mead. 2001. Macroinvertebrate instream flow studies after 20 years: a role in stream and river restoration. Regulated Rivers 17: 527-542 (3) Chapman's sedge (Carex chapmanii), a wetland plant, is also stationary. Like the peninsular floater and most mussel species, individual plants cannot relocate in response to changing flows, although it likely that distribution of propagules is influenced by variations in flow. Existing stands of the sedge could be mapped and hydraulic models used to predict inundation of the stands under varying flow regimes. Information on preferred habitat variables (e.g., water depth and velocity) could be developed and used to predict potential habitat availability for the species. (4) Bald eagle (Haliaetus leucocephalus) - Field observations and photography from blinds could be used to pinpoint the "use" / capture points of fish, etc., for individual eagles and then water velocities, depths, and substrate conditions associated with the points could be used to create habitat suitability curves. This would probably be a difficult and potentially unreliable process as the species is not entirely water dependant. (5) Hydric hammock, a natural community of the river's floodplain. Hydraulic models could be used to predict inundation patterns for this floodplain community, but it seems unreasonable that PHABSIM could be utilized for evaluating changes in this habitat type. Current District methods for establishing MFLs include analysis of inundation patterns for this and other floodplain communities. As part of its adaptive management approach the District continues to develop new and refine existing habitat suitability curves. Consultants have already refined some of the initial curves used in MFL studies to be Florida specific. The newer curves are consistent with the earlier curves though they exhibit a higher level of detail.
9-10
8) Peer reviewers mentioned that having a schematic or aerially-based map
showing PHABSIM transects and some general features would be informative to the reader, and they recommend including this type of figure in future reports. There also note that a description of the ratio of habitat types (riffle / run / pool) that are represented in the study sites by the three PHABSIM transects should be include in future reports. They also note that future reports should include a discussion of the ratio of habitat types in the study sites relative to the ratio of these habitat types in the entire reach of the river that the study sites represent.
Staff understands the points made and has tried to select representative site for location the PHABSIM transects in the past. As always access granted by private land owners has played a role in site selection. The comments of the panel are appreciated and their suggestions for schematics and better description of the transect selection process will be incorporated into future MFLs reports.
9-11
Habitat Criteria and Characterization Methods Used to Develop MFLs Fish Passage
9) The peer review panel has questioned the adequacy of the fish passage depth for maintaining negative effects associated with low flows in warm water ecosystems (i.e., temperature, dissolved oxygen, and algal blooms). The peer review staff further seeks assurance that the hydrologic control points were systematically identified. On page 4-18, in the last paragraph, it is stated, “The flows were determined by adding the 0.6-ft depth fish-passage criterion to the elevation of the lowest spot in the channel and determining the flow necessary to achieve the resultant elevations.” It would be helpful to the reader if the determination of “…the lowest spot in the channel…” was more thoroughly described in the report.
As noted in item (5) above the District has committed to the study and confirmation of its low flow threshold criteria (e.g., fish passage water depth). The dissolved oxygen and water temperature study currently being conducted by staff seeks to validate or improve the fish passage estimate with regard to the implied protection of oxygenation and thermal characteristics associated with flow across river shoals. With respect to the panel's concerns regarding description of the "lowest spot in the channel", staff notes that the lowest spot in the channel refers to the lowest surveyed elevation in the respective shoal cross-section. Staff has revised the MFLs report to clarify this description.
9-12
Wetted Perimeter
10) Given that this method [identification of the lowest wetted perimeter inflection point for establishing a low flow threshold] should only be applied in shallows, riffles or ledges, it is not clear why the authors choose to establish the “…wetted perimeter inflection point at the lowest modeled flow.” Perhaps, it would be better to simply eliminate these transects from the analysis since transects through pools should not be used.
Staff agree with this comment and actually use only the results from shallow areas for determination of low flow thresholds. Deep pools which have inflection points established below or at the lowest modeled flow are ignored when evaluating the lowest wetted perimeter inflection point. Clearly it would be inappropriate to do otherwise. Staff do however report this data for completeness, and view it as similar to a chemistry lab reporting below detection limits as the detection limit or Secchi disk depth which hits the bottom as being recorded as bottom depth.
9-13
Compliance Standards and Proposed Minimum Flows
11) The Panel notes that flow-duration curves, the common currency of hydrologists, are a useful way to present information of this type and may be beneficial to the reader in that the full range of flows that can occur in any given time step can be seen.
Staff agrees that flow duration curves are effective for conveying hydrologic information. However, staff believes that the median annual flow hydrographs presented in District MFLs reports are easily understood by both experts and laypersons and that they are appropriate for comparing potential hydrologic regimes associated with the proposed minimum flows with historic or natural flows. Staff will consider the inclusion of flow-duration curves in future MFLs reports as an addition to the currently used hydrographs.
9-14
Evaluating Assumptions and Adaptive Management
12) The Panel thinks that the District should develop a methodology to confirm the adequacy of the 15% habitat reduction criterion and the low flow threshold. They recommend an adoptive management framework for this work and suggest ongoing monitoring of key ecosystems components, specifically focusing on ecological conditions that occur at or near the low-flow threshold and 15% habitat reduction scenarios.
The 15% habitat reduction and low flow threshold criteria are used to identify acceptable ecological changes associated with long-term decreases in flow, not short-term flow variations that may occur on a seasonal basis. Manipulative studies, involving long-term flow reductions would be necessary to fully evaluate the adequacy of the flow criteria. Staff is evaluating the means by which such studies could be conducted.
9-15
Glossary of Terms 13) When an inter-disciplinary team is assembled, one of the challenges
is to ensure everyone has the same understanding of the many terms that are used in such studies. Studies of this nature are inherently complex, they are never simple, so having a glossary helps to clarify the many terms that are used.
The District has produced a glossary of terms and included in the revised version of the report. It is expected that the glossary will continue to develop as it is utilized in future MFLs reports.
9-16
Errata / Comments by Page umber in the May 18, 2007 Upper Braden River MFL peer review draft report All errata listed in the peer review report were addressed in the revised version of the report with the exception of the following. 2-22 1st paragraph, line 7 – shouldn’t the benchmark period be “1970 through 1999” rather than “1970 through 1994” – see Figure 2-14, Table 2-4, Table 2-5, last line of page? No, though in earlier MFLs reports the AMO cycle was taken to be 30 year periods recent climatologically papers and communication with NOAA staff has lead us to refine the most recent dry phase to reflect a shift back to the wet phase as of 1995. 2-32 Table 2-8 - Is the minimum pH for the Peace at Arcadia really 0.7? Staff agree that this reported values seems low. Though our original files indicated three dates (11/12/63, 8/1/64, and 9/1/65) as having a pH of 0.73 when we went back to the USGS website on 11/27/2007 we found these numbers currently reported as 7.3 and the current minimum reported as 3.8 on 3/1/1963 and have modified the revised report accordingly. 4-20 Section 4.7.1, 1st paragraph, line 4 – shouldn’t “1988-1993 and from 1994-2005”read “1988-1994 and from 1995-2005”? No. It would have been correct to go from “1988-1994 and from 1995-2005” but the actual model runs from the consultant were from “1988-1993 and from 1994-2005”. This occurred because staff had not made a determination on when the AMO shifted phases until after the PHABSIM data was delivered to the consultant. 4-22 Section 4.8.1, line 8 – shouldn’t “1989 through 1993 and from 1994 through 2005” read “1988 through 1994 and from 1995 through 2005”? No. It would have been correct to go from “1988-1994 and from 1995-2005” but the actual model runs from the consultant were from “1988-1993 and from 1994-2005”. This occurred because staff had not made a determination on when the AMO shifted phases until after the PHABSIM data was delivered to the consultant.


![Upper bound on the density of Ruelle resonances for Anosov flows. · 2018-11-03 · arXiv:1003.0513v1 [math-ph] 2 Mar 2010 Upper bound on the density of Ruelle resonances for Anosov](https://img.pdfslide.us/doc/110x75/5ec7ee52189b200b744bd570/upper-bound-on-the-density-of-ruelle-resonances-for-anosov-flows-2018-11-03-arxiv10030513v1.jpg)