Embed Size (px)
Citation preview

Stormwater Concept Plan Proposed for Industrial Development 813-913 Wallgrove Road, Horsely Park
August 2013 Reference Number X12254-01
Prepared for Gazcorp Pty Ltd

Project No. X12254.01A|Prepared for Gazcorp Pty Ltd Commercial in Confidence
COMMERCIAL IN CONFIDENCE
All intellectual property rights, including copyright, in designs developed and documents created Brown Consulting NSW Pty Ltd remain the property of this company. Any use made of such design or document without the prior written approval of Brown Consulting NSW Pty Ltd will constitute an infringement of the rights of the company which reserves all legal rights and remedies in respect of any such infringement.
The information, including any intellectual property, contained in this proposal is confidential and proprietary to the Company. It may only be used by the person to whom it is provided for the stated purpose for which it is provided and must not be imparted to any third person without the prior written approval of the Company. The Company reserves all legal rights and remedies in relation to any infringement of its rights in respect of its confidential information.
©
Brown Consulting (NSW) Pty Ltd PO Box 8300
Baulkham Hills NSW 2153
Ph: (02) 8808 5000
August 2013
DOCUMENT CONTROL
X12254-01B
Issue Date Issue Details Author Checked Approved
A July 2013 Internal Review RB
B Aug 2013 DA RB PB
X12254.01B|Prepared for Gazcorp Pty Ltd Commercial in Confidence Page | i
Table of Contents
1. INTRODUCTION ........................................................................................................................................ 1
1.1 Description of the Study Area .................................................................................................................... 2 1.2 Objectives ................................................................................................................................................... 3
2. HYDROLOGY ............................................................................................................................................. 4
2.1 Catchment Areas ........................................................................................................................................ 4 2.2 Model Parameters ...................................................................................................................................... 5 2.3 Results of Modelling ................................................................................................................................... 5
2.3.1 Existing Conditions ......................................................................................................................... 5 2.3.2 Developed Conditions – With No Detention ................................................................................... 6
2.4 On-Site Detention ....................................................................................................................................... 6 2.4.1 Performance Targets ...................................................................................................................... 6 2.4.2 Detention Requirements ................................................................................................................ 7 2.4.3 Results of Modelling with Detention .............................................................................................. 7 2.4.4 Comparison with Pre and Post Development Flows ....................................................................... 8
3. MANAGEMENT OF MAJOR AND MINOR FLOWS ......................................................................................... 9
3.1 Minor Flow Management ........................................................................................................................... 9 3.2 Major Flow Management up to 100 year ARI ............................................................................................ 9 3.3 Temporary Conveyance Structures .......................................................................................................... 10 3.4 Conveyance of External Catchments ........................................................................................................ 11
4. STORMWATER QUALITY TREATMENT ...................................................................................................... 12
4.1 Performance Targets ................................................................................................................................ 12 4.2 Stormwater Treatment Strategy .............................................................................................................. 12
4.2.1 Onsite Treatment for Individual Lots ............................................................................................ 13 4.2.2 Gross Pollutant Traps (GPT’s) ....................................................................................................... 13
4.3 Music Modelling ....................................................................................................................................... 14 4.3.1 Modelling Parameters .................................................................................................................. 14 4.3.2 Music Modelling Network ............................................................................................................ 14 4.3.3 Music Modelling Results ............................................................................................................... 15
5. STAGE 1 INTERIM WORKS ....................................................................................................................... 16
5.1 On-site Detention for Stage 1 ................................................................................................................... 16 5.2 Stormwater Quality Treatment ................................................................................................................ 17
5.2.1 Music Modelling Network ............................................................................................................ 18 5.2.2 Music modelling Results ............................................................................................................... 19
6. CONCLUSION .......................................................................................................................................... 20

X12254.01B|Prepared for Gazcorp Pty Ltd Commercial in Confidence Page | ii
7. REFERENCES ........................................................................................................................................... 20
8. GLOSSARY OF TERMS .............................................................................................................................. 21
Tables
Table 2.1: Design Loss Rates ............................................................................................................................................. 5
Table 2.2: Existing Peak Flows .......................................................................................................................................... 5
Table 2.3: Developed Peak Flows (No Detention) ............................................................................................................ 6
Table 2.4: Performance Targets for storm water Quantity .............................................................................................. 6
Table 2.5: Summary of On-Site Detention Requirements ................................................................................................ 7
Table 2.6: Summary of On-Site Detention Modelling Results .......................................................................................... 8
Table 2.7: Comparison of Pre and Post Development Peak Flow Rates (with OSD)......................................................... 8
Table 3.1: Summary of Temporary Swales .....................................................................................................................10
Table 3.2: Dimensions of Swale for Upslope Diversion ..................................................................................................11
Table 4.1: Reduction Rate Targets for Water Quality Treatment. ..................................................................................12
Table 4.2: Results of MUSIC Modelling for Stormwater Treatment Strategy No 1 for Site ............................................15
Table 5.1: Comparison of Pre and Post Development Peak Flow Rates (with OSD).......................................................16
Table 5.2: Results of MUSIC Modelling for Stormwater Treatment Strategy for Stage 1 ..............................................19
Table C.1: Adopted MUSIC modelling parameters for Rainfall Runoff Parameters .......................................................20
Table C.2: Adopted MUSIC modelling parameters for Pollutant Load Generation ........................................................21
Figures
Figure 1.1: Locality Sketch ................................................................................................................................................ 1
Figure 1.2: The Proposed Layout Plan of the Site ............................................................................................................. 2
Figure 4.1: Music Model Network for Overall Site. ........................................................................................................14
Figure 5.1: Music Model Network for Stage 1 ................................................................................................................18
APPENDICES
Appendix A Drawings
Appendix B XP-RAFTS Modelling Results
Appendix C MUSIC Modelling Results

X12254.01B| Prepared for Gazcorp Pty Ltd Page | 1
1. INTRODUCTION
Brown Consulting has been engaged by Gazcorp Pty Ltd to develop a stormwater concept plan for a proposed industrial development at 813 – 913 Wallgrove Road, Horsely Park. This concept plan covers stormwater quality and quantity management issues to support the Development Application (DA) for the subdivision of 15 lots and proposed internal access road. The site is situated within the Local Government Area of Fairfield City Council. The locality sketch of the study area is shown in Figure 1.1 below.
Figure 1.1: Locality Sketch

X12254.01B| Prepared for Gazcorp Pty Ltd Page | 2
1.1 Description of the Study Area
The site is bordered by Wallgrove Road and Western Sydney Toll Road M7 at the east, Ready Creek at the west, and Sydney Catchment Authority pipeline at the northern boundary. Currently the site is used as grazing pasture land for cattle and horses.
The proposed development consists of 15 industrial lots with an internal access road to provide access to the proposed lots from Wallgrove Road. There is a future RMS Road reserve shared in part by the site, which will eventually run along the northern boundary of the site to be commissioned at a future stage. The general layout plan of the site is shown in Figure 1.2 below.
Figure 1.2: The Proposed Layout Plan of the Site

X12254.01B| Prepared for Gazcorp Pty Ltd Page | 3
1.2 Objectives
The objectives of the Stormwater Concept Plan for the subdivision take into consideration the requirements of the Fairfield Development Concept Plan (November, 2010); Urban Area Onsite Detention Handbook (February, 1997) for water quantity and Sydney Metropolitan Catchment Management Authority, Interim Reference Guidelines for South East Queensland Concept Design Guidelines for WSUD for water quality management. The objectives of this study is:
• To provide stormwater concept design of trunk drainage for the overall site
• To provide a concept sizing of detention storage requirement to reduce all the developed peak flows off the proposed development to the pre-development flows from the site.
• To demonstrate the proposed stormwater treatment strategy incorporated into the stormwater concept plan meet the pollution reduction targets outlined in the Sydney Metropolitan Catchment Management Authority, Interim Reference Guidelines for South East Queensland Concept Design Guidelines for WSUD.
• To provide an interim stormwater concept design for the interim Stage 1 of works for the site.

X12254.01B| Prepared for Gazcorp Pty Ltd Page | 4
2. HYDROLOGY
2.1 Catchment Areas
The total site area is 52.38 ha which currently drains to three principle outlets:
Outlet 1 - The South Eastern principle subcatchment is 14.12ha in size and drains to existing box culvert located under Wallgrove Road eventually drains to Eastern Creek.
Outlet 2 – The North Eastern subcatchment which is 13.0ha in size, drains to north eastern corner of the site via an existing swale drain which then drains under the SCA pipeline.
Outlet 3 – The western subcatchments is the largest principle catchment area which is 26.0ha in size and drains directly to Reedy Creek.
There are two external upstream catchment areas draining through the site:
External SE - The South Eastern external catchment is 74.71ha in area, which drains through the south-eastern corner of the site which combines with the internal catchment areas of the site draining to Outlet 1.
External SW - The South Western external catchment is 5.6ha in area, which drains through the site along to southern boundary and eventually discharges to Reedy Creek at the south-western corner of the site.
Stormwater runoff for the existing and proposed catchment conditions was modelled using the XP-RAFTS (version SP1, 2009) hydrological package. The Sub-catchments for the model were delineated using CatchmentSIM GIS based program based on a combination of 5m DEM of Smoothed ALS data supplied by the NSW Department of Lands and land survey of the site. The existing internal and external catchment areas shown in Appendix A.
X12254.01B| Prepared for Gazcorp Pty Ltd Page | 5
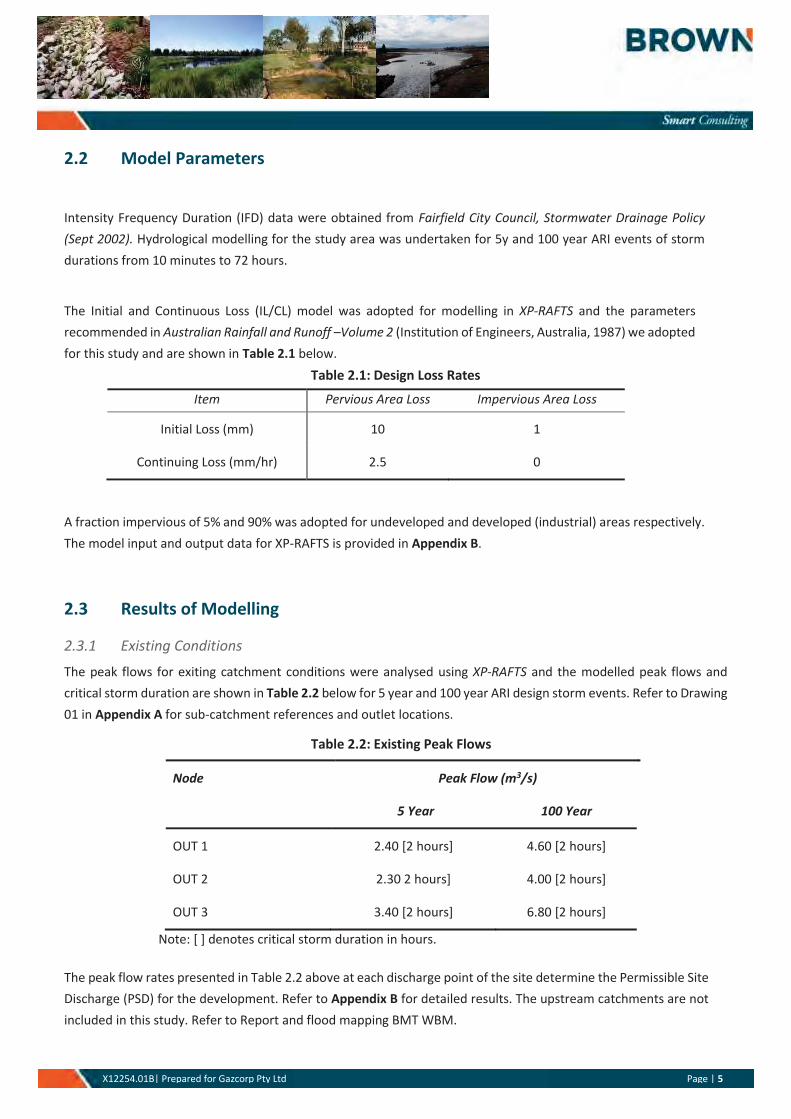
2.2 Model Parameters
Intensity Frequency Duration (IFD) data were obtained from Fairfield City Council, Stormwater Drainage Policy (Sept 2002). Hydrological modelling for the study area was undertaken for 5y and 100 year ARI events of storm durations from 10 minutes to 72 hours.
The Initial and Continuous Loss (IL/CL) model was adopted for modelling in XP-RAFTS and the parameters recommended in Australian Rainfall and Runoff –Volume 2 (Institution of Engineers, Australia, 1987) we adopted for this study and are shown in Table 2.1 below.
Table 2.1: Design Loss Rates
Item Pervious Area Loss Impervious Area Loss
Initial Loss (mm) 10 1
Continuing Loss (mm/hr) 2.5 0
A fraction impervious of 5% and 90% was adopted for undeveloped and developed (industrial) areas respectively. The model input and output data for XP-RAFTS is provided in Appendix B.
2.3 Results of Modelling
2.3.1 Existing Conditions The peak flows for exiting catchment conditions were analysed using XP-RAFTS and the modelled peak flows and critical storm duration are shown in Table 2.2 below for 5 year and 100 year ARI design storm events. Refer to Drawing 01 in Appendix A for sub-catchment references and outlet locations.
Table 2.2: Existing Peak Flows
Node Peak Flow (m3/s)
5 Year 100 Year
OUT 1 2.40 [2 hours] 4.60 [2 hours]
OUT 2 2.30 2 hours] 4.00 [2 hours]
OUT 3 3.40 [2 hours] 6.80 [2 hours]
Note: [ ] denotes critical storm duration in hours. The peak flow rates presented in Table 2.2 above at each discharge point of the site determine the Permissible Site Discharge (PSD) for the development. Refer to Appendix B for detailed results. The upstream catchments are not included in this study. Refer to Report and flood mapping BMT WBM.
X12254.01B| Prepared for Gazcorp Pty Ltd Page | 6
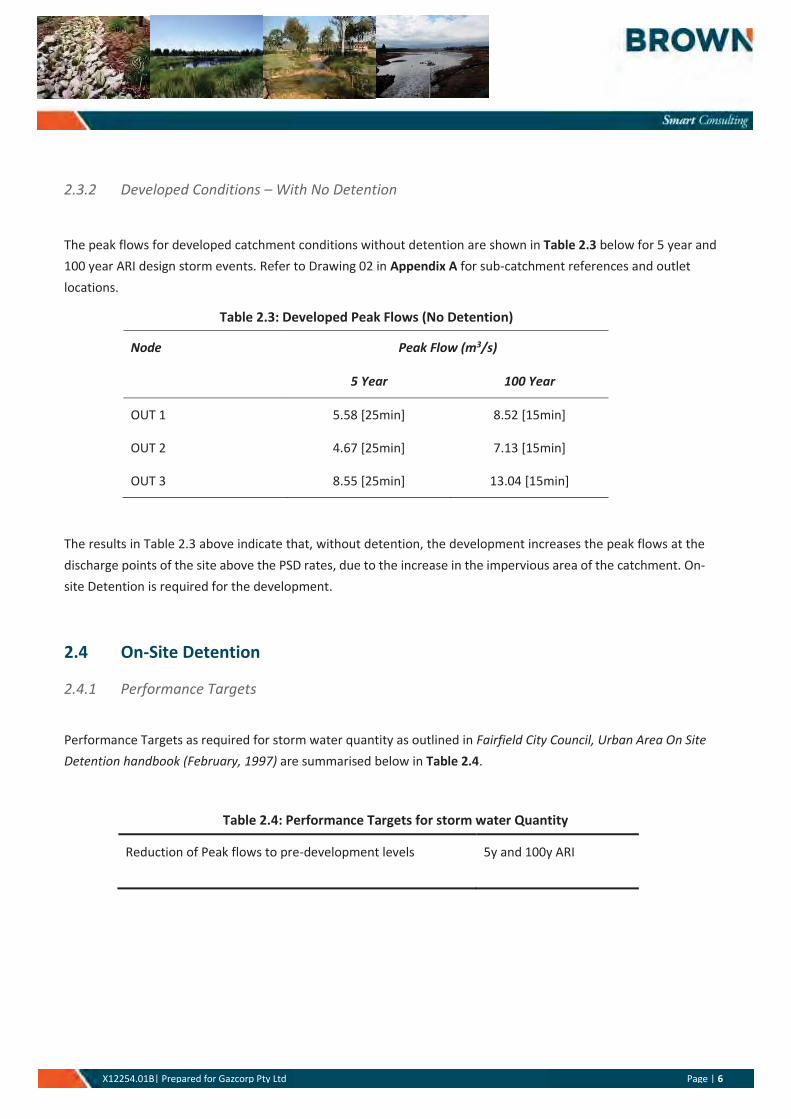
2.3.2 Developed Conditions – With No Detention
The peak flows for developed catchment conditions without detention are shown in Table 2.3 below for 5 year and 100 year ARI design storm events. Refer to Drawing 02 in Appendix A for sub-catchment references and outlet locations.
Table 2.3: Developed Peak Flows (No Detention)
Node Peak Flow (m3/s)
5 Year 100 Year
OUT 1 5.58 [25min] 8.52 [15min]
OUT 2 4.67 [25min] 7.13 [15min]
OUT 3 8.55 [25min] 13.04 [15min]
The results in Table 2.3 above indicate that, without detention, the development increases the peak flows at the discharge points of the site above the PSD rates, due to the increase in the impervious area of the catchment. On-site Detention is required for the development.
2.4 On-Site Detention
2.4.1 Performance Targets
Performance Targets as required for storm water quantity as outlined in Fairfield City Council, Urban Area On Site Detention handbook (February, 1997) are summarised below in Table 2.4.
Table 2.4: Performance Targets for storm water Quantity
Reduction of Peak flows to pre-development levels 5y and 100y ARI

X12254.01B| Prepared for Gazcorp Pty Ltd Page | 7
2.4.2 Detention Requirements
The overall stormwater quantity management strategy for the site is for each lot of the subdivision to provide an individual OSD system incorporated into their respective internal drainage systems. Each lot will have Site Storage Requirement (SSR) and Permissible Site Discharge (PSD) based on a lot area basis as summarised in Table 2.5.
Table 2.5: Summary of On-Site Detention Requirements
Attribute 5Y ARI 100Y ARI
PSD*, (m3/s/ha) 0.105 0.23
SSR*, (m3/ha) 220 315
Note: * PSD and SSR are to be provided at a rate of the total Lot Area.
The PSD and SSR for each lot has been determined to compensate for the road catchments and other bypass catchments such as external batters and landscaping areas which naturally bypasses detention. An allowance of up to 20% bypass has been factored into determining the PSD and SSR.
The actual arrangement of the detention tanks is subject to detailed design of each lot, however. For purposes of determining site SSR, a below ground detention tank with two stage outlet control structure was modelled for the OSD with no High Early Discharge (HED) included.
2.4.3 Results of Modelling with Detention
The peak flows, critical storm durations and storage requirement for developed catchment conditions with on-site detention is summarised in Table 2.6. Refer to Appendix B for detailed model output.
X12254.01B| Prepared for Gazcorp Pty Ltd Page | 8
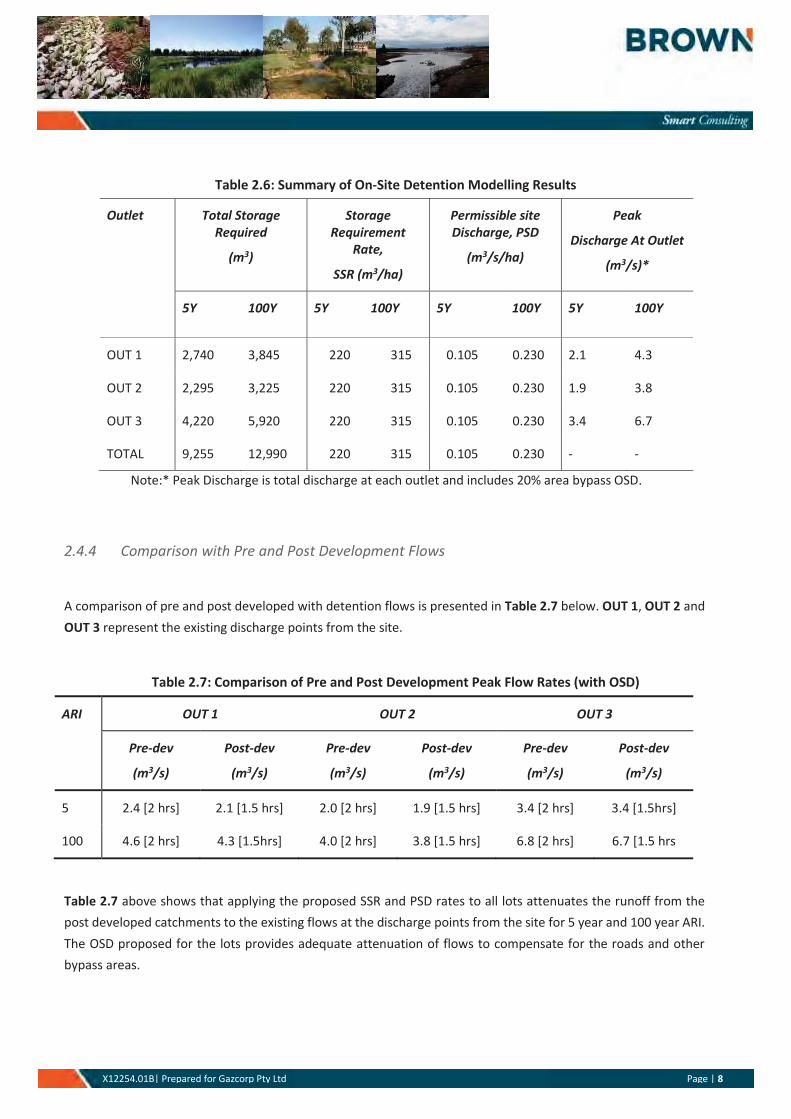
Table 2.6: Summary of On-Site Detention Modelling Results
Outlet Total Storage Required
(m3)
Storage Requirement
Rate,
SSR (m3/ha)
Permissible site Discharge, PSD
(m3/s/ha)
Peak
Discharge At Outlet
(m3/s)*
5Y 100Y 5Y 100Y 5Y 100Y 5Y 100Y
OUT 1 2,740 3,845 220 315 0.105 0.230 2.1 4.3
OUT 2 2,295 3,225 220 315 0.105 0.230 1.9 3.8
OUT 3 4,220 5,920 220 315 0.105 0.230 3.4 6.7
TOTAL 9,255 12,990 220 315 0.105 0.230 - -
Note:* Peak Discharge is total discharge at each outlet and includes 20% area bypass OSD.
2.4.4 Comparison with Pre and Post Development Flows
A comparison of pre and post developed with detention flows is presented in Table 2.7 below. OUT 1, OUT 2 and OUT 3 represent the existing discharge points from the site.
Table 2.7: Comparison of Pre and Post Development Peak Flow Rates (with OSD)
ARI OUT 1 OUT 2 OUT 3
Pre-dev
(m3/s)
Post-dev
(m3/s)
Pre-dev
(m3/s)
Post-dev
(m3/s)
Pre-dev
(m3/s)
Post-dev
(m3/s)
5 2.4 [2 hrs] 2.1 [1.5 hrs] 2.0 [2 hrs] 1.9 [1.5 hrs] 3.4 [2 hrs] 3.4 [1.5hrs]
100 4.6 [2 hrs] 4.3 [1.5hrs] 4.0 [2 hrs] 3.8 [1.5 hrs] 6.8 [2 hrs] 6.7 [1.5 hrs
Table 2.7 above shows that applying the proposed SSR and PSD rates to all lots attenuates the runoff from the post developed catchments to the existing flows at the discharge points from the site for 5 year and 100 year ARI. The OSD proposed for the lots provides adequate attenuation of flows to compensate for the roads and other bypass areas.

X12254.01B| Prepared for Gazcorp Pty Ltd Page | 9
3. MANAGEMENT OF MAJOR AND MINOR FLOWS
Runoff from lots is generally directed to the internal access road drainage system. Inter-allotment drainage is to be provided for lots draining away from the road. Stormwater is to be generally conveyed through a below ground stormwater drainage network contained within the internal access road reserves. Peak discharges from the site is not to exceed the existing pre-development flow rate from the site. Detention requirements are described in more detail in Section 2.
3.1 Minor Flow Management
Stormwater runoff from Lots will be directed to a trunk drainage system for minor storm events in a conventional pit and pipe system. Each lot is required to have its own on site detention and water quality treatment to manage water quantity and quality at the outlet.
3.2 Major Flow Management up to 100 year ARI
Flows in excess of the piped system capacity will be conveyed through the site to the nominated discharge pipes as overland flow along the internal access roads and temporary trunk drainage channels in place. The OSD system at each lot is designed in such a way to reduce post to pre developed peak flows for up to 100 year ARI and as such under normal operation of OSD systems, the major flows would be contained within the piped drainage system. Overland flow paths will be provided only as an emergency overflow provision for instances of blockage or OSD system failure.
The stormwater concept plan for the site is shown in Appendix A.

X12254.01B| Prepared for Gazcorp Pty Ltd Page | 10
3.3 Temporary Conveyance Structures
During the development of the proposed site, the road drainage system under the future RMS road reserve located at the northern boundary of the site will not be planned as constructed until after the full development of the site. The proposed lots 1 to 2 and lots 11 to 15 will have their own individual OSD systems and be connected into the future road drainage system. As a temporary interim measure, two swales (Swale No 2 and Swale No 3) are proposed to convey 100 year ARI peak flows in place of the road drainage system. The swales will be contained within the area of the site reserved for the future road and will be decommissioned upon construction of the road drainage system. Refer to Stormwater Concept Plan Drawing provided in Appendix A. The proposed dimensions and hydraulic calculations of the temporary swales are summarised below in Table 3.1.
Table 3.1: Summary of Temporary Swales
Swale
No
Depth
(m)
Base Width
(m)
Batter
(1:X)
Slope
(%)
Q
(m3/s)
Flow Depth
(m)
Freeboard
(mm)
Top Width
(m)
3 1.15 2.0 4.0 1.0 4.0 0.65 500 11
4 1.15 4.0 4.0 1.0 5.0 0.65 500 13

X12254.01B| Prepared for Gazcorp Pty Ltd Page | 11
3.4 Conveyance of External Catchments
The two external catchment areas draining through the site are to be conveyed via vegetated swales and have been designed to for storms up to 100 year ARI based on flow information supplied by BMT WBM. The dimensions of the proposed vegetated swales located at South East (Swale No.1) and West (Swale No. 4) of site are summarised in Table 3.2 below. Refer to Stormwater Concept Plan Drawing provided in Appendix A for locations of the respective swales.
Table 3.2: Dimensions of Swale for Upslope Diversion
Swale No.
Depth
(m)
Base Width
(m)
Batter
(1:X)
Slope
(%)
Top Width
(m)
1 1.5 3.0 4 0.5 20
2 0.8 2.0 4 2.0 8.5
The hydraulic modelling of the proposed swales draining the external catchment areas has been undertaken by BMT WBM. Refer to report and flood maps by BMT WBM.

X12254.01B| Prepared for Gazcorp Pty Ltd Page | 12
4. STORMWATER QUALITY TREATMENT
4.1 Performance Targets
The proposed treatment strategy for the site is such that the development site is capable of reducing export loads to the requirements of the Sydney Metropolitan Catchment Management Authority, Interim Reference Guideline for the South East Queensland Concept Design Guidelines for WSUD. These target reduction rates are as referred to in the Director General’s Environmental Assessment Requirements for the site and are provided in Table 4.1 below.
Table 4.1: Reduction Rate Targets for Water Quality Treatment.
Parameter Percentage Reduction (%)
Reduction in mean annual load of Total Gross Pollutant (GP) 90%
Reduction in mean annual load of Total Suspended Solids (TSS) 85%
Reduction in mean annual load of Total Phosphorous (TP) 65%
Reduction in mean annual load of Total Nitrogen (TN) 45%
4.2 Stormwater Treatment Strategy
The stormwater treatment strategy for the overall site is to provide the majority of treatment as on-site treatment measures to within individual lots through adopting Waters Sensitive Urban Design (WSUD) principles. The access road is to provide primary treatment with Gross Pollutant Traps (GPTs). The removal rates to be employed by WSUD within the individual lots are to provide compensatory removal of pollutants for the access road such that the overall treatment of the site meets the removal rate targets presented in Table 4.1.

X12254.01B| Prepared for Gazcorp Pty Ltd Page | 13
4.2.1 Onsite Treatment for Individual Lots
The stormwater treatment strategy for each individual lot is subject to the future development and building layout, however to compensate for the access road and bypass areas, the individual lots will need to achieve the following minimum reductions rate targets through WSUD:
• Gross Pollutants 92%
• Suspended Sediments 89%
• Total Phosphorous 69%
• Total Nitrogen 48%
4.2.2 Gross Pollutant Traps (GPT’s)
The proposed gross pollutant traps for the access road area will be placed in line of the trunk drainage system prior to discharge into specific outlet to remove litter, debris and sediment. While the pollutant capture efficiency of various traps may vary, as a conservative measure for modelling purposes, it is assumed that the GPT will be capable of removing of the following as per typical treatment performance provided in Sydney Catchment Authority, A guide to the Use of MUSIC in Sydney’s Drinking Water Catchment ():
• Gross Pollutants 90%
• Suspended Sediments 65%
• Total Phosphorous 15%
• Total Nitrogen 14%
The selection of the proprietary device is subject to detailed design, however the selection of the GPT will need to ensure the device is capable of removing the above reduction rate targets.

X12254.01B| Prepared for Gazcorp Pty Ltd Page | 14
4.3 Music Modelling
4.3.1 Modelling Parameters
The performance of the proposed water quality treatment strategy has been modelled using the MUSIC V5 water quality model. The parameters adopted for MUSIC modelling are provided in Appendix C.
4.3.2 Music Modelling Network
A generic node was modelled to represent the WSUD removal rates to be applied to individual lots. Catchment areas were separated according to surface types with pollutant generation parameters assigned according to surface type. The music modelling adopted for this strategy lumped catchment areas representing total lot roof area, car park and loading area, taking into consideration bypassing catchment areas and road area such that the assessment of reduction rate covers the overall site. The music modelling network is shown in Figure 4.1 below.
Figure 4.1: Music Model Network for Overall Site.

X12254.01B| Prepared for Gazcorp Pty Ltd Page | 15
4.3.3 Music Modelling Results
Table 4.2 shows the removal rates for the overall water quality treatment for the site. Refer to Appendix C for MUSIC model output.
Table 4.2: Results of MUSIC Modelling for Stormwater Treatment Strategy No 1 for Site
Parameter Proposed Removal
Targets for Road
Modelled Removal Rates
for Lots
Modelled Removal Rates for
Site
Required Removal rates*
TSS 65% 89% 86.6% 85%
TP 15% 69% 65.0% 65%
TN 14% 48% 45.0% 45%
Gross Pollutant
90% 92% 90.8% 90%
Note: * Performance targets as required in Interim Reference Guideline for the South East Queensland Concept Design Guidelines for WSUD
Table 4.2 shows the proposed removal rates for the future lots are capable of removing the pollutant loads below the required target removal rates for TSS, TP, TN and Gross Pollutants in Interim Reference Guideline for the South East Queensland Concept Design Guidelines for WSUD.

X12254.01B| Prepared for Gazcorp Pty Ltd Page | 16
5. STAGE 1 INTERIM WORKS
5.1 On-site Detention for Stage 1
Stage 1 of the development involves the construction of the central access road and the development of proposed Lot 10 only. OSD is to be provided for Lot 10 under the SSR and PSD requirements to be applied to all lots and temporary detention is to be provided for the access road until the future development of the overall site proceeds such that interim peak flows at each discharge point at Stage 1 does not exceed existing hydrological conditions. The tstorage requirement for temporary Basin Number 1 and Number 2 is 536 m3 and 817 m3 respectively, however once the remaining lots have been developed at a future stage, the OSD systems provided on all the lots will compensate for the impervious area of the access road as provided for under the ultimate strategy and the temporary basins can be decommissioned. The Stormwater Concept Plan for Stage 1 is provided in Appendix A.
The interim detention strategy for Stage 1 was modelled using XP-RAFTS. A comparison of pre and post developed flows with detention is presented in Table 5.1 below where, OUT 1, OUT 2 and OUT 3 represent the existing discharge points from the site. It should be noted that, an addition outlet identified as OUT 3a will be drain undeveloped catchments for the stage 1 interim strategy. Under the ultimate strategy, this drainage line will only drain external catchments through the site (Swale number 2) and all internal catchments will drain to OUT 3. Refer to Drawing No. 05 in Appendix A for outlet locations.
Table 5.1: Comparison of Pre and Post Development Peak Flow Rates (with OSD)
ARI OUT 1 OUT 2 OUT 3 OUT 3a
Pre-dev (m3/s)
Post-dev (m3/s)
Pre-dev (m3/s)
Post-dev (m3/s)
Pre-dev (m3/s)
Post-dev (m3/s)
Pre-dev (m3/s)
Post-dev (m3/s)
5 2.4
[2 hrs]
2.3
[2 hrs]
2.0
[2 hrs]
1.7
[2 hrs]
3.4
[2 hrs]
3.4
[2 hrs]
0.8
[2 hrs]
0.7
[2 hrs]
100 4.6
[2 hrs]
4.6
[2 hrs]
4.0
[2 hrs]
3.3
[2 hrs]
6.8
[2 hrs]
6.8
[2 hrs]
1.6
[2 hrs]
1.4
[2 hrs]
Table 5.1 shows that the interim detention strategy for the site is capable of attenuating peak flows discharging from the site to existing peak flows for 5 years to 100 year ARI.

X12254.01B| Prepared for Gazcorp Pty Ltd Page | 17
5.2 Stormwater Quality Treatment
The drainage strategy for Stage 1 incorporates temporary catch drains to separate runoff from undeveloped catchments from the stage 1 development footprint. It is proposed to provide a temporary 600 mm diameter pipe culvert under the access road which will drain the undeveloped catchments under the access road and around stormwater treatment basins.
The treatment strategy for Stage 1 is to be with a combination of internal treatment devices for lot 10 and temporary bio retention basins for the access road. Once the future lots have been developed at a future stage, the on lot treatment system provided on all the lots will compensate for the access road catchment and the temporary basins can be decommissioned.
The target removal rate for Lot 10 proposed to be achieved through a combination of bioretention in car park areas, Enviropods located within gully pits for Hardstand areas and finally whole site routing through in line GPTs with Stormfilter treatment system fitted to the OSD tanks. Refer to the Stormwater Concept Plan for Stage 1 provided in Appendix A. The internal drainage of Lot 10 is subject to detailed design however the sizing of the treatment systems used for MUSIC modelling to achieve the target removal rates for Stage 1 is provided in Appendix C.
X12254.01B| Prepared for Gazcorp Pty Ltd Page | 18
5.2.1 Music Modelling Network
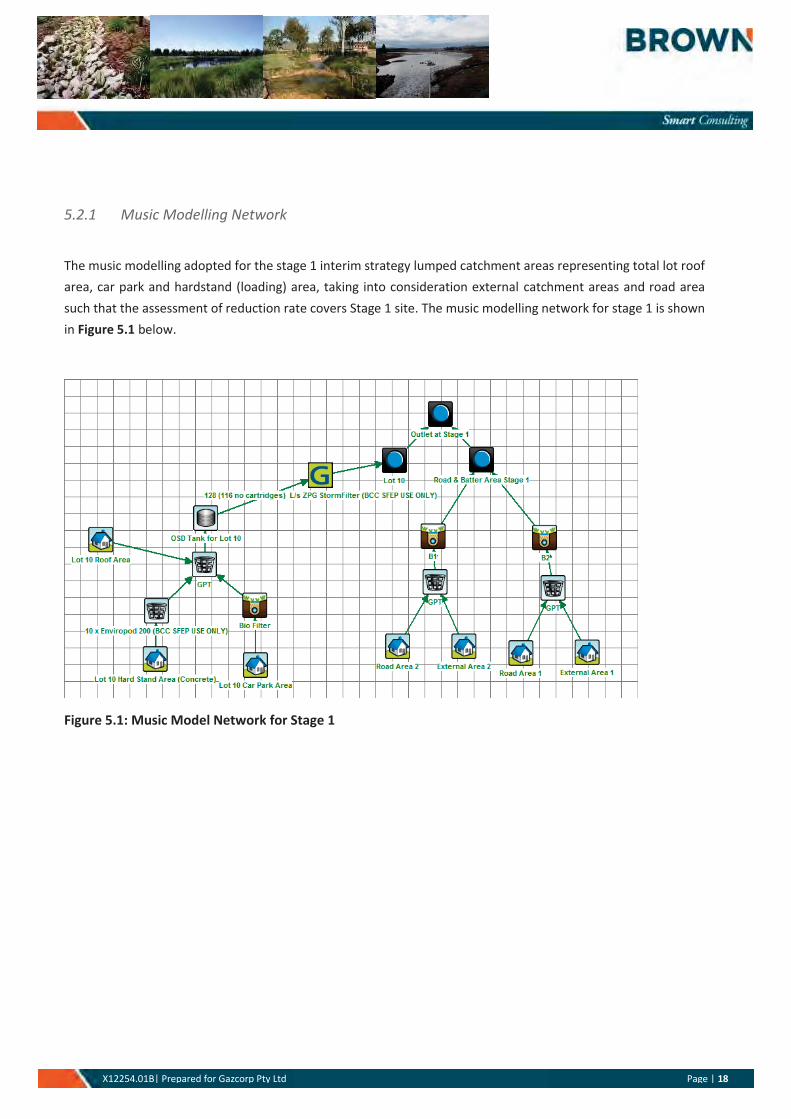
The music modelling adopted for the stage 1 interim strategy lumped catchment areas representing total lot roof area, car park and hardstand (loading) area, taking into consideration external catchment areas and road area such that the assessment of reduction rate covers Stage 1 site. The music modelling network for stage 1 is shown in Figure 5.1 below.
Figure 5.1: Music Model Network for Stage 1

X12254.01B| Prepared for Gazcorp Pty Ltd Page | 19
5.2.2 Music modelling Results
Table 5.2 shows the removal rates for the overall water quality treatment for the site. Refer to Appendix C for MUSIC model output.
Table 5.2: Results of MUSIC Modelling for Stormwater Treatment Strategy for Stage 1
Parameter Proposed Removal Targets for Lot 10
Modelled Removal Rate using Treatment Strategy for Lot 10
Modelled Overall Removal Rate for Road Area
Modelled Removal Rates for
Site
Required Removal rates*
TSS 89% 93% 88% 91.5% 85%
TP 69% 69% 58% 65.4% 65%
TN 48% 51% 45% 49.3% 45%
Gross Pollutant
92% 100% 100% 100.0% 90%
Note: * Performance targets as required in Interim Reference Guideline for the South East Queensland Concept Design Guidelines for WSUD
Table 5.2 shows that, the stormwater treatment strategy for Stage 1 is capable of removing the pollutant loads below the required target removal rates for TSS, TP, TN and Gross Pollutants in Interim Reference Guideline for the South East Queensland Concept Design Guidelines for WSUD.

X12254.01B| Prepared for Gazcorp Pty Ltd Page | 20
6. CONCLUSION
It is concluded that the proposed Stormwater Concept Plan for the site:
• Provides on-site detention (OSD) strategy capable of reducing developed peak flows to pre-developed flows from the site for 5 year to 100 year ARI design storm events for the ultimate developed site as well as the Interim Stage 1 to manage stormwater quantity discharging from the site.
• Provides stormwater treatment strategy which is capable of reducing pollutant loads of TSS, TP, TN and gross pollutants to the reduction targets outlined in the Sydney Metropolitan Catchment Management Authority, Interim Reference Guidelines for South East Queensland Concept Design Guidelines for WSUD.
7. REFERENCES
Fairfield City Council, Urban Area OnSite Detention handbook (February, 1997)
Fairfield Town Centre, Development Control Plan (November, 2010)
Fairfield City Council, Stormwater Drainage Policy (September, 2002)
Sydney Metropolitan Catchment Management Authority, Interim Reference Guideline for the South East Queensland Concept Design Guidelines for WSUD.
Sydney Metropolitan Catchment Management Authority, Draft NSW Music Modelling Guidelines (August 2010)
Sydney Catchment Authority, Draft a Guide to the Use of MUSIC in Sydney’s Drinking Water Catchments

X12254.01B| Prepared for Gazcorp Pty Ltd Page | 21
8. GLOSSARY OF TERMS Afflux The rise in water level upstream of a hydraulic structure such as a bridge or
culvert, caused by losses incurred from the hydraulic structure. Australian Height Datum National survey datum corresponding approximately to mean sea level. Annual Exceedance Probability The chance of a flood of a given size or larger occurring in any one year,
generally expressed as percentage probability. For example, a 100 year ARI flood is a 1% AEP flood. An important implication is that when a 1% AEP flood occurs, there is still a 1% probability that it could occur the following year.
Average Recurrence Interval Is the long term average number of years between the occurrence of a flood as big as, or larger than the selected flood event.
Catchment The catchment at a particular point is the area of land which drains to that point.
Design floor level The minimum (lowest) floor level specified for a building. Design flood A hypothetical flood representing a specific likelihood of occurrence (for
example the 100 year or 1% probability flood). The design flood may comprise two or more single source dominated floods.
Development Existing or proposed works which may or may not impact upon flooding. Typical works are filling of land, and the construction of roads, floodways and buildings.
Discharge The rate of flow of water measured in terms of volume over time. It is not the velocity of flow which is a measure of how fast the water is moving rather than how much is moving. Discharge and flow are interchangeable.
Digital Terrain Model A three-dimensional model of the ground surface that can be represented as a series of grids with each cell representing an elevation (DEM) or a series of interconnected triangles with elevations (TIN).
Effective warning time The available time that a community has from receiving a flood warning to when the flood reaches their location.
First Flush The initial surface runoff of a rainstorm. During this phase, water pollution in areas with high proportions of impervious surfaces is typically more concentrated compared to the remainder of the storm.
Flood Above average river or creek flows which overtop banks and inundate floodplains.
Flood awareness An appreciation of the likely threats and consequences of flooding and an understanding of any flood warning and evacuation procedures. Communities with a high degree of flood awareness respond to flood warnings promptly and efficiently, greatly reducing the potential for damage and loss of life and limb. Communities with a low degree of flood awareness may not fully appreciate the importance of flood warnings and flood preparedness and consequently suffer greater personal and economic losses.
Flood behaviour The pattern / characteristics / nature of a flood.

X12254.01B| Prepared for Gazcorp Pty Ltd Page | 22
Flooding The State Emergency Service uses the following definitions in flood warnings: Minor flooding: causes inconvenience such as closing of minor roads and the
submergence of low level bridges Moderate flooding: low-lying areas inundated requiring removal of stock
and/or evacuation of some houses. Main traffic bridges may be covered. Major flooding: extensive rural areas are flooded with properties, villages and
towns isolated and/or appreciable urban areas are flooded. Flood frequency analysis An analysis of historical flood records to determine estimates of design flood
flows. Flood fringe Land which may be affected by flooding but is not designated as a floodway
or flood storage. Flood hazard The potential threat to property or persons due to flooding. Flood level The height or elevation of flood waters relative to a datum (typically the
Australian Height Datum). Also referred to as “stage”. Flood liable land Land inundated up to the probable maximum flood – flood prone land. Floodplain Land adjacent to a river or creek which is inundated by floods up to the
probable maximum flood that is designated as flood prone land. Flood Planning Levels Are the combinations of flood levels and freeboards selected for planning
purposes to account for uncertainty in the estimate of the flood level. Flood proofing Measures taken to improve or modify the design, construction and alteration
of buildings to minimise or eliminate flood damages and threats to life and limb.
Floodplain Management The coordinated management of activities which occur on flood liable land. Floodplain Management Manual A document by the NSW Government (2001) that provides a guideline for the
management of flood liable land. This document describes the process of a floodplain risk management study.
Flood source The source of the flood waters. Floodplain Management A set of conditions and policies which define the benchmark from Standard which floodplain management options are compared and assessed. Flood standard The flood selected for planning and floodplain management activities. The
flood may be an historical or design flood. It should be based on an understanding of the flood behaviour and the associated flood hazard. It should also take into account social, economic and ecological considerations.
Flood storages Floodplain areas which are important for the temporary storage of flood waters during a flood.
Floodways Those areas of the floodplain where a significant discharge of flow occurs during floods. They are often aligned with naturally defined channels. Floodways are areas that, even if they are partially blocked, would cause significant redistribution of flood flows, or a significant increase in flood levels.

X12254.01B| Prepared for Gazcorp Pty Ltd Page | 23
Freeboard A factor of safety usually expressed as a height above the flood standard. Freeboard tends to compensate for the factors such as wave action, localised hydraulic effects and uncertainties in the design flood levels.
Geographical Information System A form of computer software developed for mapping applications and data storage. Useful for generating terrain models and processing data for input into flood estimation models.
High hazard Danger to life and limb; evacuation difficult; potential for structural damage, high social disruption and economic losses. High hazard areas are those areas subject to a combination of flood depth and flow velocity that are deemed to cause the above issues to persons or property.
Historical flood A flood which has actually occurred – Flood of Record. Hydraulic The term given to the study of water flow in rivers, estuaries with coastal
systems. Hydrograph A graph showing how a river or creek’s discharge changes with time. Hydrology The term given to the study of the rain-runoff process in catchments. Low hazard Flood depths and velocities are sufficiently low that people and their
possessions can be evacuated. Map Grid Australia A national coordinate system used for the mapping of features on a
representation of the earths surface. Based on the geographic coordinate system ‘Geodetic Datum of Australia 1994’.
Peak flood level, flow or The maximum flood level, flow or velocity occurring during a flood velocity event. Probable Maximum Flood An extreme flood deemed to be the maximum flood likely to occur at a
particular location. Probable Maximum Precipitation The greatest depth of rainfall for a given duration meteorologically possible
over a particular location. Used to estimate the probable maximum flood. Probability A statistical measure of the likely frequency or occurrence of flooding. Riparian Zone Areas that are located adjacent to watercourses. Their definition is vague
and can be characterised by landform, vegetation, legislation or their function.
Runoff The amount of rainfall from a catchment which actually ends up as flowing water in the river of creek.
Stage Equivalent to water level above a specific datum- see flood level. Triangular Irregular Network A mass of interconnected triangles used to model three-dimensional surfaces
such as the ground (see DTM) and the surface of a flood. Velocity The speed at which the flood waters are moving. Typically, modelled
velocities in a river or creek are quoted as the depth and width averaged velocity, i.e. the average velocity across the whole river or creek section.

Appendices

X12254.01B|Prepared for Gazcorp Pty Ltd Commercial in Confidence
Appendix A Drawings
Appendix B XP-RAFTS Modelling Results
Appendix C Music Modelling Results

X12254.01B|Prepared for Gazcorp Pty Ltd Commercial in Confidence
APPENDIX A
Drawings