Embed Size (px)
Citation preview

Department of Transport and Main Roads Cost-Benefit Analysis of Open Level Crossing Elimination Final Report 11 July 2012
135-05823 Release docs.pdf - Page Number: 1 of 85
Relea
sed
unde
r RTI
- DTM
R
Deloitte refers to one or more of Deloitte Touche Tohmatsu Limited, a UK private company limited by guarantee, and its network of member firms, each of which is a legally separate and independent entity. Please see www.deloitte.com/au/about for a detailed description of the legal structure of Deloitte Touche Tohmatsu Limited and its member firms.
© 2012 Deloitte Access Economics Pty Ltd
Contents
1 Introduction 1
1.1 Background 1
1.2 Structure of report 2
1.3 Restriction on report use 3
2 Site Analysis 4
2.1 Barrs Road, Glasshouse Mountains 4
2.2 Beams Road, Aspley 5
2.3 Beenleigh Road, Kuraby 6
2.4 Boundary Road, Coopers Plains 7
2.5 Bray Road, Mooloolah 8
2.6 Caloundra St, Landsborough 9
2.7 Cavendish Road, Coorparoo 10
2.8 Dawson Parade, Keperra 11
2.9 Gympie Street North, Landsborough 12
2.10 Lindum Road, Lindum 13
2.11 McKean Street, Caboolture 14
2.12 Nathan Road, Runcorn 15
2.13 Old Beaudesert Road, Salisbury 16
2.14 Pumicestone Road, Caboolture 17
2.15 Queensport Road, Murrarie 18
2.16 Robinson Road, Geebung 19
2.17 South Pine Road, Alderley 20
2.18 Stones Road, Sunnybank 21
2.19 Telegraph Road, Bald Hills 22
2.20 Wacol Station Road, Wacol 23
2.21 Warrigal Road, Runcorn 24
3 Methodology 25
3.1 Cost benefit analysis 25
3.2 Steps in Cost-Benefit Analysis 26
3.3 Inflation and discounting 26
3.4 Decision criteria 27
135-05823 Release docs.pdf - Page Number: 2 of 85
Relea
sed
unde
r RTI
- DTM
R

Deloitte refers to one or more of Deloitte Touche Tohmatsu Limited, a UK private company limited by guarantee, and its network of member firms, each of which is a legally separate and independent entity. Please see www.deloitte.com/au/about for a detailed description of the legal structure of Deloitte Touche Tohmatsu Limited and its member firms.
© 2012 Deloitte Access Economics Pty Ltd
3.5 Key methodological issues 27
3.6 Base Case 28
3.7 Project Case 28
3.8 Multi-criteria Analysis 29
4 Traffic modelling 30
5 Project costs 32
5.1 Capital costs 32
5.2 Maintenance Costs 35
5.3 Boom Gate Costs 36
6 Project benefits 37
6.1 Accidents 37
6.2 Road User Benefits – Travel Time 42
6.3 Road User Benefits – Vehicle Operating Costs 44
6.4 Rail User Benefits 45
7 Results 47
7.1 Cost-Benefit Analysis 47
7.2 Sensitivity Testing 49
7.3 Multi-criteria Analysis 52
8 Recommendations 54
8.1 Conclusions 54
9 Reference List 56
Appendix A Urban VOC Model 58
Appendix B Traffic modelling assumptions 59
Appendix C Disaggregated CBA Results 65
135-05823 Release docs.pdf - Page Number: 3 of 85
Relea
sed
unde
r RTI
- DTM
R

Executive Summary
Deloitte Access Economics: Cost-Benefit Analysis of Open Level Crossing Elimination
i
Executive Summary
Introduction
Deloitte Access Economics (Deloitte) has been engaged by the Department of Transport and Main Roads (TMR) to undertake a cost-benefit analysis of open level crossing elimination across a sample of 21 level crossing sites in South East Queensland.
The aim of the study is to determine the competing priority of the 21 sites as well as the economic benefits that result from eliminating level crossings. The study aims to provide TMR and other interested stakeholders such as Queensland Rail (QR) with information that will help guide future decisions to develop business cases to eliminate individual level crossings.
Background
Open level crossings (OLCs) continue to pose a risk for road users. While accidents at open level crossings contribute only a very small proportion of total road accidents within South East Queensland, level crossing accidents tend to be associated with more fatalities and serious injuries on average than road accidents. There is a significant social cost associated with the deaths and serious injuries arising from these accidents.
Level crossings also significantly interrupt traffic flows along key arterial roads, particularly during peak periods when both road and rail traffic levels are at their highest.
The benefits arising from elimination of OLCs are ultimately borne by all members of society:
Rail operators – reduced costs from maintenance savings and the costs associated with accidents.
Rail users – improved and more reliable travel times with fewer delays (accidents and incidents).
Road users – reduced delays and congestion (improved travel times; lower vehicle operating costs) and accidents.
Road users/pedestrians – improved safety and access.
For these reasons, the Department of Transport and Main Roads continues to operate a program of level crossing elimination as part of the Queensland Level Crossing Safety Strategy 2010-2014.
Open Level Crossing Sites
The sites selected by TMR are shown in the table below. This includes sites that were also part of a similar study undertaken by Sinclair Knight Merz (SKM) in 2006.
135-05823 Release docs.pdf - Page Number: 4 of 85
Relea
sed
unde
r RTI
- DTM
R

Executive Summary
Deloitte Access Economics: Cost-Benefit Analysis of Open Level Crossing Elimination
ii
Table 1: Open Level Crossing Sites
Open Level Crossing Sites
Barrs Road, Glass House Mountains Nathan Road, Runcorn
Beams Road, Aspley Old Beaudesert Road, Salisbury
Beenleigh Road, Kuraby Pumicestone Road, Caboolture
Boundary Road, Coopers Plains Queensport Road, Murrarie
Bray Road, Mooloolah Robinson Road, Geebung
Caloundra St, Landsborough South Pine Road, Alderley
Cavendish Road, Coorparoo Stones Road, Sunnybank
Dawson Parade, Keperra Telegraph Road, Bald Hills
Gympie Street North, Landsborough Wacol Station Road, Wacol
Lindum Road, Lindum Warrigal Road, Runcorn
McKean Street, Caboolture
Source: provided by TMR
Cost-Benefit Analysis
A cost benefit analysis of each site was conducted in order to the rank the 21 OLC sites and prioritise those which warranted further investigation.
In order to value the economic worth of grade separation at each site, the following tasks were undertaken:
estimation of capital costs at each site based upon engineering concept designs
calculation of train movements, boom gate closures and passenger loads
vehicle traffic surveys at each site
examination of vehicle queuing and delay patterns
analysis of the frequency and type of vehicle accidents at each intersection.
The impacts quantified as part of the cost benefit analysis are shown in the table below.
Table 2: Costs and Benefits
Costs Benefits
Capital construction costs Travel Time costs
Maintenance Costs (of grade separated structure) Vehicle Operating Costs
Boom Gate operating costs Accident Costs
Boom Gate reinstatement costs Rail User Delay Costs
Source: Deloitte
135-05823 Release docs.pdf - Page Number: 5 of 85
Relea
sed
unde
r RTI
- DTM
R

Executive Summary
Deloitte Access Economics: Cost-Benefit Analysis of Open Level Crossing Elimination
iii
As part of the cost-benefit analysis, these effects are forecasted and then discounted over a 30 year period at a 6% discount rate to determine the benefit cost ratio (BCR) at each site. The cost-benefit analysis results are presented in the table below.
Table 3: Cost Benefit Analysis Results – 6% Discount Rate ($2011)
Site Total Costs ($m) Total Benefits ($m) BCR
Barrs Road, Glass House Mountains 48.68 13.85 0.28
Beams Road, Aspley 44.05 158.99 3.61
Beenleigh Road, Kuraby 83.40 16.80 0.20
Boundary Road, Coopers Plains 88.03 89.43 1.02
Bray Road, Mooloolah 64.88 9.41 0.15
Caloundra St, Landsborough 27.85 11.60 0.42
Cavendish Road, Coorparoo 108.87 81.31 0.75
Dawson Pde, Keperra 90.35 23.54 0.26
Gympie Street North, Landsborough 27.85 3.82 0.14
Lindum Road, Lindum 88.03 21.19 0.24
McKean Street, Caboolture 64.88 17.86 0.28
Nathan Road, Runcorn 90.35 23.54 0.26
Old Beaudesert Road, Salisbury 76.40 12.03 0.16
Pumicestone Road, Caboolture 71.83 20.57 0.29
Queensport Road, Murrarie 76.40 13.47 0.18
Robinson Road, Geebung 173.32 15.97 0.09
South Pine Road, Alderley 85.72 10.58 0.12
Stones Road, Sunnybank 76.40 6.88 0.09
Telegraph Road, Bald Hills 68.85 41.48 0.60
Wacol Station Road, Wacol 57.94 73.27 1.26
Warrigal Road, Runcorn 90.35 9.67 0.11
Source: Deloitte
Multi-criteria Analysis
To further determine the competing priorities of the OLC sites, a multi-criteria analysis (MCA) was applied. This allows a further qualitative assessment to be made as to the significance of different inputs and allows an additional value to be placed upon issues such as safety and demand. The following criteria were applied and a priority ranking given based on quartile values:
135-05823 Release docs.pdf - Page Number: 6 of 85
Relea
sed
unde
r RTI
- DTM
R

Executive Summary
Deloitte Access Economics: Cost-Benefit Analysis of Open Level Crossing Elimination
iv
Economic justification based upon a Benefit Cost Ratio which indicates whether the benefit streams are greater than the costs involved, and that a grade separation is an efficient allocation of resources.
Safety based not only upon the number of incidents at an OLC site, but also the severity of incidents (avoided accident savings). A major driver of the OLC elimination program is the danger that level crossing sites pose to society. Even if the pure economic justification for the project is marginal, there may well be a rationale for grade separation based upon community service obligation motivations of TMR.
Traffic volumes (AADT) which indicate the relative activity (demand) at the site, which shows the number of people potentially affected by the level crossing.
A relative ranking for each site was developed after awarding scores for each of the above criteria.
Conclusions
Twenty one open level crossing sites have been examined as part of this analysis in order to determine the priority and justification for their elimination. Traffic surveying was conducted at each site to observe accurate, site specific traffic flows, and boom closures. Traffic modelling, using an excel approach and a more complex Paramics model was also conducted by sub-consultants SMEC Pty Ltd (SMEC).
This work developed key inputs for use in the economic cost benefit analysis of the sites. The total cost and benefits streams over a 30 year evaluation period were calculated in order to determine the economic worth of each proposed grade separation. Finally, a multi-criteria approach was adopted to rank the sites as high, medium or low priority (see Table 4 and Table 5 overleaf).
Table 4: Relative Priority of OLC sites
Site Priority
Site Priority
Beams Road, Aspley HIGH
Nathan Road, Runcorn MEDIUM
Cavendish Road, Coorparoo HIGH
Bray Road, Mooloolah LOW
Telegraph Road, Bald Hills HIGH
Lindum Road, Lindum LOW
Wacol Station Road, Wacol HIGH
Old Beaudesert Road, Salisbury LOW
Boundary Road, Coopers Plains HIGH
Queensport Road, Murrarie LOW
South Pine Road, Alderley HIGH
Robinson Road, Geebung LOW
Pumicestone Road, Caboolture MEDIUM
Stones Road, Sunnybank LOW
Beenleigh Road, Kuraby MEDIUM
Warrigal Road, Runcorn LOW
Caloundra St, Landsborough MEDIUM
Barrs Road, Glass House Mountains LOW
Dawson Pde, Keperra MEDIUM
Gympie Street North, Landsborough LOW
McKean Street, Caboolture MEDIUM
Source: Deloitte (Note: priority of sites is relative to the sample of sites only).
135-05823 Release docs.pdf - Page Number: 7 of 85
Relea
sed
unde
r RTI
- DTM
R

Executive Summary
Deloitte Access Economics: Cost-Benefit Analysis of Open Level Crossing Elimination
v
It is suggested that those sites awarded a high priority be subject to further investigation such as detailed business case and comprehensive engineering estimates of likely construction costs.
The sites that are evaluated as high priority include:
Beams Road, Aspley
Boundary Road, Coopers Plains
Telegraph Road, Bald Hills
Cavendish Road, Coorparoo
South Pine Road, Alderley
Wacol Station Road, Wacol
These candidate projects are more likely to yield better cost-benefit analysis results at the business case stage, based on the assumptions adopted in this report, relative to the other sites considered in this study.
Limitation of study
This study has been undertaken in accordance with the rapid appraisal stage of the Australian Transport Council “National Guidelines for Transport System Management in Australia” (2006). Therefore, the intention of the study is to provide an initial indicative prioritisation, in relative terms, of the sample sites. The findings of this report should not be used in the business case development for any of the sample sites.
135-05823 Release docs.pdf - Page Number: 8 of 85
Relea
sed
unde
r RTI
- DTM
R

Executive Summary
Deloitte Access Economics: Cost-Benefit Analysis of Open Level Crossing Elimination
vi
Table 5: Multi-criteria Analysis and Relative Priority Ranking of Sites
Site BCR AADT Accident
Savings ($) Economic Traffic Safety Priority
Barrs Road, Glass House Mountains 0.28 6,590 28,301 Medium Low Low LOW
Beams Road, Aspley 3.61 27,115 185,454 Very High High Very High HIGH
Beenleigh Road, Kuraby 0.20 14,415 74,825 Medium Medium Medium MEDIUM
Boundary Road, Coopers Plains 1.02 24,885 171,464 High Medium High HIGH
Bray Road, Mooloolah 0.14 9,870 35,701 Medium Low Medium LOW
Caloundra St, Landsborough 0.42 20,325 54,084 High Medium Low MEDIUM
Cavendish Road, Coorparoo 0.75 30,180 156,150 High High High HIGH
Dawson Pde, Keperra 0.26 21,295 73,637 Medium Medium Medium MEDIUM
Gympie Street North, Landsborough 0.14 3,690 20,276 Medium Low Low LOW
Lindum Road, Lindum 0.24 16,370 49,703 Medium Medium Low LOW
McKean Street, Caboolture 0.28 22,150 61,005 Medium Medium Medium MEDIUM
Nathan Road, Runcorn 0.26 15,585 82,429 Medium Medium Medium MEDIUM
Old Beaudesert Road, Salisbury 0.16 8,045 64,726 Medium Low Medium LOW
Pumicestone Road, Caboolture 0.29 28,250 65,442 Medium High Medium MEDIUM
Queensport Road, Murrarie 0.18 10,085 73,670 Medium Low Medium LOW
Robinson Road, Geebung 0.09 15,490 82,945 Low Medium Medium LOW
South Pine Road, Alderley 0.12 39,595 128,088 Low Very High High HIGH
Stones Road, Sunnybank 0.09 14,840 91,731 Low Medium Medium MEDIUM
Telegraph Road, Bald Hills 0.60 27,020 176,133 High High High HIGH
Wacol Station Road, Wacol 1.26 24,995 113,062 High High High HIGH
Warrigal Road, Runcorn 0.11 19,135 90,435 Low Medium Medium LOW
Key: Highest value
Third quartile
Note: scoring is relative to the sample sites
135-05823 Release docs.pdf - Page Number: 9 of 85
Released under RTI -
DTMR

Introduction
Deloitte Access Economics: Cost-Benefit Analysis of Open Level Crossing Elimination 1
1 Introduction
1.1 Background Deloitte Access Economics (Deloitte) has been engaged by the Department of Transport and Main Roads (TMR) to undertake a cost-benefit analysis study of open level crossing elimination at a sample of 21 sites in South East Queensland (SEQ).
Open level crossings continue to pose a risk for road users as well as significantly interrupt traffic flows along key arterial roads, particularly during peak periods when both road and rail traffic levels are at their highest. For these reasons, the Department continues to operate a program of level crossing elimination as part of the Queensland Level Crossing Safety Strategy 2010-2014.
A cost benefit analysis of each site was conducted in order the rank the 21 OLC sites (listed below) and prioritise those which warrant further investigation.
The following tasks were undertaken to prepare the cost-benefit analysis:
development of capital costs at each site based upon previous engineering concept designs
calculation of train movements, boom gate closures and passenger loads
vehicle traffic surveys at each site
examination of vehicle queuing and delay patterns using microsimultation traffic modelling
analysis of the frequency and type of vehicle accidents at each intersection.
The open level crossing sites that form part of this study are shown in the table below. These sites were selected by TMR and include sites that were also part of a similar study undertaken by Sinclair Knight Merz (SKM) in 2006.
Table 6: Open Level Crossing Sites
Open Level Crossing Sites
Barrs Road, Glass House Mountains Nathan Road, Runcorn
Beams Road, Aspley Old Beaudesert Road, Salisbury
Beenleigh Road, Kuraby Pumicestone Road, Caboolture
Boundary Road, Coopers Plains Queensport Road, Murrarie
Bray Road, Mooloolah Robinson Road, Geebung
Caloundra St, Landsborough South Pine Road, Alderley
Cavendish Road, Coorparoo Stones Road, Sunnybank
Dawson Parade, Keperra Telegraph Road, Bald Hills
135-05823 Release docs.pdf - Page Number: 10 of 85
Relea
sed
unde
r RTI
- DTM
R

Introduction
Deloitte Access Economics: Cost-Benefit Analysis of Open Level Crossing Elimination 2
Open Level Crossing Sites
Gympie Street North, Landsborough Wacol Station Road, Wacol
Lindum Road, Lindum Warrigal Road, Runcorn
McKean Street, Caboolture
Source: TMR
1.1.1 Previous studies
This report draws upon the work previously undertaken to investigate the need and priority for open level crossing elimination in SEQ. These studies include:
Assessment of the Justification of Open Level Crossing Elimination, Phase 1: OLC Elimination in the CityTrain Network, SKM Economics (1998).
Open Level Crossing Elimination Report, SKM (2006).
This report seeks to update and extend upon these previous reports.
The above documents were reviewed by Deloitte in the formulation of the methodology for the cost-benefit analysis. These documents also provide a useful reference point to compare how the ranking and priority of each site may have changed over time.
1.1.2 Definition
An open level crossing (OLC) is an intersection where a road and a railway meet at substantially the same level. All the OLCs examined in this study are active level crossings and as such, are signalised and have boom gates which operate automatically when a train approaches.
1.2 Structure of report The remainder of the report is set out as follows:
Section 2 provides a description of the OLC sites
Section 3 outlines our approach and methodology to the cost-benefit analysis
Section 4 provides the key outputs from the traffic modelling exercise
Section 5 provides the cost estimates for each OLC site
Section 6 discusses the expected benefits of OLC elimination
Section 7 summarises the results of the cost-benefit analysis
Section 8 provides recommendations for further investigations
Section 9 lists the references used for the purpose of compiling this report.
135-05823 Release docs.pdf - Page Number: 11 of 85
Relea
sed
unde
r RTI
- DTM
R

Introduction
Deloitte Access Economics: Cost-Benefit Analysis of Open Level Crossing Elimination 3
1.3 Restriction on report use
Limitation of our work
This report is prepared solely for the internal use of the Department of Transport and Main Roads. This report is not intended to and should not be used or relied upon by anyone else and we accept no duty of care to any other person or entity. The report has been prepared for the purpose set out in our proposal dated 10 October 2011. You should not refer to or use our name or the advice for any other purpose.
This study has been undertaken in accordance with the rapid appraisal stage of the Australian Transport Council “National Guidelines for Transport System Management in Australia” (2006). Therefore, the intention of the study is to provide an initial indicative prioritisation, in relative terms, of the sample sites. As such, the findings of this report should not be used in the business case development for any of the sample sites.
In considering the extent to which the findings of this report can be used, the limitations of the report need to be understood.
The traffic modelling and data used in this study has captured impacts from roads that directly intersect the crossings. No considerations to planned (and/or committed) major arterial or arterial link road projects were captured. The intention of the study was to assess the efficiencies gained by the transport network in its current form. All proposed road upgrades within SEQ would need to be modelled to retain any accuracy around the current report’s ranking of the sites.
135-05823 Release docs.pdf - Page Number: 12 of 85
Relea
sed
unde
r RTI
- DTM
R

Site Analysis
Deloitte Access Economics: Cost-Benefit Analysis of Open Level Crossing Elimination 4
2 Site Analysis An overview of each open level crossing site, detailing its location, proximity to major arterial roads, traffic conditions and property access is provided. Details of any relevant design options are also provided. Locality maps of each site have been obtained from google maps to display the configuration of each site.
2.1 Barrs Road, Glasshouse Mountains
The Barrs Road open level crossing is located within Sunshine Coast Regional Council, about 60km north of Brisbane. Barrs Road provides access to a few residential allotments and the Glasshouse Mountains Recreational Park. Vehicle traffic movements are relatively low with increased volumes typically only displayed on weekends, when train volumes are lower. Train movements and passenger loads through this site are also small. This relative lack of activity may be a factor in the low incident rates at this site – Barrs Road has the lowest number of recorded incidents amongst all OLCs examined as part of this analysis.
Table 7: Site Specific Statistics – Barrs Road
Site Barrs Road Average across all OLC
sample sites
Accidents (2004-2011) 0 0.19
Incidents (2004-2011) 11 64
Trains per day (2011) 53 129
Peak passenger load factor (average per train) 86 256
Vehicles per day (2011) 6,590 19,044
Source: provided by TMR, vehicles per day based on traffic count survey from SMEC
135-05823 Release docs.pdf - Page Number: 13 of 85
Relea
sed
unde
r RTI
- DTM
R

Site Analysis
Deloitte Access Economics: Cost-Benefit Analysis of Open Level Crossing Elimination 5
2.2 Beams Road, Aspley
The Beams Road intersection is on Brisbane’s north, approximately 13km from the Brisbane General Post Office (GPO). It is on the Caboolture rail line and close to Queensland University of Technology’s Carseldine Campus (which is no longer functional) and the Carseldine station. There are many train movements per day and vehicular traffic around the site is also significant. It is expected that minor land resumptions may be required to accommodate a grade separation at this site. While incident levels at this site are low, there have been 18 recorded near misses since 2004.
Table 8: Site Specific Statistics – Beams Road
Site Beams Road Average across all OLC
sample sites
Accidents (2004-2011) 0 0.19
Incidents (2004-2011) 42 64
Trains per day (2011) 185 129
Peak passenger load factor (average per train) 386 256
Vehicles per day (2011) 27,115 19,044
Source: provided by TMR, vehicles per day based on traffic count survey from SMEC
135-05823 Release docs.pdf - Page Number: 14 of 85
Relea
sed
unde
r RTI
- DTM
R

Site Analysis
Deloitte Access Economics: Cost-Benefit Analysis of Open Level Crossing Elimination 6
2.3 Beenleigh Road, Kuraby
The Beenleigh Road intersection is approximately 16km south of the Brisbane GPO. It is close to Beenleigh station and access road links to a primary school and residential allotments. It is also approximately 1.5km south of the Warrigal Road level crossing, on the Beenleigh line. Over the examined period, there have been approximately 80 incidents at this site, with 19 recorded near misses and 20 collisions with the boom gates.
Table 9: Site Specific Statistics – Beenleigh Road
Site Beenleigh Road Average across all OLC
sample sites
Accidents (2004-2011) 0 0.19
Incidents (2004-2011) 82 64
Trains per day (2011) 163 129
Peak passenger load factor (average per train) 308 256
Vehicles per day (2011) 14,415 19,044
Source: provided by TMR, vehicles per day based on traffic count survey from SMEC
135-05823 Release docs.pdf - Page Number: 15 of 85
Relea
sed
unde
r RTI
- DTM
R

Site Analysis
Deloitte Access Economics: Cost-Benefit Analysis of Open Level Crossing Elimination 7
2.4 Boundary Road, Coopers Plains
The Boundary Road OLC is approximately 11km south of the Brisbane GPO. The site is also on the Beenleigh rail line which has a large number of train movements due to its connection to the busy Gold Coast line. Vehicle traffic flows are also significant at this location with almost 25 000 vehicles using the surrounding roads. The site is controlled by traffic lights on either side of the OLC site, which are linked to the operation of the boom gates. There is a mixture of land uses surrounding the level crossing, including industrial, retail and residential. Some property resumption may be required as part of any grade separation at this site. From a safety perspective, the number of incidents at this site is also significant. With over 101 reported incidents since 2004, this OLC site is one of the most dangerous in this evaluation.
Table 10: Site Specific Statistics – Boundary Road
Site Boundary Road Average across all OLC
sample sites
Accidents (2004-2011) 0 0.19
Incidents (2004-2011) 101 64
Trains per day (2011) 176 129
Peak passenger load factor (average per train) 405 256
Vehicles per day (2011) 24,885 19,044
Source: provided by TMR, vehicles per day based on traffic count survey from SMEC
135-05823 Release docs.pdf - Page Number: 16 of 85
Relea
sed
unde
r RTI
- DTM
R

Site Analysis
Deloitte Access Economics: Cost-Benefit Analysis of Open Level Crossing Elimination 8
2.5 Bray Road, Mooloolah
The Bray Road intersection is almost 80km north of Brisbane in the town of Mooloolah within the Sunshine Coast Regional Council. It is an intersection of Bray Road, and the Mooloolah Connection Road, with the busy Sunshine Coast line which provides connections to Gympie and Nambour. The OLC is close to both the station and the commercial centre of the town, and any grade separation will likely necessitate some land resumptions. Passenger loads and vehicle flows at the site are amongst some of the lowest in this evaluation.
Table 11: Site Specific Statistics – Bray Road
Site Bray Road Average across all OLC
sample sites
Accidents (2004-2011) 0 0.19
Incidents (2004-2011) 22 64
Trains per day (2011) 53 129
Peak passenger load factor (average per train) 27 256
Vehicles per day (2011) 9,870 19,044
Source: provided by TMR, vehicles per day based on traffic count survey from SMEC
135-05823 Release docs.pdf - Page Number: 17 of 85
Relea
sed
unde
r RTI
- DTM
R

Site Analysis
Deloitte Access Economics: Cost-Benefit Analysis of Open Level Crossing Elimination 9
2.6 Caloundra St, Landsborough
The Caloundra Street OLC is 73km north of Brisbane and also on the busy Sunshine Coast rail line. The OLC is close to both Caloundra station and Landsborough Primary School. While daily train movements are relatively small (53 trains a day), vehicular (and to a lesser extent, pedestrian) movements are significant in the peak. Daily traffic flows through the site (which are in excess of 20 000) are also significant, given that the site is located outside Brisbane. The proposed solution for this site is to combine the elimination of the OLC at Gympie St North, Landsborough which is less than 1km north of this site. There have been 39 incidents since 2004 at this site which, while quite low compared to other investigated OLCs sites, is not insignificant.
Table 12: Site Specific Statistics – Caloundra Street
Site Caloundra St Average across all OLC
sample sites
Accidents (2004-2011) 0 0.19
Incidents (2004-2011) 39 64
Trains per day (2011) 53 129
Peak passenger load factor (average per train) 68 256
Vehicles per day (2011) 20,325 19,044
Source: provided by TMR, vehicles per day based on traffic count survey from SMEC
135-05823 Release docs.pdf - Page Number: 18 of 85
Relea
sed
unde
r RTI
- DTM
R

Site Analysis
Deloitte Access Economics: Cost-Benefit Analysis of Open Level Crossing Elimination 10
2.7 Cavendish Road, Coorparoo
The Cavendish Road intersection is 3.65km from the CBD. Traffic flows in the AM and PM peaks are particularly high given the road feeds into Stanley St East, a major arterial into the city. Pedestrian traffic volumes are also the highest of any level crossing site given the proximity of the OLC to the busy Coorparoo station (on the Cleveland line) and two local High Schools. Land use around the site is a mixture of light commercial and light industrial, with some residential allotments also in close proximity. Significant property resumptions are anticipated as part of any grade separation and may contribute to this site being one of the most expensive to eliminate. While daily train movements are comparatively quite low at 143 trains a day, the site has the second largest traffic flows at over 30 000 vehicles a day. Near misses are also within the higher bound, with 47 such incidents in the examined period.
Table 13: Site Specific Statistics – Cavendish Road
Site Cavendish Road Average across all OLC
sample sites
Accidents (2004-2011) 0 0.19
Incidents (2004-2011) 84 64
Trains per day (2011) 143 129
Peak passenger load factor (average per train) 389 256
Vehicles per day (2011) 30,180 19,044
Source: provided by TMR, vehicles per day based on traffic count survey from SMEC
135-05823 Release docs.pdf - Page Number: 19 of 85
Relea
sed
unde
r RTI
- DTM
R

Site Analysis
Deloitte Access Economics: Cost-Benefit Analysis of Open Level Crossing Elimination 11
2.8 Dawson Parade, Keperra
The Dawson Parade open level crossing is situated approximately 9km north-west of Brisbane CBD on the Ferny Grove line, close to Grovely Station. There is a mixture of land use patterns in the vicinity, including residential, parkland and commercial allotments. There have been 51 incidents at this site since 2004, including 20 near misses. Construction costs at this site are significant, and may require considerable land resumptions. Daily traffic volumes are over 20 000 vehicles, and train movements are 150.
Table 14: Site Specific Statistics – Dawson Parade
Site Dawson Parade Average across all OLC
sample sites
Accidents (2004-2011) 0 0.19
Incidents (2004-2011) 51 64
Trains per day (2011) 110 129
Peak passenger load factor (average per train) 150 256
Vehicles per day (2011) 21,295 19,044
Source: provided by TMR, vehicles per day based on traffic count survey from SMEC
135-05823 Release docs.pdf - Page Number: 20 of 85
Relea
sed
unde
r RTI
- DTM
R

Site Analysis
Deloitte Access Economics: Cost-Benefit Analysis of Open Level Crossing Elimination 12
2.9 Gympie Street North, Landsborough
The Gympie Street North site is in Sunshine Coast Regional Council, 74km north of the Brisbane CBD. It is on the Sunshine Coast line (which provides connections north to Gympie and Nambour) and as a result, passenger loads are noteworthy for a site outside the Brisbane area. Traffic movements are the lowest of all examined sites and the 17 recorded incidents at this site is also relatively very low. The site is in close proximity Landsborough Primary School and a pedestrian overpass has been suggested for this site. As mentioned above, the concept option proposed for this site involves closure of the existing OLC and a grade separation for vehicles at the Caloundra St site.
Table 15: Site Specific Statistics – Gympie Street North
Site Gympie Street North Average across all OLC
sample sites
Accidents (2004-2011) 0 0.19
Incidents (2004-2011) 17 64
Trains per day (2011) 53 129
Peak passenger load factor (average per train) 68 256
Vehicles per day (2011) 3,690 19,044
Source: provided by TMR, vehicles per day based on traffic count survey from SMEC
135-05823 Release docs.pdf - Page Number: 21 of 85
Relea
sed
unde
r RTI
- DTM
R

Site Analysis
Deloitte Access Economics: Cost-Benefit Analysis of Open Level Crossing Elimination 13
2.10 Lindum Road, Lindum
The Lindum Road site is approximately 12km from the Brisbane CBD in the eastern suburbs. The level crossing links Lindum Road with Kianawah and Sibley roads and is located on the Cleveland line, adjacent to Lindum railway station. The crossing is complex as the through road is Kianawah Road to North Road with T-intersections either side of the rail crossing in Lindum and Sibley Roads. Construction costs may therefore be relatively high. Traffic flows at this site are not insignificant at 16 000 vehicles a day. Daily train movements are also quite high at 139 trains. Incidents are noteworthy at 88 issues over the examined period, including eight collisions.
Table 16: Site Specific Statistics – Lindum Road
Site Lindum Road Average across all OLC
sample sites
Accidents (2004-2011) 0 0.19
Incidents (2004-2011) 88 64
Trains per day (2011) 139 129
Peak passenger load factor (average per train) 256 256
Vehicles per day (2011) 16,370 19,044
Source: provided by TMR, vehicles per day based on traffic count survey from SMEC
135-05823 Release docs.pdf - Page Number: 22 of 85
Relea
sed
unde
r RTI
- DTM
R

Site Analysis
Deloitte Access Economics: Cost-Benefit Analysis of Open Level Crossing Elimination 14
2.11 McKean Street, Caboolture
The McKean Street open level crossing site is around 44km north of Brisbane within Moreton Bay Regional Council. Traffic flows are over 20 000 and the volume of train movements number around 46. The site is on the approach to Caboolture station, upon the Sunshine Coast and Caboolture line and is surrounded by a mixture of light commercial and residential properties. The concept design involves significant land resumptions. Despite significant passenger movements at this site, historically, the number of incidents at this site has been within the lower bounds.
Table 17: Site Specific Statistics – McKean Street
Site McKean Street Average across all OLC
sample sites
Accidents (2004-2011) 0 0.19
Incidents (2004-2011) 36 64
Trains per day (2011) 46 129
Peak passenger load factor (average per train) 82 256
Vehicles per day (2011) 22,150 19,044
Source: provided by TMR, vehicles per day based on traffic count survey from SMEC
135-05823 Release docs.pdf - Page Number: 23 of 85
Relea
sed
unde
r RTI
- DTM
R
Site Analysis
Deloitte Access Economics: Cost-Benefit Analysis of Open Level Crossing Elimination 15
2.12 Nathan Road, Runcorn
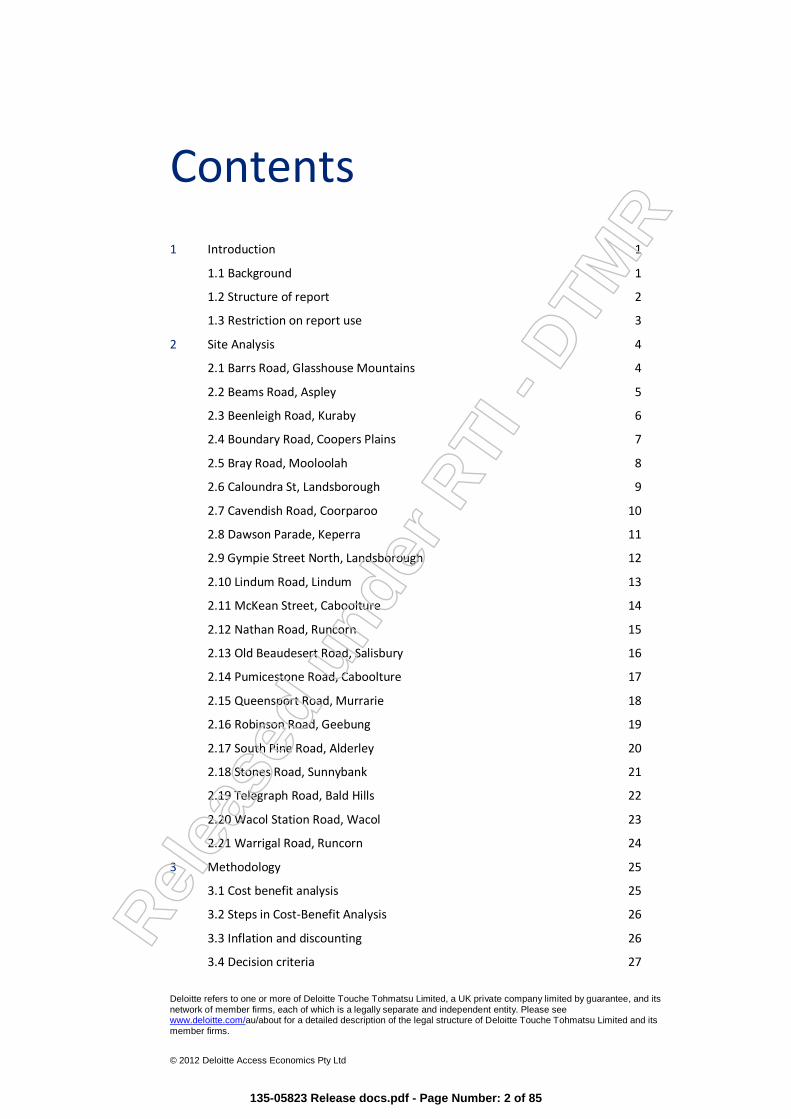
The Nathan Road crossing is in Brisbane’s south, approximately 14km from the CBD. It too is on the busy Beenleigh/Gold Coast line, within close proximity to sporting grounds, and the Runcorn Station. There are two signalised intersections near the OLC and access to station parking from the northern approach of Nathan Road. Traffic flows are in the mid-range, at 15 000 movements. There have been 77 recorded incidents at this site since 2004, including over 30 near misses with vehicles or pedestrians.
Table 18: Site Specific Statistics – Nathan Road
Site Nathan Road Average across all OLC
sample sites
Accidents (2004-2011) 0 0.19
Incidents (2004-2011) 77 64
Trains per day (2011) 175 129
Peak passenger load factor (average per train) 338 256
Vehicles per day (2011) 15,585 19,044
Source: provided by TMR, vehicles per day based on traffic count survey from SMEC
135-05823 Release docs.pdf - Page Number: 24 of 85
Relea
sed
unde
r RTI
- DTM
R

Site Analysis
Deloitte Access Economics: Cost-Benefit Analysis of Open Level Crossing Elimination 16
2.13 Old Beaudesert Road, Salisbury
The Old Beaudesert Road site is approximately 9km from Brisbane CBD on the Beenleigh/Gold Coast line. It is in close proximity to another overpass structure, commercial allotments and another OLC site in nearby Acacia Ridge that was eliminated following the initial SKM report. Train movements are in the higher band of those examined, at 183, however traffic volumes are amongst the lowest (8 000 vehicles). Historical incidents at the site are the second highest at 126, including 59 near misses and 9 collisions.
Table 19: Site Specific Statistics – Old Beaudesert Road
Site Old Beaudesert Road Average across all OLC
sample sites
Accidents (2004-2011) 0 0.19
Incidents (2004-2011) 126 64
Trains per day (2011) 183 129
Peak passenger load factor (average per train) 484 256
Vehicles per day (2011) 8,045 19,044
Source: provided by TMR, vehicles per day based on traffic count survey from SMEC
135-05823 Release docs.pdf - Page Number: 25 of 85
Relea
sed
unde
r RTI
- DTM
R

Site Analysis
Deloitte Access Economics: Cost-Benefit Analysis of Open Level Crossing Elimination 17
2.14 Pumicestone Road, Caboolture
The Pumicestone Road site is approximately 45km north of Brisbane within the Moreton Bay Regional Council jurisdictional area, a few kilometres north of Caboolture Station. Passenger loads and train movements are both relatively low at this site. It is however the third busiest site in terms of traffic volumes, with 28 000 vehicles passing through the surrounding roads and potentially being impacted by any OLC incident. Historically, there have been 43 such incidents since 2004.
Table 20: Site Specific Statistics – Pumicestone Road
Site Pumicestone Road Average across all OLC
sample sites
Accidents (2004-2011) 0 0.19
Incidents (2004-2011) 43 64
Trains per day (2011) 45 129
Peak passenger load factor (average per train) 82 256
Vehicles per day (2011) 28,250 19,044
Source: provided by TMR, vehicles per day based on traffic count survey from SMEC
135-05823 Release docs.pdf - Page Number: 26 of 85
Relea
sed
unde
r RTI
- DTM
R

Site Analysis
Deloitte Access Economics: Cost-Benefit Analysis of Open Level Crossing Elimination 18
2.15 Queensport Road, Murrarie
The Queensport site is situated in Brisbane’s east, approximately 8km from the CBD. It is close to Murrarie Station on the Cleveland line and is surrounded by residential and light commercial allotments. Traffic flows are relatively low at 10 000 vehicles a day (though this is expected to increase to 15 000 by 2021). However, it has historically been the most dangerous site. There have been 141 incidents, including 86 near misses, two cases of serious injury and one fatality.
Table 21: Site Specific Statistics – Queensport Road
Site Queensport Road Average across all OLC
sample sites
Accidents (2004-2011) 3 0.19
Incidents (2004-2011) 141 64
Trains per day (2011) 143 129
Peak passenger load factor (average per train) 257 256
Vehicles per day (2011) 10,085 19,044
Source: provided by TMR, vehicles per day based on traffic count survey from SMEC
135-05823 Release docs.pdf - Page Number: 27 of 85
Relea
sed
unde
r RTI
- DTM
R

Site Analysis
Deloitte Access Economics: Cost-Benefit Analysis of Open Level Crossing Elimination 19
2.16 Robinson Road, Geebung1
The Robinson Road site is approximately 11km north of Brisbane CBD, on the Sunshine Coast/Caboolture line. There is significant retail and other commercial activity, along with light industry in the area. It is close to numerous busy intersections and these intersections’ proximity to the station is also problematic. Boom gates are currently operated when trains are stopped at the station, which means that boom gate closure times tend to be longer than that at other sites. Passenger loads and train movements at the site are relatively high. It is expected to be one of the most expensive sites to grade separate, due in part to large resumption costs in the highly built up area. There have however been almost 100 incidents at the site, including 47 near misses and one fatality.
There is significant community lobbying for elimination of this OLC site and Brisbane City Council has previously developed a preliminary business case.
Table 22: Site Specific Statistics – Robinson Road
Site Robinson Road Average across all OLC
sample sites
Accidents (2004-2011) 1 0.19
Incidents (2004-2011) 98 64
Trains per day (2011) 186 129
Peak passenger load factor (average per train) 424 256
Vehicles per day (2011) 15,490 19,044
Source: provided by TMR, vehicles per day based on traffic count survey from SMEC
1 While this report was being finalised, Premier Campbell Newman and Brisbane Lord Mayor Graham Quirk announced an in-
principle agreement to begin work on a timeline and budget program for the upgrade of open level crossings at Robinson Road, Geebung and Telegraph Road, Bracken Ridge. Premier of Queensland, 2012. State and BCC working together to deliver for Brisbane. Media release – 4 May 2012. http://statements.cabinet.qld.gov.au/MMS/StatementDisplaySingle.aspx?id=79144
135-05823 Release docs.pdf - Page Number: 28 of 85
Relea
sed
unde
r RTI
- DTM
R
Site Analysis
Deloitte Access Economics: Cost-Benefit Analysis of Open Level Crossing Elimination 20
2.17 South Pine Road, Alderley
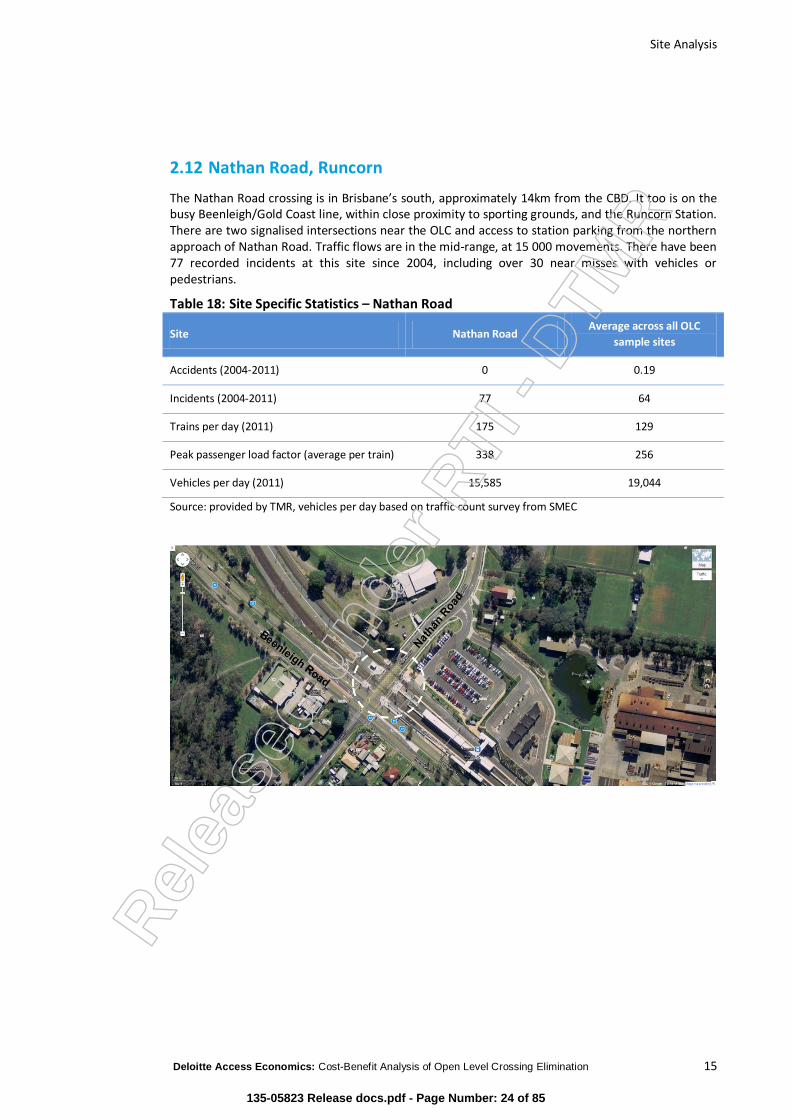
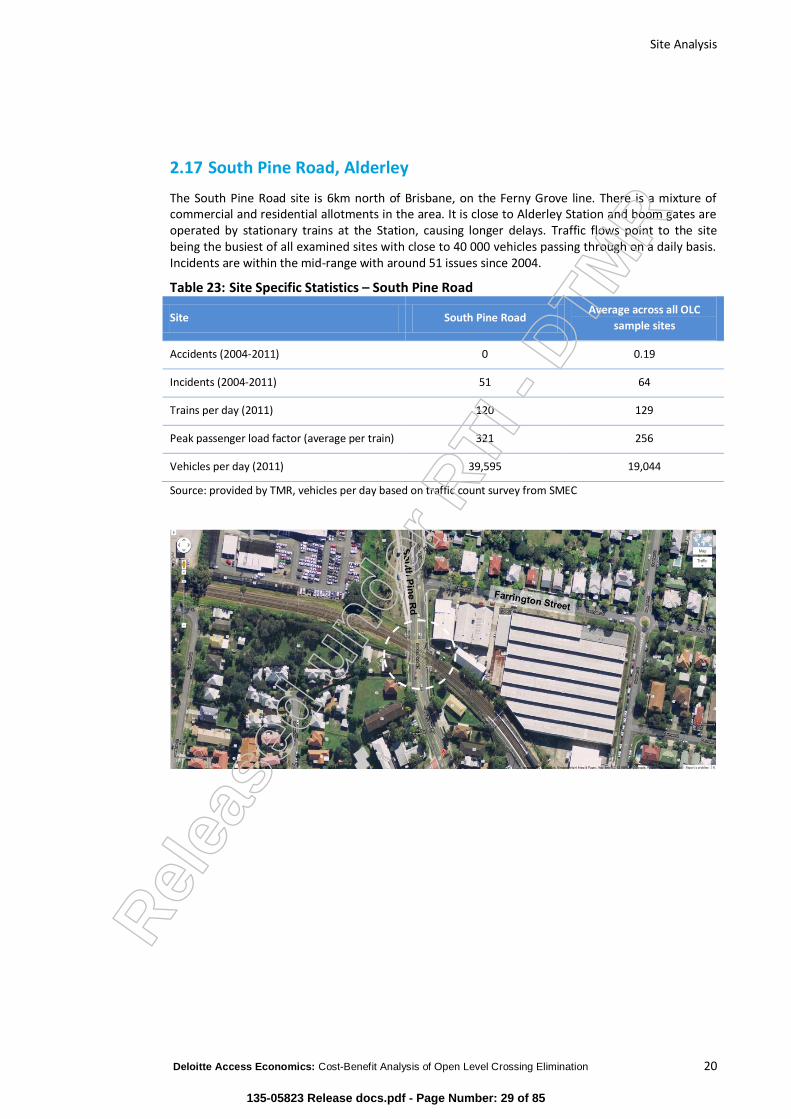
The South Pine Road site is 6km north of Brisbane, on the Ferny Grove line. There is a mixture of commercial and residential allotments in the area. It is close to Alderley Station and boom gates are operated by stationary trains at the Station, causing longer delays. Traffic flows point to the site being the busiest of all examined sites with close to 40 000 vehicles passing through on a daily basis. Incidents are within the mid-range with around 51 issues since 2004.
Table 23: Site Specific Statistics – South Pine Road
Site South Pine Road Average across all OLC
sample sites
Accidents (2004-2011) 0 0.19
Incidents (2004-2011) 51 64
Trains per day (2011) 120 129
Peak passenger load factor (average per train) 321 256
Vehicles per day (2011) 39,595 19,044
Source: provided by TMR, vehicles per day based on traffic count survey from SMEC
135-05823 Release docs.pdf - Page Number: 29 of 85
Relea
sed
unde
r RTI
- DTM
R

Site Analysis
Deloitte Access Economics: Cost-Benefit Analysis of Open Level Crossing Elimination 21
2.18 Stones Road, Sunnybank
Stones Road is in Brisbane’s southern suburbs, 13km from the CBD. The level crossing is close to Sunnybank station, along the Beenleigh/Gold Coast line. Train movements are relatively high, with 175 services daily. Traffic movements however, are not significant at 14 000, though this is expected to grow to 18 000 by 2021. A grade separated structure may require resumption of residential allotments in the vicinity of the crossing. The total number of incidents at the site is relatively low.
Table 24: Site Specific Statistics – Stones Road
Site Stones Road Average across all OLC
sample sites
Accidents (2004-2011) 0 0.19
Incidents (2004-2011) 22 64
Trains per day (2011) 175 129
Peak passenger load factor (average per train) 370 256
Vehicles per day (2011) 14,840 19,044
Source: provided by TMR, vehicles per day based on traffic count survey from SMEC
135-05823 Release docs.pdf - Page Number: 30 of 85
Relea
sed
unde
r RTI
- DTM
R

Site Analysis
Deloitte Access Economics: Cost-Benefit Analysis of Open Level Crossing Elimination 22
2.19 Telegraph Road, Bald Hills2
The Telegraph Road crossing is 16km from Brisbane CBD on the Sunshine Coast/Caboolture line. Apart from a residential allotment to the site’s north-east, the adjoining land is largely vacant. Passenger loads, train movements and traffic volumes are all relatively high at the site. The number of incidents at the site is also noteworthy, with 115 occurrences since 2004, including 45 collisions.
There is also significant community lobbying for elimination of this OLC site and Brisbane City Council has previously developed a preliminary business case.
Table 25: Site Specific Statistics – Telegraph Road
Site Telegraph Road Average across all OLC
sample sites
Accidents (2004-2011) 0 0.19
Incidents (2004-2011) 115 64
Trains per day (2011) 185 129
Peak passenger load factor (average per train) 359 256
Vehicles per day (2011) 27,020 19,044
Source: provided by TMR, vehicles per day based on traffic count survey from SMEC
2 While this report was being finalised, Premier Campbell Newman and Brisbane Lord Mayor Graham Quirk announced an in-
principle agreement to begin work on a timeline and budget program for the upgrade of open level crossings at Robinson Road, Geebung and Telegraph Road, Bracken Ridge. Premier of Queensland, 2012. State and BCC working together to deliver for Brisbane. Media release – 4 May 2012. http://statements.cabinet.qld.gov.au/MMS/StatementDisplaySingle.aspx?id=79144
135-05823 Release docs.pdf - Page Number: 31 of 85
Relea
sed
unde
r RTI
- DTM
R

Site Analysis
Deloitte Access Economics: Cost-Benefit Analysis of Open Level Crossing Elimination 23
2.20 Wacol Station Road, Wacol
Wacol Station Road may be found 16km south west of Brisbane on the Ipswich line. At this location, the railway runs in parallel to the Ipswich motorway. Passenger loads and traffic flows are both significant at the site, and both are expected to grow steadily by 2021. Historical incident numbers are slightly lower than the average across all sites.
The grade separation concept for this site proposes using the existing on/off ramps of the Ipswich motorway and building a bridge structure over the rail lines. Land resumption of a major property will be required.
Table 26: Site Specific Statistics – Wacol Station Road
Site Wacol Station Road Average across all OLC
sample sites
Accidents (2004-2011) 0 0.19
Incidents (2004-2011) 54 64
Trains per day (2011) 148 129
Peak passenger load factor (average per train) 267 256
Vehicles per day (2011) 24,995 19,044
Source: provided by TMR, vehicles per day based on traffic count survey from SMEC
135-05823 Release docs.pdf - Page Number: 32 of 85
Relea
sed
unde
r RTI
- DTM
R

Site Analysis
Deloitte Access Economics: Cost-Benefit Analysis of Open Level Crossing Elimination 24
2.21 Warrigal Road, Runcorn
The Warrigal Road site is in Brisbane’s southern suburbs, 15km from the CBD. It is located along the Beenleigh/Gold Coast line which runs along Beenleigh Road near the site and carries a significant amount of trains daily. The crossing is controlled by traffic lights which are coordinated with the crossing signals and boom gates. Traffic volumes are close to the average across all sites. Warrigal Road is expected to be one of the more expensive sites to grade separate, with a number of property resumptions also required.
Table 27: Site Specific Statistics – Warrigal Road
Site Warrigal Road Average across all OLC
sample sites
Accidents (2004-2011) 0 0.19
Incidents (2004-2011) 48 64
Trains per day (2011) 176 129
Peak passenger load factor (average per train) 98 256
Vehicles per day (2011) 19,135 19,044
Source: provided by TMR, vehicles per day based on traffic count survey from SMEC
135-05823 Release docs.pdf - Page Number: 33 of 85
Relea
sed
unde
r RTI
- DTM
R

Methodology
Deloitte Access Economics: Cost-Benefit Analysis of Open Level Crossing Elimination 25
3 Methodology This section provides an overview of the approach undertaken in the cost benefit analysis and the key assumptions that have been adopted.
Twenty-one level crossings were analysed to determine the priority and justification for their elimination. The various OLCs were compared by examining traffic flows and historical accident data, along with the capital and construction costs associated with grade separation. The benefits flowing from elimination of the OLCs, including travel time savings were quantified as part of the formal cost benefit analysis process for the 21 sites. A prioritisation process using the BCR of each site has then been conducted. A summary of the key cost-benefit analysis variables is shown in the table below.
Table 28: Cost-Benefit Analysis variables
Variables
Incident and accident rates Travel time benefits
Traffic flows (AADTs) Vehicle operating costs
Rail movements Incident delay values
Capital costs BCR
Maintenance costs
Source: Deloitte
3.1 Cost-benefit analysis Cost-benefit analysis is an economic evaluation tool – based upon the principles of welfare economics – which is often applied to public sector projects. It is used to assess public spending in terms of the benefits and costs that will accrue to society, as opposed to those in the private sector which are concerned primarily with a financial analysis of revenues and profits for the firm.
As such, cost benefit analysis is often employed by policy makers to assess the relative desirability and justification of a transport project or competing alternatives, where desirability is measured as economic worth to society as a whole.
The various costs and benefits of a proposed infrastructure project are quantified and compared to help evaluate whether a project should proceed, whether it would be an efficient allocation of resources and the value of any benefits that would accrue as a result (i.e. net economic worth of a project).
Cost-benefit analysis provides a consistent framework for organising information, listing the advantages and disadvantages of projects, determining the relevant economic values, and ranking projects and alternatives on the criterion of utility to society.
The economic analysis employed for this evaluation follows standard methodologies for assessing projects of this nature. These include:
Australian Transport Council (ATC) “National Guidelines for Transport System Management in Australia” (2006)
135-05823 Release docs.pdf - Page Number: 34 of 85
Relea
sed
unde
r RTI
- DTM
R

Methodology
Deloitte Access Economics: Cost-Benefit Analysis of Open Level Crossing Elimination 26
Austroads “Guide to Project Evaluation” (2008)
Queensland Government “Project Assurance Framework” (2010)
Queensland Government Project Assurance Framework Supplementary Guidance – “Cost Benefit Analysis Guidelines” (2010)
Department of Transport and Main Roads “Cost-Benefit Analysis Manual” (2011)
Infrastructure Australia (IA) “Better Infrastructure Decision Making Guidelines” (2010)
The methodology adopted in this study can be considered at the ‘rapid’ stage, according to the Australian Transport Council definition, due to the level of detail surrounding the capital cost estimates and the traffic modelling.
3.2 Steps in Cost-Benefit Analysis The key steps in the cost-benefit analysis process include the following:
1. Defining the project objectives and scope
2. Defining the base case (without project case) against which the project options are compared
3. Defining the project options which form the basis of the economic evaluation
4. Identifying the costs and benefits that might be expected in moving from the base case to each of the project options
5. Identifying and agreeing the core parameters of the evaluation (e.g. time scale, base year for prices to calculate present dollar values, discount rate)
6. Where possible, quantifying the costs and benefits over the expected lifecycle and discounting future values to express them in equivalent present values
7. Generating performance measures including the Net Present Value (NPV) and Benefit Cost Ratio (BCR) using discounted cash flow techniques over the evaluation period
8. Testing the sensitivity of these performance measures to changes in the underlying assumptions utilised
9. Ranking the projects according to BCR.
3.3 Inflation and discounting Inflation results in the nominal prices of goods and services rising over time. The existence of inflation raises the question of whether project inputs, such as capital costs, should be measured at the prices that prevail at the time of the appraisal, constant prices or at the prices that are in force when the cost or benefit streams occurs (current prices).
Using real constant dollars for future variables prevents the problem of having to estimate the rate of inflation (which in itself constantly varies). Real constant prices are viewed as
135-05823 Release docs.pdf - Page Number: 35 of 85
Relea
sed
unde
r RTI
- DTM
R

Methodology
Deloitte Access Economics: Cost-Benefit Analysis of Open Level Crossing Elimination 27
the preferred basis in economic evaluations and in this evaluation, 2011 price levels are applied.
Further to the issue of price bases, there is also a need to discount cost and benefit streams when comparing these over time. This is due to the principle that a dollar received today is worth more than a dollar received next year, even correcting for inflation. Ceteris paribus, individuals prefer to receive a benefit now, rather than in future, irrespective of any other consideration.
This is known as social time preference, the rate at which society as a whole discounts future costs and benefits to obtain its equivalent present value. Discounting allows the cost benefit analysis to weigh benefits and costs that occur in the immediate future at a higher present value to those that occur further out in time.
3.4 Decision criteria The calculation of the performance measures described above is provided in Table 29. Projects which yield a positive NPV indicate that the incremental benefits of the project exceed the incremental costs over the evaluation period. The BCR measures the ratio of discounted benefits to discounted costs. A BCR greater than 1 indicates that project benefits exceed project costs. The usual hurdle rate for acceptance of a project is a BCR of 1.
Table 29: Decision criteria
Criterion Description
NPV = PVB - PVC NPV = net present value is the difference between the present value of the total incremental benefits and the present value of the total incremental costs
PVB = present value of benefits
PVC = present value of costs
BCR = PVB / PVC BCR = benefit cost ratio of the present value of total incremental benefits to the present value of total incremental costs
Source: Deloitte
3.5 Key methodological issues Key evaluation parameters used in the evaluation are summarised in Table 30.
Table 30: Key Economic Evaluation Assumptions
Item Assumption
Discount rate A 6% per annum real discount rate is applied in the evaluation to calculate present values. The evaluation also undertakes sensitivity tests at the discount rates of 4%, 7% and 10%. These values are in accordance with Infrastructure Australia guidelines.
Price Year All costs and benefits in the evaluation are presented in 2011 constant prices.
135-05823 Release docs.pdf - Page Number: 36 of 85
Relea
sed
unde
r RTI
- DTM
R

Methodology
Deloitte Access Economics: Cost-Benefit Analysis of Open Level Crossing Elimination 28
Item Assumption
Evaluation period An evaluation period of 30 years from the end of the capital investment is adopted for this study, as per the Queensland Treasury and Infrastructure Australia guidelines.
It has been assumed that the grade separations would occur during calendar years 2011-2012 and that their first full year of operation (and realisation of benefits) would be from the beginning of 2013 onward.
Economic evaluation The economic evaluation considers the project from a community perspective and considers the costs and benefits which are both internal and external to the rail operator including government organisations, private sector enterprises, individuals and the environment. Some of these effects, (such as time savings, noise and air quality effects) are not directly quantified in market based monetary terms. An economic evaluation differs from a financial evaluation because the latter focuses on revenue flows, capital and operating costs for key stakeholders and it does not include externalities or private benefits such as time savings.
Annualisation An annualisation figure of 251 has been used in converting daily figures to a ‘per annum’ basis. This is in line with Australian Transport Council Guidelines and provides and accurate reflection of the number of working days in a year, excluding public holidays and weekends.
GDP Growth Real GDP growth of 1.5% has been applied to all benefit streams.
Source: Deloitte
3.5.1 Data sources
Where appropriate, data has been sourced from TMR and QR. We have relied on the accuracy of this data for the assessment.
For the purposes of this study, reliable data for both road and rail (accidents, incidents etc.) is available from 2004 to 2011. Therefore, these years form the basis for the assessment.
3.6 Base Case As part of a cost benefit analysis, a base case must be developed with which to compare the project case. It represents the situation without the project and is interchangeably referred to as business as usual, the status quo, or the ‘do minimum’ situation. For this analysis, the base case is the current track and road configuration at each station.
3.7 Project Case The project case will consider the effect of eliminating each open level crossing through either road closure or grade separation. While detailed capital costs for most sites were unavailable at this stage of the evaluation, the estimates developed for the 2006 SKM report were considered and updated. Other similar grade separation works in the State, along with more recent business cases were also used.
It is likely that multiple concept designs may be generated for some sites at a later stage if crossing elimination is deemed viable. While some sensitivity testing of construction costs
135-05823 Release docs.pdf - Page Number: 37 of 85
Relea
sed
unde
r RTI
- DTM
R

Methodology
Deloitte Access Economics: Cost-Benefit Analysis of Open Level Crossing Elimination 29
will be conducted as part of this analysis, it is expected that other variations will be assessed in greater detail when appropriate.
3.8 Multi-criteria Analysis Along with the BCR analysis developed as part of the cost benefit analysis process, a multi-criteria analysis approach will be used. This allows a further qualitative assessment to be made as to the significance of different inputs and allows an additional value to be placed upon issues such as community service obligations and matters of equity that are typically outside the scope of traditional economic analysis. The following variables will then be presented in prioritising the level crossings.
Table 31: MCA Framework
Outcome Objective Measure
Economic Does the project represent value for money? BCR
Safety Does the project improve safety? Accident savings
Traffic (demand) How many members of society are impacted by the project?
AADT
Source: Deloitte
135-05823 Release docs.pdf - Page Number: 38 of 85
Relea
sed
unde
r RTI
- DTM
R

Traffic modelling
Deloitte Access Economics: Cost-Benefit Analysis of Open Level Crossing Elimination 30
4 Traffic modelling Traffic modelling has been undertaken by sub-consultants SMEC Pty Ltd to model the expected road user travel benefits from OLC elimination. SMEC developed a Paramics micro simulation model and a standard queue delay model to estimate the benefits of the project.
Traffic surveys
Traffic surveys were commissioned by SMEC in order to obtain vehicle counts at each OLC site. These were conducted by Traffic Surveyors, Data Audit Systems. Data was obtained over the period Tuesday 6 to Wednesday 8 December 2011 for all sites except Barrs Road, Glasshouse Mountains where a survey from 11 May 2011 was used. Counts were conducted in the morning peak between the hours of 7am and 9am. The weather was clear and sunny on December 6, and it rained on the following two days. This may have understated traffic flows slightly3.
The traffic survey counted all vehicles crossing the level crossing and vehicles within the immediate surrounding road network. A comparison between the recent traffic counts and the AADTs used in the SKM (2006) study are shown in the table below. In most cases the traffic counts used in this study are higher than in the SKM report which reflects the incorporation of the wider local road network.
Table 32: Traffic counts - AADT
Site 2005 (SKM) 2011 (SMEC)
Barrs Road, Glass House Mountains 350 6,590
Beams Road, Aspley 18,000 27,115
Beenleigh Road, Kuraby 16,018 14,415
Boundary Road, Coopers Plains 19,000 24,885
Bray Road, Mooloolah 4,100 9,870
Caloundra St, Landsborough 11,000 20,325
Cavendish Road, Coorparoo 19,500 30,180
Dawson Pde, Keperra 17,780 21,295
Gympie Street North,
Landsborough 1,500 3,690
Lindum Road, Lindum 9,263 16,370
McKean Street, Caboolture 9,800 22,150
Nathan Road, Runcorn N/A 15,585
3 Literature suggests that wet weather may deter motorists from venturing onto the road and lead to a reduction in traffic
volumes. Statistically significant decreases have been observed within an Australian context, Knapp, Smithson (2000), Keay, Simmonds (2005). Wet weather may also decrease the capacity of roads, with decreased operating speeds, etc. Smith, Byrne et al. (2004).
135-05823 Release docs.pdf - Page Number: 39 of 85
Relea
sed
unde
r RTI
- DTM
R

Traffic modelling
Deloitte Access Economics: Cost-Benefit Analysis of Open Level Crossing Elimination 31
Site 2005 (SKM) 2011 (SMEC)
Old Beaudesert Road, Salisbury N/A 8,045
Pumicestone Road, Caboolture 10,500 28,250
Queensport Road, Murrarie 9,263 10,085
Robinson Road, Geebung 10,000 15,490
South Pine Road, Alderley 28,500 39,595
Stones Road, Sunnybank N/A 14,840
Telegraph Road, Bald Hills 15,500 27,020
Wacol Station Road, Wacol 9,700 24,995
Warrigal Road, Runcorn 13,056 19,135
Source: SKM (2006) and SMEC
Modelling
Using the outputs from the traffic surveys, SMEC conducted traffic modelling in order to determine the vehicle flows around each site, in 2011 and 2021 under both the base and project cases. Modelling was conducted for each site using a standard queue delay model to estimate the benefits of the project. Ten sites, selected in conjunction with TMR, were then subject to the Paramics modelling approach4.
Paramics is a traffic micro simulation program which uses a combination of nodes, links and other objects to replicate geometry constraints in the actual environment. After release from a certain specific ‘origin’, the model tracks the manner in which vehicles attempt to complete their journey towards a ‘destination zone’, given various geometric and vehicular parameters. It allows users to model vehicle movements in order to predict future behaviour based upon changes to road configurations or traffic volumes. The outputs derived from the Paramics model are attached in Appendix B.
4 These sites included Beams Road, Aspley; Boundary Road, Coopers Plains; Cavendish Road, Coorparoo Lindum Road,
Lindum; Robinson Road, Geebung; South Pine Road, Alderley; Stones Road, Sunnybank; Telegraph Road, Bald Hills; Wacol Station Road, Wacol; Warrigal Road, Runcorn.
135-05823 Release docs.pdf - Page Number: 40 of 85
Relea
sed
unde
r RTI
- DTM
R

Project costs
Deloitte Access Economics: Cost-Benefit Analysis of Open Level Crossing Elimination 32
5 Project costs Costs are assumed to be the real economic resources used in the elimination of open level crossings at the identified sites. This includes all the construction costs and the ongoing maintenance and operating costs associated with any new grade separating structure, but excludes transfer prices including GST.
5.1 Capital costs The Open Level Crossing Elimination Report (SKM, 2006) developed preliminary cost estimates for each of the 19 sites examined in that report5.
As part of this estimation exercise, a single ‘Concept Design Option’ was developed for each of the 19 sites. While a number of other technical options to solve the problems associated with OLCs exist, and notwithstanding the fact that more detailed analysis may result in additional work or design changes for visual amenity or community concerns, these initial designs were deemed ‘sufficiently robust and relevant6’. A 30% contingency was also built into these costs.
OLC elimination options
In line with the SKM report, the majority of concept options considered for the 21 sites involve the construction of a grade separating structure, which largely mimics the existing traffic paths of the relevant intersection7.
The Gympie St North OLC is the only site where complete elimination has been suggested. As it is in close proximity to the Caloundra Street site, it is proposed that the Gympie St North site be retained for pedestrian use while all road traffic would pass through a grade separated Caloundra Street.
The total cost of this ‘double upgrade’ has been equally assigned between the two sites as they must occur in conjunction with each other.
Capital Cost Deflator
For this analysis, the relevant costs from the 2006 report were inflated by 37% to 2011 dollar values, as per the ABS Road and Bridge Construction Price Index.
Construction prices and labour inputs in Queensland have increased at consistently higher prices than those in the rest of the country. This elevated cost of building a grade separated structure in Queensland has been reflected in this escalation (see below).
5 Design options were largely sourced from the (former) Department of Main Roads and Brisbane City Council. Additional
designs for missing sites were developed by SKM. 6 Sinclair Knight Merz, 2006. Open Level Crossing Elimination Report. Queensland. 7 Most of the concept designs from the SKM report involve bridges with retained earth structures to negotiate the crossing of
the rail line. Where space is available, earth embankments have been modelled instead of retained earth walls. For the bridge structures, a maximum road grade of 5.5% has been used along the roadways.
135-05823 Release docs.pdf - Page Number: 41 of 85
Relea
sed
unde
r RTI
- DTM
R

Project costs
Deloitte Access Economics: Cost-Benefit Analysis of Open Level Crossing Elimination 33
Figure 5-2: Road and Bridge Construction Index
Source: ABS, 2011. 6427.0 Producer Price Indexes, Australia.
Approach to Capital Cost Estimation
Since the 2006 SKM report, four sites have progressed to the business case stage including two that have been constructed as a grade separation solution. The Brisbane City Council commissioned business case investigations for both the Telegraph Road OLC and the Robinson Road OLC8. There have been no further studies of these sites.
The Mawhinney Street OLC in Beerwah and the Beaudesert Road OLC in Acacia Ridge have since finished construction9. Our review of the actual cost (ex-post) versus the estimated costs (ex-ante) from the SKM report is highlighted in Table 33. It is recognised that the actual ex-post cost of a project may sometimes be different to initial estimates as supplementary works are often undertaken to improve the desirability of the site and locality. Moreover as these sites have been subjected to more detailed engineering assessment, understandably the subsequent cost estimate for those sites can be considered more realistic than the preliminary estimates developed by SKM. As such we have sought to use the actual costs from these eliminated sites as a benchmark for the cost of OLC elimination.
Therefore the approach adopted in this report to estimate the capital costs for each site is undertaken in the following steps:
1. Deflate the capital cost estimates from the SKM report to $2011 prices using the ABS Road and Bridge Construction Index
2. Compare actual cost of the Mawhinney St OLC and Beaudesert Rd OLC eliminations against the estimate in the SKM report to determine the scale (%) of the difference in preliminary estimate and actual cost.
8 Brisbane City Council, 2008. Robinson Road Open Level Crossing Elimination Project – Draft Business Case; Brisbane City
Council, ARUP, 2009. Telegraph Road OLC Elimination Project, Business Case Report. 9 See SKM (2006) for more background information on these sites.
120.0
130.0
140.0
150.0
160.0
170.0
180.0In
dex
Australian Average Queensland
135-05823 Release docs.pdf - Page Number: 42 of 85
Relea
sed
unde
r RTI
- DTM
R

Project costs
Deloitte Access Economics: Cost-Benefit Analysis of Open Level Crossing Elimination 34
3. Apply the percentage difference in cost estimate (preliminary estimate to actual) for all sites.
The table below shows the initial SKM estimate for the Mawhinney St OLC and Beaudesert Rd OLC and the actual cost. On average the difference between the initial estimates and the actual costs is 74.0 per cent. Therefore, this figure is used to increase the initial SKM capital cost estimates.
Table 33: Estimate versus actual capital costs ($2011)
Site SKM estimate
($2011)
Actual cost
($2011)
Difference between SKM and actual
(%)
Beaudesert Road, Acacia
Ridge 75.3m 113.2m 50.4%
Mawhinney Street,
Beerwah 35.6m 70.4m 97.7%
Average difference in cost 74.0%
Source: SKM (2006), TMR and Deloitte calculations
Capital Cost Estimates
Guidance was sought from the Department of Transport and Main Roads as to the preferred manner in which to develop capital cost estimates for the four additional sites examined as part of this evaluation.
Site specific considerations such as the proximity to stations, road/rail configurations and the nature of adjacent property that may require resumption was considered. Accordingly, the Nathan Road OLC site was afforded the same cost as the Warrigal Road OLC site given the similar nature of both sites.
Estimates for the Old Beaudesert Road, Queensport Road and Stones Road sites were calculated by applying an average of all remaining sites.
Based on the approaches discussed above, the capital cost estimates for each OLC site are shown in the table below.
Table 34: Capital Cost Estimates ($2011) - undiscounted
Site Cost ($m)
Site Cost ($m)
Robinson Road, Geebung 178.3
Stones Road, Sunnybank 78.6
Cavendish Road, Coorparoo 112.0
Pumicestone Road, Caboolture 73.8
Dawson Pde, Keperra 92.9
Telegraph Road, Bald Hills 70.8
Nathan Road, Runcorn 92.9
Bray Road, Mooloolah 66.7
Warrigal Road, Runcorn 92.9
McKean Street, Caboolture 66.7
Boundary Road, Coopers Plains 90.5
Wacol Station Road, Wacol 59.6
Lindum Road, Lindum 90.5
Barrs Road, Glass House Mountains 50.0
South Pine Road, Alderley 88.1
Beams Road, Aspley 45.3
135-05823 Release docs.pdf - Page Number: 43 of 85
Relea
sed
unde
r RTI
- DTM
R

Project costs
Deloitte Access Economics: Cost-Benefit Analysis of Open Level Crossing Elimination 35
Site Cost ($m)
Site Cost ($m)
Beenleigh Road, Kuraby 85.8
Caloundra St, Landsborough 28.6
Old Beaudesert Road, Salisbury 78.6
Gympie Street North, Landsborough 28.6
Queensport Road, Murrarie 78.6
Source: TMR, SKM, Deloitte calculations
This conservative approach to the calculation of the capital costs has been adopted given the preliminary nature of this evaluation. The engineering challenges and variations discussed earlier have not been explicitly calculated at this stage. To account for the level of accuracy, sensitivity testing of the capital costs will be undertaken.
Indirect capital costs such as additional or replacement rolling stock purchases are not included in the analysis.
Timing
It is assumed that any construction would occur over a two year period, commencing in 2012 with costs spread equally between the two years. The structure is expected to be fully functional by 2014.
It is expected that any capital construction work would be planned to minimise disruptions upon the existing transport network. However, certain reductions in road capacity are likely to occur, causing changes in travel costs. Considerations such as vehicle delays and re-routing in this construction period have not been addressed at this stage due to the variable level of such costs.
Further considerations
This study assumes that the elimination option is to grade separate all level crossings. However it is noted that in some circumstance a cheaper alternative may exist such as elimination of a crossing through road closures. This should be subject to further investigation in the business case stage.
5.2 Maintenance Costs Routine maintenance costs for each site are assumed to be $5,396 per annum (based on a kilometre of road), as per benchmarking previously used by the former Department of Main Roads. This figure is derived from discretionary expenditure figures (provided by the Roads Programs Division). These costs are applied at a constant rate over the evaluation period, commencing in 2013 (when the grade separated structure enters operation).
Note: given lack of data, for simplicity, periodic maintenance and rehabilitation costs have been excluded from the analysis. These costs should be included at the business case stage.
135-05823 Release docs.pdf - Page Number: 44 of 85
Relea
sed
unde
r RTI
- DTM
R

Project costs
Deloitte Access Economics: Cost-Benefit Analysis of Open Level Crossing Elimination 36
5.3 Boom Gate Costs As with any component of the transport network, open level crossings generate costs associated with their upkeep and maintenance. There are routine maintenance costs and site inspections associated with boom gates and signalling. Regular maintenance of these sites is particularly important as faulty infrastructure at these sites may lead to fatal consequences. A maintenance cost of $12,000 per year is assumed for each level crossing.
Repair and re-instatement costs are also borne by Queensland Rail when minor incidents occur, namely, collisions with boom gate infrastructure. While the cost of reinstatement work following incidents may vary depending on the type of incident and location, a cost of $5,000 has been assigned to each collision of a vehicle with a boom gate. Reinstatement costs have been calculated at each site, based upon the average number of recorded instances of boom gate strikes at each location, over the last four years10.
As all OLCs in question are active level crossings, these boom gate costs have been applied at every site.
The table below highlights the annual cost reinstatement cost at each site. In the project case, these costs are no longer incurred when a grade separating structure is installed. (In effect, the infrastructure improvements lead to a combination of reduced – or avoided – costs which manifest as a benefit).
Boom gate repair costs are most notable at Telegraph Road, which experienced 44 boom strikes in the last ten years, significantly higher than the 20 strikes experienced at Beenleigh Road – the second most expensive repair bill.
The avoided costs of boom gate strikes are shown in the table below.
Table 35: Cost of boom gate strikes ($2011) – discounted at 6%
Site Cost ($)
Site Cost ($)
Telegraph Road, Bald Hills 714,213
Pumicestone Road, Caboolture 113,625
Beenleigh Road, Kuraby 324,642
Warrigal Road, Runcorn 97,393
Caloundra St, Landsborough 227,250
Beams Road, Aspley 81,161
Robinson Road, Geebung 194,785
Bray Road, Mooloolah 81,161
McKean Street, Caboolture 178,553
Lindum Road, Lindum 64,928
South Pine Road, Alderley 178,553
Gympie Street North, Landsborough 48,696
Queensport Road, Murrarie 162,321
Nathan Road, Runcorn 48,696
Boundary Road, Coopers Plains 146,089
Barrs Road, Glass House Mountains 16,232
Cavendish Road, Coorparoo 146,089
Dawson Pde, Keperra 16,232
Old Beaudesert Road, Salisbury 129,857
Stones Road, Sunnybank 16,232
Wacol Station Road, Wacol 129,857
Source: Deloitte
10 Accurate data on boom gate strike is only available from 2008. This data has been provided by the Department of Transport
and Main Roads.
135-05823 Release docs.pdf - Page Number: 45 of 85
Relea
sed
unde
r RTI
- DTM
R

Project benefits
Deloitte Access Economics: Cost-Benefit Analysis of Open Level Crossing Elimination 37
6 Project benefits With the elimination of an open level crossing, transport system users will benefit from the savings associated with reduced accidents and incidents, and savings in travel times associated with boom gate closures.
6.1 Accidents Accidents and incidents at open level crossings may impose significant costs to society. Interactions between road and rail vehicles are generally viewed as unfavourable and efforts are made to separate the two modes when designing transport systems, due to the potential risk they pose, predominantly through driver error. While all sites considered in this evaluation are active level crossings and have signalling and boom gates which operate automatically when a train approaches, accidents and incidents continue to occur. The prevalence and severity of occurrences at the OLCs in question has been observed.
Driver error
The risk of a rail accident at a level crossing is very different to the risk of a road accident at a (motor vehicle only) intersection, as moving trains require very long distances to stop11. If a driver or a pedestrian misjudges the time available to cross an intersection safely, but does not misjudge by much, only a small reduction in speed by the other driver is needed to avoid an accident.
A train driver, on the other hand, is often not able to compensate for the misjudgements of pedestrians or drivers, however small. Pedestrians and motor vehicle drivers are more accustomed to crossing the paths of other motor vehicles, and may fail to allow for train drivers’ inability to compensate.
Australia has made some significant road safety gains from speed reduction measures over the last decade. However, there is ample evidence that much more could have been – and still can be – achieved in this area. Part of the challenge in this regard is to engage more effectively with the community on the role of speed in road safety. This is particularly true at open level crossing sites and Queensland Rail is currently engaged in a public awareness campaign around safety at such locations12.
While the number of crashes at level crossings generally increases as the vehicle traffic per unit of time through the crossing rises, the frequency of trains also has a large impact. Intersections with low train frequencies are often associated with a higher rate of accidents. This is because a driver’s perception that a train is not likely to be at a crossing is reinforced each time the driver passes the crossing and does not encounter a train, thus perversely encouraging risk-taking behaviour.13
11 Bureau of Transport and Regional Economics. 2002. Rail accident costs in Australia. Report 108. 12 Queensland Rail, 2012. What would you miss? http://www.whatwouldyoumiss.com.au/index.php 13 Drivers adopt more defensive behaviour on busy lines where they have a high expectation of a train approaching a level
crossing – the probability of an accident is often related to train traffic. Upon lines that only carry one or two trains a day or less, drivers are more likely not to look for a train.
135-05823 Release docs.pdf - Page Number: 46 of 85
Relea
sed
unde
r RTI
- DTM
R

Project benefits
Deloitte Access Economics: Cost-Benefit Analysis of Open Level Crossing Elimination 38
Accidents may also occur when motor vehicles are trapped in a level crossing by boom gates. This tends to be the result of poor queuing behaviour at congested level crossings or, more frequently, drivers who take longer in the level crossing by driving further in order to go around lowered boom gate arms that block the side of the road it is legal to drive on.
Rail Accident Data Collection
Under the Transport Safety Investigation Act and Regulations 2003, all rail owners, operators, track access providers, and other ‘responsible persons’ have an obligation to report any accidents as soon as practicable to the Australian Transport Safety Bureau or relevant State or Territory rail safety regulator.
Minor incidents on the other hand (see below), particularly near misses or boom strikes which occur in the absence of a train, may be understated as some incidents are likely to be unreported by road users.
Site Specific Accident data
Records maintained by TMR indicate incident and accident rates at each identified site since 2004. These may be broadly categorised into three main types:
1. Accidents – Fatalities: train collisions with a motor vehicle or pedestrian which leads to a loss of life, within 30 days of a railway occurrence, from injuries sustained in that occurrence.
2. Accidents – Serious injuries: train collisions with a motor vehicle or pedestrian which leads to hospitalisation as a result of injuries sustained in that occurrence, but does not lead to a loss of life within 30 days of the occurrence.
3. Reported Incidents: less severe occurrences which may happen in the absence of a train at an OLC ie. a car striking a boom gate. Reported incidents are broken down into the following categories, as per the National Guidelines for classification of rail safety occurrences:
a. Train collision with a motor vehicle or person (that does not necessarily result in a fatality or serious injury)
b. Boom gate strike where OLC infrastructure is damaged
c. Near miss with a motor vehicle or person (where a train driver may take emergency action to avoid an impact and no collision occurs)
d. OLC equipment failure or defect
e. Vandalism
f. Other.
Over the period 2004-2011 there were 1,352 recorded occurrences across the 21 sites, including two fatalities and two instances of serious injury (see breakdown below).
135-05823 Release docs.pdf - Page Number: 47 of 85
Relea
sed
unde
r RTI
- DTM
R

Project benefits
Deloitte Access Economics: Cost-Benefit Analysis of Open Level Crossing Elimination 39
Table 36: Accident and Incident Data (2004 to 2011)
Site Boom
strike
OLC Equipment
Failure/Defect
Near
miss Vandalism
Collision with
person/RV Fatalities
Serious
Injuries Other
Barrs Road 1
10
Beams Road 5 1 18
18
Beenleigh Road 20 4 19
39
Boundary Road 9 6 28 1
57
Bray Road 5 2 4 1
10
Caloundra Street 14 4 2
19
Cavendish Road 9 3 47 1 1
23
Dawson Parade 1 1 20
29
Gympie Street 3 3 3
8
Kianawah Road 4 4 40 4
36
Mc Kean Road 11 5 5
15
Nathan Road 3 6 31 2 35
Old Beaudesert Road 8 7 59 1 1 50
Pumicestone Road 7 7 3 5 21
Queensport Road 10 2 86 1 2 1 2 40
Robinson Road 12 8 47 1 1 30
South Pine Road 11 3 13 24
Stones Road 1 8 13
Telegraph Road 44 6 30 1 1
33
Wacol Station Road 8 3 25
18
Warrigal Road 6 2 6
34
Source: provided by TMR
The most prevalent type of reported incidents are ‘near misses’ with pedestrians or motor vehicles.
Calculation of average accident cost
In order to monetise the above accidents, and calculate the cost of an average accident, the following assumptions were made in relation to each type of occurrence.
Boom strikes result in a maintenance cost for the rail operator and are thus considered in the previous section (Section 5 – Costs). However, as per Road and Rail Agency objectives of ‘Zero Harm’ on the Transport Network, a boom gate strike is viewed as a potential accident and a risk which must be eliminated.
135-05823 Release docs.pdf - Page Number: 48 of 85
Relea
sed
unde
r RTI
- DTM
R

Project benefits
Deloitte Access Economics: Cost-Benefit Analysis of Open Level Crossing Elimination 40
Vandalism at open level crossings is included in boom gate replacement/repair costs but not considered to impact upon accident costs.
There is always the small likelihood that technical equipment will fail, despite the best safeguards and systematic maintenance. At level crossings, the failure of OLC equipment is likely to be fatal. Again, OLC elimination may be the best solution to achieve the objectives of a 'Zero Harm' policy and eradicate this risk.
All near misses are considered potential ‘serious injuries’ as the likelihood of surviving a collision with a train (whether a pedestrian or an occupant in a motor vehicle) unscathed is slim.
All collisions with pedestrians or motor vehicles are assumed to result in minor injury (data for this category does not necessarily correspond with serious injury and fatality rates. It may be assumed that some of these occurrences refer to incidents where a motor vehicle has been trapped on an OLC site in the path of a train, but the occupants have managed to flee the vehicle in time).
There exists inadequate information about the nature of the classification ‘Other’ to make detailed assessments as to the costs of these occurrences. However, at 799 occurrences, this category is not insignificant and may increase the total costs at some sites by a large magnitude. The unit cost for property damage, as per Austroads guidelines (see below) has been used as a proxy.
A weighted average of the likelihood of each type of incident has been calculated by applying the following unit costs to estimate the average cost of an accident.
Table 37: Estimated average crash costs by severity category - resource price value in dollars per crash at June 2011
Severity Cost ($) Occurrence
Fatal $2,216,580 per crash
Serious injury $533,202 per crash
Minor injury $23,321 per crash
Average casualty $207,168 per person
PDO $8,490 per vehicle
Source: Austroads (2008)
The weighted average accident cost is based on the historical occurrence of accidents by the relevant unit cost (by accident type). The weighted average accident cost is estimated at $213,949 per accident. The average cost calculation is shown in the table below.
135-05823 Release docs.pdf - Page Number: 49 of 85
Relea
sed
unde
r RTI
- DTM
R

Project benefits
Deloitte Access Economics: Cost-Benefit Analysis of Open Level Crossing Elimination 41
Table 38: Weighted average accidents cost ($2011)
Accident type Number of incidents Cost of incident
Boom strike 192 $5,000
OLC Equipment Failure/Defect 77 $533,202
Near miss 494 $533,202
Collision with person/RV 10 $23,321
Other 562 $8,490
Fatalities 2 $2,216,580
Serious Injuries 2 $533,202
Average cost (weighted)
$235,939
Source: Austroads, TMR and Deloitte calculations
Calculation of average accident rate
In order to calculate total accident costs at each site, the incidence of accidents at the 21 sites must be determined. This is calculated as14:
Average Annualised Daily Traffic movements (AADTs) were derived from traffic counts commissioned by SMEC at each OLC site. BSTM outputs were used to derive a site specific Compound Annual Growth Rate (CAGR) between 2011 and 2021 (See Appendix B for these rates). This rate was also used to back calculate historical AADT volumes at each site. Daily train movements were sourced from historical train timetables provided by Queensland Rail and TMR. Train movements for 2021 were also calculated using BSTM growth rates. The average across all sites has been applied in a uniform manner. The inferred accident rate based on the historical number of accidents is 0.0000019919 per car/train movement. A site specific accident rate has not been adopted in order to capture a network wide accident rate across the observed sites.
Total accident costs
Total accident cost savings at each site are presented below. They are a function of the average accident rate, site specific AADTs, site specific train movements and the average accident cost. The present value of accident savings are shown in the table below.
14 Derived from SKM (2006).
135-05823 Release docs.pdf - Page Number: 50 of 85
Relea
sed
unde
r RTI
- DTM
R

Project benefits
Deloitte Access Economics: Cost-Benefit Analysis of Open Level Crossing Elimination 42
Table 39: Accident savings ($2011) – discounted at 6%
Site Accident savings
($m) Site
Accident savings
($m)
Beams Road, Aspley 0.19
Queensport Road, Murrarie 0.07
Telegraph Road, Bald Hills 0.18
Dawson Pde, Keperra 0.07
Boundary Road, Coopers
Plains
0.17
Pumicestone Road, Caboolture 0.07
Cavendish Road, Coorparoo 0.16
Old Beaudesert Road, Salisbury 0.06
South Pine Road, Alderley 0.13
McKean Street, Caboolture 0.06
Wacol Station Road, Wacol 0.11
Caloundra St, Landsborough 0.05
Stones Road, Sunnybank 0.09
Lindum Road, Lindum 0.05
Warrigal Road, Runcorn 0.09
Bray Road, Mooloolah 0.04
Robinson Road, Geebung 0.08
Barrs Road, Glass House
Mountains
0.03
Nathan Road, Runcorn 0.08
Gympie Street North,
Landsborough
0.02
Beenleigh Road, Kuraby 0.07
Source: Deloitte
6.2 Road User Benefits – Travel Time Travel time savings associated with eliminating open level crossings is generally the primary driver for projects of this nature. Boom gate closures and incidents, particularly in the peak periods when both rail and motor vehicle movements are elevated may cause significant congestion. On sites close to, or intersecting major arterial routes, the delays are further compounded and vehicle queuing may extend into local access roads as well. Grade separated structures allow for improved traffic flows and eliminate the delays associated with incidents. An incident at an OLC site, however minor, causes delays as safety personnel seek to establish the cause of the accident, clear the site and take precautionary measures. A grade separation provides motorists and rail users with shorter and more predictable journey times – a saving which is measured as part of the cost benefit analysis process.
Value of time
Transport economic analysis routinely places a value on travel time saved or lost in order to fully cost the effects of capital investment. Consideration is given to the varying values that different road users place upon their time based upon their Average Weekly Earnings15 and
15 Unpaid private travel time is valued at 40 per cent of average weekly earnings assuming a 38 hour week. Paid private time
for non commercial vehicles (cars and vans) is valued at 135 per cent of average weekly earnings less 7 per cent assumed for payroll – effectively 128 per cent – assuming a 38 hour week.
135-05823 Release docs.pdf - Page Number: 51 of 85
Relea
sed
unde
r RTI
- DTM
R

Project benefits
Deloitte Access Economics: Cost-Benefit Analysis of Open Level Crossing Elimination 43
the average occupancy of each vehicle. Austroads Guidelines16 have been used to derive the following CPI adjusted value of time for road users which are provided in the table below.
Table 40: Value of time ($2011)
Vehicle type $ per hour Description
Private $21.05 based on private car
LCV $46.29 based on average of business car and light truck
HCV $56.78 based on average of medium rigid trucks to B-Double
Source: Austroads (2008)
The following formula has then been used to price the value of travel time savings to society:
Vehicle Hours Travelled (VHT) for the base and project cases have been derived from traffic modelling conducted by SMEC. The discounted value of travel time savings over the evaluation period at each site is highlighted in the table below. Table 41: Travel time savings ($2011) - discounted at 6%
Site TTS ($m)
Site TTS ($m)
Beams Road, Aspley 105.7
Robinson Road, Geebung 2.8
Boundary Road, Coopers Plains 55.6
Queensport Road, Murrarie 2.6
Wacol Station Road, Wacol 48.2
Warrigal Road, Runcorn 2.4
Cavendish Road, Coorparoo 46.5
Pumicestone Road, Caboolture 1.4
Telegraph Road, Bald Hills 25.1
McKean Street, Caboolture 1.1
Nathan Road, Runcorn 11.5
Stones Road, Sunnybank 1.1
Lindum Road, Lindum 10.8
Caloundra St, Landsborough 0.6
Dawson Pde, Keperra 9.7
Bray Road, Mooloolah 0.5
Beenleigh Road, Kuraby 5.5
Barrs Road, Glass House Mountains 0.2
South Pine Road, Alderley 3.2
Gympie Street North, Landsborough 0.1
Old Beaudesert Road, Salisbury 3.1
Source: Deloitte
16 Austroads, 2008. Austroads Guide to Project Evaluation Part 4 – AGPE04-08. Australia. See Appendix A for relevant table.
135-05823 Release docs.pdf - Page Number: 52 of 85
Relea
sed
unde
r RTI
- DTM
R

Project benefits
Deloitte Access Economics: Cost-Benefit Analysis of Open Level Crossing Elimination 44
6.3 Road User Benefits – Vehicle Operating Costs Vehicle operating costs17 reflect the costs (measured as resource costs) incurred in operating vehicles. Fuel prices, lubricating oil prices, tyre prices, vehicle prices and vehicle repair and maintenance costs are all used as inputs when deriving vehicle operating cost parameters. It is important to note that indirect taxes and charges are omitted while the effects of subsidies are included in these calculations18.
Conversely, registration, insurance and licensing charges are not considered a component of vehicle operating costs. These costs are considered ‘fixed’ or ‘sunk’ costs associated with vehicle ownership and, as such, do not vary with distance travelled. It is assumed any vehicle that would be affected by a road improvement would pay these regardless of whether the improvement was realised or not. On this basis, depreciation is also excluded.
At OLC sites, road users experience queuing, and must remain stationary during periods of boom gate closures while trains pass. This interrupts the free flow of traffic, decreases average operating speeds and thereby increases the cost of operating a vehicle, mostly through increased fuel consumption.
Calculation of these vehicle operating costs has been conducted using the following urban model formula from Austroads guidelines19.
Where:
A, B, C, D = model coefficients
V = all day average speed in km/h
The parameter values for the coefficients (for at-grade roads) have also been obtained from Austroads. Different values are applied to Private Vehicles, Light Commercial Vehicles and Heavy Vehicles.
Average speed has been derived from traffic modelling conducted by SMEC. Where available, direct values from the Paramics modelling have been applied. For the remaining sites, an average has been used.
VKT has also been obtained from SMEC Paramics modelling. For the sites which were not subject to the Paramics modelling, SMEC traffic counts have been used to derive VKTs using AADT figures and assuming a one kilometre distance of travel on the approaches to and from the OLC site. A breakdown of AADT values for different vehicle types has been made, as per the assumptions used in the traffic modelling (See Appendix B).
The above values have been annualised for consistency and comparison and the following savings realised (see table below).
17 See Appendix A for the formula used for calculation of vehicle operating costs. 18 This removes the net indirect tax component of prices when determining vehicle operating costs. Refer to Austroads
Internal Report (2008), Update of RUC Unit Values to June 2007 – IR-156/08 for further details. 19 Austroads Internal Report (2008), Update of RUC Unit Values to June 2007 – IR-156/08
135-05823 Release docs.pdf - Page Number: 53 of 85
Relea
sed
unde
r RTI
- DTM
R

Project benefits
Deloitte Access Economics: Cost-Benefit Analysis of Open Level Crossing Elimination 45
Table 42: Vehicle operating cost savings ($2011) - discounted at 6%
Site VOC ($m)
Site VOC ($m)
Beams Road, Aspley 49.9
Queensport Road, Murrarie 5.3
Boundary Road, Coopers Plains 27.4
Beenleigh Road, Kuraby 5.1
Cavendish Road, Coorparoo 27.0
Bray Road, Mooloolah 4.2
Wacol Station Road, Wacol 20.8
Lindum Road, Lindum 4.2
Pumicestone Road, Caboolture 14.0
Old Beaudesert Road, Salisbury 3.4
McKean Street, Caboolture 11.9
Gympie Street North, Landsborough 1.6
Telegraph Road, Bald Hills 10.7
South Pine Road, Alderley 1.1
Barrs Road, Glass House Mountains 10.2
Robinson Road, Geebung 1.0
Caloundra St, Landsborough 8.7
Warrigal Road, Runcorn 0.9
Dawson Pde, Keperra 7.4
Stones Road, Sunnybank 0.4
Nathan Road, Runcorn 5.7
Source: Deloitte
6.4 Rail User Benefits Savings are also realised by rail users through grade separation or elimination of OLC sites. Incidents at OLC sites impose delays upon passengers, and lead to less reliable journey times. These too impose costs to society.
BITRE literature notes that incident related delays are often kept to a minimum, particularly in the case of passenger trains. An average delay time of 20 minutes is assumed for all accidents affecting urban passenger commuter trains and an hour for inter-urban trains20 (ie. Barrs Road, Bray Road, Caloundra St and Gympie St North).
The average value of time for a rail user is assumed to be $11.84, as per ATC Guidelines21.
Passenger loads are also considered to evaluate how many individuals benefit from a reliable train network. Passenger loads for each station were derived from Queensland Rail’s Passenger Load Survey22. Average passenger loads per train are assumed to remain constant, as absolute passenger growth is assumed to be catered for by additional trains, thus negating crowding effects.
Rail user benefits have then been calculated as thus23:
20 BTRE, 2002. Report 108 – Rail Accident Costs in Australia. Canberra. 21 ATC Guidelines, Urban Transport Vol 4 22 Queensland Rail, 2011. Passenger Load Survey Q3 – 2011. Brisbane. (AM Inbound Boardings were examined, for
consistency with other assumptions made in this analysis. Patronage was multiplied by the number of services to determine total loads at each station over the peak. 23 Derived from SKM (2006).
135-05823 Release docs.pdf - Page Number: 54 of 85
Relea
sed
unde
r RTI
- DTM
R

Project benefits
Deloitte Access Economics: Cost-Benefit Analysis of Open Level Crossing Elimination 46
The first line of the equation calculates the likelihood of an incident occurring at a particular OLC site, before applying the delay time and cost across all passengers in a year.
The discounted value of these benefit streams over the evaluation period at each site is highlighted below. Table 43: Incident delay values ($2011) - discounted at 6%
Site Rail delay savings
($m) Site
Rail delay savings
($m)
Beams Road, Aspley 0.00120
Wacol Station Road, Wacol 0.00037
Boundary Road, Coopers
Plains 0.00116 Queensport Road, Murrarie
0.00032
Telegraph Road, Bald Hills 0.00106
Lindum Road, Lindum 0.00021
Cavendish Road,
Coorparoo 0.00102 Dawson Pde, Keperra
0.00018
South Pine Road, Alderley 0.00069
Caloundra St, Landsborough 0.00018
Robinson Road, Geebung 0.00059
Barrs Road, Glass House
Mountains 0.00012
Stones Road, Sunnybank 0.00057
Pumicestone Road,
Caboolture 0.00009
Old Beaudesert Road,
Salisbury 0.00052 McKean Street, Caboolture
0.00008
Warrigal Road, Runcorn 0.00049
Gympie Street North,
Landsborough 0.00007
Nathan Road, Runcorn 0.00047
Bray Road, Mooloolah 0.00005
Beenleigh Road, Kuraby 0.00039
Source: Deloitte
135-05823 Release docs.pdf - Page Number: 55 of 85
Relea
sed
unde
r RTI
- DTM
R

Results
Deloitte Access Economics: Cost-Benefit Analysis of Open Level Crossing Elimination 47
7 Results 7.1 Cost-Benefit Analysis The overall net results from the cost-benefit analysis for each site are presented in the figure below, which are calculated at the 6 per cent discount rate.
For many of the sites, the economic value of benefits produced by the project, notably through travel time savings, are minor in absolute terms, when compared to the cost streams. Nevertheless, Beams Road OLC, Boundary Road OLC and Wacol Station Road OLC produce a BCR above 1.
Figure 1: Benefit Cost Ratio Comparison of OLC Sites (6% discount rate)
Source: Deloitte
135-05823 Release docs.pdf - Page Number: 56 of 85
Relea
sed
unde
r RTI
- DTM
R

Results
Deloitte Access Economics: Cost-Benefit Analysis of Open Level Crossing Elimination 48
A breakdown of the BCRs for each of the sites is shown in the table below. Detailed disaggregation of the CBA results for all sites is provided in Appendix C.
Table 44: Benefit Cost Ratio (6% discount rate)
Site BCR
Site BCR
Beams Road, Aspley 3.61
Lindum Road, Lindum 0.24
Wacol Station Road, Wacol 1.26
Beenleigh Road, Kuraby 0.20
Boundary Road, Coopers Plains 1.02
Queensport Road, Murrarie 0.18
Cavendish Road, Coorparoo 0.75
Old Beaudesert Road, Salisbury 0.16
Telegraph Road, Bald Hills 0.60
Bray Road, Mooloolah 0.15
Caloundra St, Landsborough 0.42
Gympie Street North, Landsborough 0.14
Pumicestone Road, Caboolture 0.29
South Pine Road, Alderley 0.12
Barrs Road, Glass House Mountains 0.28
Warrigal Road, Runcorn 0.11
McKean Street, Caboolture 0.28
Robinson Road, Geebung 0.09
Nathan Road, Runcorn 0.26
Stones Road, Sunnybank 0.09
Dawson Pde, Keperra 0.26
Source: Deloitte
135-05823 Release docs.pdf - Page Number: 57 of 85
Relea
sed
unde
r RTI
- DTM
R

Results
Deloitte Access Economics: Cost-Benefit Analysis of Open Level Crossing Elimination 49
7.2 Sensitivity Testing Sensitivity testing has been conducted to test the robustness of results against some of the modelling assumptions. Sensitivity testing is a relatively simple way to assess the uncertainty around the results of the CBA and the inputs used. For this evaluation, sensitivities have been evaluated on the following variables:
The discount rate
Total costs
Total benefits
The sensitivity testing process is discussed further below.
7.2.1 Recalculation
In order to re-run the initial cost-benefit analysis, the sensitivity analysis involves a change in one input variable at a time to observe the resultant change in the BCR.
Discount rate sensitivities have been conducted at 4 per cent, 7 per cent and 10 per cent, according to the National Guidelines for Transport System Management24. The results of the sensitivity testing of the discount rate are shown in the table below. Notably the BCR for the Cavendish Road OLC improves to above 1 at the 4 per cent discount rate.
24 Australian Transport Council, 2006 National Guidelines for Transport System Management in Australia Volumes 1-4.
135-05823 Release docs.pdf - Page Number: 58 of 85
Relea
sed
unde
r RTI
- DTM
R

Results
Deloitte Access Economics: Cost-Benefit Analysis of Open Level Crossing Elimination 50
Table 45: Sensitivity Test – various discount rates
Site 6% 4% 7% 10%
Barrs Road, Glass House Mountains 0.28 0.42 0.24 0.14
Beams Road, Aspley 3.61 5.07 3.08 1.99
Beenleigh Road, Kuraby 0.20 0.31 0.17 0.10
Boundary Road, Coopers Plains 1.02 1.44 0.86 0.55
Bray Road, Mooloolah 0.15 0.23 0.12 0.07
Caloundra St, Landsborough 0.42 0.60 0.35 0.23
Cavendish Road, Coorparoo 0.75 1.07 0.63 0.40
Dawson Pde, Keperra 0.26 0.39 0.22 0.13
Gympie Street North, Landsborough 0.14 0.22 0.11 0.06
Lindum Road, Lindum 0.24 0.36 0.20 0.12
McKean Street, Caboolture 0.28 0.41 0.23 0.14
Nathan Road, Runcorn 0.26 0.39 0.22 0.13
Old Beaudesert Road, Salisbury 0.16 0.24 0.13 0.07
Pumicestone Road, Caboolture 0.29 0.42 0.24 0.15
Queensport Road, Murrarie 0.18 0.27 0.14 0.08
Robinson Road, Geebung 0.09 0.15 0.07 0.04
South Pine Road, Alderley 0.12 0.20 0.10 0.06
Stones Road, Sunnybank 0.09 0.15 0.07 0.04
Telegraph Road, Bald Hills 0.60 0.87 0.51 0.32
Wacol Station Road, Wacol 1.26 1.79 1.07 0.69
Warrigal Road, Runcorn 0.11 0.17 0.09 0.05
Source: Deloitte
135-05823 Release docs.pdf - Page Number: 59 of 85
Relea
sed
unde
r RTI
- DTM
R

Results
Deloitte Access Economics: Cost-Benefit Analysis of Open Level Crossing Elimination 51
Sensitivities were also conducted on total cost and benefits streams to observe the effect upon the BCR. The sensitivity test results are shown in the table below.
Table 46: Sensitivity Test – costs and benefits
Site Initial
results Costs +20% Costs -20%
Benefits
+20%
Benefits -
20%
Barrs Road, Glass House Mountains 0.28 0.24 0.36 0.34 0.23
Beams Road, Aspley 3.61 3.01 4.51 4.33 2.89
Beenleigh Road, Kuraby 0.20 0.17 0.25 0.24 0.16
Boundary Road, Coopers Plains 1.02 0.85 1.27 1.22 0.81
Bray Road, Mooloolah 0.15 0.12 0.18 0.17 0.12
Caloundra St, Landsborough 0.42 0.35 0.52 0.50 0.33
Cavendish Road, Coorparoo 0.75 0.62 0.93 0.90 0.60
Dawson Pde, Keperra 0.26 0.22 0.33 0.31 0.21
Gympie Street North,
Landsborough 0.14 0.11 0.17 0.16 0.11
Lindum Road, Lindum 0.24 0.20 0.30 0.29 0.19
McKean Street, Caboolture 0.28 0.23 0.34 0.33 0.22
Nathan Road, Runcorn 0.26 0.22 0.33 0.31 0.21
Old Beaudesert Road, Salisbury 0.16 0.13 0.20 0.19 0.13
Pumicestone Road, Caboolture 0.29 0.24 0.36 0.34 0.23
Queensport Road, Murrarie 0.18 0.15 0.22 0.21 0.14
Robinson Road, Geebung 0.09 0.08 0.12 0.11 0.07
South Pine Road, Alderley 0.12 0.10 0.15 0.15 0.10
Stones Road, Sunnybank 0.09 0.08 0.11 0.11 0.07
Telegraph Road, Bald Hills 0.60 0.50 0.75 0.72 0.48
Wacol Station Road, Wacol 1.26 1.05 1.58 1.52 1.01
Warrigal Road, Runcorn 0.11 0.09 0.13 0.13 0.09
Source: Deloitte
135-05823 Release docs.pdf - Page Number: 60 of 85
Relea
sed
unde
r RTI
- DTM
R

Results
Deloitte Access Economics: Cost-Benefit Analysis of Open Level Crossing Elimination 52
7.3 Multi-criteria Analysis While the cost-benefit analysis results measure the competing priority of the OLC sites based purely upon an economic assessment, a further multi-criteria analysis has been applied to the evaluation. This allows a further qualitative assessment to be made as to the significance of different inputs have on the relative priority of the sample sites.
The following criteria were considered:
Economic justification based upon a Benefit Cost Ratio which indicates whether the benefit streams are greater than the costs involved, and that a grade separation is an efficient allocation of resources.
Traffic volumes (AADT) which indicate the relative activity at the site. It is generally recognised that increased traffic volumes are associated with increased incidents at level crossing sites. Further, if a site has high traffic volumes, the associated delay costs and vehicle operating costs from boom gate closures and incidents are borne by a greater proportion of society.
Safety based not only upon the number of incidents at an OLC site, but also the severity of incidents (avoided accident savings). A major driver of the OLC elimination program is the danger that level crossing sites pose to society. Even if the pure economic justification for the project is marginal, there may well be a rationale for grade separation based upon community service obligation motivations of TMR.
In order to determine a ranking based upon these criteria, a value has been awarded to each BCR, AADT and accident saving value. The highest value in each criterion has been awarded a score of 4 (Very high priority), while values in the third quartile have been awarded a score of 3 (High priority). Scores of 2 and 1 have been awarded to Medium and Low priority sites, respectively, based on the quartiles. The overall priority for the site is based upon a summation of these values.
All criteria (economic, traffic and safety) have been given an equal weight.
The results of the analysis are presented in the table overleaf.
135-05823 Release docs.pdf - Page Number: 61 of 85
Relea
sed
unde
r RTI
- DTM
R
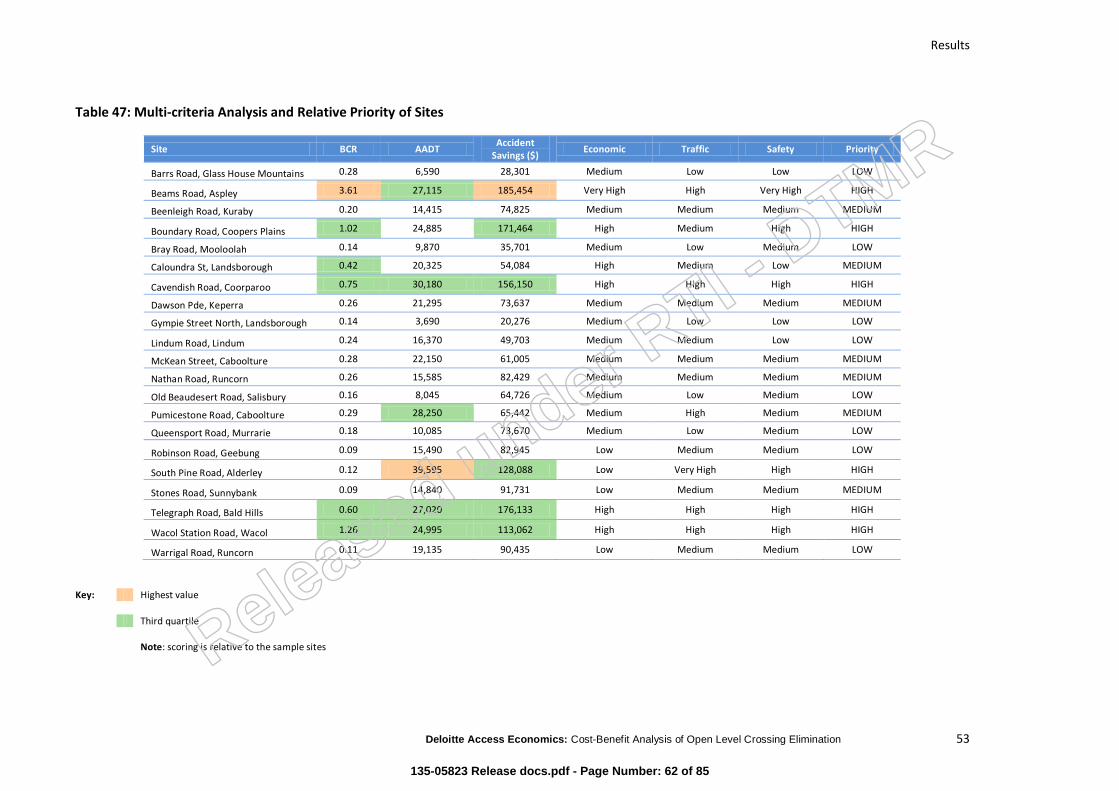
Results
Deloitte Access Economics: Cost-Benefit Analysis of Open Level Crossing Elimination 53
Table 47: Multi-criteria Analysis and Relative Priority of Sites
Key: Highest value
Third quartile
Note: scoring is relative to the sample sites
Site BCR AADT Accident
Savings ($) Economic Traffic Safety Priority
Barrs Road, Glass House Mountains 0.28 6,590 28,301 Medium Low Low LOW
Beams Road, Aspley 3.61 27,115 185,454 Very High High Very High HIGH
Beenleigh Road, Kuraby 0.20 14,415 74,825 Medium Medium Medium MEDIUM
Boundary Road, Coopers Plains 1.02 24,885 171,464 High Medium High HIGH
Bray Road, Mooloolah 0.14 9,870 35,701 Medium Low Medium LOW
Caloundra St, Landsborough 0.42 20,325 54,084 High Medium Low MEDIUM
Cavendish Road, Coorparoo 0.75 30,180 156,150 High High High HIGH
Dawson Pde, Keperra 0.26 21,295 73,637 Medium Medium Medium MEDIUM
Gympie Street North, Landsborough 0.14 3,690 20,276 Medium Low Low LOW
Lindum Road, Lindum 0.24 16,370 49,703 Medium Medium Low LOW
McKean Street, Caboolture 0.28 22,150 61,005 Medium Medium Medium MEDIUM
Nathan Road, Runcorn 0.26 15,585 82,429 Medium Medium Medium MEDIUM
Old Beaudesert Road, Salisbury 0.16 8,045 64,726 Medium Low Medium LOW
Pumicestone Road, Caboolture 0.29 28,250 65,442 Medium High Medium MEDIUM
Queensport Road, Murrarie 0.18 10,085 73,670 Medium Low Medium LOW
Robinson Road, Geebung 0.09 15,490 82,945 Low Medium Medium LOW
South Pine Road, Alderley 0.12 39,595 128,088 Low Very High High HIGH
Stones Road, Sunnybank 0.09 14,840 91,731 Low Medium Medium MEDIUM
Telegraph Road, Bald Hills 0.60 27,020 176,133 High High High HIGH
Wacol Station Road, Wacol 1.26 24,995 113,062 High High High HIGH
Warrigal Road, Runcorn 0.11 19,135 90,435 Low Medium Medium LOW
135-05823 Release docs.pdf - Page Number: 62 of 85
Released under RTI -
DTMR

Recommendations
8 Recommendations
8.1 Conclusions Twenty one open level crossing sites have been examined as part of this analysis in order to determine the priority and justification for their elimination.
Traffic surveying was conducted at each site to observe accurate, site specific traffic flows, and boom closures. Traffic modelling, using the Paramics model was also conducted by SMEC.
This work developed key inputs for use in the economic cost benefit analysis of the sites. The total cost and benefits streams over a 30 year evaluation period were calculated in order to determine the economic worth of each proposed grade separation. Finally, a multi-criteria approach was adopted to prioritise the sites as high, medium or low.
The sites that are evaluated as high priority include:
Beams Road, Aspley
Boundary Road, Coopers Plains
Telegraph Road, Bald Hills
Cavendish Road, Coorparoo
South Pine Road, Alderley
Wacol Station Road, Wacol
These findings should be interpreted on a relative scale. For example, those sites considered of high priority are of higher priority relative to the other sites considered as part of this study.
It is suggested that the sites awarded a high priority be subject to further investigation such as detailed business cases and comprehensive engineering estimates of likely construction costs. These candidate projects are more likely to yield better cost-benefit analysis results at the business case stage, based on the assumptions adopted in this report, relative to the other sites considered in this study.
135-05823 Release docs.pdf - Page Number: 63 of 85
Relea
sed
unde
r RTI
- DTM
R

Recommendations
Table 48: Summary of Results
Site Priority
Site Priority
Beams Road, Aspley HIGH
Nathan Road, Runcorn MEDIUM
Cavendish Road, Coorparoo HIGH
Bray Road, Mooloolah LOW
Telegraph Road, Bald Hills HIGH
Lindum Road, Lindum LOW
Wacol Station Road, Wacol HIGH
Old Beaudesert Road, Salisbury LOW
Boundary Road, Coopers Plains HIGH
Queensport Road, Murrarie LOW
South Pine Road, Alderley HIGH
Robinson Road, Geebung LOW
Pumicestone Road, Caboolture MEDIUM
Stones Road, Sunnybank LOW
Beenleigh Road, Kuraby MEDIUM
Warrigal Road, Runcorn LOW
Caloundra St, Landsborough MEDIUM
Barrs Road, Glass House Mountains LOW
Dawson Pde, Keperra MEDIUM
Gympie Street North, Landsborough LOW
McKean Street, Caboolture MEDIUM
Source: Deloitte (Note: scoring is in relative terms to the sample sites)
135-05823 Release docs.pdf - Page Number: 64 of 85
Relea
sed
unde
r RTI
- DTM
R
Reference List
9 Reference List Austroads (2008), “Guide to Project Evaluation Part 4: Project Evaluation Data” Third edition November 2008, Austroads Project No. TP1349, Austroads Publication No. AGPE04/08. Australian Bureau of Statistics. 2011. Consumer Price Index, Australia, March 2011. 6401.0 Australian Bureau of Statistics. 2011. Producer Price Indexes, Australia, March 2011. 6427.0 Australian Transport Council. 2006. National Guidelines for Transport System Management in Australia Volumes 1-5. Austroads, 2008. Guide to Project Evaluation Part 4: Project Evaluation Data, Austroads Project No. TP1349, Austroads Publication No. AGPE04/08. Brisbane City Council, ARUP. 2009. Telegraph Road OLC Elimination Project, Business Case Report. Brisbane City Council. 2008. Robinson Road Open Level Crossing Elimination Project – Draft Business Case. Bureau of Transport and Regional Economics. 2002. Rail Accident Costs in Australia. Report 108. Department of Transport and Main Roads. 2011. Cost Benefit Analysis Manual. Department of Transport and Main Roads. 2010. Queensland Level Crossing Safety Strategy 2010-2014. Infrastructure Australia. 2010. Better Infrastructure Decision Making Guidelines. Infrastructure Australia. 2008. Outline of Infrastructure Australia's Prioritisation Methodology. Keay, K., Simmonds, I. 2005. The association of rainfall and other weather variables with road traffic volume in Melbourne, Australia. Accident Analysis and Prevention. 37. 109-124. Knapp, K., Smithson, L. 2000. Winter storm even volume impact analysis using multiple-source archived monitoring. Transportation Research Record. 1700. 10-16. Premier of Queensland, 2012. State and BCC working together to deliver for Brisbane. Media release – 4 May 2012. http://statements.cabinet.qld.gov.au/MMS/StatementDisplaySingle.aspx?id=79144
Queensland Government. 2010. Project Assurance Framework.
135-05823 Release docs.pdf - Page Number: 65 of 85
Relea
sed
unde
r RTI
- DTM
R

Reference List
Queensland Government. 2010. Project Assurance Framework Supplementary Guidance – Cost Benefit Analysis Guidelines. Queensland Rail. 2011. Passenger Load Survey Q3 – 2011. Queensland Rail. 2011. What would you miss? http://www.whatwouldyoumiss.com.au/index.php Queensland Treasury. 2006. Cost Benefit Analysis Guidelines: Achieving Value for Money in Public Infrastructure and Service Delivery. Roads and Traffic Authority, 2009. RTA Economic Analysis Manual – Appendix B: Economic Parameters for 2009. SKM Economics. 1998. Assessment of the Justification of Open Level Crossing Elimination, Phase 1: OLC Elimination in the CityTrain Network. SKM Economics. 2006. Open Level Crossing Elimination Report. Smith, B., Byrne, K. et al. 2004. An Investigation into the Impact of Rainfall on Freeway Traffic Flow. Proceedings of the 83rd Annual Meeting of the Transportation Research Board. Taylor, J., Crawford, R. Prioritising Road-Rail Level Crossings for Grade Separation Using a Multi-Criteria Approach.
135-05823 Release docs.pdf - Page Number: 66 of 85
Relea
sed
unde
r RTI
- DTM
R

Reference List
Appendix A Urban VOC Model The following details are extracted from the Austroads Internal Report (2008), Update of RUC Unit Values to June 2007 – IR-156/08. In the model, all parameter values have been inflated to reflect 2011 prices. The formula for calculating vehicle operating costs is as follows:
The associated vehicle operating cost model parameters are detailed in the below table.
Parameter values for at-grade roads vehicle operating costs models – cents/km
135-05823 Release docs.pdf - Page Number: 67 of 85
Relea
sed
unde
r RTI
- DTM
R

Traffic modelling assumptions
Appendix B Traffic modelling assumptions Traffic Modelling Assumptions
In line with the traffic surveys commissioned by SMEC, the following breakdown has been used for Private Vehicles, Light Commercial Vehicles and Heavy Vehicles:
6% constant rate of light commercial vehicles at each site
Site specific rate of heavy vehicles (refer to table below)
Remainder of vehicles assumed to be private vehicles
Site Rate
Barrs Road, Glass House Mountains 11.2%
Beams Road, Aspley 4.3%
Beenleigh Road, Kuraby 7.0%
Boundary Road, Coopers Plains 11.7%
Bray Road, Mooloolah 4.3%
Caloundra St, Landsborough 4.9%
Cavendish Road, Coorparoo 3.2%
Dawson Pde, Keperra 2.4%
Gympie Street North, Landsborough 3.3%
Lindum Road, Lindum 4.5%
McKean Street, Caboolture 4.7%
Nathan Road, Runcorn 2.0%
Old Beaudesert Road, Salisbury 2.7%
Pumicestone Road, Caboolture 4.9%
Queensport Road, Murrarie 11.4%
Robinson Road, Geebung 6.7%
South Pine Road, Alderley 3.9%
Stones Road, Sunnybank 0.4%
Telegraph Road, Bald Hills 5.8%
Wacol Station Road, Wacol 4.4%
135-05823 Release docs.pdf - Page Number: 68 of 85
Relea
sed
unde
r RTI
- DTM
R

Traffic modelling assumptions
Site Rate
Warrigal Road, Runcorn 4.0%
Source: SMEC
Growth Rates
The following compound annual growth rates, derived from TMR’s Strategic Transport Model of Brisbane (BSTM) were applied to inflate traffic volumes. Where data was not available for certain sites, a 2% growth rate, as per the traffic modelling, was used.
Site Traffic Growth
Barrs Road, Glass House Mountains 2.00%
Beams Road, Aspley 7.43%
Beenleigh Road, Kuraby 0.20%
Boundary Road, Coopers Plains 7.42%
Bray Road, Mooloolah 2.00%
Caloundra St, Landsborough 2.00%
Cavendish Road, Coorparoo 6.04%
Dawson Pde, Keperra 0.00%
Gympie Street North, Landsborough 2.00%
Lindum Road, Lindum -5.00%
McKean Street, Caboolture 4.31%
Nathan Road, Runcorn 0.36%
Old Beaudesert Road, Salisbury 2.00%
Pumicestone Road, Caboolture 3.43%
Queensport Road, Murrarie 4.14%
Robinson Road, Geebung 0.00%
South Pine Road, Alderley 2.13%
Stones Road, Sunnybank 2.33%
Telegraph Road, Bald Hills 6.62%
Wacol Station Road, Wacol 2.77%
Warrigal Road, Runcorn 0.00%
Source: TMR
135-05823 Release docs.pdf - Page Number: 69 of 85
Relea
sed
unde
r RTI
- DTM
R

Traffic modelling assumptions
Paramics modelling outputs
VHT Base Case Project Case
Private vehicles 2011 2021 2011 2021
Beams Road, Aspley 70 1107 58 140
Boundary Road, Coopers Plains 77 757 42 332
Cavendish Road, Coorparoo 55 763 46 324
Lindum Road, Lindum 28 121 16 21
Robinson Road, Geebung 41 61 26 34
South Pine Road, Alderley 37 66 26 34
Stones Road, Sunnybank 23 30 14 17
Telegraph Road, Bald Hills 31 370 31 149
Wacol Station Road, Wacol 48 488 33 47
Warrigal Road, Runcorn 44 69 37 46
LCV 2011 2021 2011 2021
Beams Road, Aspley 5 74 4 9
Boundary Road, Coopers Plains 6 55 3 24
Cavendish Road, Coorparoo 4 50 3 21
Lindum Road, Lindum 2 8 1 1
Robinson Road, Geebung 3 4 2 2
South Pine Road, Alderley 2 4 2 2
Stones Road, Sunnybank 2 2 1 1
Telegraph Road, Bald Hills 2 25 2 10
Wacol Station Road, Wacol 3 33 2 3
Warrigal Road, Runcorn 3 5 2 3
HCV 2011 2021 2011 2021
Beams Road, Aspley 3 53 3 7
Boundary Road, Coopers Plains 11 108 6 47
Cavendish Road, Coorparoo 2 27 2 11
Lindum Road, Lindum 1 6 1 1
135-05823 Release docs.pdf - Page Number: 70 of 85
Relea
sed
unde
r RTI
- DTM
R

Traffic modelling assumptions
VHT Base Case Project Case
Robinson Road, Geebung 3 5 2 3
South Pine Road, Alderley 2 3 1 1
Stones Road, Sunnybank 0 0 0 0
Telegraph Road, Bald Hills 2 24 2 10
Wacol Station Road, Wacol 2 24 2 2
Warrigal Road, Runcorn 2 3 2 2
VKT Base Case Project Case
Private vehicles 2011 2021 2011 2021
Beams Road, Aspley 2986 5120 2993 5943
Boundary Road, Coopers Plains 1304 2245 1317 2686
Cavendish Road, Coorparoo 1514 2096 1514 2586
Lindum Road, Lindum 772 943 772 933
Robinson Road, Geebung 966 1160 968 1164
South Pine Road, Alderley 1478 1884 1477 1881
Stones Road, Sunnybank 666 830 671 828
Telegraph Road, Bald Hills 1635 2877 1635 3025
Wacol Station Road, Wacol 1020 1241 1021 1322
Warrigal Road, Runcorn 1387 1689 1385 1687
LCV 2011 2021 2011 2021
Beams Road, Aspley 200 342 200 397
Boundary Road, Coopers Plains 95 164 96 196
Cavendish Road, Coorparoo 100 138 100 171
Lindum Road, Lindum 52 63 52 63
Robinson Road, Geebung 66 80 67 80
South Pine Road, Alderley 98 125 98 125
Stones Road, Sunnybank 43 53 43 53
Telegraph Road, Bald Hills 111 196 111 206
Wacol Station Road, Wacol 68 83 68 89
135-05823 Release docs.pdf - Page Number: 71 of 85
Relea
sed
unde
r RTI
- DTM
R

Traffic modelling assumptions
VKT Base Case Project Case
Warrigal Road, Runcorn 92 113 92 112
HCV 2011 2021 2011 2021
Beams Road, Aspley 142 244 143 284
Boundary Road, Coopers Plains 185 319 187 382
Cavendish Road, Coorparoo 53 73 53 90
Lindum Road, Lindum 39 48 39 47
Robinson Road, Geebung 75 90 75 90
South Pine Road, Alderley 64 82 64 82
Stones Road, Sunnybank 2 3 3 3
Telegraph Road, Bald Hills 108 190 108 200
Wacol Station Road, Wacol 50 61 50 65
Warrigal Road, Runcorn 62 75 62 75
Operating Speed Base Case Project Case
Private vehicles 2011 2021 2011 2021
Beams Road, Aspley 43 5 52 42
Boundary Road, Coopers Plains 17 3 31 8
Cavendish Road, Coorparoo 28 3 33 8
Lindum Road, Lindum 27 8 47 44
Robinson Road, Geebung 24 19 37 34
South Pine Road, Alderley 40 29 58 55
Stones Road, Sunnybank 28 28 50 49
Telegraph Road, Bald Hills 52 8 54 20
Wacol Station Road, Wacol 21 3 31 28
Warrigal Road, Runcorn 31 25 38 37
LCV 2011 2021 2011 2021
Beams Road, Aspley 43 5 52 42
Boundary Road, Coopers Plains 17 3 31 8
135-05823 Release docs.pdf - Page Number: 72 of 85
Relea
sed
unde
r RTI
- DTM
R

Traffic modelling assumptions
Operating Speed Base Case Project Case
Cavendish Road, Coorparoo 28 3 33 8
Lindum Road, Lindum 27 8 47 44
Robinson Road, Geebung 24 19 37 34
South Pine Road, Alderley 40 29 58 55
Stones Road, Sunnybank 28 28 50 49
Telegraph Road, Bald Hills 52 8 54 20
Wacol Station Road, Wacol 21 3 31 28
Warrigal Road, Runcorn 31 25 38 37
HCV 2011 2021 2011 2021
Beams Road, Aspley 43 5 52 42
Boundary Road, Coopers Plains 17 3 31 8
Cavendish Road, Coorparoo 28 3 33 8
Lindum Road, Lindum 27 8 47 44
Robinson Road, Geebung 24 19 37 34
South Pine Road, Alderley 40 29 58 55
Stones Road, Sunnybank 28 28 50 49
Telegraph Road, Bald Hills 52 8 54 20
Wacol Station Road, Wacol 21 3 31 28
Warrigal Road, Runcorn 31 25 38 37
135-05823 Release docs.pdf - Page Number: 73 of 85
Relea
sed
unde
r RTI
- DTM
R

Disaggregated CBA Results
Appendix C Disaggregated CBA Results Barrs Road, Glass House Mountains
CBA Results $2011 m
Total Costs 48.7
Capital Costs 48.6
Maintenance 0.1
Total Benefits 13.9
Travel Time Savings 0.2
VOC Savings 10.2
Accident Savings 0.0
Rail User Benefits 0.0
Avoided OLC Costs 0.2
Residual value 3.3
Net Present Value -35
Benefit Cost Ratio 0.28
Note: CBA results at 6% discount rate and numbers in table may not add due to rounding.
135-05823 Release docs.pdf - Page Number: 74 of 85
Relea
sed
unde
r RTI
- DTM
R

Disaggregated CBA Results
Beams Road, Aspley
CBA Results $2011 m
Total Costs 44.1
Capital Costs 44.0
Maintenance 0.1
Total Benefits 159.0
Travel Time Savings 105.7
VOC Savings 49.9
Accident Savings 0.2
Rail User Benefits 0.0
Avoided OLC Costs 0.2
Residual value 3.0
Net Present Value 114.9
Benefit Cost Ratio 3.61
Note: CBA results at 6% discount rate and numbers in table may not add due to rounding.
Beenleigh Road, Kuraby
CBA Results $2011 m
Total Costs 83.4
Capital Costs 83.3
Maintenance 0.1
Total Benefits 16.8
Travel Time Savings 5.5
VOC Savings 5.1
Accident Savings 0.1
Rail User Benefits 0.0
Avoided OLC Costs 0.5
Residual value 5.6
Net Present Value -66.6
Benefit Cost Ratio 0.20
Note: CBA results at 6% discount rate and numbers in table may not add due to rounding.
135-05823 Release docs.pdf - Page Number: 75 of 85
Relea
sed
unde
r RTI
- DTM
R
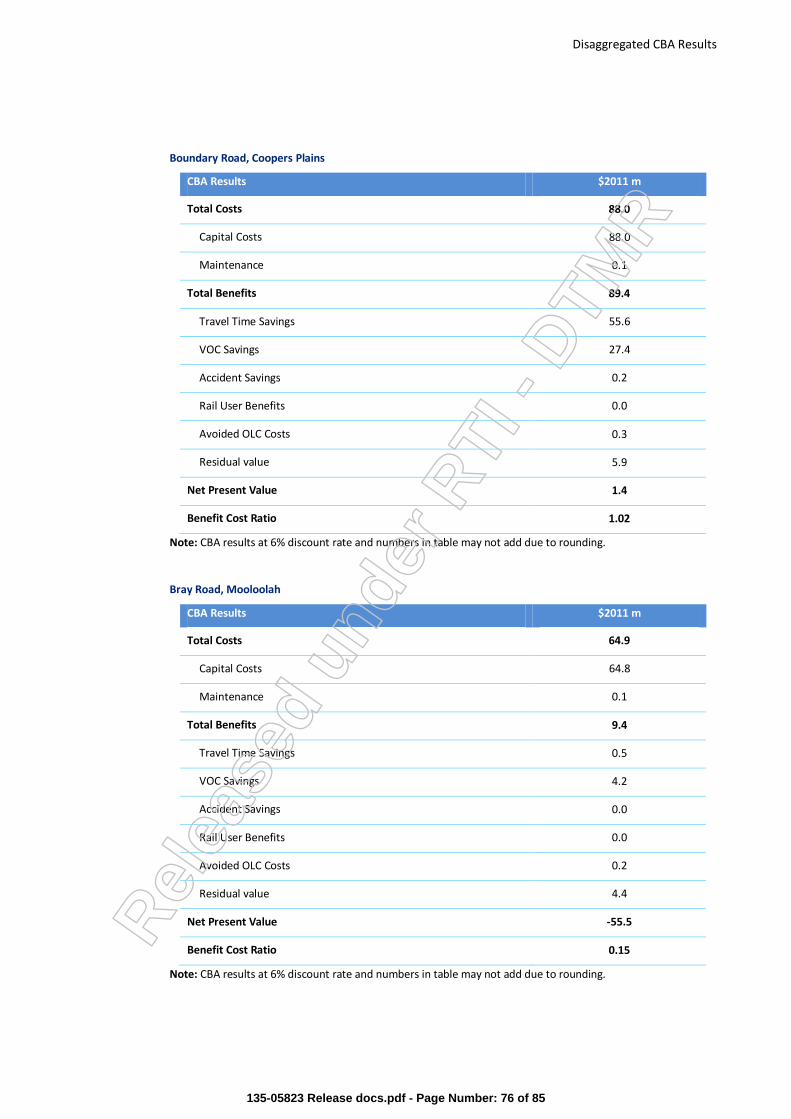
Disaggregated CBA Results
Boundary Road, Coopers Plains
CBA Results $2011 m
Total Costs 88.0
Capital Costs 88.0
Maintenance 0.1
Total Benefits 89.4
Travel Time Savings 55.6
VOC Savings 27.4
Accident Savings 0.2
Rail User Benefits 0.0
Avoided OLC Costs 0.3
Residual value 5.9
Net Present Value 1.4
Benefit Cost Ratio 1.02
Note: CBA results at 6% discount rate and numbers in table may not add due to rounding.
Bray Road, Mooloolah
CBA Results $2011 m
Total Costs 64.9
Capital Costs 64.8
Maintenance 0.1
Total Benefits 9.4
Travel Time Savings 0.5
VOC Savings 4.2
Accident Savings 0.0
Rail User Benefits 0.0
Avoided OLC Costs 0.2
Residual value 4.4
Net Present Value -55.5
Benefit Cost Ratio 0.15
Note: CBA results at 6% discount rate and numbers in table may not add due to rounding.
135-05823 Release docs.pdf - Page Number: 76 of 85
Relea
sed
unde
r RTI
- DTM
R

Disaggregated CBA Results
Caloundra St, Landsborough
CBA Results $2011 m
Total Costs 27.8
Capital Costs 27.8
Maintenance 0.1
Total Benefits 11.6
Travel Time Savings 0.6
VOC Savings 8.7
Accident Savings 0.1
Rail User Benefits 0.0
Avoided OLC Costs 0.4
Residual value 1.9
Net Present Value -16.2
Benefit Cost Ratio 0.42
Note: CBA results at 6% discount rate and numbers in table may not add due to rounding.
Cavendish Road, Coorparoo
CBA Results $2011 m
Total Costs 108.9
Capital Costs 108.8
Maintenance 0.1
Total Benefits 81.3
Travel Time Savings 46.5
VOC Savings 27.0
Accident Savings 0.2
Rail User Benefits 0.0
Avoided OLC Costs 0.3
Residual value 7.4
Net Present Value -27.6
Benefit Cost Ratio 0.75
Note: CBA results at 6% discount rate and numbers in table may not add due to rounding.
135-05823 Release docs.pdf - Page Number: 77 of 85
Relea
sed
unde
r RTI
- DTM
R

Disaggregated CBA Results
Dawson Pde, Keperra
CBA Results $2011 m
Total Costs 90.3
Capital Costs 90.3
Maintenance 0.1
Total Benefits 23.5
Travel Time Savings 9.7
VOC Savings 7.4
Accident Savings 0.1
Rail User Benefits 0.0
Avoided OLC Costs 0.2
Residual value 6.1
Net Present Value -66.8
Benefit Cost Ratio 0.26
Note: CBA results at 6% discount rate and numbers in table may not add due to rounding.
Gympie Street North, Landsborough
CBA Results $2011 m
Total Costs 27.8
Capital Costs 27.8
Maintenance 0.1
Total Benefits 3.8
Travel Time Savings 0.1
VOC Savings 1.6
Accident Savings 0.0
Rail User Benefits 0.0
Avoided OLC Costs 0.2
Residual value 1.9
Net Present Value -24.0
Benefit Cost Ratio 0.14
Note: CBA results at 6% discount rate and numbers in table may not add due to rounding.
135-05823 Release docs.pdf - Page Number: 78 of 85
Relea
sed
unde
r RTI
- DTM
R

Disaggregated CBA Results
Lindum Road, Lindum
CBA Results $2011 m
Total Costs 88.0
Capital Costs 88.0
Maintenance 0.1
Total Benefits 21.2
Travel Time Savings 10.8
VOC Savings 4.2
Accident Savings 0.0
Rail User Benefits 0.0
Avoided OLC Costs 0.2
Residual value 5.9
Net Present Value -66.8
Benefit Cost Ratio 0.24
Note: CBA results at 6% discount rate and numbers in table may not add due to rounding.
McKean Street, Caboolture
CBA Results $2011 m
Total Costs 64.9
Capital Costs 64.8
Maintenance 0.1
Total Benefits 17.9
Travel Time Savings 1.1
VOC Savings 11.9
Accident Savings 0.1
Rail User Benefits 0.0
Avoided OLC Costs 0.3
Residual value 4.4
Net Present Value -47.0
Benefit Cost Ratio 0.28
Note: CBA results at 6% discount rate and numbers in table may not add due to rounding.
135-05823 Release docs.pdf - Page Number: 79 of 85
Relea
sed
unde
r RTI
- DTM
R

Disaggregated CBA Results
Nathan Road, Runcorn
CBA Results $2011 m
Total Costs 90.3
Capital Costs 90.3
Maintenance 0.1
Total Benefits 23.5
Travel Time Savings 11.5
VOC Savings 5.7
Accident Savings 0.1
Rail User Benefits 0.0
Avoided OLC Costs 0.2
Residual value 6.1
Net Present Value -66.8
Benefit Cost Ratio 0.26
Note: CBA results at 6% discount rate and numbers in table may not add due to rounding.
Old Beaudesert Road, Salisbury
CBA Results $2011 m
Total Costs 76.4
Capital Costs 76.3
Maintenance 0.1
Total Benefits 12.0
Travel Time Savings 3.1
VOC Savings 3.4
Accident Savings 0.1
Rail User Benefits 0.0
Avoided OLC Costs 0.3
Residual value 5.2
Net Present Value -64.4
Benefit Cost Ratio 0.16
Note: CBA results at 6% discount rate and numbers in table may not add due to rounding.
135-05823 Release docs.pdf - Page Number: 80 of 85
Relea
sed
unde
r RTI
- DTM
R

Disaggregated CBA Results
Pumicestone Road, Caboolture
CBA Results $2011 m
Total Costs 71.8
Capital Costs 71.8
Maintenance 0.1
Total Benefits 20.6
Travel Time Savings 1.4
VOC Savings 14.0
Accident Savings 0.1
Rail User Benefits 0.0
Avoided OLC Costs 0.3
Residual value 4.9
Net Present Value -51.3
Benefit Cost Ratio 0.29
Note: CBA results at 6% discount rate and numbers in table may not add due to rounding.
Queensport Road, Murrarie
CBA Results $2011 m
Total Costs 76.4
Capital Costs 76.3
Maintenance 0.1
Total Benefits 13.5
Travel Time Savings 2.6
VOC Savings 5.3
Accident Savings 0.1
Rail User Benefits 0.0
Avoided OLC Costs 0.3
Residual value 5.2
Net Present Value -62.9
Benefit Cost Ratio 0.18
Note: CBA results at 6% discount rate and numbers in table may not add due to rounding.
135-05823 Release docs.pdf - Page Number: 81 of 85
Relea
sed
unde
r RTI
- DTM
R

Disaggregated CBA Results
Robinson Road, Geebung
CBA Results $2011 m
Total Costs 173.3
Capital Costs 173.2
Maintenance 0.1
Total Benefits 16.0
Travel Time Savings 2.8
VOC Savings 1.0
Accident Savings 0.1
Rail User Benefits 0.0
Avoided OLC Costs 0.4
Residual value 11.7
Net Present Value -157.3
Benefit Cost Ratio 0.09
Note: CBA results at 6% discount rate and numbers in table may not add due to rounding.
South Pine Road, Alderley
CBA Results $2011 m
Total Costs 85.7
Capital Costs 85.6
Maintenance 0.1
Total Benefits 10.6
Travel Time Savings 3.2
VOC Savings 1.1
Accident Savings 0.1
Rail User Benefits 0.0
Avoided OLC Costs 0.3
Residual value 5.8
Net Present Value -75.1
Benefit Cost Ratio 0.12
Note: CBA results at 6% discount rate and numbers in table may not add due to rounding.
135-05823 Release docs.pdf - Page Number: 82 of 85
Relea
sed
unde
r RTI
- DTM
R

Disaggregated CBA Results
Stones Road, Sunnybank
CBA Results $2011 m
Total Costs 76.4
Capital Costs 76.3
Maintenance 0.1
Total Benefits 6.9
Travel Time Savings 1.1
VOC Savings 0.4
Accident Savings 0.1
Rail User Benefits 0.0
Avoided OLC Costs 0.2
Residual value 5.2
Net Present Value -69.5
Benefit Cost Ratio 0.09
Note: CBA results at 6% discount rate and numbers in table may not add due to rounding.
Telegraph Road, Bald Hills
CBA Results $2011 m
Total Costs 68.8
Capital Costs 68.8
Maintenance 0.1
Total Benefits 41.5
Travel Time Savings 25.1
VOC Savings 10.7
Accident Savings 0.2
Rail User Benefits 0.0
Avoided OLC Costs 0.9
Residual value 4.7
Net Present Value -27.4
Benefit Cost Ratio 0.60
Note: CBA results at 6% discount rate and numbers in table may not add due to rounding.
135-05823 Release docs.pdf - Page Number: 83 of 85
Relea
sed
unde
r RTI
- DTM
R

Disaggregated CBA Results
Wacol Station Road, Wacol
CBA Results $2011 m
Total Costs 57.9
Capital Costs 57.9
Maintenance 0.1
Total Benefits 73.3
Travel Time Savings 48.2
VOC Savings 20.8
Accident Savings 0.1
Rail User Benefits 0.0
Avoided OLC Costs 0.3
Residual value 3.9
Net Present Value 15.3
Benefit Cost Ratio 1.26
Note: CBA results at 6% discount rate and numbers in table may not add due to rounding.
Warrigal Road, Runcorn
CBA Results $2011 m
Total Costs 90.3
Capital Costs 90.3
Maintenance 0.1
Total Benefits 9.7
Travel Time Savings 2.4
VOC Savings 0.9
Accident Savings 0.1
Rail User Benefits 0.0
Avoided OLC Costs 0.3
Residual value 6.1
Net Present Value -80.7
Benefit Cost Ratio 0.11
Note: CBA results at 6% discount rate and numbers in table may not add due to rounding.
135-05823 Release docs.pdf - Page Number: 84 of 85
Relea
sed
unde
r RTI
- DTM
R

Disaggregated CBA Results
www.deloitte.com.au
135-05823 Release docs.pdf - Page Number: 85 of 85
Relea
sed
unde
r RTI
- DTM
R