Embed Size (px)
Citation preview

NAFTA@10
John M. Curtis and Aaron Sydor Editors

Foreword
The research assembled in this volume has been undertaken by academic and government researchers writing in a personal capacity. Foreign Affairs and International Trade Canada managed and assembled this volume with the objective of contributing to, and encouraging, debate on an issue of major importance to the Department, to the Government of Canada, and to Canadians. The views expressed in this volume, however, are those of authors and do not reflect the views of the departments represented in this volume or of the Government of Canada.
© Minister of Public Works and Government Services Canada 2006
Cat: IT5-1/2006E
ISBN: 0-662-43036-0
(Publié également en Français)

Stay the Course or Find a New Path? Canada's Reliance on the U.S.
as an Export Market Eugene Beaulieu Herb Emery
The University of Calgary1 The University of Calgary
&
Introduction Canada is currently at a cross-road in terms of the direction to take with
respect to international trade policy. After over fifteen years of increased market integration through the Canada-U.S. Free Trade Agreement (CUSTA) and the North American Free Trade Agreement (NAFTA) the Canadian economy is more closely integrated with the United States than at any time in history. At the same time that the North American economy has become more integrated, tremendous changes have occurred outside North America as economic growth and international trade has expanded considerably in the developing world. Concern over trade nce with the United States, and the sense that Canadian firms are missinfor goverAmerica. benefit froextend maregions ofCanada sim
Indirections internationshould cosector witagenda toargued, ateconomy that the ereasons. Oin the Uguaranteeicompetitiofirms. Themarket.
1 Part of thiCarleton UDr. Beaulie
depende
g out on profitable markets outside of North America, has led to calls nment policy to encourage Canadian firms to look beyond North The important policy questions are thus: whether or not Canada would m deeper integration with the United States; whether Canada should rket integration on a regional basis; or pursue integration with other the world. Some have argued for a multi-facet approach whereby ultaneously pursues all of these objectives. part, the increased dependence on the U.S. is the result of policy taken in the 1980s – a time when Canada was at another cross-road in al trade policy. The policy debate at the time was whether Canadantinue to engage in incremental trade policy and negotiate sector-by-h the United States or should Canada pursue an ambitious trade policy increase and lock-in economic ties with the United States? Some that time, that Canada was already too closely tied to the American (receiving approximately 70 percent of Canadian exports) and argued xtent of the dependence was not healthy for economic and political thers argued that Canada had no choice – it had to secure market access .S. given the rise in U.S. protectionism. Still others argued that ng and securing access to the American market and increasing n by lowering import barriers would lead to more competitive Canadian se firms, it was argued, would thus be more successful in the world
249
s research was conducted while Eugene Beaulieu was a visiting professor at niversity and was the Norman Robertson Fellow at International Trade Canada. u acknowledges financial support from SSHRC.
250
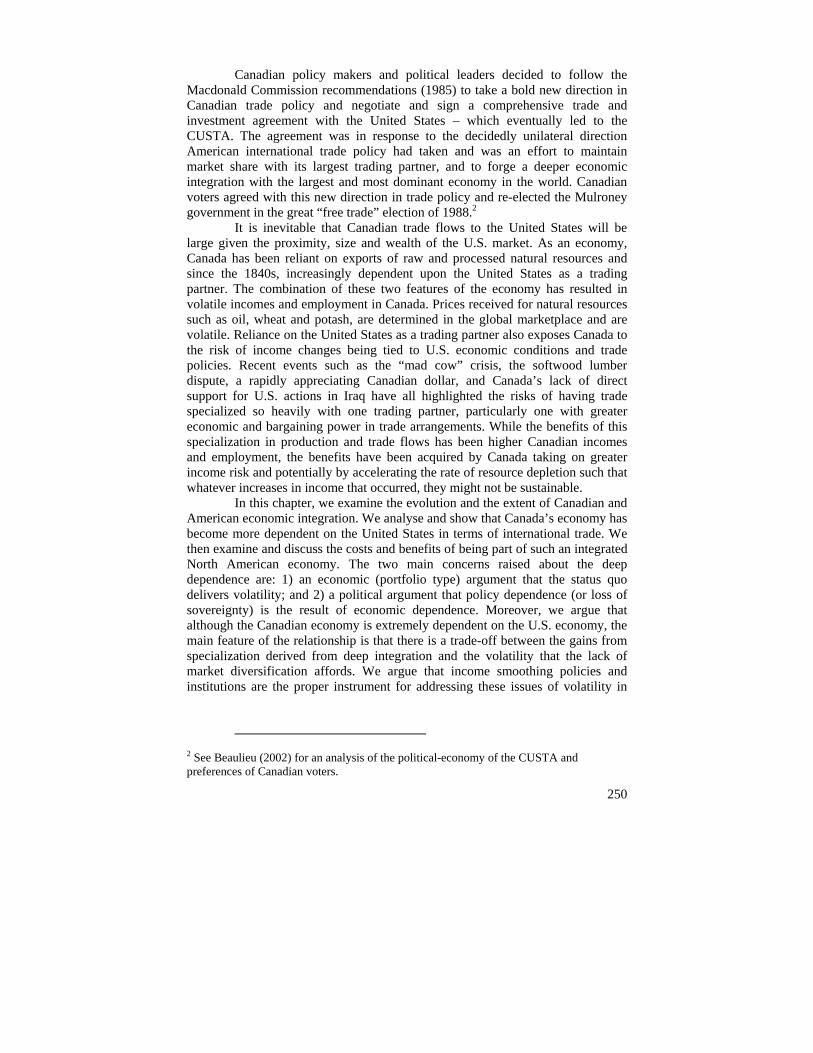
Canadian policy makers and political leaders decided to follow the Macdonald Commission recommendations (1985) to take a bold new direction in Canadian trade policy and negotiate and sign a comprehensive trade and investment agreement with the United States – which eventually led to the CUSTA. The agreement was in response to the decidedly unilateral direction American international trade policy had taken and was an effort to maintain market share with its largest trading partner, and to forge a deeper economic integration with the largest and most dominant economy in the world. Canadian voters agreed with this new direction in trade policy and re-elected the Mulroney government in the great “free trade” election of 1988.2
It is inevitable that Canadian trade flows to the United States will be large given the proximity, size and wealth of the U.S. market. As an economy, Canada has been reliant on exports of raw and processed natural resources and since the 1840s, increasingly dependent upon the United States as a trading partner. The combination of these two features of the economy has resulted in volatile incomes and employment in Canada. Prices received for natural resources such as oil, wheat and potash, are determined in the global marketplace and are volatile. Reliance on the United States as a trading partner also exposes Canada to the risk of income changes being tied to U.S. economic conditions and trade policies. Recent events such as the “mad cow” crisis, the softwood lumber dispute, a rapidly appreciating Canadian dollar, and Canada’s lack of direct support for U.S. actions in Iraq have all highlighted the risks of having trade specialized so heavily with one trading partner, particularly one with greater economic and bargaining power in trade arrangements. While the benefits of this specialization in production and trade flows has been higher Canadian incomes and employment, the benefits have been acquired by Canada taking on greater income risk and potentially by accelerating the rate of resource depletion such that whatever increases in income that occurred, they might not be sustainable.
In this chapter, we examine the evolution and the extent of Canadian and American economic integration. We analyse and show that Canada’s economy has become more dependent on the United States in terms of international trade. We then examine and discuss the costs and benefits of being part of such an integrated North American economy. The two main concerns raised about the deep dependence are: 1) an economic (portfolio type) argument that the status quo delivers volatility; and 2) a political argument that policy dependence (or loss of sovereignty) is the result of economic dependence. Moreover, we argue that although the Canadian economy is extremely dependent on the U.S. economy, the main feature of the relationship is that there is a trade-off between the gains from specialization derived from deep integration and the volatility that the lack of market diversification affords. We argue that income smoothing policies and institutions are the proper instrument for addressing these issues of volatility in
2 See Beaulieu (2002) for an analysis of the political-economy of the CUSTA and preferences of Canadian voters.

251
economic markets. Whereas income-smoothing policies are the proper instrument for market volatility, diplomacy is the proper instrument in the political sphere.
We provide evidence that the CUSTA and NAFTA were very successful at increasing the integration of the North American economy and argue that market forces should determine whether we have ever deeper integration with the United States. It is important to point out that Canada’s move to regional trade agreements and a more integrated regional economy in the 1980s and 1990s was part of a decision by Canadians that diversification via protection was too costly. Ergo the choice to sacrifice income level to reduce volatility may not be a palatable choice for voters.
From close ties to deeper integration
Figure 1 shows the evolution of Canada’s export trade with the United States since 1840. During the period of Reciprocity from 1854 to 1866, the share of merchandise exports destined for the U.S. reached as high as 70%. Britain resumed its dominant position as Canada’s trade partner after the abrogation of Reciprocity. From 1886 to 1947, exports to the United States were usually 35% to 40% of total exports, and exports accounted for 25% to 40% of Canada’s Gross National Product (GNP). From 1886 to 1913, exports to Britain accounted for over half of Canadian exports, but fell abruptly during World War I to 25% to 30% of total Canadian exports. Canada’s reliance on the United States as an export destination has been increasing as a series of steps after World War II. In 1947, 39% of exports went to the U.S., and 27.5% to the UK. In 1950, the UK share had fallen to 15%, and the share of exports to the U.S. increased to 65% (Rooth 2000).
Even as early as the late 1950s, the extent of Canadian dependence on trade with the United States was considered an exceptional and unprecedented economic relationship between two sovereign nations. Moreover, the exceptionally close economic ties between Canada and the United States had already become a concern for Canadian politicians, policymakers and academics. At a speech at Carleton University in 1958, the great Canadian-born trade economist Jacob Viner remarked that “These are all exceptionally high ratios for economic relations of one country to another. They cannot be matched, taken together, I feel certain, for any other two countries in the free world.” (Viner, 1958 p. 37).3
Although Canadian exports to the United States had already reached 60% of total Canadian exports, the trend continued upward. From 1950 to 1967, the share of exports to the U.S. remained at around 60%, but increased to 70% for the period 1969 to 1983. Since 1983, the share of exports to the U.S. has increased to reach a peak of 86% in 2000.
3 Note that Jacob Viner’s seminal work established the economic model of customs unions that became the foundation for economic thinking on regional trade agreements.

Figure 1 Percentage of Total Exports to the US, 1850-2002
0
0.1
0.2
0.3
0.4
0.5
0.6
0.7
0.8
0.9
1
1840 1860 1880 1900 1920 1940 1960 1980 2000 2020
Source: F. H. Leacy (1982); CANSIM; Marr and Paterson (1980)
Figure 2
Canadian Exchange Rate 1948-2004 (US $ per Cdn $)
0.0000.2000.4000.6000.8001.0001.200
1948
1953
1958
1963
1968
1973
1978
1983
1988
1993
1998
2003
Exports to the U.S. continued to grow in absolute and relative importance in the 1960s, but the composition of exports shifted from reliance on pulp and paper and minerals to manufactured goods. The expansion of Canada’s manufacturing exports after 1960 was stimulated by the devaluation of the Canadian dollar from $1.04 in 1959 to $0.925 (US dollars per Canadian dollar),
252

and by policy developments like the Autopact of 1965 (Norrie, Owram and Emery 2002). Figure 2 presents the Canadian exchange rate vis-à-vis the U.S. dollar from 1948 to 2004.
Figure 3 shows that the real value of exports to destinations other than the U.S. grew until 1980, but by much less than exports to the U.S. It is the expansion in total exports, particularly to the U.S., that dominates the expansion of Canadian trade after 1960. One of the notable features of the real value of exports is that export values reached a plateau in the 1980s, the value of exports to the U.S. levelled off while exports to the rest of the world showed some decline.
With the expansion of trade with the United States, Canada’s reliance on external trade as measured by the ratio of exports to GNP/GDP increased. Figure 4 shows the ratio of exports to output in Canada from 1870 to 2000. Other than during World War I and World War II, when exports were exceptionally high, until 1960 exports were normally between 15 and 20% of GNP. Since 1960, the ratio of the value of exports to GDP has increased such that today the ratio is over 35 percent. As Canada experienced a severe recession in the early 1980s coincident with the stagnation in growth of its exports, the Macdonald Commission investigated what was needed to re-invigorate the Canadian economy. The Commission concluded that a movement towards freer trade with the United States would be a positive development, and in 1989, the Mulroney Conservative government implemented the CUSTA and in 1994, the NAFTA. Following the implementation of these policies, exports to the U.S. grew rapidly, and while exports to the rest of the world showed no growth, the share of total exports destined for the U.S. grew to a high of 86%. Figure 3
Value of Exports to US and Rest of the World (ROW), 1946-2002, in Constant 1996 $
0
50000000
100000000
150000000
200000000
250000000
300000000
350000000
400000000
1946
1948
1950
1952
1954
1956
1958
1960
1962
1964
1966
1968
1970
1972
1974
1976
1978
1980
1982
1984
1986
1988
1990
1992
1994
1996
1998
2000
2002
Con
stan
t 199
6 $
ExpUSEXPROW
Source: Leacy (1982); CANSIM
253
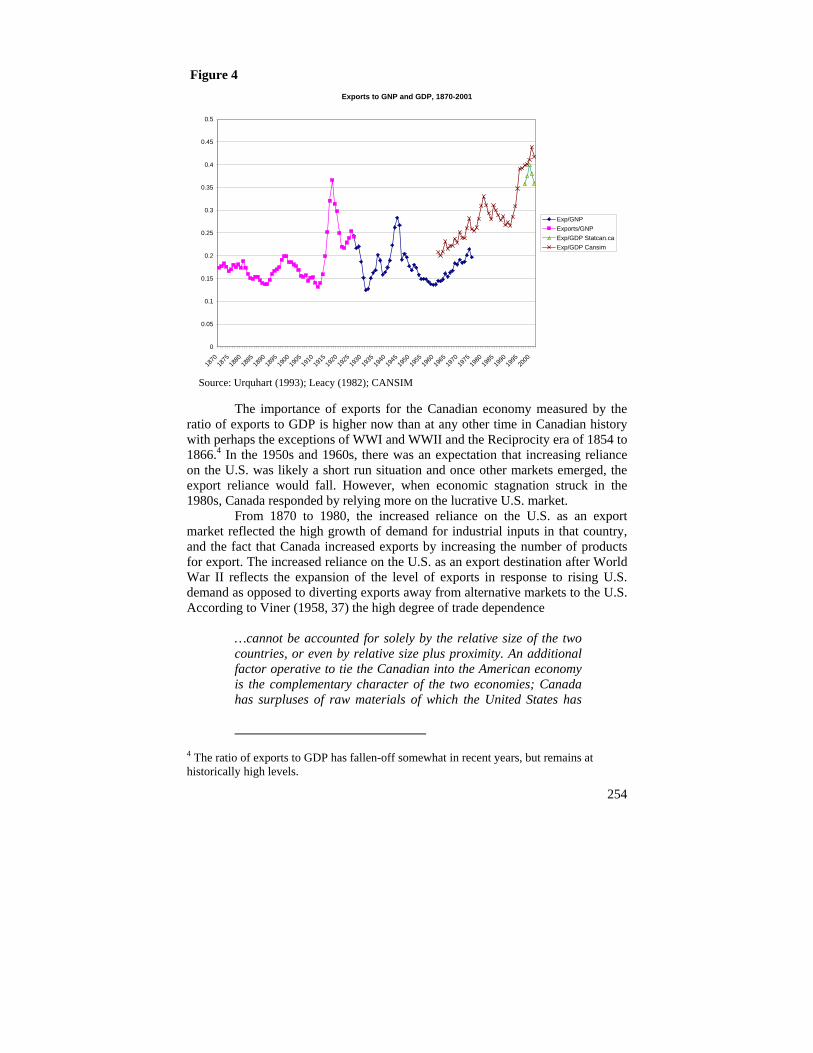
Figure 4 Exports to GNP and GDP, 1870-2001
0
0.05
0.1
0.15
0.2
0.25
0.3
0.35
0.4
0.45
0.5
1870
1875
1880
1885
1890
1895
1900
1905
1910
1915
1920
1925
1930
1935
1940
1945
1950
1955
1960
1965
1970
1975
1980
1985
1990
1995
2000
Exp/GNPExports/GNPExp/GDP Statcan.caExp/GDP Cansim
Source: Urquhart (1993); Leacy (1982); CANSIM
The importance of exports for the Canadian economy measured by the ratio of exports to GDP is higher now than at any other time in Canadian history with perhaps the exceptions of WWI and WWII and the Reciprocity era of 1854 to 1866.4 In the 1950s and 1960s, there was an expectation that increasing reliance on the U.S. was likely a short run situation and once other markets emerged, the export reliance would fall. However, when economic stagnation struck in the 1980s, Canada responded by relying more on the lucrative U.S. market.
From 1870 to 1980, the increased reliance on the U.S. as an export market reflected the high growth of demand for industrial inputs in that country, and the fact that Canada increased exports by increasing the number of products for export. The increased reliance on the U.S. as an export destination after World War II reflects the expansion of the level of exports in response to rising U.S. demand as opposed to diverting exports away from alternative markets to the U.S. According to Viner (1958, 37) the high degree of trade dependence
…cannot be accounted for solely by the relative size of the two countries, or even by relative size plus proximity. An additional factor operative to tie the Canadian into the American economy is the complementary character of the two economies; Canada has surpluses of raw materials of which the United States has
4 The ratio of exports to GDP has fallen-off somewhat in recent years, but remains at historically high levels.
254

255
deficiencies; standard American capital goods are well adapted to Canadian production techniques; the consumption standards and tastes of the two countries are almost identical, so that Canadian consumers' goods find a ready market in the United States.5 The U.S. industrial demands for commodities in which Canada was
abundant caused the expansion in exports and the Canadian capital boom of the 1950s. David Slater (1955, 4) found:
The changes in content and geographical destination are closely related. The decline of the United Kingdom as a market is closely related to the enormous decline in exports of animal products, lumber and timber, and the more recent decline in agricultural and vegetable products. The relative rise of the United States as a market is related to the enormous expansion of wood products, particularly pulp and paper, and non-ferrous metals. To a considerable degree, for Canada to sell to different areas she must sell (and produce) different things; to sell different things she must sell to different areas. The 1957 Final Report of the Royal Commission on Canada’s Economic
Prospects (the Gordon Commission) included forecasts of Canada’s export to GDP ratio and percentage of exports to the U.S. for 1980. With a forecast based on a basic premise that there would be no severe economic depressions, world conflicts or radical changes in policies (among others), the report forecast that total exports to GNP would fall from 21.7% to 18.4% while the share of total exports to the U.S. would rise from 62% to 69.5%. Amongst merchandise exports, the only sub-groups expected to increase their share of total exports between 1955 and 1980 were Chemicals, Aluminum and products, and Petroleum and Products. All other sub-groups including agricultural and food products, pulp and paper, lumber, and copper and nickel were predicted to have falling shares of total exports (Kuznets 1959, Table 3). In many respects, these forecasts were remarkably accurate as in 1980 the export to GNP ratio was around 20% and the share of exports to the U.S. was around 70%. This would suggest that the Autopact, the abandonment of the Bretton-Woods fixed exchange rate systems and large shocks like the OPEC oil crises that took place between 1957 and 1980 had little effect on the ratio of exports to GDP over the long run. All told, this
5 Note that last sentence segment in the original passage from Viner reads: “; the consumption standards and tastes of the two countries are almost identical, so that American consumers' goods find a ready market in the United States.” This appears to be a typographical error – so we changed “American consumers’ goods” to “Canadian consumers’ goods.”

256
suggests remarkable stability and predictability of the Canada-US trade relationship prior to the CUSTA.
As late as 1980, increased specialization in the destination for exports was accompanied by greater diversification of products for export. Since 1980, the volume of Canadian international trade has continued to increase rapidly and has become even more specialized in its destination market partner, i.e. increasingly specialized in trade with the U.S. However, Acharya, Sharma and Rao (2003) find that most of the increase in trade has been intra-industry, rather than inter-industry trade. The rapid increase in intra-industry trade suggests that trade flows have become more diversified in the variety of goods traded – but the authors also find that Canada’s comparative advantage remains in commodity intensive sectors. Acharya et al (2003) examine the changes in export intensities and import penetrations for 84 industries between 1985 and 1997. They find that the number of industries with increased trade (larger export intensities and import penetration) increased during this period. In 1985, 30 of the 84 industries (or 36 percent) had export intensities of more than 30 percent and by 1997, 50 industries (or 60 percent) had export intensities of more than 30 percent. Similar increases occurred in import penetration rates.
Note that although there was a large increase in trade over a broad cross section of industries, the relative pattern of export intensity and import penetration was very stable from 1985 to 1997. Since 1997, however, the value of exports has increased due to increases in intra-industry trade in autos and in energy exports where high prices have resulted in a highly specialized export composition. Figure 5 shows the top industries by exports to the United States in 1993 and 2002 with all industries related to automobiles, trucks, engines and parts aggregated into one category. The figure shows the large increases in total Canadian exports since 1993, and especially since 1997, from increases in the exports of automobiles and light trucks and from exports of oil and gas. At the same time, the figure also shows that increased values of exports are across a large number of industries. In fact, although the magnitude is less than for autos, trucks and parts, real exports grew for all of the top 25 exporting industries except the computer and peripheral equipment industry and the semiconductor and other electronic component industry. The “All Others” residual category represents an enormous increase in the real value of exports for a large number of industries representing a large number of products.
There is strong evidence in the literature that CUSTA and NAFTA had a significant impact on trade flows. A recent working paper by Romalis (2002) makes the point that it is difficult to measure the impact of CUSTA or NAFTA. Part of the problem is the level of aggregation. Romalis uses very detailed trade data and finds large impacts of the CUSTA and NAFTA tariff changes on North American trade flows. The problem with using more aggregate data is that much of the cross-commodity variation in tariffs occurs within quite detailed industry sectors. There is additional evidence based on Helliwell (1998) that the border effect between Canada and the United States has declined since NAFTA. Again, evidence that the trade agreements had some impact on the degree of integration.

Figure 5 Figure 5: Exports to US for Top 25 Industries (5 Digit NAICS Code) 1993 and 2002 in
Constant 1992 Billions of $CDN
0
20
40
60
80
100
120
140
Autos,
Trucks
and P
arts
Oil and
Gas
Extrac
tion
Paper
Mills
Sawmills
, Woo
d Pres
ervati
on
Aerosp
ace P
roduc
ts an
d Part
s
Petrole
um R
efine
ries
Alumina
and A
luminu
m Prod
'n an
d Proc
Other P
lastic
Prod
uct
Resin
and S
ynthe
tic R
ubbe
r
Venee
r, Plyw
ood a
nd Eng
ineere
d Woo
d Prod
uct
Compu
ter an
d Peri
phera
l Equ
ipmen
t
Other M
otor V
ehicl
e Part
s
Office F
urnitu
re (in
cludin
g Fixt
ures)
Animal
Slaugh
tering
and P
roces
sing
Iron a
nd Stee
l Mills
and F
erro-A
lloy
Teleph
one A
ppara
tus
Non-F
errou
s Meta
l (exc
ept A
luminu
m) Smelt
ing an
d Refi
ning
Pulp M
ills
Semico
nduc
tor an
d Othe
r Elec
tronic
Com
pone
nt
House
hold
and I
nstitu
tiona
l Furn
iture
All OTHERS
Bill
ions
199
2 $
CD
N19932002
Source: Strategis Web Page (Industry Canada): http://strategis.ic.gc.ca/
Deeper bilateral integration in a regional world
Figure 6 shows that the ratio of Canada’s exports to GDP has been high compared to the average ratio for high income countries since 1965. However, it also shows that Canada’s ratio of exports to GDP grew faster than the average ratio for high income countries after 1990. In 1965, the ratio of exports to GDP was approximately 19 percent in Canada and 12 percent on average among high income countries (representing a 53 percent differential). The increase in the ratio from 1965 to 1990 was similar for Canada and for the average of high income countries (the differential did not change much). However, after 1990 the ratio increased faster in Canada than it did for the averages across the other countries. By 2001, the ratio was 44 percent in Canada and 23 percent on average among high income countries – a differential of over 87 percent.
Note, however, that comparing Canada to country averages obscures the fact that a large number of countries have much higher export to GDP ratios than Canada. In fact, out of the 166 countries for which data are available, Canada’s ratio of exports to GDP ranked 64th in 2001. Figure 7 presents a scatter plot of the ratio of exports to GDP against country size (measured by GDP) for the high income countries.6 Canada is not at all an outlier in terms of the ratio of exports to
6 High income countries are defined as those with GDP measured in US dollars greater than $12,000 in 2001. Note that the three largest world economies (Germany, Japan and the
257

GDP given the size of the country. Canada has a higher ratio than the largest countries in the world – but as the regression line shows – the ratio is inversely related to country size. The outlier countries include Luxemburg and Hong Kong with export to GDP ratios greater than 100 percent. Ireland (IRL), Belgium (BEL) and the Netherlands (NLD) also have higher ratios of exports to GDP than their size suggests. On the other hand, Australia (AUS) and Greece (GRC) have lower than average export to GDP ratios given their economic size. Figure 6
Export Share of GDP for Canada and Country Groups: 1965-2001
0.0010.0020.0030.0040.0050.00
1965
1970
1975
1980
1985
1990
1995
2000
Year
Perc
ent
High incomeCanada
It is also important to recognize that Canada was not the only country to
recently experience an increase in trade dependence. In fact, the rapid growth of world exports in the post-war period caused export revenues to be an increasingly important portion of domestic income for numerous countries. As Moore and Rugman (2001) point out, world trade flows have become increasingly regional, and less global in nature. Figure 8 provides an illustration of how trade flows became more regional between 1980 and 2000. As seen in the figure, intra-NAFTA trade went from 34% of North American trade in 1980 to 56% in 2000. Europe and Asia experienced similar growth in the share of regional trade.
United States) are excluded from the figure for scale and space considerations. The diagram is very similar including slope of the regression line.
258

Although world trade flows have become more regional, Canadian trade flows became even more concentrated.
Figure 7
AUS
AUT
BEL
CANCHEDNK
ESPFIN
FRAGBRGRC
HKG
IRL
ISLISR
ITAKOR
LUX
MAC
NLD
NORNZL
PRI
PRT
SVN
SWE
050
100
150
Exp
ort/G
DP
0 500000 1000000 1500000 2000000GDP millions US $
Fitted values exports/GDP
Linear Regression Line Included; High Income Countries*Export Share of GDP and Country Size in 2001
* Japan, Germany and the US are excluded due to scale and space constraints. These are the three largest countries and the picture is similar (but difficult to read) when they are included. High income countries are defined here as those with GDP per capita greater than US$12,000. Source: World Development Indicators Figure 8: Intra-regional vs inter-regional trade
259
NAFTA 304.1
Intra-NAFTA102.2 (34%)
Exports (US$ billion) in 1980
Asia 273.9
Intra-Asia96.7 (35.3%)
EU 2,283
Intra-EU385.2 (52%)
NAFTA 304.1
Intra-NAFTA102.2 (34%)
Exports (US$ billion) in 1980
Asia 273.9
Intra-Asia96.7 (35.3%)
EU 2,283
Intra-EU385.2 (52%)
NAFTA 1,213.3
Intra-NAFTA676.4 (56%)
Exports (US$ billion) in 2000
Asia 1,594.3
Intra-Asia887.8 (56%)
EU 2,283
Intra-EU1416.8 (62%)
NAFTA 1,213.3
Intra-NAFTA676.4 (56%)
Exports (US$ billion) in 2000
Asia 1,594.3
Intra-Asia887.8 (56%)
EU 2,283
Intra-EU1416.8 (62%)
NAFTA 1,213.3
Intra-NAFTA676.4 (56%)
Exports (US$ billion) in 2000
Asia 1,594.3
Intra-Asia887.8 (56%)
EU 2,283
Intra-EU1416.8 (62%)

260
The problems with economic dependence on the U.S. As noted above, at the present time, Canada is more dependent on exports to
a single market than at any point in its history. The obvious policy question that arises is whether or not this is a problem. Part of the static welfare gains in standard neoclassical trade models is derived from specialization in production and trade flows. These gains can be offset by the increased risk associated with increased specialization. This section examines the concerns that are expressed over the lack of diversity in Canadian export markets.
Irreversible investments and strategic trade considerations
There is a potentially critical strategic problem with negotiating deeper economic ties with a much larger trading partner. The problem is similar to what is known as a “hold-up” problem in the industrial organization literature. The basic idea is that in a world with irreversible investments, anticipated trade negotiations between a large country and a small country might make the small country worse off. Investors anticipating liberalized trade will invest in export opportunities making the small country dependent on trade with the large country and destroying the small country’s bargaining position. A version of this argument was popularized during the CUSTA debates by the retired Judge Marjorie Bowker (1988) and was also expressed by economist Brian Copeland (1989). The idea was then formalized in economic theory by John McLaren (1997). Judge Bowker was part of a grass-roots movement opposed to CUSTA and pointed out that the abrogation clause in CUSTA (either side can abrogate the agreement on six months notice) could place Canada in a serious predicament regardless of who abrogates the deal because Canadian industry will have restructured and invested in export related activities. The key point is that Canada will gain from CUSTA by re-adjusting its economy toward the U.S. export market. When these investments are irreversible, however, Canada becomes extremely vulnerable to threats of abrogation. As Copeland (1989) points out, this weakens Canada’s bargaining position on any trade issue.
McLaren (1997) makes the point, however, that this trade negotiations case differs from the “hold-up problem” in industrial organization because in the latter case firms make decisions on the negotiations and on the related investment. In the trade case, the government negotiates trade policy and private firms make investment decisions. This is important because in the former case the firm can walk away from the table, if it anticipates a hold-up problem. However, while the government can walk away from the negotiating table, this might not be credible to private investors who will invest in any event and destroy the government’s bargaining position. McLaren (1997) points out that one alternative for a small country in this situation is to diversify trade with a number of other countries.
Some commentators have raised additional concerns more recently that Canada’s trade dependence on the U.S. exposes Canada to uncertainties due to the increasingly evident move by the U.S. to politicize trade relations by connecting

261
trade policy to other political objectives.7 In May, 2003 the then U.S. Trade Representative Robert Zoellick announced that co-operation in foreign policy and security issues are a pre-condition for any country wanting to negotiate a free trade agreement with the U.S., for example, confirming these concerns.
The “Portfolio” concern with dependence on a small number of markets and excess reliance on natural resources
Canada’s early economic development up to 1840 was fostered by British mercantile policies (Navigation Acts, Corn Laws and Timber Tariffs) that provided Canadian products with preferential treatment and access into the British market. Canada lost this privileged access to the British market after 1840 with the repeal of the timber tariffs and the Corn Laws a few years later in 1846 and the Navigation Acts in 1849. The loss of this preferential access coincided with an economic slump in the British North American (BNA) colonies and the consequences of the loss of an important market became clear. In the short run, the BNA colonies responded by seeking a new market for their resources and eventually entered into the Reciprocity Treaty of 1854 with the United States. Over the period of the Treaty, 1854-1866, reported Canadian exports grew by over 300% but the effect of the Treaty was a small one-time gain in the level of exports to the U.S (Norrie, Owram and Emery 2002). With the abrogation of the Treaty in 1866, Canada continued to orient itself increasingly towards trade with the United States, even negotiating an ill-fated Reciprocity Agreement with the U.S. in 1911 (see Beaulieu and Emery 2002).
The Depression of the 1930s was a hard lesson for a small economy like Canada’s dependent on the exports of a few commodities to a small number of markets. In 1929, merchandise exports represented 22% of Canadian GNP. In contrast, merchandise exports were only 5% of GNP in the U.S. The importance of exports for income was more acute in some sectors like forestry, farming and mining where 80% of produce was exported. Canada’s wheat exports alone were 40% of world wheat exports. Canada also had a lack of diversification in export goods as 80% of Canada’s exports were made up of three primary products: grains, animal products and forest products. Wheat and flour alone comprised 36% of total exports. Canada was also reliant on two export markets, the U.S. and the UK (In 1929, over 1/3 of exports went to U.S. while another 1/3 were destined for the UK) and through the gold standard, the monetary policies of the three countries were bound together. With the glut of wheat and other primary products on world markets by the late-1920s, commodity prices were low and Canadian exporters were not doing well. The U.S. and U.K. moves to protectionism, the 1930 Smoot-Hawley Tariff in the U.S. in particular, resulted in draconian reductions in Canadian exports. By 1932, exports to the U.S. were half of their 1929 level and to the U.K., 2/3 of their 1929 level. While it is clear that the high reliance on exports of a few commodities left the Canadian economy particularly vulnerable in the 1930s, it is not clear if there were arrangements that Canada
7 See Winham and Ostry (2003).

262
could have pursued to avoid the devastating effects of the Depression. Most, if not all, economies were moving in protectionist directions in the 1930s and had experienced precipitous drops in incomes. There were no alternative export markets to which Canada could have turned.
After World War II, the growing share of Canadian exports to the U.S. was cause for some concern in Canada, but it was not clear what alternatives existed. Gibson (1956, 423) argued that:
Many Canadians feel a little uneasy because we now send such a large proportion of our exports to the United States. Though a feeling of concern is understandable, the fact is that we have had no practicable alternative to increasing our exports to the United States. In the post-war period the big increase in demand has come from the United States and it must be admitted that the increase has been very welcome in Canada. No remotely comparable opportunity for expanding our export markets has been available in the sterling area or elsewhere, particularly in the early post-war period when we were worried about obtaining adequate markets.
Similarly, Simon Kuznets (1959, 378) wrote:
There is a conflict between apprehension over the recently increased “dominance” of the United States in the foreign trade of Canada, its foreign capital, and some of its important industries, and recognition that these ties with its larger neighbor to the south are an important and increasing source of economic strength, a basis for past growth and a promise for the future which it would be irrational to forego… Yet there is apprehension… lest the increased dependence upon United States markets, for imports and particularly for exports, make Canada more sensitive to the vagaries of United States economic policy… Gibson (1956, 424) argued that the reliance on the U.S. as an export
market was likely to diminish once the economies of Europe stabilized and hence, not reason for concern:
The kind of goods produced by our basic industries and particularly our minerals and wood products are in growing demand throughout the world. The economic recovery of Europe has much increased the continent’s requirements for industrial raw materials. The growth of nationalism all over the world, with its emphasis on industrialization, has added further to demand. The most powerful impulse is, of course, the recent surge in growth in the world’s population, perhaps the most

263
rapid in recorded history. We are thus not so completely dependent on the United States for the disposal of our basic exports as the trade figures appear to suggest. Gibson’s expectation that the reliance on the U.S. market for Canada’s
exports would diminish could not have been more incorrect. As noted above, Canada’s reliance on the U.S. has grown and concerns over the reliance on trade with United States continue to be voiced. “This concentration of trade creates vulnerability, much the same as a company that makes most of its sales to a single buyer” (Winham and Ostry (2003)). At a recent “Borderlines” conference, one “dooms-dayer” opined that Canadians “have pinned our prosperity to trade with a single convenient customer on a cheap Canadian dollar. Any of us with brains enough to run a lemonade stand knows the risk of a single customer.”8 Although the logic of the argument is questionable and the analogy is completely fallacious (are Canadian businesses with access to a market of over 290 million people really selling to a single customer?), it does raise important concerns that the Canadian economy may be “too dependent” on the American market. Recent events such as the softwood lumber dispute, the “mad cow” disease scare which closed the border to Canadian beef exports, and tensions between the two countries over Canada’s choice not to support the U.S. in Iraq, have shown the risk of relying on preferential access to one, albeit large and wealthy, economy.
According to Winham and Ostry (2003) Canada is facing a new crisis due to the vulnerability created by its trade-dependence on the United States. The authors point out that there are two basic alternative strategies Canada can follow: 1) move Canada to deeper economic and political ties with the United States; and 2) diversify trade in a “second policy direction.” Even the Governor of the Bank of Canada has argued that Canadians need to look beyond the North American continent. In a recent speech, David Dodge (Nov 2003) argues:
During the 1980s and 1990s, free-trade agreements with the United States and Mexico focused Canada's attention on the opportunities south of the border. Individual Canadians and businesses have been making the tough adjustments that are necessary to face increased competition and to take advantage of new opportunities. While keeping that continental focus, it is now important that we broaden our sights and focus on opportunities that are opening up in the rest of the world.
Winham and Ostry also come down with an argument for the latter policy direction. They argue that the free trade agreement was the proper response to the
8 This quote is attributed to Desmond Morton from McGill Univeristy in “Ideas that Matter,” Vol. 2 #4, p. 36 published by Zephyr Press, Toronto. This issue is devoted to ideas expressed at a series of conferences “BorderLines: Canada in North America” sponsored by the Institute for Research on Public Policy (IRPP).

264
uncertainty over trade policy in the late-1970s and early 1980s as the United States pursued a “unilateral” approach to international policy during that period, however, today, a policy of closer ties with the United States would be a mistake. Their argument of vulnerability comes down to the standard analogy that treats Canada as one agent selling one product to one large buyer which leaves one vulnerable and exposed. However, as pointed out above, Canada is not one seller peddling one good to one large buyer. Canadian export dependence on the U.S. is comprised of thousands producers peddling thousands of different goods to millions of American firms and consumers. According to Statistics Canada’s data based on the Exporter Registry, 41,267 establishments exported goods in 2001 – up from 30,589 enterprises exporting in 1993.9 The “lack of diversification” argument looks pretty weak in this context.
The impact of trade dependence on export performance
A central question regarding the impact of Canadian trade dependence on the United States is whether Canadian export performance has suffered. A starting point from which to address this empirical question is to examine whether Canada managed to export more as a percentage of world trade over time. The next step is to decompose the change in world export shares into structural changes and residual – or unexplained changes. A common approach used in the literature to evaluate why the exports of one country grew faster (or more slowly) than world exports is the Constant Market Share (CMS) analysis. The CMS analysis applies a “structural decomposition analysis” methodology to exports. The CMS analysis decomposes export growth into one of four factors: a) the general growth of world exports (i.e. growth in global demand for exports), b) the composition of the country’s exports; c) the destination of the country’s exports; and d) a residual term which includes all other factors not captured by a), b), and c). The residual term has become interpreted as a “competitiveness index”.
Taszynski (1951) was the first to apply this structural decomposition methodology to exports. Leamer and Stern (1970) provide a detailed discussion of CMS analysis and propose a new version of the method. The methodology has been used extensively in applied international applications including work on the United States by Bowen and Pelzman (1984) and more recently by Azam and Azam (1994). The mathematical foundation of the approach (based on Leamer and Stern (1970)) is presented in the appendix.
Swisterski (2002) employs the CMS approach to decompose sources of export revenues in the OECD from 1972 to 1992. Some results from his analysis for Canada are summarized in Table 1. For the 1972-76 period, if Canadian exports had grown at the rate of world exports, they would have been 1.65 times greater than the actual level. Canada was unable to maintain its market share during this period primarily due to negative competitiveness (-48.5%) and destination (-15.0%) effects and to a much lesser extent by commodity (-1.5%) effects.
9 See Statistics Canada Catalogue no. 65-506-XIE “A profile of Canadian exporters”.

Table 1: Constant Market Share Analysis for Canada
265
1972-76 1976-80 1980-84 1984-88 1988-92 1980-88 1980-92a) World Trade 165.0 132.9 -18.5 179.2 170.4 57.4 85.0b) Commodity -1.5 -7.6 -5.5 14.9 -37.1 3.6 -11.3c) Destination -15.0 3.5 61.9 -39.6 -53.9 32.3 12.3d) Competitiveness -48.5 -28.8 62.1 -54.6 20.6 6.7 13.9Total % 100 100 100 100 100 100 100
During the 1976-80 period, Canadian export growth was again below the
world average, and again the commodity and the competitiveness effects were negative (-7.6% and –28.8% respectively). The competitiveness effect increased by 20 percentage points, from –49% in the previous period to –29%. However, there was a positive destination effect on Canadian exports during the period of 3.5%. As seen in Table 1, the destination effect was very large and positive from 1980-84 and again from 1988-92 – although it was negative from 1984-88.
If Canadian exports had grown at the global rate of export growth from 1984 to 1988, they would have been 1.79 times larger than was actually the case. The destination and the competitiveness effects were both negative at –39.6% and –54.6% respectively, but the commodity effect was positive (at 14.9%). The positive commodity effect coincided with a structural change among Canada’s principal exports. Whereas machinery was still Canada’s leading export, manufactured goods became the second largest export group, pushing crude material exports into third place.
During the 1988-92 period, however, Canada experienced a positive competitiveness effect of 20.6%. Notwithstanding the positive competitiveness effect, Canadian export growth was below the world average rate, with negative commodity and destination effects, at –37.1% and -53.9% respectively. The negative destination effect was to a great extent due to the 1991 recession in the United States.
Between 1972 and 1992, Canadian exports grew at well below the world average rate, with negative commodity (-25.5%) and competitiveness (-18.4%) effects, and only a marginally positive destination effect (0.9%). One of the key factors contributing to the decline in Canada’s market share of world exports over this 20 year period was the falling demand for (and thus relative value of) the Food and the Crude Materials commodity groups; both of which comprise a large share of Canadian exports.
Table 2 from Swisterski (2002) presents the CMS results for all OECD countries between 1972 and 1992. The columns show the percentage contribution of individual CMS effects to the overall change in exports. As Table 2 indicates in the first column, growth in world trade accounted for most of the growth in trade for all OECD countries. Export growth can be accounted for by overall growth in world trade in New Zealand, Sweden, Canada, Australia and the Netherlands. Since this table is one of relative contributions of the four factors of trade growth, the overall impact of commodity, destination and competitiveness in these

266
countries will be negative. Canada’s commodity composition and competitiveness effects are negative, but note that the destination effect is almost neutral. New Zealand, Australia, Iceland and Canada had high and negative commodity effects whereas Switzerland, Japan, Germany, the U.S. and Italy had large positive commodity composition effects. Although the destination effect was neutral in Canada, it was positive and large in Australia, Japan, New Zealand and the U.S. Ireland had one of the highest competitiveness effects.
The results of the CMS analysis conducted by Swisterski (2002) provide some evidence that Canadian export performance from 1972 to 1992 was not adversely affected by the degree of trade dependence on the American economy. Canadian exports grew more slowly than the world growth in exports over the period but this had more to do with the commodity composition of Canadian exports and the competitiveness residual. Note that Richardson (1971) is critical of the CMS approach pointing out that the signs and values of the various effects may change depending on how the base period is constructed. That is, the values and signs of the effects may change if the final year, instead of the initial year of the period under study is used as the base year. Fagerberg and Sollie (1987) address the Richardson (1971) criticisms and perform a revised CMS study of 20 OECD countries from 1961-83. Fagerberg and Sollie (1987) find similar results for Canada over that period – that is – they also find a positive “destination” effect for Canadian exports.
Has increased dependence on the United States as a Trading partner increased the volatility of exports and income for Canada?
Another approach to examining whether trade dependence on the United States has adversely affected Canadian export performance is to analyse the long term trend and variability of Canadian exports. This provides an alternative approach to the CMS analysis. Ideally it would be useful to conduct a counter-factual experiment whereby the variance of exports for the actual “portfolio” of Canadian exports is compared to a hypothetical export portfolio with less dependence on trade with the United States. This approach would require the estimation of an export trade model which is beyond the scope of this study. However, we compare the variation of Canadian exports to the variation of exports of a similar country that is not as dependent on trade with one large trading partner. One way to compare the income risk associated with specializing on a single export market is to compare the volatility of income and exports of Australia and Canada since World War II. Whereas Canada was oriented towards the U.S., Australia went towards Asia and only recently to the U.S.

Table 2: Constant Market Share for OECD countries: 1972-92
World Trade
Commodity Effect
Destination Effect
Competitiveness Effect
Australia 130.7 -53.7 32.3 -9.3Austria 77.7 3.8 -9.2 27.8Belgium & Luxemburg 121.0 7.1 3.3 -31.4Canada 143.0 -25.5 0.9 -18.4Denmark 97.3 -3.4 -4.2 10.3Finland 113.2 -15.4 -13.3 15.5France 101.2 6.5 -4.9 -2.8Germany 99.0 19.6 -5.8 -12.8Greece 79.1 -11.1 -6.3 38.2Iceland 115.1 -36.5 -8.5 30.0Ireland 48.2 -3.3 3.1 51.9Italy 94.2 15.6 -5.1 -4.8Japan 71.0 24.1 23.1 -18.1Netherlands 126.4 15.6 0.8 -42.8New Zealand 183.7 -78.9 10.5 -15.3Norway 84.9 -4.6 -2.5 22.2Portugal 60.8 0.2 -6.1 45.2Spain 46.5 0.0 -2.9 56.5Sweden 156.5 0.1 -4.7 -51.9Switzerland 93.5 25.9 3.4 -22.8Turkey 49.9 -15.7 -0.5 66.2U.K. 109.2 13.9 -0.9 -22.2U.S.A. 100.1 16.9 21.7 -38.6 Table 3: Comparing the Growth and Variation of Canadian and Australian Exports, GDP and GDP per capita from 1949 to 2003
Growth Variation Growth Variation Growth Variation Growth Variation Growth VariationAustralia 8.6% 0.25 10.7% 0.31 14.2% 0.51 6.9% 0.31 10.1% 1.25Canada 6.8% 0.26 12.9% 0.30 12.1% 0.43 7.5% 0.37 9.5% 1.23Australia 11.1% 0.41 10.7% 0.27 13.1% 0.47 5.9% 0.24 10.2% 1.13Canada 7.7% 0.30 10.5% 0.25 11.0% 0.39 4.7% 0.21 8.3% 1.00Australia 8.6% 0.31 8.5% 0.22 11.6% 0.42 4.6% 0.19 8.3% 1.01Canada 5.2% 0.19 8.6% 0.20 9.7% 0.35 3.6% 0.16 6.6% 0.89
Growth is the average annual growth of the variable over the period. Variation is the standard deviation divided by the average of that variable for the period.
1949-03
Exports
GDP
GDP per capita
1949-64 1965-73 1974-88 1989-03
Table 3 presents the average annual growth rates and variation of
exports, GDP and GDP per capita for Canada and Australia from 1949 to 2003 (last column). There are several important aspects of this comparison that are worth mentioning. First, over the entire period from 1949 to 2003, the variation of exports was almost the same in Canada and Australia but the GDP and GDP per capita had higher variation in Australia. Second, on average over the entire period Australian exports, GDP and GDP per capita grew faster than they did for Canada
267

268
but that was also associated with greater variation in the measures. Although we do not look at causal relationships and are looking at only two countries, in this case there does not appear to be much of a trade-off between variability and growth. Third, the growth rates of the variables in the two countries follow a similar pattern over time: high and low growth episodes correspond with each other in both countries and across all three variables. The highest average annual growth rates of all three variables for both countries was 1974-88 while the lowest growth occurred in the 1989-03 period. Relative to the experience of Australia, an economy much less dependent on the United States as a trading partner, it appears that Canada does not have any greater volatility in her trade patterns and incomes. Recognizing that income per capita in Canada is higher than it is for Australia leads us to conclude that deeper integration with the United States has benefited Canada.
Both the CMS analysis and the comparison of variation and growth of exports and income between Canada and Australia provide evidence that Canadian export dependence on the American economy did not adversely affect Canadian export performance. Australia and Canada sell their exports in a world market that is interconnected. Based on the evidence above, it would be highly dubious to argue that Canada would have benefited a great deal from pursuing policies designed to diversify export markets.
There does not appear to be a large potential for Canadian exporters to diversify their markets. In particular, for natural resource exports, there are not multiple independent markets across which any country can diversify its sales. Natural resource demand has always been global and when one export destination deteriorates in its demand position, so do most of the others. The Great Depression showed that there were no alternative markets for exporters to exploit; the collapse of potash demand in the 1970s illustrated the same problem for that commodity and we saw it again with respect to oil in the 1980s. Wheat has also had this problem for over a century. Another question to ponder is whether there exists an alternative market to the U.S. for Canadian produced auto-parts? All of this indicates that there is limited potential for diversifying the market risk across destinations.
Trade policy and trade diversification
What role is there for policy to diversify the portfolio of destination markets? As discussed earlier, the 1957 Final Report of the Royal Commission on Canada’s Economic Prospects forecasts of Canada’s export to GDP ratio and percentage of exports to the U.S. for 1980 were remarkably accurate as in 1980 the export to GNP ratio was around 20% and the share of exports to the U.S. was around 70%. This would suggest that the Autopact, the abandonment of the Bretton-Woods fixed exchange rate system and large shocks like the OPEC oil crises that took place between 1957 and 1980 had little effect over the long run. What scope would the Canadian government have to influence the structure of Canadian trade flows?
The alternative approach to trade diversion policies, or trade promotion to markets that currently do not import a great deal from Canada, is to continue

269
having Canada export to the markets that pay the highest prices for our produce. This will mean that we remain highly dependent on the U.S. market and subject to considerable income risk and income volatility. What a government may be able to do is develop institutions to smooth incomes.
Can, or even should, the federal government encourage Canadian exporters to divert some of its trade away from the high price market in the name of greater income stability? The answer to this question is not obvious. First, in a global marketplace, are there many segregated markets, which is a necessary condition for this sort of diversification, or is there really one large integrated/global market? If all markets are subject to the same business cycles as the U.S., then there may be little scope for true diversification. The relevant policy issue might not be trade specialization versus diversification per se, but one of how Canada should address its income volatility. Incomes from trade can be expected to be high and low depending on demand for Canada’s exports, but total income over time will presumably be maximized by Canada specializing in its comparative advantage and exporting to the highest price buyer. Thus, the issue is really one of smoothing income over time. This can be done by Canada not fully pursuing its comparative advantage, or by not putting all its exports into a small number of markets, but it can also be achieved through other “income-smoothing” institutions that can be designed and run by government.
Consider that federal equalization payments in Canada were part of a strategy encouraging regional specialization in production within a diversified national economy. These payments smooth the incomes of the resource producing provinces. Unemployment/Employment insurance, personal savings etc… are ways in which individual workers smooth incomes over the business cycle. The Canada Pension Plan reserve fund, Registered Retirement Savings Plan, etc… are ways in which governments seek to have pension incomes and payouts smoothed over time. On a more aggregate level, oil economies like Norway, Alaska and Alberta have established savings/stabilization/endowment funds to smooth government revenues and in some cases personal incomes over the oil price cycles. The Canadian Wheat Board was established, following the Great Depression, to stabilize prices for farmers over the wheat price cycle. All of these arrangements are alternatives to the trade diversification strategy that smooth incomes over time while encouraging exporters to maximize incomes by selling to the high price markets. Thus it would appear that the federal government may want to consider institutions for smoothing income as a practical alternative to a strategy of diversifying export markets.
Conclusions
The analysis above provides a framework for examining the desirability of pursuing policies aimed at diversifying Canadian export markets. The study confirms that the concentration of Canadian exports on U.S. markets are at an all time high. It also argues that this lack of diversity in export markets exposes Canadian exports to any barriers that arise at the U.S. border or in the U.S. market place. However, the study argues that there are no compelling reasons to adopt policies designed to diversify exports. First, at a time when over 70 percent of

270
Canadian exports went to the U.S. market, Canadian voters endorsed a free trade agreement that fundamentally changed the direction of Canadian trade policy. The new trade policy direction contributed to even higher shares of Canadian exports going to the U.S. market. Furthermore, policies designed to diversify exports to other markets are at a minimum ineffective and might sacrifice income growth.

271
Bibliography Acharya, Ram, Prakash Sharma and Someshwar Rao (2003) “Canada-US Trade
and Foreign Direct Investment Patterns,” in Richard G. Harris edited North American Linkages: Opportunities and Challenges for Canada. (The Industry Canada Research Series, University of Calgary Press).
Azam, Golam and Farida Azam (1994) “Sources of Changes in US Manufactured Exports During the Eighties,” Journal of Economics and Finance 18(1) 31-42.
Baland, J. M. and P. Francios (2000) “Rent-seeking and Resource Booms,” Journal of Development Economics. 61, p. 527-42.
Beaulieu, Eugene (2002) “Factor or Industry Cleavages in Trade Policy: An Empirical Analysis of the Stolper-Samuelson Theorem,” Economics & Politics. Vol. 14 No. 2, pp. 99-132, July.
Beaulieu, Eugene and J. C. Herbert Emery. (2001) “Pork Packers, Reciprocity and Laurier’s Defeat in the 1911 General Election,” Journal of Economic History. Volume 61; December 2001; Number 4. 1082-1100.
Bowen, Harry P., and Joseph Pelzman. (1984) “US Export Competitiveness: 1962-77” Applied Economics 16 461-473.
Courchene, Thomas J. and Colin R. Telmer (1998) From Heartland to North American Region State: The Social, Fiscal and Federal Evolution of Ontario. Toronto: University of Toronto Press.
Fagerberg, Jan and Gunnar Sollie (1987) “The Method of Constant Market Shares Analysis Reconsidered,” Applied Economics 19 1571-83, 1987.
Gibson, (1956) “The Changing Influence of the United States on the Canadian Economy,” Canadian Journal of Economics and Political Science, 22 (4), 421-36.
Helliwell, John F. (1998), How Much Do National Borders Matter?, Washington, D.C.: Brookings Institution Press.
Kuznets, Simon (1959) “Canada’s Economic Prospects: A Review Article,” American Economic Review 49 (3), 359-85.
Larsen, Erling Røed (2003) “Are Rich Countries Immune to the Resource Curse? Evidence from Norway's Management of Its Oil Riches,” Discussion Papers No. 362, October 2003. Statistics Norway, Research Department
Leacy, F. H. (1982) “Historical Statistics of Canada, 2nd edition.” (Ottawa: Statistics Canada).
Leamer, Edward, and Robert M. Stern. (1970) Quantitative International Economics Chapter 7, Allyn and Bacon, Boston.
Marr, William L., and Donald G. Patterson (1986) Canada: An economic History. Toronto: Gage.
Moore, Karl and Alan Rugman (2001) "The Myths of Globalization" Ivey Business Journal 66:1 (September 2001): 64-68.
Norrie, Kenneth, Douglas Owram and J. C. Herbert Emery (2002) A History of the Canadian Economy. (Toronto, Harcourt Brace & Company, Canada).
Ostry, Sylvia and Gilbert R. Winham (2003) “The second trade crisis,” Globe and Mail. Tuesday June 17, 2003.

272
Rodriguez, Francisco and Dani Rodrik (1999) “Trade Policy and Economic Growth: A Skeptic's Guide to Cross-National Evidence” NBER Working Paper No. w7081. Issued in April 1999.
Romalis, John, (2002) “NAFTA’s and CUSFTA’s Impact on North American Trade,” University of Chicago GSB mimeo, July.
Rooth, Tim (2000) “Australia, Canada, and the International Economy in the Era of Postwar Reconstruction, 1945–50”, Australian Economic History Review 40(2) , 127-152
Sachs, J. D. and A. M. Warner (2001) “The Curse of Natural Resources,” European Economic Review,45, s 827-838.
Sachs, J. D. and A. M. Warner (1999) “The Big Push, Natural Resource Booms and Growth,” Journal of Development Economics, 59, pp. 43-76.
Sala-i-Martin, Xavier X. (1997) “I Just Ran Two Million Regressions.” American Economic Review 87(2): 178-83.
Slater, David W. (1955) “Changes in the Structure of Canada's International Trade,” The Canadian Journal of Economics and Political Science, Vol. 21, No. 1. (Feb., 1955), pp. 1-19.
Stevens, P. (2003) “Resource Impact: Curse or Blessing? A Literature Survey,” Journal of Energy Literature, 9 (1), pp. 3-42.
Swisterski, Pawel (2002) “A Constant Market Share Analysis of OECD Export Performance, 1972-1992,” University of Calgary, Department of Economics, MA Thesis.
Torvik, R. (2001) “Learning by Doing and the Dutch Disease,” European Economic Review, 45, pp. 285-306.
Tyszynski, H., (1951) “World Trade in Manufactured Commodities, 1899-1950”, The Manchester School, XIX, 272-304, September.
Urquhart, M.C. (1993) Gross National Product, Canada 1870-1926: The Derivation of the Estimates. (Kingston and Montreal: McGill-Queens Press).
Winham, Gilbert R. and Sylvia Ostry (2003) “The Second Trade Crisis,” The Globe and Mail. Tuesday, June 17, 2003.
Viner, Jacob (1958) Canada and Its Giant Neighbour. Alan B. Plaunt Memorial Lectures, Carleton University, Ottawa. 30 January and 1 February 1958. (Copyright 1958, Carleton University).

273
APPENDIX: Constant Market Share Analysis (CMS) In its most general form, the CMS model measures a country’s total export growth relative to total global export growth:
1) V2 – V1 = rV1 + (V2 - V1 – rV1) Where: V2 = Value of the country’s total exports in period 2
V1 = Value of the country’s total exports in period 1 r = percent increase in total world exports between periods 1 and 2. The last term in equation 1, “(V2-V1-rV1)” captures the difference between the growth of exports due to the world’s growth of exports (rV1), and actual growth of a country’s exports (V2-V1). This residual term is identified as the “competitiveness effect.” A more detailed CMS model can be expressed as follows: 2) V2
ij – V1ij = rijV1
ij + (V2ij – V1
ij – rijV1ij)
Where V2ij = Value of the country’s exports of commodity “i” to region “j” in
period 2 rij = percent increase in world exports of commodity “i” to region “j” between periods 1 and 2 Aggregating equation 2) over all exports and destinations yields: 3) V2.. – V1.. = ΣiΣjrijV1
ij + ΣiΣj(V2ij – V1
ij – rijV1ij)
Where V1.., V2.. = Total value of the country’s exports in periods 1 and 2 respectively. In turn, equation 3) can be re-written:
4) V2.. – V1.. = rV1.. + Σi(ri – r)V1i. + ΣiΣj(rij - ri)V1
ij + ΣiΣj(V2ij – V1
ij – rijV1ij)
(a) (b) (c) (d) Where ri = percent increase in world exports of commodity “i” between periods 1 and 2 V1
i. = Value of the country’s exports of commodity “i” in period 1 As Leamer and Stern (1970) point out, the difference between equation
1) and 4) is the “level” of analysis. Equation 1 explains the change in a country’s value of exports only in terms of change in world demand (i.e. general growth of world exports), and the competitiveness residual. Equation 4 decomposes the growth in the country’s exports in terms of: (a) the growth of the world exports; (b) the composition of the country’s exports; (c) export destination; and (d) the competitiveness residual.
The “competitiveness residual” shows the difference between a country’s actual export growth rate and the export growth rate it would have achieved had it maintained its market share of exports of each commodity group to each region. The competitiveness residual reveals how a country is able to compete with other exporters, controlling for the structural effects (commodity and destination factors).

274