Embed Size (px)
Citation preview
materials
Article
Properties of FeAlSi-X-Y Alloys (X,Y=Ni, Mo)Prepared by Mechanical Alloying and SparkPlasma Sintering
Filip Pruša 1,* , Olga Proshchenko 1, Andrea Školáková 1, Vojtech Kucera 1 andFrantišek Laufek 2,3
1 Department of Metals and Corrosion Engineering, University of Chemistry and Technology, Technická 5,166 28 Prague, Czech Republic; [email protected] (O.P.); [email protected] (A.Š.); [email protected] (V.K.)
2 Institute of Physics, The Czech Academy of Sciences, Na Slovance 1999/2, 182 00 Prague, Czech Republic;[email protected]
3 Czech Geological Survey, Geologická 6, 152 00 Prague, Czech Republic* Correspondence: [email protected]
Received: 25 November 2019; Accepted: 6 January 2020; Published: 8 January 2020�����������������
Abstract: Short-term mechanical alloying and compaction by spark plasma sintering was used forthe production of FeAl20Si20Mo20-XNiX (X corresponds to 5–15 wt %) alloy, which showed anultrafine-grained microstructure with dimensions of phases around 200 nm or smaller. It was foundthat the addition of Mo and Ni to the FeAl20Si20 alloy results in the formation of the AlMoSi phasecompared to the three-phase FeAl20Si20 alloy, which initially contained FeSi, Fe3Si, and Fe3Al2Si3phases. All the investigated alloys increased their hardness, reaching up to 1401 HV 1 for theFeAl20Si20Mo5Ni15 alloy, which contained in total 58.5% of the FeSi and Fe3Al2Si3 phases. As aresult, all the prepared alloys showed one order magnitude lower wear rates ranging from 3.14 to5.97·10−6 mm3
·N−1·m−1 as well as significantly lower friction coefficients compared to two reference
tool steels. The alloys achieved high compressive strengths (up to 2200 MPa); however, they alsoexhibited high brittleness even after long-term annealing, which reduced the strengths of all thealloys below approximately 1600 MPa. Furthermore, the alloys were showing ductile behavior whencompressively tested at elevated temperature of 800 ◦C. The oxidation resistance of the alloys wassuperior due to the formation of a compact Al2O3 protective layer that did not delaminate.
Keywords: mechanical alloying; spark plasma sintering; hardness; compressive strength; oxidationresistance; wear
1. Introduction
The Fe–Al–Si-based alloys belong to a perspective group of materials that was developed byjoining two binary alloy systems, namely Fe–Al and Fe–Si. These alloys might find their utilization as amuch cheaper and lighter substitution of heat-resistant steels or even nickel superalloys [1,2]. The mainadvantages of these alloys are their excellent thermal stability and resistance against high-temperaturereactions in oxygen or sulfate-bearing atmospheres [3–7]. Such behavior has been initially describedfor the Fe–Al system, which is capable of maintaining its mechanical properties up to 500 ◦C [8,9].Simultaneously, the Fe–Al alloys create a compact and protective layer made of either of α-Al2O3 orγ-Al2O3, whose formation is temperature-dependent [2,10]. Comparing these two modifications, thelatter mentioned provides significantly better protection, since it does not contain pores as the α-Al2O3
does [1].The present oxidic layer acts as a shielding bipolar membrane that decreases the diffusion of
metal atoms through the layer toward the environment while also blocking the gases’ transport in
Materials 2020, 13, 292; doi:10.3390/ma13020292 www.mdpi.com/journal/materials
Materials 2020, 13, 292 2 of 17
the opposite direction. The α-Al2O3 modification provides lower protection since it contains manypores and is often prone to the formation of microcracks. Notably, the temperatures between 800 and900 ◦C are known to be responsible for these kinds of defects. In this temperature interval, a metastableθ-Al2O3 is often formed and further transforms during cooling into a stable α-Al2O3 form, which isaccompanied by a volume change [11]. As a result, tensile stresses are induced into the layer, allowingthe formation of microcracks while simultaneously decreasing the adhesion of the layer to the alloysurface [12].
The negative effect of high porosity can be overcome by the addition of Si due to a formation of farmore complex and dense compounds called spinels. Especially, the low addition of Si can effectivelyreduce the porosity of the protection layer. However, when some critical content of Si is exceeded, theporosity increases again, e.g., the Fe–Al–Si alloys containing over 30 wt % Si are exhibiting enormousporosity, making them unusable [10,13–17]. Simultaneously, the addition of Si toward the Fe–Alalloys suppresses the formation of aluminides in favor of silicides or alumino–silicides. Thus, e.g.,the FeAl20Si20 (wt %) alloy is composed of FeSi, Fe3Si and Fe3Al2Si3 [15], or FeAl2Si phases [13,18].The substitution of aluminides by silicides increases the hardness and strength of alloy as well asthe wear resistance and thermal stability, although at the expense of toughness [9,10,13,15,16,19–22].It has been found that the content of various forms of silicides determines the hardness of these alloys.The major contribution to the resulting hardness is mainly caused by the FeSi phase, which is knownfor its high hardness of 958 HV 1 [19]. Accordingly, to the work of Wu et al. [23], the FeSi phase exhibitsthe third-highest calculated hardness among the phases present in the Fe–Si binary system. Accordingto this, the FeAlSi alloys were reported to exhibit the hardness of 730 HV 5 in case of FeAl10Si30alloy [13–15]. On the other hand, the increase in Al content at the expense of Si results in a hardnessdecrease down to 440 HV 5 in the FeAl30Si10 alloy.
A further increase in the hardness and strength of the FeAlSi alloys may be achieved by thealloying of transition elements, especially Ni and Mo. Up to now, almost no reports have mentioned theinfluence of these elements on the microstructure and properties of quaternary and foremostly quinaryalloys. Novák et al. [24] reported that the addition of Ni in the FeAl20Si20 (wt %) alloy prepared byreactive synthesis resulted in a decrease of porosity while increasing the hardness and wear resistanceas well as thermal stability and oxidation resistance at 800 ◦C. The same alloy, although preparedby mechanical alloying (MA) and compacted via spark plasma sintering (SPS), showed quite similarresults, increasing the hardness and compressive strength from 1049 HV 1 up to 1376 HV 1 and from1085 MPa up to over 1800 MPa [25].
The Fe–Al–Si-based alloys are in general prepared by powder metallurgy, which overcomes theproblems experienced during cast-metallurgy processes. Especially, the MA is capable of providingand retaining the beneficial microstructural refinement and homogeneity, which further improves themechanical properties [26–30]. During the process, a highly localized cold welding allowing only alimited diffusion of elements; continuous fracturing and deformation strengthening is responsiblefor the ultrafine or even nanocrystalline microstructure of the alloys [27,31,32]. As a compactionmethod, various techniques including uniaxial pressing and isostatic pressing, both done at elevatedtemperatures, seem to be failing to deliver expected results. The main setback is a long duration of theprocesses allowing microstructural coarsening, which deteriorates the desirable properties gained bythe MA [33]. Thus, the fast compaction via SPS is capable of providing almost full-density compactsand is especially of interest.
Thus, the present work describes the influence of Ni and Mo addition onto the complex propertiesof FeAl20Si20 alloy prepared by a combination of mechanical alloying and spark plasma sintering.The aim was to describe the effects of the different amounts of Ni and Mo as alloying elements on themicrostructure, mechanical properties, and thermal stability, including oxidation resistance.
Materials 2020, 13, 292 3 of 17
2. Materials and Methods
The FeAl20Si20Mo20-XNiX (X = 5–15 wt %) alloys were prepared from pure elements, which weremixed in appropriate amounts forming 20 g powder batches for mechanical alloying (MA). For thispurpose, powders of Fe (purity of 99.9%, Strem Chemicals, Newburyport, US), Al (purity of 99.7%,Strem Chemicals, Newburyport, MA, US), Si (purity of 99.5%, Alfa Aesar, Lancashire, UK), Mo (purityof 99.5%, Alfa Aesar, Lancashire, UK), and Ni (purity of 99.5%, Merck, Darmstadt, United Kingdom)were used. The powders were placed into a milling jar together with milling balls, which were bothmade from AISI 420 stainless steel. Afterwards, the jar was sealed and flushed with Ar (purity of99.996%) for 2 min with a constant flow of 2 l/min. Mechanical alloying was done in a milling deviceRetsch PM100 CM (Retsch, Haan, Germany) for 10.5 h while for each 30 min of the process, a short10-min pause was maintained to suppress the excessive cold welding.
Then, prepared powders were compacted via spark plasma sintering (SPS, FCT Systeme, HP-D10, Rauenstein, Germany) using a heating rate of 300 ◦C/min until reaching 900 ◦C, after which theheating rate was reduced to only 100 ◦C/min. The samples were compacted at a temperature of 1000 ◦Cwith a pressure of 48 MPa and remained at this temperature for 10 min. Afterwards, the samples wereslowly cooled down to 300 ◦C with a speed of 50 ◦C/min to reduce the thermal stress–strains withinthe sample. Prepared samples were cut using a diamond blade cutting device (Leco Precision VC-50Vari-Cut, St. Joseph, US) into samples which were either used for microstructural investigations of formechanical testing.
Present phases were determined by powder X-ray diffraction (XRD, Bruker D8 Advance, Karlsruhe,Germany, CuKα radiation and LynxEye-XE detector), while the actual chemical composition of theprepared samples was determined by X-ray fluorescence analysis (XRF, ARL 9400 XP, Thermo ARL,Switzerland). Semi-quantitative phase analysis, as well as the calculation of lattice and microstructuralparameters were performed by the Rietveld method using the Topas 5 program (Bruker AXS, 2014).The microstructure of the prepared cross-sections was investigated using scanning electron microscopy(SEM, Tescan Lyra, Brno, Czech Republic) equipped with an energy-dispersive spectrometer (EDS,Oxford Instruments, 80 mm2, High Wycombe, United Kingdom). The surface porosity was determinedusing light microscopy (LM, Olympus PME-3, Tokyo, Japan), obtaining at least 20 micrographs with atotal area of 0.55 mm2, which were then analyzed by the threshold method.
For the compressive tests, cuboid samples with a height length corresponding to 1.5 times thelength of the bottom side were used. The compressive tests were done on a universal testing device(LabTest SP 250.1-VM, Labortech s.r.o., Opava, Czech Republic) with a strain speed of 0.001 s−1.Prepared alloys were also tested for thermal stability, which was determined by the hardness changeduring long-term annealing and by compressive tests, which were done either at laboratory temperatureafter annealing or at an elevated temperature of 800 ◦C.
Furthermore, the samples were also investigated for the kinetics of cyclic oxidation at 800 ◦C.For this purpose, the samples were placed into the electric resistance furnace for time segmentscomposed of 4, 9, 25, 50, 75, and 100 h, and then cooled down outside the furnace. The weight gaindue to a formation of oxidic products was measured on an analytical balance (Pioneer PA224, Ohaus,Parsippany, NJ, US).
To fully describe the mechanical properties, tribological tests were done using a pin-on-disc setup(TRIBOtechnic, Clichy, France). The tests were done on polished samples at laboratory temperature inan oscillating regime with an Al2O3 ball 6 mm in diameter that was moving with a speed of 10 mm·s−1
until reaching a total distance of 15 m. The ball was loaded with 5 N, and the wear track profile has beenmeasured with a profilometer. The temperature and humidity during the tests were constant duringall the tests corresponding to 22.2 ◦C and 35.5%. Obtained results were compared with the results oftool steels 1.2379 (AISI D2) and 1.3343 (AISI M 2) supplied from an external company. Both the steelswere heat-treated by the supplier accordingly to the conditions specified in the relevant standards.
Materials 2020, 13, 292 4 of 17
3. Results and Discussion
3.1. Phase Composition and Microstructure
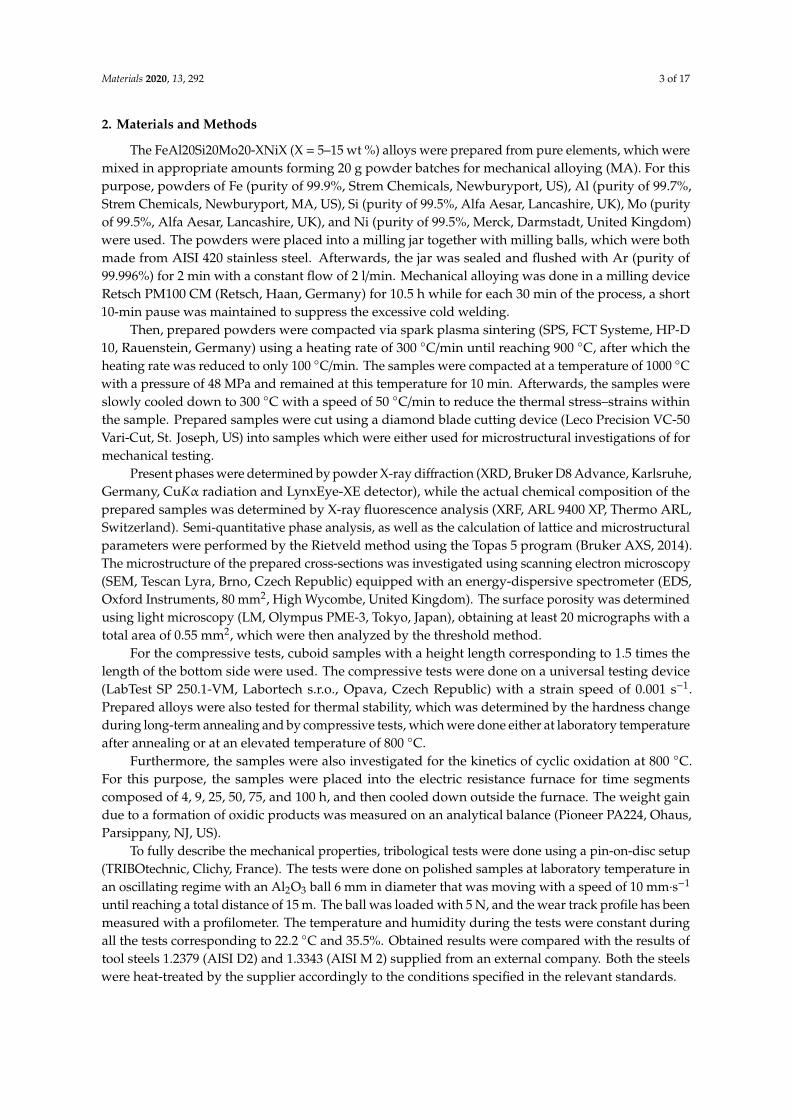
The phase composition of all the MA + SPS alloys has been determined by the Rietveld X-raydiffraction analysis, and the patterns are shown in Figure 1. Accordingly to the results, all the preparedalloys were composed of two binary FeSi and Fe3Si phases and of two ternary Fe3Al2Si3 and AlMoSiphases, and the lattice parameters are shown in Table 1. Compared to the work of others [34–36], theshort-term MA formed only intermetallic phases instead of solid solutions, which are created duringmuch longer process durations. It was discovered that the different amount of the Mo and Ni additiondid not change the phase compositions within the tested range of chemical compositions. All thephases were showing the presence of crystallites with average dimensions around 50 nm (Table 2).Only the FeSi phase in the MA + SPS FeAl20Si20Mo5Ni15 alloy contained larger crystallites withaverage dimensions of 100 nm. The volume fraction of the phases varied with the increasing content ofMo, favoring the formation of a ternary AlMoSi phase. Thus, the content of the AlMoSi phase increasedfrom 8.5 wt % up to 23.0 wt %, mostly at the expanse of the FeSi phase. All of the mentioned phaseswere saturated with other elements, which slightly changed the lattice parameters when compared tothe known values.
Figure 1. XRD diffraction patterns of the mechanical alloying and spark plasma sintering (MA + SPS)FeAl20Si20-Mo-Ni (wt %) alloys containing Mo and Ni in a range from 5–15 wt %.
Table 1. Lattice parameters determined by the XRD analysis of present phases identified in the MA +
SPS FeAl20Si20-Mo-Ni alloys.
PhasesLattice Parameters
a (nm) b (nm) c (nm) α (◦) β (◦) γ (◦)
FeSi 0.4519 ± 0.0001 – – – – –Fe3Al2Si3 0.4668 ± 0.0003 0.6325 ± 0.0004 0.7486 ± 0.0004 101.12 ± 0.04 105.88 ± 0.04 101.32 ± 0.04
Fe3Si 0.5637 ± 0.0001 – – – – –AlMoSi 0.4655 ± 0.0002 – 0.6532 ± 0.0004 – – –
FeSi 0.4530 ± 0.0001 – – – – –Fe3Al2Si3 0.4707 ± 0.0003 0.6222 ± 0.0004 0.7472 ± 0.0004 100.60 ± 0.04 105.36 ± 0.05 101.87 ± 0.05
Fe3Si 0.5688 ± 0.0001 – – – – –AlMoSi 0.4668 ± 0.0001 – 0.6538 ± 0.0001 – – –
FeSi 0.4530 ± 0.0001 – – – – –Fe3Al2Si3 0.4686 ± 0.0002 0.6320 ± 0.0002 0.7504 ± 0.0003 100.95 ± 0.01 105.70 ± 0.02 101.54 ± 0.03
Fe3Si 0.5684 ± 0.0001 – – – – –AlMoSi 0.4665 ± 0.0001 – 0.6539 ± 0.0002 – – –
In comparison to our previous work [37], the addition of Mo and Ni resulted in the formationof an AlMoSi phase, which depleted the content of the elements within the remaining phases. As aresult, the lattice parameters of the FeSi, Fe3Si, and Al2Fe3Si3 phases were in the majority of the caseslower compared to the lattice parameters obtained for identical phases in the FeAl20Si20 alloy. Theseresults also differed from results observed by others, which, e.g., either calculated the values of theFe3Si phase as a = 0.5650 nm [38] or determined the values of Fe3Al2Si3 by an XRD measurement [39].
Materials 2020, 13, 292 5 of 17
The observed change in the lattice parameters was caused by the partial substitution of elements thatcaused stress–strains in the lattice, changing its parameters. Such observations have been alreadymentioned in our previous work [37] and the works of others [16,40].
Table 2. The phase parameters, phase fractions, and crystallite sizes determined by Rietveld analysis.
Alloy Phases Space Group Wt % Crystallite Size (nm)
FeAl20Si20Mo5Ni15
FeSi P213 32.5 ± 0.1 100Fe3Al2Si3 P1 24.5 ± 0.1 ≈ 50
Fe3Si Fm3m 34.5 ± 0.1 43AlMoSi P6222 8.5 ± 0.1 63
FeAl20Si20Mo10Ni10
FeSi P213 30.0 ± 0.1 65Fe3Al2Si3 P1 18.5 ± 0.2 ≈ 50
Fe3Si Fm3m 39.0 ± 0.1 35AlMoSi P6222 12.5 ± 0.1 ≈ 60
FeAl20Si20Mo15Ni5
FeSi P213 17.0 ± 0.1 50Fe3Al2Si3 P1 27.0 ± 0.2 ≈ 50
Fe3Si Fm3m 33.0 ± 0.1 40AlMoSi P6222 23.0 ± 0.1 55
It should be noted that the increasing content of the AlMoSi phase was followed by a decrease ofthe FeSi phase, reducing from 32.5 wt % to 17.0 wt %, which corresponded to FeAl20Si20Mo15Ni5alloy. Additionally, the peak width was almost the same in all the alloys, which coincided withmicrostructural observations that confirmed almost identical dimensions of phases, regardless of thechemical composition.
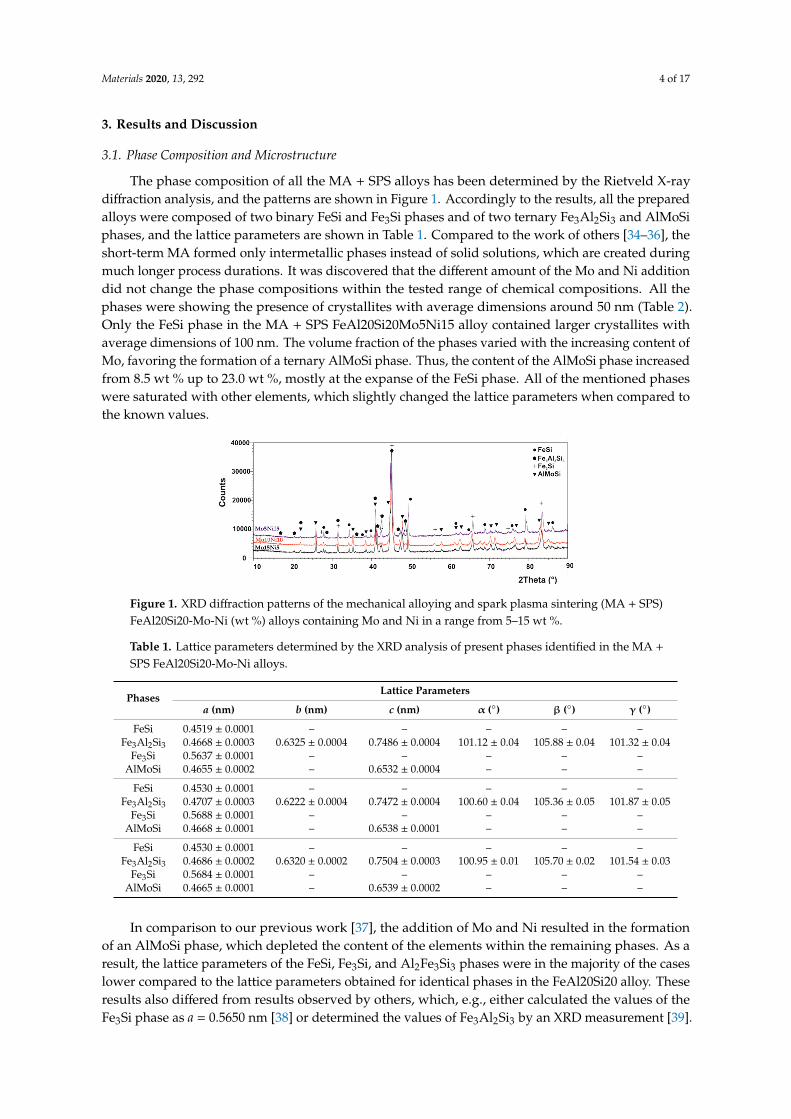
The surface porosity of the prepared MA + SPS alloys (Figure 2) has been determined by athreshold method for which the light micrographs prior etching were used. All of the prepared alloyswere showing almost comparable porosity around 1.6%, which is almost three times higher than ofthe FeAl20Si20 alloys prepared by the same conditions [37]. The reason for the higher porosity mightbe found in the increased lattice stress–strains in present FeSi, Fe3Si, and Al2Fe3Si3 phases due totheir enrichment by alloying elements. Besides, the formation of fine-grained AlMoSi phases alsocontributed to the overall strengthening of the material and further decreasing the plasticity duringSPS compaction. Thus, the porosity could be only decreased using higher compaction temperatures,which would, on the other hand, promote a higher rate of microstructural coarsening that woulddeteriorate the overall mechanical properties.
Figure 2. Surface porosity of the prepared MA + SPS FeAl20Si20-Mo-Ni alloys depending on the actualcontent of Mo and Ni within the alloy.
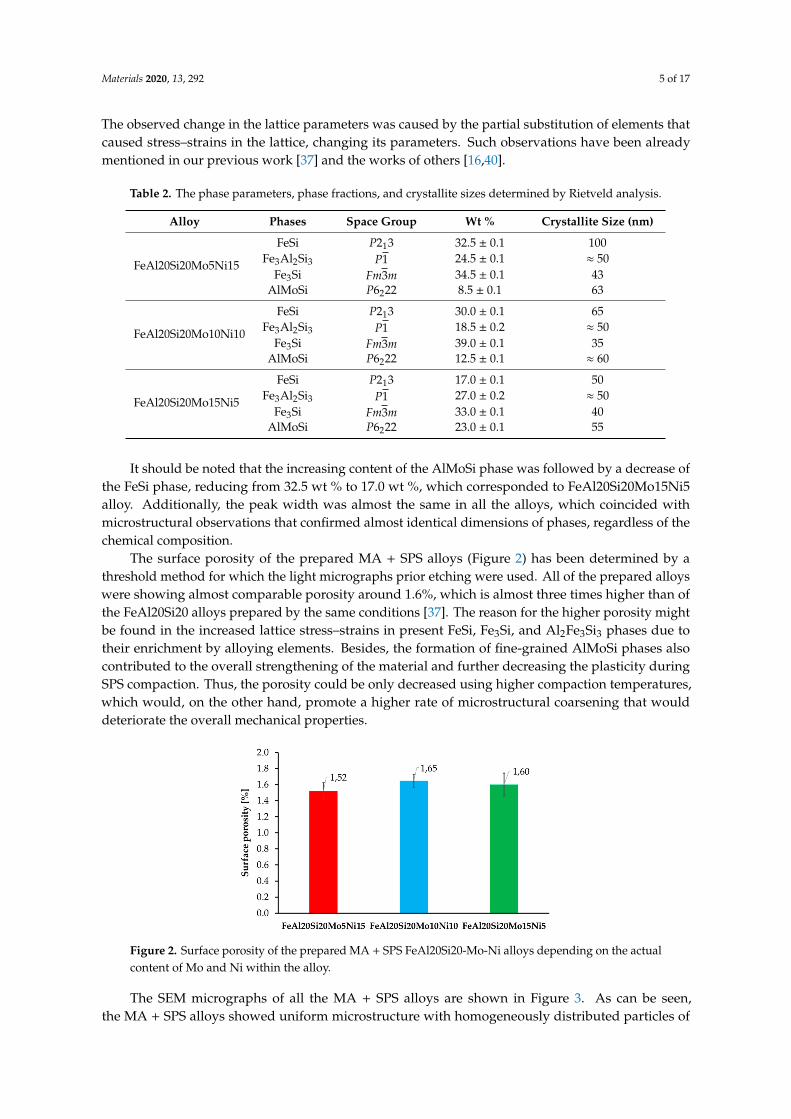
The SEM micrographs of all the MA + SPS alloys are shown in Figure 3. As can be seen,the MA + SPS alloys showed uniform microstructure with homogeneously distributed particles of
Materials 2020, 13, 292 6 of 17
intermetallic phases. These phases were mostly polyhedral in shape with various dimensions, as isshown. The present phases were roughly distinguished based on the physical background of the usedbackscattered electron detector, which displays elements with higher atomic number as bright areas,while lighter atoms manifest themselves as darker objects. Thus, based on the observations, threeevident areas with different chemical content were discovered. The brightest rounded particles withan average diameter below 200 nm were containing Mo and thus corresponded to the AlMoSi phase.The bright gray and middle gray phases were showing sufficient brightness, suggesting the presenceof elements such as Fe and Si, identifying themselves as FeSi or Fe3Si phases. The dark gray phaseswere showing the presence of light elements such as Al, and thus were initially identified as Fe3Al2Si3phases. Among these phases, small dark and rounded objects were also observed. The particlescould be either pores, which formed during etching in a reagent containing fluoride ions, or oxideparticles. The origin of oxides particles might be found in the pre-oxidized powders, since the processof mechanical alloying was done in a protective Ar atmosphere. Comparing all the alloys used forMA, the lowest standard Gibbs energy of ∆G 298,16 = –1584.0 kJ·mol−1 corresponded to the formationof Al2O3, followed by the value of Fe3O4 (∆G 298,16 = −1015.3 kJ·mol−1) [41]. When compared toother alloys, these oxides exhibit the highest affinity to oxygen and thus are the primary sourcesof contamination via oxygen. Among the oxidic particles, the presence of small dimples caused byfluorine ions, which were present in the etching solution, was observed.
Figure 3. SEM micrographs of the MA + SPS FeAl20Si20-Mo-Ni alloys showing (a) FeAl20Si20Mo5Ni15;(b) FeAl20Si20Mo10Ni10; and (c) FeAl20Si20Mo15Ni5 alloys (a combination of BSE+SE detectorswas used).
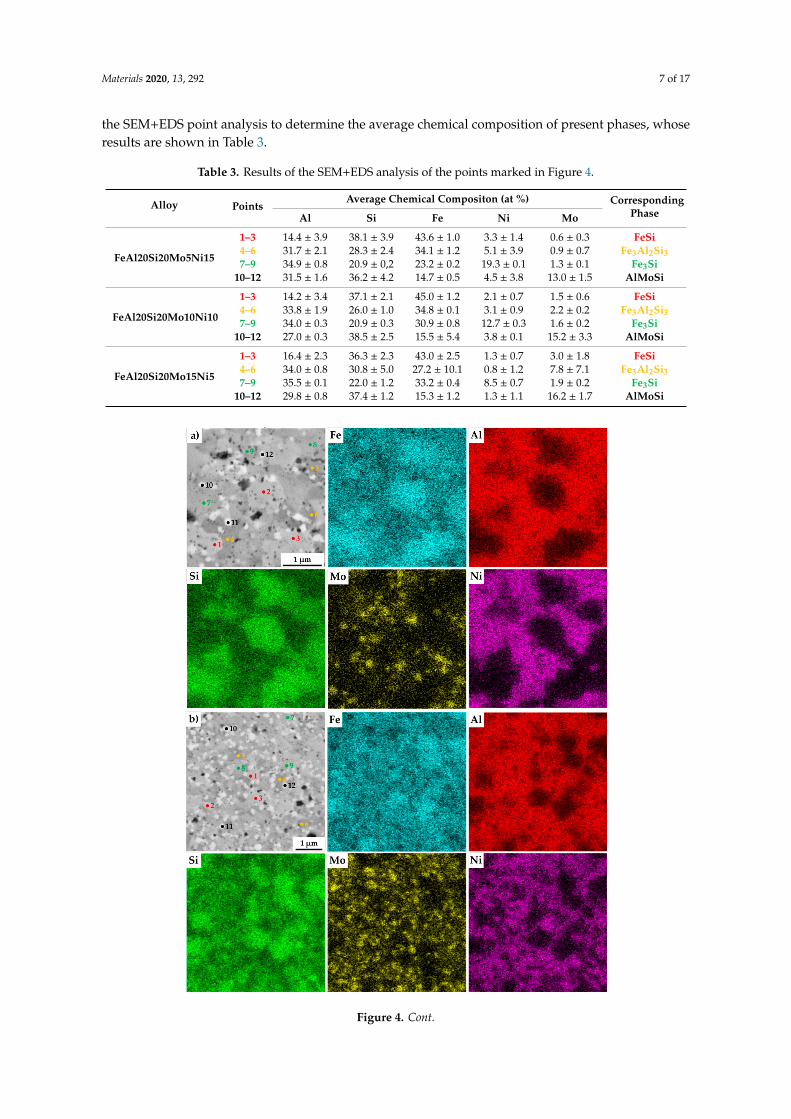
The present phases were distinguished by SEM+EDS element distribution maps, as shown inFigure 4. The maps show large areas, which were enriched mainly in Fe and Si. On the otherhand, the areas enriched in Al were also containing Ni. Nevertheless, the present phases werehardly distinguishable by the appearance of the element distribution map, since the elements oftensupersaturate the phases, exceeding the expected concentrations. Such observations are nothingunusual, considering that the preparation via MA can be briefly described as a non-equilibria processallowing the creation of phases that are enriched of other elements. Thus, these areas were analyzed by
Materials 2020, 13, 292 7 of 17
the SEM+EDS point analysis to determine the average chemical composition of present phases, whoseresults are shown in Table 3.
Table 3. Results of the SEM+EDS analysis of the points marked in Figure 4.
Alloy PointsAverage Chemical Compositon (at %) Corresponding
PhaseAl Si Fe Ni Mo
FeAl20Si20Mo5Ni15
1–3 14.4 ± 3.9 38.1 ± 3.9 43.6 ± 1.0 3.3 ± 1.4 0.6 ± 0.3 FeSi4–6 31.7 ± 2.1 28.3 ± 2.4 34.1 ± 1.2 5.1 ± 3.9 0.9 ± 0.7 Fe3Al2Si37–9 34.9 ± 0.8 20.9 ± 0,2 23.2 ± 0.2 19.3 ± 0.1 1.3 ± 0.1 Fe3Si
10–12 31.5 ± 1.6 36.2 ± 4.2 14.7 ± 0.5 4.5 ± 3.8 13.0 ± 1.5 AlMoSi
FeAl20Si20Mo10Ni10
1–3 14.2 ± 3.4 37.1 ± 2.1 45.0 ± 1.2 2.1 ± 0.7 1.5 ± 0.6 FeSi4–6 33.8 ± 1.9 26.0 ± 1.0 34.8 ± 0.1 3.1 ± 0.9 2.2 ± 0.2 Fe3Al2Si37–9 34.0 ± 0.3 20.9 ± 0.3 30.9 ± 0.8 12.7 ± 0.3 1.6 ± 0.2 Fe3Si
10–12 27.0 ± 0.3 38.5 ± 2.5 15.5 ± 5.4 3.8 ± 0.1 15.2 ± 3.3 AlMoSi
FeAl20Si20Mo15Ni5
1–3 16.4 ± 2.3 36.3 ± 2.3 43.0 ± 2.5 1.3 ± 0.7 3.0 ± 1.8 FeSi4–6 34.0 ± 0.8 30.8 ± 5.0 27.2 ± 10.1 0.8 ± 1.2 7.8 ± 7.1 Fe3Al2Si37–9 35.5 ± 0.1 22.0 ± 1.2 33.2 ± 0.4 8.5 ± 0.7 1.9 ± 0.2 Fe3Si
10–12 29.8 ± 0.8 37.4 ± 1.2 15.3 ± 1.2 1.3 ± 1.1 16.2 ± 1.7 AlMoSi
Figure 4. Cont.
Materials 2020, 13, 292 8 of 17
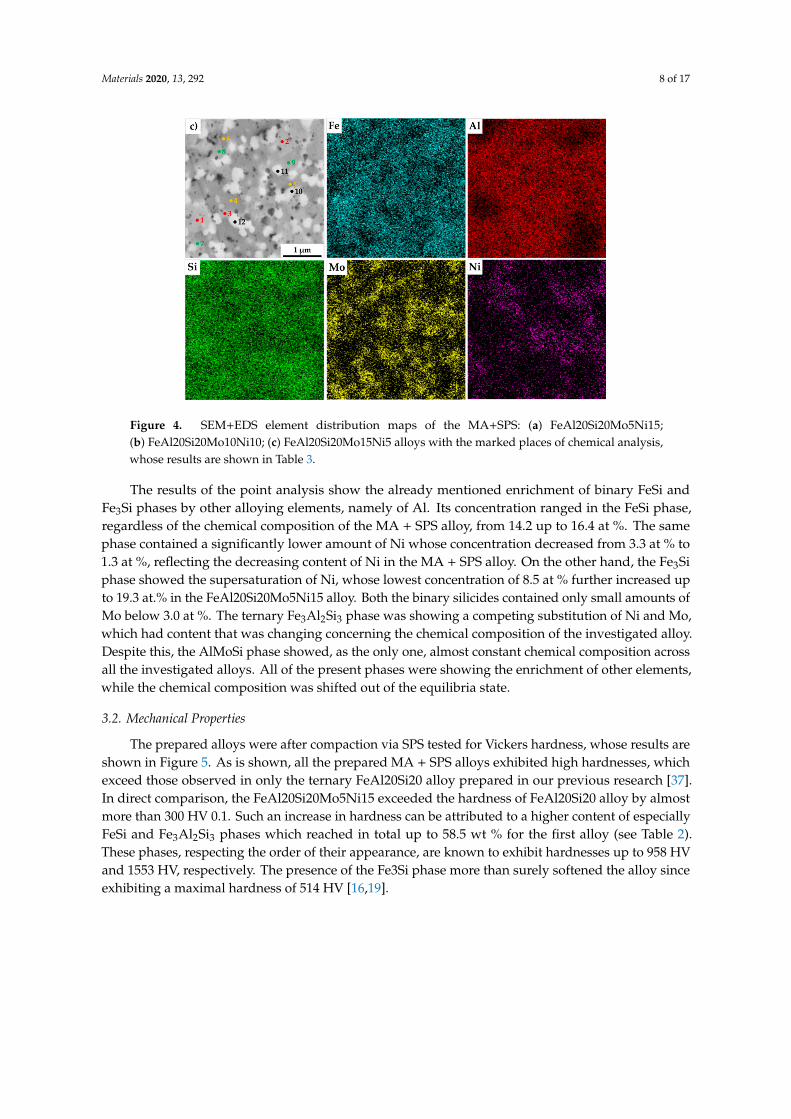
Figure 4. SEM+EDS element distribution maps of the MA+SPS: (a) FeAl20Si20Mo5Ni15;(b) FeAl20Si20Mo10Ni10; (c) FeAl20Si20Mo15Ni5 alloys with the marked places of chemical analysis,whose results are shown in Table 3.
The results of the point analysis show the already mentioned enrichment of binary FeSi andFe3Si phases by other alloying elements, namely of Al. Its concentration ranged in the FeSi phase,regardless of the chemical composition of the MA + SPS alloy, from 14.2 up to 16.4 at %. The samephase contained a significantly lower amount of Ni whose concentration decreased from 3.3 at % to1.3 at %, reflecting the decreasing content of Ni in the MA + SPS alloy. On the other hand, the Fe3Siphase showed the supersaturation of Ni, whose lowest concentration of 8.5 at % further increased upto 19.3 at.% in the FeAl20Si20Mo5Ni15 alloy. Both the binary silicides contained only small amounts ofMo below 3.0 at %. The ternary Fe3Al2Si3 phase was showing a competing substitution of Ni and Mo,which had content that was changing concerning the chemical composition of the investigated alloy.Despite this, the AlMoSi phase showed, as the only one, almost constant chemical composition acrossall the investigated alloys. All of the present phases were showing the enrichment of other elements,while the chemical composition was shifted out of the equilibria state.
3.2. Mechanical Properties
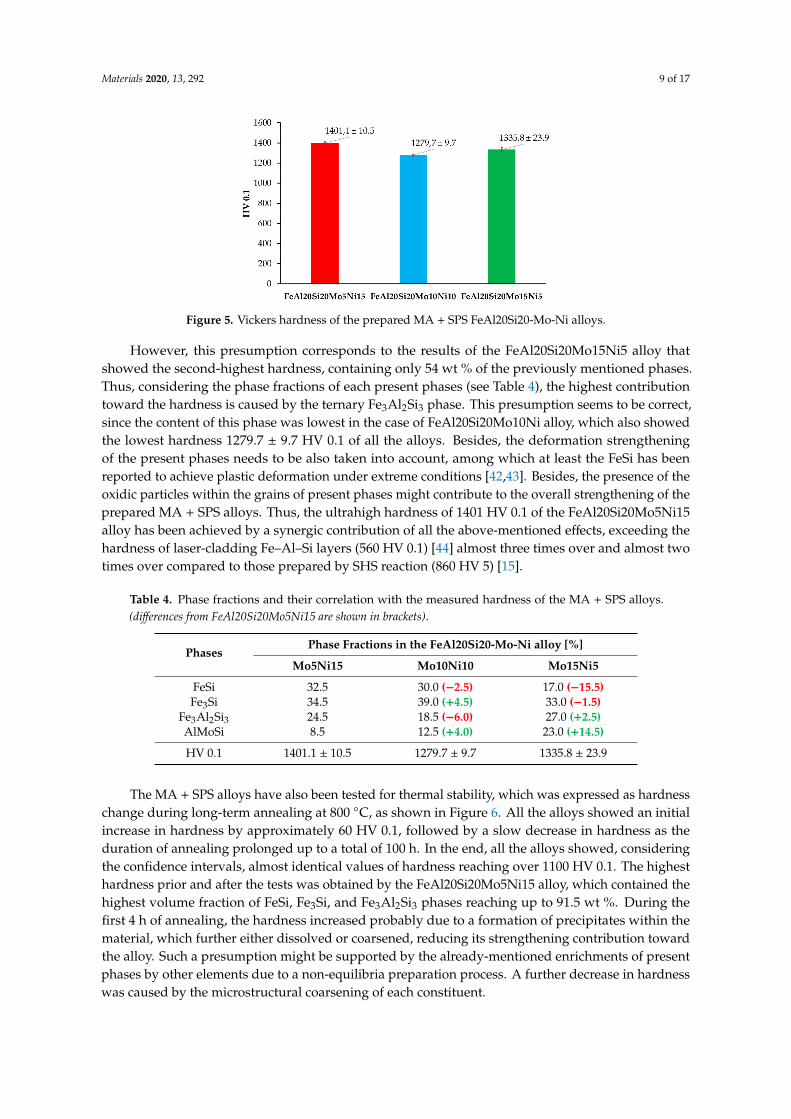
The prepared alloys were after compaction via SPS tested for Vickers hardness, whose results areshown in Figure 5. As is shown, all the prepared MA + SPS alloys exhibited high hardnesses, whichexceed those observed in only the ternary FeAl20Si20 alloy prepared in our previous research [37].In direct comparison, the FeAl20Si20Mo5Ni15 exceeded the hardness of FeAl20Si20 alloy by almostmore than 300 HV 0.1. Such an increase in hardness can be attributed to a higher content of especiallyFeSi and Fe3Al2Si3 phases which reached in total up to 58.5 wt % for the first alloy (see Table 2).These phases, respecting the order of their appearance, are known to exhibit hardnesses up to 958 HVand 1553 HV, respectively. The presence of the Fe3Si phase more than surely softened the alloy sinceexhibiting a maximal hardness of 514 HV [16,19].
Materials 2020, 13, 292 9 of 17
Figure 5. Vickers hardness of the prepared MA + SPS FeAl20Si20-Mo-Ni alloys.
However, this presumption corresponds to the results of the FeAl20Si20Mo15Ni5 alloy thatshowed the second-highest hardness, containing only 54 wt % of the previously mentioned phases.Thus, considering the phase fractions of each present phases (see Table 4), the highest contributiontoward the hardness is caused by the ternary Fe3Al2Si3 phase. This presumption seems to be correct,since the content of this phase was lowest in the case of FeAl20Si20Mo10Ni alloy, which also showedthe lowest hardness 1279.7 ± 9.7 HV 0.1 of all the alloys. Besides, the deformation strengtheningof the present phases needs to be also taken into account, among which at least the FeSi has beenreported to achieve plastic deformation under extreme conditions [42,43]. Besides, the presence of theoxidic particles within the grains of present phases might contribute to the overall strengthening of theprepared MA + SPS alloys. Thus, the ultrahigh hardness of 1401 HV 0.1 of the FeAl20Si20Mo5Ni15alloy has been achieved by a synergic contribution of all the above-mentioned effects, exceeding thehardness of laser-cladding Fe–Al–Si layers (560 HV 0.1) [44] almost three times over and almost twotimes over compared to those prepared by SHS reaction (860 HV 5) [15].
Table 4. Phase fractions and their correlation with the measured hardness of the MA + SPS alloys.(differences from FeAl20Si20Mo5Ni15 are shown in brackets).
PhasesPhase Fractions in the FeAl20Si20-Mo-Ni alloy [%]
Mo5Ni15 Mo10Ni10 Mo15Ni5
FeSi 32.5 30.0 (−2.5) 17.0 (−15.5)Fe3Si 34.5 39.0 (+4.5) 33.0 (−1.5)
Fe3Al2Si3 24.5 18.5 (−6.0) 27.0 (+2.5)AlMoSi 8.5 12.5 (+4.0) 23.0 (+14.5)
HV 0.1 1401.1 ± 10.5 1279.7 ± 9.7 1335.8 ± 23.9
The MA + SPS alloys have also been tested for thermal stability, which was expressed as hardnesschange during long-term annealing at 800 ◦C, as shown in Figure 6. All the alloys showed an initialincrease in hardness by approximately 60 HV 0.1, followed by a slow decrease in hardness as theduration of annealing prolonged up to a total of 100 h. In the end, all the alloys showed, consideringthe confidence intervals, almost identical values of hardness reaching over 1100 HV 0.1. The highesthardness prior and after the tests was obtained by the FeAl20Si20Mo5Ni15 alloy, which contained thehighest volume fraction of FeSi, Fe3Si, and Fe3Al2Si3 phases reaching up to 91.5 wt %. During thefirst 4 h of annealing, the hardness increased probably due to a formation of precipitates within thematerial, which further either dissolved or coarsened, reducing its strengthening contribution towardthe alloy. Such a presumption might be supported by the already-mentioned enrichments of presentphases by other elements due to a non-equilibria preparation process. A further decrease in hardnesswas caused by the microstructural coarsening of each constituent.
Materials 2020, 13, 292 10 of 17
Figure 6. Thermal stability of the MA + SPS alloys expressed as HV 0.1 change during long-termannealing at 800 ◦C.
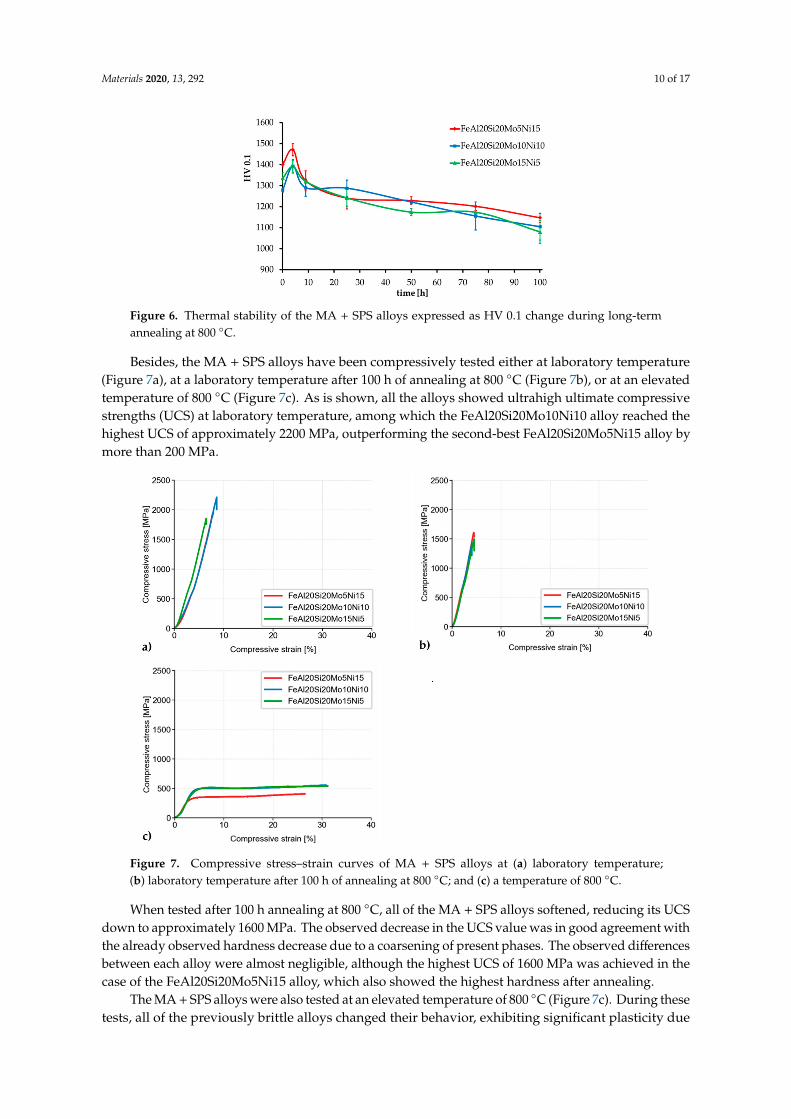
Besides, the MA + SPS alloys have been compressively tested either at laboratory temperature(Figure 7a), at a laboratory temperature after 100 h of annealing at 800 ◦C (Figure 7b), or at an elevatedtemperature of 800 ◦C (Figure 7c). As is shown, all the alloys showed ultrahigh ultimate compressivestrengths (UCS) at laboratory temperature, among which the FeAl20Si20Mo10Ni10 alloy reached thehighest UCS of approximately 2200 MPa, outperforming the second-best FeAl20Si20Mo5Ni15 alloy bymore than 200 MPa.
Figure 7. Compressive stress–strain curves of MA + SPS alloys at (a) laboratory temperature;(b) laboratory temperature after 100 h of annealing at 800 ◦C; and (c) a temperature of 800 ◦C.
When tested after 100 h annealing at 800 ◦C, all of the MA + SPS alloys softened, reducing its UCSdown to approximately 1600 MPa. The observed decrease in the UCS value was in good agreement withthe already observed hardness decrease due to a coarsening of present phases. The observed differencesbetween each alloy were almost negligible, although the highest UCS of 1600 MPa was achieved in thecase of the FeAl20Si20Mo5Ni15 alloy, which also showed the highest hardness after annealing.
The MA + SPS alloys were also tested at an elevated temperature of 800 ◦C (Figure 7c). During thesetests, all of the previously brittle alloys changed their behavior, exhibiting significant plasticity due
Materials 2020, 13, 292 11 of 17
to the activation of non-discrete dislocation movements. Although the tests were done at elevatedtemperature, the FeAl20Si20Mo10Ni10 and FeAl20Si20Mo15Ni5 showed almost identical values ofcompressive yield strength (CYS), which were 428 and 437 MPa, respectively.
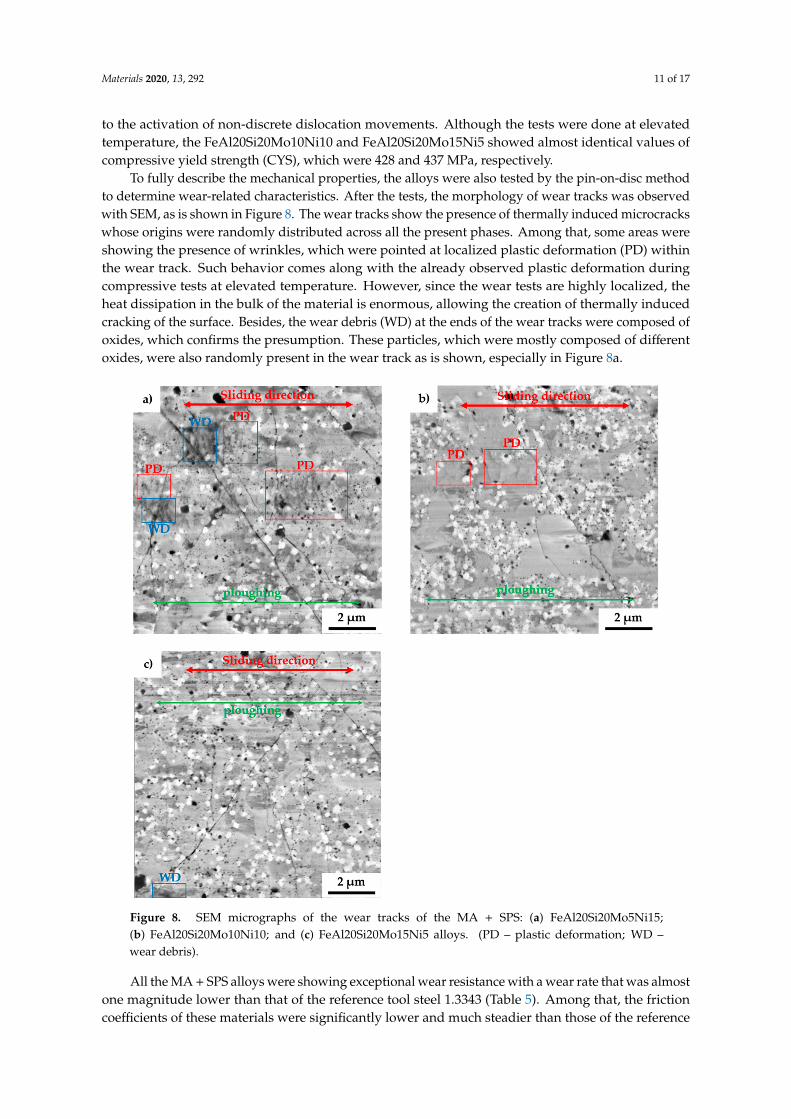
To fully describe the mechanical properties, the alloys were also tested by the pin-on-disc methodto determine wear-related characteristics. After the tests, the morphology of wear tracks was observedwith SEM, as is shown in Figure 8. The wear tracks show the presence of thermally induced microcrackswhose origins were randomly distributed across all the present phases. Among that, some areas wereshowing the presence of wrinkles, which were pointed at localized plastic deformation (PD) withinthe wear track. Such behavior comes along with the already observed plastic deformation duringcompressive tests at elevated temperature. However, since the wear tests are highly localized, theheat dissipation in the bulk of the material is enormous, allowing the creation of thermally inducedcracking of the surface. Besides, the wear debris (WD) at the ends of the wear tracks were composed ofoxides, which confirms the presumption. These particles, which were mostly composed of differentoxides, were also randomly present in the wear track as is shown, especially in Figure 8a.
Figure 8. SEM micrographs of the wear tracks of the MA + SPS: (a) FeAl20Si20Mo5Ni15;(b) FeAl20Si20Mo10Ni10; and (c) FeAl20Si20Mo15Ni5 alloys. (PD – plastic deformation; WD –wear debris).
All the MA + SPS alloys were showing exceptional wear resistance with a wear rate that was almostone magnitude lower than that of the reference tool steel 1.3343 (Table 5). Among that, the frictioncoefficients of these materials were significantly lower and much steadier than those of the reference
Materials 2020, 13, 292 12 of 17
tool steels. The lowest friction coefficient of 0.446 was achieved in the case of FeAl20Si20Mo10Ni10alloy, which also exhibited the lowest wear rate of 3.14 10−6 mm3
·N−1·m−1. On the other hand, the
reference tool steels were showing significantly higher friction coefficients as well as higher wearrates reaching up to 1.46 10−5 mm3
·N−1·m−1. Such a high friction coefficient indicated high tangential
forces between the ball and tested materials, which need to be overcome to maintain the movementduring the wear test. As a result, a lot of energy dissipates during the intensive plastic deformation ofsublayers beneath the sliding ball. As a result, the wear track of the tool steels contained deep andwide grooves from ploughing the released particles, enhancing the three-body abrasion.
Table 5. Results of the wear tests done at laboratory temperatures of all the MA + SPS alloys and tworeferences (Ra – surface roughness).
Alloy Ra (µm) Wear(mm3
·N−1·m−1)RSD (±) Friction
Coefficient (–)
FeAl20Si20Mo5Ni15 0.0166 5.97 × 10⁻⁶ 3.33 × 10⁻⁷ 0.495FeAl20Si20Mo10Ni10 0.0062 3.14 × 10⁻⁶ 3.00 × 10⁻⁷ 0.446FeAl20Si20Mo15Ni5 0.0139 5.68 × 10⁻⁶ 4.48 × 10⁻⁷ 0.498
Steel 1.2379 0.0096 1.46 × 10⁻⁵ 1.51 × 10⁻⁶ 0.732Steel 1.3343 0.0080 2.84 × 10⁻⁶ 1.93 × 10⁻⁷ 0.669
Compared to that, the MA + SPS alloys showed a rather shallow profile of the wear track withonly minor traces of ploughing, as is shown in Figure 8. The grooves were present in all the observedphases, implying that the cohesion between the phases was sufficient, and none of them chipped off,acting as a powerful abrasive medium that would significantly increase the wear rate. Such behaviorof the MA + SPS alloys was responsible for achieving a low friction coefficient, as was discovered.
These excellent results of wear resistance were a direct consequence of the phase composition of allthe MA + SPS alloys containing binary and ternary silicides, which comes along the ultrafine-grainedmicrostructure and good cohesion of powder particles as well as of the present phases, which did nottend to chip. Considering the high hardness of all the MA + SPS alloys, the primary wear mechanismseems to be oxidation wear together with a minor contribution of abrasive wear. This presumptionis supported by the presence of wrinkles pointing at the plastic deformation that are these materialscapable of only at elevated temperatures as well as by the presence of oxides found within the weartrack or at the end of the wear track.
3.3. Oxidation Resistance
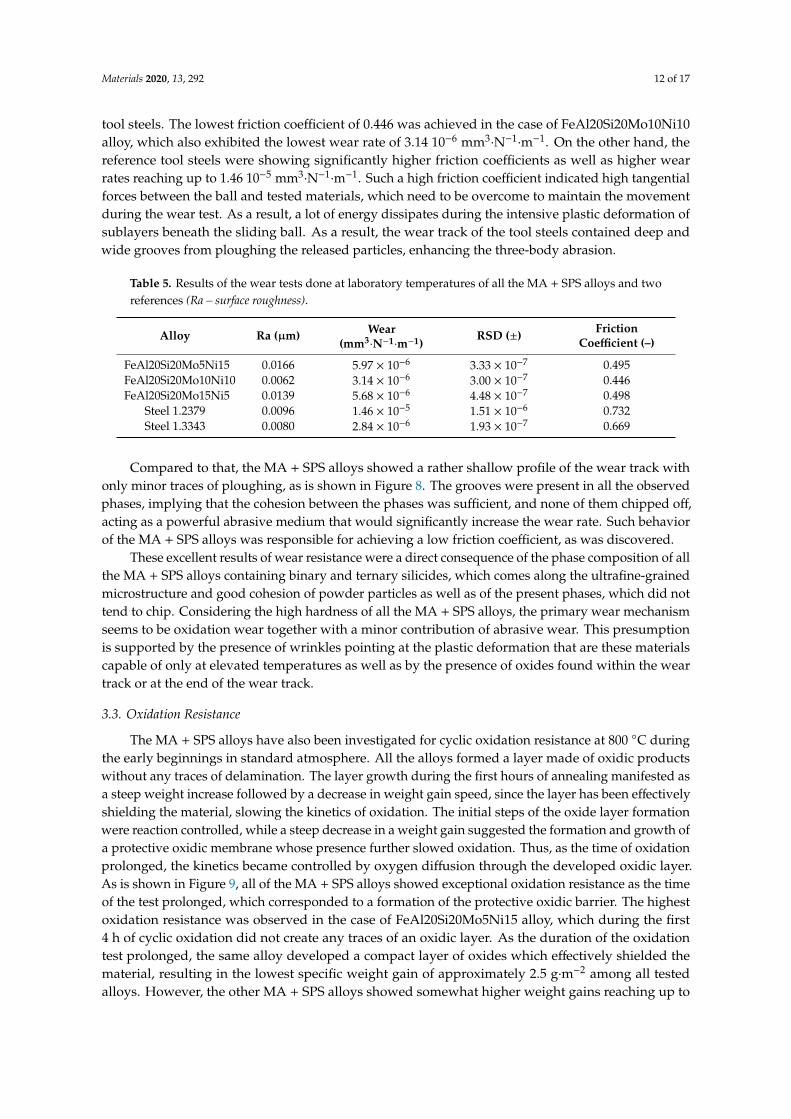
The MA + SPS alloys have also been investigated for cyclic oxidation resistance at 800 ◦C duringthe early beginnings in standard atmosphere. All the alloys formed a layer made of oxidic productswithout any traces of delamination. The layer growth during the first hours of annealing manifested asa steep weight increase followed by a decrease in weight gain speed, since the layer has been effectivelyshielding the material, slowing the kinetics of oxidation. The initial steps of the oxide layer formationwere reaction controlled, while a steep decrease in a weight gain suggested the formation and growth ofa protective oxidic membrane whose presence further slowed oxidation. Thus, as the time of oxidationprolonged, the kinetics became controlled by oxygen diffusion through the developed oxidic layer.As is shown in Figure 9, all of the MA + SPS alloys showed exceptional oxidation resistance as the timeof the test prolonged, which corresponded to a formation of the protective oxidic barrier. The highestoxidation resistance was observed in the case of FeAl20Si20Mo5Ni15 alloy, which during the first4 h of cyclic oxidation did not create any traces of an oxidic layer. As the duration of the oxidationtest prolonged, the same alloy developed a compact layer of oxides which effectively shielded thematerial, resulting in the lowest specific weight gain of approximately 2.5 g·m−2 among all testedalloys. However, the other MA + SPS alloys showed somewhat higher weight gains reaching up to
Materials 2020, 13, 292 13 of 17
10 g·m−2, which are still good enough. It should be noted that due to the limited dimensions of thesamples, the weight gains were typical in the order of mg.
Figure 9. Oxidation kinetics of the MA + SPS FeAl20Si20-Mo-Ni alloys during annealing at 800 ◦C.
An oblique cross-section has been prepared to display the oxidic layer sufficiently. The thicknessof the present oxidic layer (Table 6) obtained via the oblique cross-section has been calculated usingEquation (1):
dr = dm· sin(tan−1
( rs
l
))(1)
where dr is the real thickness of the oxidic layer, dm is the measured thickness on the oblique cross-section;rs is the diameter of used support, and l is the distance between the support and the oxidic layer. As isshown in Table 6, the real thickness of the oxidic layers after 100 h of oxidation done at 800 ◦C wasaround 1 µm.
Table 6. Real thickness of an oxidic layer after 100 h at 800 ◦C observed on an oblique cross-sectioncalculated using Equation (1).
Alloy Thickness of Oxidic Layer (µm)
FeAl20Si20Mo5Ni15 0.99FeAl20Si20Mo10Ni10 1.13FeAl20Si20Mo15Ni5 0.83
The thicknesses of the present oxidic layers observed on oblique cross-sections were after 100 h ofcyclic oxidation almost identical, reaching approximately 1 µm.
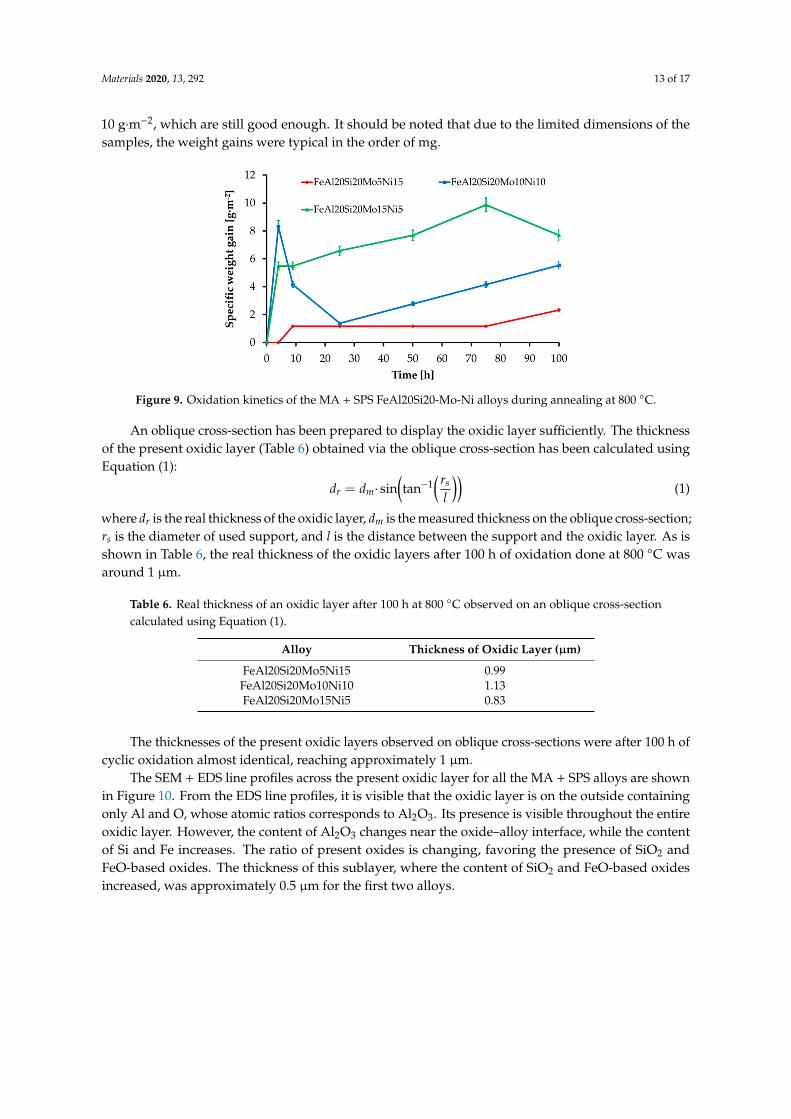
The SEM + EDS line profiles across the present oxidic layer for all the MA + SPS alloys are shownin Figure 10. From the EDS line profiles, it is visible that the oxidic layer is on the outside containingonly Al and O, whose atomic ratios corresponds to Al2O3. Its presence is visible throughout the entireoxidic layer. However, the content of Al2O3 changes near the oxide–alloy interface, while the contentof Si and Fe increases. The ratio of present oxides is changing, favoring the presence of SiO2 andFeO-based oxides. The thickness of this sublayer, where the content of SiO2 and FeO-based oxidesincreased, was approximately 0.5 µm for the first two alloys.
Materials 2020, 13, 292 14 of 17
Figure 10. SEM+EDS linescans across the oxide layers formed on the MA + SPS: (a) FeAl20Si20Mo5Ni15;(b) FeAl20Si20Mo10Ni10; and (c) FeAl20Si20Mo15Ni5 alloys after 100 h of cyclic oxidation at 800 ◦C.
On the other hand, the FeAl20Si20Mo15Ni15 alloy showed an increased concentration of Si alreadyin a distance of 1 µm from the interface of the environment oxidic layer. The increasing concentrationof Si was later followed by an increasing concentration of Fe as the distance increased. The presence of
Materials 2020, 13, 292 15 of 17
Si in the deeper parts of the oxidic layer significantly improved the oxidation resistance, outperformingthose of the other tested MA + SPS alloys.
The formation of Al2O3 layers depleted the sub-areas beneath the layer, showing the presence ofphases whose concentration of elements corresponded to the FeSi phase, still saturated, among otherelements, with Al reaching up to 15 at.%. Such a finding was already discussed in the work of [45],who proposed and also verified that the increased diffusion of Al through the newly developed barrierdepleted the present intermetallic phases from Al, resulting in a formation of silicides. Additionally,some of the previously mentioned black areas were showing an increased concentration of Al and O,whose ratios corresponded to Al2O3. The origin of these particles can be found in partially pre-oxidizedpowder particles of Al and others, which during the MA formed the most thermodynamically stableAl2O3 product.
4. Conclusions
A combination of mechanical alloying and compaction via spark plasma sintering successfullyprepared the FeAl20Si20-Mo-Ni alloys containing from 5–15 wt % of the alloying elements. Preparedalloys showed a uniform microstructure composed of four phases, namely of FeSi, Fe3Si, Fe3Al2Si3,and AlMoSi phases. Formation of the AlMoSi phase increased the hardness and compressive strengthof the alloys. It was found that increasing the amount of Mo in the alloy reduced the fraction of FeSiphase at the expanse of the newly created AlMoSi phase. All of the present phases were enriched withalloying elements, increasing the lattice stress–strains due to their deformation. The main contributiontoward the hardness of the alloys was, among the MA process itself, caused by Fe3Al2Si3, whosecontent together with the second-hardest FeSi phase reached in the FeAl20Si20Mo5Ni15 up to 58.5 wt%.
As a direct correlation with the hardness, the investigated alloys outperformed the reference toolsteels by more than one order of magnitude regarding the wear rate while exhibiting lower frictioncoefficients. The primary wear mechanism was found to be oxidation wear, which subsequentlyallowed abrasive wear due to the presence of oxidic debris. During the cyclic oxidation tests, all thealloys showed exceptional oxidation resistance while creating a compact layer of oxidic products thatwas mainly composed of Al2O3 without any traces of delamination. Furthermore, it was found thatthe highest oxidation resistance of the FeAl20Si20Mo5Ni15 was caused by slightly different ratios ofoxides present in the layer. The oxidic layer was initially composed of Al2O3 at the environment–layerinterface and slightly changed, revealing an increase in the content of Si followed by Fe.
Author Contributions: Conceptualization, F.P.; methodology, F.P.; investigation, O.P., A.Š, V.K., and F.L.; datacuration, A.Š. and V.K.; writing—original draft preparation, F.P.; writing—review and editing, V.K. and A.Š.;funding acquisition, F.P. All authors have read and agreed to the published version of the manuscript.
Funding: This research was carried out in the frame of the project 17-07559S, financed by Czech Science Foundation.
Conflicts of Interest: The authors declare no conflict of interest.
References
1. Xu, C.H.; Gao, W.; He, Y.D. High temperature oxidation behaviour of FeAl intermetallics—Oxide scalesformed in ambient atmosphere. Scr. Mater. 2000, 42, 975–980. [CrossRef]
2. Novák, P.; Zelinková, M.; Šerák, J.; Michalcová, A.; Novák, M.; Vojtech, D. Oxidation resistance of SHSFe–Al–Si alloys at 800 ◦C in air. Intermetallics 2011, 19, 1306–1312. [CrossRef]
3. Sencekova, L.; Palm, M.; Pešicka, J.; Veselý, J. Microstructures, mechanical properties and oxidation behaviourof single-phase Fe3Al (D03) and two-phase α-Fe,Al (A2)+Fe3Al (D03) FeAlV alloys. Intermetallics 2016,73, 58–66. [CrossRef]
4. Sina, H.; Corneliusson, J.; Turba, K.; Iyengar, S. A study on the formation of iron aluminide (FeAl) fromelemental powders. J. Alloy. Compd. 2015, 636, 261–269. [CrossRef]
Materials 2020, 13, 292 16 of 17
5. Li, X.; Prokopcáková, P.; Palm, M. Microstructure and mechanical properties of Fe–Al–Ti–B alloys withadditions of Mo and W. Mater. Sci. Eng. A 2014, 611, 234–241. [CrossRef]
6. Xu, C.H.; Gao, W.; Li, S. Oxidation behaviour of FeAl intermetallics – the effect of Y on the scale spallationresistance. Corros. Sci. 2001, 43, 671–688. [CrossRef]
7. Haušild, P.; Siegl, J.; Málek, P.; Šíma, V. Effect of C, Ti, Zr and B alloying on fracture mechanisms in hot-rolledFe–40 (at.%)Al. Intermetallics 2009, 17, 680–687. [CrossRef]
8. Palm, M. Concepts derived from phase diagram studies for the strengthening of Fe–Al-based alloys.Intermetallics 2005, 13, 1286–1295. [CrossRef]
9. Schmitt, A.; Kumar, K.S.; Kauffmann, A.; Li, X.; Stein, F.; Heilmaier, M. Creep of binary Fe-Al alloys withultrafine lamellar microstructures. Intermetallics 2017, 90, 180–187. [CrossRef]
10. Hadef, F. Solid-state reactions during mechanical alloying of ternary Fe–Al–X (X=Ni, Mn, Cu, Ti, Cr, B, Si)systems: A review. J. Magn. Magn. Mater. 2016, 419, 105–118. [CrossRef]
11. Fei, W.; Kuiry, S.C.; Seal, S. Inhibition of metastable alumina formation on Fe-Cr-Al-Y alloy fibers at hightemperature using titania coating. Oxid. Met. 2004, 62, 29–44. [CrossRef]
12. Kadiri, H.E.; Molins, R.; Bienvenu, Y.; Horstemeyer, M.F. Abnormal High Growth Rates of MetastableAluminas on FeCrAl Alloys. Oxid. Met. 2005, 64, 63–97. [CrossRef]
13. Novák, P.; Knotek, V.; Šerák, J.; Michalcová, A.; Vojtech, D. Synthesis of Fe-Al-Si intermediary phases byreactive sintering. Powder Metall. 2011, 54, 167–171. [CrossRef]
14. Gupta, S.P. Intermetallic compound formation in Fe–Al–Si ternary system: Part I. Mater. Charact. 2002,49, 269–291. [CrossRef]
15. Novák, P.; Knotek, V.; Voderová, M.; Kubásek, J.; Šerák, J.; Michalcová, A.; Vojtech, D. Intermediary phasesformation in Fe–Al–Si alloys during reactive sintering. J. Alloy. Compd. 2010, 497, 90–94. [CrossRef]
16. Novák, P.; Michalcová, A.; Voderová, M.; Šíma, M.; Šerák, J.; Vojtech, D.; Wienerová, K. Effect of reactivesintering conditions on microstructure of Fe–Al–Si alloys. J. Alloy. Compd. 2010, 493, 81–86. [CrossRef]
17. Han, Y.; Ban, C.; Zhang, H.; Nagaumi, H.; Ba, Q.; Cui, J. Investigations on the Solidification Behavior ofAl-Fe-Si Alloy in an Alternating Magnetic Field. Mater. Trans. 2006, 47, 2092–2098. [CrossRef]
18. Golovin, I.S.; Strahl, A.; Neuhäuser, H. Anelastic relaxation and structure of ternary Fe–Al–Me alloys withMe=Co, Cr, Ge, Mn, Nb, Si, Ta, Ti, Zr. Int. J. Mater. Res. 2006, 97, 1078–1092. [CrossRef]
19. Milekhine, V.; Onsøien, M.; Solberg, J.K.; Skaland, T. Mechanical properties of FeSi (ε), FeSi2 (ζα) and Mg2Si.Intermetallics 2002, 10, 743–750. [CrossRef]
20. Galano, M.; Rubiolo, G.H. Creep behaviour of a FeSi-base metallic glass containing nanocrystals. Scr. Mater.2003, 48, 617–622. [CrossRef]
21. Józwiak, S.; Karczewski, K.; Bojar, Z. The effect of loading mode changes during the sintering process on themechanical properties of FeAl intermetallic sinters. Intermetallics 2013, 33, 99–104. [CrossRef]
22. Sundar, R.S.; Deevi, S.C. High-temperature strength and creep resistance of FeAl. Mater. Sci. Eng. A 2003,357, 124–133. [CrossRef]
23. Wu, J.; Chong, X.; Jiang, Y.; Feng, J. Stability, electronic structure, mechanical and thermodynamic propertiesof Fe-Si binary compounds. J. Alloy. Compd. 2017, 693, 859–870. [CrossRef]
24. Novák, P.; Mejzlíková, L.; Hošek, V.; Martínek, M.; Marek, I.; Michalcova, A. Structure and Properties ofFe-Ni-Al-Si Alloys Produced by Powder Metallurgy. Acta Phys. Pol. A 2012, 122, 524–527. [CrossRef]
25. Nová, K.; Novák, P.; Arzel, A.; Pruša, F. Alloying of Fe-Al-Si Alloys by Nickel and Titanium. Manuf. Technol.2018, 18, 645–649. [CrossRef]
26. Józwiak, S.; Karczewski, K.; Bojar, Z. Kinetics of reactions in FeAl synthesis studied by the DTA techniqueand JMA model. Intermetallics 2010, 18, 1332–1337. [CrossRef]
27. Canakci, A.; Erdemir, F.; Varol, T.; Ozkaya, S. Formation of Fe–Al intermetallic coating on low-carbon steelby a novel mechanical alloying technique. Powder Technol. 2013, 247, 24–29. [CrossRef]
28. Dobromyslov, A.V.; Taluts, N.I.; Pilyugin, V.P.; Tolmachev, T.P. Mechanical alloying of Al–Fe alloys usingsevere deformation by high-pressure torsion. Phys. Met. Metallogr. 2015, 116, 942–950. [CrossRef]
29. Neikov, O.D. Handbook of Non-Ferrous Metal Powders; Neikov, O.D., Naboychenko, S.S., Murashova, I.V.,Gopienko, V.G., Frishberg, I.V., Lotsko, D.V., Eds.; Elsevier: Oxford, UK; pp. 63–79. [CrossRef]
30. Cech, J.; Haušild, P.; Karlík, M.; Kadlecová, V.; Capek, J.; Pruša, F.; Novák, P. Mechanical Properties of FeAlSiPowders Prepared by Mechanical Alloying from Different Initial Feedstock Materials. Matériaux Tech. 2019,107, 6. [CrossRef]
Materials 2020, 13, 292 17 of 17
31. Azzaza, S.; Alleg, S.; Sunol, J.J. Phase Transformation in the Ball Milled Fe31Co31Nb8B30 Powders. Adv. Mater.Phys. Chem. 2013, 3, 90–100. [CrossRef]
32. Izadi, S.; Akbari, G.H.; Janghorban, K. Sintering and mechanical properties of mechanically alloyed Fe–Al–(B)nanostructures. J. Alloy. Compd. 2010, 496, 699–702. [CrossRef]
33. Jiang, T. Investigation of Phase Composition and Microstructure of the FeAl Intermetallics CompoundsBulks Fabricated by Mechanical Alloying Process and Hot-Pressing Process. Adv. Mater. Res. 2011, 228,899–904. [CrossRef]
34. Kalita, M.P.C.; Perumal, A.; Srinivasan, A. Structural analysis of mechanically alloyed nanocrystallineFe75Si15Al10 powders. Mater. Lett. 2007, 61, 824–826. [CrossRef]
35. Kalita, M.P.C.; Perumal, A.; Srinivasan, A. Structure and magnetic properties of nanocrystalline Fe75Si25powders prepared by mechanical alloying. J. Magn. Magn. Mater. 2008, 320, 2780–2783. [CrossRef]
36. Boukherroub, N.; Guittoum, A.; Laggoun, A.; Hemmous, M.; Martínez-Blanco, D.; Blanco, J.A.;Souami, N.; Gorria, P.; Bourzami, A.; Lenoble, O. Microstructure and magnetic properties of nanostructured(Fe0.8Al0.2)100–xSix alloy produced by mechanical alloying. J. Magn. Magn. Mater. 2015, 385, 151–159.[CrossRef]
37. Pruša, F.; Šesták, J.; Školáková, A.; Novák, P.; Haušild, P.; Karlík, M.; Minárik, P.; Kopecek, J.; Laufek, F.Application of SPS consolidation and its influence on the properties of the FeAl20Si20 alloys prepared bymechanical alloying. Mater. Sci. Eng. A 2019, 761, 138020. [CrossRef]
38. Ma, R.P.; Wan, M.; Huang, J.; Xie, Q.; Suzuki, T. Calculation of electronic structure and mechanical propertiesof DO 3 – Fe 75-x Si 25 Ni x intermetallic compounds by first principles. Int. J. Mod. Phys. B 2015. [CrossRef]
39. Yanson, T.I.; Manyako, M.B.; Bodak, O.I.; German, N.V.; Zarechnyuk, O.S.; Cerný, R.; Yvon, K. TriclinicFe3Al2Si3 and Orthorhombic Fe3Al2Si4 with New Structure Types. Acta Crystallogr. Sect. C Cryst.Struct. Commun. 1996, 52, 2964–2967. [CrossRef]
40. Apiñaniz, E.; Legarra, E.; Plazaola, F.; Garitaonandia, J.S. Influence of addition of Si in FeAl alloys: Theory.J. Magn. Magn. Mater. 2008, 320, e692–e695. [CrossRef]
41. Gale, W.F.; Totemeier, T.C. Smithells Metals Reference Book; Elsevier Science: Amsterdam, The Netherlands,2003.
42. Kupenko, I.; Merkel, S.; Achorner, M.; Plückthun, C.; Liermann, H.-P.; Sanchez-Valle, C. Plastic deformationof FeSi at high pressures: Implications for planetary cores. In EGU General Assembly Conference Abstracts;EGU2017: Vienna, Austria, 2017.
43. Ehlers, S.K.; Mendiratta, M.G. Tensile behaviour of two DO3-ordered alloys: Fe3Si and Fe-20 at % Al-5 at %Si. J. Mater. Sci. 1984, 19, 2203–2210. [CrossRef]
44. Zhao, L.-Z.; Zhao, M.-J.; Li, D.-Y.; Zhang, J.; Xiong, G.-Y. Study on Fe–Al–Si in situ composite coatingfabricated by laser cladding. Appl. Surf. Sci. 2012, 258, 3368–3372. [CrossRef]
45. Novak, P.; Nova, K. Oxidation Behavior of Fe-Al, Fe-Si and Fe-Al-Si Intermetallics. Materials 2019, 12, 1748.[CrossRef] [PubMed]
© 2020 by the authors. Licensee MDPI, Basel, Switzerland. This article is an open accessarticle distributed under the terms and conditions of the Creative Commons Attribution(CC BY) license (http://creativecommons.org/licenses/by/4.0/).


![> plot(cos(x) + sin(x), x=0..Pi); plot(tan(x), x=-Pi..Pi ... · > plot3d({sin(x*y), x + 2*y},x=-Pi..Pi,y=-Pi..Pi); ↵ c1:= [cos(x)-2*cos(0.4*y),sin(x)-2*sin(0.4*y),y]: ↵ c2:= [cos(x)+2*cos(0.4*y),sin(x)+2*sin(0.4*y),y]:](https://img.pdfslide.us/doc/110x75/5e87f19cd4429b02985e2e8b/-plotcosx-sinx-x0pi-plottanx-x-pipi-plot3dsinxy.jpg)