Embed Size (px)
Citation preview
TESTING AND
ASSESSMENT OF
CG-7 PRESSURE RELIEF
VALVE AND
PROPANE CYLINDER
PERFORMANCE
Volume 1:
Results and Evaluation
To
National Propane Gas Association
1150 Seventeenth St. NW, Suite 310
Washington, DC 20036
January 31, 2003
FINAL REPORT
on
TESTING AND ASSESSMENT OF CG-7 PRESSURE RELIEF VALVE AND
PROPANE CYLINDER PERFORMANCE
VOLUME 1: RESULTS AND EVALUATION
to
National Propane Gas Association 1150 Seventeenth St. NW, Suite 310
Washington, DC 20036
January 31, 2003
by
D.R. Stephens, M.T. Gifford, R.B. Francini and D.D. Mooney
BATTELLE 505 King Avenue
Columbus, Ohio 43201-2693
ii
Battelle does not engage in research for advertising, sales promotion, or endorsement of our clients' interests including raising investment capital or recommending investments decisions, or other publicity purposes, or for any use in litigation. Battelle endeavors at all times to produce work of the highest quality, consistent with our contract commitments. However, because of the research and/or experimental nature of this work the client undertakes the sole responsibility for the consequence of any use or misuse of, or inability to use, any information, apparatus, process or result obtained from Battelle, and Battelle, its employees, officers, or Trustees have no legal liability for the accuracy, adequacy, or efficacy thereof.

iii
EXECUTIVE SUMMARY The Research and Special Projects Administration (RSPA) of the U.S. Department of Transportation recently has been examining issues of performance, durability and reliability of propane fuel cylinders and their pressure relief valves. RSPA has considered developing new regulations for their inspection and requalification. This could have significant impact on the propane industry, which estimates that there are over 50,000,000 of these cylinders in service. When the National Propane Gas Association (NPGA) explored this issue it found that there is little data in the literature on the actual performance and reliability of propane cylinders and relief valves. To gain a clear understanding of the issues and concerns, NPGA obtained the assistance of Battelle to test propane cylinders and relief valves that have been in service for up to 60 years and to develop a database on their performance. This report summarizes the results of an experimental program conducted by Battelle in which cylinders and relief valves which had been in use from 2 to 60 years were collected from across the country and were subjected to a series of tests to determine their performance and integrity. Nearly four hundred 20-pound propane cylinders were collected from 14 locations across the United States, representing 8 North American climate regions. The collection included 19 different cylinder manufacturers or manufacturer codes and 23 different relief valve manufacturers or manufacturer codes. The collection effort specifically targeted cylinders that were near the end of their useful life in order to examine the assumptions that are the foundation for design, testing and requalification of cylinders and relief valves. All cylinders were visually inspected according to the procedures of Compressed Gas Association (CGA) Pamphlet C-6 Standards for Visual Inspection of Compressed Gas Cylinders. The data were reviewed and a representative subset of cylinders was selected for detailed testing. Nearly 250 cylinders were then subjected to hydrostatic expansion and burst testing to generate a database comparing visual, hydrostatic and burst test results. Over 230 relief valves were subjected to a test procedure derived from CGA Pamphlet S-1.1 Pressure Relief Device Standards Part 1 – Cylinders for Compressed Gas Cylinders. This included measurement of the start-to-discharge, full-open, and reseat pressures of the relief valves, as well as flow rate. This has resulted in a comprehensive database that allows direct and detailed comparison of relief valve and cylinder performance. The database is sufficient to determine the factor of safety against failure with 95 percent confidence. The details of each cylinder and relief valve test are summarized in the companion report, Testing and Assessment of CG-7 Pressure Relief Valve and Propane Cylinder Performance, Volume 2: Data Report. DOT-regulated cylinders used for propane must be requalified periodically by visual inspection or by hydrostatic expansion pressure test. Industry experience suggests that visual inspection and hydrostatic expansion tests can reliably verify the safety and integrity of propane fuel cylinders. However, this experience is anecdotal and has not been documented. In the first part of this program, Battelle developed an experimental database comparing the results of visual and hydrostatic expansion test methods for cylinder requalification against actual burst test performance of more than 200 cylinders. Performance and integrity of the propane cylinders were established by burst testing each of the 236 test cylinders. The minimum design burst pressure criterion used here is 960 psi, or four times the service pressure of 240 psi, consistent with typical DOT requirements. The measured burst pressures were compared to predictions by visual inspection and hydrostatic expansion test to determine how well they predicted low failure pressure performance and how conservative their predictions were. Visual inspection predicts integrity based upon visual appearance of excessive corrosion or damage. Although visual inspection predicted failure (rejected), 196 out of 236 cylinders (83.1 percent), only 8 of 236
iv
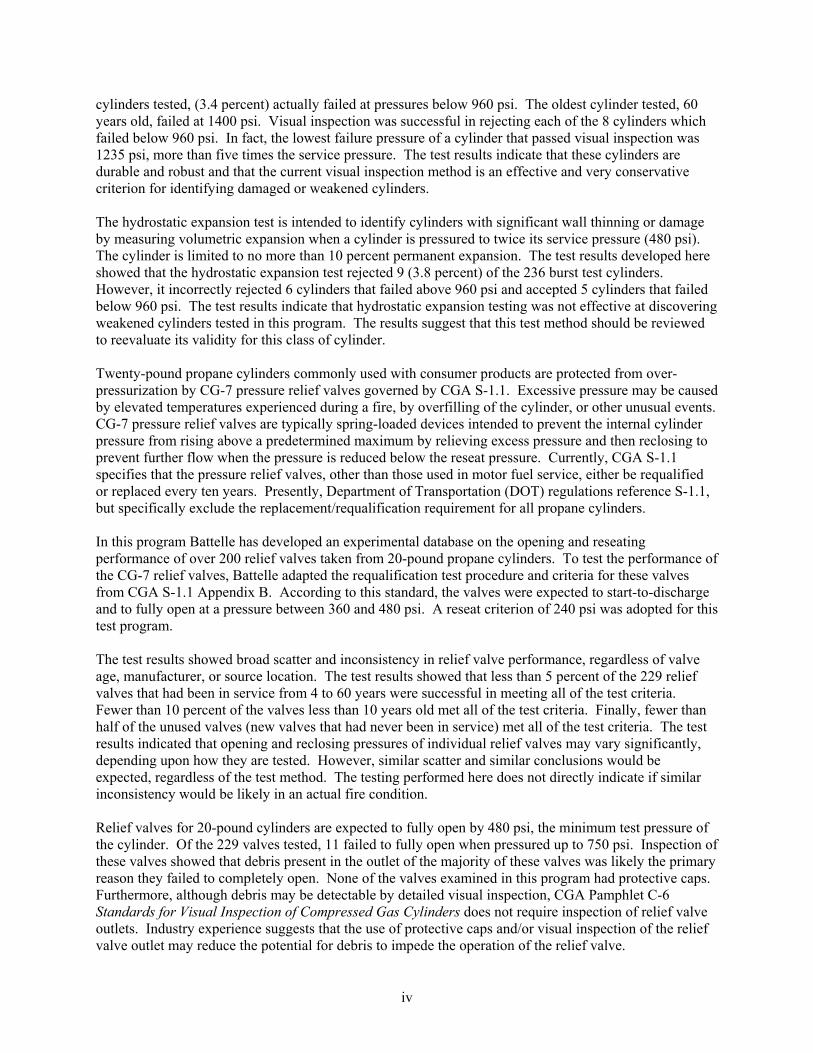
cylinders tested, (3.4 percent) actually failed at pressures below 960 psi. The oldest cylinder tested, 60 years old, failed at 1400 psi. Visual inspection was successful in rejecting each of the 8 cylinders which failed below 960 psi. In fact, the lowest failure pressure of a cylinder that passed visual inspection was 1235 psi, more than five times the service pressure. The test results indicate that these cylinders are durable and robust and that the current visual inspection method is an effective and very conservative criterion for identifying damaged or weakened cylinders. The hydrostatic expansion test is intended to identify cylinders with significant wall thinning or damage by measuring volumetric expansion when a cylinder is pressured to twice its service pressure (480 psi). The cylinder is limited to no more than 10 percent permanent expansion. The test results developed here showed that the hydrostatic expansion test rejected 9 (3.8 percent) of the 236 burst test cylinders. However, it incorrectly rejected 6 cylinders that failed above 960 psi and accepted 5 cylinders that failed below 960 psi. The test results indicate that hydrostatic expansion testing was not effective at discovering weakened cylinders tested in this program. The results suggest that this test method should be reviewed to reevaluate its validity for this class of cylinder. Twenty-pound propane cylinders commonly used with consumer products are protected from over-pressurization by CG-7 pressure relief valves governed by CGA S-1.1. Excessive pressure may be caused by elevated temperatures experienced during a fire, by overfilling of the cylinder, or other unusual events. CG-7 pressure relief valves are typically spring-loaded devices intended to prevent the internal cylinder pressure from rising above a predetermined maximum by relieving excess pressure and then reclosing to prevent further flow when the pressure is reduced below the reseat pressure. Currently, CGA S-1.1 specifies that the pressure relief valves, other than those used in motor fuel service, either be requalified or replaced every ten years. Presently, Department of Transportation (DOT) regulations reference S-1.1, but specifically exclude the replacement/requalification requirement for all propane cylinders. In this program Battelle has developed an experimental database on the opening and reseating performance of over 200 relief valves taken from 20-pound propane cylinders. To test the performance of the CG-7 relief valves, Battelle adapted the requalification test procedure and criteria for these valves from CGA S-1.1 Appendix B. According to this standard, the valves were expected to start-to-discharge and to fully open at a pressure between 360 and 480 psi. A reseat criterion of 240 psi was adopted for this test program. The test results showed broad scatter and inconsistency in relief valve performance, regardless of valve age, manufacturer, or source location. The test results showed that less than 5 percent of the 229 relief valves that had been in service from 4 to 60 years were successful in meeting all of the test criteria. Fewer than 10 percent of the valves less than 10 years old met all of the test criteria. Finally, fewer than half of the unused valves (new valves that had never been in service) met all of the test criteria. The test results indicated that opening and reclosing pressures of individual relief valves may vary significantly, depending upon how they are tested. However, similar scatter and similar conclusions would be expected, regardless of the test method. The testing performed here does not directly indicate if similar inconsistency would be likely in an actual fire condition. Relief valves for 20-pound cylinders are expected to fully open by 480 psi, the minimum test pressure of the cylinder. Of the 229 valves tested, 11 failed to fully open when pressured up to 750 psi. Inspection of these valves showed that debris present in the outlet of the majority of these valves was likely the primary reason they failed to completely open. None of the valves examined in this program had protective caps. Furthermore, although debris may be detectable by detailed visual inspection, CGA Pamphlet C-6 Standards for Visual Inspection of Compressed Gas Cylinders does not require inspection of relief valve outlets. Industry experience suggests that the use of protective caps and/or visual inspection of the relief valve outlet may reduce the potential for debris to impede the operation of the relief valve.
v
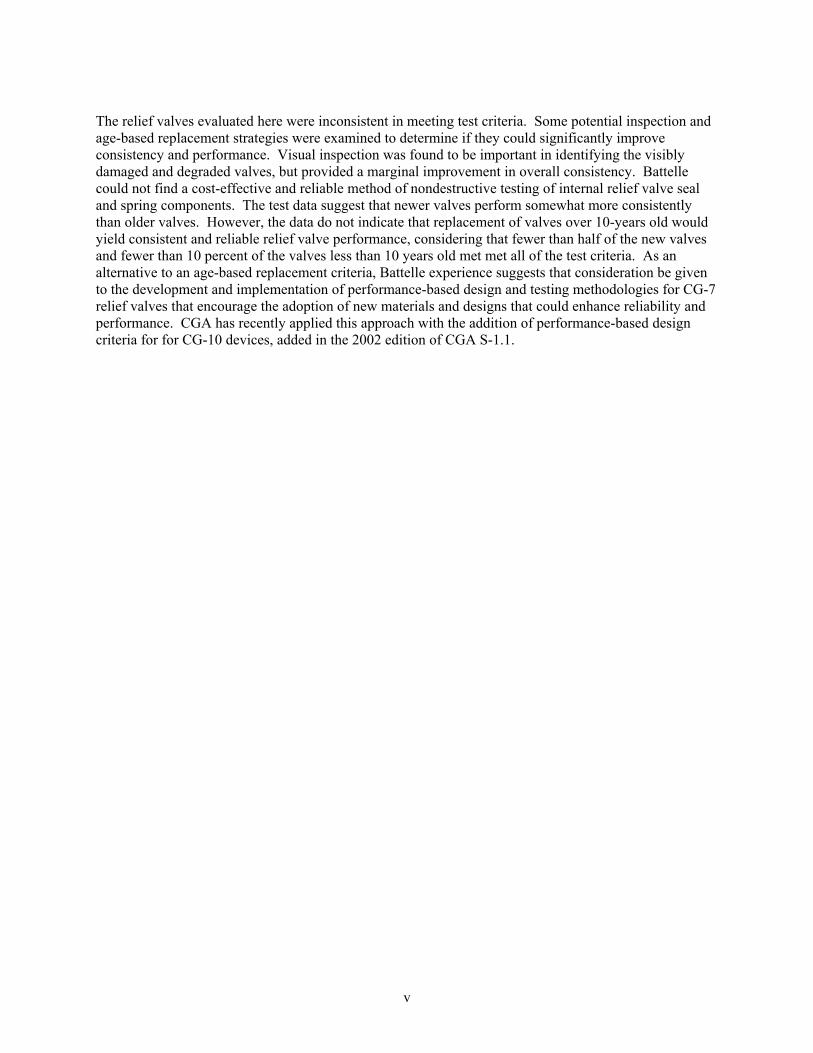
The relief valves evaluated here were inconsistent in meeting test criteria. Some potential inspection and age-based replacement strategies were examined to determine if they could significantly improve consistency and performance. Visual inspection was found to be important in identifying the visibly damaged and degraded valves, but provided a marginal improvement in overall consistency. Battelle could not find a cost-effective and reliable method of nondestructive testing of internal relief valve seal and spring components. The test data suggest that newer valves perform somewhat more consistently than older valves. However, the data do not indicate that replacement of valves over 10-years old would yield consistent and reliable relief valve performance, considering that fewer than half of the new valves and fewer than 10 percent of the valves less than 10 years old met met all of the test criteria. As an alternative to an age-based replacement criteria, Battelle experience suggests that consideration be given to the development and implementation of performance-based design and testing methodologies for CG-7 relief valves that encourage the adoption of new materials and designs that could enhance reliability and performance. CGA has recently applied this approach with the addition of performance-based design criteria for for CG-10 devices, added in the 2002 edition of CGA S-1.1.

vi
vii
TABLE OF CONTENTS
Executive Summary .....................................................................................................................................iii Table of Contents........................................................................................................................................vii
List of Tables .........................................................................................................................................viii List of Figures ........................................................................................................................................viii Acknowledgements................................................................................................................................... x
Testing and Assessment of CG-7 Pressure Relief Valve and1Propane Cylinder Performance.................... 1 Program Objectives and Introduction ....................................................................................................... 1
Inspection and Requalification of Propane Cylinders........................................................................... 1 Pressure Relief Valves .......................................................................................................................... 2
Background ............................................................................................................................................... 2 Portable LPG Fuel Storage Cylinders ................................................................................................... 2 LPG Properties...................................................................................................................................... 3 Relief Valves for LPG Cylinders .......................................................................................................... 3
Overview of Cylinder Collection and Visual Inspection ..........................................................................6 Cylinder Collection............................................................................................................................... 6 Test Cylinder Selection and Demographics.......................................................................................... 7
Visual Inspection Results and Evaluation............................................................................................... 12 Visual Inspection Results.................................................................................................................... 12
Cylinder Testing and Evaluation............................................................................................................. 16 Cylinder Hydrostatic and Burst Test Results and Evaluation ............................................................. 16
Relief Valve Testing and Evaluation ...................................................................................................... 26 Testing Methodology .......................................................................................................................... 26 Valve Test Criteria .............................................................................................................................. 27 Observations on Visual Inspection of Relief Valves .......................................................................... 27 Relief Valve Test Results and Evaluation........................................................................................... 29
Summary of Test Results and General Observations...................................................................... 29 Flow Rate Results ........................................................................................................................... 30 Implications for Safety.................................................................................................................... 30 Comparison of Potential Replacement Standards ........................................................................... 36 Effects of Environment, Source Location and Manufacturer ......................................................... 42 Effect of Relief Valve Size ............................................................................................................. 44 Potential Causes of Observed Behavior.......................................................................................... 43 Benefits and Value of Visual Inspection......................................................................................... 46 Need for Performance-Based Design and Testing Methodology.................................................... 46
Closure .................................................................................................................................................... 62 References............................................................................................................................................... 62
Appendix A, Description of Test Methods and Procedures......................................................................A-1 Appendix B, Statistical Analysis of Safety Factors and Cylinder Performance ....................................... B-1
viii
LIST OF TABLES Table 1. Summary of cylinder visual inspection results. ........................................................................... 13 Table 2. Summary of cylinders that failed at pressures below 960 psi. ..................................................... 20 Table 3. Summary of cylinders that failed 10 percent expansion criterion of hydrostatic expansion test.. 25 Table 4. Summary of relief valve test performance. .................................................................................. 31 Table 5. Comparison of relief valve replacement criteria performance..................................................... 38 Table 6. Summary of “worst case” relief valves that did not open when pressured to 750 psi. ................ 61
LIST OF FIGURES Figure 1. Examples of unused and used 20-pound LPG storage cylinders investigated in this program. ... 4 Figure 2. Saturation curve for propane and butane hydrocarbon fuels showing their boiling point as a
function of pressure............................................................................................................................... 4 Figure 3. Illustration of a cylinder valve with integral relief valve used on 20-pound propane cylinders... 5 Figure 4. Map illustrating climate regions and source locations of collected cylinders and valves. ........... 8 Figure 5. Age distribution of test cylinders.................................................................................................. 9 Figure 6. Source environment distribution of test cylinders. ..................................................................... 10 Figure 7. Source location of test cylinders................................................................................................. 10 Figure 8. Cylinder manufacturer distribution of test specimens. ............................................................... 11 Figure 9. Valve manufacturer distribution of test specimens. ................................................................... 11 Figure 10. Comparison of the percentage of cylinders collected in each age bracket which failed visual
inspection for all causes and which failed inspection due to corrosion. ............................................. 14 Figure 11. Comparison of the percentage of cylinders collected from each source environment which
failed visual inspection for all causes and those which failed inspection due to corrosion. ............... 15 Figure 12. Comparison of the percentage of cylinders collected from each source location which failed
visual inspection for all causes and those that failed inspection due to corrosion. ............................. 15 Figure 13. Failure pressure of all cylinders tested as a function of age. .................................................... 18 Figure 14. Failure pressure of cylinders that passed visual inspection as a function of age.................... 199 Figure 15. Failure pressure of cylinders that failed visual inspection as a function of age. ...................... 19 Figure 16. Comparison of the age distribution of cylinders that failed above and below 960 psi. ............ 21 Figure 17. Comparison of the environment distribution of cylinders that failed above and below 960 psi.
............................................................................................................................................................ 22 Figure 18. Comparison of the source location distribution of cylinders that failed above and below 960.
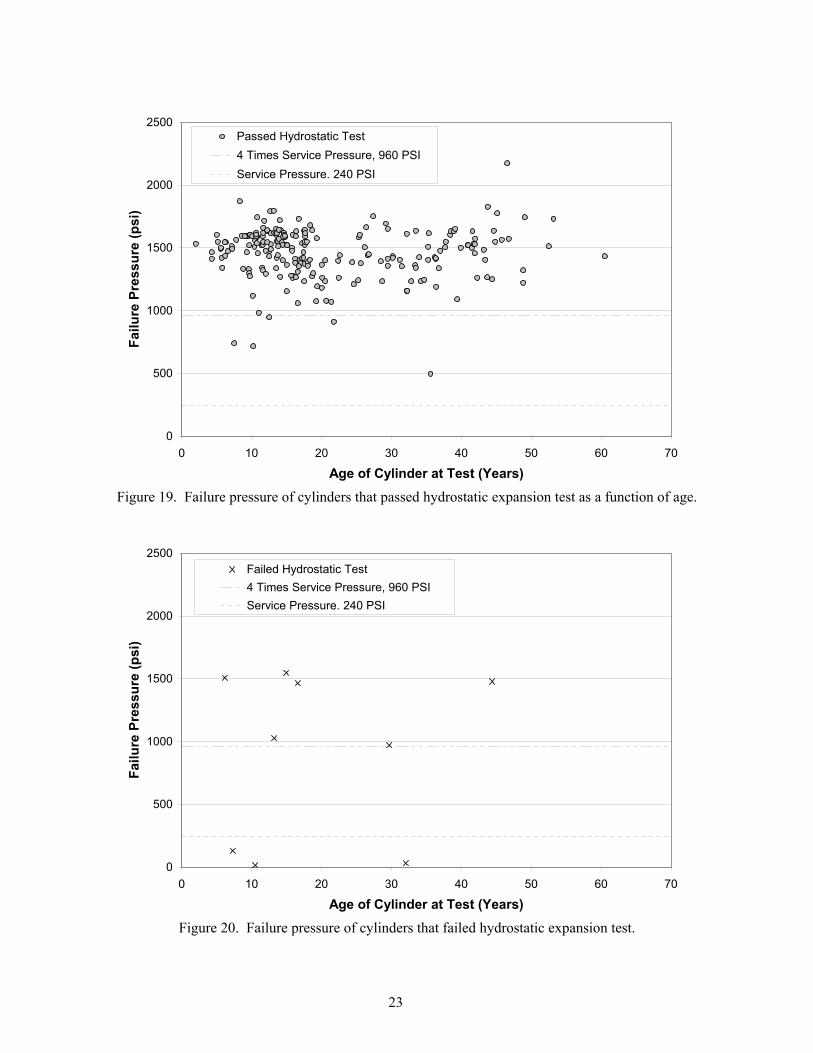
............................................................................................................................................................ 22 Figure 19. Failure pressure of cylinders that passed hydrostatic expansion test as a function of age. ...... 22 Figure 20. Failure pressure of cylinders that failed hydrostatic expansion test. ........................................ 23 Figure 21. Comparison of cylinder failure pressure to percent permanent expansion measured in
hydrostatic test. ................................................................................................................................... 24 Figure 22. Summary and comparison of results of visual inspection of valves from cylinders which
passed and failed cylinder visual inspection procedures..................................................................... 28 Figure 23. First sequence (A) start-to-discharge pressure of all relief valves tested. ................................ 32 Figure 24. Second sequence (B) start-to-discharge pressure of all relief valves tested. ............................ 32 Figure 25. First sequence (A) full-open pressure of all relief valves tested............................................... 33 Figure 26. Second sequence (B) full-open pressure of all relief valves tested. ......................................... 33 Figure 27. First sequence (A) reseat pressure of all relief valves tested. ................................................... 34
ix
Figure 28. Second sequence (B) reseat pressure of all relief valves tested................................................ 34 Figure 29. Measured relief valve flow rate as a function of age................................................................ 35 Figure 30. Comparison of the Sequence A start-to-discharge pressure results for different replacement
criteria. ................................................................................................................................................ 39 Figure 31. Comparison of the Sequence B start-to-discharge pressure results for different replacement
criteria. ................................................................................................................................................ 39 Figure 32. Comparison of the Sequence A full-open pressure results for different replacement criteria. .. 40 Figure 33. Comparison of the Sequence B full-open pressure results for different replacement criteria. .. 40 Figure 34. Comparison of the Sequence A reseat pressure results for different replacement criteria. ....... 41 Figure 35. Comparison of the Sequence B reseat pressure results for different replacement criteria. ...... 41 Figure 36. Comparison of the Sequence A start-to-discharge pressure results for different source
environments....................................................................................................................................... 49 Figure 37. Comparison of the Sequence B start-to-discharge pressure results for different source
environments....................................................................................................................................... 49 Figure 38. Comparison of the Sequence A full open pressure results for different source environments. 50 Figure 39. Comparison of the Sequence B full open pressure results for different source environments. 50 Figure 40. Comparison of the Sequence A reseat pressure results for different source environments...... 51 Figure 41. Comparison of the Sequence A reseat pressure results for different source environments...... 51 Figure 42. Comparison of the Sequence A start-to-discharge pressure results for different source
locations. ............................................................................................................................................. 52 Figure 43. Comparison of the Sequence B start-to-discharge pressure results for different source
locations.. ............................................................................................................................................ 52 Figure 44. Comparison of the Sequence A full open pressure results for different source locations. ....... 53 Figure 45. Comparison of the Sequence B full open pressure results for different source locations. ....... 53 Figure 46. Comparison of the Sequence A reseat pressure results for different source locations. ............ 54 Figure 47. Comparison of the Sequence B reseat pressure results for different source locations. ............ 54 Figure 48. Comparison of the Sequence A start-to-discharge pressure results for different relief valve
manufacturers...................................................................................................................................... 55 Figure 49. Comparison of the Sequence B start-to-discharge pressure results for different relief valve
manufacturers...................................................................................................................................... 55 Figure 50. Comparison of the Sequence A full open pressure results for different relief valve
manufacturers...................................................................................................................................... 56 Figure 51. Comparison of the Sequence B full open pressure results for different relief valve
manufacturers...................................................................................................................................... 56 Figure 52. Comparison of the Sequence A reseat pressure results for different relief valve
manufacturers...................................................................................................................................... 57 Figure 53. Comparison of the Sequence B reseat pressure results for different relief valve manufacturers ..................................................................................................................................... 57 Figure 54. Comparison of the Sequence A start-to-discharge pressure results for compact and standard
relief valves......................................................................................................................................... 58 Figure 55. Comparison of the Sequence B start-to-discharge pressure results for compact and standard
relief valves......................................................................................................................................... 58 Figure 56. Comparison of the Sequence A full-open pressure results for compact and standard relief
valves .................................................................................................................................................. 59 Figure 57. Comparison of the Sequence B full-open pressure results for compact and standard relief
valves .................................................................................................................................................. 59 Figure 58. Comparison of the Sequence A reseat pressure results for compact and standard relief valves ................................................................................................................................................. 60 Figure 59. Comparison of the Sequence B reseat pressure results for compact and standard relief valves ................................................................................................................................................. 60
x
ACKNOWLEDGEMENTS The authors wish to express their appreciation to the individuals and organizations who contributed to the successful completion of this challenging program. Mr. Larry Osgood and Mr. Bruce Swiecicki provided valuable insights and oversight on behalf of NPGA. Mr. William Butterbaugh was highly instrumental in the collection of specimens for testing and an asset to the program. The cylinder inspection and testing was conducted capably and professionally by Mr. Steve Koschara of McKnight Cylinder. The authors would also like to acknowledge the valuable contributions of Battelle staff David Roberts and Brian Carpenter. NPGA and Battelle gratefully acknowledge the assistance of the following propane marketers as well as William Butterbaugh who supplied cylinders for testing and analysis.
Active Propane, Hillside, IL Mutual Liquid Gas & Equipment, Gardena, CA Revere Gas & Appliance, Hopewell, VA Georgia Gas Distributors, Atlanta, GA Mobile Gas/Cornerstone Partners, Jacksonville, FL Wisconsin LP-Gas, Wausau, WI Blossman Gas, Ocean Springs, MS Reliance Propane, Toledo, OH Taylor Gas, Fairburn, GA AmeriGas Propane, Yuba City, CA A-B Gas Company, Houston, TX Suburban Propane Corp., Whippany NJ AmeriGas Propane, Phoenix, AZ
1
TESTING AND ASSESSMENT OF CG-7 PRESSURE RELIEF VALVE AND
PROPANE CYLINDER PERFORMANCE
VOLUME 1: RESULTS AND EVALUATION
D.R. Stephens, M.T. Gifford, R.B. Francini and D.D. Mooney
Battelle Columbus, Ohio
January 31, 2003
PROGRAM OBJECTIVES AND INTRODUCTION The Research and Special Projects Administration (RSPA) of the U.S. Department of Transportation recently has been examining issues of performance, durability and reliability of propane fuel cylinders and pressure relief valves. They have considered developing new regulations for inspection and requalification of fuel cylinders and relief valves that could have significant impact on the propane industry. The National Propane Gas Association (NPGA) requested Battelle’s assistance in developing data and analyses to better understand the performance of propane cylinders and their relief valves in service.
Inspection and Requalification of Propane Cylinders
DOT-regulated cylinders used for propane must be requalified periodically by visual inspection or by hydrostatic expansion pressure tests. The industry experience indicates that visual inspection and hydrostatic expansion tests can demonstrate the safety and integrity of propane fuel cylinders. However, this experience is anecdotal and has not been not been documented. The industry does not have a database of experimental data that clearly confirms the validity of its visual inspection and hydrostatic proof testing for requalification of propane fuel cylinders. NPGA requested that Battelle develop an experimental database which compares the results of visual and hydrostatic expansion test methods for cylinder requalification against actual burst pressure test performance. The purpose of this evaluation of visual inspection is to confirm for the propane industry and DOT that current visual inspection methods and criteria for condemning cylinders are adequate to ensure the safety of propane storage cylinders. Visual inspection should identify cylinders that are damaged or degraded and should ensure they are condemned and removed from service before they fail.

2
Pressure Relief Valves
CG-7 pressure-relief valves are used to protect 20-pound and other propane cylinders commonly employed on consumer products from over-pressurization. Excessive pressure can occur in the cylinder as a result of an increase in temperature experienced during a fire, overfilling of the cylinder, or other unusual events. CG-7 pressure relief valves are typically spring-loaded devices with elasotmeric seals intended to prevent the internal cylinder pressure from rising above a predetermined level by venting the excess pressure and then reseating when the pressure is reduced to an acceptable level. Currently, the Pressure Relief Device Standard, Part 1 – Cylinders for Compressed Gases, CGA S-1.1, requires the pressure relief valves, other than those used in motor fuel service, either be requalified or replaced every ten years. Only valves designed and labeled for requalification may be requalified. Therefore, most of the valves in service must be replaced after ten years, according to the S-1.1 standard. Presently, DOT regulations reference S-1.1, but specifically exclude the replacement/requalification requirement. In the October 30, 1998 issuance of HM-220, RSPA acknowledged its earlier withdrawal of the requirement for replacement or requalification of the pressure relief valves after ten years, and also requested data and comments on the need for reconsidering this requirement. The NPGA wishes to develop a technical basis to address the solicited input by the DOT that could potentially support the expectation that the service life of the cylinders and valves is greater than ten years. This report summarizes the results of an experimental program in which cylinders and valves ranging in age from 2 to 60 years were collected from across the United States and were subjected to a series of tests intended to characterize their performance and integrity. This is Volume 1 of a two volume report on the results of the program. This first volume is a summary and analysis of the test results. The second volume provides a detailed description of the results of each cylinder and valve investigated. Volume 1 is organized as follows:
Background Overview of Cylinder Collection and Visual Inspection Visual Inspection Results and Evaluation Cylinder Testing and Evaluation Relief Valve Testing and Assessment Appendix A – Detailed Description of Test Methods and Procedures Appendix B – Statistical Analysis of Safety Factors and Cylinder Performance
The summary and conclusions of this program are provided in the Executive Summary at the beginning of the document.
BACKGROUND
Portable LPG Fuel Storage Cylinders
For the purposes of this report, the term “propane” is used to refer to liquefied petroleum gas (LPG). The gas is typically a mixture of propane and butane and other hydrocarbons that are gaseous at room temperature and atmospheric pressures, but may be stored in liquid form at room temperature and at
3
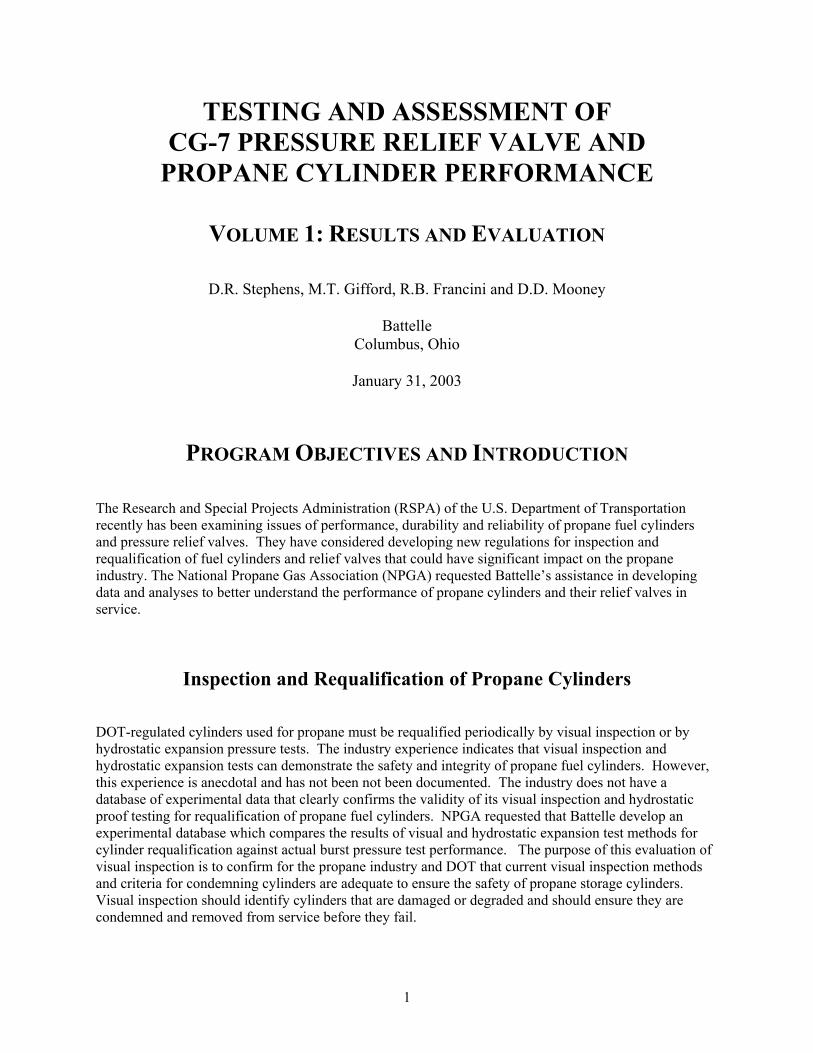
pressures on the order of 150 psi. LPG is widely used in consumer and industrial applications because it is easy to store, transport and use for heating and cooking applications. In the United States, LPG is typically stored and transported in steel cylinders having volumes from one quart up to 120 gallons. The focus of the investigation presented here is the most common LPG storage cylinder for consumer use, the 20-pound propane capacity cylinder such as those shown Figure 1. The figure shows a new, unusued cylinder on the left and a used cylinder taken from service on the right. The cylinder on the right may be considered to be a typical example of the cylinders tested in this program. These cylinders are used for outdoor cooking grills, heaters, torches and a range of other consumer appliances. The design of the 20-pound cylinders investigated in this program are designated Type 4BA and are governed by U.S. Department of Transportation Standards, Title 49, Part 173, General Requirements for Shipments and Packagings. These cylinders, which are constructed of steel, are approximately 17.5 inches tall and 12 inches in diameter and hold approximately 4.7 gallons of LPG. The service pressure of 4BA cylinders used for LPG service is 240 psi. Although DOT does not specify a minimum burst pressure for these cylinders, DOT typically specifies a minimum design burst pressure of 4 times service pressure, or 960 psi. In LPG service, DOT requires that these cylinders be subjected to a hydrostatic expansion test to twice the service pressure (480 psi) every 12 years, according to procedures in CGA C-6, Methods for Hydrostatic Testing of Compressed Gas Cylinders. Alternatively, the cylinders may be subjected to hydrostatic pressure tests without measurement of expansion. Known as the modified hydrostatic test, this test must be repeated every seven years after expiration of the first 12-year period. As an alternative to pressure testing, these cylinders may be evaluated by external visual inspection according to CGA C-6, Standards for Visual Inspection of Steel Compressed Gas Cylinders. When visual inspection is used, subsequent inspections are required at five-year intervals after the first inspection.
LPG Properties
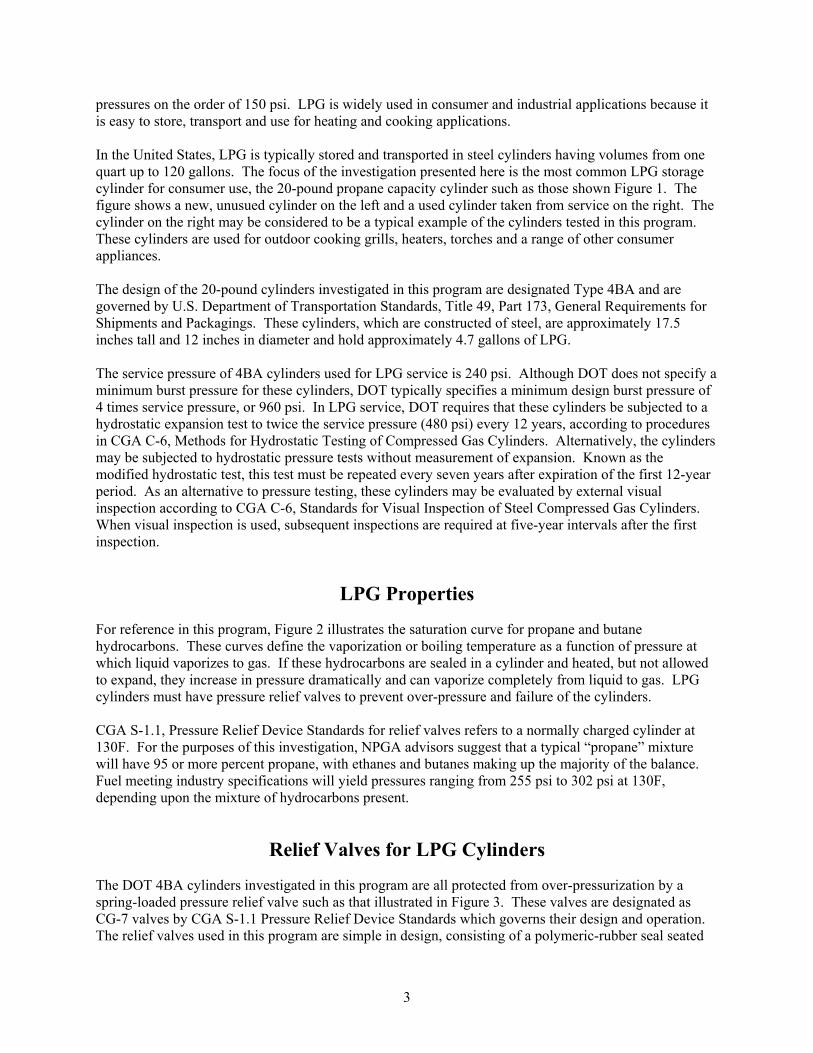
For reference in this program, Figure 2 illustrates the saturation curve for propane and butane hydrocarbons. These curves define the vaporization or boiling temperature as a function of pressure at which liquid vaporizes to gas. If these hydrocarbons are sealed in a cylinder and heated, but not allowed to expand, they increase in pressure dramatically and can vaporize completely from liquid to gas. LPG cylinders must have pressure relief valves to prevent over-pressure and failure of the cylinders. CGA S-1.1, Pressure Relief Device Standards for relief valves refers to a normally charged cylinder at 130F. For the purposes of this investigation, NPGA advisors suggest that a typical “propane” mixture will have 95 or more percent propane, with ethanes and butanes making up the majority of the balance. Fuel meeting industry specifications will yield pressures ranging from 255 psi to 302 psi at 130F, depending upon the mixture of hydrocarbons present.
Relief Valves for LPG Cylinders
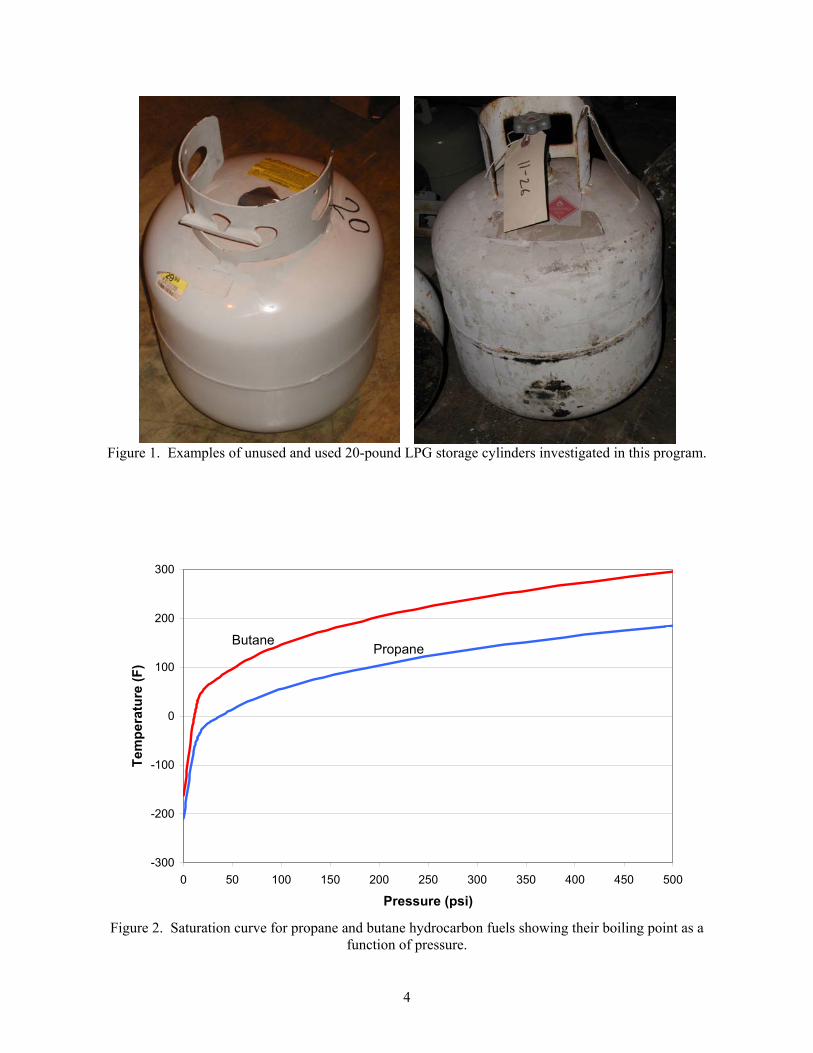
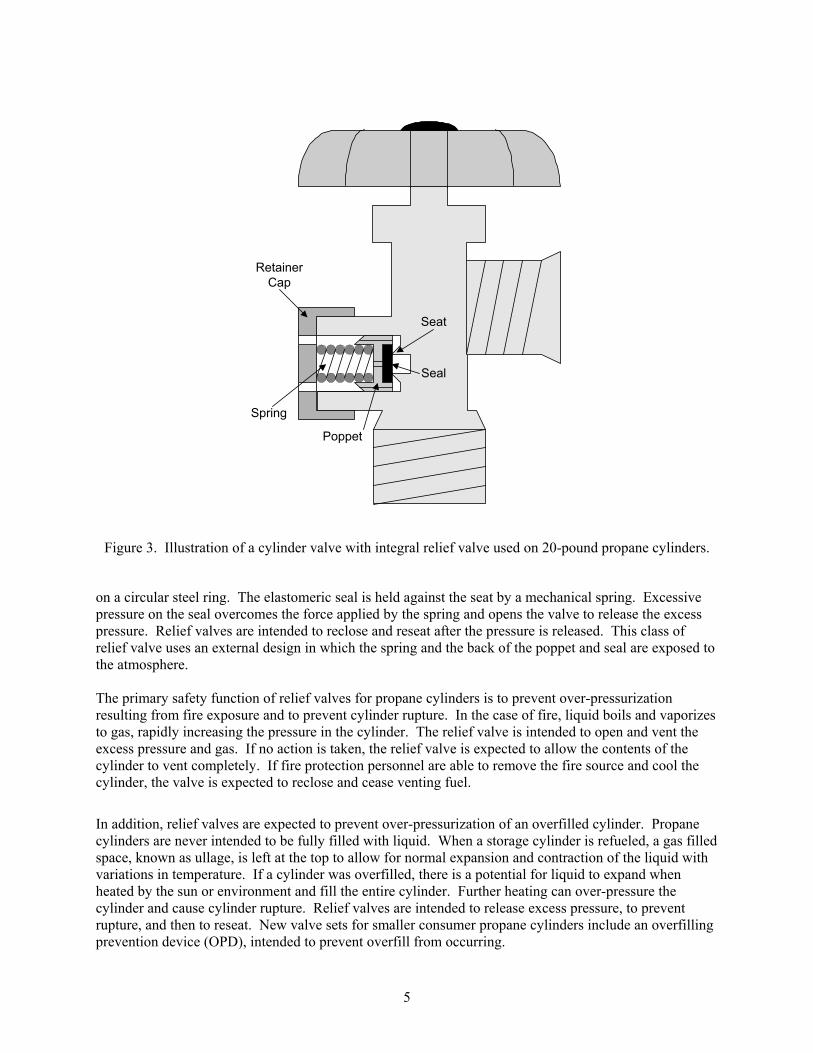
The DOT 4BA cylinders investigated in this program are all protected from over-pressurization by a spring-loaded pressure relief valve such as that illustrated in Figure 3. These valves are designated as CG-7 valves by CGA S-1.1 Pressure Relief Device Standards which governs their design and operation. The relief valves used in this program are simple in design, consisting of a polymeric-rubber seal seated
4
Figure 1. Examples of unused and used 20-pound LPG storage cylinders investigated in this program.
Figure 2. Saturation curve for propane and butane hydrocarbon fuels showing their boiling point as a function of pressure.
-300
-200
-100
0
100
200
300
0 50 100 150 200 250 300 350 400 450 500
Pressure (psi)
Tem
pera
ture
(F)
Butane Propane
5
Figure 3. Illustration of a cylinder valve with integral relief valve used on 20-pound propane cylinders.
on a circular steel ring. The elastomeric seal is held against the seat by a mechanical spring. Excessive pressure on the seal overcomes the force applied by the spring and opens the valve to release the excess pressure. Relief valves are intended to reclose and reseat after the pressure is released. This class of relief valve uses an external design in which the spring and the back of the poppet and seal are exposed to the atmosphere. The primary safety function of relief valves for propane cylinders is to prevent over-pressurization resulting from fire exposure and to prevent cylinder rupture. In the case of fire, liquid boils and vaporizes to gas, rapidly increasing the pressure in the cylinder. The relief valve is intended to open and vent the excess pressure and gas. If no action is taken, the relief valve is expected to allow the contents of the cylinder to vent completely. If fire protection personnel are able to remove the fire source and cool the cylinder, the valve is expected to reclose and cease venting fuel.
In addition, relief valves are expected to prevent over-pressurization of an overfilled cylinder. Propane cylinders are never intended to be fully filled with liquid. When a storage cylinder is refueled, a gas filled space, known as ullage, is left at the top to allow for normal expansion and contraction of the liquid with variations in temperature. If a cylinder was overfilled, there is a potential for liquid to expand when heated by the sun or environment and fill the entire cylinder. Further heating can over-pressure the cylinder and cause cylinder rupture. Relief valves are intended to release excess pressure, to prevent rupture, and then to reseat. New valve sets for smaller consumer propane cylinders include an overfilling prevention device (OPD), intended to prevent overfill from occurring.
RetainerCap
Seat
Spring
Poppet
Seal
6
OVERVIEW OF CYLINDER COLLECTION AND VISUAL INSPECTION
Cylinder and relief valve design, testing and requalification requirements are all based upon assumptions of the severity of the service environment and how much damage is caused by the service environment. Without a systematic evaluation of cylinders from service, there has been no way to know if these assumptions are correct and how conservative the requirements are. The underlying goal of this program was to collect a large set of cylinders representing a variety of ages, service environments and service conditions and to test them to better understand real world performance and the value of certain design, testing, and requalification requirements. This goal was accomplished by collecting 20-pound propane cylinders that have been in service across the United States and subjecting the cylinders and relief valves to a series of tests that demonstrate their performance. This section of the report gives a brief summary of the collection and visual inspection process. It is followed by an in-depth review of cylinder test results and relief valve test results. A more detailed description of the cylinder collection process is given in Appendix A.
Cylinder Collection
For this program, NPGA and Mr. William Butterbaugh, consultant, assisted Battelle in acquiring nearly 400 cylinders from propane marketers located throughout the United States. Efforts were made to obtain the most reasonable distribution possible of propane cylinders and relief valves representing service in different environments typical of the United States. Propane marketers were requested to provide cylinders from different manufacturers, ages, service uses (propane grills, industrial heaters, plumbers pots, etc.), and structural conditions (mix of cylinders which would fail visual inspection as well as those that would pass). Cylinder suppliers were asked to provide cylinders meeting the following criteria:
• Cylinders should have original valves. • Cylinders should not be purged and should not have been left open to the air. • 25-50% of the cylinders should not be able to pass visual inspection. • The remaining cylinders should be at least 5 years old. If possible, most of the remaining
cylinders should be toward the end of their useful life. The collected cylinders were all shipped to McKnight Cylinder in Ruffs Dale, PA, for inspection and cylinder testing. In addition to the cylinders from service, twenty new, unused cylinders were purchased for comparison evaluations. All of the new cylinders had manufacture dates within two years of the date of their purchase. A total of 394 cylinders were collected for evaluation in this program. The collection of the cylinders encompassed the following conditions and environments
5 to 60 years in age 8 different service environments 14 different source locations 19 different cylinder manufacturers or codes
7
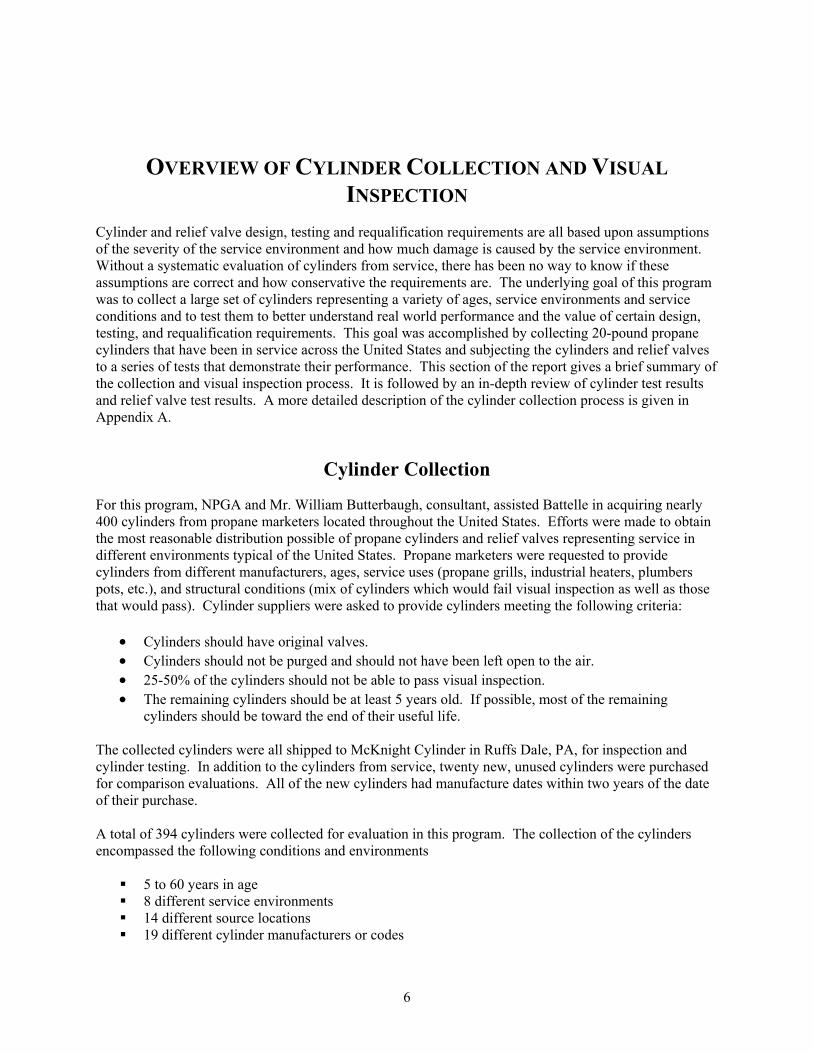
23 different valve manufacturers or codes Figure 4 illustrates the eight environmental regions from which cylinders were collected. As will be evident in later discussions, the collected cylinders varied in condition and levels of integrity. This database represents cylinders that appeared to be near the end of their useful life because of their condition. As such, it provides a good basis for examining some of the assumptions that are the foundation for design, testing and requalification of cylinders and relief valves.
Test Cylinder Selection and Demographics
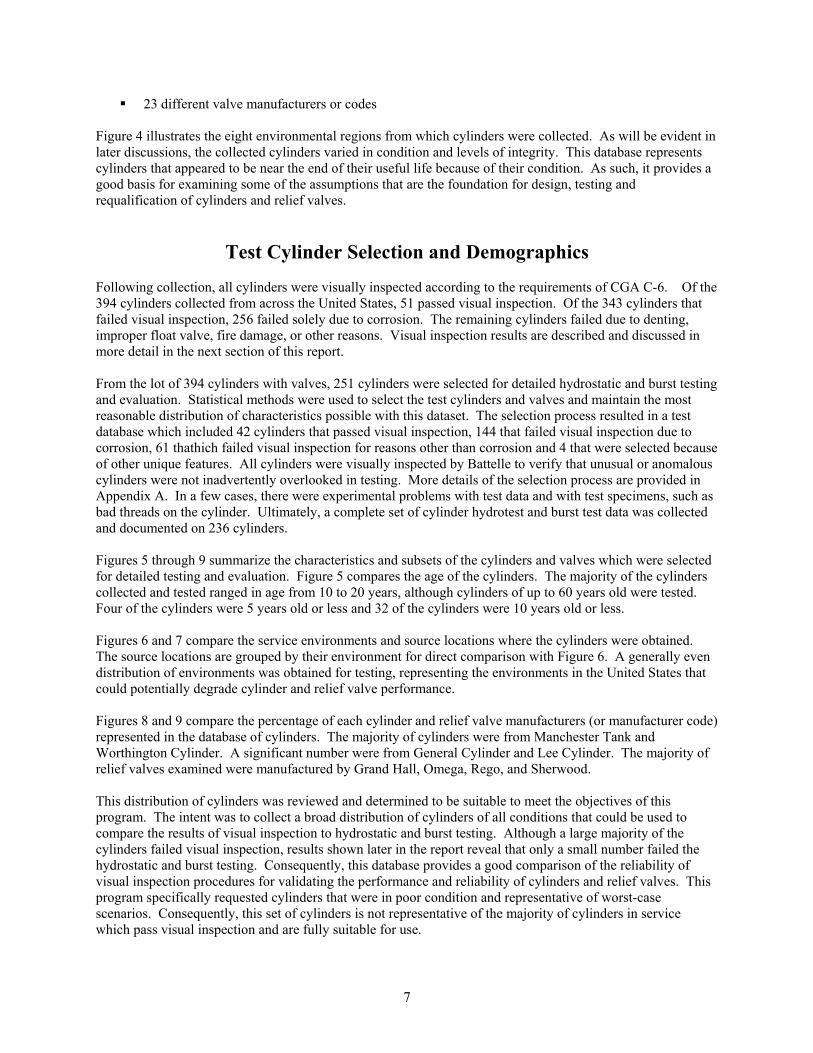
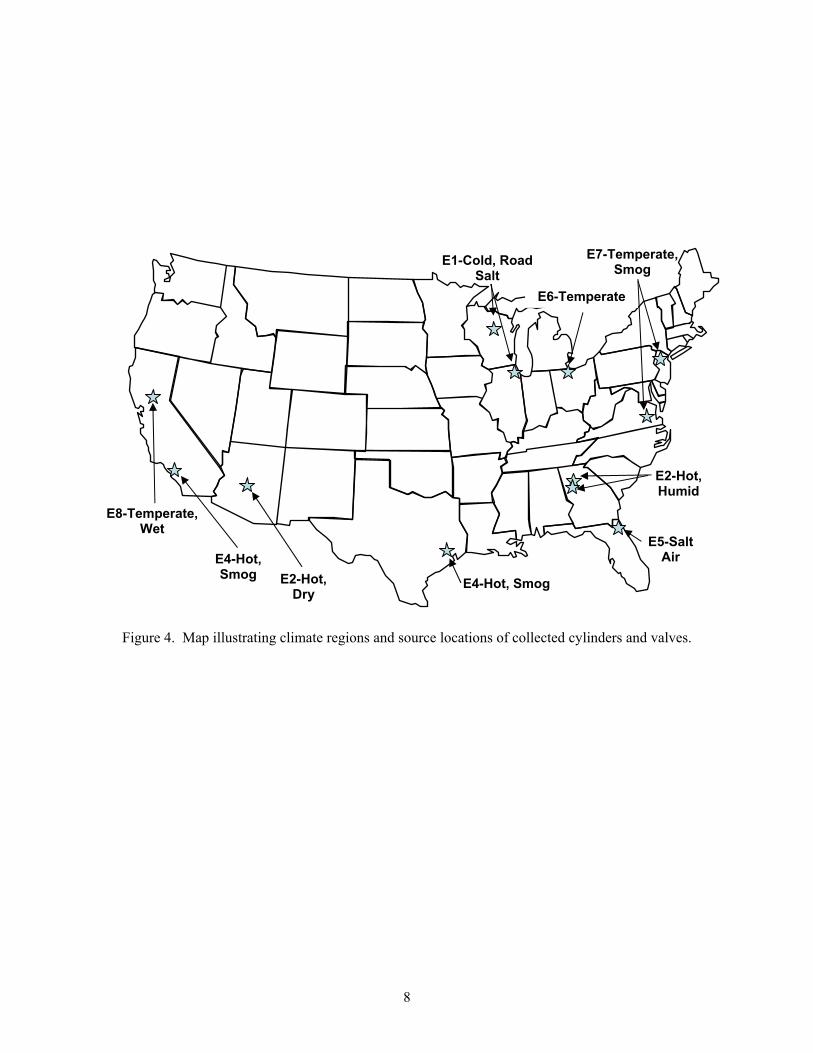
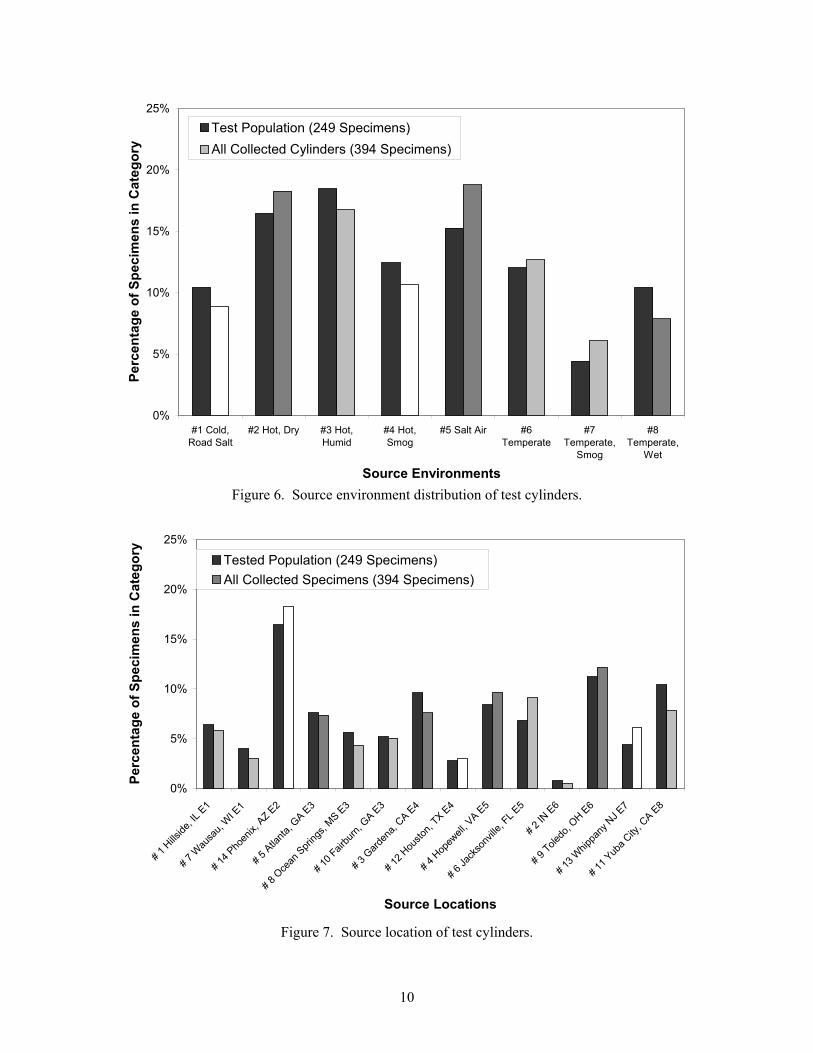
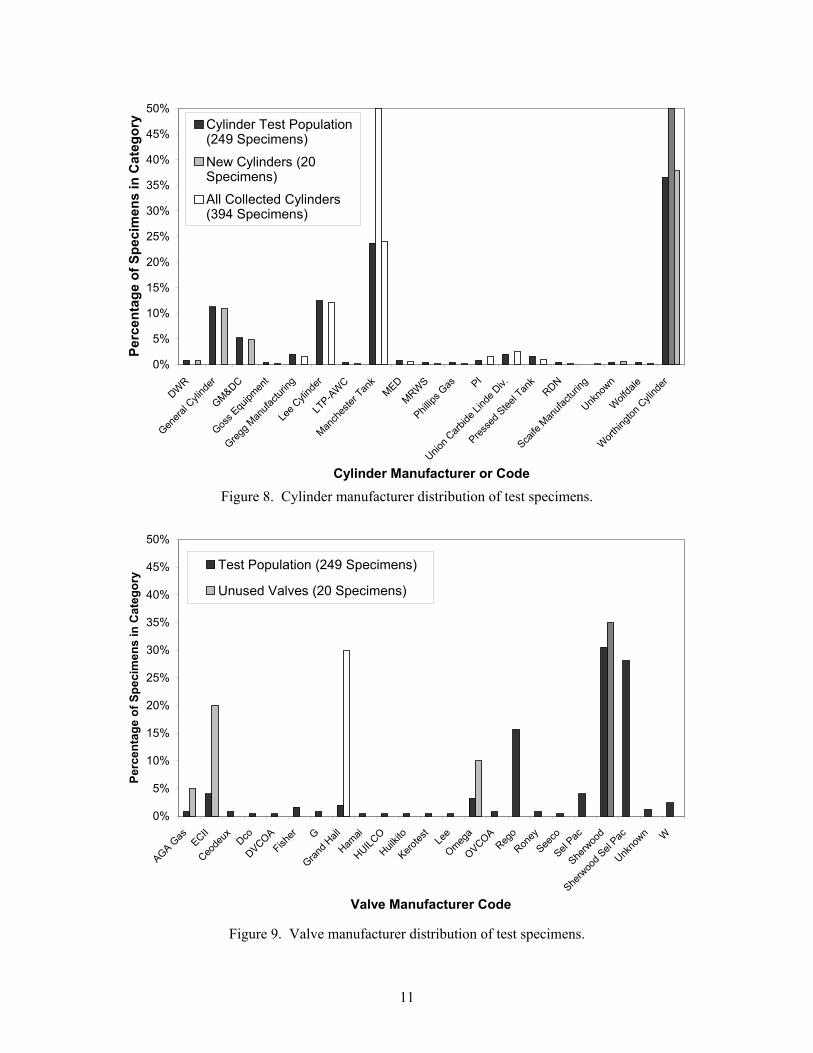
Following collection, all cylinders were visually inspected according to the requirements of CGA C-6. Of the 394 cylinders collected from across the United States, 51 passed visual inspection. Of the 343 cylinders that failed visual inspection, 256 failed solely due to corrosion. The remaining cylinders failed due to denting, improper float valve, fire damage, or other reasons. Visual inspection results are described and discussed in more detail in the next section of this report. From the lot of 394 cylinders with valves, 251 cylinders were selected for detailed hydrostatic and burst testing and evaluation. Statistical methods were used to select the test cylinders and valves and maintain the most reasonable distribution of characteristics possible with this dataset. The selection process resulted in a test database which included 42 cylinders that passed visual inspection, 144 that failed visual inspection due to corrosion, 61 thathich failed visual inspection for reasons other than corrosion and 4 that were selected because of other unique features. All cylinders were visually inspected by Battelle to verify that unusual or anomalous cylinders were not inadvertently overlooked in testing. More details of the selection process are provided in Appendix A. In a few cases, there were experimental problems with test data and with test specimens, such as bad threads on the cylinder. Ultimately, a complete set of cylinder hydrotest and burst test data was collected and documented on 236 cylinders. Figures 5 through 9 summarize the characteristics and subsets of the cylinders and valves which were selected for detailed testing and evaluation. Figure 5 compares the age of the cylinders. The majority of the cylinders collected and tested ranged in age from 10 to 20 years, although cylinders of up to 60 years old were tested. Four of the cylinders were 5 years old or less and 32 of the cylinders were 10 years old or less. Figures 6 and 7 compare the service environments and source locations where the cylinders were obtained. The source locations are grouped by their environment for direct comparison with Figure 6. A generally even distribution of environments was obtained for testing, representing the environments in the United States that could potentially degrade cylinder and relief valve performance. Figures 8 and 9 compare the percentage of each cylinder and relief valve manufacturers (or manufacturer code) represented in the database of cylinders. The majority of cylinders were from Manchester Tank and Worthington Cylinder. A significant number were from General Cylinder and Lee Cylinder. The majority of relief valves examined were manufactured by Grand Hall, Omega, Rego, and Sherwood. This distribution of cylinders was reviewed and determined to be suitable to meet the objectives of this program. The intent was to collect a broad distribution of cylinders of all conditions that could be used to compare the results of visual inspection to hydrostatic and burst testing. Although a large majority of the cylinders failed visual inspection, results shown later in the report reveal that only a small number failed the hydrostatic and burst testing. Consequently, this database provides a good comparison of the reliability of visual inspection procedures for validating the performance and reliability of cylinders and relief valves. This program specifically requested cylinders that were in poor condition and representative of worst-case scenarios. Consequently, this set of cylinders is not representative of the majority of cylinders in service which pass visual inspection and are fully suitable for use.
8
Figure 4. Map illustrating climate regions and source locations of collected cylinders and valves.
E4-Hot, Smog E2-Hot,
Dry E4-Hot, Smog
E2-Hot, Humid
E5-Salt Air
E6-Temperate
E1-Cold, Road Salt
E8-Temperate, Wet
E7-Temperate, Smog

9
Figure 5. Age distribution of test cylinders.
0%
5%
10%
15%
20%
25%
30%
35%
40%
45%
50%
0-5 5-10 10-15 15-20 20-25 25-30 30-35 35-40 40-45 45-50 50-55 55-60 60-65
Age Ranges (Years)
Perc
enta
ge o
f Spe
cim
ens
in C
ateg
ory
Test Population (249 Specimens)
All Collected Cylinders (380 Specimens)
10
Figure 6. Source environment distribution of test cylinders.
Figure 7. Source location of test cylinders.
0%
5%
10%
15%
20%
25%
#1 Cold,Road Salt
#2 Hot, Dry #3 Hot,Humid
#4 Hot,Smog
#5 Salt Air #6Temperate
#7Temperate,
Smog
#8Temperate,
Wet
Source Environments
Perc
enta
ge o
f Spe
cim
ens
in C
ateg
ory
Test Population (249 Specimens)All Collected Cylinders (394 Specimens)
0%
5%
10%
15%
20%
25%
# 1 H
illside
, IL E1
# 7 W
ausa
u, WI E
1
# 14 P
hoen
ix, AZ E2
# 5 Atla
nta, G
A E3
# 8 O
cean
Spring
s, MS E3
# 10 F
airbu
rn, G
A E3
# 3 G
arden
a, CA E4
# 12 H
ousto
n, TX E4
# 4 H
opew
ell, V
A E5
# 6 Ja
ckso
nville
, FL E
5
# 2 IN
E6
# 9 Tole
do, O
H E6
# 13 W
hippa
ny N
J E7
# 11 Y
uba C
ity, C
A E8
Source Locations
Perc
enta
ge o
f Spe
cim
ens
in C
ateg
ory
Tested Population (249 Specimens)All Collected Specimens (394 Specimens)
11
Figure 8. Cylinder manufacturer distribution of test specimens.
Figure 9. Valve manufacturer distribution of test specimens.
0%
5%
10%
15%
20%
25%
30%
35%
40%
45%
50%
DWR
Genera
l Cylin
der
GM&DC
Goss E
quipm
ent
Gregg M
anufa
cturin
g
Lee C
ylinde
r
LTP-A
WC
Manch
ester
Tank
MED
MRWS
Phillip
s Gas PI
Union C
arbide
Lind
e Div.
Presse
d Stee
l Tan
kRDN
Scaife
Man
ufactu
ring
Unkno
wn
Wolfda
le
Worthin
gton C
ylinde
r
Cylinder Manufacturer or Code
Perc
enta
ge o
f Spe
cim
ens
in C
ateg
ory Cylinder Test Population
(249 Specimens)New Cylinders (20Specimens)All Collected Cylinders(394 Specimens)
0%
5%
10%
15%
20%
25%
30%
35%
40%
45%
50%
AGA Gas ECII
Ceode
ux Dco
DVCOAFish
er G
Grand H
all
Hamai
HUILCO
Huilkit
o
Kerotes
tLe
e
Omega
OVCOAReg
oRon
eySee
co
Sel Pac
Sherw
ood
Sherw
ood S
el Pac
Unkno
wn W
Valve Manufacturer Code
Perc
enta
ge o
f Spe
cim
ens
in C
ateg
ory
Test Population (249 Specimens)
Unused Valves (20 Specimens)
12
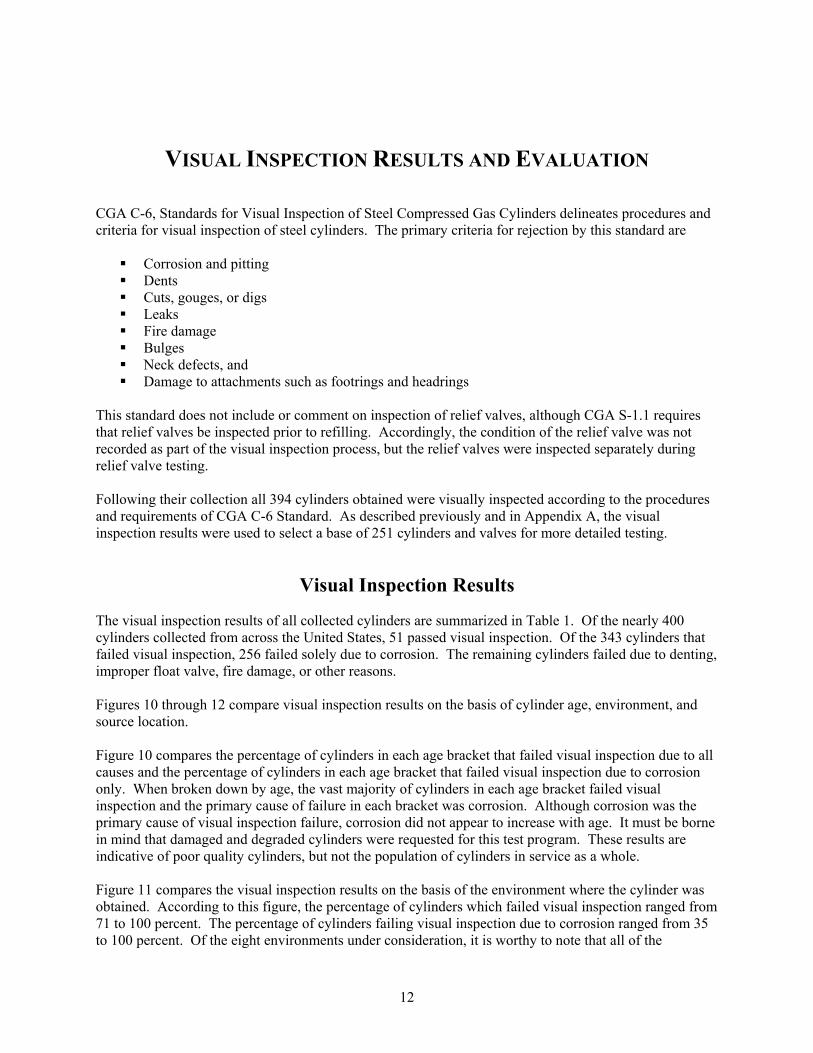
VISUAL INSPECTION RESULTS AND EVALUATION CGA C-6, Standards for Visual Inspection of Steel Compressed Gas Cylinders delineates procedures and criteria for visual inspection of steel cylinders. The primary criteria for rejection by this standard are
Corrosion and pitting Dents Cuts, gouges, or digs Leaks Fire damage Bulges Neck defects, and Damage to attachments such as footrings and headrings
This standard does not include or comment on inspection of relief valves, although CGA S-1.1 requires that relief valves be inspected prior to refilling. Accordingly, the condition of the relief valve was not recorded as part of the visual inspection process, but the relief valves were inspected separately during relief valve testing. Following their collection all 394 cylinders obtained were visually inspected according to the procedures and requirements of CGA C-6 Standard. As described previously and in Appendix A, the visual inspection results were used to select a base of 251 cylinders and valves for more detailed testing.
Visual Inspection Results
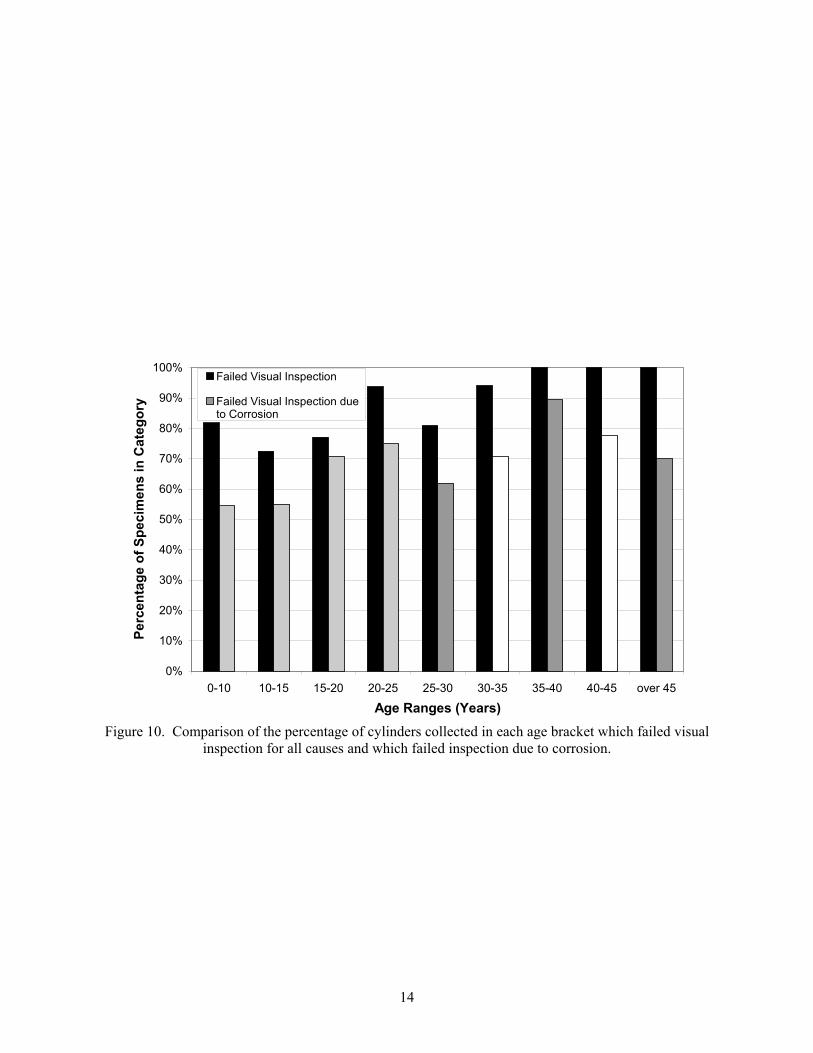
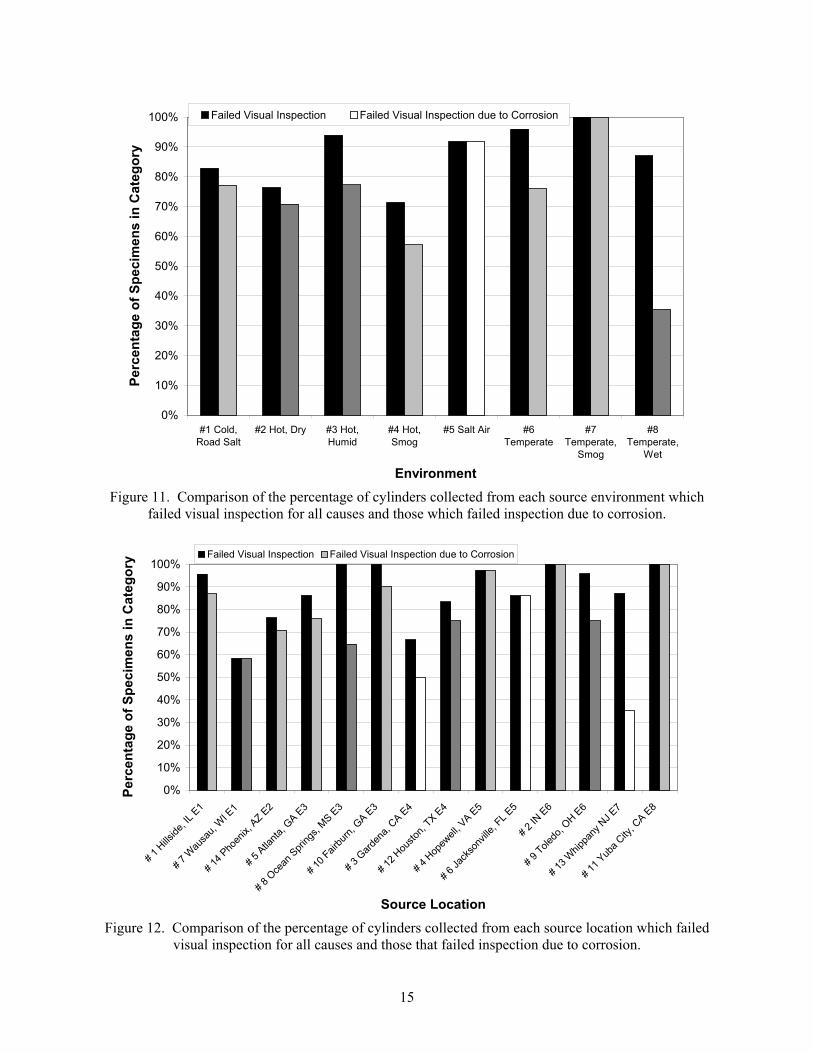
The visual inspection results of all collected cylinders are summarized in Table 1. Of the nearly 400 cylinders collected from across the United States, 51 passed visual inspection. Of the 343 cylinders that failed visual inspection, 256 failed solely due to corrosion. The remaining cylinders failed due to denting, improper float valve, fire damage, or other reasons. Figures 10 through 12 compare visual inspection results on the basis of cylinder age, environment, and source location. Figure 10 compares the percentage of cylinders in each age bracket that failed visual inspection due to all causes and the percentage of cylinders in each age bracket that failed visual inspection due to corrosion only. When broken down by age, the vast majority of cylinders in each age bracket failed visual inspection and the primary cause of failure in each bracket was corrosion. Although corrosion was the primary cause of visual inspection failure, corrosion did not appear to increase with age. It must be borne in mind that damaged and degraded cylinders were requested for this test program. These results are indicative of poor quality cylinders, but not the population of cylinders in service as a whole. Figure 11 compares the visual inspection results on the basis of the environment where the cylinder was obtained. According to this figure, the percentage of cylinders which failed visual inspection ranged from 71 to 100 percent. The percentage of cylinders failing visual inspection due to corrosion ranged from 35 to 100 percent. Of the eight environments under consideration, it is worthy to note that all of the

13
specimens from the salt air (Virginia and Florida) environment and the temperate, smog (New Jersey) environments that failed visual inspection did so due to corrosion. In addition, less than half of the cylinders from the temperate, wet (Yuba City, CA) environment failed due to corrosion, whereas the majority failed due to corrosion in other areas. The results here indicate that the primary cause of visual inspection rejection and, therefore, visible damage is corrosion, regardless of age and environment. The mechanisms of corrosion are well understood and are known to relate to environmental exposure. The results here generally suggest that environment may contribute to corrosion degradation, as might be expected. The results here do not suggest any anomalies with regards to source environment and likelihood of corrosion. While this relationship is interesting, the generally high failure pressure of all cylinders shown later in this report, suggests that cylinder corrosion (and therefore environment) are not likely to be major contributors to degradation in safety.
Table 1. Summary of cylinder visual inspection results.
Number of Cylinders
Percentage of Collected Cylinders
Collected Cylinders 394 100 Cylinders Passing Visual Inspection 51 12.9 Cylinders Failing Visual Inspection 343 87.1 Cylinders failing visual due to: Dent, Dig, Bulge, Gouge 20 5.1 Corrosion 296 75.1 Leakage 0 0.0 Fire Damage 1 0.3 Condition of Rings 39 9.9 Other Failures 17 4.3
14
Figure 10. Comparison of the percentage of cylinders collected in each age bracket which failed visual inspection for all causes and which failed inspection due to corrosion.
0%
10%
20%
30%
40%
50%
60%
70%
80%
90%
100%
0-10 10-15 15-20 20-25 25-30 30-35 35-40 40-45 over 45
Age Ranges (Years)
Perc
enta
ge o
f Spe
cim
ens
in C
ateg
ory
Failed Visual Inspection
Failed Visual Inspection dueto Corrosion
15
Figure 11. Comparison of the percentage of cylinders collected from each source environment which failed visual inspection for all causes and those which failed inspection due to corrosion.
Figure 12. Comparison of the percentage of cylinders collected from each source location which failed visual inspection for all causes and those that failed inspection due to corrosion.
0%
10%
20%
30%
40%
50%
60%
70%
80%
90%
100%
#1 Cold,Road Salt
#2 Hot, Dry #3 Hot,Humid
#4 Hot,Smog
#5 Salt Air #6Temperate
#7Temperate,
Smog
#8Temperate,
Wet
Environment
Perc
enta
ge o
f Spe
cim
ens
in C
ateg
ory
Failed Visual Inspection Failed Visual Inspection due to Corrosion
0%
10%
20%
30%
40%
50%
60%
70%
80%
90%
100%
# 1 H
illside
, IL E1
# 7 W
ausa
u, WI E
1
# 14 P
hoen
ix, AZ E2
# 5 Atla
nta, G
A E3
# 8 O
cean
Spring
s, MS E3
# 10 F
airbu
rn, G
A E3
# 3 G
arden
a, CA E4
# 12 H
ousto
n, TX E4
# 4 H
opew
ell, V
A E5
# 6 Ja
ckso
nville
, FL E
5
# 2 IN
E6
# 9 Tole
do, O
H E6
# 13 W
hippa
ny N
J E7
# 11 Y
uba C
ity, C
A E8
Source Location
Perc
enta
ge o
f Spe
cim
ens
in C
ateg
ory Failed Visual Inspection Failed Visual Inspection due to Corrosion
16
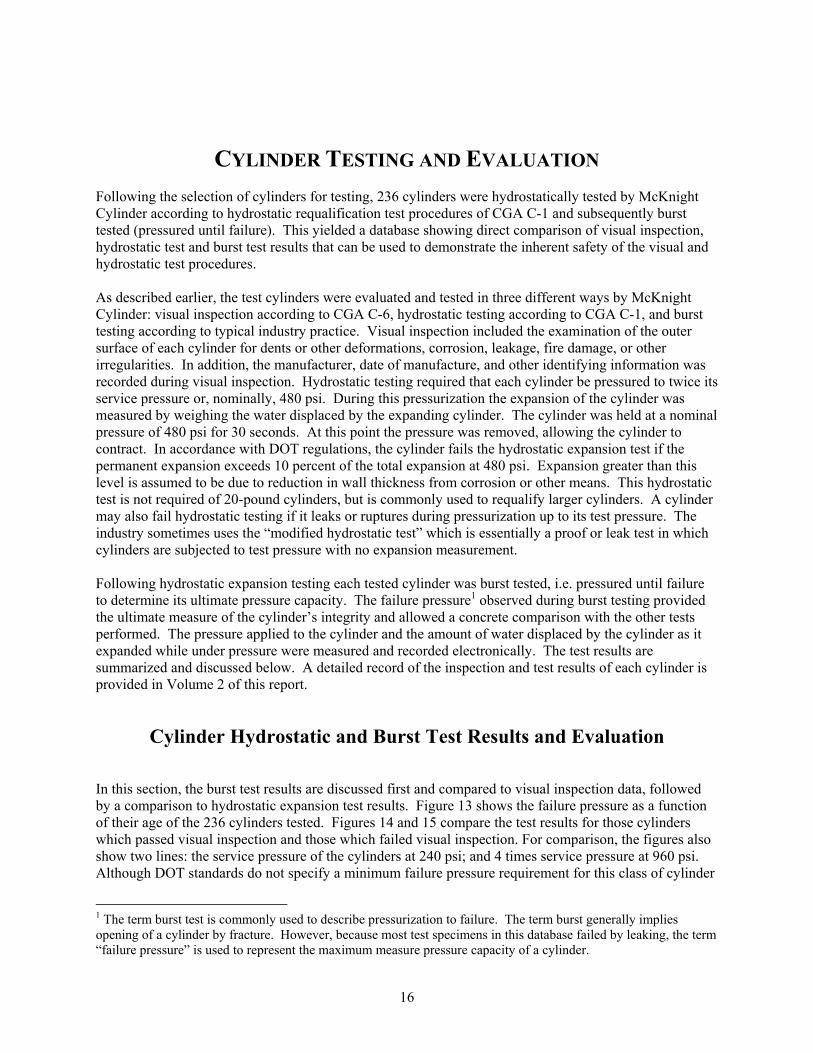
CYLINDER TESTING AND EVALUATION Following the selection of cylinders for testing, 236 cylinders were hydrostatically tested by McKnight Cylinder according to hydrostatic requalification test procedures of CGA C-1 and subsequently burst tested (pressured until failure). This yielded a database showing direct comparison of visual inspection, hydrostatic test and burst test results that can be used to demonstrate the inherent safety of the visual and hydrostatic test procedures. As described earlier, the test cylinders were evaluated and tested in three different ways by McKnight Cylinder: visual inspection according to CGA C-6, hydrostatic testing according to CGA C-1, and burst testing according to typical industry practice. Visual inspection included the examination of the outer surface of each cylinder for dents or other deformations, corrosion, leakage, fire damage, or other irregularities. In addition, the manufacturer, date of manufacture, and other identifying information was recorded during visual inspection. Hydrostatic testing required that each cylinder be pressured to twice its service pressure or, nominally, 480 psi. During this pressurization the expansion of the cylinder was measured by weighing the water displaced by the expanding cylinder. The cylinder was held at a nominal pressure of 480 psi for 30 seconds. At this point the pressure was removed, allowing the cylinder to contract. In accordance with DOT regulations, the cylinder fails the hydrostatic expansion test if the permanent expansion exceeds 10 percent of the total expansion at 480 psi. Expansion greater than this level is assumed to be due to reduction in wall thickness from corrosion or other means. This hydrostatic test is not required of 20-pound cylinders, but is commonly used to requalify larger cylinders. A cylinder may also fail hydrostatic testing if it leaks or ruptures during pressurization up to its test pressure. The industry sometimes uses the “modified hydrostatic test” which is essentially a proof or leak test in which cylinders are subjected to test pressure with no expansion measurement. Following hydrostatic expansion testing each tested cylinder was burst tested, i.e. pressured until failure to determine its ultimate pressure capacity. The failure pressure1 observed during burst testing provided the ultimate measure of the cylinder’s integrity and allowed a concrete comparison with the other tests performed. The pressure applied to the cylinder and the amount of water displaced by the cylinder as it expanded while under pressure were measured and recorded electronically. The test results are summarized and discussed below. A detailed record of the inspection and test results of each cylinder is provided in Volume 2 of this report.
Cylinder Hydrostatic and Burst Test Results and Evaluation
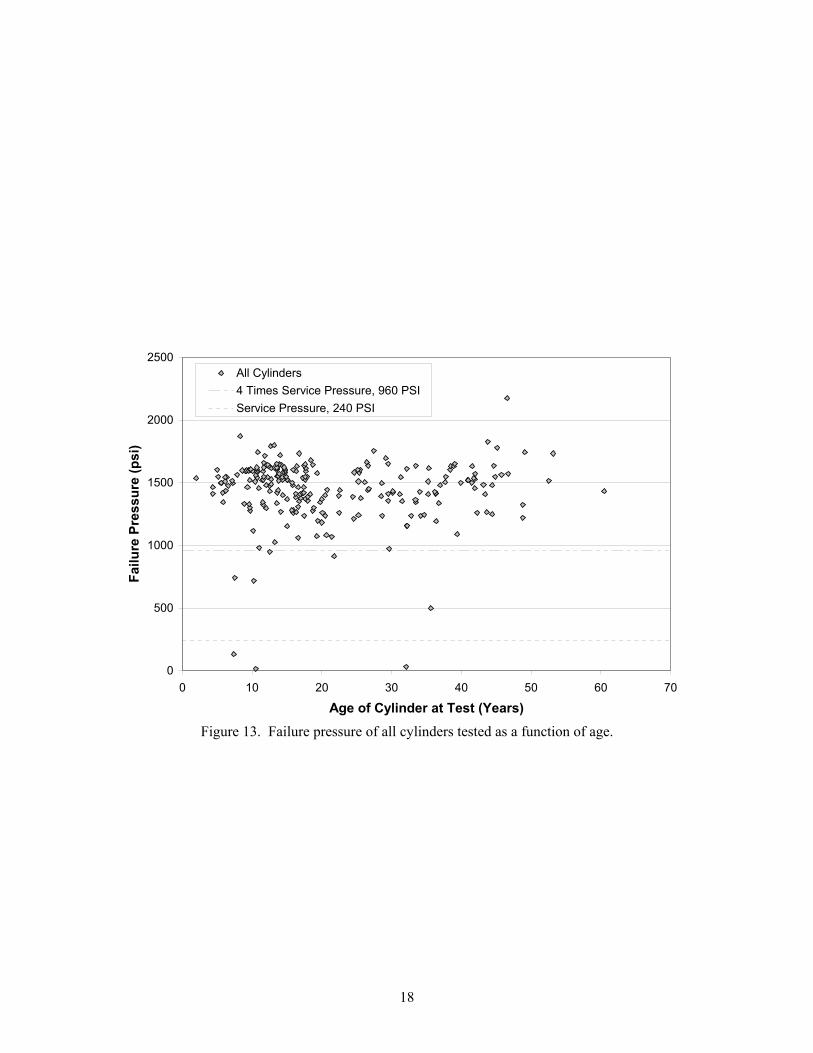
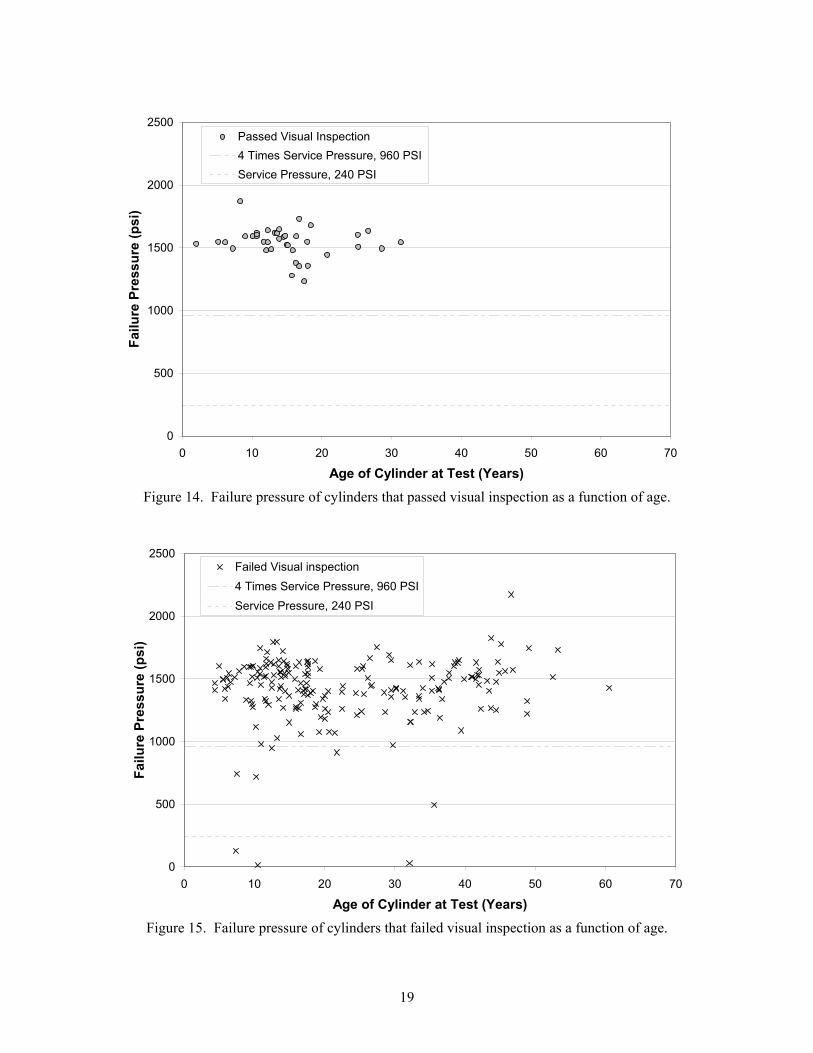
In this section, the burst test results are discussed first and compared to visual inspection data, followed by a comparison to hydrostatic expansion test results. Figure 13 shows the failure pressure as a function of their age of the 236 cylinders tested. Figures 14 and 15 compare the test results for those cylinders which passed visual inspection and those which failed visual inspection. For comparison, the figures also show two lines: the service pressure of the cylinders at 240 psi; and 4 times service pressure at 960 psi. Although DOT standards do not specify a minimum failure pressure requirement for this class of cylinder
1 The term burst test is commonly used to describe pressurization to failure. The term burst generally implies opening of a cylinder by fracture. However, because most test specimens in this database failed by leaking, the term “failure pressure” is used to represent the maximum measure pressure capacity of a cylinder.

17
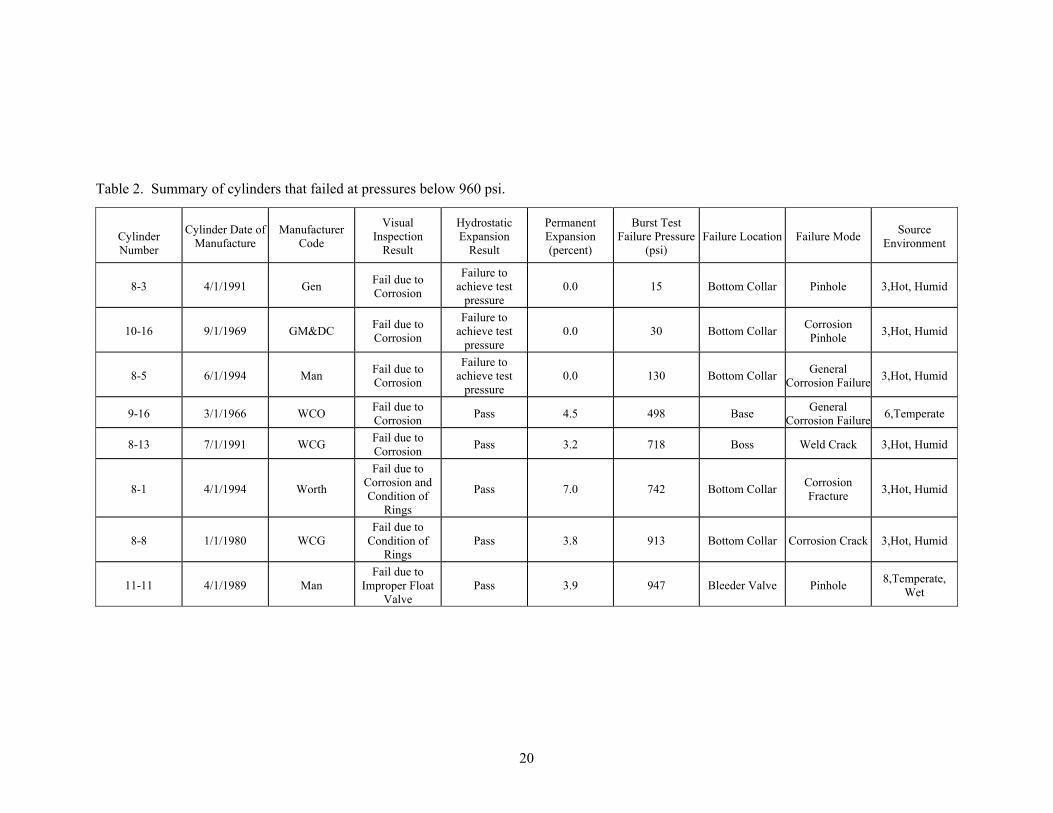
4BA, DOT typically specifies 4 times service pressure as the minimum failure pressure for metal pressure vessels. The results in Figure 14 show that all of the cylinders that passed visual inspection failed at pressures above 4 times service pressure. The lowest failure pressure of any cylinder which passed visual inspection was 1235 psi, over 5 times service pressure. Figure 15 shows the failure pressure of cylinders which failed visual inspection. Only 8 cylinders (3.4 percent of test cylinders) failed at pressures below 960 psi. It is important to note that each of those 8 that failed the visual inspection procedure and would have been rejected and removed from service. The test results in Figure 13 through 15 show that the cylinders appear to be durable and resistant to burst with 96.6 percent of the cylinders tested meeting the minimum burst pressure criterion. The oldest cylinder tested, 60 years old, failed at 1400 psi. Visual inspection was successful at removing the lowest failure pressure cylinders from service. However, 83.1 percent of the cylinders failed the visual inspection procedure. This comparison indicates that the current visual inspection method is effective, indeed very conservative at identifying damaged or weakened cylinders. For further examination, Table 2 summarizes the condition of the eight specimens that failed below 960 psi and and Figures 16 through 18 compare the burst pressure results on the basis of age, source environment, and source location. The results in Figure 16 show that 25 percent of the cylinders that failed below 960 psi were less than 10 years old and 37.5 percent were between 10 and 15 years old. This suggests cylinders do not degrade continuously with age, but that newer cylinders may be damaged or degraded as much as older cylinders. Figures 17 and 18 indicate that the majority of cylinders that failed below 960 psi were from a single location and environment in Georgia. Table 2 shows that, of the 8 that failed the criterion, 6 were related to corrosion. Five of the 6 failures from the Georgia environment were related to corrosion. The burst test results confirm the visual inspection results that, for this set of propane cylinders, corrosion was the primary cause of degradation. Figure 19 and Table 2 summarize the results for cylinders which passed hydrostatic expansion test. Figure 20 and Table 3 summarize the results for cylinders which failed the hydrostatic expansion test. In examining the results in Figure 19, five specimens which passed the hydrostatic expansion test had failure pressures below 960 psi, meaning they were actually unsatisfactory to remain in service. In examining the results in Figure 20, six specimens that failed the hydrostatic test had failure pressures above 960 psi, meaning they were satisfactory to remain in service. A cylinder may fail a hydrostatic expansion test either by leaking before it achieves the test pressure (480 psi) or by exceeding the 10 percent expansion criterion. Inspection of the results in Figures 19 and 20 show that the only poor quality cylinders which were correctly identified by this test were those which leaked. For this database, the expansion criterion was unable to discriminate cylinder integrity and was unconservative. These test results indicate that hydrostatic expansion testing was not effective at identifying weakened cylinders tested in this program. Further examination is warranted. Hydrostatic expansion depends upon steel properties and upon wall thickness. It should be expected to discern the integrity of cylinders that fail by general corrosion over the entire surface. However, the failures observed in this investigation occurred primarily because of localized corrosion or other local phenomena. Hydrostatic expansion with a 10 percent expansion criterion did not appear capable of detecting this type of failure. Figure 21 compares the burst pressure of the tested cylinders to the permanent expansion that was measured. These results suggest that a criterion of 2 or 3 percent maximum permanent expansion might be better able to discern the integrity of cylinders. However, there are other issues that need to be considered before modifying the expansion criterion. The results suggest that this test method should be reviewed to reevaluate its suitability for this class of cylinder.
18
Figure 13. Failure pressure of all cylinders tested as a function of age.
0
500
1000
1500
2000
2500
0 10 20 30 40 50 60 70
Age of Cylinder at Test (Years)
Failu
re P
ress
ure
(psi
)
All Cylinders4 Times Service Pressure, 960 PSIService Pressure, 240 PSI
19
Figure 14. Failure pressure of cylinders that passed visual inspection as a function of age.
Figure 15. Failure pressure of cylinders that failed visual inspection as a function of age.
0
500
1000
1500
2000
2500
0 10 20 30 40 50 60 70
Age of Cylinder at Test (Years)
Failu
re P
ress
ure
(psi
)Passed Visual Inspection4 Times Service Pressure, 960 PSIService Pressure, 240 PSI
0
500
1000
1500
2000
2500
0 10 20 30 40 50 60 70
Age of Cylinder at Test (Years)
Failu
re P
ress
ure
(psi
)
Failed Visual inspection4 Times Service Pressure, 960 PSIService Pressure, 240 PSI
20
Table 2. Summary of cylinders that failed at pressures below 960 psi.
Cylinder Number
Cylinder Date of Manufacture
Manufacturer Code
Visual Inspection
Result
Hydrostatic Expansion
Result
Permanent Expansion (percent)
Burst Test Failure Pressure
(psi) Failure Location Failure Mode Source
Environment
8-3 4/1/1991 Gen Fail due to Corrosion
Failure to achieve test
pressure 0.0 15 Bottom Collar Pinhole 3,Hot, Humid
10-16 9/1/1969 GM&DC Fail due to Corrosion
Failure to achieve test
pressure 0.0 30 Bottom Collar Corrosion
Pinhole 3,Hot, Humid
8-5 6/1/1994 Man Fail due to Corrosion
Failure to achieve test
pressure 0.0 130 Bottom Collar General
Corrosion Failure 3,Hot, Humid
9-16 3/1/1966 WCO Fail due to Corrosion Pass 4.5 498 Base General
Corrosion Failure 6,Temperate
8-13 7/1/1991 WCG Fail due to Corrosion Pass 3.2 718 Boss Weld Crack 3,Hot, Humid
8-1 4/1/1994 Worth
Fail due to Corrosion and Condition of
Rings
Pass 7.0 742 Bottom Collar Corrosion Fracture 3,Hot, Humid
8-8 1/1/1980 WCG Fail due to
Condition of Rings
Pass 3.8 913 Bottom Collar Corrosion Crack 3,Hot, Humid
11-11 4/1/1989 Man Fail due to
Improper Float Valve
Pass 3.9 947 Bleeder Valve Pinhole 8,Temperate, Wet

21
Figure 16. Comparison of the age distribution of cylinders that failed above and below 960 psi.
0%
5%
10%
15%
20%
25%
30%
35%
40%
45%
50%
0-5 5-10 10-15 15-20 20-25 25-30 30-35 35-40 40-45 45-50 50-55 55-60 60-65
Age Ranges (Years)
Perc
enta
ge o
f Spe
cim
ens
in C
ateg
ory
Cylinders that Failed Above 960 psi (228 Specimens)
Cylinders that Failed Below 960 psi (8 Specimens)

22
Figure 17. Comparison of the environment distribution of cylinders that failed above and below 960 psi.
Figure 18. Comparison of the source location distribution of cylinders that failed above and below 960.
0%
10%
20%
30%
40%
50%
60%
70%
80%
90%
100%
#1 Cold,Road Salt
#2 Hot, Dry #3 Hot,Humid
#4 Hot,Smog
#5 Salt Air #6Temperate
#7Temperate,
Smog
#8Temperate,
Wet
Environments
Perc
enta
ge o
f Spe
cim
ens
in C
ateg
ory
Cylinders that Failed Above 960 psi (228 Specimens)
Cylinders that Failed Below 960psi (8 Specimens)
0%
10%
20%
30%
40%
50%
60%
70%
80%
90%
100%
# 1 H
illside
, IL E1
# 7 W
ausa
u, WI E
1
# 14 P
hoen
ix, AZ E2
# 5 Atla
nta, G
A E3
# 8 O
cean
Spring
s, MS E3
# 10 F
airbu
rn, G
A E3
# 3 G
arden
a, CA E4
# 12 H
ousto
n, TX E4
# 4 H
opew
ell, V
A E5
# 6 Ja
ckso
nville
, FL E
5
# 2 IN
E6
# 9 Tole
do, O
H E6
# 13 W
hippa
ny N
J E7
# 11 Y
uba C
ity, C
A E8
Source Locations
Perc
enta
ge o
f Spe
cim
ens
in C
ateg
ory
Cylinders that Failed Above 960 psi (228 Specimens)
Cylinders that Failed Below 960psi (8 Specimens)
23
Figure 19. Failure pressure of cylinders that passed hydrostatic expansion test as a function of age.
Figure 20. Failure pressure of cylinders that failed hydrostatic expansion test.
0
500
1000
1500
2000
2500
0 10 20 30 40 50 60 70
Age of Cylinder at Test (Years)
Failu
re P
ress
ure
(psi
)Passed Hydrostatic Test4 Times Service Pressure, 960 PSIService Pressure. 240 PSI
0
500
1000
1500
2000
2500
0 10 20 30 40 50 60 70
Age of Cylinder at Test (Years)
Failu
re P
ress
ure
(psi
)
Failed Hydrostatic Test4 Times Service Pressure, 960 PSIService Pressure. 240 PSI

24
Figure 21. Comparison of cylinder failure pressure to percent permanent expansion measured in
hydrostatic test.
0
500
1000
1500
2000
2500
0 1 2 3 4 5 6 7 8 9 10 11 12
Permanent Expansion (percent)
Failu
re P
ress
ure
(psi
)
Hydrostatic Test CylindersService Pressure, 240 PSI4 times Service Pressure, 960 PSI
35%>13%>14%>
20%>20%>

25
Table 3. Summary of cylinders that failed 10 percent permanent expansion criterion of hydrostatic expansion test.
Cylinder Number
Cylinder Date of
Manufacture
Manufacturer Code
Cause for Failing Visual Inspection
Failure Pressure
(psi)
Failure Location Failure Mode
Total Expansion
(cc's)
Permanent Expansion
(cc's)
Elastic Expansion
(cc's)
Permanent Expansion (percent)
Source Environment
14-40 11/1/1986 Worth Corrosion 1548 Boss Transverse Fracture 62.6 6.3 56.3 10.1 2,Hot, Dry
9-24 8/1/1995 Man Dented 1509 Boss Transverse Fracture 98.4 34.4 64.0 35.0 6,Temperate
4-16 5/1/1957 POL
Corrosion and Condition of
Rings 1479 Top Collar Weld Pinhole 69.7 9.1 60.6 13.1 5,Salt Air
11-16 3/1/1985 Gen Condition of
Rings 1465 Boss Weld Fracture 49.3 7.1 42.2 14.4 8,Temperate,
Wet
5-19 7/1/1988 Man Corrosion 1025 Circumferential
Weld Weld Crack 70.0 13.9 56.1 19.9 3,Hot, Humid
13-3 2/1/1972 GM&DC Corrosion 972 Bottom Collar Corrosion Pinhole 99.4 19.8 79.6 19.9 7,Temperate,
Smog

26
RELIEF VALVE TESTING AND EVALUATION
Testing Methodology
The cylinder valves with integral relief valves remained in the propane cylinders and remained closed until the cylinders were hydrostatically tested. Relief valves were then removed from the test cylinders and shipped to Battelle for detailed testing. The valves were labeled and placed in individually sealed bags. Relief valve testing was performed approximately two weeks after their removal from the cylinder. In total, 2302 valves were each tested by Battelle in a manner consistent with the CGA S-1.1 Appendix B Requalification Procedures for CG-7 Pressure Relief Valves4 and UL 132 Standard for Safety Relief Valves for Anhydrous Ammonia and LP-Gas5, Test Numbers 1, 2 and 3. The details of the test protocol used are explained in Appendix A of this report. Two enhancements were made to the relief valve test procedure to fully capture all relevant information. First, the equipment and procedure were enhanced so that the pressure at which the valve first bubbles could be measured to within 2 psi, rather than the 50 psi increments specified in S-1.1. Secondly, preliminary testing showed that many valves did not open smoothly after the first bubble. Rather, they typically bubbled slowly as the pressure increased and then popped and opened fully at pressures 25 to 75 psi above the first bubble pressure. The test procedure was enhanced to record the full opening pressure (FOP) in addition to the start to discharge (STD) pressure. Consistent with CGA and UL procedures, the start-to-discharge, full-open and reseat pressures of each valve were measured and recorded twice in a single test session. The flow capacity of the relief valve was measured between each discharge/reseat sequence. In these tests, a hose was connected to the outlet of the valve and submerged in four inches of water. The start-to-discharge pressure was measured by slowly pressuring the valve until the first bubble of air escaping was observed. In many cases the relief valve did not open fully until the pressure was increased further. Following recording of the STD, the valve was pressured until a loud “pop” was heard and the flow rate jumped significantly. This was recorded as the full-open-pressure (FOP). Once the valve was fully opened, the pressure of the air flowing into the valve was adjusted to the valve flow rating pressure and the flow rate was measured. Subsequently, the pressure in the valve was reduced carefully until no more bubbles were observed to escape the valve. This was recorded as the reseat pressure. After the initial sequence, the start-to-discharge pressure, full-open pressure, and reseating pressure tests were repeated. The first and second test cycles were referred to as the A sequence and B sequence, respectively. A potentially significant difference between the Battelle test protocol and the S-1.1 and UL 132 test protocols was the dwell (wait) time between A and B sequence. S-1.1 and UL 132 have a one hour dwell between the two sequences. When contacted by Battelle, UL indicated that there was an expectation that this one hour wait would be reduced or deleted in the future. Battelle performed some preliminary dwell tests on a valve which suggested that there was no effect of wait time on results. Program advisors reviewed the test procedure and did not identify potential problems as a result of this difference. However, as discussed later in the report, the second start-to-discharge results may be influenced by this
2 Some relief valves could not be tested due to valve damage and inability of components other than the relief valve to maintain pressure.
27
dwell time. Nevertheless, the trends in performance appear consistent, regardless of the details of the test procedures, and this caused no change in the overall conclusions of the report. Although relief valves for 20-pound propane cylinders are expected to open between 360 and 480 psi, some did not open when pressured up to 750 psi. The outlet of each of the valves was inspected visually following the test cycle to collect further information. The inspection found evidence of debris, paint, and corrosion in many valves. The results of this inspection is described and discussed later in this report.
Valve Test Criteria
In conducting these tests, certain criteria are used for evaluation and comparison. The genesis of these criteria are described below. The service pressure of the DOT 4BA cylinders tested was 240 psi. The minimum required (hydrostatic expansion) test pressure for these cylinders is twice the service pressure, or 480 psi. Although DOT standards do not specify a minimum failure pressure requirement for this class of cylinder 4BA, DOT typically specifies 4 times service pressure as the minimum failure pressure for metal pressure vessels, e.g. 960 psi. Most of the valves tested in this program were marked with a pressure of 375 psi, which was interpreted to be the set pressure of the valve. UL 132 indicates that relief valves with a set pressure of 375 psi, have a flow rating pressure of 450 psi. In CGA S-1.1, Section 6.6 and the Requalification Procedure in Appendix B requires that relief valves start to discharge between 75 and 100 percent of the flow rating pressure, e.g. 337.5 and 450 psi. However, NFPA 58 requires that cylinders have relief valves with the start-to-discharge pressure not less than 75 percent nor more than 100 percent of the minimum required test pressure of the cylinder, e.g. between 360 and 480 psi. In discussions with NPGA representatives it was agreed that the criterion to be used for start-to-discharge pressure would be 360 and 480 psi. However, flow rating tests were performed at 450 psi, which would be expected to be more conservative than testing at 480 psi. In CGA S-1.1, Section 4.3.2.3 requires that the reseating pressure of relief valves not be less than the pressure in a normally charged cylinder at 130 F. NFPA representatives suggest that the range of “normally charged” pressures currently would be between 255 psi and 302 psi. For the purposes of this report and simplicity, it was conservatively assumed that reseating should occur above the service pressure of 240 psi. This conservative value allows a few more valves to meet the reseat criterion than would the S-1.1 criterion, but does not change the overall conclusions of the program.
Observations on Visual Inspection of Relief Valves
In review of current industry practices, Battelle found that, although CGA S-1.1 standard for pressure relief valves requires that relief valves be inspected before each fill, CGA C-6 visual inspection procedures for propane cylinders do not include relief valve inspection. As discussed in more detail later, some valves that failed to open contained debris or were packed with debris of various types. It is clear that relief valves cannot operate properly when the external spring and outlet port contains foreign matter. During inspection of the relief valves in this investigation, Battelle identified four types of contamination
Packed with debris Partial debris

28
Limited evidence of corrosion products Paint
Figure 22 shows the results of the visual inspection of relief valves and compares those from cylinders passing visual inspection to those failing cylinder visual inspection.
Figure 22. Summary and comparison of results of visual inspection of valves from cylinders which passed and failed cylinder visual inspection procedures.
Battelle’s assessment did not show evidence that paint would likely degrade performance. Evidence of corrosion of the relief valve components would, of course, be detrimental, but limited corrosion products from other sources would not be expected to be detrimental as long as they do not interfere with relief valve operation. The results shown here suggest that consideration should be given to adding visual inspection of the relief valve to the cylinder visual inspection currently defined by CGA C-6. Furthermore, while relief valves should not be repaired or modified, Battelle’s inspection indicates simple cleaning and removal of debris by compressed air may be beneficial. Such a visual inspection method should be developed in a consensus standards process with the involvement of relief valve and cylinder manufacturers and should be verified by testing. Following are some considerations for a visual inspection procedure suggested by the work done under this program.
The outlet of all relief valves should be cleaned of debris only by application of a stream of compressed air at no greater than 150 psi to the outlet. The valve should not be washed with water jet or other liquid which could enable corrosion.
Valve Inspection
0.0%
5.0%
10.0%
15.0%
20.0%
25.0%
30.0%
35.0%
40.0%
45.0%
50.0%
Packed With Debris Limited Debris Corrosion Products Painted No Debris
All Cylinders Cylinders Passing Visual Inspection Cylinders Failing Visual Inspection
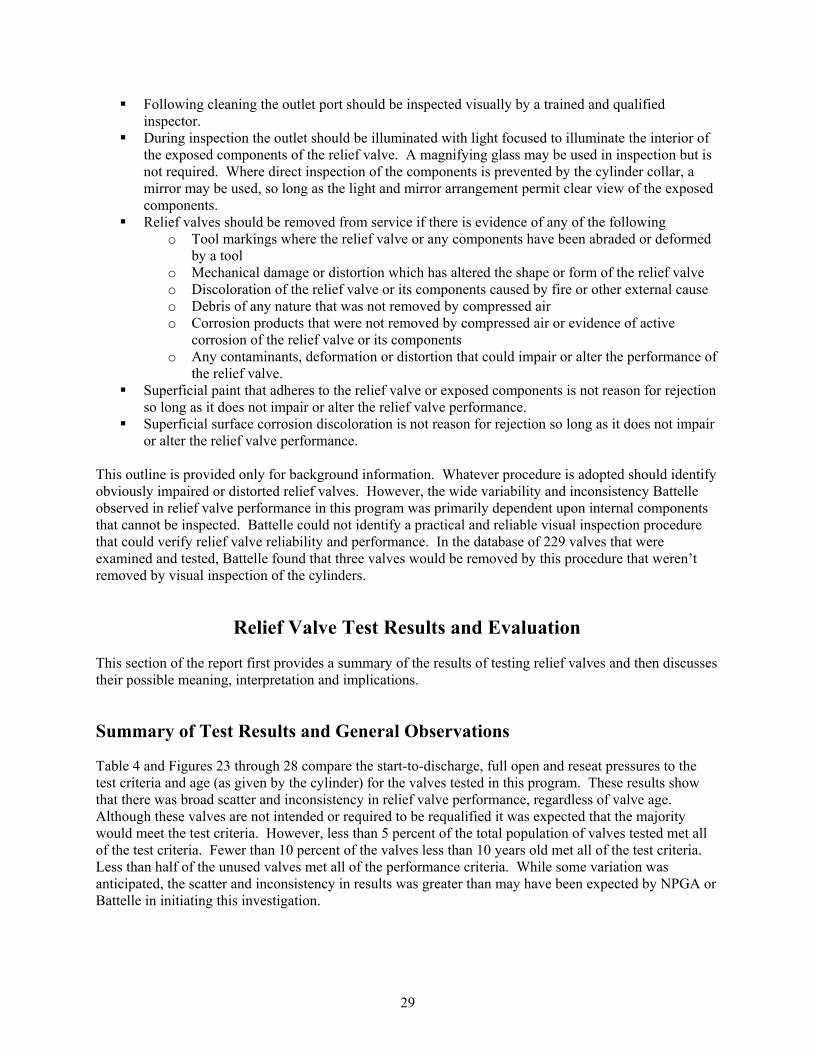
29
Following cleaning the outlet port should be inspected visually by a trained and qualified inspector.
During inspection the outlet should be illuminated with light focused to illuminate the interior of the exposed components of the relief valve. A magnifying glass may be used in inspection but is not required. Where direct inspection of the components is prevented by the cylinder collar, a mirror may be used, so long as the light and mirror arrangement permit clear view of the exposed components.
Relief valves should be removed from service if there is evidence of any of the following o Tool markings where the relief valve or any components have been abraded or deformed
by a tool o Mechanical damage or distortion which has altered the shape or form of the relief valve o Discoloration of the relief valve or its components caused by fire or other external cause o Debris of any nature that was not removed by compressed air o Corrosion products that were not removed by compressed air or evidence of active
corrosion of the relief valve or its components o Any contaminants, deformation or distortion that could impair or alter the performance of
the relief valve. Superficial paint that adheres to the relief valve or exposed components is not reason for rejection
so long as it does not impair or alter the relief valve performance. Superficial surface corrosion discoloration is not reason for rejection so long as it does not impair
or alter the relief valve performance. This outline is provided only for background information. Whatever procedure is adopted should identify obviously impaired or distorted relief valves. However, the wide variability and inconsistency Battelle observed in relief valve performance in this program was primarily dependent upon internal components that cannot be inspected. Battelle could not identify a practical and reliable visual inspection procedure that could verify relief valve reliability and performance. In the database of 229 valves that were examined and tested, Battelle found that three valves would be removed by this procedure that weren’t removed by visual inspection of the cylinders.
Relief Valve Test Results and Evaluation
This section of the report first provides a summary of the results of testing relief valves and then discusses their possible meaning, interpretation and implications.
Summary of Test Results and General Observations
Table 4 and Figures 23 through 28 compare the start-to-discharge, full open and reseat pressures to the test criteria and age (as given by the cylinder) for the valves tested in this program. These results show that there was broad scatter and inconsistency in relief valve performance, regardless of valve age. Although these valves are not intended or required to be requalified it was expected that the majority would meet the test criteria. However, less than 5 percent of the total population of valves tested met all of the test criteria. Fewer than 10 percent of the valves less than 10 years old met all of the test criteria. Less than half of the unused valves met all of the performance criteria. While some variation was anticipated, the scatter and inconsistency in results was greater than may have been expected by NPGA or Battelle in initiating this investigation.
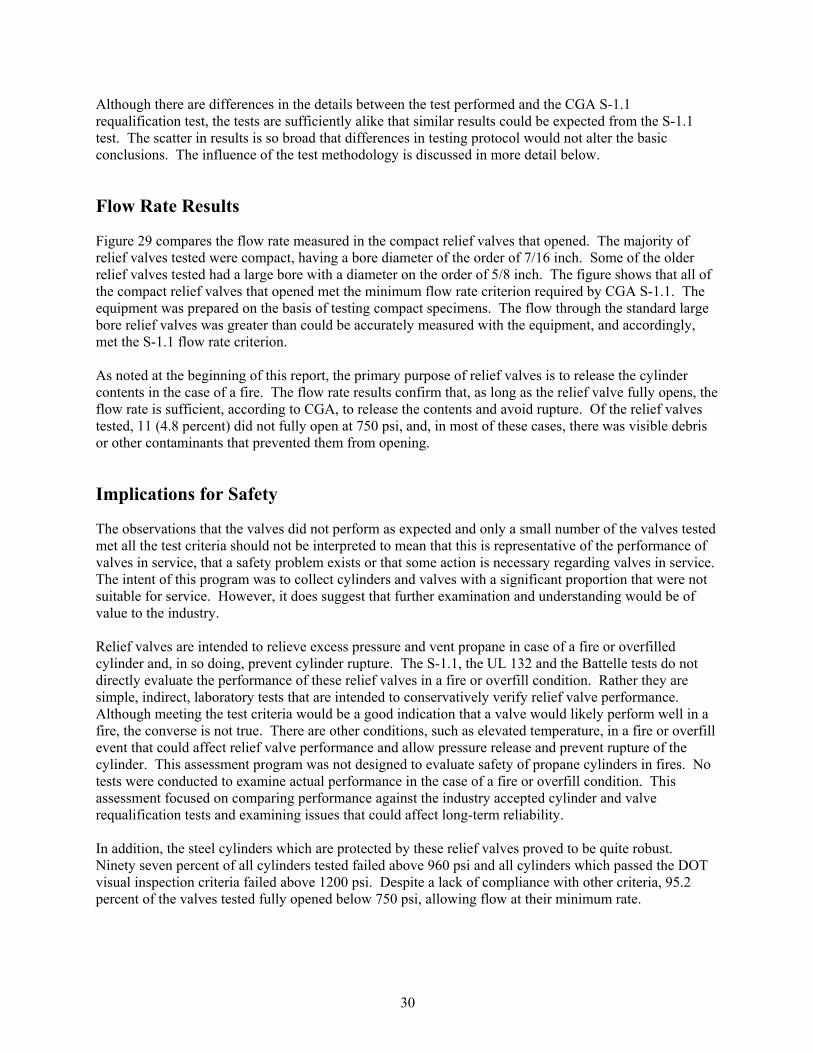
30
Although there are differences in the details between the test performed and the CGA S-1.1 requalification test, the tests are sufficiently alike that similar results could be expected from the S-1.1 test. The scatter in results is so broad that differences in testing protocol would not alter the basic conclusions. The influence of the test methodology is discussed in more detail below.
Flow Rate Results
Figure 29 compares the flow rate measured in the compact relief valves that opened. The majority of relief valves tested were compact, having a bore diameter of the order of 7/16 inch. Some of the older relief valves tested had a large bore with a diameter on the order of 5/8 inch. The figure shows that all of the compact relief valves that opened met the minimum flow rate criterion required by CGA S-1.1. The equipment was prepared on the basis of testing compact specimens. The flow through the standard large bore relief valves was greater than could be accurately measured with the equipment, and accordingly, met the S-1.1 flow rate criterion. As noted at the beginning of this report, the primary purpose of relief valves is to release the cylinder contents in the case of a fire. The flow rate results confirm that, as long as the relief valve fully opens, the flow rate is sufficient, according to CGA, to release the contents and avoid rupture. Of the relief valves tested, 11 (4.8 percent) did not fully open at 750 psi, and, in most of these cases, there was visible debris or other contaminants that prevented them from opening.
Implications for Safety
The observations that the valves did not perform as expected and only a small number of the valves tested met all the test criteria should not be interpreted to mean that this is representative of the performance of valves in service, that a safety problem exists or that some action is necessary regarding valves in service. The intent of this program was to collect cylinders and valves with a significant proportion that were not suitable for service. However, it does suggest that further examination and understanding would be of value to the industry. Relief valves are intended to relieve excess pressure and vent propane in case of a fire or overfilled cylinder and, in so doing, prevent cylinder rupture. The S-1.1, the UL 132 and the Battelle tests do not directly evaluate the performance of these relief valves in a fire or overfill condition. Rather they are simple, indirect, laboratory tests that are intended to conservatively verify relief valve performance. Although meeting the test criteria would be a good indication that a valve would likely perform well in a fire, the converse is not true. There are other conditions, such as elevated temperature, in a fire or overfill event that could affect relief valve performance and allow pressure release and prevent rupture of the cylinder. This assessment program was not designed to evaluate safety of propane cylinders in fires. No tests were conducted to examine actual performance in the case of a fire or overfill condition. This assessment focused on comparing performance against the industry accepted cylinder and valve requalification tests and examining issues that could affect long-term reliability. In addition, the steel cylinders which are protected by these relief valves proved to be quite robust. Ninety seven percent of all cylinders tested failed above 960 psi and all cylinders which passed the DOT visual inspection criteria failed above 1200 psi. Despite a lack of compliance with other criteria, 95.2 percent of the valves tested fully opened below 750 psi, allowing flow at their minimum rate.
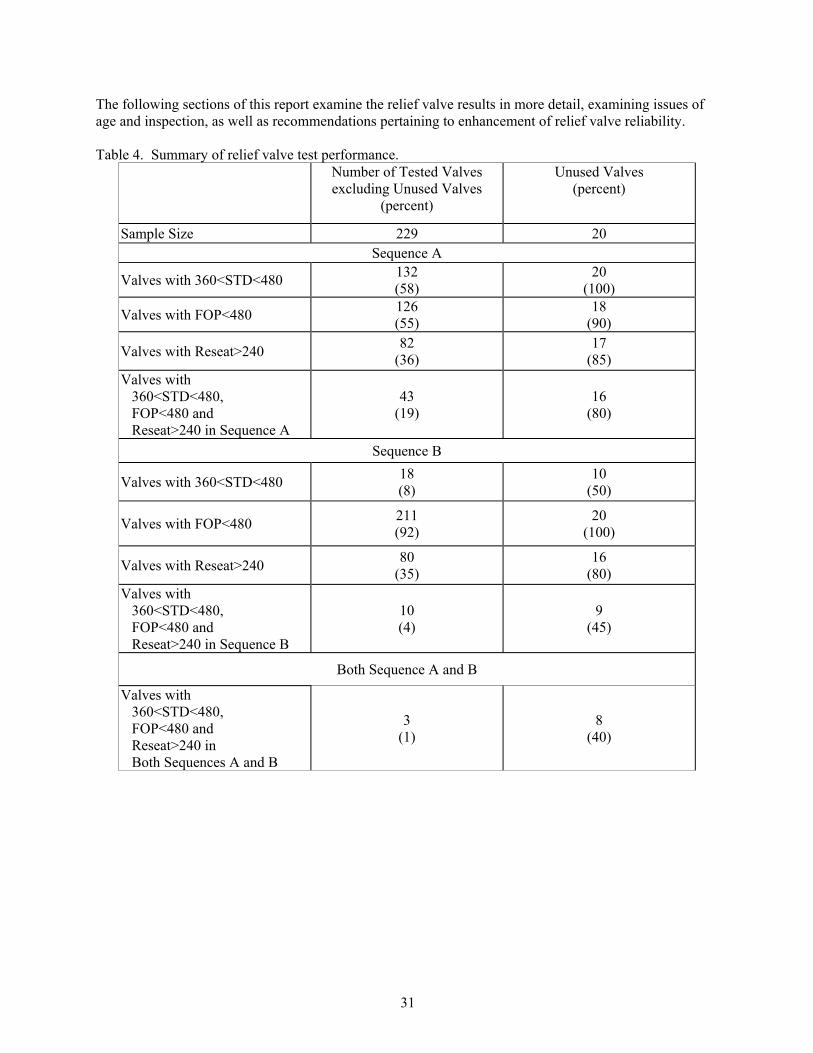
31
The following sections of this report examine the relief valve results in more detail, examining issues of age and inspection, as well as recommendations pertaining to enhancement of relief valve reliability. Table 4. Summary of relief valve test performance.
Number of Tested Valves excluding Unused Valves
(percent)
Unused Valves (percent)
Sample Size 229 20 Sequence A
Valves with 360<STD<480 132 (58)
20 (100)
Valves with FOP<480 126 (55)
18 (90)
Valves with Reseat>240 82 (36)
17 (85)
Valves with 360<STD<480, FOP<480 and Reseat>240 in Sequence A
43 (19)
16 (80)
Sequence B
Valves with 360<STD<480 18 (8)
10 (50)
Valves with FOP<480 211 (92)
20 (100)
Valves with Reseat>240 80 (35)
16 (80)
Valves with 360<STD<480, FOP<480 and Reseat>240 in Sequence B
10 (4)
9 (45)
Both Sequence A and B
Valves with 360<STD<480, FOP<480 and Reseat>240 in Both Sequences A and B
3 (1)
8 (40)
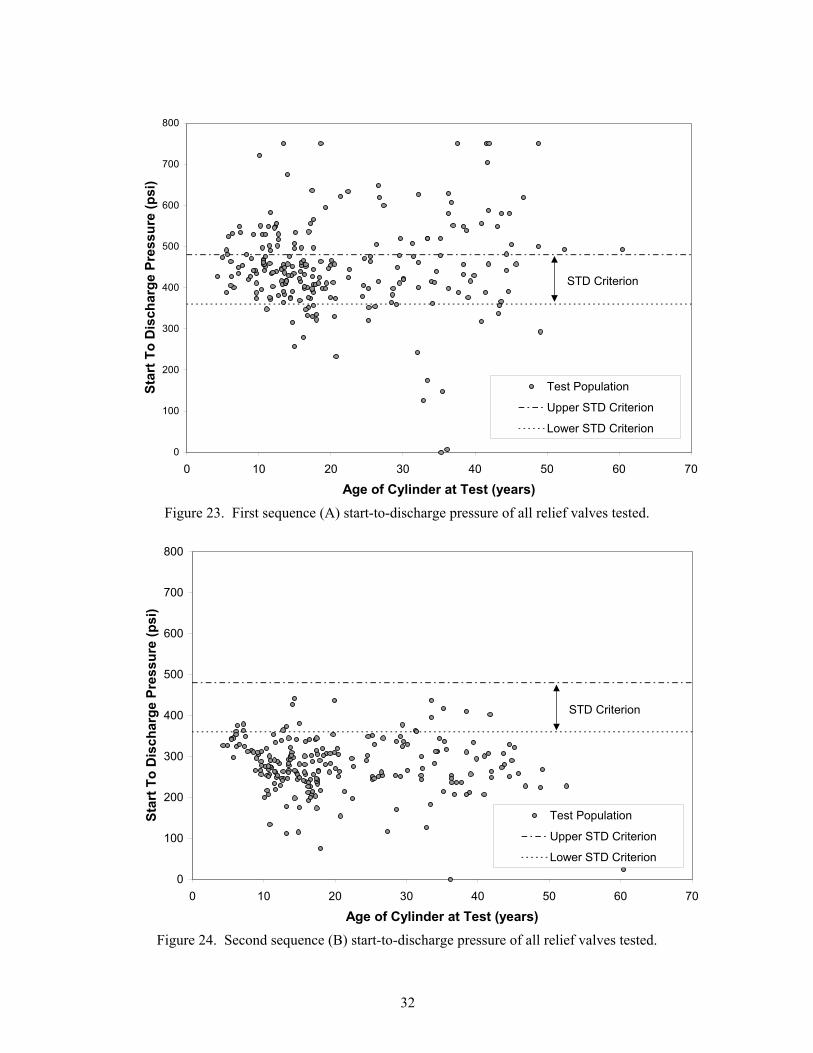
32
Figure 23. First sequence (A) start-to-discharge pressure of all relief valves tested.
Figure 24. Second sequence (B) start-to-discharge pressure of all relief valves tested.
0
100
200
300
400
500
600
700
800
0 10 20 30 40 50 60 70
Age of Cylinder at Test (years)
Star
t To
Dis
char
ge P
ress
ure
(psi
)
Test Population
Upper STD Criterion
Lower STD Criterion
STD Criterion
0
100
200
300
400
500
600
700
800
0 10 20 30 40 50 60 70
Age of Cylinder at Test (years)
Star
t To
Dis
char
ge P
ress
ure
(psi
)
Test Population
Upper STD Criterion
Lower STD Criterion
STD Criterion

33
Figure 25. First sequence (A) full-open pressure of all relief valves tested.
Figure 26. Second sequence (B) full-open pressure of all relief valves tested.
0
100
200
300
400
500
600
700
800
0 10 20 30 40 50 60 70
Age of Cylinder at Test (years)
Full
Ope
n Pr
essu
re (p
si)
Test Population
FOP Criterion
FOP
0
100
200
300
400
500
600
700
800
0 10 20 30 40 50 60 70
Age of Cylinder at Test (years)
Full
Ope
n Pr
essu
re (p
si)
Test Population
FOP Criterion
FOP
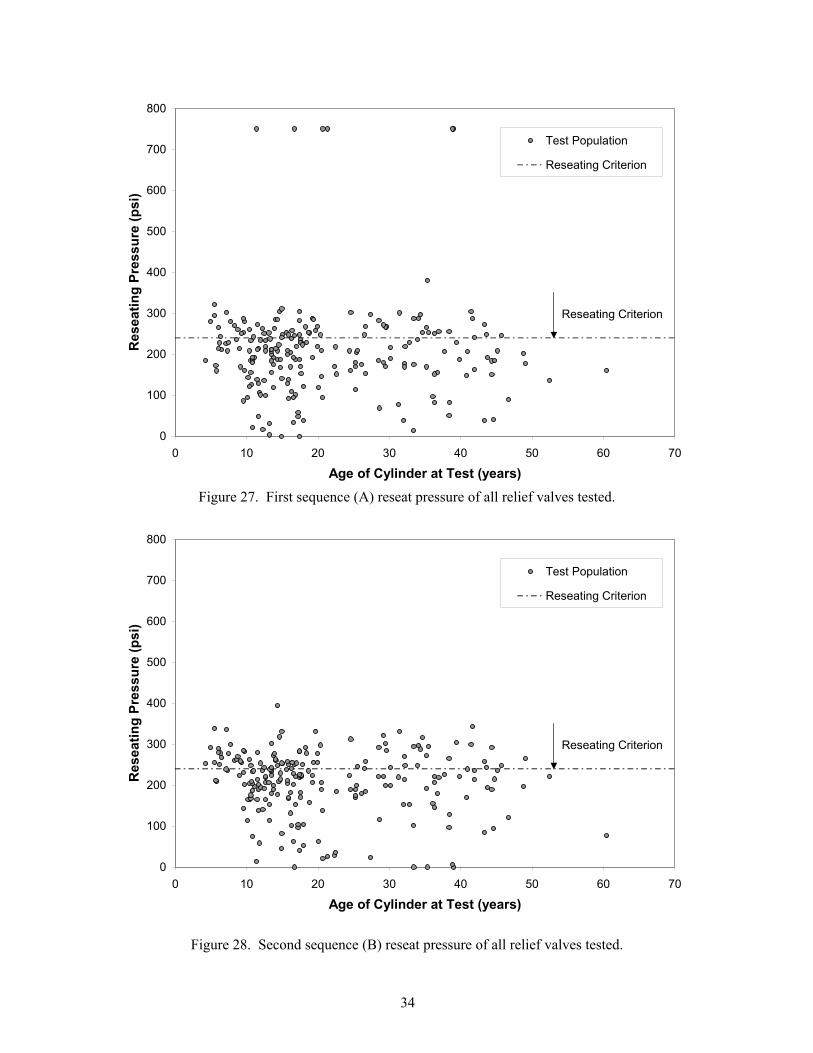
34
Figure 27. First sequence (A) reseat pressure of all relief valves tested.
Figure 28. Second sequence (B) reseat pressure of all relief valves tested.
0
100
200
300
400
500
600
700
800
0 10 20 30 40 50 60 70
Age of Cylinder at Test (years)
Res
eatin
g Pr
essu
re (p
si)
Test Population
Reseating Criterion
Reseating Criterion
0
100
200
300
400
500
600
700
800
0 10 20 30 40 50 60 70
Age of Cylinder at Test (years)
Res
eatin
g Pr
essu
re (p
si)
Test Population
Reseating Criterion
Reseating Criterion

35
Figure 29. Measured relief valve flow rate as a function of age.
0
50
100
150
200
0 10 20 30 40 50 60 70Age at Test (years)
Flow
Rat
e (ft
.^3/
min
.)
Unused Valves
Compact Valves
Flow Rate Criterion
Note: Flow rate through all standard sized relief valves that opened was greater than the equipment capacity of over 200 ft^/min.
36
Comparison of Potential Replacement Standards
One of the primary objectives of this program was to examine the potential for visual inspection of the relief valve as an alternative for replacement of relief valves after 10 years, as suggested by CGA S-1.1. As one avenue to explore this potential requirement, the benefits of replacement were compared against the benefits of visual inspection of the valves. Table 5 and Figures 30 through 35 compare the test results for start-to-discharge, full-open and reseat pressure for both test sequences for five potential replacement standards, including
All tested, used valves Unused valves Valves less than 10 years old Valves from cylinders which passed visual inspection Valves which passed both cylinder and valve visual inspection
Table 5 compares the percentage of valves that met the test criteria, the average STD, FOP or reseat pressures and the range of STD, FOP and reseat pressures for each potential replacement standard. This table allows a comparison of the relative performance on each segment of the test. In this table, better performance is implied by a higher number of relief valves meeting the criteria and by smaller pressure ranges (i.e. smaller scatter). Figures 30 through 35 plot the pressure level for each specimen “stacked” in a single column for each of the potential replacement standards. In so doing, the figures readily show the relative number of specimens that meet the test criteria for each standard and how the “scatter” in data is distributed. Side-by-side comparison of the results allows a rapid visual and physical comparison.
Analysis
Table 5, Rows 1 and 5 and Figures 30 and 31 compare the start-to-discharge pressure in the A and B test sequence for each potential replacement standard. In the A sequence, all of the unused valves met the STD test criterion. The “10-year” and “inspected” valves had similar percentages meeting the STD criterion (61 to 72 percent). However, Figure 30 shows that the 10-year valves had more specimens above the STD criterion than the inspected valves. In Sequence B, half of the unused valves met the STD criterion, 15 percent of the 10-year valves met the criterion, 6 percent of the valves passing cylinder visual inspection met the criterion and 3 percent of the valves passing cylinder and visual inspection met the criterion. The 10-year replacement standard yielded less scatter in both A and B sequences and did better at meeting the STD criterion for Sequence B than either inspection standard. Rows 2 and 6 and Figures 32 and 33 compare the full-open pressure in the A and B test sequences. In the A sequence, 90 percent of the unused valves met the FOP test criterion and the 10-year and inspected valves had similar percentages meeting the FOP criterion (66 to 69 percent). In the B sequence, 100 percent of the unused valves met the FOP criterion and 97 to 100 percent of the 10-year and inspected valves met the criterion. Rows 3 and 7 and Figures 34 and 35 compare the reseat pressure in the A and B test sequences. In the A sequence, 85 percent of the unused valves met the reseat criterion, 63 percent of the 10 year valves met the criterion and 28 to 29 percent of the inspected valves met the criterion. In the B sequence, 80 percent of the new valves met the criterion, 70 percent of the 10-year valves met the criterion and 31 percent of the inspected valves met the criterion. In both sequences, the 10-year replacement standard showed less
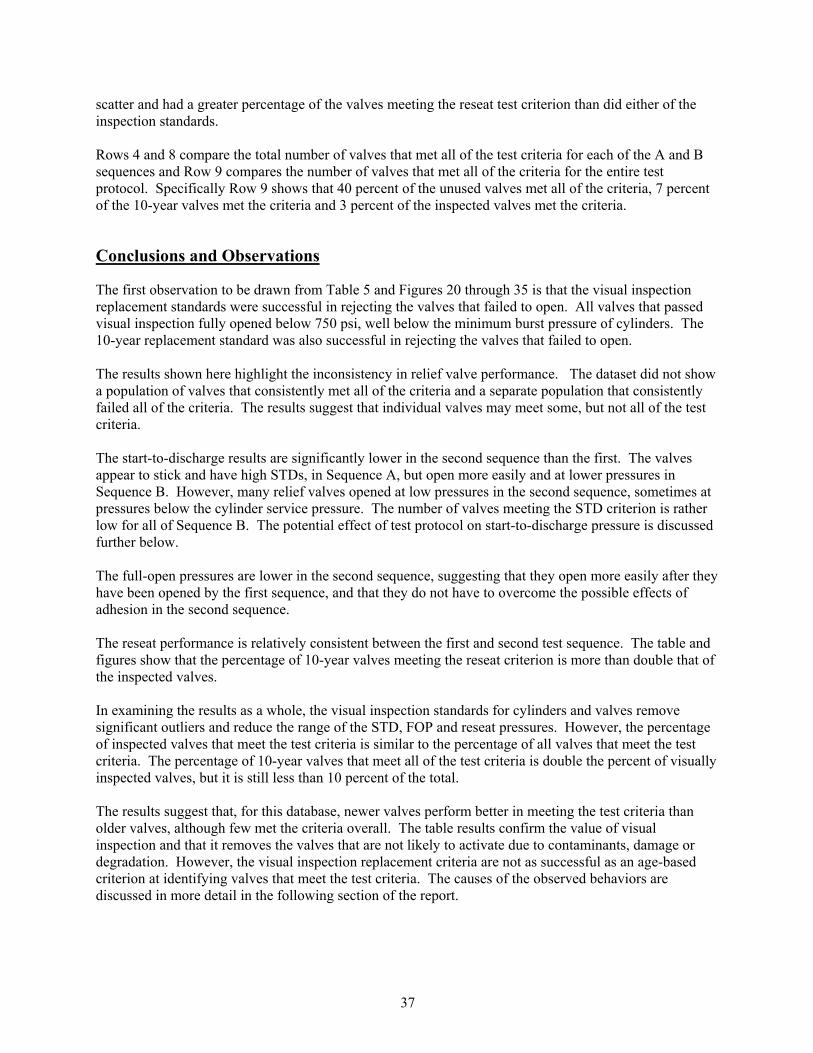
37
scatter and had a greater percentage of the valves meeting the reseat test criterion than did either of the inspection standards. Rows 4 and 8 compare the total number of valves that met all of the test criteria for each of the A and B sequences and Row 9 compares the number of valves that met all of the criteria for the entire test protocol. Specifically Row 9 shows that 40 percent of the unused valves met all of the criteria, 7 percent of the 10-year valves met the criteria and 3 percent of the inspected valves met the criteria.
Conclusions and Observations
The first observation to be drawn from Table 5 and Figures 20 through 35 is that the visual inspection replacement standards were successful in rejecting the valves that failed to open. All valves that passed visual inspection fully opened below 750 psi, well below the minimum burst pressure of cylinders. The 10-year replacement standard was also successful in rejecting the valves that failed to open. The results shown here highlight the inconsistency in relief valve performance. The dataset did not show a population of valves that consistently met all of the criteria and a separate population that consistently failed all of the criteria. The results suggest that individual valves may meet some, but not all of the test criteria. The start-to-discharge results are significantly lower in the second sequence than the first. The valves appear to stick and have high STDs, in Sequence A, but open more easily and at lower pressures in Sequence B. However, many relief valves opened at low pressures in the second sequence, sometimes at pressures below the cylinder service pressure. The number of valves meeting the STD criterion is rather low for all of Sequence B. The potential effect of test protocol on start-to-discharge pressure is discussed further below. The full-open pressures are lower in the second sequence, suggesting that they open more easily after they have been opened by the first sequence, and that they do not have to overcome the possible effects of adhesion in the second sequence. The reseat performance is relatively consistent between the first and second test sequence. The table and figures show that the percentage of 10-year valves meeting the reseat criterion is more than double that of the inspected valves. In examining the results as a whole, the visual inspection standards for cylinders and valves remove significant outliers and reduce the range of the STD, FOP and reseat pressures. However, the percentage of inspected valves that meet the test criteria is similar to the percentage of all valves that meet the test criteria. The percentage of 10-year valves that meet all of the test criteria is double the percent of visually inspected valves, but it is still less than 10 percent of the total. The results suggest that, for this database, newer valves perform better in meeting the test criteria than older valves, although few met the criteria overall. The table results confirm the value of visual inspection and that it removes the valves that are not likely to activate due to contaminants, damage or degradation. However, the visual inspection replacement criteria are not as successful as an age-based criterion at identifying valves that meet the test criteria. The causes of the observed behaviors are discussed in more detail in the following section of the report.
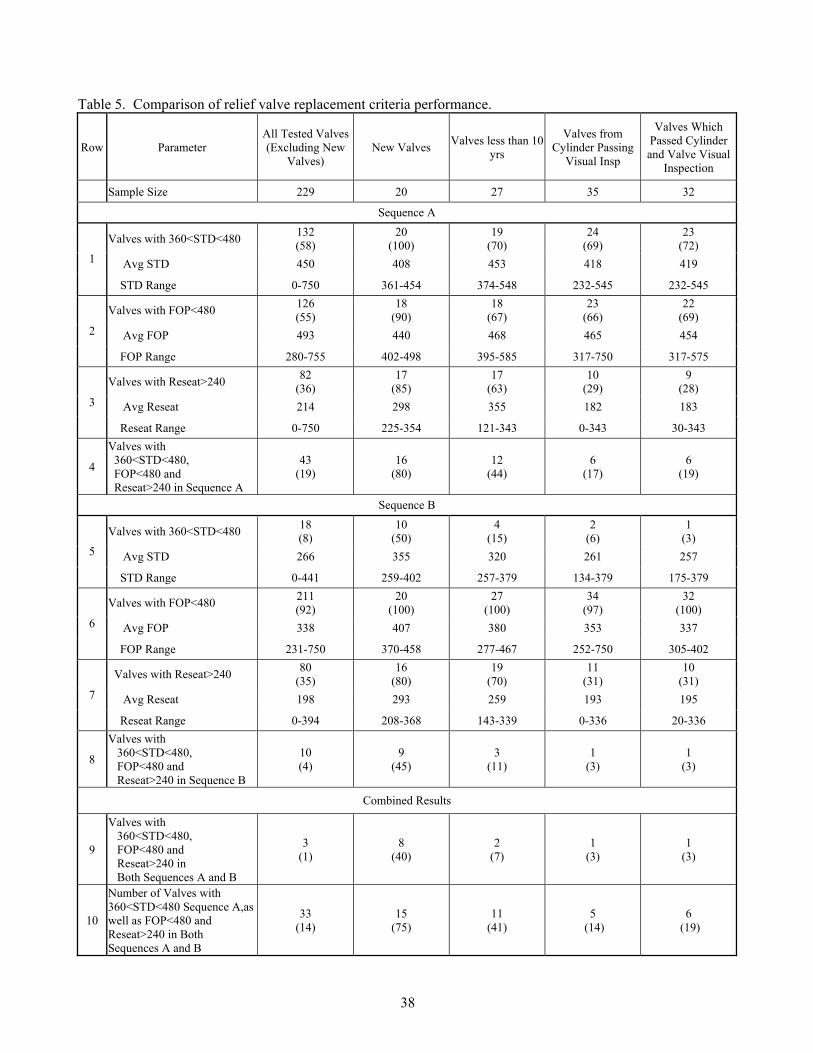
38
Table 5. Comparison of relief valve replacement criteria performance.
Row Parameter All Tested Valves (Excluding New
Valves) New Valves Valves less than 10
yrs
Valves from Cylinder Passing
Visual Insp
Valves Which Passed Cylinder and Valve Visual
Inspection
Sample Size 229 20 27 35 32
Sequence A
Valves with 360<STD<480 132 (58)
20 (100)
19 (70)
24 (69)
23 (72)
Avg STD 450 408 453 418 419 1
STD Range 0-750 361-454 374-548 232-545 232-545
Valves with FOP<480 126 (55)
18 (90)
18 (67)
23 (66)
22 (69)
Avg FOP 493 440 468 465 454 2
FOP Range 280-755 402-498 395-585 317-750 317-575
Valves with Reseat>240 82 (36)
17 (85)
17 (63)
10 (29)
9 (28)
Avg Reseat 214 298 355 182 183 3
Reseat Range 0-750 225-354 121-343 0-343 30-343
4
Valves with 360<STD<480, FOP<480 and Reseat>240 in Sequence A
43 (19)
16 (80)
12 (44)
6 (17)
6 (19)
Sequence B
Valves with 360<STD<480 18 (8)
10 (50)
4 (15)
2 (6)
1 (3)
Avg STD 266 355 320 261 257 5
STD Range 0-441 259-402 257-379 134-379 175-379
Valves with FOP<480 211 (92)
20 (100)
27 (100)
34 (97)
32 (100)
Avg FOP 338 407 380 353 337 6
FOP Range 231-750 370-458 277-467 252-750 305-402
Valves with Reseat>240 80 (35)
16 (80)
19 (70)
11 (31)
10 (31)
Avg Reseat 198 293 259 193 195 7
Reseat Range 0-394 208-368 143-339 0-336 20-336
8
Valves with 360<STD<480, FOP<480 and Reseat>240 in Sequence B
10 (4)
9 (45)
3 (11)
1 (3)
1 (3)
Combined Results
9
Valves with 360<STD<480, FOP<480 and Reseat>240 in Both Sequences A and B
3 (1)
8 (40)
2 (7)
1 (3)
1 (3)
10
Number of Valves with 360<STD<480 Sequence A,as well as FOP<480 and Reseat>240 in Both Sequences A and B
33 (14)
15 (75)
11 (41)
5 (14)
6 (19)
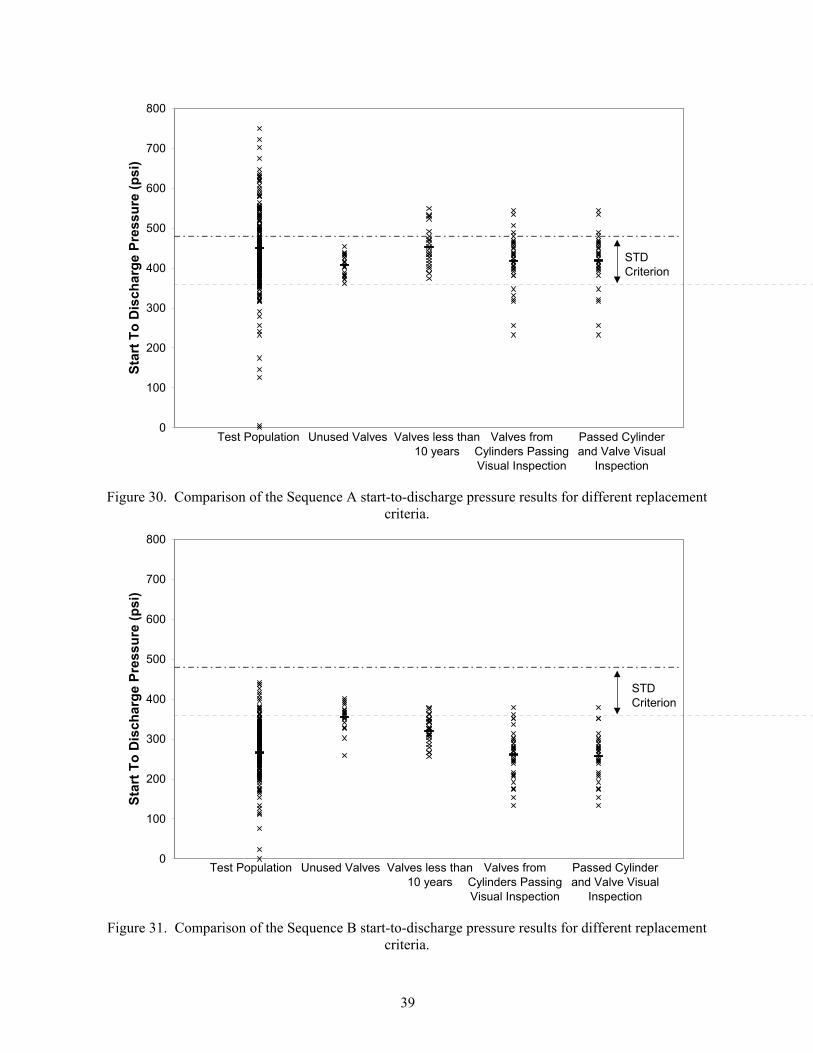
39
Figure 30. Comparison of the Sequence A start-to-discharge pressure results for different replacement criteria.
Figure 31. Comparison of the Sequence B start-to-discharge pressure results for different replacement criteria.
0
100
200
300
400
500
600
700
800
Star
t To
Dis
char
ge P
ress
ure
(psi
)
STD Criterion
Test Population Unused Valves Valves less than 10 years
Valves from Cylinders Passing Visual Inspection
Passed Cylinder and Valve Visual
Inspection
0
100
200
300
400
500
600
700
800
Star
t To
Dis
char
ge P
ress
ure
(psi
)
STD Criterion
Test Population Unused Valves Valves less than 10 years
Valves from Cylinders Passing Visual Inspection
Passed Cylinder and Valve Visual
Inspection
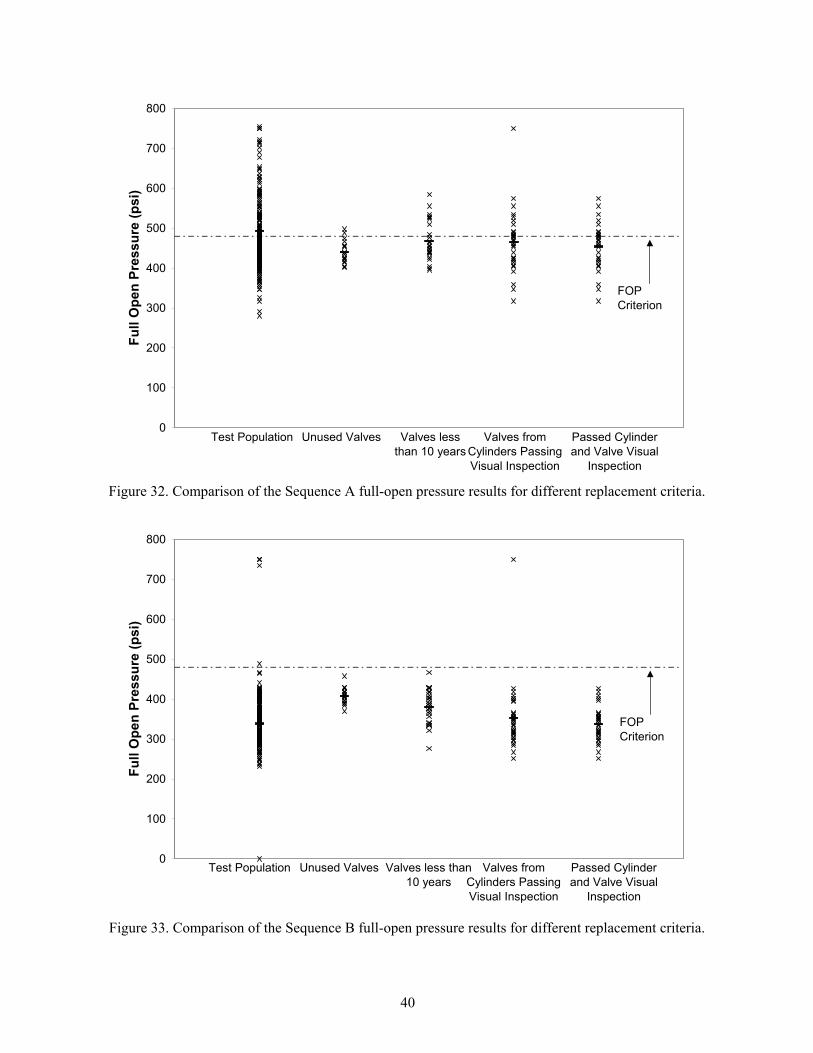
40
Figure 32. Comparison of the Sequence A full-open pressure results for different replacement criteria.
Figure 33. Comparison of the Sequence B full-open pressure results for different replacement criteria.
0
100
200
300
400
500
600
700
800
Full
Ope
n Pr
essu
re (p
si)
FOP Criterion
Test Population Unused Valves Valves less than 10 years
Valves from Cylinders Passing Visual Inspection
Passed Cylinder and Valve Visual
Inspection
0
100
200
300
400
500
600
700
800
Full
Ope
n Pr
essu
re (p
si)
FOP Criterion
Test Population Unused Valves Valves less than 10 years
Valves from Cylinders Passing Visual Inspection
Passed Cylinder and Valve Visual
Inspection
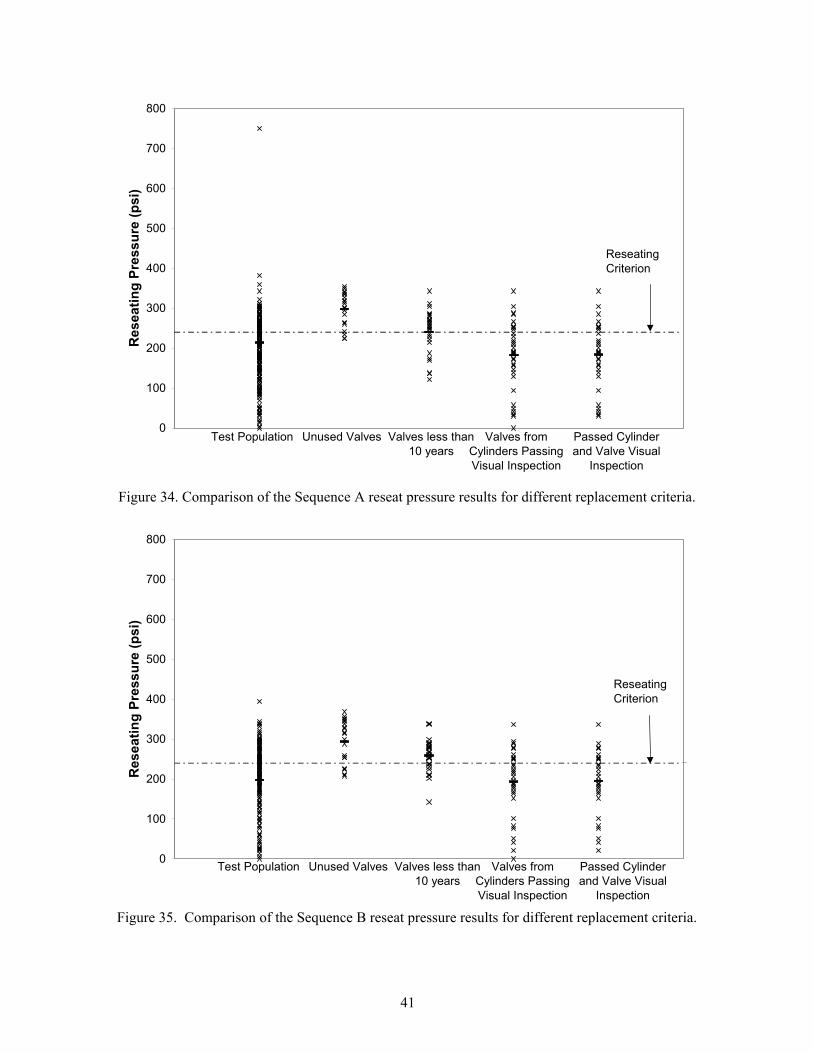
41
Figure 34. Comparison of the Sequence A reseat pressure results for different replacement criteria.
Figure 35. Comparison of the Sequence B reseat pressure results for different replacement criteria.
0
100
200
300
400
500
600
700
800
Res
eatin
g Pr
essu
re (p
si)
Reseating Criterion
Test Population Unused Valves Valves less than 10 years
Valves from Cylinders Passing Visual Inspection
Passed Cylinder and Valve Visual
Inspection
0
100
200
300
400
500
600
700
800
Res
eatin
g Pr
essu
re (p
si)
Reseating Criterion
Test Population Unused Valves Valves less than 10 years
Valves from Cylinders Passing Visual Inspection
Passed Cylinder and Valve Visual
Inspection

42
Effects of Environment, Source Location and Manufacturer
Figures 36 through 52 summarize the start-to-discharge, full-open and reseat pressures from the relief valve test results sorted on the basis of source environment, source location and valve manufacturer. Again, the figures plot the pressure level for each specimen “stacked” in a single column for each of the subsets. In so doing, the figures readily show how the relative number of specimens meet the test criteria and how the scatter in data is distributed. Side-by-side comparison of the results of each of the potential replacement criteria allows a rapid visual and physical comparison of their results. The source environment comparison in Figures 36 through 41 shows fairly consistent behavior across each environment. Each environment shows similar scatter and range for start-to-discharge, full-open, and reseat pressure for both test sequence A and B. Any of the apparent differences in scatter that the data might suggest are more likely to be the result of differences in the number of specimens from each environment. These plots do not suggest any major differences that are a result of source environment. The same thing is true for source location comparisons shown in Figures 42 through 47. There is no apparent fundamental difference that can be shown to be a function of environment. Lastly, the valve manufacturer comparison in Figures 48 through 53 suggests that the manufacturers with the largest number of valves showed the greatest span of results. More Rego, Sherwood and Sherwood Sel Pac valves were tested than the other manufacturers as shown by Figure 9. Roughly 20 percent of the valves tested were from Rego, approximately 30 percent were labeled Sherwood and about 28 percent were labeled Sherwood Sel Pac. Each of these showed similar range of results for start-to-discharge, full open and reseat pressures. While the overall range was similar, more of the Sherwood and Sherwood Sel Pac met the test criteria.
Effect of Relief Valve Size
As noted earlier in this report, the majority of relief valves tested were “compact” having a bore diameter of the order of 7/16 inch. Some of the older “standard” relief valves tested had a large bore with a diameter of the order of 5/8 inch. All of the relief valves that opened met the minimum flow rate criterion required by CGA S-1.1. Figures 54 through 59 compare the start-to-discharge, full-open and reseat results for compact and standard relief valves. The data in the figures don’t appear to indicate major distinctions between the performance of the compact and standard valves. Many more compact valves were tested than standard, and, consequently, they appear to have more scatter. However, any apparent differences are more likely the result of the number of each tested than actual differences in performance. Table 6 summarizes the condition of the 11 worst case relief valves that did not fully open when pressured to 750 psi. Of the six that did not discharge at all, 4 were standard and 2 were compact. Of the remaining 5 that discharged (bubbled), but did not fully open, all were compact. Again, more compact relieve valves were tested than standard, so this does not necessarily imply a difference in performance. A comprehensive analysis of each of these relief valves is needed before any difinitive conclusions can be made for these valves.
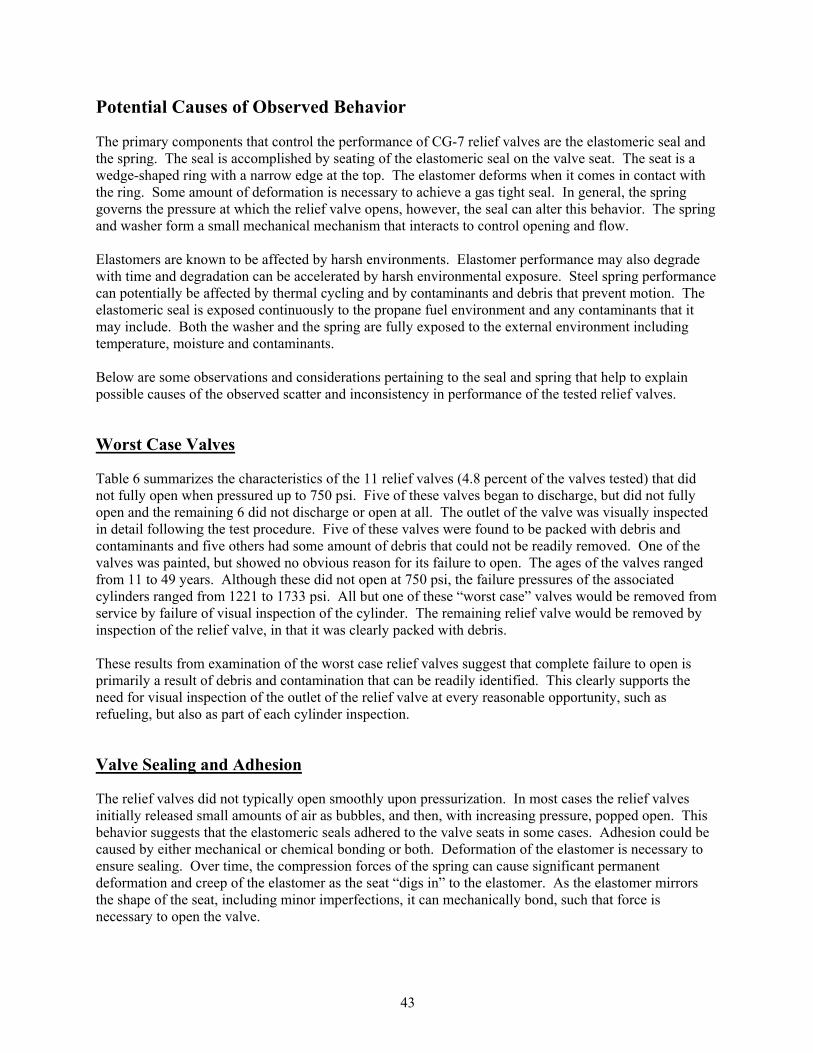
43
Potential Causes of Observed Behavior
The primary components that control the performance of CG-7 relief valves are the elastomeric seal and the spring. The seal is accomplished by seating of the elastomeric seal on the valve seat. The seat is a wedge-shaped ring with a narrow edge at the top. The elastomer deforms when it comes in contact with the ring. Some amount of deformation is necessary to achieve a gas tight seal. In general, the spring governs the pressure at which the relief valve opens, however, the seal can alter this behavior. The spring and washer form a small mechanical mechanism that interacts to control opening and flow. Elastomers are known to be affected by harsh environments. Elastomer performance may also degrade with time and degradation can be accelerated by harsh environmental exposure. Steel spring performance can potentially be affected by thermal cycling and by contaminants and debris that prevent motion. The elastomeric seal is exposed continuously to the propane fuel environment and any contaminants that it may include. Both the washer and the spring are fully exposed to the external environment including temperature, moisture and contaminants. Below are some observations and considerations pertaining to the seal and spring that help to explain possible causes of the observed scatter and inconsistency in performance of the tested relief valves.
Worst Case Valves
Table 6 summarizes the characteristics of the 11 relief valves (4.8 percent of the valves tested) that did not fully open when pressured up to 750 psi. Five of these valves began to discharge, but did not fully open and the remaining 6 did not discharge or open at all. The outlet of the valve was visually inspected in detail following the test procedure. Five of these valves were found to be packed with debris and contaminants and five others had some amount of debris that could not be readily removed. One of the valves was painted, but showed no obvious reason for its failure to open. The ages of the valves ranged from 11 to 49 years. Although these did not open at 750 psi, the failure pressures of the associated cylinders ranged from 1221 to 1733 psi. All but one of these “worst case” valves would be removed from service by failure of visual inspection of the cylinder. The remaining relief valve would be removed by inspection of the relief valve, in that it was clearly packed with debris. These results from examination of the worst case relief valves suggest that complete failure to open is primarily a result of debris and contamination that can be readily identified. This clearly supports the need for visual inspection of the outlet of the relief valve at every reasonable opportunity, such as refueling, but also as part of each cylinder inspection.
Valve Sealing and Adhesion
The relief valves did not typically open smoothly upon pressurization. In most cases the relief valves initially released small amounts of air as bubbles, and then, with increasing pressure, popped open. This behavior suggests that the elastomeric seals adhered to the valve seats in some cases. Adhesion could be caused by either mechanical or chemical bonding or both. Deformation of the elastomer is necessary to ensure sealing. Over time, the compression forces of the spring can cause significant permanent deformation and creep of the elastomer as the seat “digs in” to the elastomer. As the elastomer mirrors the shape of the seat, including minor imperfections, it can mechanically bond, such that force is necessary to open the valve.
44
There is also potential for chemical reactions to take place at the seal interface. Aging of the elastomer over time may release curing agents that could react at the surfaces or react with the fuel or contaminants to form products that chemically bond the surfaces. Like glue, these would require force to break any bonds that may be formed. It is possible that hydrocarbons or contaminants in the fuel could interact chemically with the elastomer, influencing its performance or degradation. Overall inconsistency of relief valve sealing and adhesion could also be influenced by the spring. It is not known how consistent the springs are in terms of their spring constant, repeatability and influence by temperature, compressive forces and time. The compressive force on the spring will vary daily as the pressure in the cylinder varies with ambient temperature. Depending upon the material specifications and consistency, such changes could possibly alter spring performance.
Reseating Performance
Reseating performance was consistent between the two test sequences. For the entire set of valves tested, 36 percent met the reseating criterion during the first sequence and 35 percent met the reseating criterion during the second sequence. However, reseating performance appeared to be significantly affected by age. Each of the reseating figures shows increased scatter with valve age. The values in Table 5 show that the percentage of unused relief valves and relief valves less than 10 years old that met the reseat criterion was nearly double the percentage of valves from the entire dataset meeting the criterion. Seating and reseating is primarily controlled by deformation of the elastomeric seal. These observations suggest that valves of a similar age have a like ability to deform and seal. It further suggests that older elastomers are less able to deform and seal than newer elastomers. Loss of the ability to deform could be caused by aging affects or by environmental exposure or both. Detailed testing of the elastomers used in these tests would be needed to better determine their performance and cause of any unexpected behaviors.
Full-Open Pressure
The full open pressure behavior appears to be consistent with a “sticky” valve rationale. Although 55 percent of the specimens fully opened within the test criteria during the first sequence, 92 percent opened during the second. Practically 100 percent of the 10-year and inspected valves fully opened during the second sequence. Once any stuck relief valves were opened by the first round, the behavior was relatively consistent in full opening the second sequence.
Start-to-Discharge Repeatability and Dwell Time
Of all of the test elements, the relief valves performed least well on the Sequence B start-to-discharge test. Whereas at least 35 percent of the relief valves met the other criteria, only 8 percent of those tested met the criteria for the second start-to-discharge test. This test followed after the full flow rate measurement and the first reseating. The second start-to-discharge pressure was typically 50 to 200 psi lower than the first start-to-discharge pressure for used valves. Although each of the valves was reseated, it began to discharge bubbles at much lower pressures during the second sequence. This could be related to both the ability of the spring to maintain an even force on the seal and the ability of the elastomeric seal to deform and maintain a gas tight seal. One major difference between the Battelle test protocol and the S-1.1 and UL 132 test protocols was the dwell time between A and B sequence. S-1.1 and UL 132 have a one hour dwell (wait) between the two
45
sequences. When contacted by Battelle, UL indicated that there was an expectation that this one hour wait would be reduced or deleted in the future. Battelle performed some dwell time tests on a valve which suggested that there was no effect of wait time on results. It is possible that the one hour dwell allows the elastomeric washer time to deform and effect a better seal, potentially resulting in a higher start-to-discharge pressure in Sequence B and improving its performance. It was also suggested that the flow portion of the test cooled the elastomer significantly, preventing it from resealing fully. Hence, it is possible that the valves could have performed better in this portion of the test if the protocol were modified. Row 10 in Table 5 compares the performance of different subsets of the valves, excluding the start-to-discharge results from sequence B. Significantly more valves meet the other five criteria, however, the trends remain the same. The dwell time does not appear likely to influence other portions of the test, nor does it alter the primary conclusions of this investigation. In any further work, the issue of dwell time and cooling should be considered, particularly as it related to safety in an overfill situation. In an overfill or other similar condition, a valve could be called upon to repeatedly open and close to release pressure as a cylinder is heated over time. The influence of dwell time could affect the effectiveness of the pressure release.
Discussion of Age Effects
CG-7 relief valves for 20-pound propane cylinders are not intended to be requalified. CGA S-1.1 has a requirement that these valves be replaced after ten years, however, DOT does not require their replacement. This issue my be explored by examining Figures 23 through 28 which compare the start-to-discharge, full-open and reseat performance test results for both the A and B test sequence as well as Table 5 and Figures 30 through 35, which compare the results for valves under 10 years old to all valves and performance of inspected valve subsets. In all cases the results suggest that the scatter for valves older than 10 years is greater than the scatter for valves less than 10 years old. The age affect is most apparent in the reseat results and figures. As discussed earlier, reseating is directly related to the ability of the elastomer to deform. It is possible that this deformation ability diminishes over time due to aging or environmental exposure or both. Further examination to evaluate this behaviour would be beneficial to help guide design and material selection in the future. Elastomeric materials have improved over time and products purchased today are often more reliable and durable than the same product purchased 10 and 20 years ago. CGA S-1.1 does not give the rationale for 10-year replacement of relief valves. It is possible that the newer valves have more durable and reliable materials and that only valves older than a specific date need to be replaced, rather than a 10-year “moving window”. Furthermore, the need for replacement could be avoided in the future by selection of different materials. Performance based test criteria for durability and reliability in the S-1.1 standard valve could provide a sound basis for enhancement of the product to prevent the need for age based replacement requirements.
Unused Valves
One unexpected result obtained in this testing was that only 40 percent of the unused valves met all of the test criteria. Understandably, these valves had been unpressured during their life and so were subject to spring force, with no counteracting pressure. It would be expected that this might cause the valves to stick upon first pressurization. However, the test results indicated that all of the unused valves began to discharge within the appropriate range, although 10 percent (2 specimens) did not fully open within the test criterion of 480 psi. The poorest performance of the new valves was in the second sequence start-to-

46
discharge measurement where 50 percent of the valves began to discharge at pressures between 240 and 360. As discussed earlier, the second start-to-discharge could be sensitive to the test conditions. These results suggests two issues that may be considered in any future work. The lack of pressure balance for long periods of time could potentially have an influence on subsequent performance. The second issue is the repeatability of start-to-discharge performance and the influence of dwell time before reopening.
Benefits and Value of Visual Inspection
While visual inspection does not address all performance issues, it can be applied to enhance relief valve reliability as discussed below.
Cylinder Visual Inspection
For the database of cylinders tested, a major percentage of valves would be removed from service because of the condition of the cylinder, regardless of the condition of the valve. Although the valves were not inspected as part of the procedure for the base of cylinders tested, cylinder visual inspection would have removed 10 of the 11 worst case valves (those which did not fully open) from service. It can be said that although the current cylinder visual inspection process does not include specific inspection of the valves, bothe the cylinder and valve are subjected to the same environmental conditions and an indirect benefit is realized by the removal of those valves which may have been in the most damaging and most corrosive environments, as evidenced by cylinder condition. For the set of cylinders and valves tested here, visual inspection of the valves removed three that were not already removed by visual inspection of the cylinder.
Valve Visual Inspection
The test program conducted here showed that internal as well as external issues significantly affect the reliability and performance of the relief valves tested. External issues such as debris and contaminants and external mechanical damage can be readily addressed through visual inspection. However, the majority of performance concerns with the tested valves depend upon the behavior of the elastomer washer and the spring, which cannot be verified with visual inspection. Visual inspection of relief valves is helpful necessary to ensure reliable performance, but it is not sufficient to detect all flaws, based on the design and materials used in current relief valve technology.
Need for Performance-Based Design and Testing Methodology
The results of this test program indicate that only a portion of the relief valves tested would meet the criteria for requalification in CGA S-1.1 and UL 132. Unused valves two years old or less did not all meet the criteria to be requalified for service. Sixty percent of the valves less than 10 years old did not meet the test criteria. While no evidence was found in this program that an immediate safety issue exists, these test results suggest that the valve performance is not as robust as that assumed by the industry. While the test results suggest that replacement of the relief valves after 10 years could improve reliability of the relief valves in service, the results do not suggest that 10-year replacement is the best solution to improving reliability. The test results show that the cylinders themselves are very robust and may perform reliably for 50 years. The cylinders are also relatively inexpensive, such that the cost of relief valve replacement, including
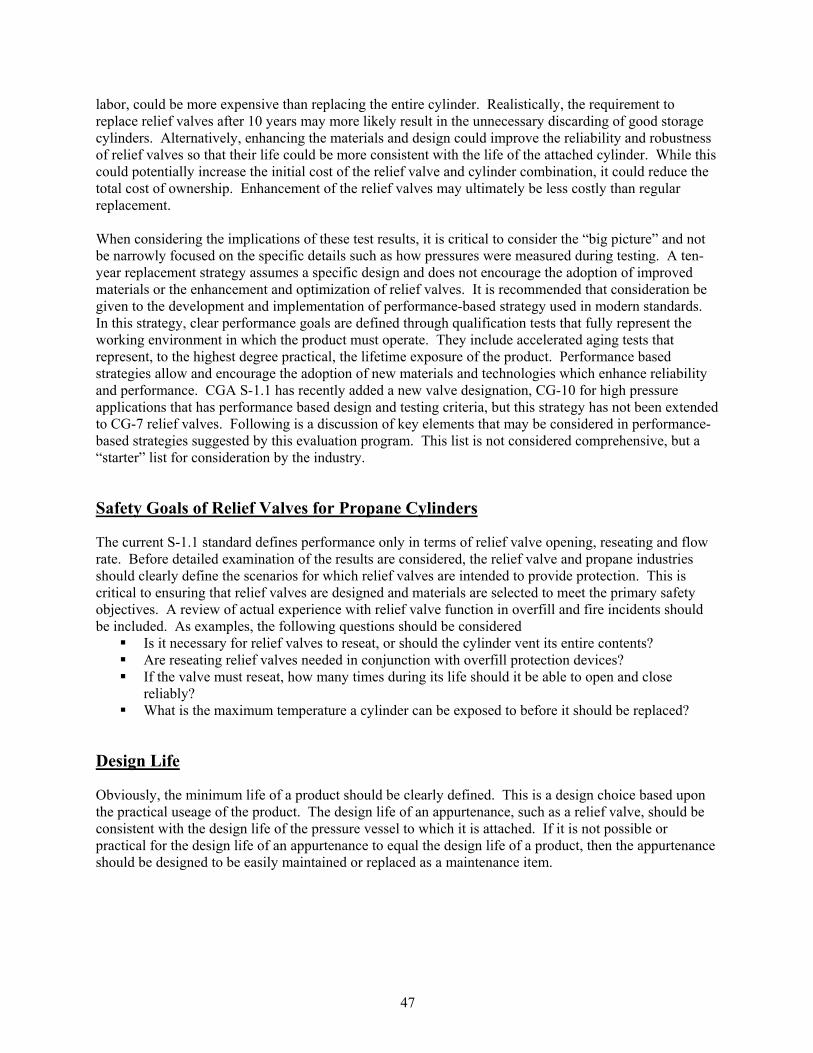
47
labor, could be more expensive than replacing the entire cylinder. Realistically, the requirement to replace relief valves after 10 years may more likely result in the unnecessary discarding of good storage cylinders. Alternatively, enhancing the materials and design could improve the reliability and robustness of relief valves so that their life could be more consistent with the life of the attached cylinder. While this could potentially increase the initial cost of the relief valve and cylinder combination, it could reduce the total cost of ownership. Enhancement of the relief valves may ultimately be less costly than regular replacement. When considering the implications of these test results, it is critical to consider the “big picture” and not be narrowly focused on the specific details such as how pressures were measured during testing. A ten-year replacement strategy assumes a specific design and does not encourage the adoption of improved materials or the enhancement and optimization of relief valves. It is recommended that consideration be given to the development and implementation of performance-based strategy used in modern standards. In this strategy, clear performance goals are defined through qualification tests that fully represent the working environment in which the product must operate. They include accelerated aging tests that represent, to the highest degree practical, the lifetime exposure of the product. Performance based strategies allow and encourage the adoption of new materials and technologies which enhance reliability and performance. CGA S-1.1 has recently added a new valve designation, CG-10 for high pressure applications that has performance based design and testing criteria, but this strategy has not been extended to CG-7 relief valves. Following is a discussion of key elements that may be considered in performance-based strategies suggested by this evaluation program. This list is not considered comprehensive, but a “starter” list for consideration by the industry.
Safety Goals of Relief Valves for Propane Cylinders
The current S-1.1 standard defines performance only in terms of relief valve opening, reseating and flow rate. Before detailed examination of the results are considered, the relief valve and propane industries should clearly define the scenarios for which relief valves are intended to provide protection. This is critical to ensuring that relief valves are designed and materials are selected to meet the primary safety objectives. A review of actual experience with relief valve function in overfill and fire incidents should be included. As examples, the following questions should be considered
Is it necessary for relief valves to reseat, or should the cylinder vent its entire contents? Are reseating relief valves needed in conjunction with overfill protection devices? If the valve must reseat, how many times during its life should it be able to open and close
reliably? What is the maximum temperature a cylinder can be exposed to before it should be replaced?
Design Life
Obviously, the minimum life of a product should be clearly defined. This is a design choice based upon the practical useage of the product. The design life of an appurtenance, such as a relief valve, should be consistent with the design life of the pressure vessel to which it is attached. If it is not possible or practical for the design life of an appurtenance to equal the design life of a product, then the appurtenance should be designed to be easily maintained or replaced as a maintenance item.
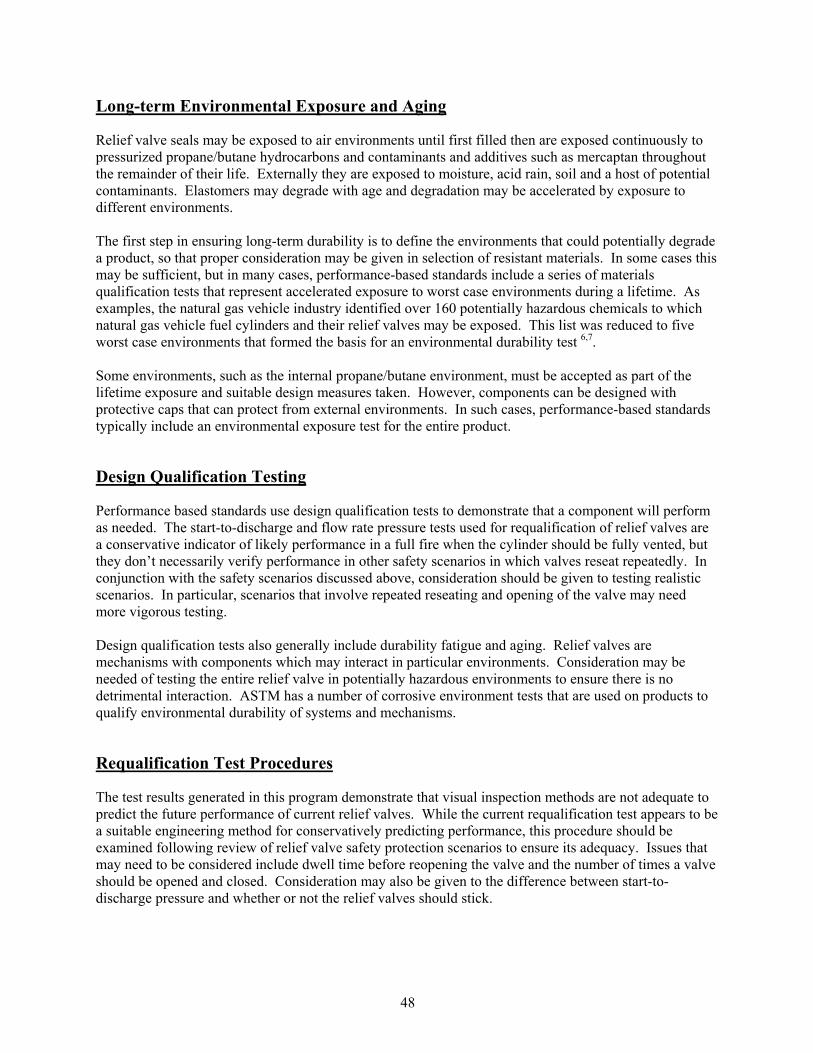
48
Long-term Environmental Exposure and Aging
Relief valve seals may be exposed to air environments until first filled then are exposed continuously to pressurized propane/butane hydrocarbons and contaminants and additives such as mercaptan throughout the remainder of their life. Externally they are exposed to moisture, acid rain, soil and a host of potential contaminants. Elastomers may degrade with age and degradation may be accelerated by exposure to different environments. The first step in ensuring long-term durability is to define the environments that could potentially degrade a product, so that proper consideration may be given in selection of resistant materials. In some cases this may be sufficient, but in many cases, performance-based standards include a series of materials qualification tests that represent accelerated exposure to worst case environments during a lifetime. As examples, the natural gas vehicle industry identified over 160 potentially hazardous chemicals to which natural gas vehicle fuel cylinders and their relief valves may be exposed. This list was reduced to five worst case environments that formed the basis for an environmental durability test 6,7. Some environments, such as the internal propane/butane environment, must be accepted as part of the lifetime exposure and suitable design measures taken. However, components can be designed with protective caps that can protect from external environments. In such cases, performance-based standards typically include an environmental exposure test for the entire product.
Design Qualification Testing
Performance based standards use design qualification tests to demonstrate that a component will perform as needed. The start-to-discharge and flow rate pressure tests used for requalification of relief valves are a conservative indicator of likely performance in a full fire when the cylinder should be fully vented, but they don’t necessarily verify performance in other safety scenarios in which valves reseat repeatedly. In conjunction with the safety scenarios discussed above, consideration should be given to testing realistic scenarios. In particular, scenarios that involve repeated reseating and opening of the valve may need more vigorous testing. Design qualification tests also generally include durability fatigue and aging. Relief valves are mechanisms with components which may interact in particular environments. Consideration may be needed of testing the entire relief valve in potentially hazardous environments to ensure there is no detrimental interaction. ASTM has a number of corrosive environment tests that are used on products to qualify environmental durability of systems and mechanisms.
Requalification Test Procedures
The test results generated in this program demonstrate that visual inspection methods are not adequate to predict the future performance of current relief valves. While the current requalification test appears to be a suitable engineering method for conservatively predicting performance, this procedure should be examined following review of relief valve safety protection scenarios to ensure its adequacy. Issues that may need to be considered include dwell time before reopening the valve and the number of times a valve should be opened and closed. Consideration may also be given to the difference between start-to-discharge pressure and whether or not the relief valves should stick.
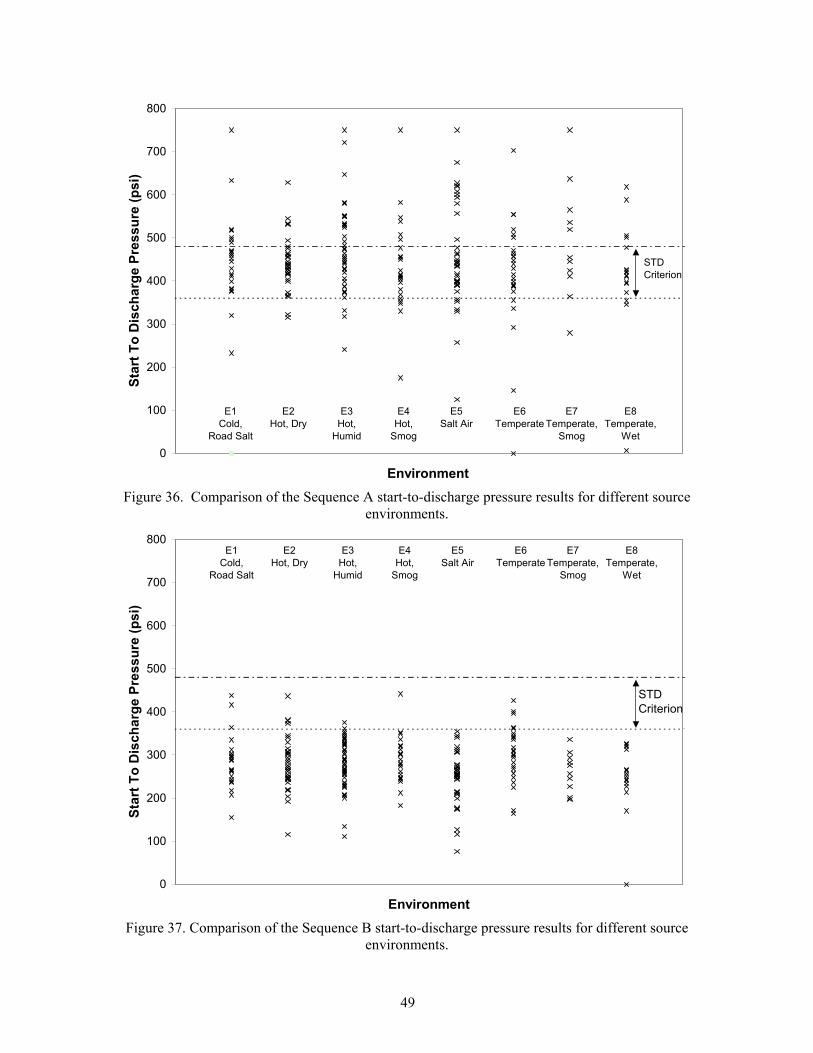
49
Figure 36. Comparison of the Sequence A start-to-discharge pressure results for different source environments.
Figure 37. Comparison of the Sequence B start-to-discharge pressure results for different source environments.
0
100
200
300
400
500
600
700
800
Environment
Star
t To
Dis
char
ge P
ress
ure
(psi
)
STD Criterion
E1 Cold,
Road Salt
E2 Hot, Dry
E3 Hot,
Humid
E4 Hot,
Smog
E5 Salt Air
E6 Temperate
E7 Temperate,
Smog
E8Temperate,
Wet
0
100
200
300
400
500
600
700
800
Environment
Star
t To
Dis
char
ge P
ress
ure
(psi
)
STD Criterion
E1 Cold,
Road Salt
E2 Hot, Dry
E3 Hot,
Humid
E4 Hot,
Smog
E5 Salt Air
E6 Temperate
E7 Temperate,
Smog
E8Temperate,
Wet
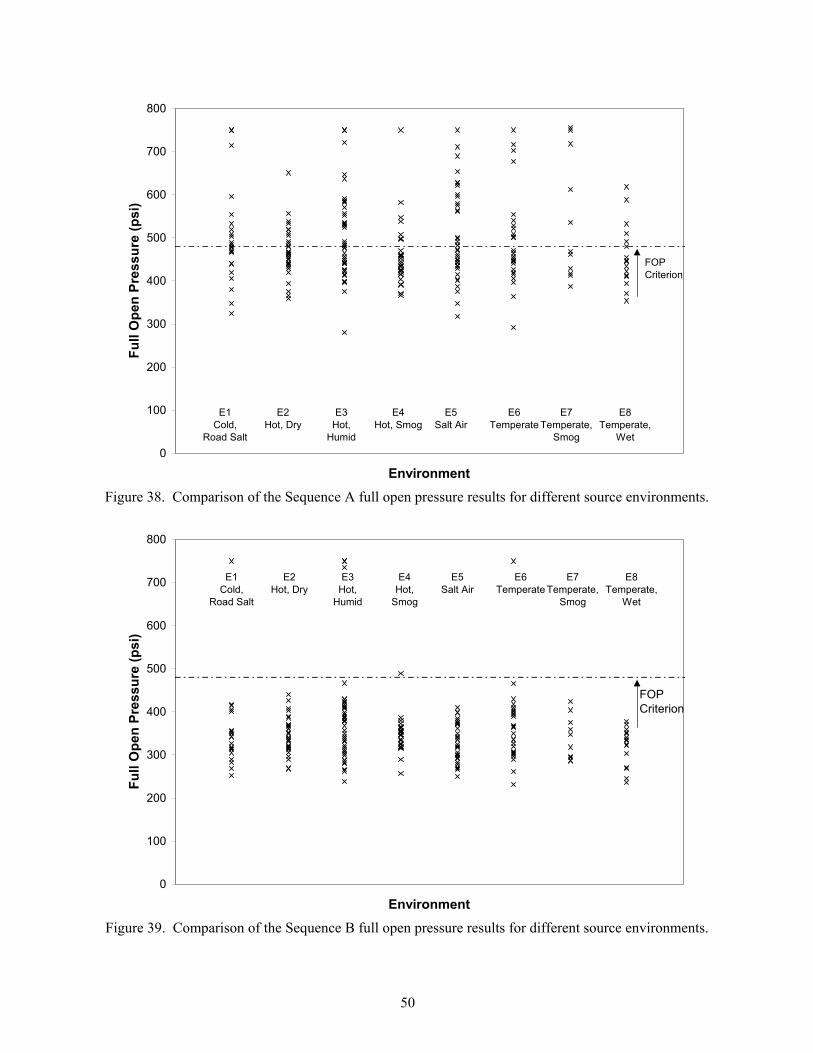
50
Figure 38. Comparison of the Sequence A full open pressure results for different source environments.
Figure 39. Comparison of the Sequence B full open pressure results for different source environments.
0
100
200
300
400
500
600
700
800
Environment
Full
Ope
n Pr
essu
re (p
si)
FOP Criterion
E1 Cold,
Road Salt
E2 Hot, Dry
E3 Hot,
Humid
E4 Hot, Smog
E5 Salt Air
E6 Temperate
E7 Temperate,
Smog
E8Temperate,
Wet
0
100
200
300
400
500
600
700
800
Environment
Full
Ope
n Pr
essu
re (p
si)
FOP Criterion
E1 Cold,
Road Salt
E2 Hot, Dry
E3 Hot,
Humid
E4 Hot,
Smog
E5 Salt Air
E6 Temperate
E7 Temperate,
Smog
E8Temperate,
Wet
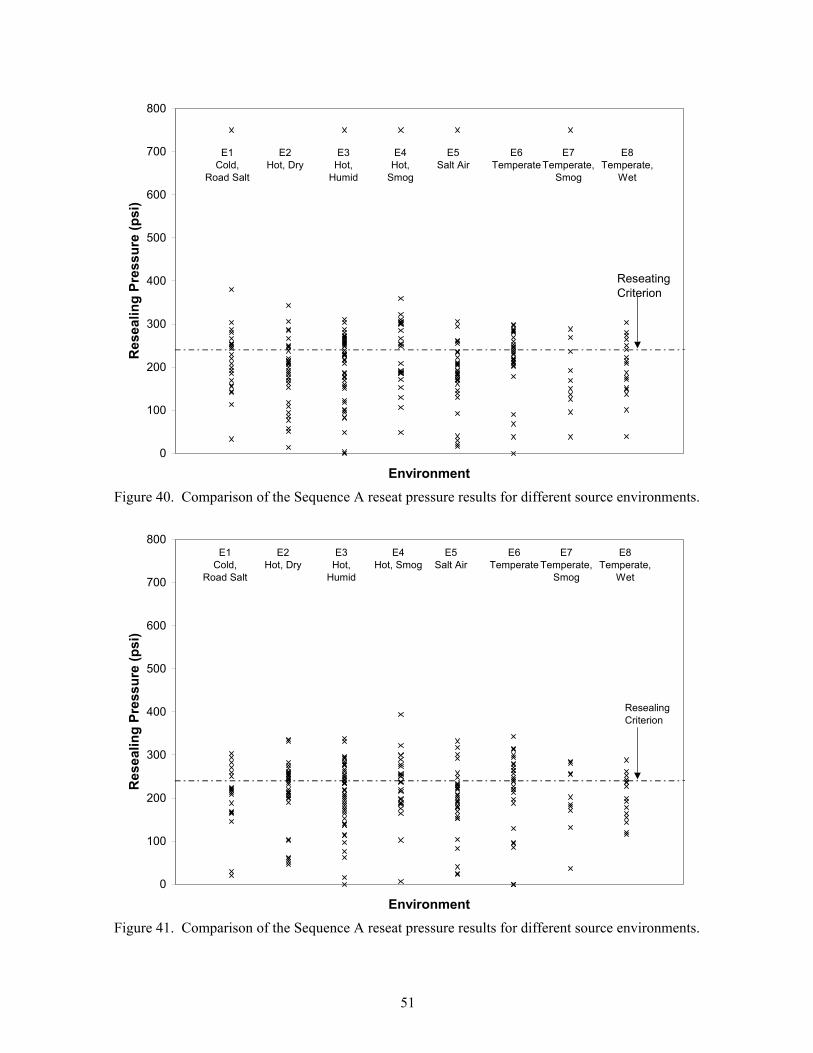
51
Figure 40. Comparison of the Sequence A reseat pressure results for different source environments.
Figure 41. Comparison of the Sequence A reseat pressure results for different source environments.
0
100
200
300
400
500
600
700
800
Environment
Res
ealin
g Pr
essu
re (p
si)
Reseating Criterion
E1 Cold,
Road Salt
E2 Hot, Dry
E3 Hot,
Humid
E4 Hot,
Smog
E5 Salt Air
E6 Temperate
E7 Temperate,
Smog
E8Temperate,
Wet
0
100
200
300
400
500
600
700
800
Environment
Res
ealin
g Pr
essu
re (p
si)
Resealing Criterion
E1 Cold,
Road Salt
E2 Hot, Dry
E3 Hot,
Humid
E4 Hot, Smog
E5 Salt Air
E6 Temperate
E7 Temperate,
Smog
E8Temperate,
Wet
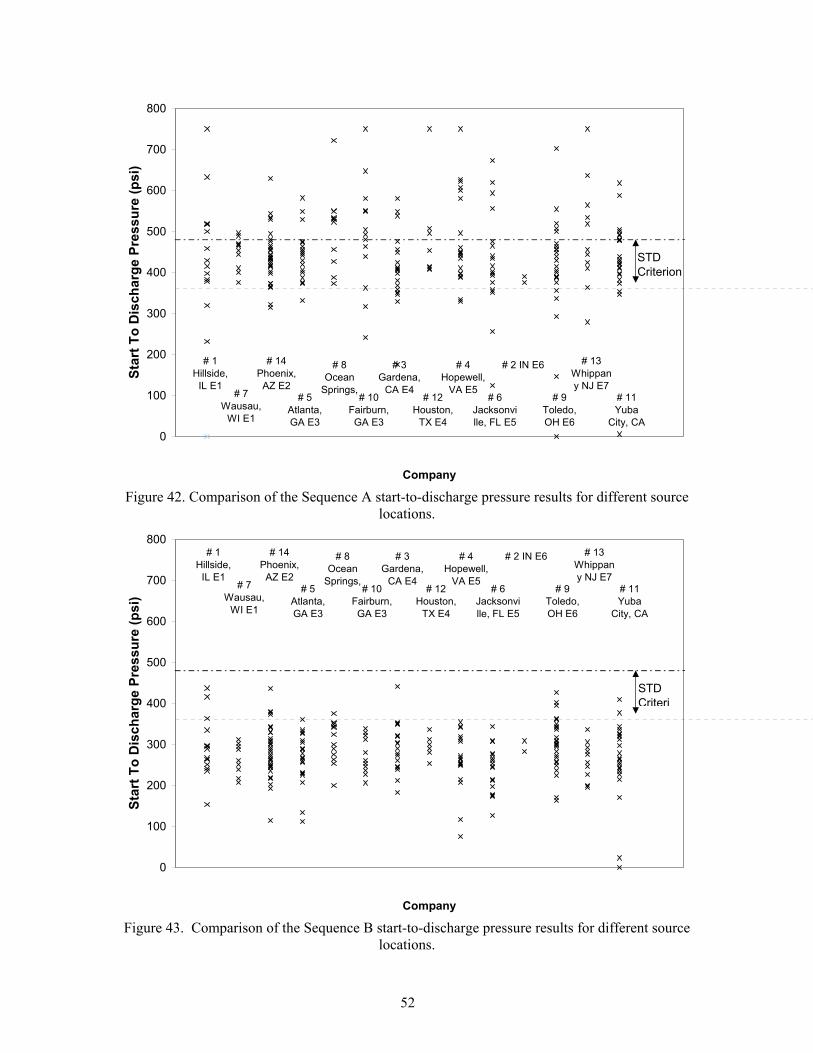
52
Figure 42. Comparison of the Sequence A start-to-discharge pressure results for different source locations.
Figure 43. Comparison of the Sequence B start-to-discharge pressure results for different source locations.
0
100
200
300
400
500
600
700
800
Company
Star
t To
Dis
char
ge P
ress
ure
(psi
)
STD Criterion
# 1 Hillside,
IL E1# 7
Wausau, WI E1
# 14 Phoenix, AZ E2
# 5 Atlanta, GA E3
# 8 Ocean
Springs, # 10
Fairburn, GA E3
# 3 Gardena,
CA E4# 12
Houston, TX E4
# 4 Hopewell,
VA E5# 6
Jacksonville, FL E5
# 2 IN E6
# 9 Toledo, OH E6
# 13 Whippany NJ E7
# 11 Yuba
City, CA
0
100
200
300
400
500
600
700
800
Company
Star
t To
Dis
char
ge P
ress
ure
(psi
)
STD Criteri
# 1 Hillside,
IL E1# 7
Wausau, WI E1
# 14 Phoenix, AZ E2
# 5 Atlanta, GA E3
# 8 Ocean
Springs, # 10
Fairburn, GA E3
# 3 Gardena,
CA E4# 12
Houston, TX E4
# 4 Hopewell,
VA E5# 6
Jacksonville, FL E5
# 2 IN E6
# 9 Toledo, OH E6
# 13 Whippany NJ E7
# 11 Yuba
City, CA
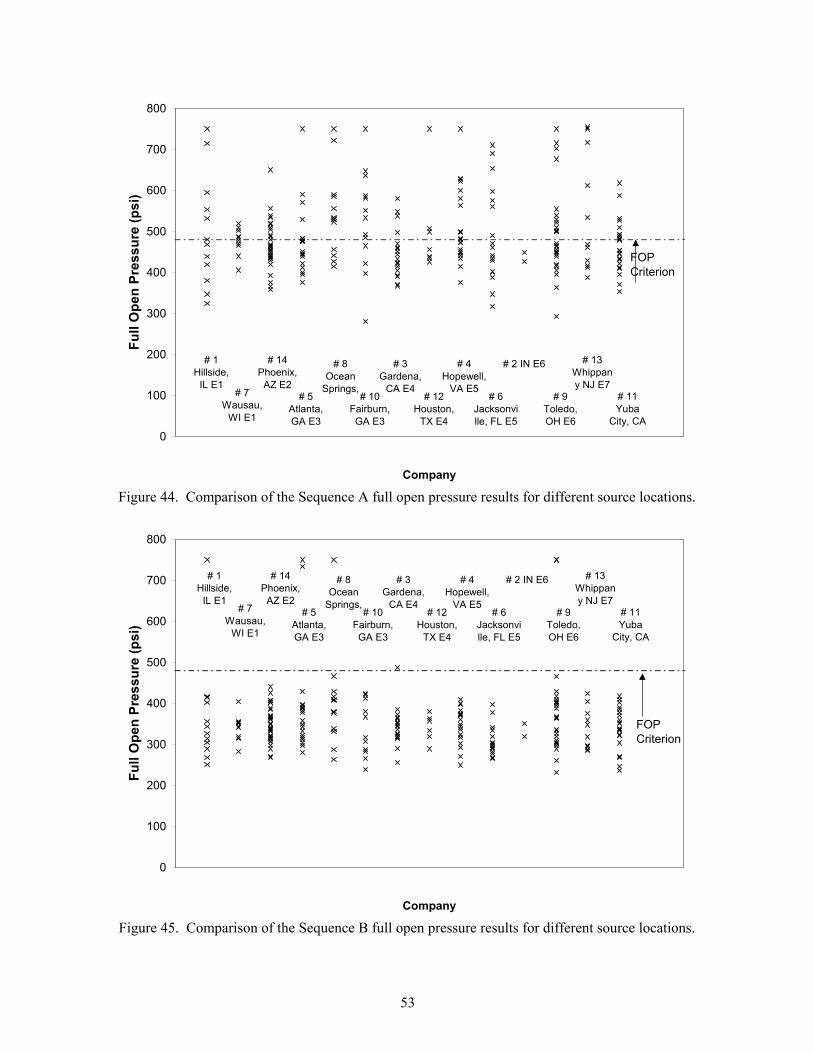
53
Figure 44. Comparison of the Sequence A full open pressure results for different source locations.
Figure 45. Comparison of the Sequence B full open pressure results for different source locations.
0
100
200
300
400
500
600
700
800
Company
Full
Ope
n Pr
essu
re (p
si)
FOP Criterion
# 1 Hillside,
IL E1# 7
Wausau, WI E1
# 14 Phoenix,
AZ E2# 5
Atlanta, GA E3
# 8 Ocean
Springs, # 10
Fairburn, GA E3
# 3 Gardena,
CA E4# 12
Houston, TX E4
# 4 Hopewell,
VA E5# 6
Jacksonville, FL E5
# 2 IN E6
# 9 Toledo, OH E6
# 13 Whippany NJ E7
# 11 Yuba
City, CA

54
Figure 46. Comparison of the Sequence A reseat pressure results for different source locations.
Figure 47. Comparison of the Sequence B reseat pressure results for different source locations.
0
100
200
300
400
500
600
700
800
Company
Res
ealin
g Pr
essu
re (p
si)
ReseatingCriterion
# 1 Hillside,
IL E1# 7
Wausau, WI E1
# 14 Phoenix,
AZ E2# 5
Atlanta, GA E3
# 8 Ocean
Springs, # 10
Fairburn, GA E3
# 3 Gardena,
CA E4# 12
Houston, TX E4
# 4 Hopewell,
VA E5# 6
Jacksonville, FL E5
# 2 IN E6
# 9 Toledo, OH E6
# 13 Whippany NJ E7
# 11 Yuba
City, CA
0
100
200
300
400
500
600
700
800
Company
Res
ealin
g Pr
essu
re (p
si)
Resealing Criterion
# 1 Hillside,
IL E1# 7
Wausau, WI E1
# 14 Phoenix,
AZ E2# 5
Atlanta, GA E3
# 8 Ocean
Springs, # 10
Fairburn, GA E3
# 3 Gardena,
CA E4# 12
Houston, TX E4
# 4 Hopewell,
VA E5# 6
Jacksonville, FL E5
# 2 IN E6
# 9 Toledo, OH E6
# 13 Whippany NJ E7
# 11 Yuba
City, CA
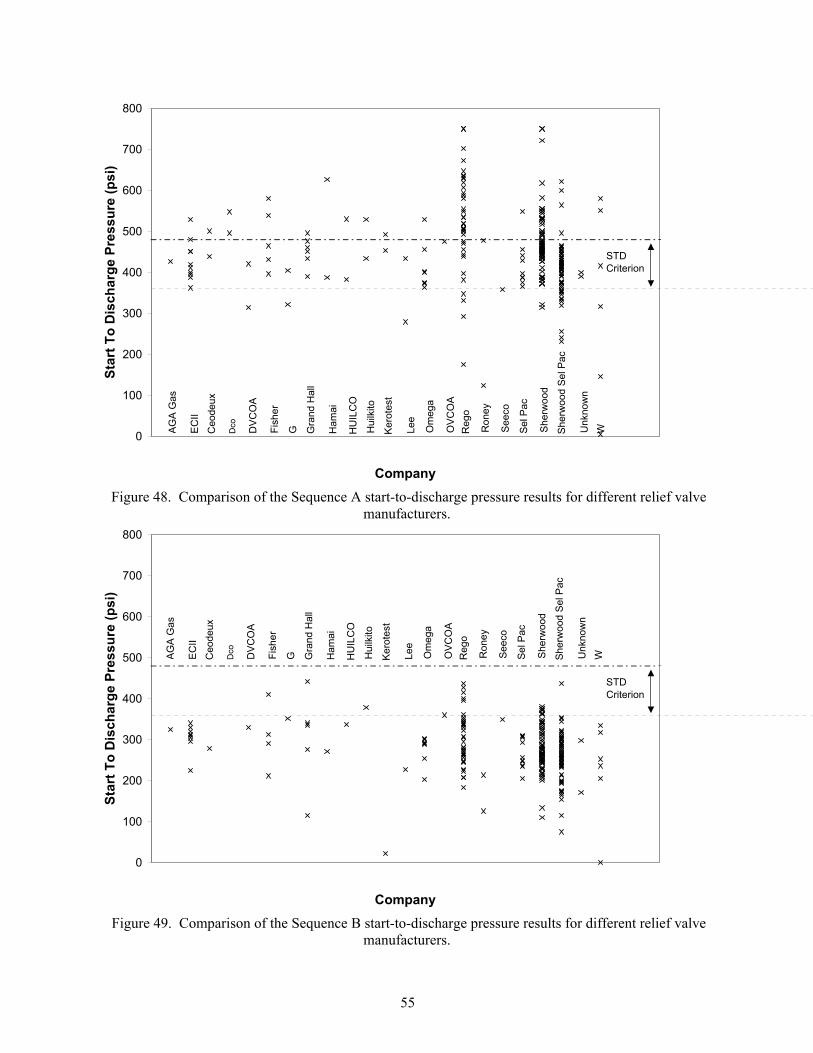
55
Figure 48. Comparison of the Sequence A start-to-discharge pressure results for different relief valve manufacturers.
Figure 49. Comparison of the Sequence B start-to-discharge pressure results for different relief valve manufacturers.
0
100
200
300
400
500
600
700
800
Company
Star
t To
Dis
char
ge P
ress
ure
(psi
)
STD Criterion
AGA
Gas
ECII
Ceo
deux
Dco DVC
OA
Fish
er
G Gra
nd H
all
Ham
ai
HU
ILC
O
Hui
lkito
Kero
test
Lee
Om
ega
OVC
OA
Reg
o
Ron
ey
Seec
o
Sel P
ac
Sher
woo
d
Sher
woo
d Se
l Pac
Unk
now
nW
0
100
200
300
400
500
600
700
800
Company
Star
t To
Dis
char
ge P
ress
ure
(psi
)
STD Criterion
AGA
Gas
ECII
Ceo
deux
Dco DVC
OA
Fish
er
G Gra
nd H
all
Ham
ai
HU
ILC
O
Hui
lkito
Kero
test
Lee
Om
ega
OVC
OA
Reg
o
Ron
ey
Seec
o
Sel P
ac
Sher
woo
d
Sher
woo
d Se
l Pac
Unk
now
nW

56
Figure 50. Comparison of the Sequence A full open pressure results for different relief valve manufacturers.
Figure 51. Comparison of the Sequence B full open pressure results for different relief valve manufacturers.
0
100
200
300
400
500
600
700
800
Company
Full
Ope
n Pr
essu
re (p
si)
FOP Criterion
AGA
Gas
ECII
Ceo
deux
Dco DVC
OA
Fish
er
G Gra
nd H
all
Ham
ai
HU
ILC
O
Hui
lkito
Kero
test
Lee
Om
ega
OVC
OA
Reg
o
Ron
ey
Seec
o
Sel P
ac
Sher
woo
d
Sher
woo
d Se
l Pac
Unk
now
nW
0
100
200
300
400
500
600
700
800
Company
Full
Ope
n Pr
essu
re (p
si)
FOP Criterion
AGA
Gas
ECII
Ceo
deux
Dco DVC
OA
Fish
er
G Gra
nd H
all
Ham
ai
HU
ILC
O
Hui
lkito
Kero
test
Lee
Om
ega
OVC
OA
Reg
o
Ron
ey
Seec
o
Sel P
ac
Sher
woo
d
Sher
woo
d Se
l Pac
Unk
now
nW
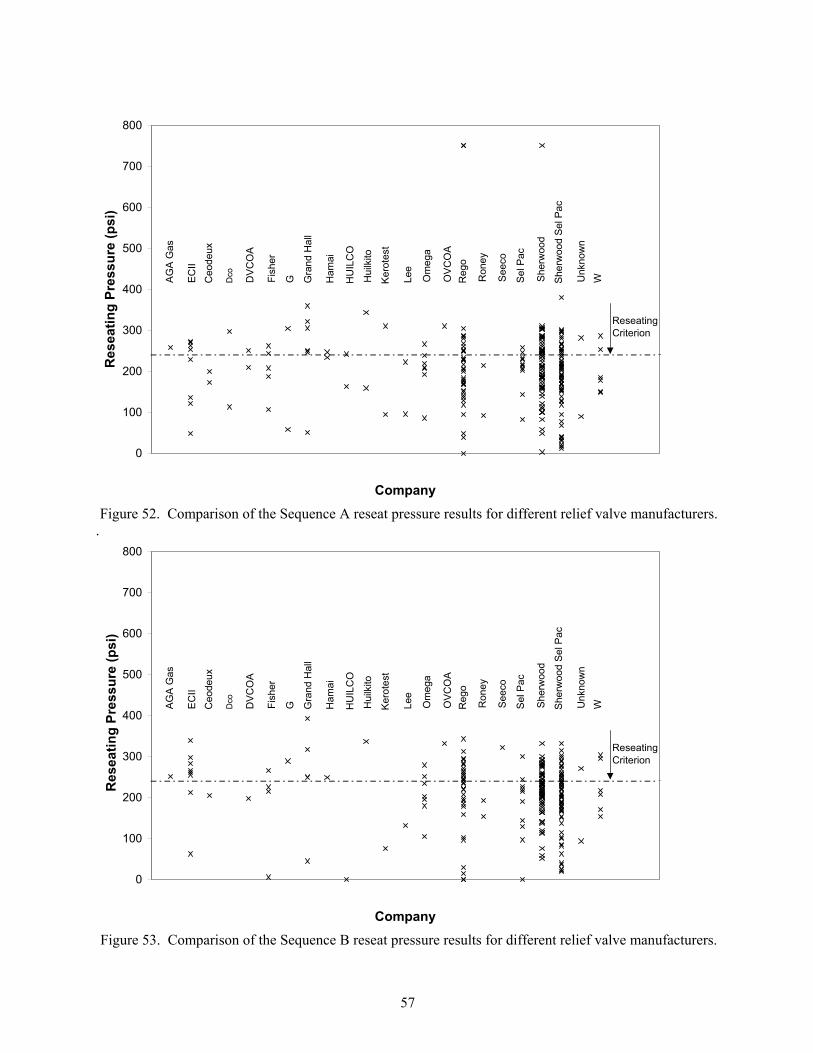
57
Figure 52. Comparison of the Sequence A reseat pressure results for different relief valve manufacturers. .
Figure 53. Comparison of the Sequence B reseat pressure results for different relief valve manufacturers.
0
100
200
300
400
500
600
700
800
Company
Res
eatin
g Pr
essu
re (p
si)
Reseating Criterion
AGA
Gas
ECII
Ceo
deux
Dco DVC
OA
Fish
er
G Gra
nd H
all
Ham
ai
HU
ILC
O
Hui
lkito
Kero
test
Lee
Om
ega
OVC
OA
Reg
o
Ron
ey
Seec
o
Sel P
ac
Sher
woo
d
Sher
woo
d Se
l Pac
Unk
now
nW
0
100
200
300
400
500
600
700
800
Company
Res
eatin
g Pr
essu
re (p
si)
Reseating Criterion
AGA
Gas
ECII
Ceo
deux
Dco DVC
OA
Fish
er
G Gra
nd H
all
Ham
ai
HU
ILC
O
Hui
lkito
Kero
test
Lee
Om
ega
OVC
OA
Reg
o
Ron
ey
Seec
o
Sel P
ac
Sher
woo
d
Sher
woo
d Se
l Pac
Unk
now
nW
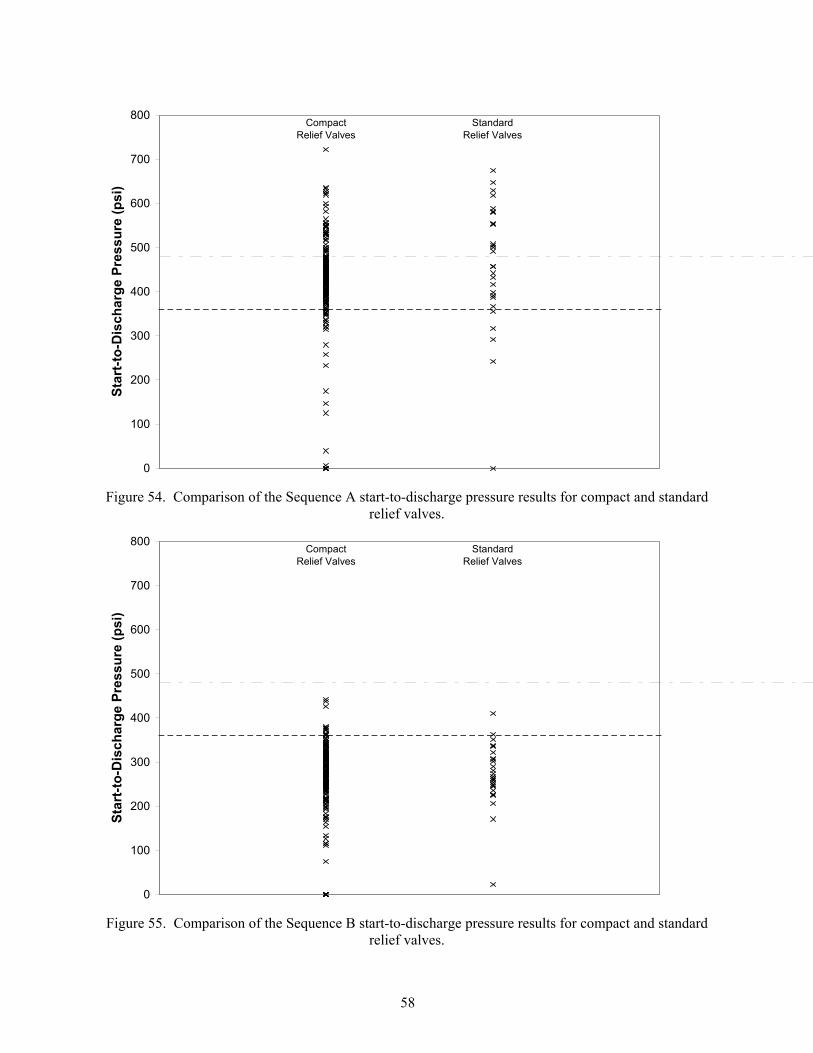
58
Figure 54. Comparison of the Sequence A start-to-discharge pressure results for compact and standard relief valves.
Figure 55. Comparison of the Sequence B start-to-discharge pressure results for compact and standard relief valves.
0
100
200
300
400
500
600
700
800St
art-t
o-D
isch
arge
Pre
ssur
e (p
si)
Compact Relief Valves
Standard Relief Valves
0
100
200
300
400
500
600
700
800
Star
t-to-
Dis
char
ge P
ress
ure
(psi
)
Compact Relief Valves
Standard Relief Valves
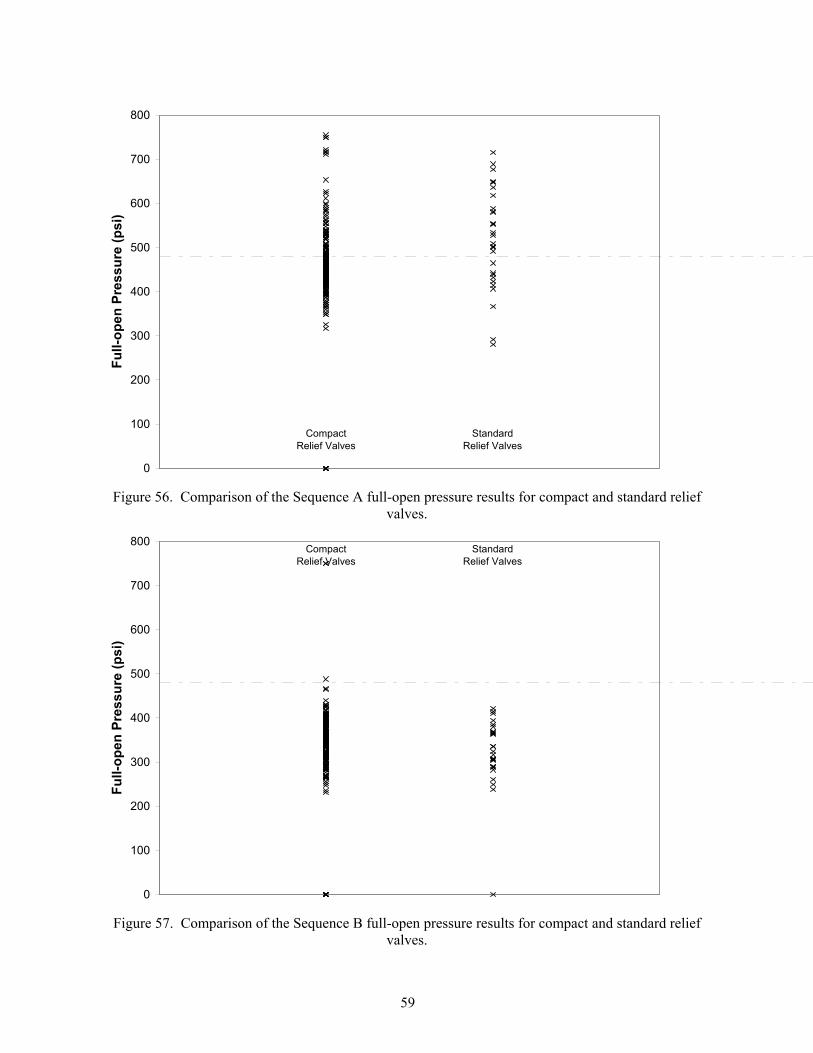
59
Figure 56. Comparison of the Sequence A full-open pressure results for compact and standard relief valves.
Figure 57. Comparison of the Sequence B full-open pressure results for compact and standard relief valves.
0
100
200
300
400
500
600
700
800Fu
ll-op
en P
ress
ure
(psi
)
Compact Relief Valves
Standard Relief Valves
0
100
200
300
400
500
600
700
800
Full-
open
Pre
ssur
e (p
si)
Compact Relief Valves
Standard Relief Valves
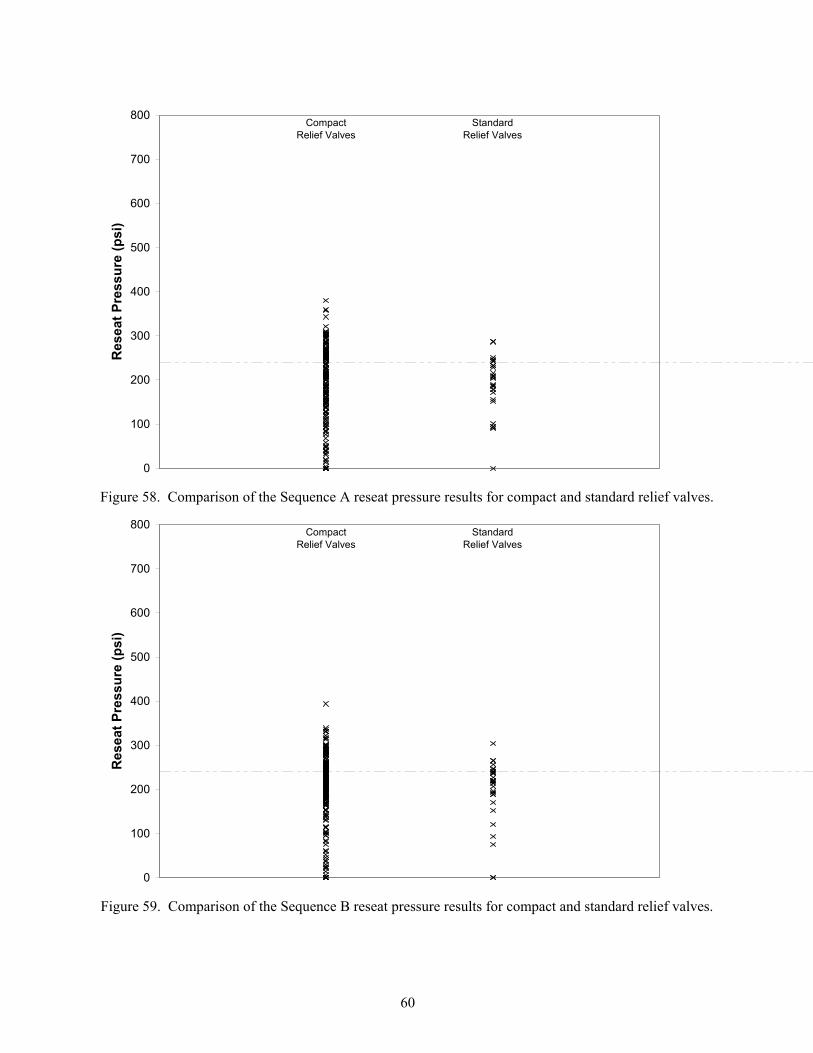
60
Figure 58. Comparison of the Sequence A reseat pressure results for compact and standard relief valves.
Figure 59. Comparison of the Sequence B reseat pressure results for compact and standard relief valves.
0
100
200
300
400
500
600
700
800R
esea
t Pre
ssur
e (p
si)
Compact Relief Valves
Standard Relief Valves
0
100
200
300
400
500
600
700
800
Res
eat P
ress
ure
(psi
)
Compact Relief Valves
Standard Relief Valves

61
Table 6. Summary of “worst case” relief valves that did not open when pressured to 750 psi.
DND – Did not discharge DNO – Did not open
Cylinder Number
Cylinder Date of
Manufacture
Age (years)
Valve Manufacturer
Compact or
Standard
Cylinder Visual
Inspection Result
Cylinder Failure
Pressure (psi)
Valve Visual
Inspection Result
Start-to-Discharge Pressure A
(psi)
Full Open Pressure A
(psi)
Reseat Pressure A
(psi)
Start-to-Discharge Pressure B
(psi)
Full Open Pressure B
(psi)
Reseat Pressure B
(psi)
1-8 12/1/1952 49 Rego Standard Fail 1221 Packed with Debris DND DNO DNO DNO DNO DNO
13-23 2/1/1983 19 Rego Compact Fail 1274 Packed with Debris DND DNO DNO DNO DNO DNO
1-2 10/1/1959 42 Sherwood Standard Fail 1572 Limited Debris DND DNO DNO DNO DNO DNO
10-12 3/1/1960 42 Sherwood Standard Fail 1631 Packed with Debris DND DNO DNO DNO DNO DNO
4-20 2/1/1964 38 Sherwood Standard Fail 1504 Limited Debris DND DNO DNO DNO DNO DNO
12-4 4/1/1988 14 Sherwood Compact Fail 1602 Paint DND DNO DNO DNO DNO DNO
9-29 7/1/1984 17 Rego Compact Fail 1538 Limited Debris 555 DNO 204 341 DNO 97
8-2 5/1/1990 11 Rego Compact Fail 1519 Limited Debris 549 DNO 118 354 DNO 15
9-41 4/1/1968 34 Rego Compact Fail 1636 Packed with Debris 520 DNO 38 396 DNO 0
1-6 4/1/1968 34 Rego Compact Fail 1343 Corrosion Products 519 DNO 304 438 DNO 295
5-6 1/1/1985 17 Rego Compact Pass 1733 Packed with Debris 332 DNO 0 208 DNO 0
62
CLOSURE This report summarizes the results of an experimental program in which cylinders and relief valves ranging in age from 2 to 60 years were collected from across the United States and subjected to a series of tests intended to characterize their performance and integrity. Nearly four hundred 20-pound propane cylinders were collected from 14 source locations and from 8 North American climates. The cylinders represented 19 different manufacturers or manufacturer codes and 23 different relief valve manufacturers or manufacturer codes. All cylinders were visually inspected according to the procedures of CGA Pamphlet C-6 Standards for Visual Inspection of Compressed Gas Cylinders. The data were reviewed and a representative subset of cylinders was selected for detailed testing. Nearly 250 cylinders were subjected to hydrostatic expansion and burst testing to generate a database comparing visual inspection to hydrostatic and burst test results. Over 230 relief valves were subjected to a test procedure developed by Battelle derived from CGA Pamphlet S-1.1 Pressure Relief Device Standards Part 1 – Cylinders for Compressed Gas Cylinders. This included measurement of the start-to-discharge, full-open and reseat pressures of the relief valves as well as flow rate. This project has resulted in a comprehensive database that allows for direct and detailed comparison of relief valve and cylinder performance. The details of each cylinder and relief valve test are summarized in the Volume 2, Data Report. The summary and conclusions of the investigation are given in the Executive Summary of the report.
REFERENCES
1. Code of Federal Regulations, Title 49, Volume 2, Part 173, Section 173.34, Qualification, Maintenance and Use of Cylinders, U.S. Government Printing Office, 2001.
2. CGA C-6- 2001, Standards for Visual Inspection of Steel Compressed Gas Cylinders, Eighth Edition, Compressed Gas Association, Inc., Chantilly, VA, 2001.
3. CGA C-1-1996, Methods for Hydrostatic Testing of Compressed Gas Cylinders, Compressed Gas Association, Inc., Washington D.C., 1996.
4. CGA S-1.1-2001, Pressure Relief Device Standards Part 1-Cylinder for Compressed Gasses, Ninth Edition, Compressed Gas Association, Inc., Chantilly, VA, 2001.
5. UL 132, Standard for Safety Relief Valves for Anhydrous Ammonia and LP-Gas, Underwriters Laboratories Inc. (UL), Northbrook, IL, 1997.
6. Herridge, J. T., and Stephens, D. R., Identification of Service Environment of NGV Fuel Cylinders, GRI 94/0203, Gas Research Institute, Chicago, Illinois, July 1994.
7. ANSI/IAS NGV2, Basic Requirements for Compressed Natural Gas Vehicle (NGV) Fuel Containers, American National Standards Institute/International Approval Services, Cleveland, OH, October 2000.
8. ANSI/IAS PRD1—1998, Basic Requirements for Pressure Relief Devices for Natural Gas Vehicle Fuel Containers, American National Standards Institute/International Approval Services, Cleveland, OH, June 1998.
A-1
APPENDIX A
DESCRIPTION OF TEST METHODS AND PROCEDURES
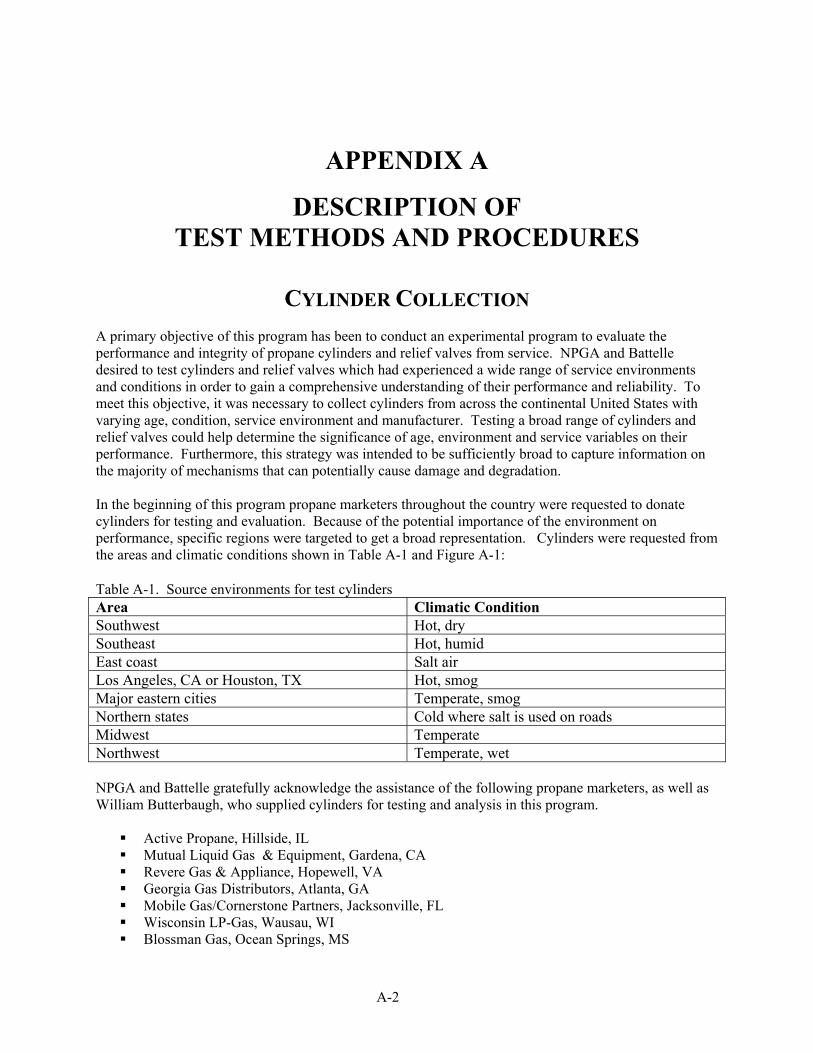
A-2
APPENDIX A
DESCRIPTION OF TEST METHODS AND PROCEDURES
CYLINDER COLLECTION A primary objective of this program has been to conduct an experimental program to evaluate the performance and integrity of propane cylinders and relief valves from service. NPGA and Battelle desired to test cylinders and relief valves which had experienced a wide range of service environments and conditions in order to gain a comprehensive understanding of their performance and reliability. To meet this objective, it was necessary to collect cylinders from across the continental United States with varying age, condition, service environment and manufacturer. Testing a broad range of cylinders and relief valves could help determine the significance of age, environment and service variables on their performance. Furthermore, this strategy was intended to be sufficiently broad to capture information on the majority of mechanisms that can potentially cause damage and degradation. In the beginning of this program propane marketers throughout the country were requested to donate cylinders for testing and evaluation. Because of the potential importance of the environment on performance, specific regions were targeted to get a broad representation. Cylinders were requested from the areas and climatic conditions shown in Table A-1 and Figure A-1: Table A-1. Source environments for test cylinders Area Climatic Condition Southwest Hot, dry Southeast Hot, humid East coast Salt air Los Angeles, CA or Houston, TX Hot, smog Major eastern cities Temperate, smog Northern states Cold where salt is used on roads Midwest Temperate Northwest Temperate, wet
NPGA and Battelle gratefully acknowledge the assistance of the following propane marketers, as well as William Butterbaugh, who supplied cylinders for testing and analysis in this program.
Active Propane, Hillside, IL Mutual Liquid Gas & Equipment, Gardena, CA Revere Gas & Appliance, Hopewell, VA Georgia Gas Distributors, Atlanta, GA Mobile Gas/Cornerstone Partners, Jacksonville, FL Wisconsin LP-Gas, Wausau, WI Blossman Gas, Ocean Springs, MS
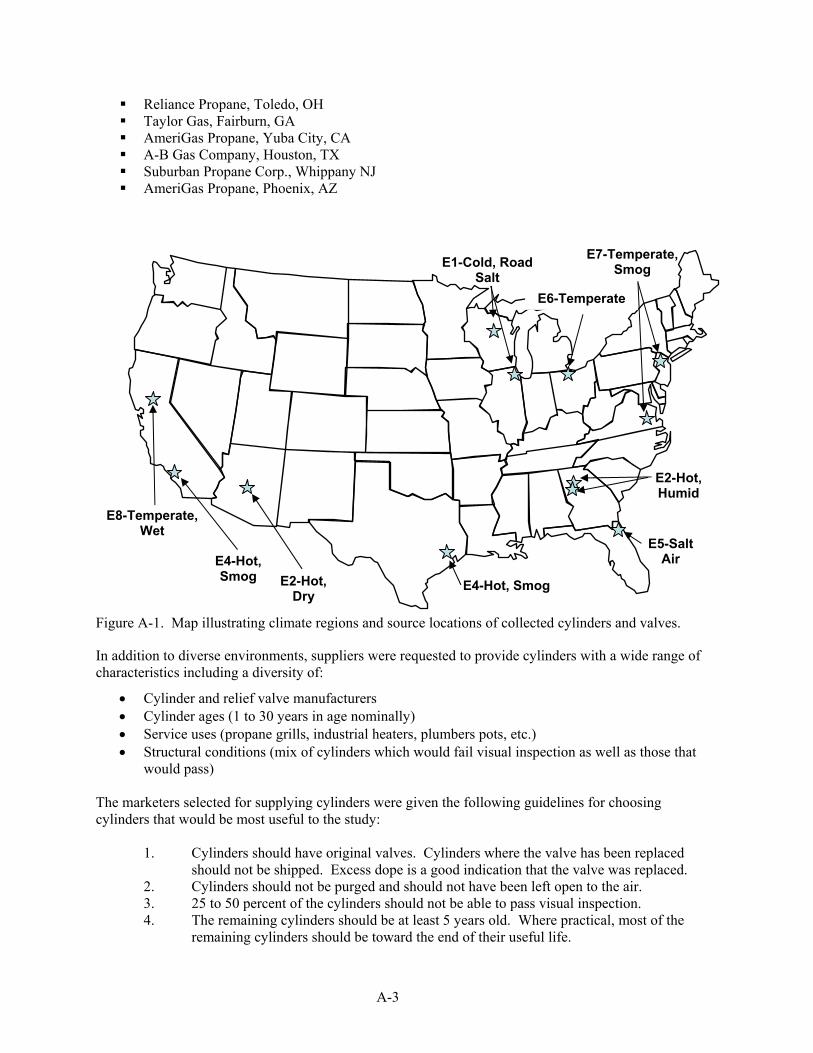
A-3
Reliance Propane, Toledo, OH Taylor Gas, Fairburn, GA AmeriGas Propane, Yuba City, CA A-B Gas Company, Houston, TX Suburban Propane Corp., Whippany NJ AmeriGas Propane, Phoenix, AZ
Figure A-1. Map illustrating climate regions and source locations of collected cylinders and valves.
In addition to diverse environments, suppliers were requested to provide cylinders with a wide range of characteristics including a diversity of:
• Cylinder and relief valve manufacturers • Cylinder ages (1 to 30 years in age nominally) • Service uses (propane grills, industrial heaters, plumbers pots, etc.) • Structural conditions (mix of cylinders which would fail visual inspection as well as those that
would pass) The marketers selected for supplying cylinders were given the following guidelines for choosing cylinders that would be most useful to the study:
1. Cylinders should have original valves. Cylinders where the valve has been replaced should not be shipped. Excess dope is a good indication that the valve was replaced.
2. Cylinders should not be purged and should not have been left open to the air. 3. 25 to 50 percent of the cylinders should not be able to pass visual inspection. 4. The remaining cylinders should be at least 5 years old. Where practical, most of the
remaining cylinders should be toward the end of their useful life.
E4-Hot, Smog E2-Hot,
Dry E4-Hot, Smog
E2-Hot, Humid
E5-Salt Air
E6-Temperate
E1-Cold, Road Salt
E8-Temperate, Wet
E7-Temperate, Smog

A-4
5. All cylinders should be tagged with the marketer’s name and location. 6. All cylinders should be labeled the same as would be done for local delivery to a cylinder
exchange outlet. 7. Cylinders should be palletized and shrink-wrapped prior to carrier pickup.
Cylinders needed to have original valves so that the age of the valve could be determined. While cylinders are stamped with a date of manufacture, valves are not. If a valve had been replaced it would be difficult to determine the age of the valve. It was important that the cylinder interiors had not been exposed to the open air. A goal of this study was to determine the behavior of cylinders if kept in service. A cylinder that had been left open could have been exposed to corrosion on the interior of the cylinder compromising the correlation between visual inspections of the exterior surfaces with the failure pressure of the cylinder. Having a significant population of cylinders that would fail visual inspection allowed the analysis to investigate the proportion of cylinders that failed visual inspection yet failed above the specified burst pressure of these cylinders. At the same time having a significant number of cylinders that would pass visual inspection was also important to ensure that cylinders that passed visual inspection were strong enough to hold up under elevated pressures. The collection process was designed to provide a varied sample of cylinders from across the country while minimizing the ability of outside factors to influence the test results. A varied sample population enhanced the statistical validity of the test analysis, and specific collection guidelines enhance the physical validity of the test analysis. These collection procedures provided a reasonable sample of cylinders for testing. A total of 394 cylinders were collected for evaluation in this program. The collection of cylinders encompassed the following conditions and environments
5 to 60 years in age 8 different service environments 14 different source locations 19 different cylinder manufacturers or codes 23 different valve manufacturers or codes
The collected cylinders were all shipped to McKnight Cylinder in Ruffs Dale, PA for inspection and cylinder testing. In addition to the cylinders from service, 20 new, unused cylinders were purchased for comparison evaluations. All of the new cylinders had manufacture dates within two years of the date of their purchase.
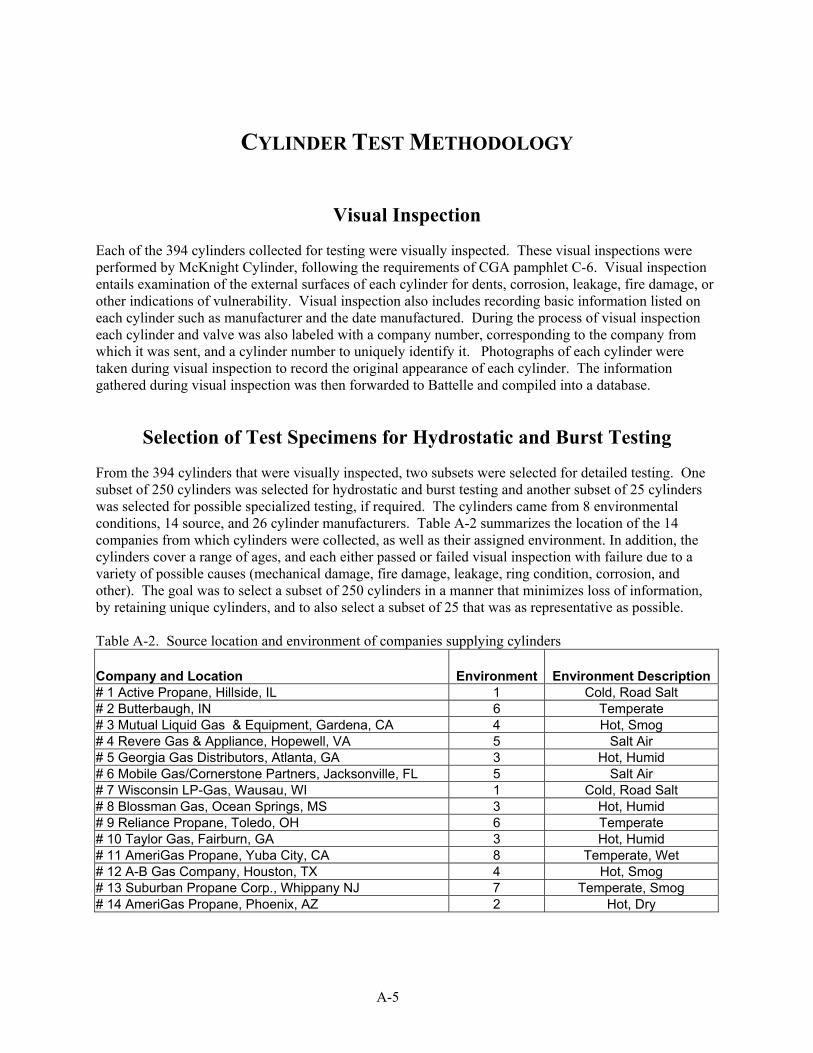
A-5
CYLINDER TEST METHODOLOGY
Visual Inspection
Each of the 394 cylinders collected for testing were visually inspected. These visual inspections were performed by McKnight Cylinder, following the requirements of CGA pamphlet C-6. Visual inspection entails examination of the external surfaces of each cylinder for dents, corrosion, leakage, fire damage, or other indications of vulnerability. Visual inspection also includes recording basic information listed on each cylinder such as manufacturer and the date manufactured. During the process of visual inspection each cylinder and valve was also labeled with a company number, corresponding to the company from which it was sent, and a cylinder number to uniquely identify it. Photographs of each cylinder were taken during visual inspection to record the original appearance of each cylinder. The information gathered during visual inspection was then forwarded to Battelle and compiled into a database.
Selection of Test Specimens for Hydrostatic and Burst Testing
From the 394 cylinders that were visually inspected, two subsets were selected for detailed testing. One subset of 250 cylinders was selected for hydrostatic and burst testing and another subset of 25 cylinders was selected for possible specialized testing, if required. The cylinders came from 8 environmental conditions, 14 source, and 26 cylinder manufacturers. Table A-2 summarizes the location of the 14 companies from which cylinders were collected, as well as their assigned environment. In addition, the cylinders cover a range of ages, and each either passed or failed visual inspection with failure due to a variety of possible causes (mechanical damage, fire damage, leakage, ring condition, corrosion, and other). The goal was to select a subset of 250 cylinders in a manner that minimizes loss of information, by retaining unique cylinders, and to also select a subset of 25 that was as representative as possible. Table A-2. Source location and environment of companies supplying cylinders
Company and Location Environment Environment Description# 1 Active Propane, Hillside, IL 1 Cold, Road Salt # 2 Butterbaugh, IN 6 Temperate # 3 Mutual Liquid Gas & Equipment, Gardena, CA 4 Hot, Smog # 4 Revere Gas & Appliance, Hopewell, VA 5 Salt Air # 5 Georgia Gas Distributors, Atlanta, GA 3 Hot, Humid # 6 Mobile Gas/Cornerstone Partners, Jacksonville, FL 5 Salt Air # 7 Wisconsin LP-Gas, Wausau, WI 1 Cold, Road Salt # 8 Blossman Gas, Ocean Springs, MS 3 Hot, Humid # 9 Reliance Propane, Toledo, OH 6 Temperate # 10 Taylor Gas, Fairburn, GA 3 Hot, Humid # 11 AmeriGas Propane, Yuba City, CA 8 Temperate, Wet # 12 A-B Gas Company, Houston, TX 4 Hot, Smog # 13 Suburban Propane Corp., Whippany NJ 7 Temperate, Smog # 14 AmeriGas Propane, Phoenix, AZ 2 Hot, Dry
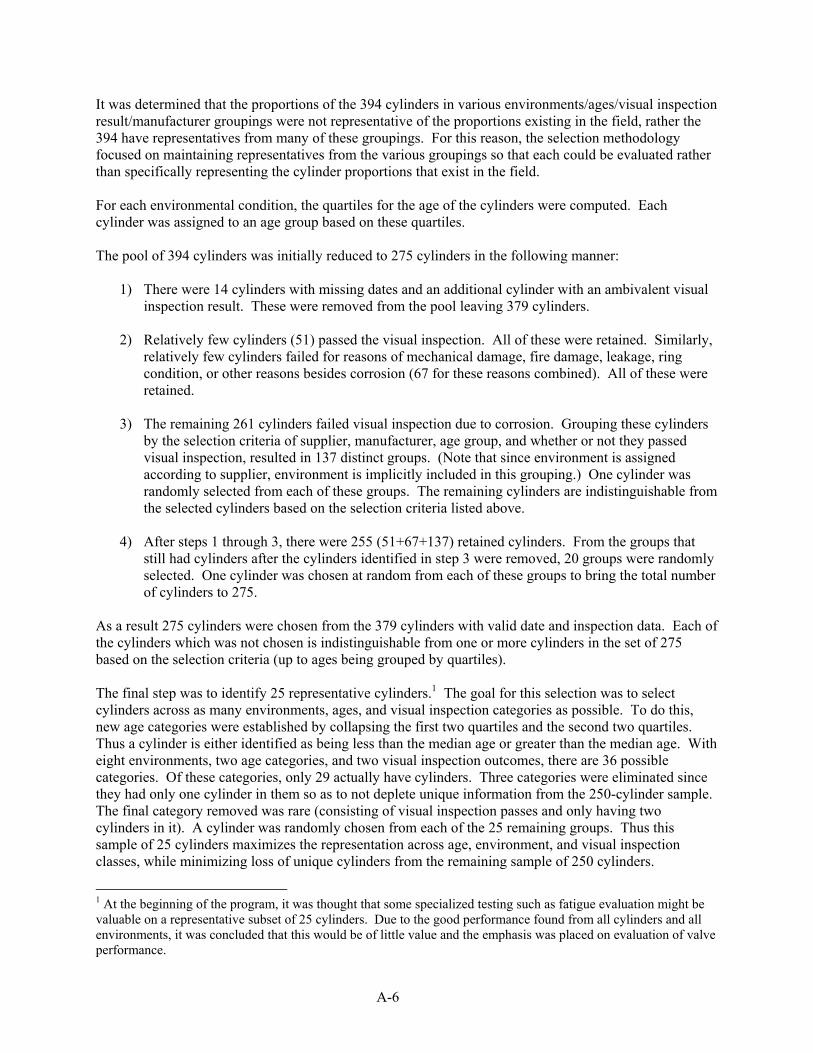
A-6
It was determined that the proportions of the 394 cylinders in various environments/ages/visual inspection result/manufacturer groupings were not representative of the proportions existing in the field, rather the 394 have representatives from many of these groupings. For this reason, the selection methodology focused on maintaining representatives from the various groupings so that each could be evaluated rather than specifically representing the cylinder proportions that exist in the field. For each environmental condition, the quartiles for the age of the cylinders were computed. Each cylinder was assigned to an age group based on these quartiles. The pool of 394 cylinders was initially reduced to 275 cylinders in the following manner:
1) There were 14 cylinders with missing dates and an additional cylinder with an ambivalent visual inspection result. These were removed from the pool leaving 379 cylinders.
2) Relatively few cylinders (51) passed the visual inspection. All of these were retained. Similarly,
relatively few cylinders failed for reasons of mechanical damage, fire damage, leakage, ring condition, or other reasons besides corrosion (67 for these reasons combined). All of these were retained.
3) The remaining 261 cylinders failed visual inspection due to corrosion. Grouping these cylinders
by the selection criteria of supplier, manufacturer, age group, and whether or not they passed visual inspection, resulted in 137 distinct groups. (Note that since environment is assigned according to supplier, environment is implicitly included in this grouping.) One cylinder was randomly selected from each of these groups. The remaining cylinders are indistinguishable from the selected cylinders based on the selection criteria listed above.
4) After steps 1 through 3, there were 255 (51+67+137) retained cylinders. From the groups that
still had cylinders after the cylinders identified in step 3 were removed, 20 groups were randomly selected. One cylinder was chosen at random from each of these groups to bring the total number of cylinders to 275.
As a result 275 cylinders were chosen from the 379 cylinders with valid date and inspection data. Each of the cylinders which was not chosen is indistinguishable from one or more cylinders in the set of 275 based on the selection criteria (up to ages being grouped by quartiles). The final step was to identify 25 representative cylinders.1 The goal for this selection was to select cylinders across as many environments, ages, and visual inspection categories as possible. To do this, new age categories were established by collapsing the first two quartiles and the second two quartiles. Thus a cylinder is either identified as being less than the median age or greater than the median age. With eight environments, two age categories, and two visual inspection outcomes, there are 36 possible categories. Of these categories, only 29 actually have cylinders. Three categories were eliminated since they had only one cylinder in them so as to not deplete unique information from the 250-cylinder sample. The final category removed was rare (consisting of visual inspection passes and only having two cylinders in it). A cylinder was randomly chosen from each of the 25 remaining groups. Thus this sample of 25 cylinders maximizes the representation across age, environment, and visual inspection classes, while minimizing loss of unique cylinders from the remaining sample of 250 cylinders.
1 At the beginning of the program, it was thought that some specialized testing such as fatigue evaluation might be valuable on a representative subset of 25 cylinders. Due to the good performance found from all cylinders and all environments, it was concluded that this would be of little value and the emphasis was placed on evaluation of valve performance.
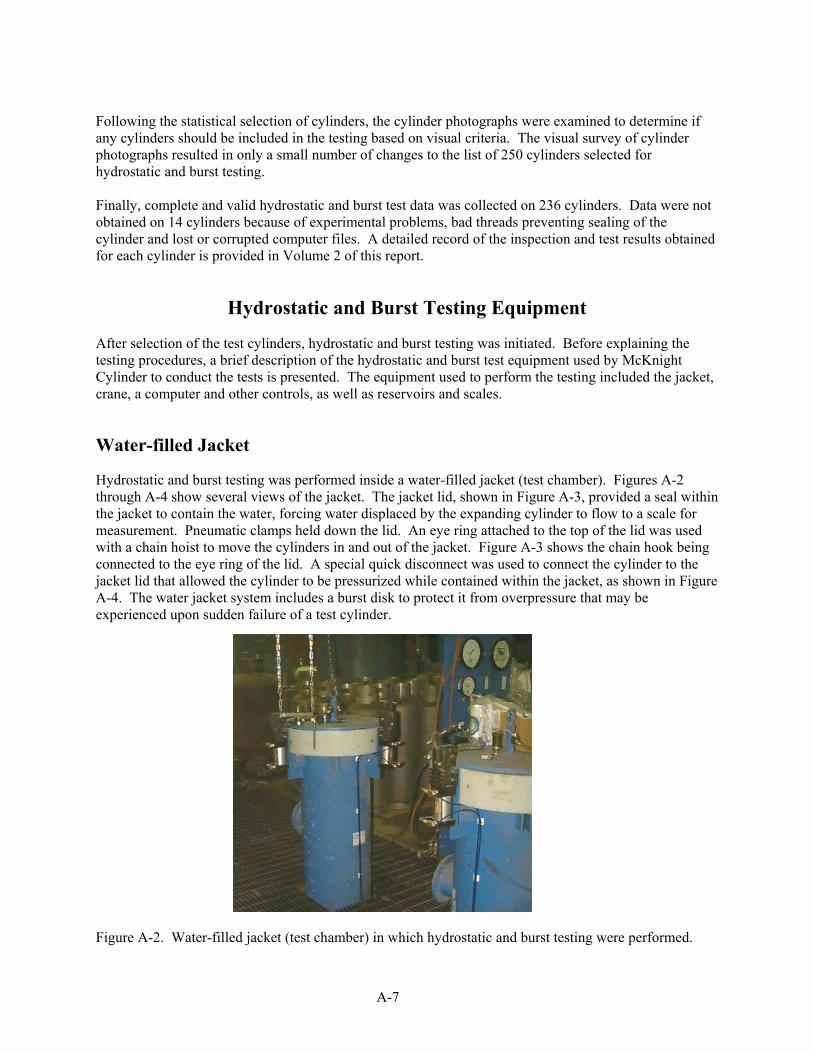
A-7
Following the statistical selection of cylinders, the cylinder photographs were examined to determine if any cylinders should be included in the testing based on visual criteria. The visual survey of cylinder photographs resulted in only a small number of changes to the list of 250 cylinders selected for hydrostatic and burst testing. Finally, complete and valid hydrostatic and burst test data was collected on 236 cylinders. Data were not obtained on 14 cylinders because of experimental problems, bad threads preventing sealing of the cylinder and lost or corrupted computer files. A detailed record of the inspection and test results obtained for each cylinder is provided in Volume 2 of this report.
Hydrostatic and Burst Testing Equipment
After selection of the test cylinders, hydrostatic and burst testing was initiated. Before explaining the testing procedures, a brief description of the hydrostatic and burst test equipment used by McKnight Cylinder to conduct the tests is presented. The equipment used to perform the testing included the jacket, crane, a computer and other controls, as well as reservoirs and scales.
Water-filled Jacket
Hydrostatic and burst testing was performed inside a water-filled jacket (test chamber). Figures A-2 through A-4 show several views of the jacket. The jacket lid, shown in Figure A-3, provided a seal within the jacket to contain the water, forcing water displaced by the expanding cylinder to flow to a scale for measurement. Pneumatic clamps held down the lid. An eye ring attached to the top of the lid was used with a chain hoist to move the cylinders in and out of the jacket. Figure A-3 shows the chain hook being connected to the eye ring of the lid. A special quick disconnect was used to connect the cylinder to the jacket lid that allowed the cylinder to be pressurized while contained within the jacket, as shown in Figure A-4. The water jacket system includes a burst disk to protect it from overpressure that may be experienced upon sudden failure of a test cylinder.
Figure A-2. Water-filled jacket (test chamber) in which hydrostatic and burst testing were performed.
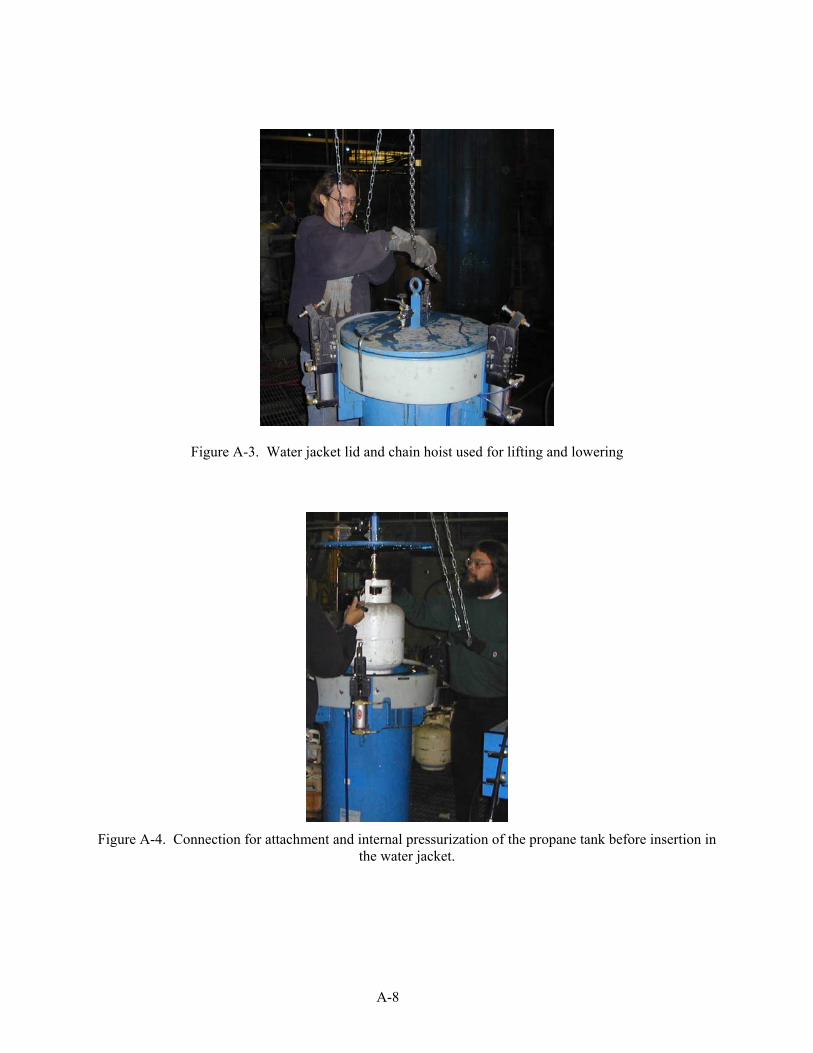
A-8
Figure A-3. Water jacket lid and chain hoist used for lifting and lowering
Figure A-4. Connection for attachment and internal pressurization of the propane tank before insertion in the water jacket.
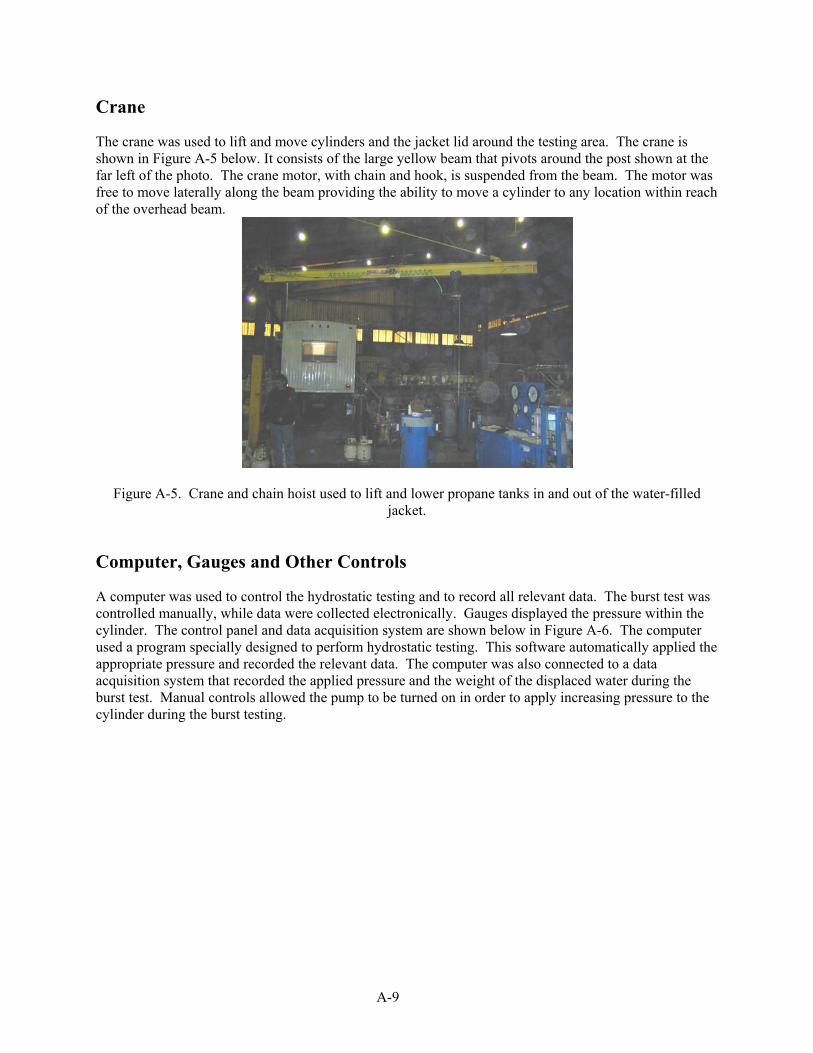
A-9
Crane
The crane was used to lift and move cylinders and the jacket lid around the testing area. The crane is shown in Figure A-5 below. It consists of the large yellow beam that pivots around the post shown at the far left of the photo. The crane motor, with chain and hook, is suspended from the beam. The motor was free to move laterally along the beam providing the ability to move a cylinder to any location within reach of the overhead beam.
Figure A-5. Crane and chain hoist used to lift and lower propane tanks in and out of the water-filled
jacket.
Computer, Gauges and Other Controls
A computer was used to control the hydrostatic testing and to record all relevant data. The burst test was controlled manually, while data were collected electronically. Gauges displayed the pressure within the cylinder. The control panel and data acquisition system are shown below in Figure A-6. The computer used a program specially designed to perform hydrostatic testing. This software automatically applied the appropriate pressure and recorded the relevant data. The computer was also connected to a data acquisition system that recorded the applied pressure and the weight of the displaced water during the burst test. Manual controls allowed the pump to be turned on in order to apply increasing pressure to the cylinder during the burst testing.
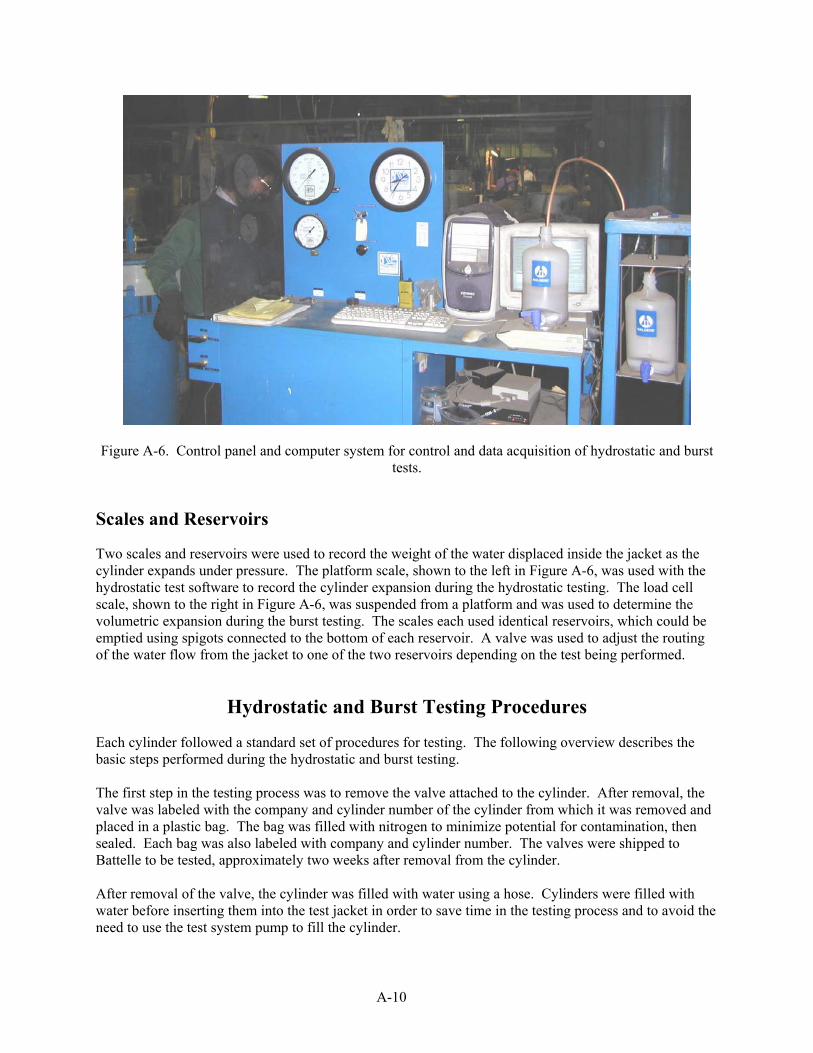
A-10
Figure A-6. Control panel and computer system for control and data acquisition of hydrostatic and burst
tests.
Scales and Reservoirs
Two scales and reservoirs were used to record the weight of the water displaced inside the jacket as the cylinder expands under pressure. The platform scale, shown to the left in Figure A-6, was used with the hydrostatic test software to record the cylinder expansion during the hydrostatic testing. The load cell scale, shown to the right in Figure A-6, was suspended from a platform and was used to determine the volumetric expansion during the burst testing. The scales each used identical reservoirs, which could be emptied using spigots connected to the bottom of each reservoir. A valve was used to adjust the routing of the water flow from the jacket to one of the two reservoirs depending on the test being performed.
Hydrostatic and Burst Testing Procedures
Each cylinder followed a standard set of procedures for testing. The following overview describes the basic steps performed during the hydrostatic and burst testing. The first step in the testing process was to remove the valve attached to the cylinder. After removal, the valve was labeled with the company and cylinder number of the cylinder from which it was removed and placed in a plastic bag. The bag was filled with nitrogen to minimize potential for contamination, then sealed. Each bag was also labeled with company and cylinder number. The valves were shipped to Battelle to be tested, approximately two weeks after removal from the cylinder. After removal of the valve, the cylinder was filled with water using a hose. Cylinders were filled with water before inserting them into the test jacket in order to save time in the testing process and to avoid the need to use the test system pump to fill the cylinder.
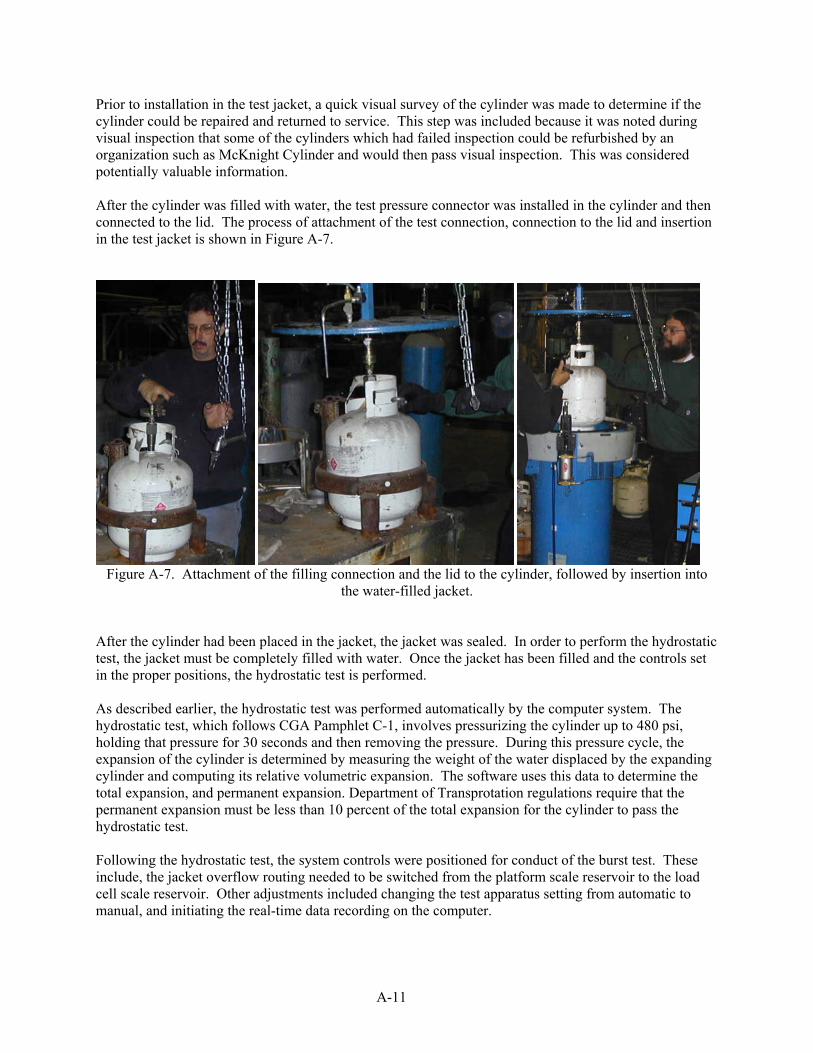
A-11
Prior to installation in the test jacket, a quick visual survey of the cylinder was made to determine if the cylinder could be repaired and returned to service. This step was included because it was noted during visual inspection that some of the cylinders which had failed inspection could be refurbished by an organization such as McKnight Cylinder and would then pass visual inspection. This was considered potentially valuable information. After the cylinder was filled with water, the test pressure connector was installed in the cylinder and then connected to the lid. The process of attachment of the test connection, connection to the lid and insertion in the test jacket is shown in Figure A-7.
Figure A-7. Attachment of the filling connection and the lid to the cylinder, followed by insertion into
the water-filled jacket. After the cylinder had been placed in the jacket, the jacket was sealed. In order to perform the hydrostatic test, the jacket must be completely filled with water. Once the jacket has been filled and the controls set in the proper positions, the hydrostatic test is performed. As described earlier, the hydrostatic test was performed automatically by the computer system. The hydrostatic test, which follows CGA Pamphlet C-1, involves pressurizing the cylinder up to 480 psi, holding that pressure for 30 seconds and then removing the pressure. During this pressure cycle, the expansion of the cylinder is determined by measuring the weight of the water displaced by the expanding cylinder and computing its relative volumetric expansion. The software uses this data to determine the total expansion, and permanent expansion. Department of Transprotation regulations require that the permanent expansion must be less than 10 percent of the total expansion for the cylinder to pass the hydrostatic test. Following the hydrostatic test, the system controls were positioned for conduct of the burst test. These include, the jacket overflow routing needed to be switched from the platform scale reservoir to the load cell scale reservoir. Other adjustments included changing the test apparatus setting from automatic to manual, and initiating the real-time data recording on the computer.
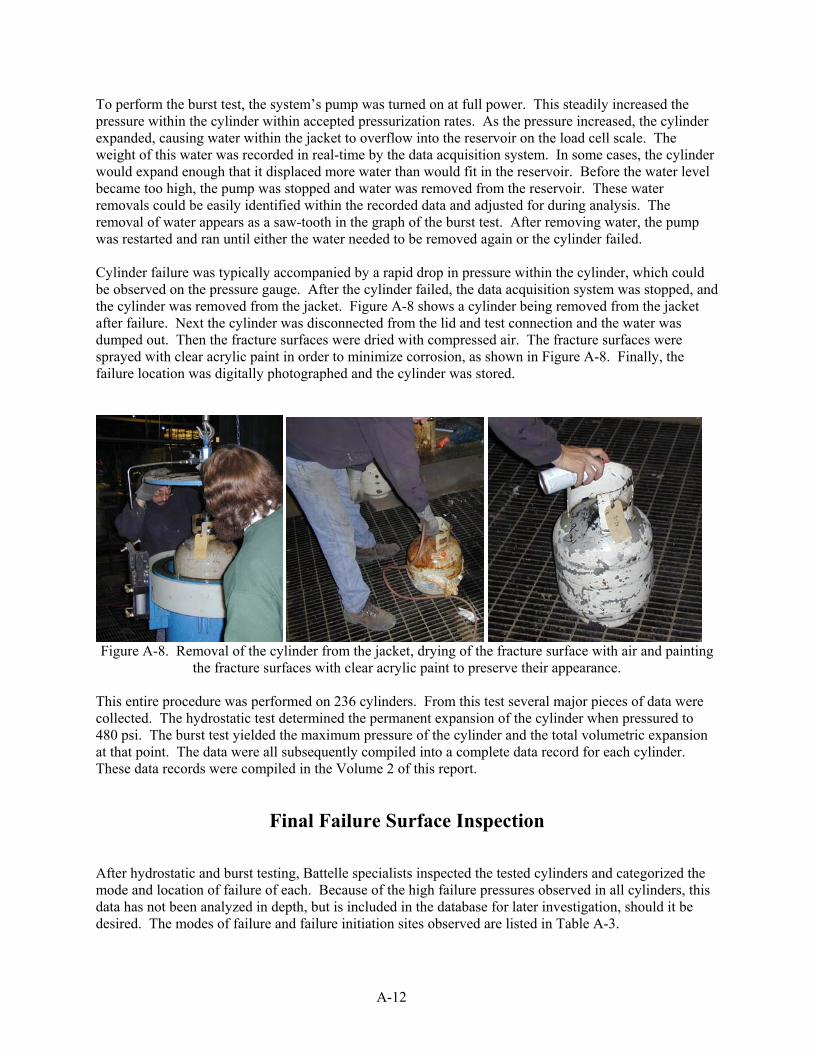
A-12
To perform the burst test, the system’s pump was turned on at full power. This steadily increased the pressure within the cylinder within accepted pressurization rates. As the pressure increased, the cylinder expanded, causing water within the jacket to overflow into the reservoir on the load cell scale. The weight of this water was recorded in real-time by the data acquisition system. In some cases, the cylinder would expand enough that it displaced more water than would fit in the reservoir. Before the water level became too high, the pump was stopped and water was removed from the reservoir. These water removals could be easily identified within the recorded data and adjusted for during analysis. The removal of water appears as a saw-tooth in the graph of the burst test. After removing water, the pump was restarted and ran until either the water needed to be removed again or the cylinder failed. Cylinder failure was typically accompanied by a rapid drop in pressure within the cylinder, which could be observed on the pressure gauge. After the cylinder failed, the data acquisition system was stopped, and the cylinder was removed from the jacket. Figure A-8 shows a cylinder being removed from the jacket after failure. Next the cylinder was disconnected from the lid and test connection and the water was dumped out. Then the fracture surfaces were dried with compressed air. The fracture surfaces were sprayed with clear acrylic paint in order to minimize corrosion, as shown in Figure A-8. Finally, the failure location was digitally photographed and the cylinder was stored.
Figure A-8. Removal of the cylinder from the jacket, drying of the fracture surface with air and painting
the fracture surfaces with clear acrylic paint to preserve their appearance. This entire procedure was performed on 236 cylinders. From this test several major pieces of data were collected. The hydrostatic test determined the permanent expansion of the cylinder when pressured to 480 psi. The burst test yielded the maximum pressure of the cylinder and the total volumetric expansion at that point. The data were all subsequently compiled into a complete data record for each cylinder. These data records were compiled in the Volume 2 of this report.
Final Failure Surface Inspection
After hydrostatic and burst testing, Battelle specialists inspected the tested cylinders and categorized the mode and location of failure of each. Because of the high failure pressures observed in all cylinders, this data has not been analyzed in depth, but is included in the database for later investigation, should it be desired. The modes of failure and failure initiation sites observed are listed in Table A-3.
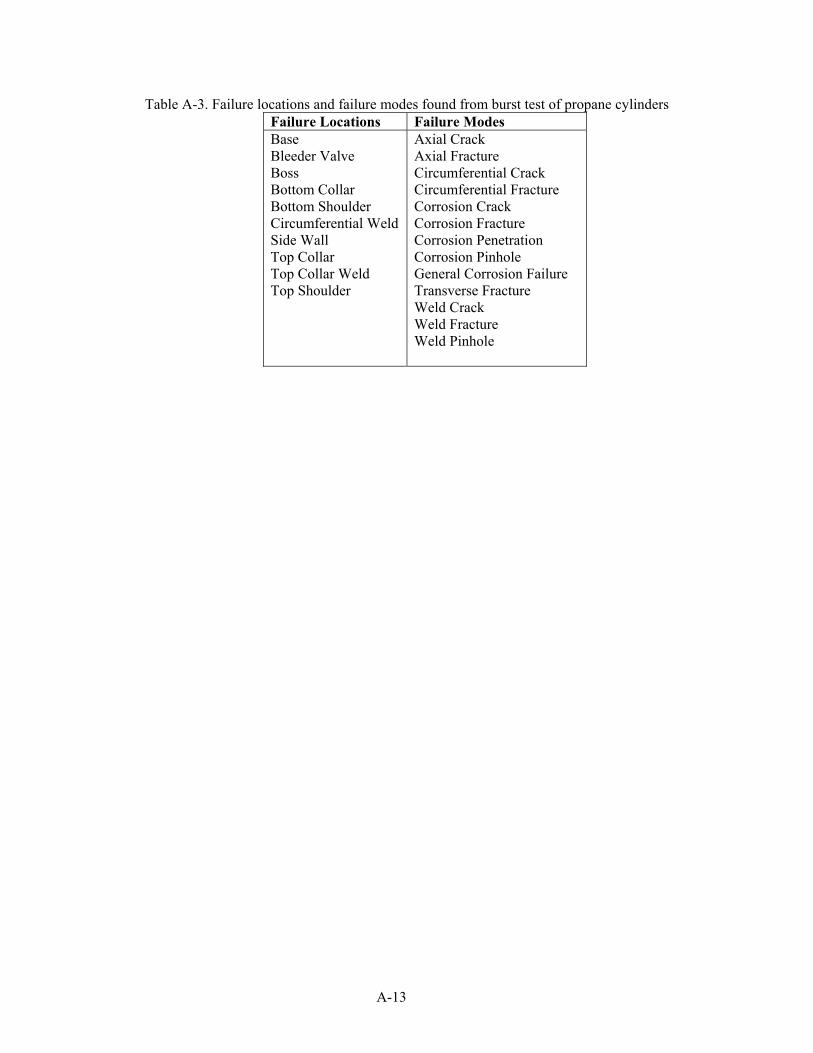
A-13
Table A-3. Failure locations and failure modes found from burst test of propane cylinders Failure Locations Failure Modes Base Bleeder Valve Boss Bottom Collar Bottom Shoulder Circumferential Weld Side Wall Top Collar Top Collar Weld Top Shoulder
Axial Crack Axial Fracture Circumferential Crack Circumferential Fracture Corrosion Crack Corrosion Fracture Corrosion Penetration Corrosion Pinhole General Corrosion Failure Transverse Fracture Weld Crack Weld Fracture Weld Pinhole

A-14
VALVE TESTING METHODOLOGY As described earlier, the valves were removed from each cylinder before hydrostatic and burst testing, and shipped to Battelle’s laboratories in Columbus, Ohio for testing. At Battelle, each valve was tested using a procedure consistent with the relief valve requalification test procedure given in Appendix B of CGA S-1.1 and UL 132 Tests 1, 2 and 3. The procedure was modified to take more precise measurements of the valve opening and closing data and to expedite testing of over 200 relief valves. The test equipment setup used for this testing is shown in Figure A-9.
Figure A-9. Apparatus and equipment used to test relief valve performance.
Valve Testing Equipment
Before describing the valve testing procedures, a brief description of the equipment used during the valve testing is provided below.
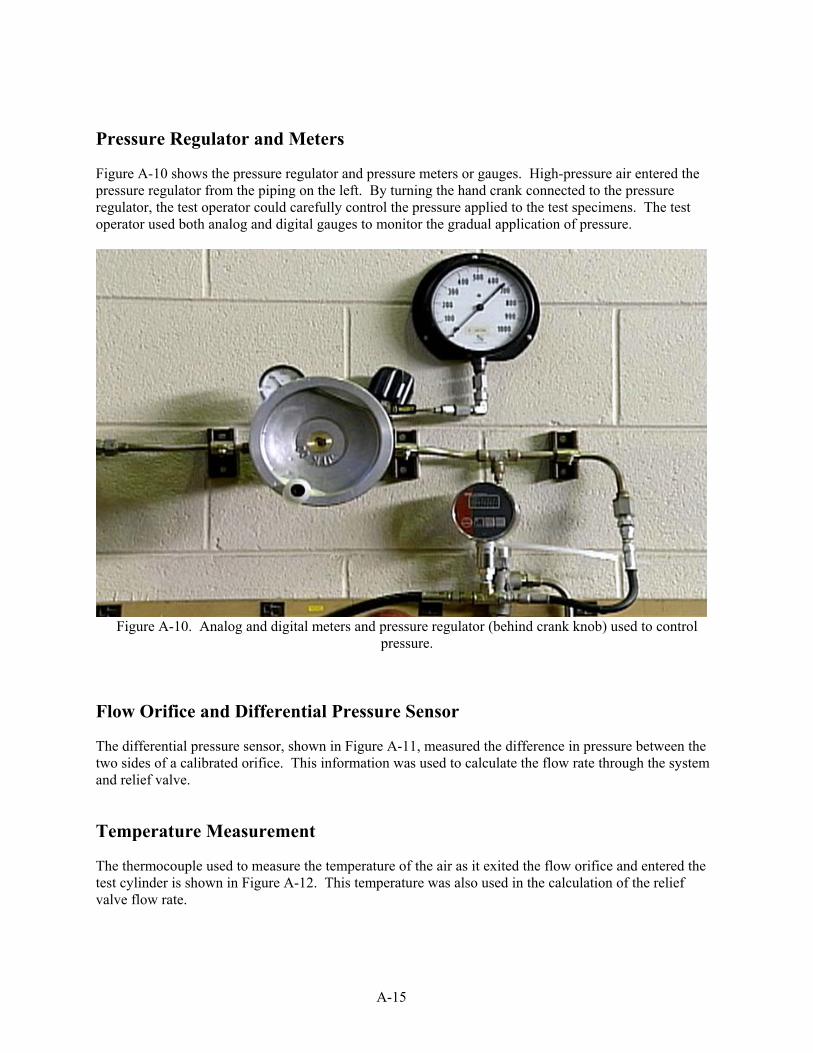
A-15
Pressure Regulator and Meters
Figure A-10 shows the pressure regulator and pressure meters or gauges. High-pressure air entered the pressure regulator from the piping on the left. By turning the hand crank connected to the pressure regulator, the test operator could carefully control the pressure applied to the test specimens. The test operator used both analog and digital gauges to monitor the gradual application of pressure.
Figure A-10. Analog and digital meters and pressure regulator (behind crank knob) used to control
pressure.
Flow Orifice and Differential Pressure Sensor
The differential pressure sensor, shown in Figure A-11, measured the difference in pressure between the two sides of a calibrated orifice. This information was used to calculate the flow rate through the system and relief valve.
Temperature Measurement
The thermocouple used to measure the temperature of the air as it exited the flow orifice and entered the test cylinder is shown in Figure A-12. This temperature was also used in the calculation of the relief valve flow rate.
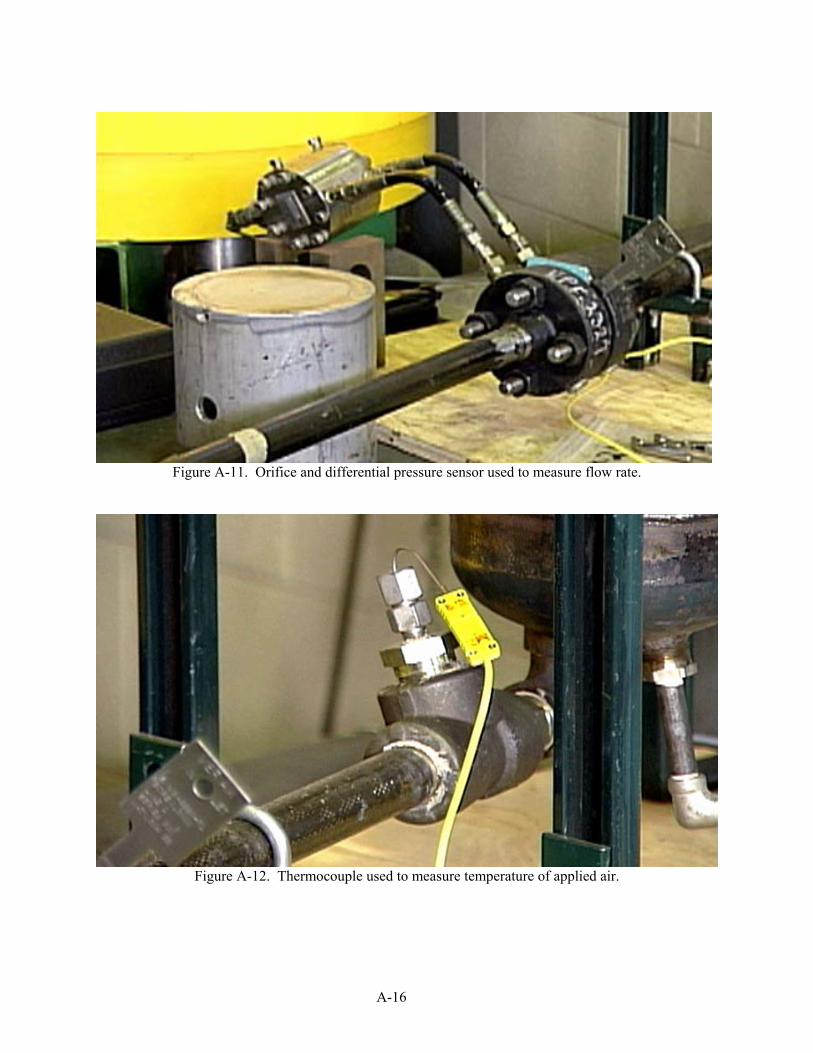
A-16
Figure A-11. Orifice and differential pressure sensor used to measure flow rate.
Figure A-12. Thermocouple used to measure temperature of applied air.
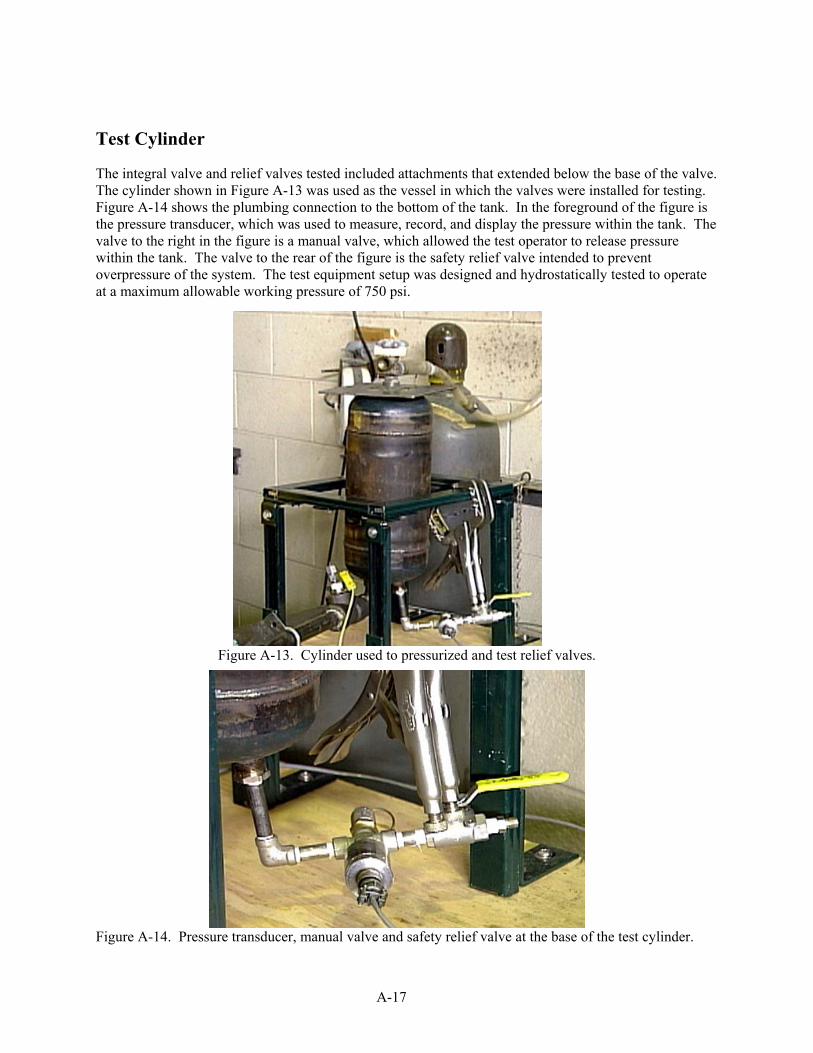
A-17
Test Cylinder
The integral valve and relief valves tested included attachments that extended below the base of the valve. The cylinder shown in Figure A-13 was used as the vessel in which the valves were installed for testing. Figure A-14 shows the plumbing connection to the bottom of the tank. In the foreground of the figure is the pressure transducer, which was used to measure, record, and display the pressure within the tank. The valve to the right in the figure is a manual valve, which allowed the test operator to release pressure within the tank. The valve to the rear of the figure is the safety relief valve intended to prevent overpressure of the system. The test equipment setup was designed and hydrostatically tested to operate at a maximum allowable working pressure of 750 psi.
Figure A-13. Cylinder used to pressurized and test relief valves.
Figure A-14. Pressure transducer, manual valve and safety relief valve at the base of the test cylinder.
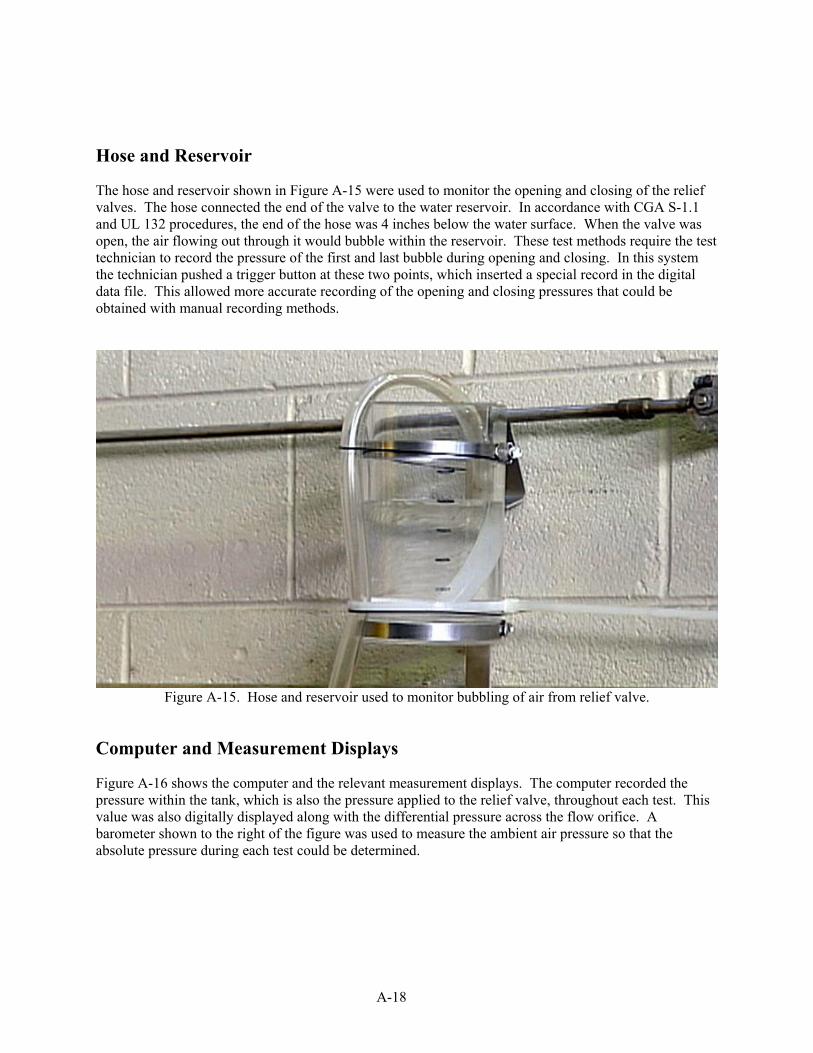
A-18
Hose and Reservoir
The hose and reservoir shown in Figure A-15 were used to monitor the opening and closing of the relief valves. The hose connected the end of the valve to the water reservoir. In accordance with CGA S-1.1 and UL 132 procedures, the end of the hose was 4 inches below the water surface. When the valve was open, the air flowing out through it would bubble within the reservoir. These test methods require the test technician to record the pressure of the first and last bubble during opening and closing. In this system the technician pushed a trigger button at these two points, which inserted a special record in the digital data file. This allowed more accurate recording of the opening and closing pressures that could be obtained with manual recording methods.
Figure A-15. Hose and reservoir used to monitor bubbling of air from relief valve.
Computer and Measurement Displays
Figure A-16 shows the computer and the relevant measurement displays. The computer recorded the pressure within the tank, which is also the pressure applied to the relief valve, throughout each test. This value was also digitally displayed along with the differential pressure across the flow orifice. A barometer shown to the right of the figure was used to measure the ambient air pressure so that the absolute pressure during each test could be determined.
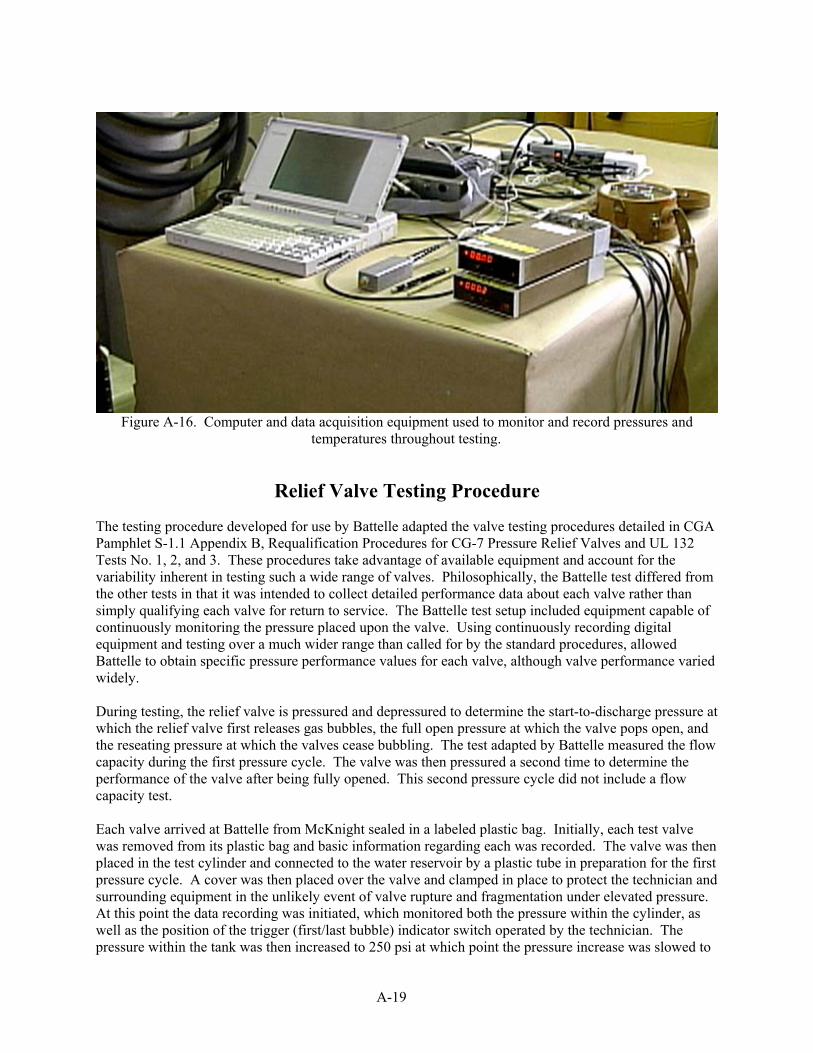
A-19
Figure A-16. Computer and data acquisition equipment used to monitor and record pressures and
temperatures throughout testing.
Relief Valve Testing Procedure
The testing procedure developed for use by Battelle adapted the valve testing procedures detailed in CGA Pamphlet S-1.1 Appendix B, Requalification Procedures for CG-7 Pressure Relief Valves and UL 132 Tests No. 1, 2, and 3. These procedures take advantage of available equipment and account for the variability inherent in testing such a wide range of valves. Philosophically, the Battelle test differed from the other tests in that it was intended to collect detailed performance data about each valve rather than simply qualifying each valve for return to service. The Battelle test setup included equipment capable of continuously monitoring the pressure placed upon the valve. Using continuously recording digital equipment and testing over a much wider range than called for by the standard procedures, allowed Battelle to obtain specific pressure performance values for each valve, although valve performance varied widely. During testing, the relief valve is pressured and depressured to determine the start-to-discharge pressure at which the relief valve first releases gas bubbles, the full open pressure at which the valve pops open, and the reseating pressure at which the valves cease bubbling. The test adapted by Battelle measured the flow capacity during the first pressure cycle. The valve was then pressured a second time to determine the performance of the valve after being fully opened. This second pressure cycle did not include a flow capacity test. Each valve arrived at Battelle from McKnight sealed in a labeled plastic bag. Initially, each test valve was removed from its plastic bag and basic information regarding each was recorded. The valve was then placed in the test cylinder and connected to the water reservoir by a plastic tube in preparation for the first pressure cycle. A cover was then placed over the valve and clamped in place to protect the technician and surrounding equipment in the unlikely event of valve rupture and fragmentation under elevated pressure. At this point the data recording was initiated, which monitored both the pressure within the cylinder, as well as the position of the trigger (first/last bubble) indicator switch operated by the technician. The pressure within the tank was then increased to 250 psi at which point the pressure increase was slowed to
A-20
no more than 2 psi per second. The technician achieved this rate by comparing the digital pressure readout and the clock and adjusting the pressure regulator’s hand crank appropriately. When the first bubble occurred, the technician pressed the trigger switch, placing a record in the digital data file. The first bubble represents the lowest pressure at which flow occurs through the valve. If the first bubble did not occur before the cylinder pressure reached 750 psi, the testing was stopped, and the failure of the valve to open was recorded. Typically, however the valves bubbled between 375 and 500 psi. After the first bubbles were observed and noted, the tubing connecting the valve to the reservoir was removed to allow the valve to pop fully open. If the valve popped open while the tubing was still attached, as often occurred when the start to discharge or first bubble and the full opening or pop occurred simultaneously, the tubing would slide off the valve. The test equipment was designed so that this could occur safely. If the valve did not pop open at the initial discharge, the applied pressure was increased until the valve popped fully open. The technician recorded the full open pressure by using the trigger switch to mark the digital data file. However the full open pressure could typically be identified in the recorded data as a sharp drop in pressure without the aid of the marker. If there was flow through the valve as the pressure increased to 450 psi, the technician would record the flow characteristics at that point. The flow characteristics consisted of the flow temperature, the differential pressure across the orifice, the barometric pressure, and the pressure on the valve. From these values the flow rate through the valve could be determined. In many cases the first bubble and pop occurred above 450 psi. In these cases, the technician lowered the pressure to 450 psi after the pop occurred and recorded the flow characteristics at that point. After the flow characteristics were recorded the pressure was turned off and the reservoir hose was reattached to the valve. The pressure within the tank was then lowered at roughly 2 psi per second. As the bubbles coming from the valve decreased the pressure drop within the tank was slowed to allow accurate recording of the final bubble. The button on the switch was pressed when the last bubble occurred. At this point the data acquisition system was stopped and the first start to discharge test and flow test, known as Sequence A, was complete. The second start to discharge test, known as Sequence B, was performed in the same manner as the first pressure cycle except no flow characteristics were recorded. The recorded data from each test was stored in separate files for interpretation. The primary results of the valve tests consisted of the start-to-discharge or first bubble pressure, the full-open or popping pressure, and the reseating or last bubble pressure, as well as the flow characteristics from which the flow rate could be calculated. Following Sequence B testing, all of the pressure was removed from the test system, and the valve was removed and returned to its labeled plastic bag.
Comparison of Test Procedures
Table A-4 compares the primary elements of the Battelle test methodology to the methods of CGA S-1.1 Appendix B and UL 132 Test Numbers 1, 2 and 3. Differences between the test methods include:
The CGA S-1.1 method begins looking for bubbles at 375 psi, the UL 132 method begins looking at 350 psi and the Battelle procedure begins at 0 psi.
If no bubble occurs at the maximum start-to-discharge pressure, 480 psi, the CGA S-1.1 procedure holds for 5 minutes, whereas the Battelle procedure continues increasing pressure smoothly until the first bubble is observed.
A-21
The Battelle procedure separately records start-to-discharge and full-open pressure, whereas CGA S-1.1 does not.
The Battelle procedure continues pressurization up to 750 psi, if the valve did not start-to-discharge or fully open, whereas the CGA S-1.1 procedure terminates at the maximum test pressure of 480 psi.
CGA S-1.1 requires complete depressurization, before and after flow testing, whereas, the Battelle method measures flow directly between measuring full-open pressure and reseating pressure.
CGA S-1.1 begins the second start to discharge test 1 hour after flow rate measurement test. Battelle measures the second start-to-discharge pressure directly after reseating the valve.
Relief Valve Sensitivity to Test Method
One difference between the Battelle test protocol and the CGA S-1.1 and UL 132 test protocols was the dwell time between A and B sequence. CGA S-1.1 and UL 132 have a one hour dwell (wait) between the two sequences. When contacted by Battelle, UL indicated that there was an expectation that this one hour wait would be reduced or deleted in the future. Battelle performed some preliminary dwell tests on a valve which suggested that there was no effect of wait time on results. Program advisors reviewed the test procedure and did not identify potential problems as a result of this difference. Consequently, Battelle initiated the second test sequence immediately upon completion of the first test sequence. As discussed in the main body of the report, it is possible that some of the relief valves tested were sensitive to this dwell time. The Battelle test procedure was developed to accurately and efficiently record the same information required by the CGA S-1.1 and UL 132 tests as well as other performance parameters over the range of expected performance of relief valves. The primary differences in procedures were in pressure increments and hold times. At the time the test was developed, it was expected that most valves would perform consistently and that that only a few outliers would perform erratically. Furthermore, it was expected that relief valve performance would not be sensitive to nuances in test method. As discussed in the main body of this report, there was wide variation in the performance of relief valves and only a fraction of the valves met all of the test criteria as performed by Battelle. In examining the relief valve test results, the behavior of the elastomeric seals may be time-dependent and, consequently, the performance of the relief valve seals may be affected somewhat by the rate at which the testing is performed. However, analysis of the data suggests that, because of the wide scatter in performance, these differences would not change the fundamental conclusions of this project. Furthermore, sensitivity to nuances in the test method further confirms an overall inconsistency in relief valve performance observed in the test data.
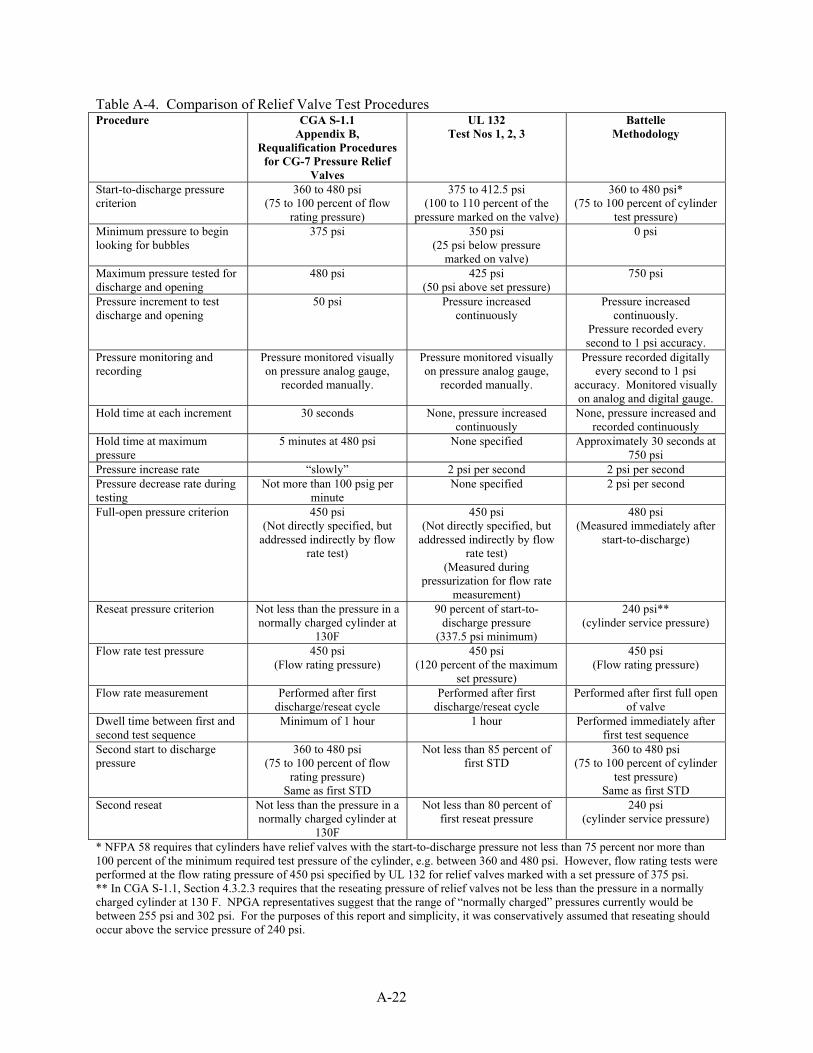
A-22
Table A-4. Comparison of Relief Valve Test Procedures Procedure CGA S-1.1
Appendix B, Requalification Procedures
for CG-7 Pressure Relief Valves
UL 132 Test Nos 1, 2, 3
Battelle Methodology
Start-to-discharge pressure criterion
360 to 480 psi (75 to 100 percent of flow
rating pressure)
375 to 412.5 psi (100 to 110 percent of the
pressure marked on the valve)
360 to 480 psi* (75 to 100 percent of cylinder
test pressure) Minimum pressure to begin looking for bubbles
375 psi 350 psi (25 psi below pressure
marked on valve)
0 psi
Maximum pressure tested for discharge and opening
480 psi 425 psi (50 psi above set pressure)
750 psi
Pressure increment to test discharge and opening
50 psi Pressure increased continuously
Pressure increased continuously.
Pressure recorded every second to 1 psi accuracy.
Pressure monitoring and recording
Pressure monitored visually on pressure analog gauge,
recorded manually.
Pressure monitored visually on pressure analog gauge,
recorded manually.
Pressure recorded digitally every second to 1 psi
accuracy. Monitored visually on analog and digital gauge.
Hold time at each increment 30 seconds None, pressure increased continuously
None, pressure increased and recorded continuously
Hold time at maximum pressure
5 minutes at 480 psi None specified Approximately 30 seconds at 750 psi
Pressure increase rate “slowly” 2 psi per second 2 psi per second Pressure decrease rate during testing
Not more than 100 psig per minute
None specified 2 psi per second
Full-open pressure criterion 450 psi (Not directly specified, but
addressed indirectly by flow rate test)
450 psi (Not directly specified, but
addressed indirectly by flow rate test)
(Measured during pressurization for flow rate
measurement)
480 psi (Measured immediately after
start-to-discharge)
Reseat pressure criterion Not less than the pressure in a normally charged cylinder at
130F
90 percent of start-to-discharge pressure
(337.5 psi minimum)
240 psi** (cylinder service pressure)
Flow rate test pressure 450 psi (Flow rating pressure)
450 psi (120 percent of the maximum
set pressure)
450 psi (Flow rating pressure)
Flow rate measurement Performed after first discharge/reseat cycle
Performed after first discharge/reseat cycle
Performed after first full open of valve
Dwell time between first and second test sequence
Minimum of 1 hour 1 hour Performed immediately after first test sequence
Second start to discharge pressure
360 to 480 psi (75 to 100 percent of flow
rating pressure) Same as first STD
Not less than 85 percent of first STD
360 to 480 psi (75 to 100 percent of cylinder
test pressure) Same as first STD
Second reseat Not less than the pressure in a normally charged cylinder at
130F
Not less than 80 percent of first reseat pressure
240 psi (cylinder service pressure)
* NFPA 58 requires that cylinders have relief valves with the start-to-discharge pressure not less than 75 percent nor more than 100 percent of the minimum required test pressure of the cylinder, e.g. between 360 and 480 psi. However, flow rating tests were performed at the flow rating pressure of 450 psi specified by UL 132 for relief valves marked with a set pressure of 375 psi. ** In CGA S-1.1, Section 4.3.2.3 requires that the reseating pressure of relief valves not be less than the pressure in a normally charged cylinder at 130 F. NPGA representatives suggest that the range of “normally charged” pressures currently would be between 255 psi and 302 psi. For the purposes of this report and simplicity, it was conservatively assumed that reseating should occur above the service pressure of 240 psi.
B-1
APPENDIX B
STATISTICAL ANALYSIS OF SAFETY FACTORS AND CYLINDER PERFORMANCE
B-2
APPENDIX B
STATISTICAL ANALYSIS OF SAFETY FACTORS AND CYLINDER PERFORMANCE
Typical Margin of Safety Against Failure for Those Cylinders That Pass Visual Inspection and Those That Do Not
Margin of safety is defined to be the ratio of the failure pressure to the service pressure (240 psi). The standard measure of “typical” is the median. In this case the median failure pressure to service pressure ratio is 6.10 for cylinders that failed visual inspection versus 6.45 for cylinders that passed visual inspection. Some other statistics that may be useful in understanding the margin of safety are the mean and the minimum. The mean margin of safety for cylinders failing visual inspection is 5.92 (with a standard deviation of 1.12)1; for cylinders passing visual inspection the mean margin of safety is 6.44 (with a standard deviation of 0.48). Cylinders passing visual inspection have a minimum margin of safety of 5.15 compared to a minimum of 0.06 for cylinders failing visual inspection. It should be noted that many more cylinders in our sample failed visual inspection than passed (194/40). The differences between the means and the minima can be understood looking at the box plot below. The sample that failed visual inspection has both a much wider spread and more cylinders with much smaller margin of error. There are several reasons for the wider spread among the failed cylinders. The first is there are three cylinders in the sample that failed at very low pressures (15, 30, and 130 psi), well below service pressures. So, while part of the sample, they do not represent cylinders in operating condition. All other cylinders in the sample have failure pressures above 240 psi. If we remove these three cylinders from sample failing visual inspection, the standard deviation drops to 0.87 (and the mean and minimum increase to 6.00 and 2.08 respectively). Secondly, statistical theory predicts that the larger the sample taken the larger the number of extreme values expected. Indeed, events that are expected one percent of the time are expected to happen about twice in a sample of 200 (or 194), but are unlikely to be seen in a sample of 40. Even though many good cylinders fail visual inspection, all the cylinders passing visual inspection had a margin of safety of at least 5.
1 Standard deviation is a measure of dispersion or scatter in a set of data. A larger standard deviation suggests greater dispersion and scatter.
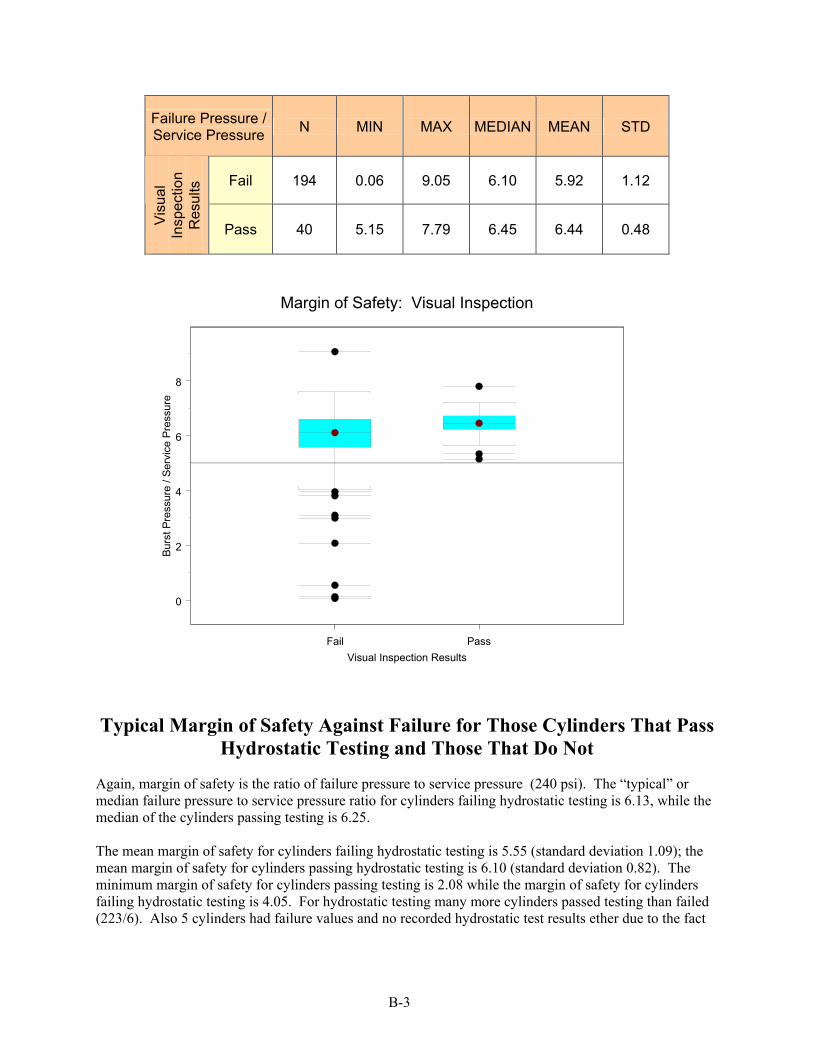
B-3
Failure Pressure / Service Pressure N MIN MAX MEDIAN MEAN STD
Fail 194 0.06 9.05 6.10 5.92 1.12 Vi
sual
In
spec
tion
Res
ults
Pass 40 5.15 7.79 6.45 6.44 0.48
Fail PassVisual Inspection Results
0
2
4
6
8
Burs
t Pre
ssur
e / S
ervi
ce P
ress
ure
Margin of Safety: Visual Inspection
Typical Margin of Safety Against Failure for Those Cylinders That Pass Hydrostatic Testing and Those That Do Not
Again, margin of safety is the ratio of failure pressure to service pressure (240 psi). The “typical” or median failure pressure to service pressure ratio for cylinders failing hydrostatic testing is 6.13, while the median of the cylinders passing testing is 6.25. The mean margin of safety for cylinders failing hydrostatic testing is 5.55 (standard deviation 1.09); the mean margin of safety for cylinders passing hydrostatic testing is 6.10 (standard deviation 0.82). The minimum margin of safety for cylinders passing testing is 2.08 while the margin of safety for cylinders failing hydrostatic testing is 4.05. For hydrostatic testing many more cylinders passed testing than failed (223/6). Also 5 cylinders had failure values and no recorded hydrostatic test results ether due to the fact
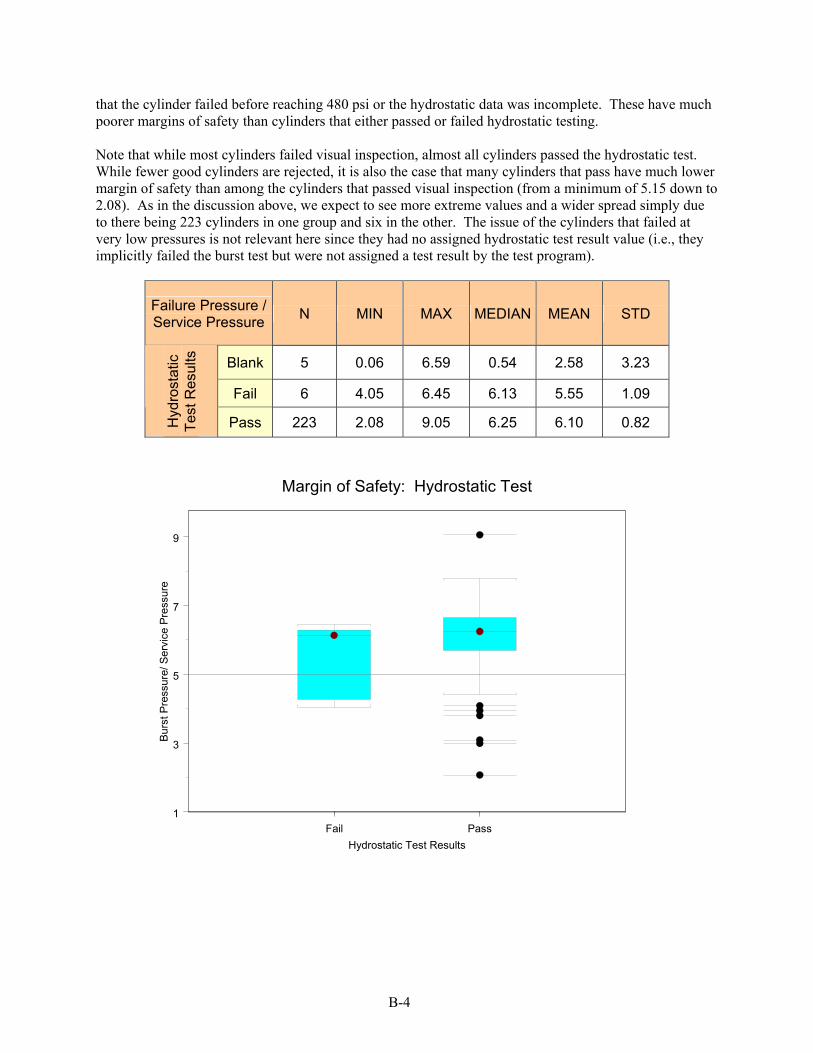
B-4
that the cylinder failed before reaching 480 psi or the hydrostatic data was incomplete. These have much poorer margins of safety than cylinders that either passed or failed hydrostatic testing. Note that while most cylinders failed visual inspection, almost all cylinders passed the hydrostatic test. While fewer good cylinders are rejected, it is also the case that many cylinders that pass have much lower margin of safety than among the cylinders that passed visual inspection (from a minimum of 5.15 down to 2.08). As in the discussion above, we expect to see more extreme values and a wider spread simply due to there being 223 cylinders in one group and six in the other. The issue of the cylinders that failed at very low pressures is not relevant here since they had no assigned hydrostatic test result value (i.e., they implicitly failed the burst test but were not assigned a test result by the test program).
Failure Pressure / Service Pressure N MIN MAX MEDIAN MEAN STD
Blank 5 0.06 6.59 0.54 2.58 3.23
Fail 6 4.05 6.45 6.13 5.55 1.09
Hyd
rost
atic
Te
st R
esul
ts
Pass 223 2.08 9.05 6.25 6.10 0.82
Fail PassHydrostatic Test Results
1
3
5
7
9
Burs
t Pre
ssur
e/ S
ervi
ce P
ress
ure
Margin of Safety: Hydrostatic Test
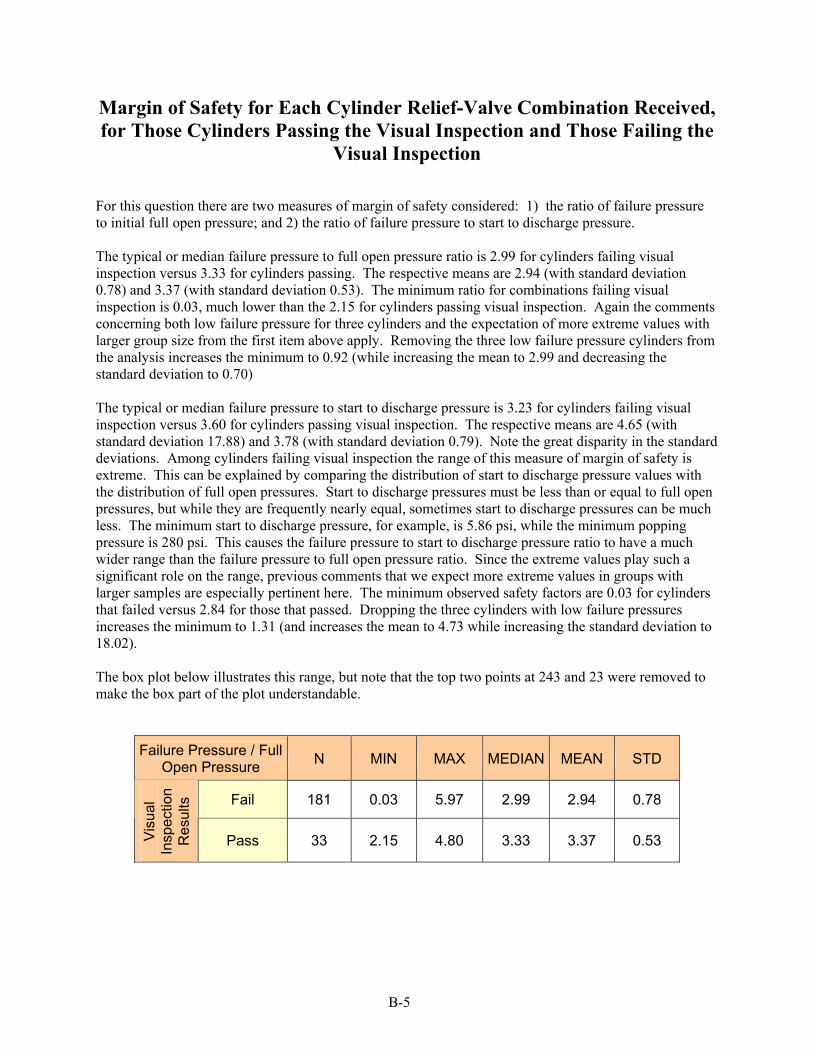
B-5
Margin of Safety for Each Cylinder Relief-Valve Combination Received, for Those Cylinders Passing the Visual Inspection and Those Failing the
Visual Inspection
For this question there are two measures of margin of safety considered: 1) the ratio of failure pressure to initial full open pressure; and 2) the ratio of failure pressure to start to discharge pressure. The typical or median failure pressure to full open pressure ratio is 2.99 for cylinders failing visual inspection versus 3.33 for cylinders passing. The respective means are 2.94 (with standard deviation 0.78) and 3.37 (with standard deviation 0.53). The minimum ratio for combinations failing visual inspection is 0.03, much lower than the 2.15 for cylinders passing visual inspection. Again the comments concerning both low failure pressure for three cylinders and the expectation of more extreme values with larger group size from the first item above apply. Removing the three low failure pressure cylinders from the analysis increases the minimum to 0.92 (while increasing the mean to 2.99 and decreasing the standard deviation to 0.70) The typical or median failure pressure to start to discharge pressure is 3.23 for cylinders failing visual inspection versus 3.60 for cylinders passing visual inspection. The respective means are 4.65 (with standard deviation 17.88) and 3.78 (with standard deviation 0.79). Note the great disparity in the standard deviations. Among cylinders failing visual inspection the range of this measure of margin of safety is extreme. This can be explained by comparing the distribution of start to discharge pressure values with the distribution of full open pressures. Start to discharge pressures must be less than or equal to full open pressures, but while they are frequently nearly equal, sometimes start to discharge pressures can be much less. The minimum start to discharge pressure, for example, is 5.86 psi, while the minimum popping pressure is 280 psi. This causes the failure pressure to start to discharge pressure ratio to have a much wider range than the failure pressure to full open pressure ratio. Since the extreme values play such a significant role on the range, previous comments that we expect more extreme values in groups with larger samples are especially pertinent here. The minimum observed safety factors are 0.03 for cylinders that failed versus 2.84 for those that passed. Dropping the three cylinders with low failure pressures increases the minimum to 1.31 (and increases the mean to 4.73 while increasing the standard deviation to 18.02). The box plot below illustrates this range, but note that the top two points at 243 and 23 were removed to make the box part of the plot understandable.
Failure Pressure / Full Open Pressure N MIN MAX MEDIAN MEAN STD
Fail 181 0.03 5.97 2.99 2.94 0.78
Visu
al
Insp
ectio
n R
esul
ts
Pass 33 2.15 4.80 3.33 3.37 0.53

B-6
Fail PassVisual Inspection Results
0
1
2
3
4
5
6
Burs
t Pre
ssur
e / P
oppi
ng P
ress
ure
Margin of Safety: Cylinder/Valve CombinationBurst Pressure / Popping Pressure
Failure Pressure / Start to discharge Pressure N MIN MAX MEDIAN MEAN STD
Fail 182 0.03 243.34 3.23 4.65 17.88
Visu
al
Insp
ectio
n R
esul
ts
Pass 33 2.84 6.22 3.60 3.78 0.79

B-7
Fail PassVisual Inspection Results
0
2
4
6
8
10
Burs
t Pre
ssur
e / F
irst B
ubbl
e Pr
essu
reMargin of Safety: Cylinder/Valve Combination
Burst Pressure / First Bubble Pressure
Outliers removed from FailGroup at 23 and 243
Probability of Matching an Unacceptable Relief Valve with an Unacceptable Cylinder in a Random Assignment of Relief Valves and
Cylinders
The probability of matching an unacceptable relief valve with an unacceptable cylinder in a random assignment of relief valves and cylinders based upon the data set analyzed here is 0.00149 or 0.149%1.
Assumptions and method:
We assume that the empirical distributions of failure pressures and popping pressures observed in the data are representative of the general population. Theoretical density functions were fit to these empirical distributions (more details below). By “random assignment of relief valves and cylinders” we assume that the choice of valve and cylinder is independent in the statistical sense so that the joint probability distribution is the product of the density function for full open pressure and the density function for failure pressure. With this joint probability density function, we compute P(Failure Pressure < Full Open Pressure).
1 This does not represent the probability of failure to occur because it does not incorporate the probability of the unacceptable cylinder and relief valve being subjected to an overpressure or fire condition.

B-8
More assumptions and details:
When examining the distribution of failure pressures, three cylinders appeared as extreme outliers with failure pressures less than 240. Since these failure pressures were less than the service pressures, it was assumed that these cylinders were not in working order and should be excluded from this analysis. The distribution of failure pressure has roughly a Normal distribution (i.e. Gaussian or classical bell-shape), but skewed with a heavy left tail. A mixture model of two Normal densities was fit to the data with good agreement to the empirical curve. Since the failure pressure distributions are different for cylinders passing and failing visual inspection (indeed, no cylinder that passed visual inspection had failure pressure below 1200, but the distribution for cylinders failing visual inspection ranged far below 1200), it seems reasonable to expect the overall distribution to be well described by a mixture of two distributions. The empirical distribution of relief valve pressures also has roughly a skewed Normal shape with a heavy tail to the right. There is also an issue of nine valves that did not open under the maximum test pressure of 750, statistically termed censored data. These complicate the fitting process because we know they open at some pressure larger than 750, but we do not know the specific value. Thus the observed tail continues to the right, but exactly how far can’t be determined. Two fitting strategies were investigated. A Lognormal distribution was fit using the techniques of survival analysis, which was developed to handle censored data. Also a mixture of two Normal distributions was fit to the data with the censored points assigned values to make the tail area correct. Again a mixture of distributions is reasonable given that there are likely two populations in our sample base (loosely corresponding to passing or failing visual inspection). The two approaches result in very similar probabilities. Since the mixture model most nearly matched the shape of the observed distribution and since its results were slightly more conservative than those associated with the Lognormal fit, the results of this approach are reported.
Conclusions:
The probability of matching an unacceptable relief valve with an unacceptable cylinder in a random assignment of relief valves and cylinders based upon the data set analyzed here is 0.00149 or 0.149%. We know that only cylinders that failed visual inspection had failure pressures below 1200 psi; hence, these are much more likely to be paired with an unacceptable valve failure than are the cylinders which passed visual inspection. Thus if a different proportion of systems in the field would fail visual inspection than what we observed in our testing, the estimated probability may be biased. If it is reasonable to assume that more “failed” cylinders were donated than “passed” cylinders due to economic considerations and that the ratio of “failed” to “passed” is lower in the field than in our sample, then this probability estimate will be conservative.