Embed Size (px)
DESCRIPTION
Biotech Industry -2014 Report
Citation preview
Battelle/BIOState BioscienceJobs, Investmentsand Innovation 2014
Presenting Sponsor:

June 2014
Battelle does not engage in research for advertising, sales promotion, or
endorsement of our clients’ interests including raising investment capital or
recommending investments decisions, or other publicity purposes, or for
any use in litigation.
Battelle endeavors at all times to produce work of the highest quality,
consistent with our contract commitments. However, because of the
research and/or experimental nature of this work the client undertakes the
sole responsibility for the consequence of any use or misuse of, or inability
to use, any information, apparatus, process or result obtained from Battelle,
and Battelle, its employees, officers, or Trustees have no legal liability for
the accuracy, adequacy, or efficacy thereof.
Battelle/BIO State Bioscience Jobs, Investments and Innovation 2014 Page
iii
The Project Team
Battelle—Every day, the people of Battelle apply science and technology to solving what matters most. At major technology centers and national laboratories around the world, Battelle conducts research and development, designs and manufactures products, and delivers critical services for
government and commercial customers. Headquartered in Columbus, Ohio since its founding in 1929, Battelle serves the national security, health and life sciences, and energy and environmental
industries. For more information, visit www.battelle.org.
In 1991, Battelle created the Technology Partnership Practice (TPP). We focus Battelle’s broad experience to better serve economic development organizations, universities, and nonprofit technology
organizations across the U.S. For further information, please contact Mitch Horowitz at [email protected] or Ryan Helwig at [email protected].
BIO—Biotechnology Industry Organization—BIO is the world's largest trade association representing biotechnology companies, academic institutions, state biotechnology centers and related organizations across the United States and in more than 30 other nations. BIO members are involved in the research and development of innovative healthcare, agricultural, industrial and environmental
biotechnology products. BIO also produces the BIO International Convention, the world’s largest gathering of the biotechnology industry, along with industry-leading investor and partnering meetings held around the world. BIOtechNOW is BIO's blog chronicling “innovations transforming our world” and
the BIO Newsletter is the organization’s bi-weekly email newsletter.
PMP Public Affairs Consulting, Inc.—PMP— is an independent consulting firm serving the public and constituent relations needs of bioscience-related companies and associations.
Bravo Group—We help our clients win tough fights, anywhere. Our difference is an integrated, campaign-style approach, where we match smart strategies with key relationships, a wide range of
tactics, and the experience needed to get things done. We bring energy and urgency to every campaign... understanding the importance of tight timelines and winning every day... in the toughest circumstances. Winning requires understanding the challenge... making strategic choices for victory...
and using clear, compelling communications to move audiences to action. With our integrated campaign-style approach, we’re built to win. Every day. Our work in public relations, advocacy, advertising and research, when integrated into a comprehensive campaign, is unbeatable. Bravo
Group... win tough fights. thebravogroup.com

Battelle/BIO State Bioscience Jobs, Investments and Innovation 2014 Page
v
Highlights
A Robust Bioscience Industry with Strong Prospects for Growth
While not immune to the economic crisis and resulting recession, the bioscience industry weathered difficult economic times better than most industries, and is on course to regain its previous high employment levels. Indeed, the promise of bioscience-based solutions to global grand challenges in human health, food security, sustainable industrial production and environmental protection provides an optimistic picture for the biosciences as a key economic development engine in the U.S.
In this sixth biennial report, Battelle and BIO continue the tradition of reporting national and state statistics for the bioscience industry in the U.S. Returning for this edition are bioscience metrics for leading U.S. metro areas.
The latest Battelle/BIO data indicate that:
In 2012, U.S. bioscience companies employed 1.62 million personnel across more than 73,000 individual business establishments.
Over the past decade the industry has added nearly 111,000 new, high-paying jobs or 7.4 percent to its employment base.
Economic output of the bioscience industry has expanded significantly with 17 percent growth for the biosciences since 2007, nearly twice the national private sector nominal output growth.
The industry continues its tradition of creating high-wage, family-sustaining jobs with average wages 80 percent greater than the overall private sector and growing at a faster rate.
Requirements for Sustaining the Promise of this Important Industry While the prospects for bioscience-based economic growth in the U.S. remain strong, attention must be paid to maintaining the innovation ecosystem that powers the industry. Battelle/BIO does see signs of stress that are a concern for the future if not addressed. Federal funding for scientific research is critical to assuring progress in fundamental discoveries that underpin national bioscience innovation, yet bellwethers, such as NIH funding, are trending in the wrong direction. Similarly, risk capital has also fallen off in recent years, creating barriers to advancing biosciences innovation.
The threat from international competition is strong and growing. Bioscience-based economic development is the target of both first-world and developing nations, and assuring U.S. competitiveness requires:
Research funding that supports both the understanding of basic biological precepts and their ultimate translation into bioscience-related products and services.
Regulatory systems firmly grounded in science and predictable in their application.
Strong protections for intellectual property, both domestically and internationally.
Medical reimbursement and payment policies that are favorable to the development of new and innovative biomedical products.
Government trade actions that sustain and improve the “openness” of international markets for U.S. bioscience goods and services.
Federal and state tax policies and incentive systems that sustain industry competitiveness.
Education and workforce development programs providing the skilled workforce needed for today and tomorrow.
Battelle/BIO State Bioscience Jobs, Investments and Innovation 2014 Page
vi
State-by-State & Metropolitan Area Bioscience Industry Trends
The bioscience industry is well distributed across states and plays a major role as an economic driver, with many states maintaining niche strengths in specialized areas across the major industry subsectors. Highlights of state industry performance include:
Thirty three States and Puerto Rico have an employment specialization in at least one of the five bioscience subsectors in 2012. These include:
– 14 states specialized in Agricultural Feedstock & Chemicals
– 10 states and Puerto Rico specialized in Bioscience-related Distribution
– 13 states and Puerto Rico specialized in Drugs & Pharmaceuticals
– 14 states and Puerto Rico specialized in Medical Devices & Equipment
– 11 states and Puerto Rico specialized in Research, Testing and Medical Labs.
Remarkably, 17 states and Puerto Rico are specialized in at least two of the five bioscience subsectors, suggesting that there may be spillover impacts from specialization in one niche into another.
New Jersey and Puerto Rico stand out in having a specialization in four of the five bioscience subsectors.
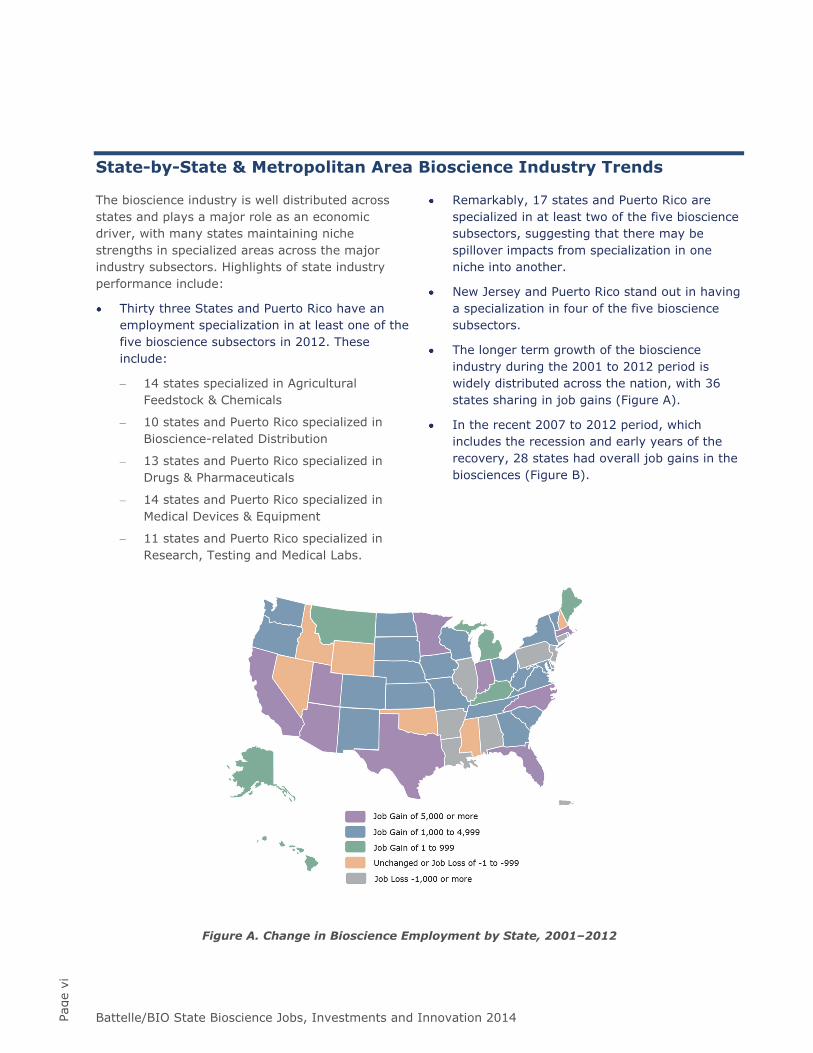
The longer term growth of the bioscience industry during the 2001 to 2012 period is widely distributed across the nation, with 36 states sharing in job gains (Figure A).
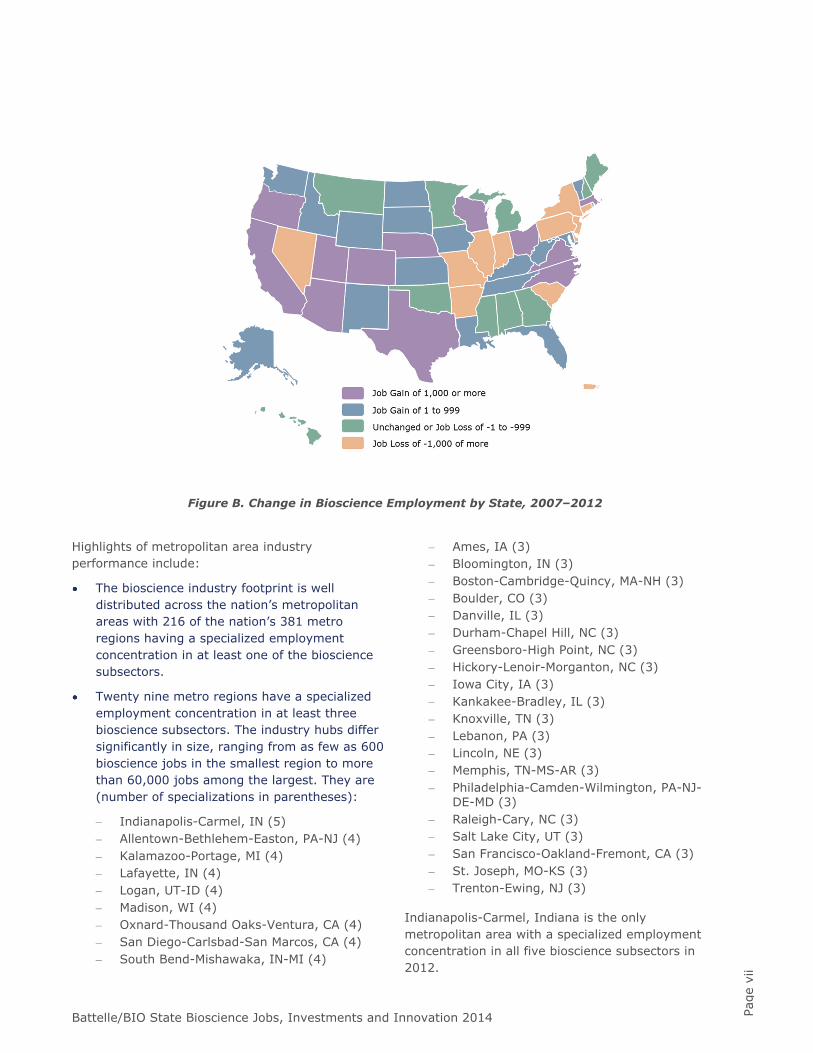
In the recent 2007 to 2012 period, which includes the recession and early years of the recovery, 28 states had overall job gains in the biosciences (Figure B).
Figure A. Change in Bioscience Employment by State, 2001–2012
Battelle/BIO State Bioscience Jobs, Investments and Innovation 2014 Page
vii
Figure B. Change in Bioscience Employment by State, 2007–2012 Highlights of metropolitan area industry performance include:
The bioscience industry footprint is well distributed across the nation’s metropolitan areas with 216 of the nation’s 381 metro regions having a specialized employment concentration in at least one of the bioscience subsectors.
Twenty nine metro regions have a specialized employment concentration in at least three bioscience subsectors. The industry hubs differ significantly in size, ranging from as few as 600 bioscience jobs in the smallest region to more than 60,000 jobs among the largest. They are (number of specializations in parentheses):
– Indianapolis-Carmel, IN (5) – Allentown-Bethlehem-Easton, PA-NJ (4) – Kalamazoo-Portage, MI (4) – Lafayette, IN (4) – Logan, UT-ID (4) – Madison, WI (4) – Oxnard-Thousand Oaks-Ventura, CA (4) – San Diego-Carlsbad-San Marcos, CA (4) – South Bend-Mishawaka, IN-MI (4)
– Ames, IA (3) – Bloomington, IN (3) – Boston-Cambridge-Quincy, MA-NH (3) – Boulder, CO (3) – Danville, IL (3) – Durham-Chapel Hill, NC (3) – Greensboro-High Point, NC (3) – Hickory-Lenoir-Morganton, NC (3) – Iowa City, IA (3) – Kankakee-Bradley, IL (3) – Knoxville, TN (3) – Lebanon, PA (3) – Lincoln, NE (3) – Memphis, TN-MS-AR (3) – Philadelphia-Camden-Wilmington, PA-NJ-
DE-MD (3) – Raleigh-Cary, NC (3) – Salt Lake City, UT (3) – San Francisco-Oakland-Fremont, CA (3) – St. Joseph, MO-KS (3) – Trenton-Ewing, NJ (3)
Indianapolis-Carmel, Indiana is the only metropolitan area with a specialized employment concentration in all five bioscience subsectors in 2012.

Battelle/BIO State Bioscience Jobs, Investments and Innovation 2014 Page
ix
Contents
Page
Highlights ........................................................................................................................ v A Robust Bioscience Industry with Strong Prospects for Growth .......................................... v Requirements for Sustaining the Promise of this Important Industry ................................... v State-by-State & Metropolitan Area Bioscience Industry Trends ......................................... vi
U.S. Bioscience Industry: The National Picture ............................................................... 1 Introduction ............................................................................................................... 1 The U.S. Bioscience Industry: Current Status and Recent Trends ........................................ 4
Bioscience Subsectors: Comparative U.S. Performance ................................................ 6 The Different Story Told by “Output” ......................................................................... 8 High Wages, High Impact ........................................................................................ 9 Broader Impact of the Bioscience Industry: Employment Multipliers ............................ 10
An Engine of Innovation – Patent Activity in Biosciences .................................................. 11 Signs of Stress in the U.S. Bioscience Innovation Ecosystem ............................................ 13
R&D Funding ....................................................................................................... 13 Capital Availability ............................................................................................... 14 International Competition and the U.S. Operating Environment................................... 16
State and Local Initiatives: Innovations in Supporting Industry Growth ............................. 17 State and Metropolitan Area Performance ..................................................................... 21
Agricultural Feedstock & Chemicals .............................................................................. 23 State Leaders & Highlights .................................................................................... 23
Drugs & Pharmaceuticals ............................................................................................ 27 State Leaders & Highlights .................................................................................... 27
Medical Devices & Equipment ...................................................................................... 31 State Leaders & Highlights .................................................................................... 31
Research, Testing, & Medical Laboratories ..................................................................... 35 State Leaders & Highlights .................................................................................... 35
Bioscience-Related Distribution .................................................................................... 39 State Leaders & Highlights .................................................................................... 39
State Bioscience Innovation Performance Metrics ......................................................... 43 Academic Bioscience R&D Expenditures ........................................................................ 43 NIH Funding ............................................................................................................. 45 Bioscience Venture Capital Investments ........................................................................ 46 Bioscience-Related Patents ......................................................................................... 48

Battelle/BIO State Bioscience Jobs, Investments and Innovation 2014 Page
x
Appendix A. Data & Methodology .................................................................................. 51 Industry Employment, Establishments, and Wages ......................................................... 51
Industry Employment Multipliers ............................................................................. 52 Additional Bioscience Performance Metrics Data .............................................................. 53
Bioscience Academic R&D Expenditures ................................................................... 53 National Institutes of Health (NIH) Funding .............................................................. 53 Bioscience Venture Capital Investments ................................................................... 53 Bioscience Patents ................................................................................................ 53
List of Tables
Page
Table 1. Employment Changes, Total Biosciences and Total Private Sector ..................................... 4 Table 2. U.S. Bioscience Establishment and Employment Data for 2012, and Percent Change,
2001–2012 and 2007–2012 .............................................................................................. 6 Table 3. Average Annual Wages for Selected Industries in the U.S., 2012 ...................................... 9 Table 4. U.S. Bioscience Venture Capital Investments by Stage, 2009-2013 .................................. 15 Table 5. States with Large and Specialized Employment in Agricultural Feedstock and Chemicals,
2012 ............................................................................................................................ 23 Table 6. Metropolitan Statistical Areas with the Largest Employment Levels in Agricultural
Feedstock and Chemicals, 2012 ....................................................................................... 24 Table 7. Metropolitan Statistical Areas with the Highest Location Quotients in Agricultural
Feedstock and Chemicals, by Size of MSA, 2012 ................................................................. 25 Table 8. States with Large and Specialized Employment in Drugs and Pharmaceuticals, 2012 ........... 28 Table 9. Metropolitan Statistical Areas with the Largest Employment Levels in Drugs and
Pharmaceuticals, 2012 .................................................................................................... 28 Table 10. Metropolitan Statistical Areas with the Highest Location Quotients in Drugs and
Pharmaceuticals, by Size of MSA, 2012 ............................................................................. 29 Table 11. States with Large and Specialized Employment in Medical Devices and Equipment,
2012 ............................................................................................................................ 31 Table 12. Metropolitan Statistical Areas with the Largest Employment Levels in Medical Devices
and Equipment, 2012 ..................................................................................................... 32 Table 13. Metropolitan Statistical Areas with the Highest Location Quotients in Medical Devices
and Equipment, by Size of MSA, 2012 ............................................................................... 33 Table 14. States with Large and Specialized Employment in Research, Testing, and Medical
Laboratories, 2012 ......................................................................................................... 35 Table 15. Metropolitan Statistical Areas with the Largest Employment Levels in Research,
Testing, and Medical Laboratories, 2012 ............................................................................ 36 Table 16. Metropolitan Statistical Areas with the Highest Location Quotients in Research,
Testing, and Medical Laboratories, by Size of MSA, 2012 ..................................................... 37 Table 17. States with Large and Specialized Employment in Bioscience-Related Distribution,
2012 ............................................................................................................................ 39 Table 18. Metropolitan Statistical Areas with the Largest Employment Levels in Bioscience-
Related Distribution, 2012 ............................................................................................... 40 Table 19. Metropolitan Statistical Areas with the Highest Location Quotients in Bioscience-
Related Distribution, by Size of MSA, 2012 ........................................................................ 41 Table 20. Leading States—Academic Bioscience R&D Expenditures and Growth, FY 2012 ................. 44
Battelle/BIO State Bioscience Jobs, Investments and Innovation 2014 Page
xi
Table 21. Leading States—Per Capita and Concentration of Academic Bioscience R&D Expenditures, FY 2012 ................................................................................................... 44
Table 22. Leading States—NIH Funding, FY 2013 ...................................................................... 45 Table 23. Leading States in Bioscience Venture Capital Investments, 2009-2013 ........................... 46 Table 24. Leading States—Bioscience Venture Capital Investments, 2009-2013 ............................. 47 Table 25. Leading States—Bioscience-Related Patents, 2009-2013 .............................................. 48 Table 26. Leading States–Bioscience-Related Patents by Class Group, 2009-2013 .......................... 49 Table A-1. The Bioscience Industry, NAICS Definition ................................................................ 52 Table A-2. Bioscience-Related Patents—Classes and Groups ....................................................... 55
List of Figures
Page
Figure A. Change in Bioscience Employment by State, 2001–2012 ................................................ vi Figure B. Change in Bioscience Employment by State, 2007–2012 ................................................ vii Figure 1. Global Grand Challenges with Bioscience Solutions ......................................................... 1 Figure 2. Trends in U.S. Bioscience and Private Sector Employment, 2001–2012 ............................. 4 Figure 3. Long-Term Employment Trend, Bioscience Industry vs. Other Technology Sectors .............. 5 Figure 4. Trends in Gross Economic Output, Bioscience Subsectors, and Total Private Sector ............. 8 Figure 5. Change in Real Average Annual Wages in the Biosciences, 2001– 2012 ........................... 10 Figure 6. U.S. Bioscience Patents by Year, 2009–2013 ............................................................... 11 Figure 7. U.S. Bioscience Patents by Class Group, 2009–2013 ..................................................... 12 Figure 8. National Institutes of Health Funding, 2009–2013 ($ Billions) ........................................ 13 Figure 9. U.S. Academic Bioscience R&D Expenditures, FY 2009–FY 2012 ..................................... 14 Figure 10. U.S. Bioscience Venture Capital Investments, 2009-2013 ($ Millions) ............................ 15 Figure 11. U.S. Bioscience Venture Capital Investments by Sector, 2009-2013 ($ Millions) .............. 16

Battelle/BIO State Bioscience Jobs, Investments and Innovation 2014 Page
1
U.S. Bioscience Industry: The National Picture
Introduction
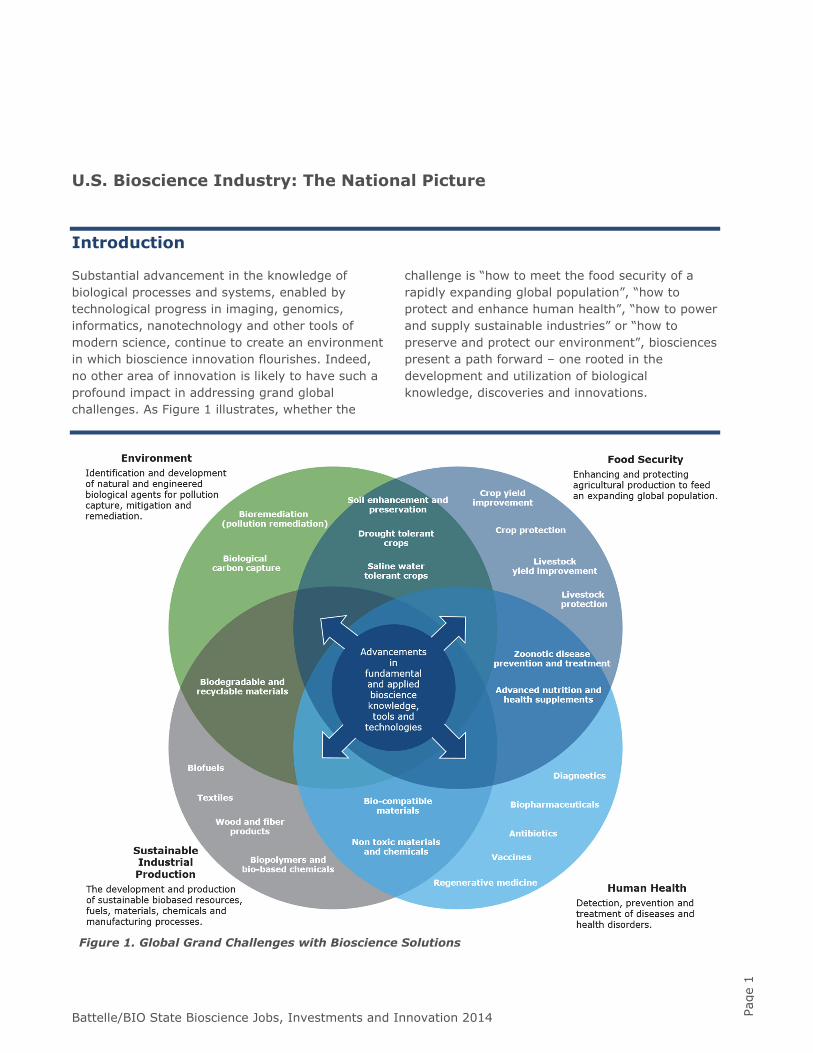
Substantial advancement in the knowledge of biological processes and systems, enabled by technological progress in imaging, genomics, informatics, nanotechnology and other tools of modern science, continue to create an environment in which bioscience innovation flourishes. Indeed, no other area of innovation is likely to have such a profound impact in addressing grand global challenges. As Figure 1 illustrates, whether the
challenge is “how to meet the food security of a rapidly expanding global population”, “how to protect and enhance human health”, “how to power and supply sustainable industries” or “how to preserve and protect our environment”, biosciences present a path forward – one rooted in the development and utilization of biological knowledge, discoveries and innovations.
Figure 1. Global Grand Challenges with Bioscience Solutions
Battelle/BIO State Bioscience Jobs, Investments and Innovation 2014 Page
2
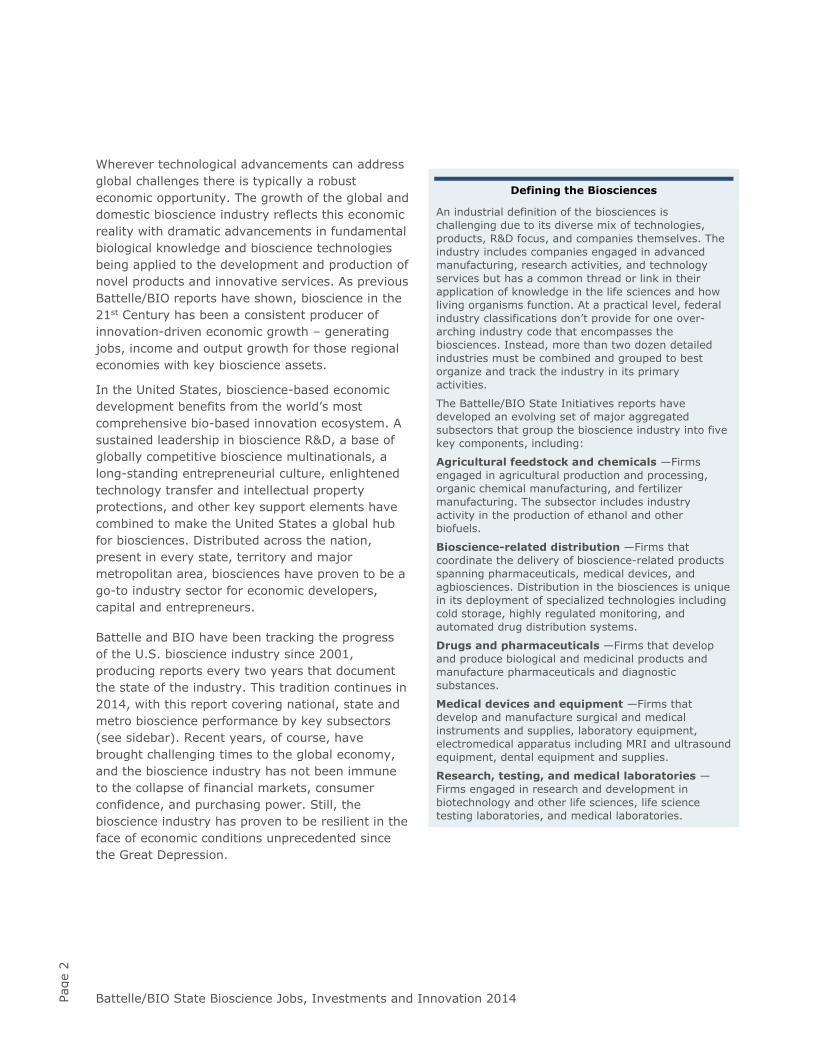
Wherever technological advancements can address global challenges there is typically a robust economic opportunity. The growth of the global and domestic bioscience industry reflects this economic reality with dramatic advancements in fundamental biological knowledge and bioscience technologies being applied to the development and production of novel products and innovative services. As previous Battelle/BIO reports have shown, bioscience in the 21st Century has been a consistent producer of innovation-driven economic growth – generating jobs, income and output growth for those regional economies with key bioscience assets.
In the United States, bioscience-based economic development benefits from the world’s most comprehensive bio-based innovation ecosystem. A sustained leadership in bioscience R&D, a base of globally competitive bioscience multinationals, a long-standing entrepreneurial culture, enlightened technology transfer and intellectual property protections, and other key support elements have combined to make the United States a global hub for biosciences. Distributed across the nation, present in every state, territory and major metropolitan area, biosciences have proven to be a go-to industry sector for economic developers, capital and entrepreneurs.
Battelle and BIO have been tracking the progress of the U.S. bioscience industry since 2001, producing reports every two years that document the state of the industry. This tradition continues in 2014, with this report covering national, state and metro bioscience performance by key subsectors (see sidebar). Recent years, of course, have brought challenging times to the global economy, and the bioscience industry has not been immune to the collapse of financial markets, consumer confidence, and purchasing power. Still, the bioscience industry has proven to be resilient in the face of economic conditions unprecedented since the Great Depression.
Defining the Biosciences
An industrial definition of the biosciences is challenging due to its diverse mix of technologies, products, R&D focus, and companies themselves. The industry includes companies engaged in advanced manufacturing, research activities, and technology services but has a common thread or link in their application of knowledge in the life sciences and how living organisms function. At a practical level, federal industry classifications don’t provide for one over-arching industry code that encompasses the biosciences. Instead, more than two dozen detailed industries must be combined and grouped to best organize and track the industry in its primary activities.
The Battelle/BIO State Initiatives reports have developed an evolving set of major aggregated subsectors that group the bioscience industry into five key components, including:
Agricultural feedstock and chemicals —Firms engaged in agricultural production and processing, organic chemical manufacturing, and fertilizer manufacturing. The subsector includes industry activity in the production of ethanol and other biofuels.
Bioscience-related distribution —Firms that coordinate the delivery of bioscience-related products spanning pharmaceuticals, medical devices, and agbiosciences. Distribution in the biosciences is unique in its deployment of specialized technologies including cold storage, highly regulated monitoring, and automated drug distribution systems.
Drugs and pharmaceuticals —Firms that develop and produce biological and medicinal products and manufacture pharmaceuticals and diagnostic substances.
Medical devices and equipment —Firms that develop and manufacture surgical and medical instruments and supplies, laboratory equipment, electromedical apparatus including MRI and ultrasound equipment, dental equipment and supplies.
Research, testing, and medical laboratories —Firms engaged in research and development in biotechnology and other life sciences, life science testing laboratories, and medical laboratories.
Battelle/BIO State Bioscience Jobs, Investments and Innovation 2014 Page
3
As both the domestic and global economies continue to rise in the current post-recession period, the bioscience industry remains of key strategic importance to the economic development of the U.S. and its individual states, territories and metropolitan areas. Bioscience infrastructure and intellectual capital assets in the U.S. remain world-leading, and federal government and private sector funding of R&D continue to presage bioscience innovation and the commercialization of new bioscience products and technologies. Ups and downs in the global and domestic economy, of course, impact the industry, but the fundamental promise of the bioscience industry as a powerful platform for economic and societal progress continues unabated.
Industry Employment Data and Analysis
To measure the size, relative concentration, and overall employment impacts of the biosciences in the United States, Battelle tabulated employment, establishment, and wage data for each state, the District of Columbia, Puerto Rico, and every metropolitan statistical area (MSA). The data were calculated for each of the five bioscience industry subsectors for 2001 through 2012 (though for MSA data just 2012 data are included), the most current, detailed, and comparable annual data available.
The Bureau of Labor Statistics (BLS) Quarterly Census of Employment and Wages (QCEW) program data were used as the primary data source for this industry analysis. The QCEW provides the most accurate employment data for detailed industries at the sub-national level. The data represent a virtual “census” of workers covered under the Unemployment Insurance system, as reported by employers.
Metropolitan area data that measure employment and the relative employment concentration in this analysis are tabulated and presented in groups by the overall private sector employment level of the MSA. Each MSA is classified as either large, medium, or small with respect to private sector employment. A “large” MSA has total regional employment at or above 250,000. A “medium” MSA has total employment greater than or equal to 75,000, but less than 250,000. A “small” MSA has employment less than 75,000. By presenting key employment metrics among metro areas of a similar overall size, the data provide a more useful comparison.
For more information on the industry definition and data used in this employment analysis, please see the Data and Methodology appendix.
Battelle/BIO State Bioscience Jobs, Investments and Innovation 2014 Page
4
The U.S. Bioscience Industry: Current Status and Recent Trends
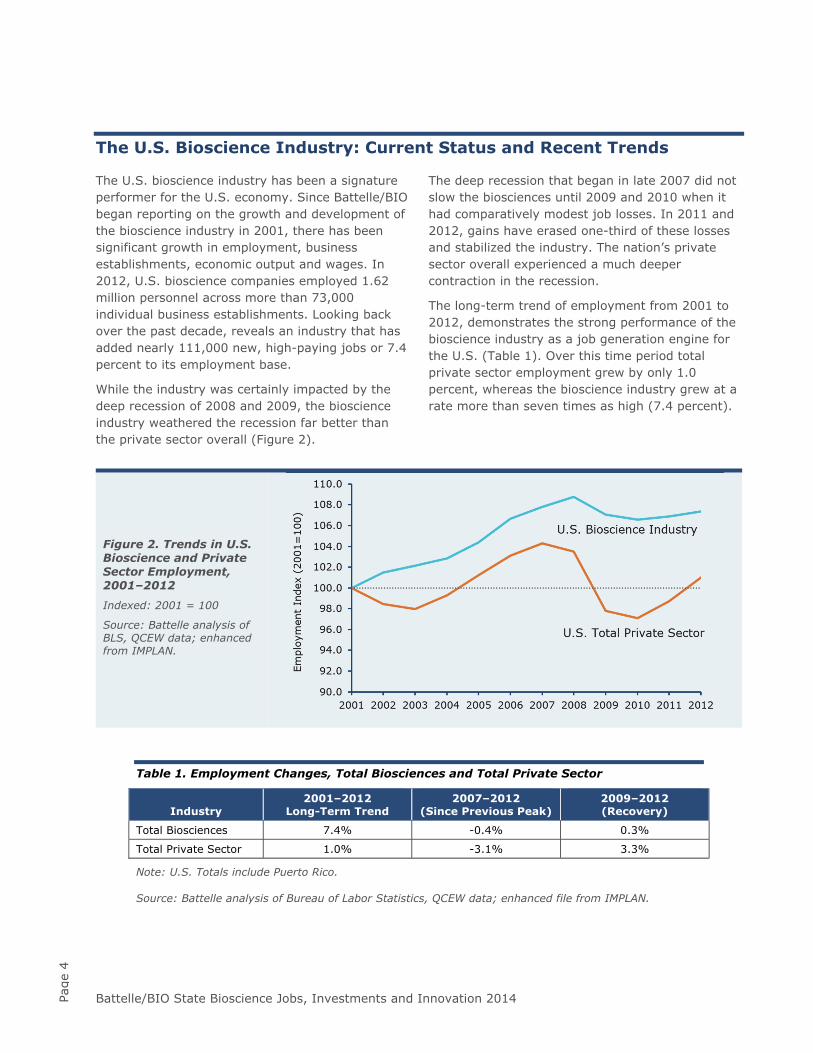
The U.S. bioscience industry has been a signature performer for the U.S. economy. Since Battelle/BIO began reporting on the growth and development of the bioscience industry in 2001, there has been significant growth in employment, business establishments, economic output and wages. In 2012, U.S. bioscience companies employed 1.62 million personnel across more than 73,000 individual business establishments. Looking back over the past decade, reveals an industry that has added nearly 111,000 new, high-paying jobs or 7.4 percent to its employment base.
While the industry was certainly impacted by the deep recession of 2008 and 2009, the bioscience industry weathered the recession far better than the private sector overall (Figure 2).
The deep recession that began in late 2007 did not slow the biosciences until 2009 and 2010 when it had comparatively modest job losses. In 2011 and 2012, gains have erased one-third of these losses and stabilized the industry. The nation’s private sector overall experienced a much deeper contraction in the recession.
The long-term trend of employment from 2001 to 2012, demonstrates the strong performance of the bioscience industry as a job generation engine for the U.S. (Table 1). Over this time period total private sector employment grew by only 1.0 percent, whereas the bioscience industry grew at a rate more than seven times as high (7.4 percent).
Figure 2. Trends in U.S. Bioscience and Private Sector Employment, 2001–2012
Indexed: 2001 = 100
Source: Battelle analysis of BLS, QCEW data; enhanced from IMPLAN.
Table 1. Employment Changes, Total Biosciences and Total Private Sector
Industry 2001–2012
Long-Term Trend 2007–2012
(Since Previous Peak) 2009–2012 (Recovery)
Total Biosciences 7.4% -0.4% 0.3%
Total Private Sector 1.0% -3.1% 3.3%
Note: U.S. Totals include Puerto Rico.
Source: Battelle analysis of Bureau of Labor Statistics, QCEW data; enhanced file from IMPLAN.
Battelle/BIO State Bioscience Jobs, Investments and Innovation 2014 Page
5
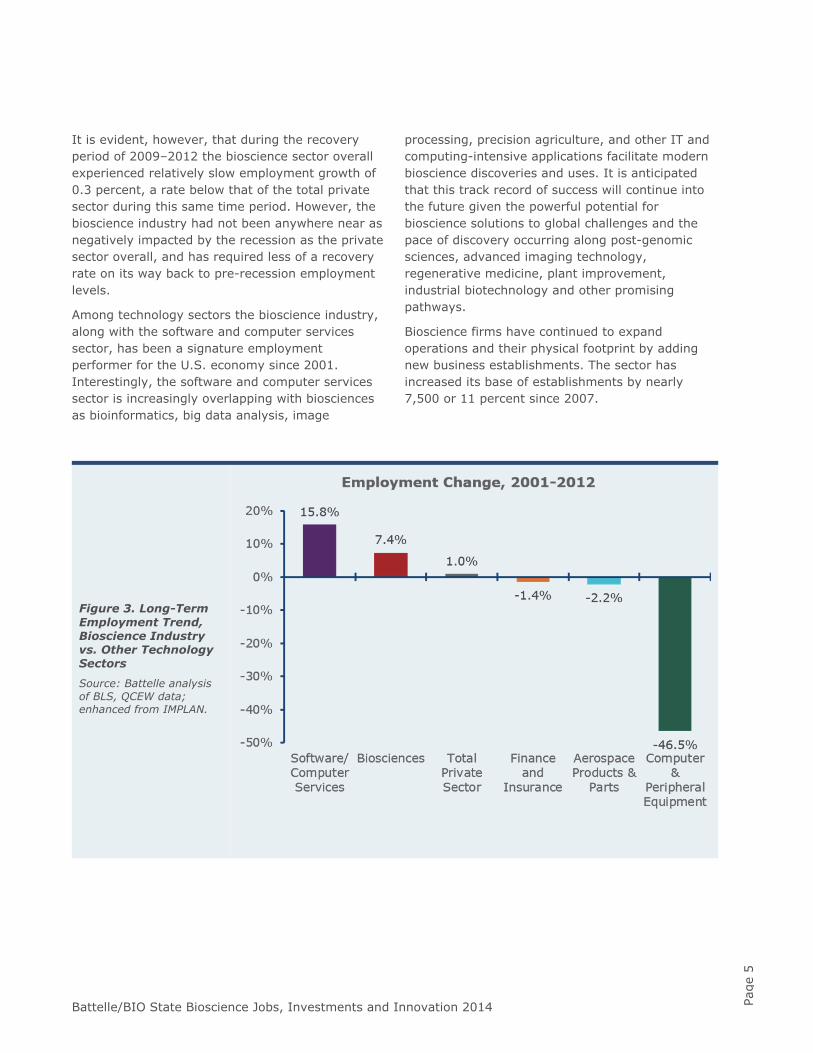
It is evident, however, that during the recovery period of 2009–2012 the bioscience sector overall experienced relatively slow employment growth of 0.3 percent, a rate below that of the total private sector during this same time period. However, the bioscience industry had not been anywhere near as negatively impacted by the recession as the private sector overall, and has required less of a recovery rate on its way back to pre-recession employment levels.
Among technology sectors the bioscience industry, along with the software and computer services sector, has been a signature employment performer for the U.S. economy since 2001. Interestingly, the software and computer services sector is increasingly overlapping with biosciences as bioinformatics, big data analysis, image
processing, precision agriculture, and other IT and computing-intensive applications facilitate modern bioscience discoveries and uses. It is anticipated that this track record of success will continue into the future given the powerful potential for bioscience solutions to global challenges and the pace of discovery occurring along post-genomic sciences, advanced imaging technology, regenerative medicine, plant improvement, industrial biotechnology and other promising pathways.
Bioscience firms have continued to expand operations and their physical footprint by adding new business establishments. The sector has increased its base of establishments by nearly 7,500 or 11 percent since 2007.
Figure 3. Long-Term Employment Trend, Bioscience Industry vs. Other Technology Sectors
Source: Battelle analysis of BLS, QCEW data; enhanced from IMPLAN.
Battelle/BIO State Bioscience Jobs, Investments and Innovation 2014 Page
6
Bioscience Subsectors: Comparative U.S. Performance
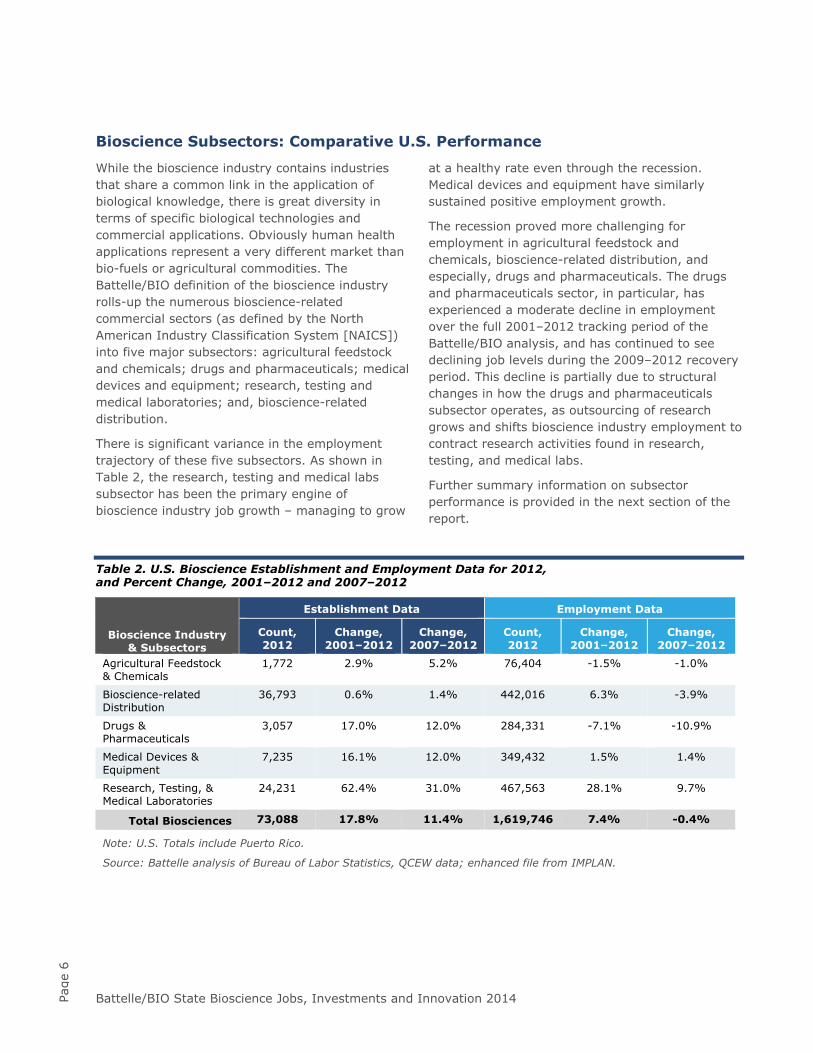
While the bioscience industry contains industries that share a common link in the application of biological knowledge, there is great diversity in terms of specific biological technologies and commercial applications. Obviously human health applications represent a very different market than bio-fuels or agricultural commodities. The Battelle/BIO definition of the bioscience industry rolls-up the numerous bioscience-related commercial sectors (as defined by the North American Industry Classification System [NAICS]) into five major subsectors: agricultural feedstock and chemicals; drugs and pharmaceuticals; medical devices and equipment; research, testing and medical laboratories; and, bioscience-related distribution.
There is significant variance in the employment trajectory of these five subsectors. As shown in Table 2, the research, testing and medical labs subsector has been the primary engine of bioscience industry job growth – managing to grow
at a healthy rate even through the recession. Medical devices and equipment have similarly sustained positive employment growth.
The recession proved more challenging for employment in agricultural feedstock and chemicals, bioscience-related distribution, and especially, drugs and pharmaceuticals. The drugs and pharmaceuticals sector, in particular, has experienced a moderate decline in employment over the full 2001–2012 tracking period of the Battelle/BIO analysis, and has continued to see declining job levels during the 2009–2012 recovery period. This decline is partially due to structural changes in how the drugs and pharmaceuticals subsector operates, as outsourcing of research grows and shifts bioscience industry employment to contract research activities found in research, testing, and medical labs.
Further summary information on subsector performance is provided in the next section of the report.
Table 2. U.S. Bioscience Establishment and Employment Data for 2012, and Percent Change, 2001–2012 and 2007–2012
Bioscience Industry & Subsectors
Establishment Data Employment Data
Count, 2012
Change, 2001–2012
Change, 2007–2012
Count, 2012
Change, 2001–2012
Change, 2007–2012
Agricultural Feedstock & Chemicals
1,772 2.9% 5.2% 76,404 -1.5% -1.0%
Bioscience-related Distribution
36,793 0.6% 1.4% 442,016 6.3% -3.9%
Drugs & Pharmaceuticals
3,057 17.0% 12.0% 284,331 -7.1% -10.9%
Medical Devices & Equipment
7,235 16.1% 12.0% 349,432 1.5% 1.4%
Research, Testing, & Medical Laboratories
24,231 62.4% 31.0% 467,563 28.1% 9.7%
Total Biosciences 73,088 17.8% 11.4% 1,619,746 7.4% -0.4%
Note: U.S. Totals include Puerto Rico.
Source: Battelle analysis of Bureau of Labor Statistics, QCEW data; enhanced file from IMPLAN.
Battelle/BIO State Bioscience Jobs, Investments and Innovation 2014 Page
7
Commentary on Bioscience Subsector Performance
Among the major subsectors, research, testing, and medical labs is not only the largest of the five, but also the fastest growing. The subsector employs more than 467,000 or nearly one in three U.S. bioscience workers and has recorded an impressive set of steady job gains over the full 11-year period since 2001. Over more than a decade, the subsector has increased employment by 28 percent with an impressive annual average growth rate of 2.3 percent per year. Growth in research, testing, and medical labs has continued in recent years despite the recession with a 9.7 percent growth rate since 2007 when the economy peaked.
Bioscience-related distribution companies stand just behind research, testing, and medical labs with just over 442,000 jobs in 2012. This employee total has grown by 6.3 percent overall since 2001 though most of those job gains were during the previous economic expansion that ended in 2007. Since 2007, the subsector has shed employment in 4 of 5 years and is down 3.9 percent. Recent signs of stabilization, however, could signal an impending rebound as the subsector grew slightly in 2011 (up 0.6 percent) and had a slight decline in 2012 (just 0.3 percent). In 2012, employment in bioscience-related distribution accounted for 27 percent of all national bioscience jobs.
The U.S. medical devices and equipment subsector employed more than 349,000 in 2012 or 22 percent of all bioscience employment. Medical device firms have increased overall employment in 6 of the last 8 years and since losing jobs in 2009 and 2010 amidst the recession, have increased employment for two consecutive years. Since 2007, subsector jobs are up 1.4 percent. Going back more than a decade, the medical device subsector has been relatively stable with overall employment up 1.5 percent since 2001.
Drugs and pharmaceuticals has struggled in recent years with five consecutive years of job losses. With the onset of the recession in 2008, the subsector began to steadily lose jobs, and since its recent employment peak in 2007, is down 10.9 percent. Since 2007, employment declines have averaged 2.3 percent in drugs and pharmaceuticals but in 2012 the subsector stabilized, declining by just 0.3 percent. In 2012, the subsector accounted for 17 percent of the nation’s bioscience jobs.
Agricultural feedstock and chemicals, with more than 76,000 jobs in 2012, is smallest among the major subsectors of the biosciences (5 percent of the biosciences). Employment in the subsector has remained relatively stable over the decade (down just 1.5 percent since 2001) and since the economic peak in 2007 (down 1 percent). While the trend in the subsector has been relatively flat overall since 2007, 2012 saw agricultural bioscience firms increase employment. The 2012 job gain of 2.3 percent, the first growth in several years, has offset some of the job loss that occurred during the recession.
Battelle/BIO State Bioscience Jobs, Investments and Innovation 2014 Page
8
The Different Story Told by “Output”
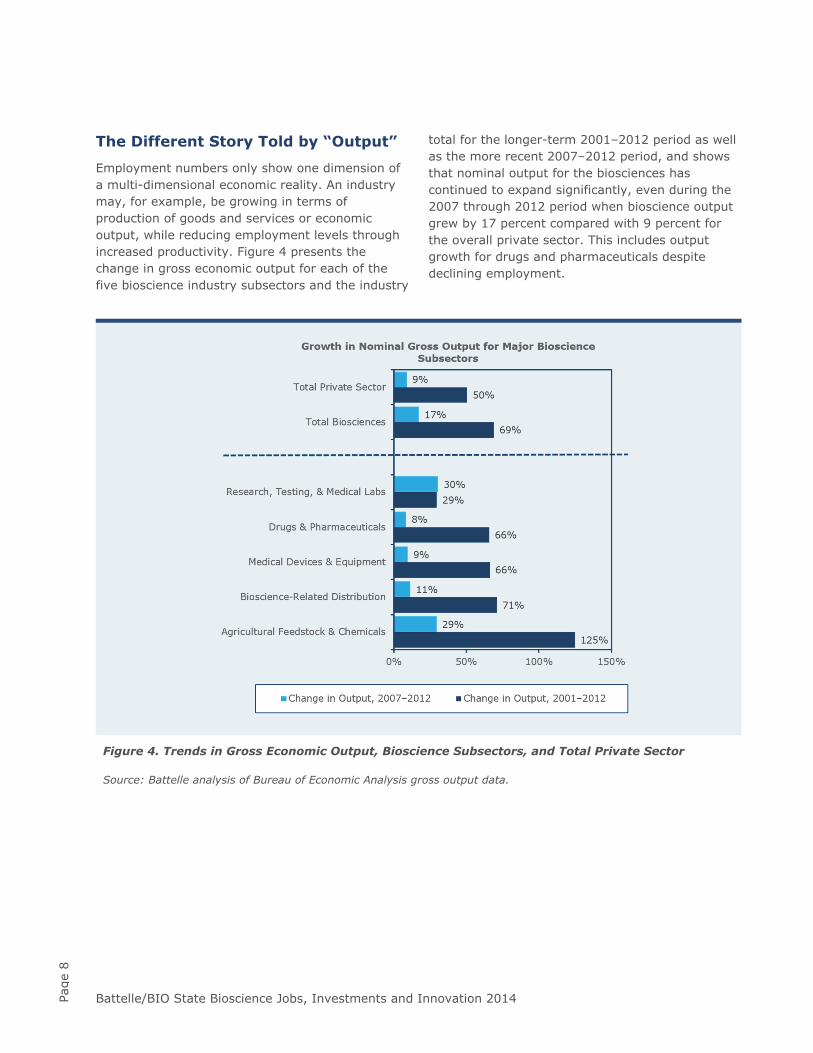
Employment numbers only show one dimension of a multi-dimensional economic reality. An industry may, for example, be growing in terms of production of goods and services or economic output, while reducing employment levels through increased productivity. Figure 4 presents the change in gross economic output for each of the five bioscience industry subsectors and the industry
total for the longer-term 2001–2012 period as well as the more recent 2007–2012 period, and shows that nominal output for the biosciences has continued to expand significantly, even during the 2007 through 2012 period when bioscience output grew by 17 percent compared with 9 percent for the overall private sector. This includes output growth for drugs and pharmaceuticals despite declining employment.
Figure 4. Trends in Gross Economic Output, Bioscience Subsectors, and Total Private Sector
Source: Battelle analysis of Bureau of Economic Analysis gross output data.
Battelle/BIO State Bioscience Jobs, Investments and Innovation 2014 Page
9
High Wages, High Impact
The importance of the bioscience industry as an economic engine for the U.S. is further illustrated in reference to wage levels. While the total level of employment in the nation is an important metric, all jobs are not created equal when it comes to wages and salaries above the national average. The bioscience sector is particularly notable for being a source of high-wage jobs.
The bioscience industry employs a highly skilled and well-educated workforce across a wide array of occupations that include laboratory technicians, engineers, scientists, IT professionals, and advanced production workers. The demand for these skilled professionals driving innovation and deploying advanced technologies requires paying competitive wages. In addition, the high value-adding nature of the biosciences translates into higher wages commensurate with these activities. The biosciences, therefore, have a workforce earning a substantial wage premium relative to workers in other industries.
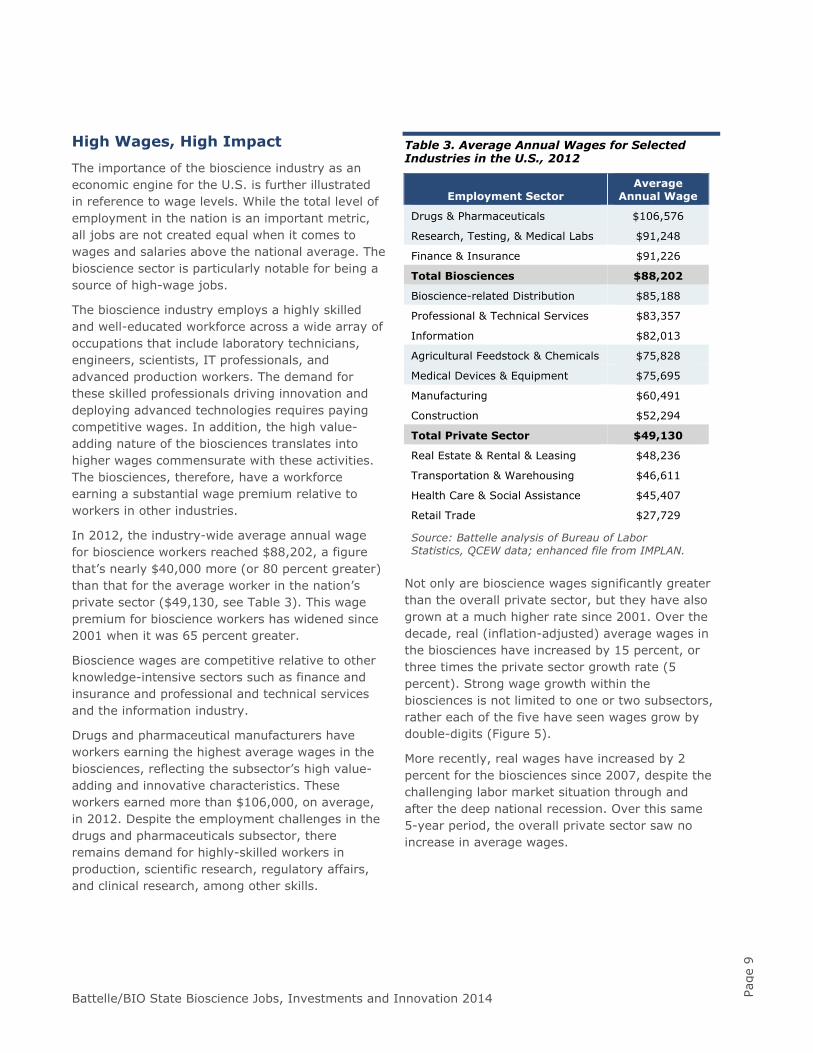
In 2012, the industry-wide average annual wage for bioscience workers reached $88,202, a figure that’s nearly $40,000 more (or 80 percent greater) than that for the average worker in the nation’s private sector ($49,130, see Table 3). This wage premium for bioscience workers has widened since 2001 when it was 65 percent greater.
Bioscience wages are competitive relative to other knowledge-intensive sectors such as finance and insurance and professional and technical services and the information industry.
Drugs and pharmaceutical manufacturers have workers earning the highest average wages in the biosciences, reflecting the subsector’s high value-adding and innovative characteristics. These workers earned more than $106,000, on average, in 2012. Despite the employment challenges in the drugs and pharmaceuticals subsector, there remains demand for highly-skilled workers in production, scientific research, regulatory affairs, and clinical research, among other skills.
Table 3. Average Annual Wages for Selected Industries in the U.S., 2012
Employment Sector Average
Annual Wage
Drugs & Pharmaceuticals $106,576
Research, Testing, & Medical Labs $91,248
Finance & Insurance $91,226
Total Biosciences $88,202
Bioscience-related Distribution $85,188
Professional & Technical Services $83,357
Information $82,013
Agricultural Feedstock & Chemicals $75,828
Medical Devices & Equipment $75,695
Manufacturing $60,491
Construction $52,294
Total Private Sector $49,130
Real Estate & Rental & Leasing $48,236
Transportation & Warehousing $46,611
Health Care & Social Assistance $45,407
Retail Trade $27,729
Source: Battelle analysis of Bureau of Labor Statistics, QCEW data; enhanced file from IMPLAN.
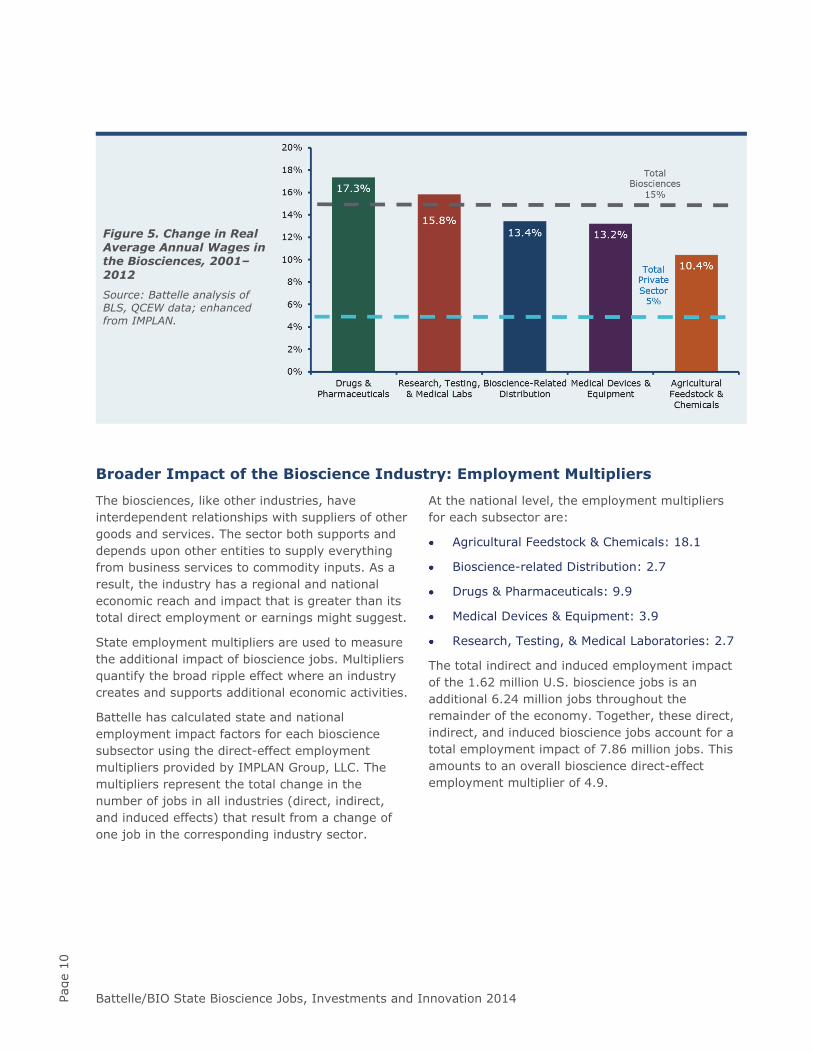
Not only are bioscience wages significantly greater than the overall private sector, but they have also grown at a much higher rate since 2001. Over the decade, real (inflation-adjusted) average wages in the biosciences have increased by 15 percent, or three times the private sector growth rate (5 percent). Strong wage growth within the biosciences is not limited to one or two subsectors, rather each of the five have seen wages grow by double-digits (Figure 5).
More recently, real wages have increased by 2 percent for the biosciences since 2007, despite the challenging labor market situation through and after the deep national recession. Over this same 5-year period, the overall private sector saw no increase in average wages.
Battelle/BIO State Bioscience Jobs, Investments and Innovation 2014 Page
10
Figure 5. Change in Real Average Annual Wages in the Biosciences, 2001– 2012
Source: Battelle analysis of BLS, QCEW data; enhanced from IMPLAN.
Broader Impact of the Bioscience Industry: Employment Multipliers
The biosciences, like other industries, have interdependent relationships with suppliers of other goods and services. The sector both supports and depends upon other entities to supply everything from business services to commodity inputs. As a result, the industry has a regional and national economic reach and impact that is greater than its total direct employment or earnings might suggest.
State employment multipliers are used to measure the additional impact of bioscience jobs. Multipliers quantify the broad ripple effect where an industry creates and supports additional economic activities.
Battelle has calculated state and national employment impact factors for each bioscience subsector using the direct-effect employment multipliers provided by IMPLAN Group, LLC. The multipliers represent the total change in the number of jobs in all industries (direct, indirect, and induced effects) that result from a change of one job in the corresponding industry sector.
At the national level, the employment multipliers for each subsector are:
Agricultural Feedstock & Chemicals: 18.1
Bioscience-related Distribution: 2.7
Drugs & Pharmaceuticals: 9.9
Medical Devices & Equipment: 3.9
Research, Testing, & Medical Laboratories: 2.7
The total indirect and induced employment impact of the 1.62 million U.S. bioscience jobs is an additional 6.24 million jobs throughout the remainder of the economy. Together, these direct, indirect, and induced bioscience jobs account for a total employment impact of 7.86 million jobs. This amounts to an overall bioscience direct-effect employment multiplier of 4.9.
Battelle/BIO State Bioscience Jobs, Investments and Innovation 2014 Page
11
An Engine of Innovation – Patent Activity in Biosciences
The innovating nature of the U.S. bioscience industry has contributed to growth in employment, wages, and productivity. Innovation is “the act or process of introducing new ideas, devices, or methods.”1 When the innovation process leads to a tangible invention, the U.S. and global community has a generally accepted standard whereby a novel invention may be protected via patenting. The generation of patents in advanced manufacturing sectors like the biosciences is particularly important given the intensity of R&D activity and capital expenditures typically required to advance bioscience innovations. In turn, data regarding the generation of bioscience patents serves as a robust metric for “bioscience industry innovation.”
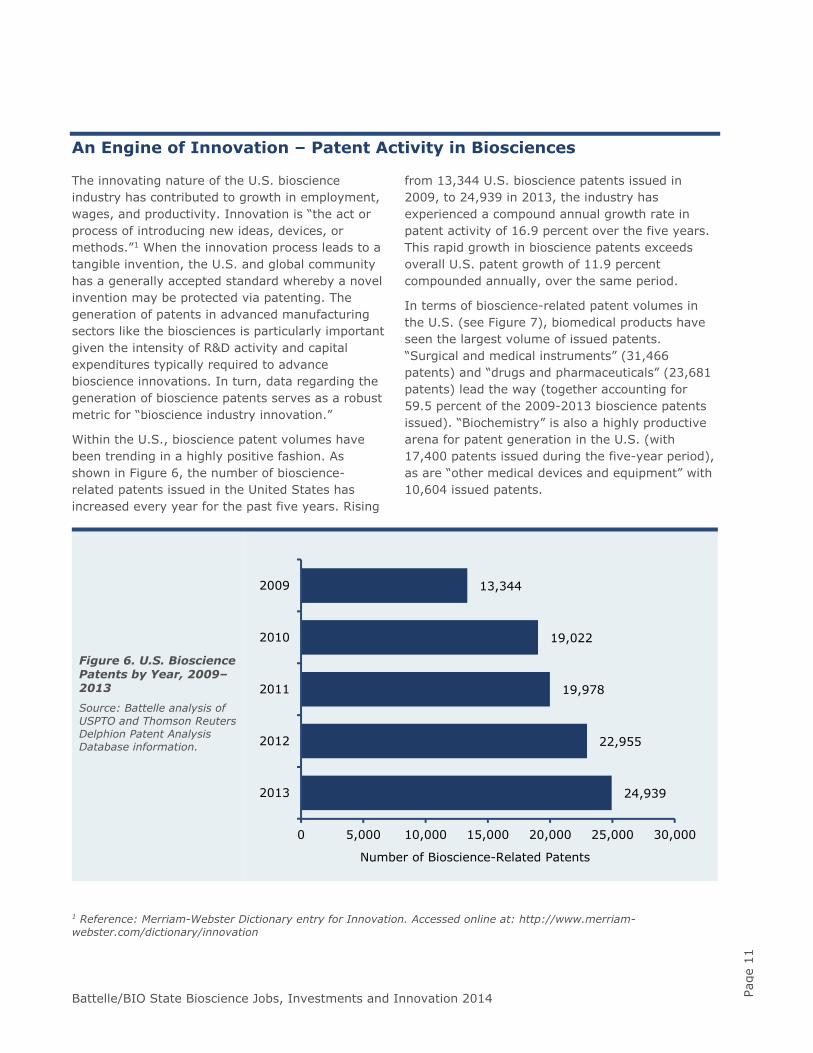
Within the U.S., bioscience patent volumes have been trending in a highly positive fashion. As shown in Figure 6, the number of bioscience-related patents issued in the United States has increased every year for the past five years. Rising
from 13,344 U.S. bioscience patents issued in 2009, to 24,939 in 2013, the industry has experienced a compound annual growth rate in patent activity of 16.9 percent over the five years. This rapid growth in bioscience patents exceeds overall U.S. patent growth of 11.9 percent compounded annually, over the same period.
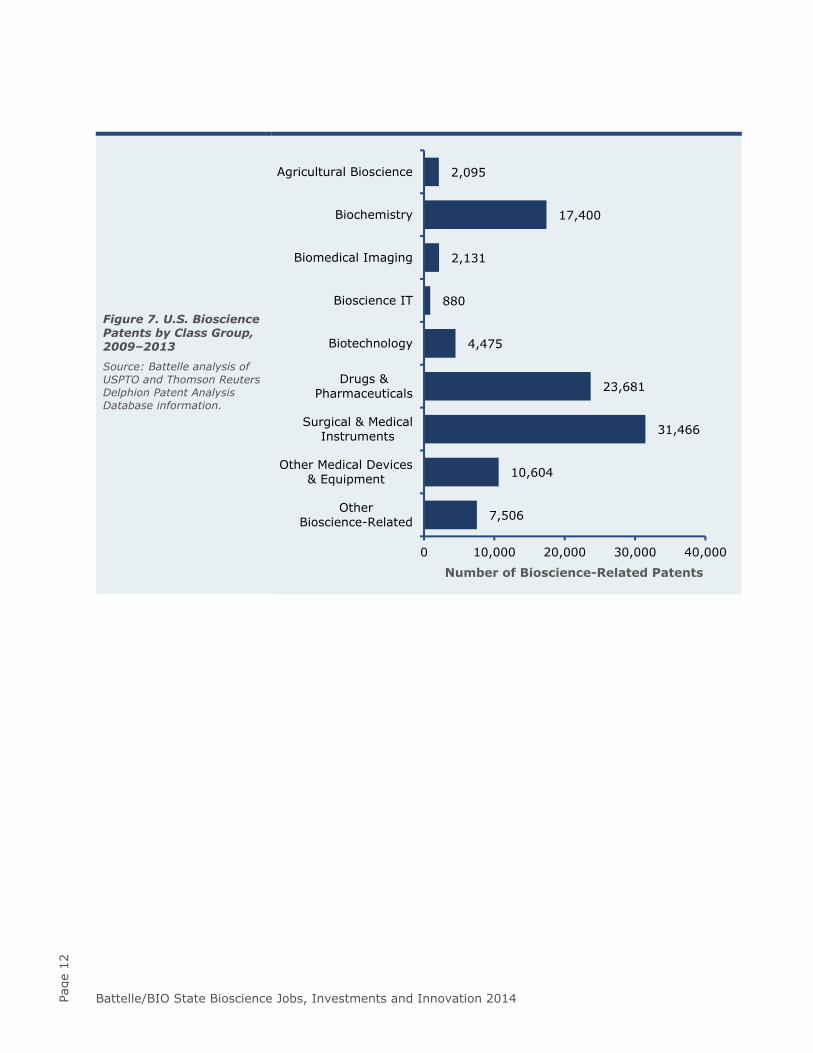
In terms of bioscience-related patent volumes in the U.S. (see Figure 7), biomedical products have seen the largest volume of issued patents. “Surgical and medical instruments” (31,466 patents) and “drugs and pharmaceuticals” (23,681 patents) lead the way (together accounting for 59.5 percent of the 2009-2013 bioscience patents issued). “Biochemistry” is also a highly productive arena for patent generation in the U.S. (with 17,400 patents issued during the five-year period), as are “other medical devices and equipment” with 10,604 issued patents.
Figure 6. U.S. Bioscience Patents by Year, 2009–2013
Source: Battelle analysis of USPTO and Thomson Reuters Delphion Patent Analysis Database information.
1 Reference: Merriam-Webster Dictionary entry for Innovation. Accessed online at: http://www.merriam-webster.com/dictionary/innovation
24,939
22,955
19,978
19,022
13,344
0 5,000 10,000 15,000 20,000 25,000 30,000
2013
2012
2011
2010
2009
Number of Bioscience-Related Patents
Battelle/BIO State Bioscience Jobs, Investments and Innovation 2014 Page
12
Figure 7. U.S. Bioscience Patents by Class Group, 2009–2013
Source: Battelle analysis of USPTO and Thomson Reuters Delphion Patent Analysis Database information.
7,506
10,604
31,466
23,681
4,475
880
2,131
17,400
2,095
0 10,000 20,000 30,000 40,000
OtherBioscience-Related
Other Medical Devices& Equipment
Surgical & MedicalInstruments
Drugs &Pharmaceuticals
Biotechnology
Bioscience IT
Biomedical Imaging
Biochemistry
Agricultural Bioscience
Number of Bioscience-Related Patents
Battelle/BIO State Bioscience Jobs, Investments and Innovation 2014 Page
13
Signs of Stress in the U.S. Bioscience Innovation Ecosystem
While the bioscience industry has excelled as an engine of economic development for the U.S., its ongoing success cannot be taken for granted. Certainly, from a scientific standpoint there should be little doubt that modern biosciences will continue to generate high impact innovations and new technologies for commercialization – the issue is how much of that commercialization and associated economic growth will take place in the United States? Technology-based economic development requires the efficient operation of a complex innovation ecosystem – an ecosystem with robust R&D funding, predictable access to early-stage and expansion capital, a supply of well-trained and productive workers, strong intellectual property protections, and a favorable regulatory environment that facilitates, rather than hinders, business development. Overall, the U.S. has enjoyed comparatively healthy bioscience commercialization conditions, but there are cracks evident in the foundations that have supported growth of this critically important industry.
R&D Funding
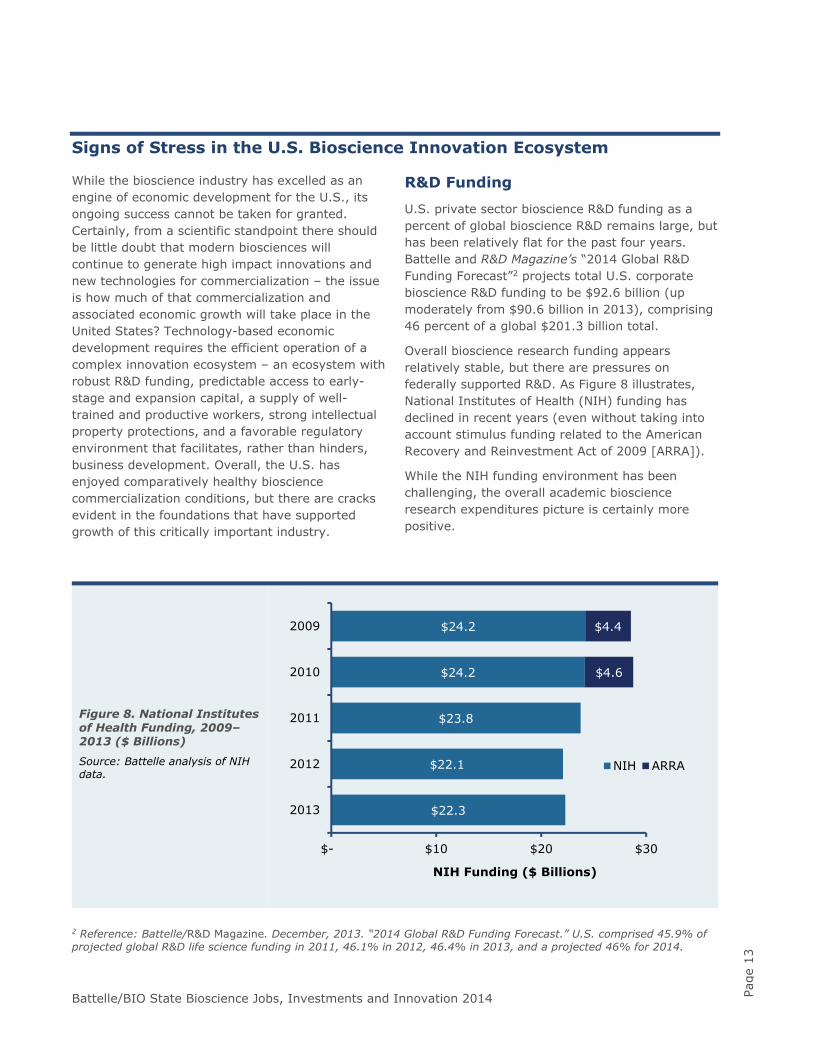
U.S. private sector bioscience R&D funding as a percent of global bioscience R&D remains large, but has been relatively flat for the past four years. Battelle and R&D Magazine’s “2014 Global R&D Funding Forecast”2 projects total U.S. corporate bioscience R&D funding to be $92.6 billion (up moderately from $90.6 billion in 2013), comprising 46 percent of a global $201.3 billion total.
Overall bioscience research funding appears relatively stable, but there are pressures on federally supported R&D. As Figure 8 illustrates, National Institutes of Health (NIH) funding has declined in recent years (even without taking into account stimulus funding related to the American Recovery and Reinvestment Act of 2009 [ARRA]).
While the NIH funding environment has been challenging, the overall academic bioscience research expenditures picture is certainly more positive.
Figure 8. National Institutes of Health Funding, 2009–2013 ($ Billions)
Source: Battelle analysis of NIH data.
2 Reference: Battelle/R&D Magazine. December, 2013. “2014 Global R&D Funding Forecast.” U.S. comprised 45.9% of projected global R&D life science funding in 2011, 46.1% in 2012, 46.4% in 2013, and a projected 46% for 2014.
$22.3
$22.1
$23.8
$24.2
$24.2
$4.6
$4.4
$- $10 $20 $30
2013
2012
2011
2010
2009
NIH Funding ($ Billions)
NIH ARRA
Battelle/BIO State Bioscience Jobs, Investments and Innovation 2014 Page
14
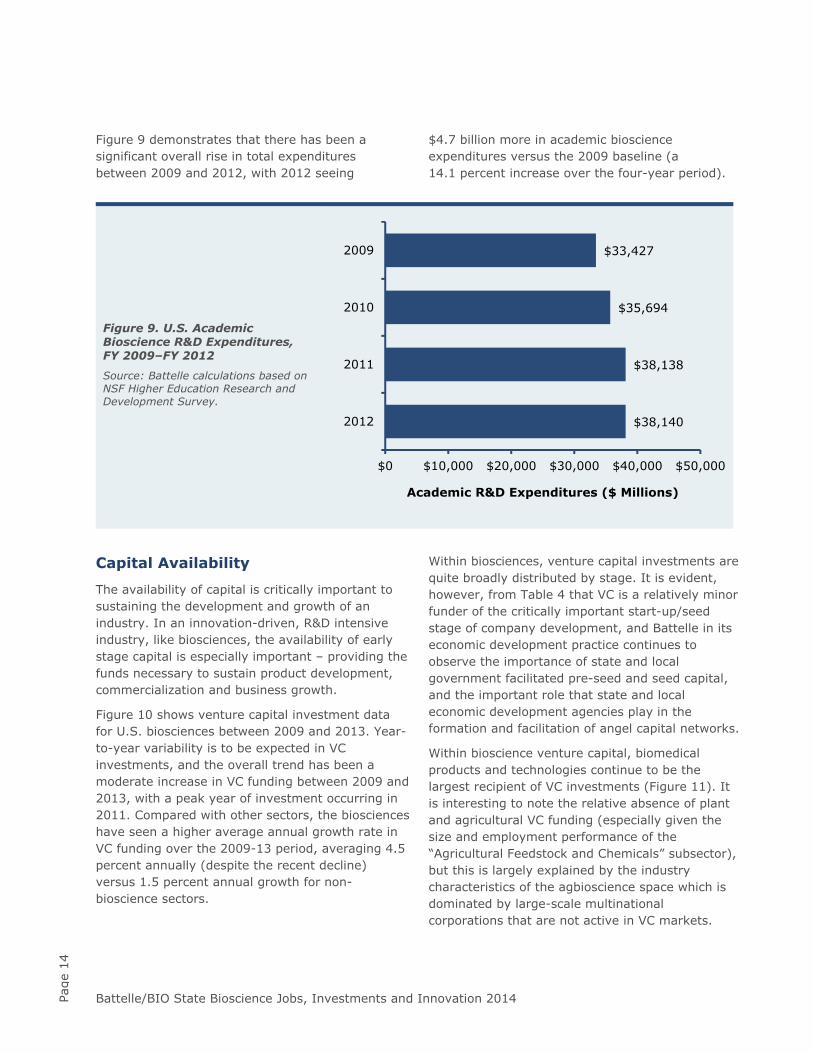
Figure 9 demonstrates that there has been a significant overall rise in total expenditures between 2009 and 2012, with 2012 seeing
$4.7 billion more in academic bioscience expenditures versus the 2009 baseline (a 14.1 percent increase over the four-year period).
Figure 9. U.S. Academic Bioscience R&D Expenditures, FY 2009–FY 2012
Source: Battelle calculations based on NSF Higher Education Research and Development Survey.
Capital Availability
The availability of capital is critically important to sustaining the development and growth of an industry. In an innovation-driven, R&D intensive industry, like biosciences, the availability of early stage capital is especially important – providing the funds necessary to sustain product development, commercialization and business growth.
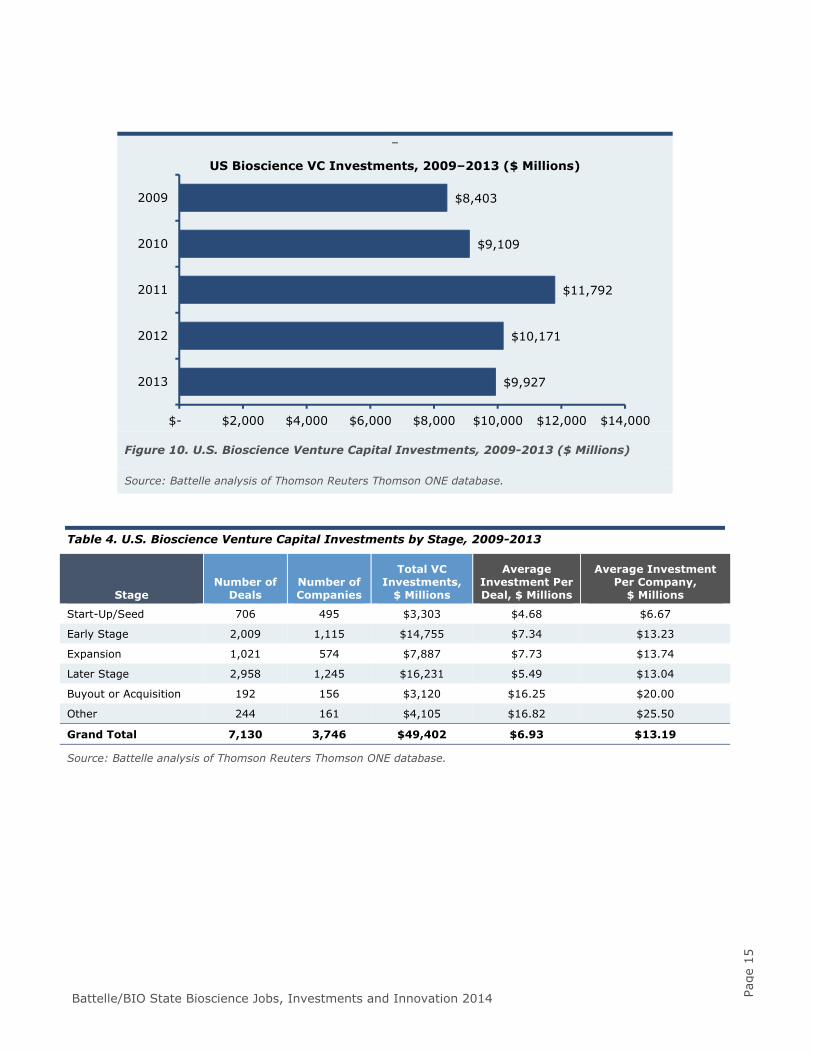
Figure 10 shows venture capital investment data for U.S. biosciences between 2009 and 2013. Year-to-year variability is to be expected in VC investments, and the overall trend has been a moderate increase in VC funding between 2009 and 2013, with a peak year of investment occurring in 2011. Compared with other sectors, the biosciences have seen a higher average annual growth rate in VC funding over the 2009-13 period, averaging 4.5 percent annually (despite the recent decline) versus 1.5 percent annual growth for non-bioscience sectors.
Within biosciences, venture capital investments are quite broadly distributed by stage. It is evident, however, from Table 4 that VC is a relatively minor funder of the critically important start-up/seed stage of company development, and Battelle in its economic development practice continues to observe the importance of state and local government facilitated pre-seed and seed capital, and the important role that state and local economic development agencies play in the formation and facilitation of angel capital networks.
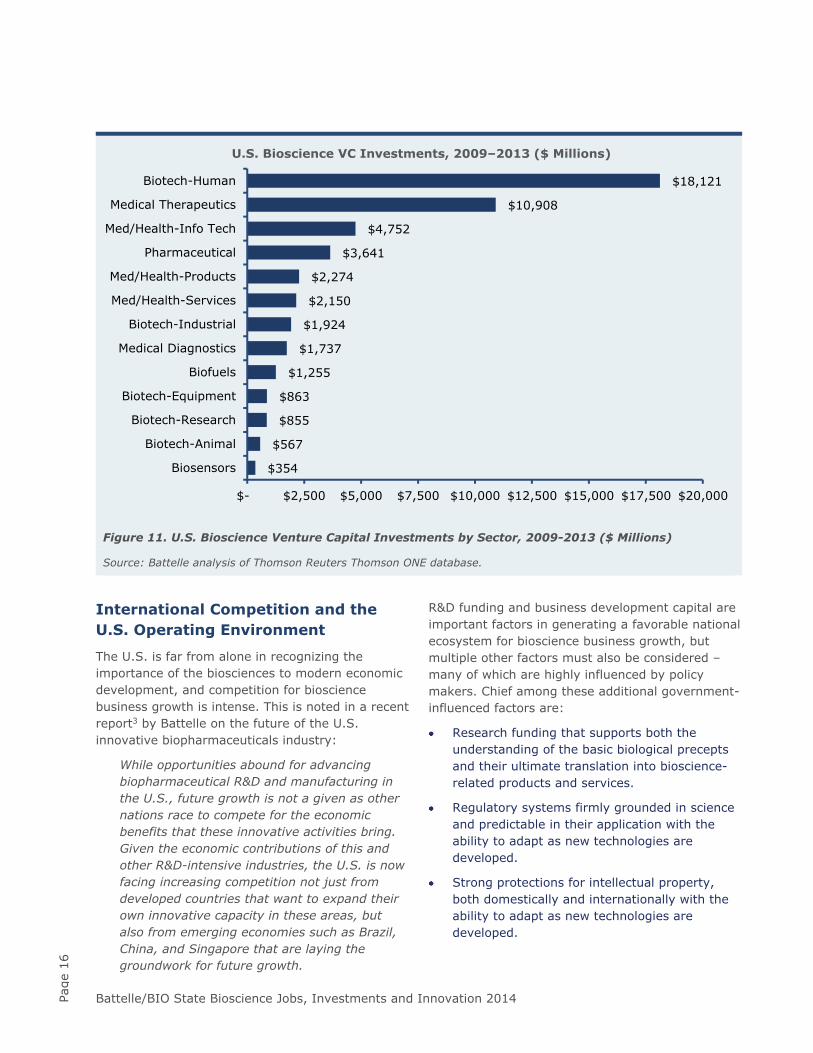
Within bioscience venture capital, biomedical products and technologies continue to be the largest recipient of VC investments (Figure 11). It is interesting to note the relative absence of plant and agricultural VC funding (especially given the size and employment performance of the “Agricultural Feedstock and Chemicals” subsector), but this is largely explained by the industry characteristics of the agbioscience space which is dominated by large-scale multinational corporations that are not active in VC markets.
$38,140
$38,138
$35,694
$33,427
$0 $10,000 $20,000 $30,000 $40,000 $50,000
2012
2011
2010
2009
Academic R&D Expenditures ($ Millions)
Battelle/BIO State Bioscience Jobs, Investments and Innovation 2014 Page
15
–
Figure 10. U.S. Bioscience Venture Capital Investments, 2009-2013 ($ Millions)
Source: Battelle analysis of Thomson Reuters Thomson ONE database.
Table 4. U.S. Bioscience Venture Capital Investments by Stage, 2009-2013
Stage Number of
Deals Number of Companies
Total VC Investments,
$ Millions
Average Investment Per Deal, $ Millions
Average Investment Per Company,
$ Millions
Start-Up/Seed 706 495 $3,303 $4.68 $6.67
Early Stage 2,009 1,115 $14,755 $7.34 $13.23
Expansion 1,021 574 $7,887 $7.73 $13.74
Later Stage 2,958 1,245 $16,231 $5.49 $13.04
Buyout or Acquisition 192 156 $3,120 $16.25 $20.00
Other 244 161 $4,105 $16.82 $25.50
Grand Total 7,130 3,746 $49,402 $6.93 $13.19
Source: Battelle analysis of Thomson Reuters Thomson ONE database.
$9,927
$10,171
$11,792
$9,109
$8,403
$- $2,000 $4,000 $6,000 $8,000 $10,000 $12,000 $14,000
2013
2012
2011
2010
2009
US Bioscience VC Investments, 2009–2013 ($ Millions)
Battelle/BIO State Bioscience Jobs, Investments and Innovation 2014 Page
16
Figure 11. U.S. Bioscience Venture Capital Investments by Sector, 2009-2013 ($ Millions)
Source: Battelle analysis of Thomson Reuters Thomson ONE database.
International Competition and the U.S. Operating Environment
The U.S. is far from alone in recognizing the importance of the biosciences to modern economic development, and competition for bioscience business growth is intense. This is noted in a recent report3 by Battelle on the future of the U.S. innovative biopharmaceuticals industry:
While opportunities abound for advancing biopharmaceutical R&D and manufacturing in the U.S., future growth is not a given as other nations race to compete for the economic benefits that these innovative activities bring. Given the economic contributions of this and other R&D-intensive industries, the U.S. is now facing increasing competition not just from developed countries that want to expand their own innovative capacity in these areas, but also from emerging economies such as Brazil, China, and Singapore that are laying the groundwork for future growth.
R&D funding and business development capital are important factors in generating a favorable national ecosystem for bioscience business growth, but multiple other factors must also be considered – many of which are highly influenced by policy makers. Chief among these additional government-influenced factors are:
Research funding that supports both the understanding of the basic biological precepts and their ultimate translation into bioscience-related products and services.
Regulatory systems firmly grounded in science and predictable in their application with the ability to adapt as new technologies are developed.
Strong protections for intellectual property, both domestically and internationally with the ability to adapt as new technologies are developed.
$354
$567
$855
$863
$1,255
$1,737
$1,924
$2,150
$2,274
$3,641
$4,752
$10,908
$18,121
$- $2,500 $5,000 $7,500 $10,000 $12,500 $15,000 $17,500 $20,000
Biosensors
Biotech-Animal
Biotech-Research
Biotech-Equipment
Biofuels
Medical Diagnostics
Biotech-Industrial
Med/Health-Services
Med/Health-Products
Pharmaceutical
Med/Health-Info Tech
Medical Therapeutics
Biotech-Human
U.S. Bioscience VC Investments, 2009–2013 ($ Millions)
Battelle/BIO State Bioscience Jobs, Investments and Innovation 2014 Page
17
Medical reimbursement and payment policies that are favorable to the development of new and innovative biomedical products.
Government trade actions that sustain and improve the “openness” of international markets for U.S. bioscience goods and services.
Federal and state tax policies and incentive systems that sustain industry competitiveness.
Education and workforce development programs providing the skilled workforce needed for today and tomorrow.
3 Reference: Battelle Technology Partnership Practice. 2014. “The U.S. Biopharmaceutical Industry: Perspectives On Future Growth And The Factors That Will Drive It.” PhRMA.
State and Local Initiatives: Innovations in Supporting Industry Growth
Clearly the U.S. federal government wields great influence over bioscience market dynamics. Along with private sector research and development, federal agencies play a key role in fundamental and applied research across the life science spectrum. Federal regulations impact new product introductions in medicines, medical devices, and agricultural products. Federal tax incentives and policies influence the economics of emerging sectors such as biofuels and green chemicals. Federal health care reforms, Medicare reimbursement policies and Farm Bill policies impact the economics of bioscience subsectors. And, federal trade, tax, and monetary policies impact overall U.S. industrial competitiveness.
While the federal government holds influence over nationwide dynamics, individual states and metropolitan districts can and do have an important role to play in establishing favorable conditions for bioscience industry cluster development and growth. Through supports for industry-university collaborations, provision of R&D tax credits, business incubator development, risk-capital supports, and other innovation support mechanisms, states and metro regions are able to enhance their attractiveness for bioscience projects and increase the birth rate and growth of new bioscience companies.
An evident trend in 2012 and 2013 is increasing local level collaborations between the bioscience industry and research universities, academic medical centers and independent research institutes. Particular emphasis is evident in efforts to advance university-generated research toward commercialization in cooperation with industry.
Among the approaches undertaken are university/industry partnerships, proof-of-concept funds and joint ventures. There were more than 30 new efforts in cooperative university-industry ventures supported by state governments, and identified by BIO, across the nation in the 2012–2013 time period. Presented below are examples of these new state efforts.
Colorado A partnership between the Innovation Center of the Rockies (ICR) and Colorado State University (CSU) Ventures was formed to accelerate on a statewide level technology commercialization based on faculty research. CSU faculty and graduate researchers will be matched with ICR’s network of more than 1,000 advisors and mentors to spur new business creation. The focus is primarily on the commercialization of bioscience, cleantech, engineering, aerospace and IT/ software technologies.
Lawmakers passed a bill (SB 80) to strengthen R&D efforts at colleges and universitiesby expanding authority of higher education institutions to create technology test beds by purchasing emerging technology for testing and evaluating. This allows universities to test new technologies, products or processes to assess commercial potential and the possible benefits to the state’s economy.
Illinois MATTER is a new startup center for next-generation healthcare technology companies, located in Chicago’s Merchandise Mart with collaborative workspace, allows interaction among entrepreneurs, academics and investors in order to create and grow new companies in healthcare information technology, medical devices, medical diagnostics and biopharmaceuticals. The state’s
Battelle/BIO State Bioscience Jobs, Investments and Innovation 2014 Page
18
funding package, administered through the Illinois Department of Commerce and Economic Opportunity (DCEO), consists of a $2.5 million state investment and a loan of $1.5 million that provides seed funding support for the project.
Indiana The Indiana Biosciences Research Institute was launched as a statewide public-private partnership by BioCrossroads with an initial $25 million state commitment that has now been matched by corporate and philanthropic funders. The Institute is developing a novel operating model, with industry providing a major source of funding and defining the Institute’s research focus to optimize commercialization opportunities. Industry executives from Eli Lilly and Company, Roche Diagnostics, Dow AgroSciences, Indiana University Health, Cook Medical and Biomet have been critical in advancing the Institute in partnership with BioCrossroads, state government and Indiana’s research institutions. The Institute will initially focus on the most pressing global and local interrelated human health issues: cardiovascular disease, diabetes, obesity and nutrition. These interrelated metabolic disorders are a major economic burden and a leading cause of death in the United States.
Kansas A new proof-of-concept fund supported by the University of Kansas will provide funding to mature research projects in all areas of technology, helping to attract industry investment and bring products to market. Applicants can apply for up to $50,000 per proposal and must clearly indicate economic potential of their technology and identify companies that would be suitable partners for commercial success, according to a press release. The university announced it awarded a total of nearly $200,000 in 2012.
Maryland Building on the momentum of the InvestMaryland initiative passed last legislative session, Gov. Martin O’Malley unveiled a joint venture between the state, federal research labs and five universities to accelerate technology commercialization. Approved by lawmakers in April, the Maryland Innovation Initiative (HB 442) is a new fund administered by the Maryland Technology Development Corporation (TEDCO) that aims to move 40 new discoveries a year out of thelab and into the marketplace. The five participating universities contribute between $100,000 and
$200,000 on an annual basis, combined with $5 million in state funding approved in the FY13 budget. Funding will support startup grants to innovators best positioned to push their technology and business plans into the marketplace quickly.
TEDCO also will manage a new $50 million investment fund providing seed capital to launch new businesses that use technologies from government and university research labs in Maryland, Delaware and Washington, DC. The Chesapeake Regional Innovation Fund will invest in startups focused on the areas of life sciences, energy and security.
Michigan Established in late 2011, the Michigan Corporate Relations Network (MCRN) took off last year working to create partnerships that connect businesses to university resources that support innovative research and growth in the state’s economy. The MCRN was established with six of the state’s 15 public universities and offers a comprehensive Business Engagement Center to connect entrepreneurs with companies and help them access university library resources.
MCRN also has developed three program activities for small and large firms:
Small Company Innovation Program – provides small businesses with access to matching funds to engage the MCRN partner universities on company-specific research projects.
Small Company Internship Award – provides funding for students to work as summer interns or cooperative positions with corporate partners (typically in STEM fields)on projects that are both beneficial to the company and academically relevant tothe student.
Instant Innovation Program - the program brings faculty experts from the universities together with companies to tackle significant business and research challenges identified by the companies in a daylong, facilitated brainstorming session.
Minnesota The University of Minnesota plans to launch two new funds in 2013 to support novel ideas coming out of the university. One will be a $20 million seed fund limited to university startups, and the other will be a $50 million national venture
Battelle/BIO State Bioscience Jobs, Investments and Innovation 2014 Page
19
fund that will seek additional private capital and be open to entrepreneurs from across the country.
New York The Rochester Institute of Technology (RIT) dedicated $3.5 million in reserves to launch a venture fund for assisting companies with ties to the university. RIT officials touted the abilityto offer financial assistance on top of their already comprehensive suite of services such as Venture Creations and a Center for Student Innovation and Entrepreneurship. Officials anticipate about $500,000 will be awarded per year to a few businesses.
Ohio The UC Technology Commercialization Accelerator was formed under a partnership agreement between the University of Cincinnati (UC) and the Midwest EB5 Regional Center to help transition technologies out of the university into the marketplace. A total of $750,000 was committed toward the project. A competitive application process will be used to assess a technology’s viability for startup and licensing opportunities and gap funding or the accelerator to the most promising ideas will provide pre-seed awards.
Pennsylvania As part of a presentation mapping out Drexel University’s plans to transform a section of the surrounding area into an “innovation neighborhood,” the president of the university announced it would launch a new venture fund in 2013. The fund will support Drexel University faculty, students and alumni and area entrepreneurs. The announcement was made shortly after Philadelphia Mayor Michael Nutter outlined his plans for two public-private venture funds.
Washington With funding from foundations, investors and the state, a $20 million early stage venture fund was launched at the University of Washington (UW) for investing in promising startups spunout of UW and other research institutions across the state. The W Fund will help the most promising research and student-generated startups clear early financing hurdles, gain traction more quickly, and reach venture-fundable milestones. It also is expected to help advance UW’s Commercialization Initiative, which aims to double the number of new companies created at the university over the next three years.

Battelle/BIO State Bioscience Jobs, Investments and Innovation 2014 Page
21
State and Metropolitan Area Performance
The following section provides a more in-depth examination of employment trends among each of the five major bioscience subsectors. Data were tabulated for each state, the District of Columbia, and Puerto Rico to determine the size and relative job concentration within each subsector. In addition, employment growth and loss were calculated to highlight recent trends. In this edition, current (2012) industry metrics were calculated for every Metropolitan Statistical Area (MSA) as well.
Employment size measures the absolute level of jobs within each state and region. To allow for meaningful comparisons at the state level, those states with more than 5 percent of national employment are designated “large,” while those states with more than 3 percent but less than 5 percent are referred to as “sizable.” For metro-politan regions, two listings are presented for each subsector: one sets out the top 25 metropolitan regions in employment across all metropolitan regions and the other listing groups the top 15 regions based upon the size of the metropolitan area (large, medium or small).
Employment concentration is a useful way in which to gauge the relative size of a state’s or region’s subsectors compared to the national average. While employment size reveals the largest geographic components, employment concentration can reveal the relative importance of the subsectors to a regional or state economy. State and regional location quotients (LQs) measure the degree of job concentration within the region relative to the nation. States or regions with an LQ greater than 1.0 are said to have a concentration in the subsector. When the LQ is significantly above average (i.e., 1.20 or greater), the state is said to have a “specialization” in the subsector.
The level of employment growth or loss during 2007 to 2012 provides a snapshot of recent progress in growing a state’s bioscience sector, this is useful when examining the recent recession and early years of the recovery. In this analysis, job growth or loss was measured by absolute employment gains or losses, as percentage changes may overstate trends in those states with a smaller subsector employment base.
Battelle/BIO State Bioscience Jobs, Investments and Innovation 2014 Page
22
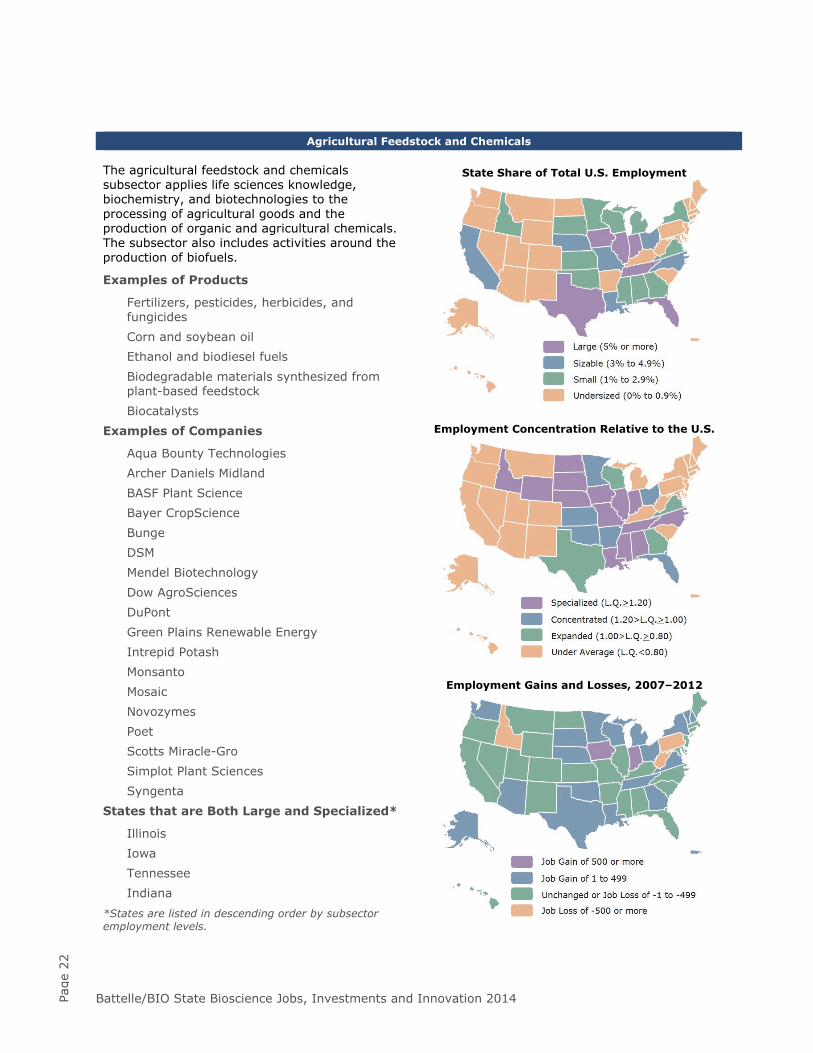
Agricultural Feedstock and Chemicals The agricultural feedstock and chemicals subsector applies life sciences knowledge, biochemistry, and biotechnologies to the processing of agricultural goods and the production of organic and agricultural chemicals. The subsector also includes activities around the production of biofuels.
Examples of Products
Fertilizers, pesticides, herbicides, and fungicides Corn and soybean oil Ethanol and biodiesel fuels Biodegradable materials synthesized from plant-based feedstock Biocatalysts
Examples of Companies
Aqua Bounty Technologies Archer Daniels Midland BASF Plant Science Bayer CropScience Bunge DSM Mendel Biotechnology Dow AgroSciences DuPont Green Plains Renewable Energy Intrepid Potash Monsanto Mosaic Novozymes Poet Scotts Miracle-Gro Simplot Plant Sciences Syngenta
States that are Both Large and Specialized*
Illinois Iowa Tennessee Indiana
*States are listed in descending order by subsector employment levels.
State Share of Total U.S. Employment
Employment Concentration Relative to the U.S.
Employment Gains and Losses, 2007–2012
Battelle/BIO State Bioscience Jobs, Investments and Innovation 2014 Page
23
Agricultural Feedstock & Chemicals
The nation’s agricultural feedstock and chemicals companies operate nearly 1,800 business establishments that employed 76,404 in 2012. These jobs represent about 5 percent of bioscience industry employment, and while the trend in the subsector has been relatively flat overall since 2007 (down just 1 percent), 2012 saw agricultural bioscience firms increase employment.
Like the overall bioscience industry, employment peaked in the subsector in 2008 before contracting in the recession. The 2012 job gain of 2.3 percent, the first growth in several years, has offset some of this job loss.
The industry subsector has two major compon-ents—agricultural feedstock which includes companies engaged in bio-based processing of corn, soybeans, and other oilseeds; and organic and agricultural chemicals producers that manufacture fertilizers, pesticides, herbicides, biofuels, and others.
Continued hiring in ethanol production has helped the organic and agricultural chemicals component grow overall since 2007.
State Leaders & Highlights
Employment Size: Agbioscience employment is well distributed across the U.S., with the largest 10 states accounting for just 63 percent of jobs.
Large States: Illinois, Iowa, Tennessee, Texas, Florida, Indiana
Sizable States: North Carolina, Ohio, California, Louisiana, Nebraska, Missouri
Employment Concentration: Fourteen states have a specialized concentration of jobs in the agricultural feedstock and chemicals subsector. These concentrations are in the Midwest and South.
Specialized States: Iowa, Nebraska, South Dakota, Tennessee, Indiana, Idaho, Louisiana, Illinois, Wyoming, North Dakota, Mississippi, Missouri, Alabama, North Carolina
Concentrated States: Kansas, Florida, Arkansas, Ohio, Oklahoma, Minnesota
Employment Growth: From 2007-12, 21 states had some increase in subsector jobs with Iowa and Indiana having substantial increases.
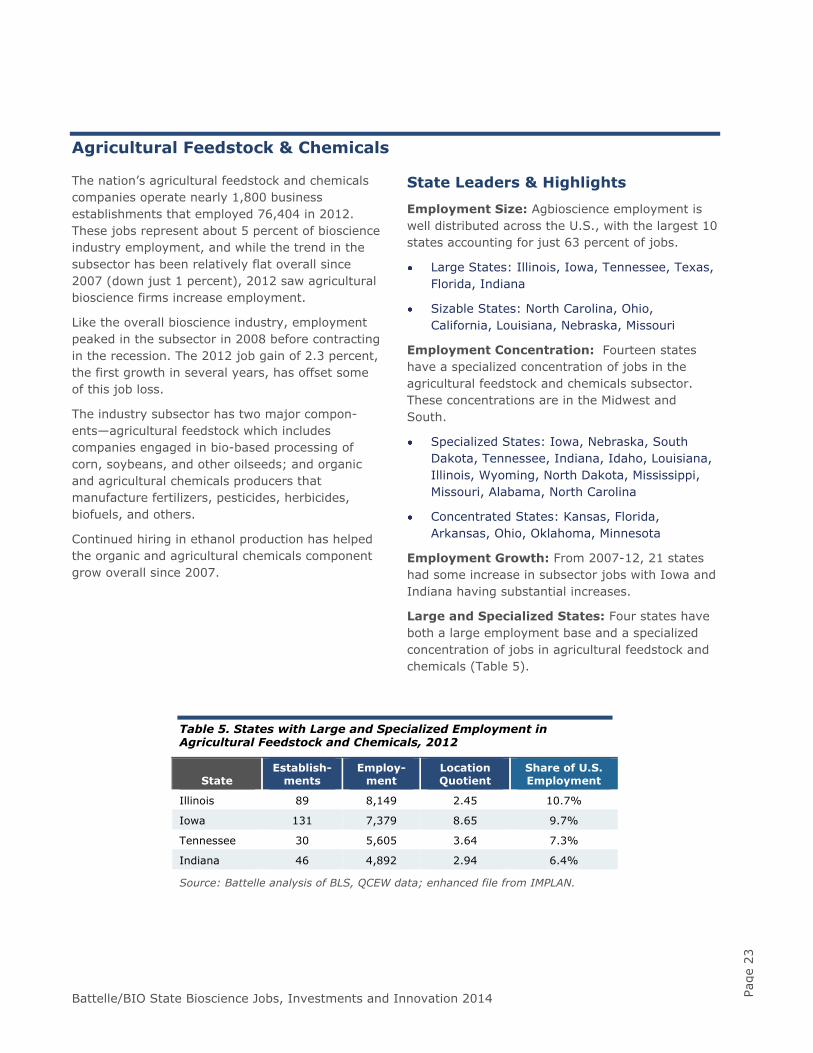
Large and Specialized States: Four states have both a large employment base and a specialized concentration of jobs in agricultural feedstock and chemicals (Table 5).
Table 5. States with Large and Specialized Employment in Agricultural Feedstock and Chemicals, 2012
State Establish-
ments Employ-
ment Location Quotient
Share of U.S. Employment
Illinois 89 8,149 2.45 10.7%
Iowa 131 7,379 8.65 9.7%
Tennessee 30 5,605 3.64 7.3%
Indiana 46 4,892 2.94 6.4%
Source: Battelle analysis of BLS, QCEW data; enhanced file from IMPLAN.
Battelle/BIO State Bioscience Jobs, Investments and Innovation 2014 Page
24
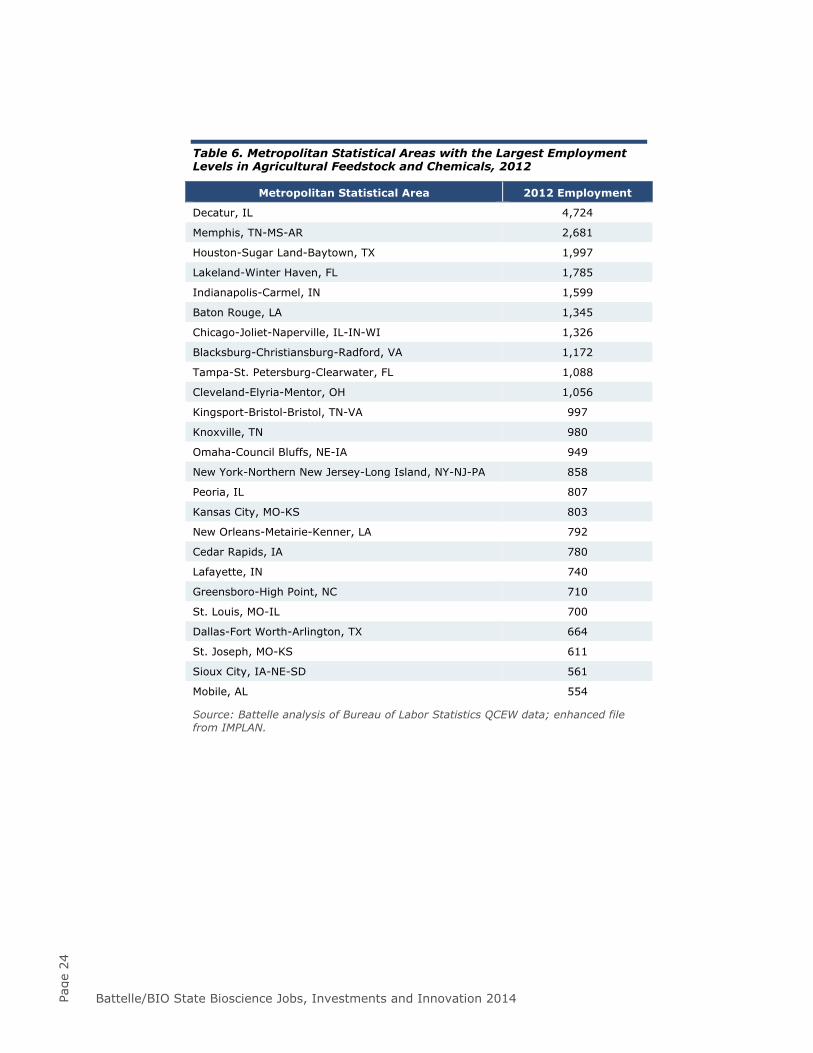
Table 6. Metropolitan Statistical Areas with the Largest Employment Levels in Agricultural Feedstock and Chemicals, 2012
Metropolitan Statistical Area 2012 Employment
Decatur, IL 4,724
Memphis, TN-MS-AR 2,681
Houston-Sugar Land-Baytown, TX 1,997
Lakeland-Winter Haven, FL 1,785
Indianapolis-Carmel, IN 1,599
Baton Rouge, LA 1,345
Chicago-Joliet-Naperville, IL-IN-WI 1,326
Blacksburg-Christiansburg-Radford, VA 1,172
Tampa-St. Petersburg-Clearwater, FL 1,088
Cleveland-Elyria-Mentor, OH 1,056
Kingsport-Bristol-Bristol, TN-VA 997
Knoxville, TN 980
Omaha-Council Bluffs, NE-IA 949
New York-Northern New Jersey-Long Island, NY-NJ-PA 858
Peoria, IL 807
Kansas City, MO-KS 803
New Orleans-Metairie-Kenner, LA 792
Cedar Rapids, IA 780
Lafayette, IN 740
Greensboro-High Point, NC 710
St. Louis, MO-IL 700
Dallas-Fort Worth-Arlington, TX 664
St. Joseph, MO-KS 611
Sioux City, IA-NE-SD 561
Mobile, AL 554
Source: Battelle analysis of Bureau of Labor Statistics QCEW data; enhanced file from IMPLAN.
Battelle/BIO State Bioscience Jobs, Investments and Innovation 2014 Page
25
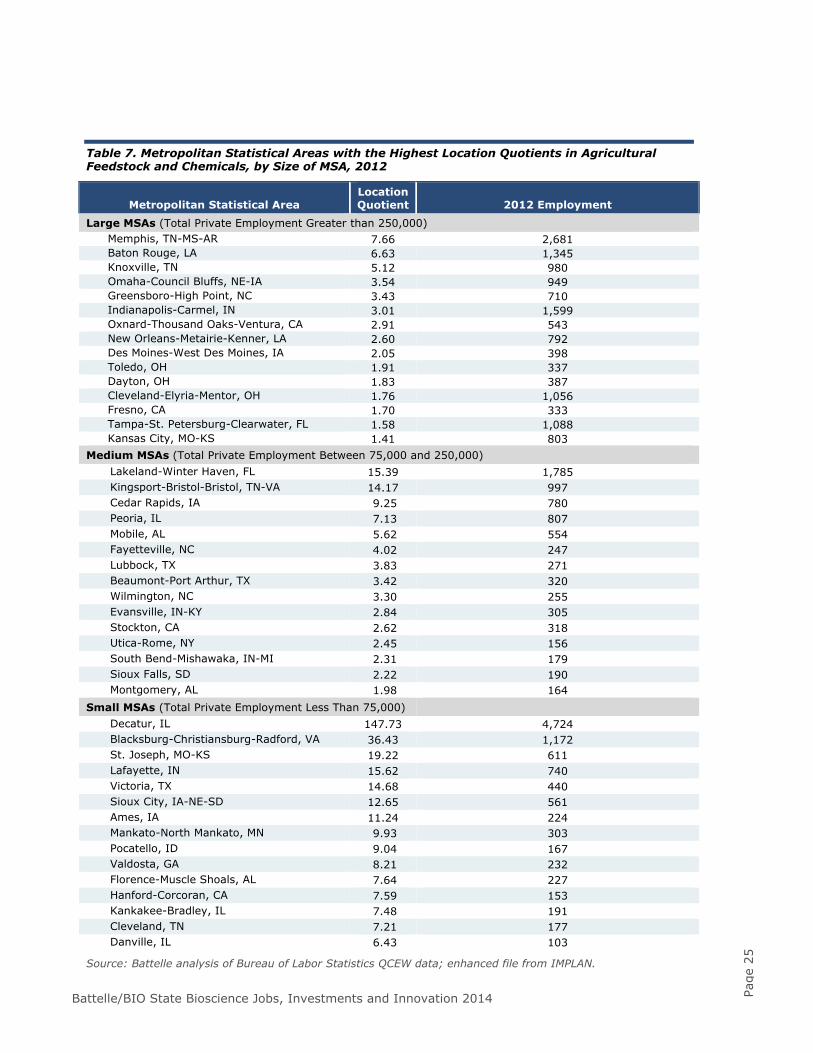
Table 7. Metropolitan Statistical Areas with the Highest Location Quotients in Agricultural Feedstock and Chemicals, by Size of MSA, 2012
Metropolitan Statistical Area Location Quotient 2012 Employment
Large MSAs (Total Private Employment Greater than 250,000) Memphis, TN-MS-AR 7.66 2,681 Baton Rouge, LA 6.63 1,345 Knoxville, TN 5.12 980 Omaha-Council Bluffs, NE-IA 3.54 949 Greensboro-High Point, NC 3.43 710 Indianapolis-Carmel, IN 3.01 1,599 Oxnard-Thousand Oaks-Ventura, CA 2.91 543 New Orleans-Metairie-Kenner, LA 2.60 792 Des Moines-West Des Moines, IA 2.05 398 Toledo, OH 1.91 337 Dayton, OH 1.83 387 Cleveland-Elyria-Mentor, OH 1.76 1,056 Fresno, CA 1.70 333 Tampa-St. Petersburg-Clearwater, FL 1.58 1,088 Kansas City, MO-KS 1.41 803
Medium MSAs (Total Private Employment Between 75,000 and 250,000) Lakeland-Winter Haven, FL 15.39 1,785 Kingsport-Bristol-Bristol, TN-VA 14.17 997 Cedar Rapids, IA 9.25 780 Peoria, IL 7.13 807 Mobile, AL 5.62 554 Fayetteville, NC 4.02 247 Lubbock, TX 3.83 271 Beaumont-Port Arthur, TX 3.42 320 Wilmington, NC 3.30 255 Evansville, IN-KY 2.84 305 Stockton, CA 2.62 318 Utica-Rome, NY 2.45 156 South Bend-Mishawaka, IN-MI 2.31 179 Sioux Falls, SD 2.22 190 Montgomery, AL 1.98 164
Small MSAs (Total Private Employment Less Than 75,000) Decatur, IL 147.73 4,724 Blacksburg-Christiansburg-Radford, VA 36.43 1,172 St. Joseph, MO-KS 19.22 611 Lafayette, IN 15.62 740 Victoria, TX 14.68 440 Sioux City, IA-NE-SD 12.65 561 Ames, IA 11.24 224 Mankato-North Mankato, MN 9.93 303 Pocatello, ID 9.04 167 Valdosta, GA 8.21 232 Florence-Muscle Shoals, AL 7.64 227 Hanford-Corcoran, CA 7.59 153 Kankakee-Bradley, IL 7.48 191 Cleveland, TN 7.21 177 Danville, IL 6.43 103
Source: Battelle analysis of Bureau of Labor Statistics QCEW data; enhanced file from IMPLAN.
Battelle/BIO State Bioscience Jobs, Investments and Innovation 2014 Page
26
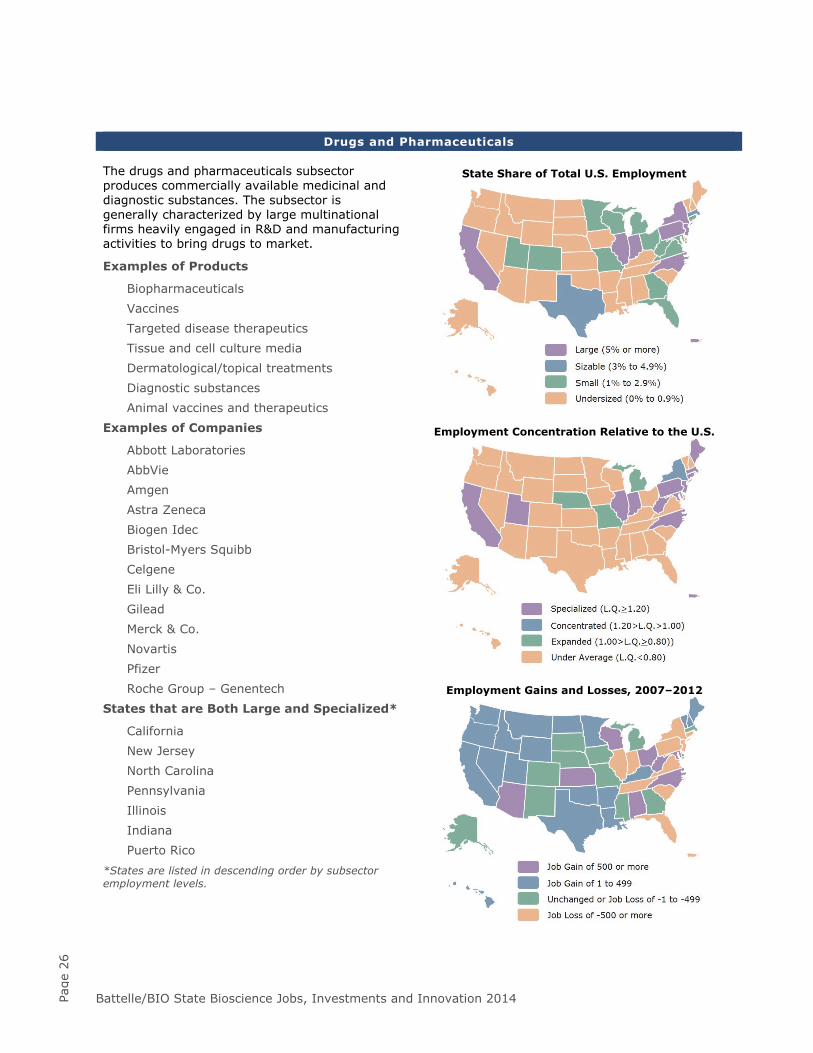
Drugs and Pharmaceuticals The drugs and pharmaceuticals subsector produces commercially available medicinal and diagnostic substances. The subsector is generally characterized by large multinational firms heavily engaged in R&D and manufacturing activities to bring drugs to market.
Examples of Products
Biopharmaceuticals Vaccines Targeted disease therapeutics Tissue and cell culture media Dermatological/topical treatments Diagnostic substances Animal vaccines and therapeutics
Examples of Companies
Abbott Laboratories AbbVie Amgen Astra Zeneca Biogen Idec Bristol-Myers Squibb Celgene Eli Lilly & Co. Gilead Merck & Co. Novartis Pfizer Roche Group – Genentech
States that are Both Large and Specialized*
California New Jersey North Carolina Pennsylvania Illinois Indiana Puerto Rico
*States are listed in descending order by subsector employment levels.
State Share of Total U.S. Employment
Employment Concentration Relative to the U.S.
Employment Gains and Losses, 2007–2012
Battelle/BIO State Bioscience Jobs, Investments and Innovation 2014 Page
27
Drugs & Pharmaceuticals
U.S. drugs and pharmaceutical manufacturers employed more than 284,000 in 2012 representing about 18 percent of the national bioscience industry. With the onset of the recession in 2008, the subsector began to steadily lose jobs, and since its recent employment peak in 2007, is down 10.9 percent. Since 2007, employment declines have averaged 2.3 percent in drugs and pharmaceuticals but in 2012 the subsector stabilized, declining by just 0.3 percent.
Despite the overall job declines in drugs and pharmaceuticals, there have been some bright spots. While pharmaceutical preparation is by far the largest component of this subsector and has accounted for the majority of job losses in recent years, two other smaller sectors have added jobs since 2007. In-vitro diagnostic substances and biological product manufacturing have increased their employment by 8 percent and 7 percent, respectively.
The pharmaceutical subsector is characterized by extensive R&D and high value-adding activities in developing new therapeutics, vaccines, biologics, and diagnostic substances. The subsector continues to expand its economic output despite shedding jobs and these value-added activities are reflected in the very high average wages paid to its workers. In 2012, the average worker in the drugs and pharmaceuticals subsector was paid nearly $107,000—21 percent more than the average bioscience worker and more than twice the private sector average.
State Leaders & Highlights
Employment Size: In terms of geography, drugs and pharmaceuticals manufacturing is more highly concentrated among fewer states. The three largest employer states—California, New Jersey, and North Carolina—combine to employ one in three subsector workers nationally.
Large States: California, New Jersey, North Carolina, New York, Pennsylvania, Illinois, Indiana, Puerto Rico
Sizable States: Texas, Massachusetts
Employment Concentration: Thirteen states and Puerto Rico have a specialized concentration of jobs in the drugs and pharmaceuticals subsector.
Specialized States: Puerto Rico, New Jersey, North Carolina, Indiana, West Virginia, Utah, Connecticut, Pennsylvania, Illinois, Rhode Island, California, Maryland, Maine, Massachusetts
Concentrated States: New York
Employment Growth: From 2007-12, 28 states had some increase in subsector jobs with North Carolina, West Virginia, Maryland, Wisconsin, Arizona, Kansas, Alabama, and Ohio recording substantial job increases.
Large and Specialized States. Six states and Puerto Rico have both a large employment base and a specialized concentration of jobs in drugs and pharmaceuticals (Table 8).
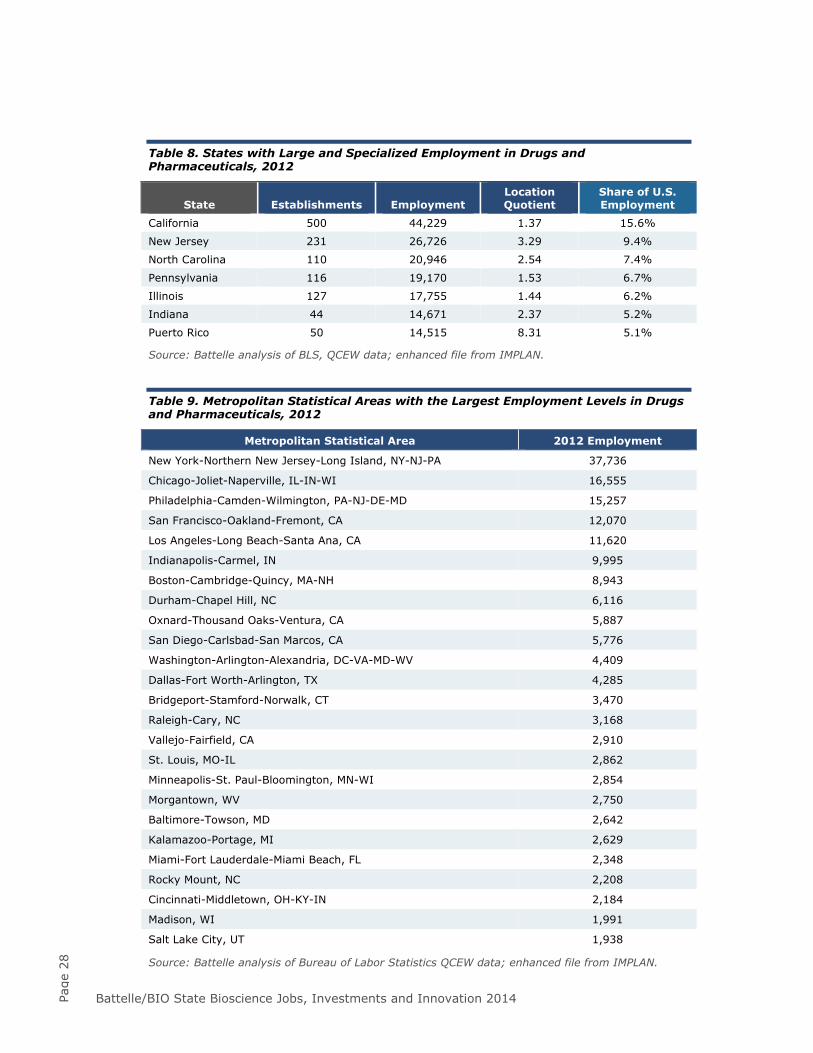
Battelle/BIO State Bioscience Jobs, Investments and Innovation 2014 Page
28
Table 8. States with Large and Specialized Employment in Drugs and Pharmaceuticals, 2012
State Establishments Employment Location Quotient
Share of U.S. Employment
California 500 44,229 1.37 15.6%
New Jersey 231 26,726 3.29 9.4%
North Carolina 110 20,946 2.54 7.4%
Pennsylvania 116 19,170 1.53 6.7%
Illinois 127 17,755 1.44 6.2%
Indiana 44 14,671 2.37 5.2%
Puerto Rico 50 14,515 8.31 5.1%
Source: Battelle analysis of BLS, QCEW data; enhanced file from IMPLAN.
Table 9. Metropolitan Statistical Areas with the Largest Employment Levels in Drugs and Pharmaceuticals, 2012
Metropolitan Statistical Area 2012 Employment
New York-Northern New Jersey-Long Island, NY-NJ-PA 37,736
Chicago-Joliet-Naperville, IL-IN-WI 16,555
Philadelphia-Camden-Wilmington, PA-NJ-DE-MD 15,257
San Francisco-Oakland-Fremont, CA 12,070
Los Angeles-Long Beach-Santa Ana, CA 11,620
Indianapolis-Carmel, IN 9,995
Boston-Cambridge-Quincy, MA-NH 8,943
Durham-Chapel Hill, NC 6,116
Oxnard-Thousand Oaks-Ventura, CA 5,887
San Diego-Carlsbad-San Marcos, CA 5,776
Washington-Arlington-Alexandria, DC-VA-MD-WV 4,409
Dallas-Fort Worth-Arlington, TX 4,285
Bridgeport-Stamford-Norwalk, CT 3,470
Raleigh-Cary, NC 3,168
Vallejo-Fairfield, CA 2,910
St. Louis, MO-IL 2,862
Minneapolis-St. Paul-Bloomington, MN-WI 2,854
Morgantown, WV 2,750
Baltimore-Towson, MD 2,642
Kalamazoo-Portage, MI 2,629
Miami-Fort Lauderdale-Miami Beach, FL 2,348
Rocky Mount, NC 2,208
Cincinnati-Middletown, OH-KY-IN 2,184
Madison, WI 1,991
Salt Lake City, UT 1,938
Source: Battelle analysis of Bureau of Labor Statistics QCEW data; enhanced file from IMPLAN.
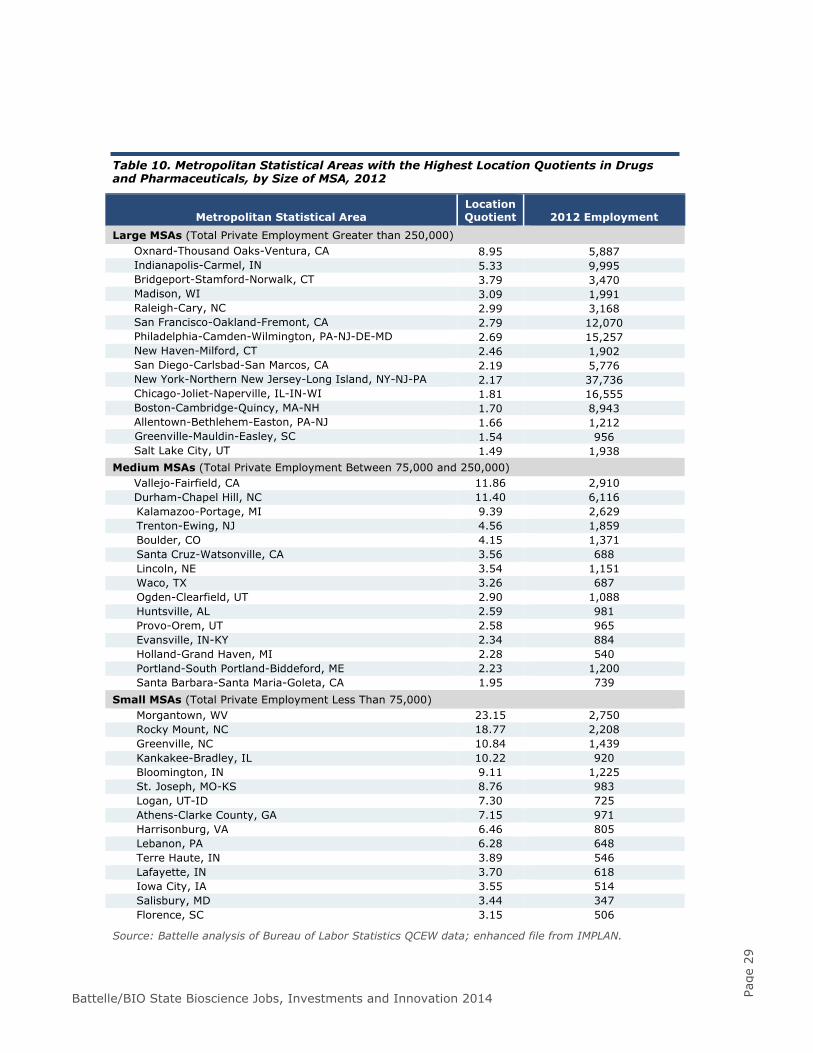
Battelle/BIO State Bioscience Jobs, Investments and Innovation 2014 Page
29
Table 10. Metropolitan Statistical Areas with the Highest Location Quotients in Drugs and Pharmaceuticals, by Size of MSA, 2012
Metropolitan Statistical Area Location Quotient 2012 Employment
Large MSAs (Total Private Employment Greater than 250,000) Oxnard-Thousand Oaks-Ventura, CA 8.95 5,887 Indianapolis-Carmel, IN 5.33 9,995 Bridgeport-Stamford-Norwalk, CT 3.79 3,470 Madison, WI 3.09 1,991 Raleigh-Cary, NC 2.99 3,168 San Francisco-Oakland-Fremont, CA 2.79 12,070 Philadelphia-Camden-Wilmington, PA-NJ-DE-MD 2.69 15,257 New Haven-Milford, CT 2.46 1,902 San Diego-Carlsbad-San Marcos, CA 2.19 5,776 New York-Northern New Jersey-Long Island, NY-NJ-PA 2.17 37,736 Chicago-Joliet-Naperville, IL-IN-WI 1.81 16,555 Boston-Cambridge-Quincy, MA-NH 1.70 8,943 Allentown-Bethlehem-Easton, PA-NJ 1.66 1,212 Greenville-Mauldin-Easley, SC 1.54 956 Salt Lake City, UT 1.49 1,938
Medium MSAs (Total Private Employment Between 75,000 and 250,000) Vallejo-Fairfield, CA 11.86 2,910 Durham-Chapel Hill, NC 11.40 6,116 Kalamazoo-Portage, MI 9.39 2,629 Trenton-Ewing, NJ 4.56 1,859 Boulder, CO 4.15 1,371 Santa Cruz-Watsonville, CA 3.56 688 Lincoln, NE 3.54 1,151 Waco, TX 3.26 687 Ogden-Clearfield, UT 2.90 1,088 Huntsville, AL 2.59 981 Provo-Orem, UT 2.58 965 Evansville, IN-KY 2.34 884 Holland-Grand Haven, MI 2.28 540 Portland-South Portland-Biddeford, ME 2.23 1,200 Santa Barbara-Santa Maria-Goleta, CA 1.95 739
Small MSAs (Total Private Employment Less Than 75,000) Morgantown, WV 23.15 2,750 Rocky Mount, NC 18.77 2,208 Greenville, NC 10.84 1,439 Kankakee-Bradley, IL 10.22 920 Bloomington, IN 9.11 1,225 St. Joseph, MO-KS 8.76 983 Logan, UT-ID 7.30 725 Athens-Clarke County, GA 7.15 971 Harrisonburg, VA 6.46 805 Lebanon, PA 6.28 648 Terre Haute, IN 3.89 546 Lafayette, IN 3.70 618 Iowa City, IA 3.55 514 Salisbury, MD 3.44 347 Florence, SC 3.15 506
Source: Battelle analysis of Bureau of Labor Statistics QCEW data; enhanced file from IMPLAN.
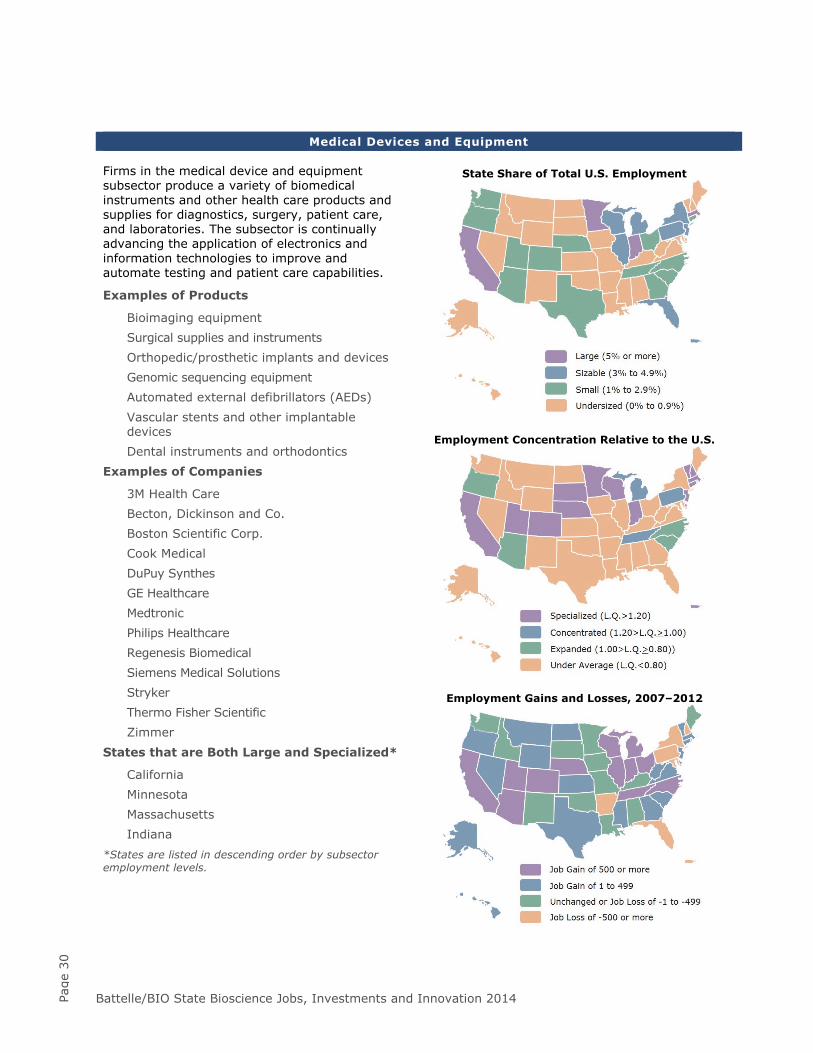
Battelle/BIO State Bioscience Jobs, Investments and Innovation 2014 Page
30
Medical Devices and Equipment Firms in the medical device and equipment subsector produce a variety of biomedical instruments and other health care products and supplies for diagnostics, surgery, patient care, and laboratories. The subsector is continually advancing the application of electronics and information technologies to improve and automate testing and patient care capabilities.
Examples of Products
Bioimaging equipment Surgical supplies and instruments Orthopedic/prosthetic implants and devices Genomic sequencing equipment Automated external defibrillators (AEDs) Vascular stents and other implantable devices Dental instruments and orthodontics
Examples of Companies
3M Health Care Becton, Dickinson and Co. Boston Scientific Corp. Cook Medical DuPuy Synthes GE Healthcare Medtronic Philips Healthcare Regenesis Biomedical Siemens Medical Solutions Stryker Thermo Fisher Scientific Zimmer
States that are Both Large and Specialized*
California Minnesota Massachusetts Indiana
*States are listed in descending order by subsector employment levels.
State Share of Total U.S. Employment
Employment Concentration Relative to the U.S.
Employment Gains and Losses, 2007–2012
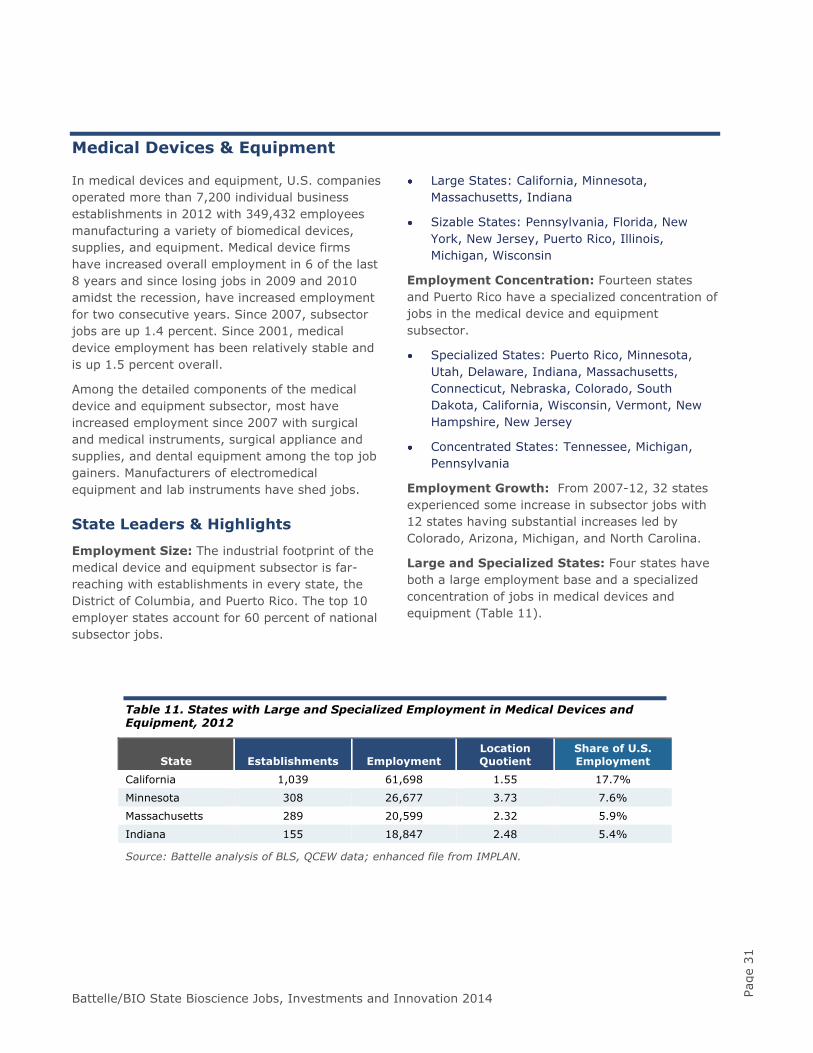
Battelle/BIO State Bioscience Jobs, Investments and Innovation 2014 Page
31
Medical Devices & Equipment
In medical devices and equipment, U.S. companies operated more than 7,200 individual business establishments in 2012 with 349,432 employees manufacturing a variety of biomedical devices, supplies, and equipment. Medical device firms have increased overall employment in 6 of the last 8 years and since losing jobs in 2009 and 2010 amidst the recession, have increased employment for two consecutive years. Since 2007, subsector jobs are up 1.4 percent. Since 2001, medical device employment has been relatively stable and is up 1.5 percent overall.
Among the detailed components of the medical device and equipment subsector, most have increased employment since 2007 with surgical and medical instruments, surgical appliance and supplies, and dental equipment among the top job gainers. Manufacturers of electromedical equipment and lab instruments have shed jobs.
State Leaders & Highlights
Employment Size: The industrial footprint of the medical device and equipment subsector is far-reaching with establishments in every state, the District of Columbia, and Puerto Rico. The top 10 employer states account for 60 percent of national subsector jobs.
Large States: California, Minnesota, Massachusetts, Indiana
Sizable States: Pennsylvania, Florida, New York, New Jersey, Puerto Rico, Illinois, Michigan, Wisconsin
Employment Concentration: Fourteen states and Puerto Rico have a specialized concentration of jobs in the medical device and equipment subsector.
Specialized States: Puerto Rico, Minnesota, Utah, Delaware, Indiana, Massachusetts, Connecticut, Nebraska, Colorado, South Dakota, California, Wisconsin, Vermont, New Hampshire, New Jersey
Concentrated States: Tennessee, Michigan, Pennsylvania
Employment Growth: From 2007-12, 32 states experienced some increase in subsector jobs with 12 states having substantial increases led by Colorado, Arizona, Michigan, and North Carolina.
Large and Specialized States: Four states have both a large employment base and a specialized concentration of jobs in medical devices and equipment (Table 11).
Table 11. States with Large and Specialized Employment in Medical Devices and Equipment, 2012
State Establishments Employment Location Quotient
Share of U.S. Employment
California 1,039 61,698 1.55 17.7%
Minnesota 308 26,677 3.73 7.6%
Massachusetts 289 20,599 2.32 5.9%
Indiana 155 18,847 2.48 5.4%
Source: Battelle analysis of BLS, QCEW data; enhanced file from IMPLAN.
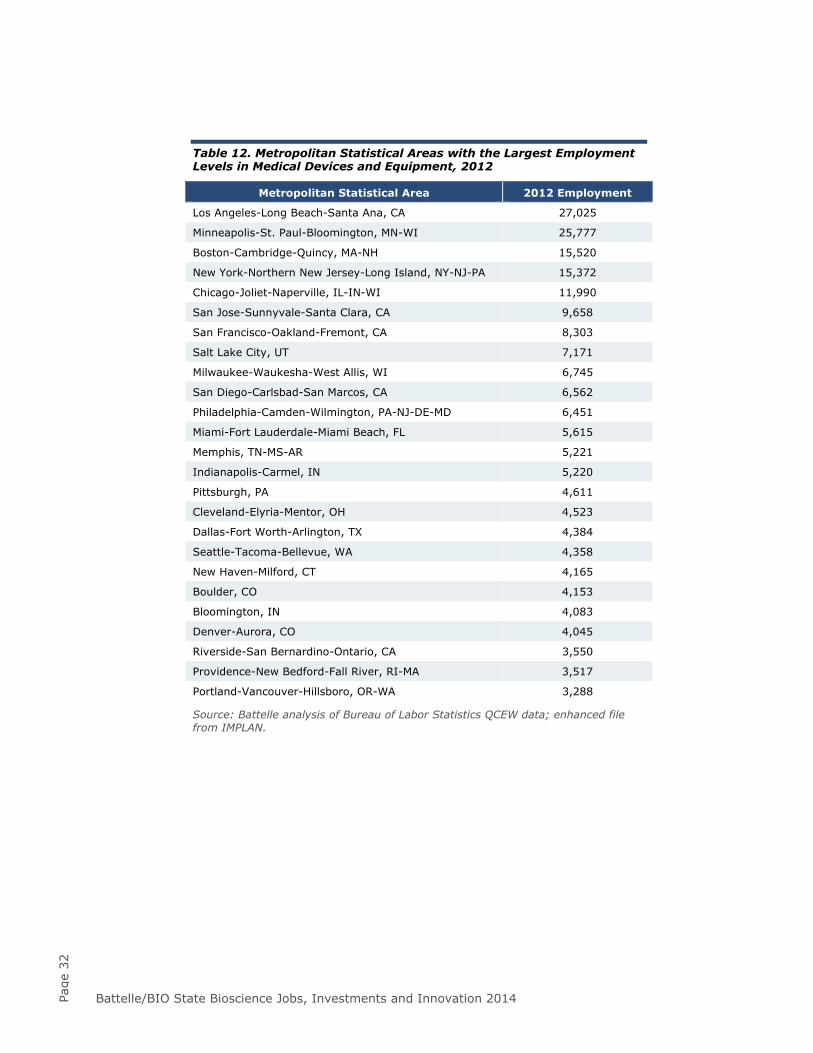
Battelle/BIO State Bioscience Jobs, Investments and Innovation 2014 Page
32
Table 12. Metropolitan Statistical Areas with the Largest Employment Levels in Medical Devices and Equipment, 2012
Metropolitan Statistical Area 2012 Employment
Los Angeles-Long Beach-Santa Ana, CA 27,025
Minneapolis-St. Paul-Bloomington, MN-WI 25,777
Boston-Cambridge-Quincy, MA-NH 15,520
New York-Northern New Jersey-Long Island, NY-NJ-PA 15,372
Chicago-Joliet-Naperville, IL-IN-WI 11,990
San Jose-Sunnyvale-Santa Clara, CA 9,658
San Francisco-Oakland-Fremont, CA 8,303
Salt Lake City, UT 7,171
Milwaukee-Waukesha-West Allis, WI 6,745
San Diego-Carlsbad-San Marcos, CA 6,562
Philadelphia-Camden-Wilmington, PA-NJ-DE-MD 6,451
Miami-Fort Lauderdale-Miami Beach, FL 5,615
Memphis, TN-MS-AR 5,221
Indianapolis-Carmel, IN 5,220
Pittsburgh, PA 4,611
Cleveland-Elyria-Mentor, OH 4,523
Dallas-Fort Worth-Arlington, TX 4,384
Seattle-Tacoma-Bellevue, WA 4,358
New Haven-Milford, CT 4,165
Boulder, CO 4,153
Bloomington, IN 4,083
Denver-Aurora, CO 4,045
Riverside-San Bernardino-Ontario, CA 3,550
Providence-New Bedford-Fall River, RI-MA 3,517
Portland-Vancouver-Hillsboro, OR-WA 3,288
Source: Battelle analysis of Bureau of Labor Statistics QCEW data; enhanced file from IMPLAN.
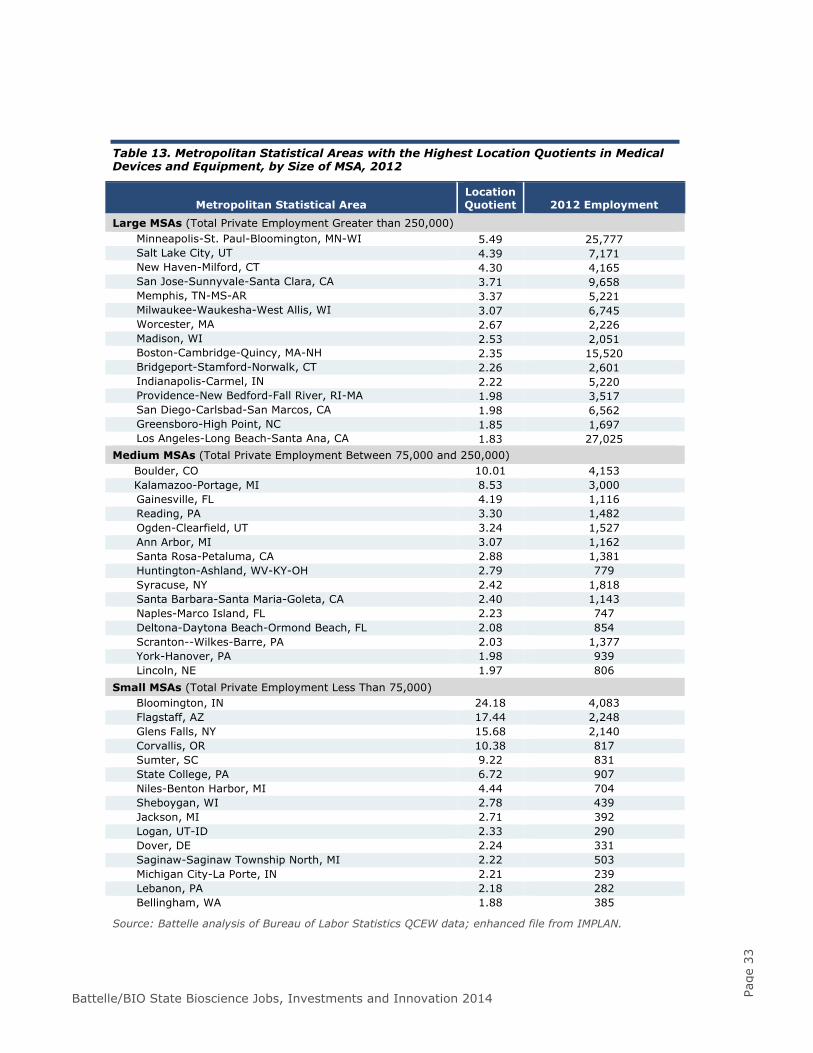
Battelle/BIO State Bioscience Jobs, Investments and Innovation 2014 Page
33
Table 13. Metropolitan Statistical Areas with the Highest Location Quotients in Medical Devices and Equipment, by Size of MSA, 2012
Metropolitan Statistical Area Location Quotient 2012 Employment
Large MSAs (Total Private Employment Greater than 250,000) Minneapolis-St. Paul-Bloomington, MN-WI 5.49 25,777 Salt Lake City, UT 4.39 7,171 New Haven-Milford, CT 4.30 4,165 San Jose-Sunnyvale-Santa Clara, CA 3.71 9,658 Memphis, TN-MS-AR 3.37 5,221 Milwaukee-Waukesha-West Allis, WI 3.07 6,745 Worcester, MA 2.67 2,226 Madison, WI 2.53 2,051 Boston-Cambridge-Quincy, MA-NH 2.35 15,520 Bridgeport-Stamford-Norwalk, CT 2.26 2,601 Indianapolis-Carmel, IN 2.22 5,220 Providence-New Bedford-Fall River, RI-MA 1.98 3,517 San Diego-Carlsbad-San Marcos, CA 1.98 6,562 Greensboro-High Point, NC 1.85 1,697 Los Angeles-Long Beach-Santa Ana, CA 1.83 27,025
Medium MSAs (Total Private Employment Between 75,000 and 250,000) Boulder, CO 10.01 4,153 Kalamazoo-Portage, MI 8.53 3,000 Gainesville, FL 4.19 1,116 Reading, PA 3.30 1,482 Ogden-Clearfield, UT 3.24 1,527 Ann Arbor, MI 3.07 1,162 Santa Rosa-Petaluma, CA 2.88 1,381 Huntington-Ashland, WV-KY-OH 2.79 779 Syracuse, NY 2.42 1,818 Santa Barbara-Santa Maria-Goleta, CA 2.40 1,143 Naples-Marco Island, FL 2.23 747 Deltona-Daytona Beach-Ormond Beach, FL 2.08 854 Scranton--Wilkes-Barre, PA 2.03 1,377 York-Hanover, PA 1.98 939 Lincoln, NE 1.97 806
Small MSAs (Total Private Employment Less Than 75,000) Bloomington, IN 24.18 4,083 Flagstaff, AZ 17.44 2,248 Glens Falls, NY 15.68 2,140 Corvallis, OR 10.38 817 Sumter, SC 9.22 831 State College, PA 6.72 907 Niles-Benton Harbor, MI 4.44 704 Sheboygan, WI 2.78 439 Jackson, MI 2.71 392 Logan, UT-ID 2.33 290 Dover, DE 2.24 331 Saginaw-Saginaw Township North, MI 2.22 503 Michigan City-La Porte, IN 2.21 239 Lebanon, PA 2.18 282 Bellingham, WA 1.88 385
Source: Battelle analysis of Bureau of Labor Statistics QCEW data; enhanced file from IMPLAN.
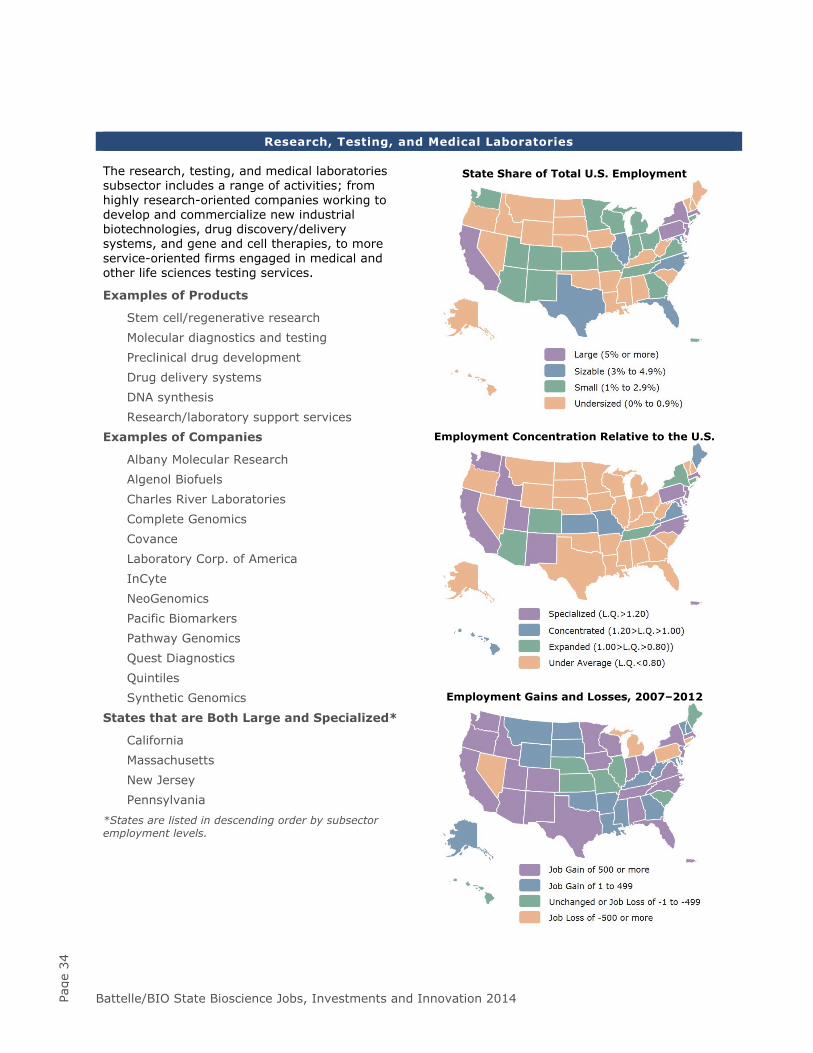
Battelle/BIO State Bioscience Jobs, Investments and Innovation 2014 Page
34
Research, Testing, and Medical Laboratories The research, testing, and medical laboratories subsector includes a range of activities; from highly research-oriented companies working to develop and commercialize new industrial biotechnologies, drug discovery/delivery systems, and gene and cell therapies, to more service-oriented firms engaged in medical and other life sciences testing services.
Examples of Products
Stem cell/regenerative research Molecular diagnostics and testing Preclinical drug development Drug delivery systems DNA synthesis Research/laboratory support services
Examples of Companies
Albany Molecular Research Algenol Biofuels Charles River Laboratories Complete Genomics Covance Laboratory Corp. of America InCyte NeoGenomics Pacific Biomarkers Pathway Genomics Quest Diagnostics Quintiles Synthetic Genomics
States that are Both Large and Specialized*
California Massachusetts New Jersey Pennsylvania
*States are listed in descending order by subsector employment levels.
State Share of Total U.S. Employment
Employment Concentration Relative to the U.S.
Employment Gains and Losses, 2007–2012
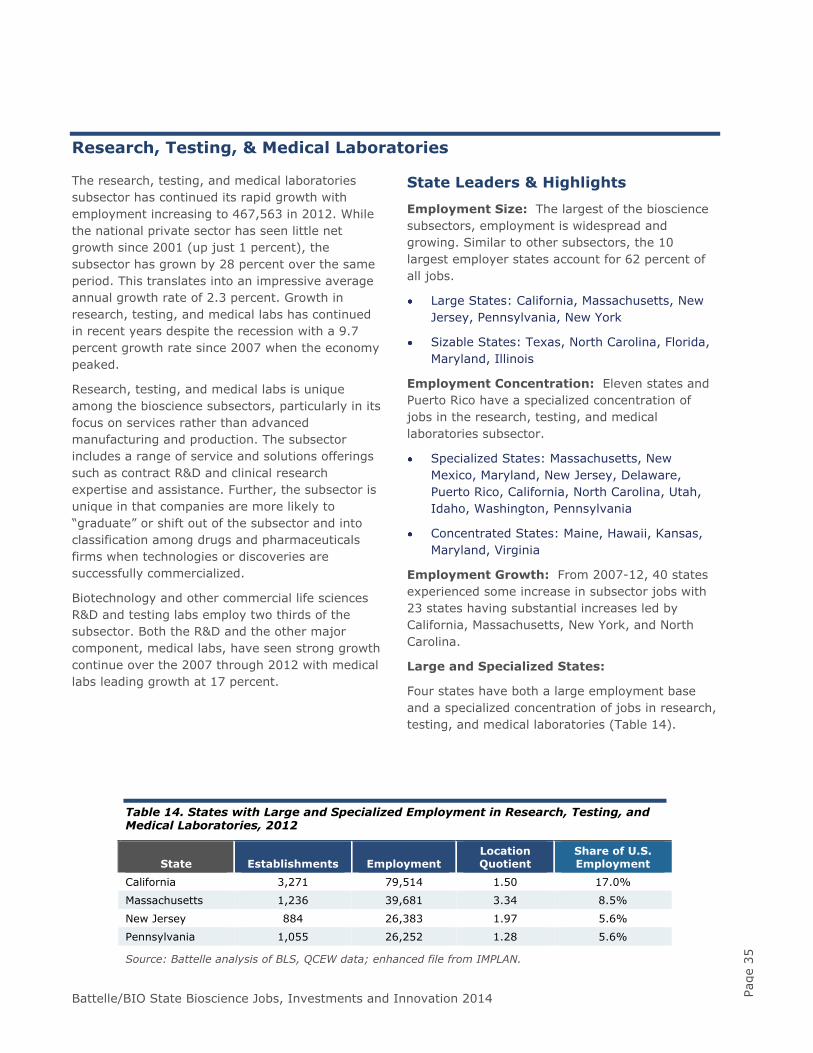
Battelle/BIO State Bioscience Jobs, Investments and Innovation 2014 Page
35
Research, Testing, & Medical Laboratories
The research, testing, and medical laboratories subsector has continued its rapid growth with employment increasing to 467,563 in 2012. While the national private sector has seen little net growth since 2001 (up just 1 percent), the subsector has grown by 28 percent over the same period. This translates into an impressive average annual growth rate of 2.3 percent. Growth in research, testing, and medical labs has continued in recent years despite the recession with a 9.7 percent growth rate since 2007 when the economy peaked.
Research, testing, and medical labs is unique among the bioscience subsectors, particularly in its focus on services rather than advanced manufacturing and production. The subsector includes a range of service and solutions offerings such as contract R&D and clinical research expertise and assistance. Further, the subsector is unique in that companies are more likely to “graduate” or shift out of the subsector and into classification among drugs and pharmaceuticals firms when technologies or discoveries are successfully commercialized.
Biotechnology and other commercial life sciences R&D and testing labs employ two thirds of the subsector. Both the R&D and the other major component, medical labs, have seen strong growth continue over the 2007 through 2012 with medical labs leading growth at 17 percent.
State Leaders & Highlights
Employment Size: The largest of the bioscience subsectors, employment is widespread and growing. Similar to other subsectors, the 10 largest employer states account for 62 percent of all jobs.
Large States: California, Massachusetts, New Jersey, Pennsylvania, New York
Sizable States: Texas, North Carolina, Florida, Maryland, Illinois
Employment Concentration: Eleven states and Puerto Rico have a specialized concentration of jobs in the research, testing, and medical laboratories subsector.
Specialized States: Massachusetts, New Mexico, Maryland, New Jersey, Delaware, Puerto Rico, California, North Carolina, Utah, Idaho, Washington, Pennsylvania
Concentrated States: Maine, Hawaii, Kansas, Maryland, Virginia
Employment Growth: From 2007-12, 40 states experienced some increase in subsector jobs with 23 states having substantial increases led by California, Massachusetts, New York, and North Carolina.
Large and Specialized States:
Four states have both a large employment base and a specialized concentration of jobs in research, testing, and medical laboratories (Table 14).
Table 14. States with Large and Specialized Employment in Research, Testing, and Medical Laboratories, 2012
State Establishments Employment Location Quotient
Share of U.S. Employment
California 3,271 79,514 1.50 17.0%
Massachusetts 1,236 39,681 3.34 8.5%
New Jersey 884 26,383 1.97 5.6%
Pennsylvania 1,055 26,252 1.28 5.6%
Source: Battelle analysis of BLS, QCEW data; enhanced file from IMPLAN.
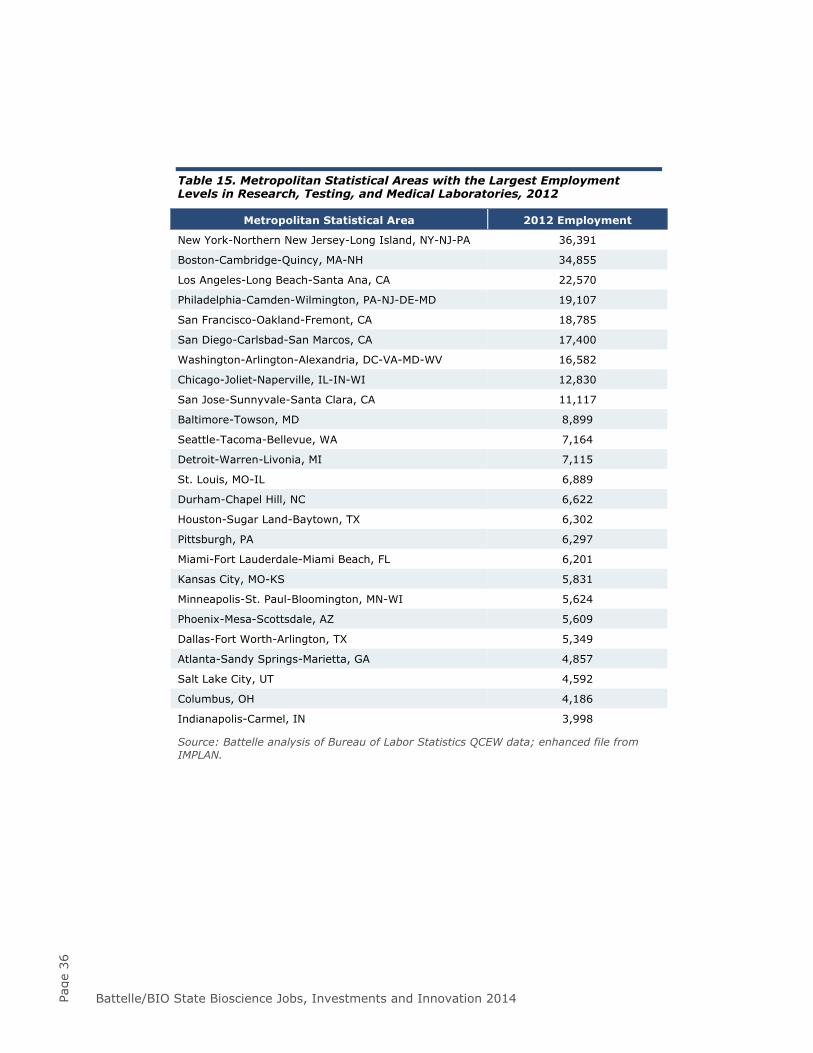
Battelle/BIO State Bioscience Jobs, Investments and Innovation 2014 Page
36
Table 15. Metropolitan Statistical Areas with the Largest Employment Levels in Research, Testing, and Medical Laboratories, 2012
Metropolitan Statistical Area 2012 Employment
New York-Northern New Jersey-Long Island, NY-NJ-PA 36,391
Boston-Cambridge-Quincy, MA-NH 34,855
Los Angeles-Long Beach-Santa Ana, CA 22,570
Philadelphia-Camden-Wilmington, PA-NJ-DE-MD 19,107
San Francisco-Oakland-Fremont, CA 18,785
San Diego-Carlsbad-San Marcos, CA 17,400
Washington-Arlington-Alexandria, DC-VA-MD-WV 16,582
Chicago-Joliet-Naperville, IL-IN-WI 12,830
San Jose-Sunnyvale-Santa Clara, CA 11,117
Baltimore-Towson, MD 8,899
Seattle-Tacoma-Bellevue, WA 7,164
Detroit-Warren-Livonia, MI 7,115
St. Louis, MO-IL 6,889
Durham-Chapel Hill, NC 6,622
Houston-Sugar Land-Baytown, TX 6,302
Pittsburgh, PA 6,297
Miami-Fort Lauderdale-Miami Beach, FL 6,201
Kansas City, MO-KS 5,831
Minneapolis-St. Paul-Bloomington, MN-WI 5,624
Phoenix-Mesa-Scottsdale, AZ 5,609
Dallas-Fort Worth-Arlington, TX 5,349
Atlanta-Sandy Springs-Marietta, GA 4,857
Salt Lake City, UT 4,592
Columbus, OH 4,186
Indianapolis-Carmel, IN 3,998
Source: Battelle analysis of Bureau of Labor Statistics QCEW data; enhanced file from IMPLAN.
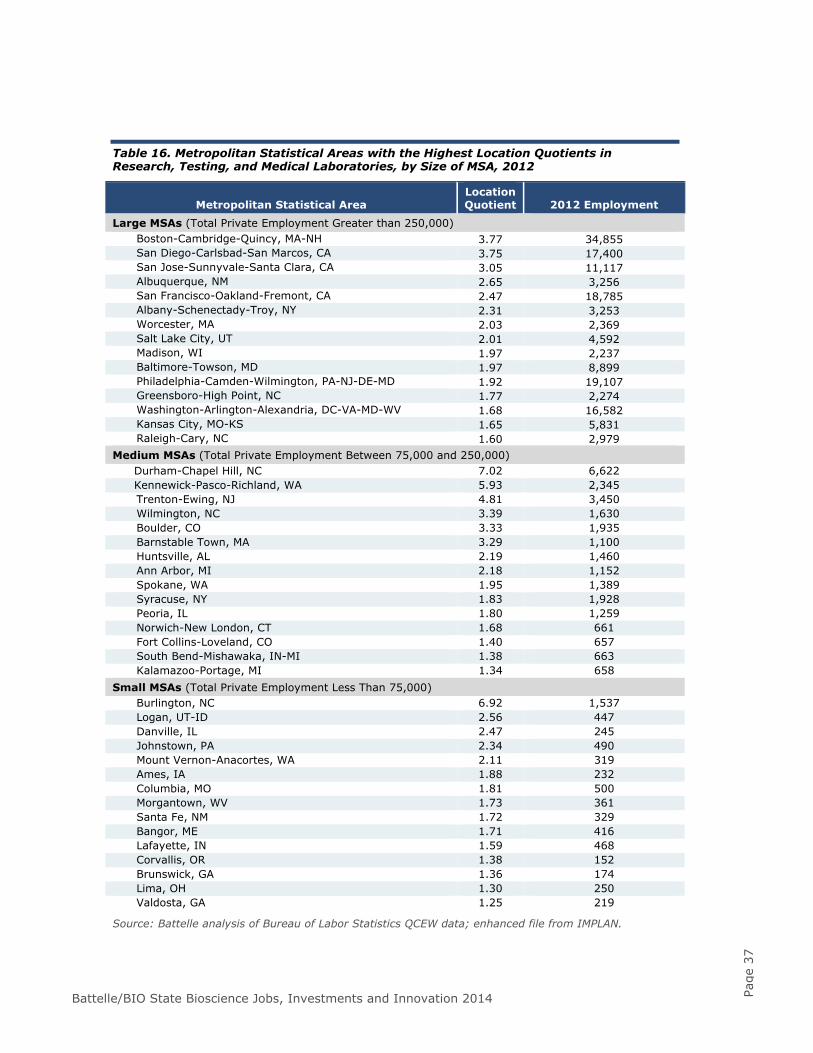
Battelle/BIO State Bioscience Jobs, Investments and Innovation 2014 Page
37
Table 16. Metropolitan Statistical Areas with the Highest Location Quotients in Research, Testing, and Medical Laboratories, by Size of MSA, 2012
Metropolitan Statistical Area Location Quotient 2012 Employment
Large MSAs (Total Private Employment Greater than 250,000) Boston-Cambridge-Quincy, MA-NH 3.77 34,855 San Diego-Carlsbad-San Marcos, CA 3.75 17,400 San Jose-Sunnyvale-Santa Clara, CA 3.05 11,117 Albuquerque, NM 2.65 3,256 San Francisco-Oakland-Fremont, CA 2.47 18,785 Albany-Schenectady-Troy, NY 2.31 3,253 Worcester, MA 2.03 2,369 Salt Lake City, UT 2.01 4,592 Madison, WI 1.97 2,237 Baltimore-Towson, MD 1.97 8,899 Philadelphia-Camden-Wilmington, PA-NJ-DE-MD 1.92 19,107 Greensboro-High Point, NC 1.77 2,274 Washington-Arlington-Alexandria, DC-VA-MD-WV 1.68 16,582 Kansas City, MO-KS 1.65 5,831 Raleigh-Cary, NC 1.60 2,979
Medium MSAs (Total Private Employment Between 75,000 and 250,000) Durham-Chapel Hill, NC 7.02 6,622 Kennewick-Pasco-Richland, WA 5.93 2,345 Trenton-Ewing, NJ 4.81 3,450 Wilmington, NC 3.39 1,630 Boulder, CO 3.33 1,935 Barnstable Town, MA 3.29 1,100 Huntsville, AL 2.19 1,460 Ann Arbor, MI 2.18 1,152 Spokane, WA 1.95 1,389 Syracuse, NY 1.83 1,928 Peoria, IL 1.80 1,259 Norwich-New London, CT 1.68 661 Fort Collins-Loveland, CO 1.40 657 South Bend-Mishawaka, IN-MI 1.38 663 Kalamazoo-Portage, MI 1.34 658
Small MSAs (Total Private Employment Less Than 75,000) Burlington, NC 6.92 1,537 Logan, UT-ID 2.56 447 Danville, IL 2.47 245 Johnstown, PA 2.34 490 Mount Vernon-Anacortes, WA 2.11 319 Ames, IA 1.88 232 Columbia, MO 1.81 500 Morgantown, WV 1.73 361 Santa Fe, NM 1.72 329 Bangor, ME 1.71 416 Lafayette, IN 1.59 468 Corvallis, OR 1.38 152 Brunswick, GA 1.36 174 Lima, OH 1.30 250 Valdosta, GA 1.25 219
Source: Battelle analysis of Bureau of Labor Statistics QCEW data; enhanced file from IMPLAN.
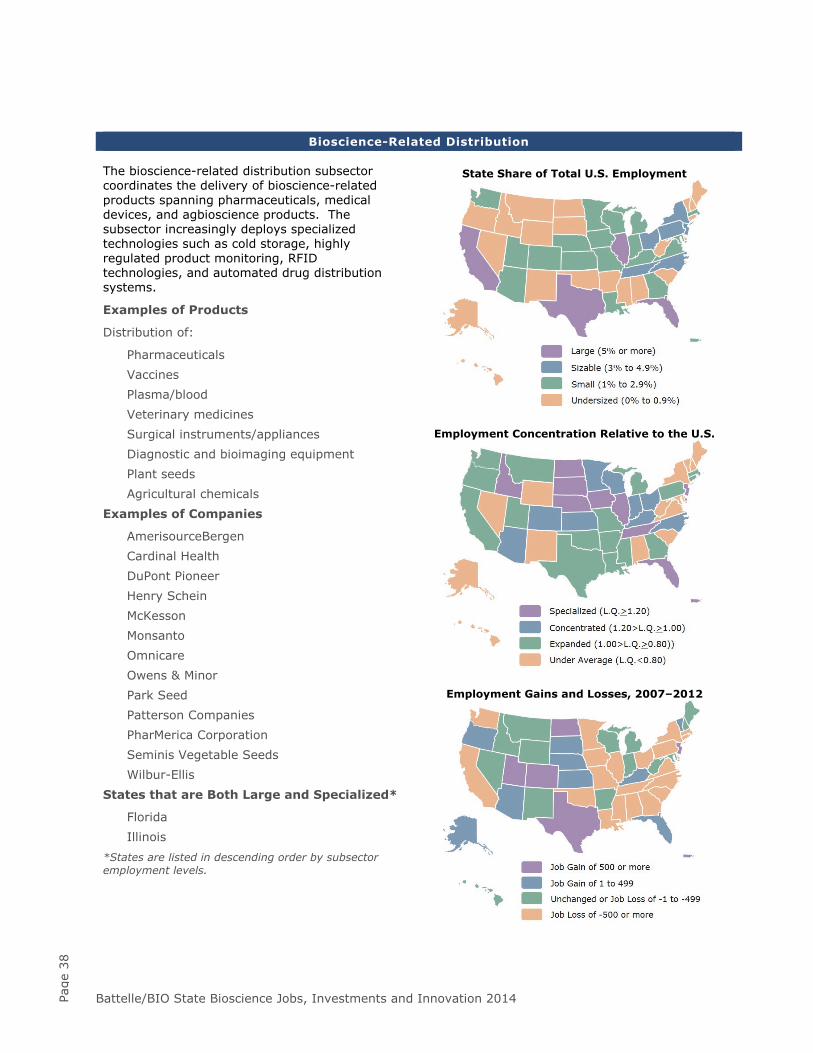
Battelle/BIO State Bioscience Jobs, Investments and Innovation 2014 Page
38
Bioscience-Related Distribution The bioscience-related distribution subsector coordinates the delivery of bioscience-related products spanning pharmaceuticals, medical devices, and agbioscience products. The subsector increasingly deploys specialized technologies such as cold storage, highly regulated product monitoring, RFID technologies, and automated drug distribution systems.
Examples of Products
Distribution of:
Pharmaceuticals Vaccines Plasma/blood Veterinary medicines Surgical instruments/appliances Diagnostic and bioimaging equipment Plant seeds Agricultural chemicals
Examples of Companies
AmerisourceBergen Cardinal Health DuPont Pioneer Henry Schein McKesson Monsanto Omnicare Owens & Minor Park Seed Patterson Companies PharMerica Corporation Seminis Vegetable Seeds Wilbur-Ellis
States that are Both Large and Specialized*
Florida Illinois
*States are listed in descending order by subsector employment levels.
State Share of Total U.S. Employment
Employment Concentration Relative to the U.S.
Employment Gains and Losses, 2007–2012
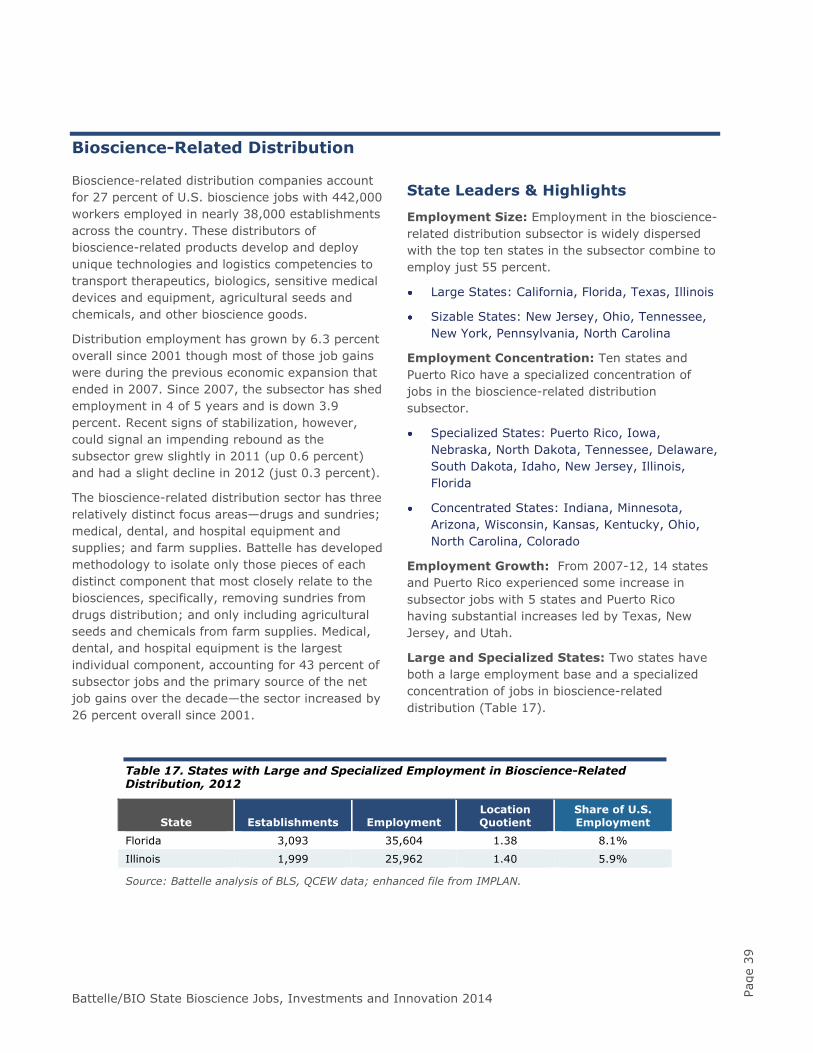
Battelle/BIO State Bioscience Jobs, Investments and Innovation 2014 Page
39
Bioscience-Related Distribution
Bioscience-related distribution companies account for 27 percent of U.S. bioscience jobs with 442,000 workers employed in nearly 38,000 establishments across the country. These distributors of bioscience-related products develop and deploy unique technologies and logistics competencies to transport therapeutics, biologics, sensitive medical devices and equipment, agricultural seeds and chemicals, and other bioscience goods.
Distribution employment has grown by 6.3 percent overall since 2001 though most of those job gains were during the previous economic expansion that ended in 2007. Since 2007, the subsector has shed employment in 4 of 5 years and is down 3.9 percent. Recent signs of stabilization, however, could signal an impending rebound as the subsector grew slightly in 2011 (up 0.6 percent) and had a slight decline in 2012 (just 0.3 percent).
The bioscience-related distribution sector has three relatively distinct focus areas—drugs and sundries; medical, dental, and hospital equipment and supplies; and farm supplies. Battelle has developed methodology to isolate only those pieces of each distinct component that most closely relate to the biosciences, specifically, removing sundries from drugs distribution; and only including agricultural seeds and chemicals from farm supplies. Medical, dental, and hospital equipment is the largest individual component, accounting for 43 percent of subsector jobs and the primary source of the net job gains over the decade—the sector increased by 26 percent overall since 2001.
State Leaders & Highlights
Employment Size: Employment in the bioscience-related distribution subsector is widely dispersed with the top ten states in the subsector combine to employ just 55 percent.
Large States: California, Florida, Texas, Illinois
Sizable States: New Jersey, Ohio, Tennessee, New York, Pennsylvania, North Carolina
Employment Concentration: Ten states and Puerto Rico have a specialized concentration of jobs in the bioscience-related distribution subsector.
Specialized States: Puerto Rico, Iowa, Nebraska, North Dakota, Tennessee, Delaware, South Dakota, Idaho, New Jersey, Illinois, Florida
Concentrated States: Indiana, Minnesota, Arizona, Wisconsin, Kansas, Kentucky, Ohio, North Carolina, Colorado
Employment Growth: From 2007-12, 14 states and Puerto Rico experienced some increase in subsector jobs with 5 states and Puerto Rico having substantial increases led by Texas, New Jersey, and Utah.
Large and Specialized States: Two states have both a large employment base and a specialized concentration of jobs in bioscience-related distribution (Table 17).
Table 17. States with Large and Specialized Employment in Bioscience-Related Distribution, 2012
State Establishments Employment Location Quotient
Share of U.S. Employment
Florida 3,093 35,604 1.38 8.1%
Illinois 1,999 25,962 1.40 5.9%
Source: Battelle analysis of BLS, QCEW data; enhanced file from IMPLAN.
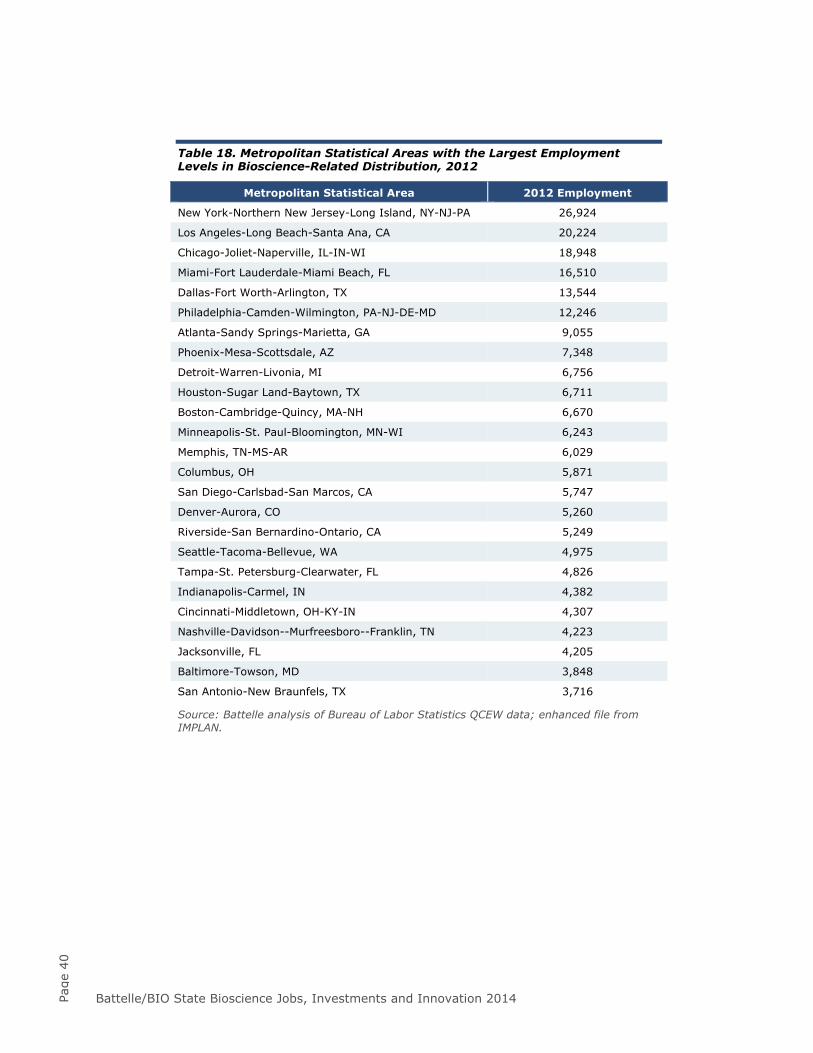
Battelle/BIO State Bioscience Jobs, Investments and Innovation 2014 Page
40
Table 18. Metropolitan Statistical Areas with the Largest Employment Levels in Bioscience-Related Distribution, 2012
Metropolitan Statistical Area 2012 Employment
New York-Northern New Jersey-Long Island, NY-NJ-PA 26,924
Los Angeles-Long Beach-Santa Ana, CA 20,224
Chicago-Joliet-Naperville, IL-IN-WI 18,948
Miami-Fort Lauderdale-Miami Beach, FL 16,510
Dallas-Fort Worth-Arlington, TX 13,544
Philadelphia-Camden-Wilmington, PA-NJ-DE-MD 12,246
Atlanta-Sandy Springs-Marietta, GA 9,055
Phoenix-Mesa-Scottsdale, AZ 7,348
Detroit-Warren-Livonia, MI 6,756
Houston-Sugar Land-Baytown, TX 6,711
Boston-Cambridge-Quincy, MA-NH 6,670
Minneapolis-St. Paul-Bloomington, MN-WI 6,243
Memphis, TN-MS-AR 6,029
Columbus, OH 5,871
San Diego-Carlsbad-San Marcos, CA 5,747
Denver-Aurora, CO 5,260
Riverside-San Bernardino-Ontario, CA 5,249
Seattle-Tacoma-Bellevue, WA 4,975
Tampa-St. Petersburg-Clearwater, FL 4,826
Indianapolis-Carmel, IN 4,382
Cincinnati-Middletown, OH-KY-IN 4,307
Nashville-Davidson--Murfreesboro--Franklin, TN 4,223
Jacksonville, FL 4,205
Baltimore-Towson, MD 3,848
San Antonio-New Braunfels, TX 3,716
Source: Battelle analysis of Bureau of Labor Statistics QCEW data; enhanced file from IMPLAN.
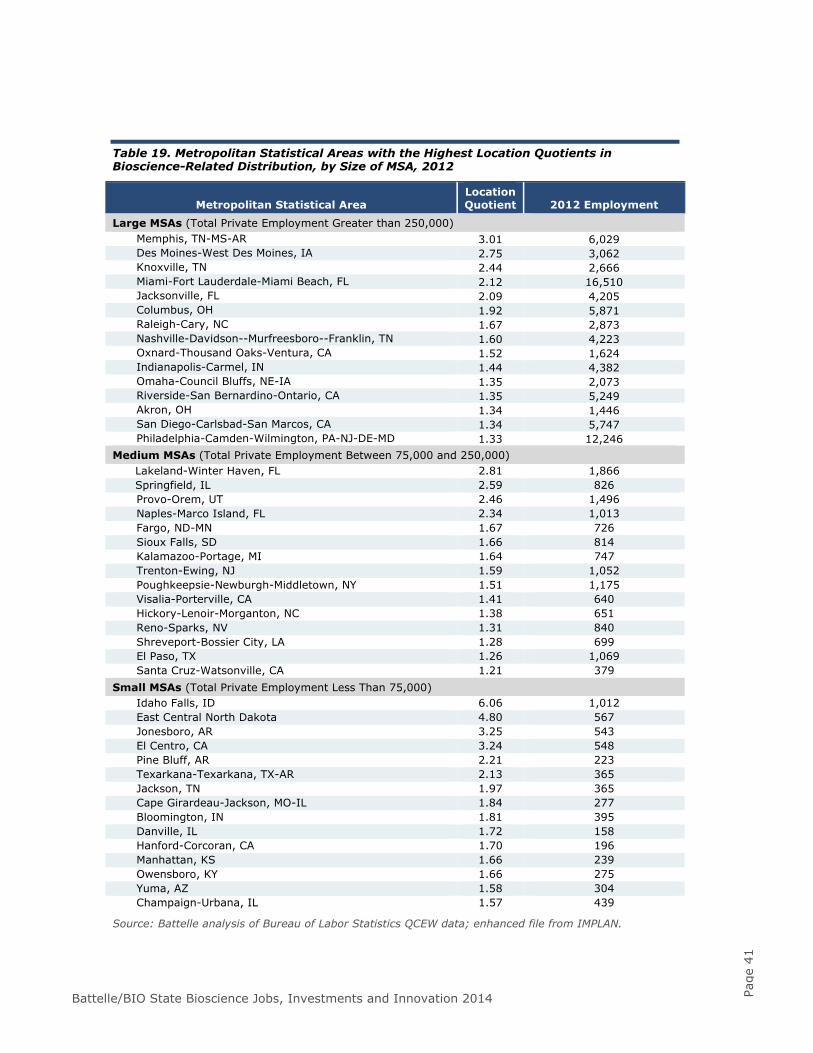
Battelle/BIO State Bioscience Jobs, Investments and Innovation 2014 Page
41
Table 19. Metropolitan Statistical Areas with the Highest Location Quotients in Bioscience-Related Distribution, by Size of MSA, 2012
Metropolitan Statistical Area Location Quotient 2012 Employment
Large MSAs (Total Private Employment Greater than 250,000) Memphis, TN-MS-AR 3.01 6,029 Des Moines-West Des Moines, IA 2.75 3,062 Knoxville, TN 2.44 2,666 Miami-Fort Lauderdale-Miami Beach, FL 2.12 16,510 Jacksonville, FL 2.09 4,205 Columbus, OH 1.92 5,871 Raleigh-Cary, NC 1.67 2,873 Nashville-Davidson--Murfreesboro--Franklin, TN 1.60 4,223 Oxnard-Thousand Oaks-Ventura, CA 1.52 1,624 Indianapolis-Carmel, IN 1.44 4,382 Omaha-Council Bluffs, NE-IA 1.35 2,073 Riverside-San Bernardino-Ontario, CA 1.35 5,249 Akron, OH 1.34 1,446 San Diego-Carlsbad-San Marcos, CA 1.34 5,747 Philadelphia-Camden-Wilmington, PA-NJ-DE-MD 1.33 12,246
Medium MSAs (Total Private Employment Between 75,000 and 250,000) Lakeland-Winter Haven, FL 2.81 1,866 Springfield, IL 2.59 826 Provo-Orem, UT 2.46 1,496 Naples-Marco Island, FL 2.34 1,013 Fargo, ND-MN 1.67 726 Sioux Falls, SD 1.66 814 Kalamazoo-Portage, MI 1.64 747 Trenton-Ewing, NJ 1.59 1,052 Poughkeepsie-Newburgh-Middletown, NY 1.51 1,175 Visalia-Porterville, CA 1.41 640 Hickory-Lenoir-Morganton, NC 1.38 651 Reno-Sparks, NV 1.31 840 Shreveport-Bossier City, LA 1.28 699 El Paso, TX 1.26 1,069 Santa Cruz-Watsonville, CA 1.21 379
Small MSAs (Total Private Employment Less Than 75,000) Idaho Falls, ID 6.06 1,012 East Central North Dakota 4.80 567 Jonesboro, AR 3.25 543 El Centro, CA 3.24 548 Pine Bluff, AR 2.21 223 Texarkana-Texarkana, TX-AR 2.13 365 Jackson, TN 1.97 365 Cape Girardeau-Jackson, MO-IL 1.84 277 Bloomington, IN 1.81 395 Danville, IL 1.72 158 Hanford-Corcoran, CA 1.70 196 Manhattan, KS 1.66 239 Owensboro, KY 1.66 275 Yuma, AZ 1.58 304 Champaign-Urbana, IL 1.57 439
Source: Battelle analysis of Bureau of Labor Statistics QCEW data; enhanced file from IMPLAN.

Battelle/BIO State Bioscience Jobs, Investments and Innovation 2014 Page
43
State Bioscience Innovation Performance Metrics
Given the concerns and issues relating to the U.S. bioscience innovation ecosystem, this year’s report features an examination of key performance measures driving bioscience innovation on a state-by-state basis, including:
Academic bioscience R&D expenditures
National Institutes of Health (NIH) funding
Venture capital investments in bioscience companies
Bioscience-related patents invented within the state.
The analysis is presented for the leading states in each metric. Controlling for size and population, many states emerge as leaders in the biosciences.
Academic Bioscience R&D Expenditures A key driver for biosciences development is a state’s base of university bioscience research assets and excellence. More than most other technology-based industry clusters, biosciences industrial development is driven by the ability to catalyze a robust and integral relationship between the industry and academic research and development communities.
The bioscience industry specifically benefits from close connections to research universities given the unique translational “bench to bedside” research requirements for advancing biomedical development. The connection between biomedical product advancement and clinical care is not simply one of advancing a supplier and buyer relationship. Advances in biosciences to treat human health require extensive clinical trials to ensure the safety and efficacy of new medical products, which in turn call for close collaborations between industry, researchers, and clinicians.
The nation’s colleges and universities directed $38.1 billion in R&D expenditures toward research in the biosciences in fiscal year (FY) 2012. Research dollars are spread across all states; however, as shown in Table 20, states with larger populations and states with large, multi-institution
academic infrastructures lead in total academic bioscience R&D.
Smaller states emerge among the high-growth leaders certainly due, in part, to a smaller original base of expenditures though rates are particularly high for many of these states. Some growth rates exceed 40 percent growth over a relatively short, 3-year period. Florida and New York, for example, appear on both lists in Table 20 seeing impressive R&D growth among an already large base of bioscience research activity.
On a per-capita basis, other states emerge as leaders in academic bioscience R&D. The District of Columbia, with significant levels of bioscience R&D at Georgetown University and George Washington University, leads the nation (Table 21). Other states with a highly concentrated bioscience research complex include Maryland, Massachusetts, and North Carolina. North Carolina’s academic institutions are heavily focused in the biosciences relative to other fields, as it appears among the national leaders in the share of research activity in the biosciences relative to all other fields. Missouri leads this list with nearly 85 percent of all academic research expenditures in the biosciences.
As with the industry-based definition of biosciences presented in the previous section, the biosciences in this context do not include health services.
For comparability, the various metrics are converted into a per-capita measure (or into a “per 1 million population” metric) in the tables in this section. In some instances, when a state’s population is less than 1 million, the number shown in the table may be greater than the actual magnitude of the metric.
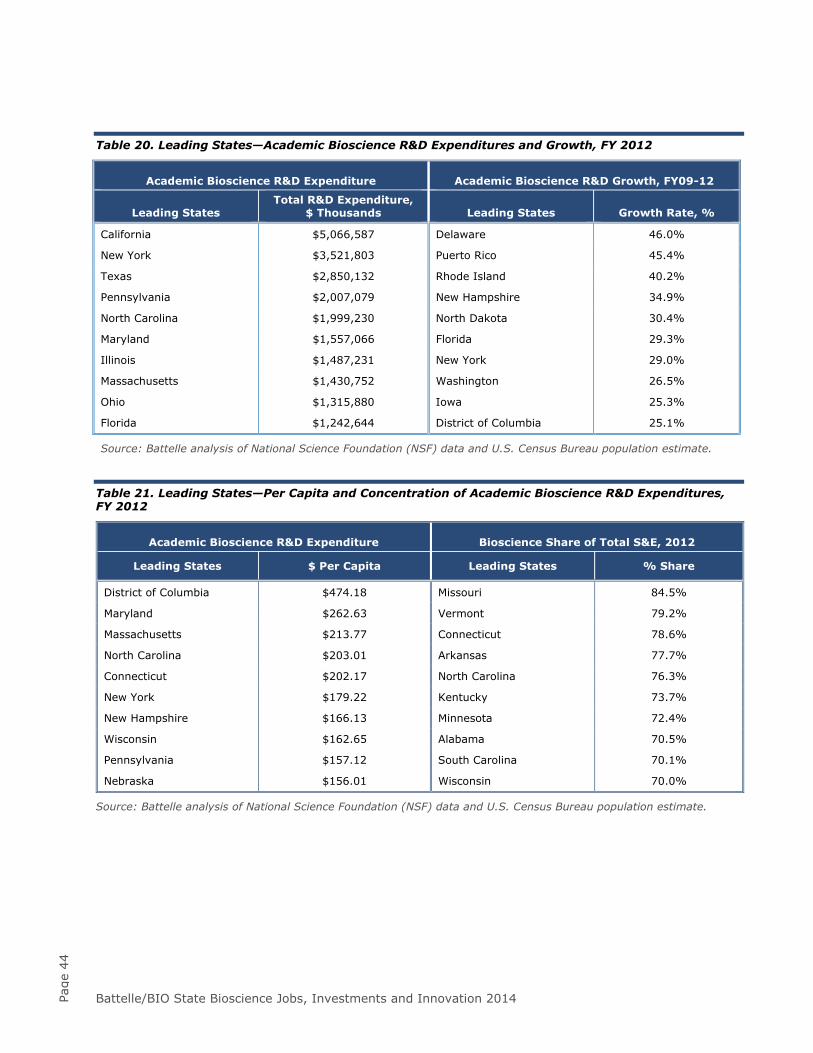
Battelle/BIO State Bioscience Jobs, Investments and Innovation 2014 Page
44
Table 20. Leading States—Academic Bioscience R&D Expenditures and Growth, FY 2012
Academic Bioscience R&D Expenditure Academic Bioscience R&D Growth, FY09-12
Leading States Total R&D Expenditure,
$ Thousands Leading States Growth Rate, %
California $5,066,587 Delaware 46.0%
New York $3,521,803 Puerto Rico 45.4%
Texas $2,850,132 Rhode Island 40.2%
Pennsylvania $2,007,079 New Hampshire 34.9%
North Carolina $1,999,230 North Dakota 30.4%
Maryland $1,557,066 Florida 29.3%
Illinois $1,487,231 New York 29.0%
Massachusetts $1,430,752 Washington 26.5%
Ohio $1,315,880 Iowa 25.3%
Florida $1,242,644 District of Columbia 25.1%
Source: Battelle analysis of National Science Foundation (NSF) data and U.S. Census Bureau population estimate.
Table 21. Leading States—Per Capita and Concentration of Academic Bioscience R&D Expenditures, FY 2012
Academic Bioscience R&D Expenditure Bioscience Share of Total S&E, 2012
Leading States $ Per Capita Leading States % Share
District of Columbia $474.18 Missouri 84.5%
Maryland $262.63 Vermont 79.2%
Massachusetts $213.77 Connecticut 78.6%
North Carolina $203.01 Arkansas 77.7%
Connecticut $202.17 North Carolina 76.3%
New York $179.22 Kentucky 73.7%
New Hampshire $166.13 Minnesota 72.4%
Wisconsin $162.65 Alabama 70.5%
Pennsylvania $157.12 South Carolina 70.1%
Nebraska $156.01 Wisconsin 70.0%
Source: Battelle analysis of National Science Foundation (NSF) data and U.S. Census Bureau population estimate.
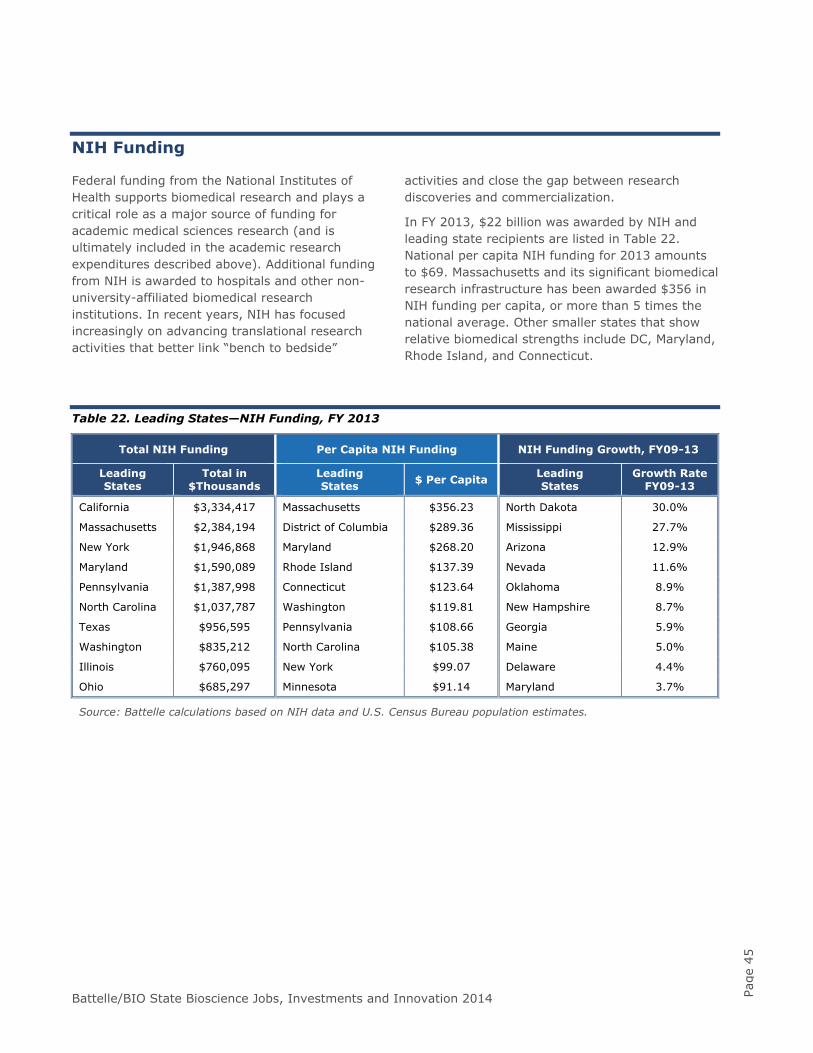
Battelle/BIO State Bioscience Jobs, Investments and Innovation 2014 Page
45
NIH Funding
Federal funding from the National Institutes of Health supports biomedical research and plays a critical role as a major source of funding for academic medical sciences research (and is ultimately included in the academic research expenditures described above). Additional funding from NIH is awarded to hospitals and other non-university-affiliated biomedical research institutions. In recent years, NIH has focused increasingly on advancing translational research activities that better link “bench to bedside”
activities and close the gap between research discoveries and commercialization.
In FY 2013, $22 billion was awarded by NIH and leading state recipients are listed in Table 22. National per capita NIH funding for 2013 amounts to $69. Massachusetts and its significant biomedical research infrastructure has been awarded $356 in NIH funding per capita, or more than 5 times the national average. Other smaller states that show relative biomedical strengths include DC, Maryland, Rhode Island, and Connecticut.
Table 22. Leading States—NIH Funding, FY 2013
Total NIH Funding Per Capita NIH Funding NIH Funding Growth, FY09-13
Leading States
Total in $Thousands
Leading States $ Per Capita Leading
States Growth Rate
FY09-13
California $3,334,417 Massachusetts $356.23 North Dakota 30.0%
Massachusetts $2,384,194 District of Columbia $289.36 Mississippi 27.7%
New York $1,946,868 Maryland $268.20 Arizona 12.9%
Maryland $1,590,089 Rhode Island $137.39 Nevada 11.6%
Pennsylvania $1,387,998 Connecticut $123.64 Oklahoma 8.9%
North Carolina $1,037,787 Washington $119.81 New Hampshire 8.7%
Texas $956,595 Pennsylvania $108.66 Georgia 5.9%
Washington $835,212 North Carolina $105.38 Maine 5.0%
Illinois $760,095 New York $99.07 Delaware 4.4%
Ohio $685,297 Minnesota $91.14 Maryland 3.7%
Source: Battelle calculations based on NIH data and U.S. Census Bureau population estimates.
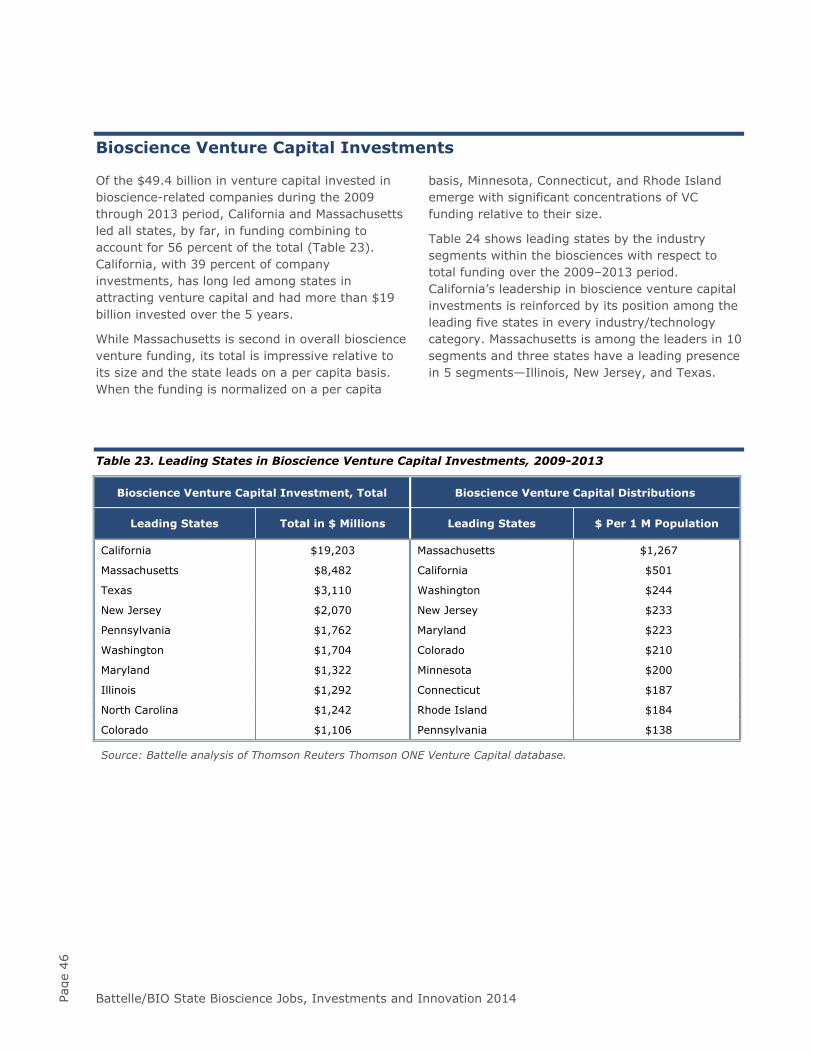
Battelle/BIO State Bioscience Jobs, Investments and Innovation 2014 Page
46
Bioscience Venture Capital Investments
Of the $49.4 billion in venture capital invested in bioscience-related companies during the 2009 through 2013 period, California and Massachusetts led all states, by far, in funding combining to account for 56 percent of the total (Table 23). California, with 39 percent of company investments, has long led among states in attracting venture capital and had more than $19 billion invested over the 5 years.
While Massachusetts is second in overall bioscience venture funding, its total is impressive relative to its size and the state leads on a per capita basis. When the funding is normalized on a per capita
basis, Minnesota, Connecticut, and Rhode Island emerge with significant concentrations of VC funding relative to their size.
Table 24 shows leading states by the industry segments within the biosciences with respect to total funding over the 2009–2013 period. California’s leadership in bioscience venture capital investments is reinforced by its position among the leading five states in every industry/technology category. Massachusetts is among the leaders in 10 segments and three states have a leading presence in 5 segments—Illinois, New Jersey, and Texas.
Table 23. Leading States in Bioscience Venture Capital Investments, 2009-2013
Bioscience Venture Capital Investment, Total Bioscience Venture Capital Distributions
Leading States Total in $ Millions Leading States $ Per 1 M Population
California $19,203 Massachusetts $1,267
Massachusetts $8,482 California $501
Texas $3,110 Washington $244
New Jersey $2,070 New Jersey $233
Pennsylvania $1,762 Maryland $223
Washington $1,704 Colorado $210
Maryland $1,322 Minnesota $200
Illinois $1,292 Connecticut $187
North Carolina $1,242 Rhode Island $184
Colorado $1,106 Pennsylvania $138
Source: Battelle analysis of Thomson Reuters Thomson ONE Venture Capital database.
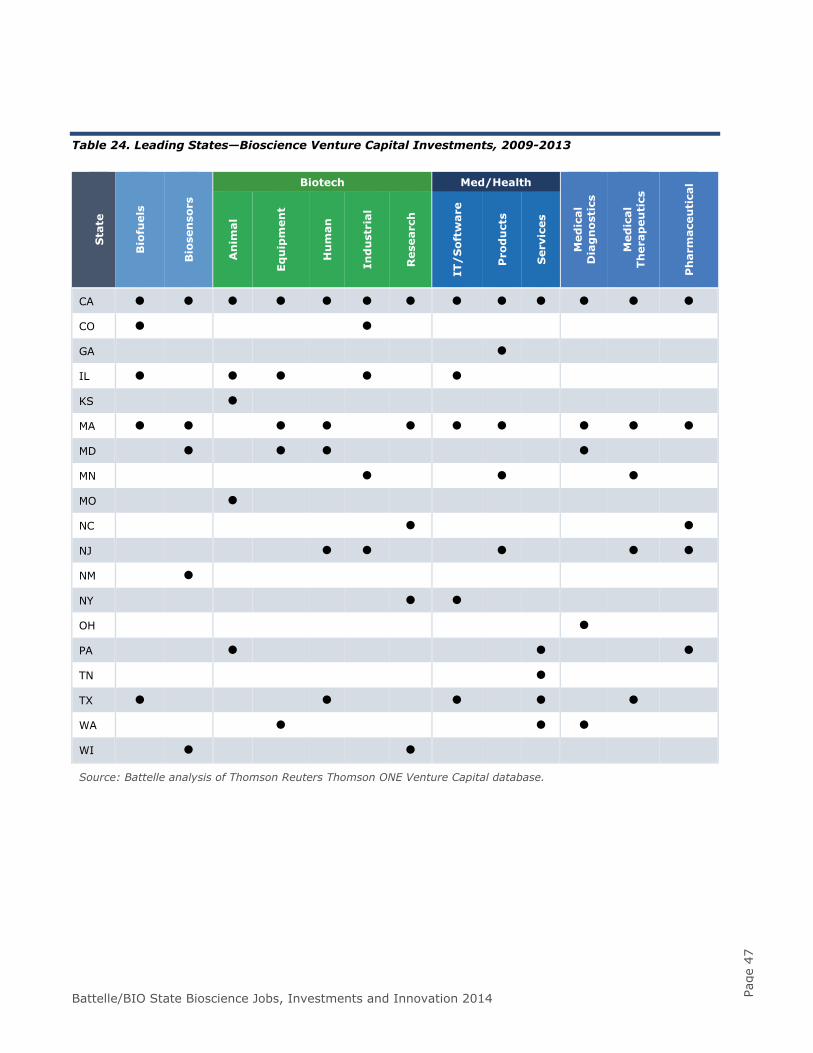
Battelle/BIO State Bioscience Jobs, Investments and Innovation 2014 Page
47
Table 24. Leading States—Bioscience Venture Capital Investments, 2009-2013
Sta
te
Bio
fuel
s
Bio
sen
sors
Biotech Med/Health
Med
ical
D
iag
nos
tics
Med
ical
Th
erap
euti
cs
Ph
arm
aceu
tica
l
An
imal
Equ
ipm
ent
Hu
man
Ind
ust
rial
Res
earc
h
IT/
Sof
twar
e
Pro
du
cts
Ser
vice
s
CA
CO
GA
IL
KS
MA
MD
MN
MO
NC
NJ
NM
NY
OH
PA
TN
TX
WA
WI
Source: Battelle analysis of Thomson Reuters Thomson ONE Venture Capital database.
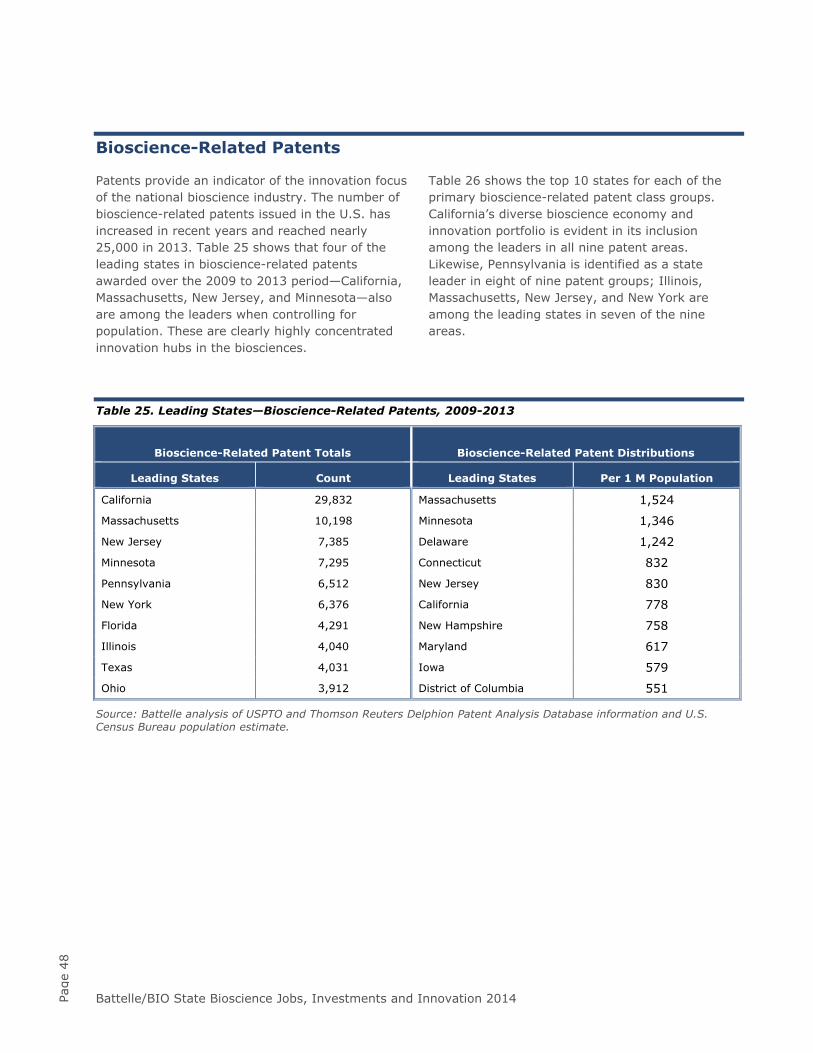
Battelle/BIO State Bioscience Jobs, Investments and Innovation 2014 Page
48
Bioscience-Related Patents
Patents provide an indicator of the innovation focus of the national bioscience industry. The number of bioscience-related patents issued in the U.S. has increased in recent years and reached nearly 25,000 in 2013. Table 25 shows that four of the leading states in bioscience-related patents awarded over the 2009 to 2013 period—California, Massachusetts, New Jersey, and Minnesota—also are among the leaders when controlling for population. These are clearly highly concentrated innovation hubs in the biosciences.
Table 26 shows the top 10 states for each of the primary bioscience-related patent class groups. California’s diverse bioscience economy and innovation portfolio is evident in its inclusion among the leaders in all nine patent areas. Likewise, Pennsylvania is identified as a state leader in eight of nine patent groups; Illinois, Massachusetts, New Jersey, and New York are among the leading states in seven of the nine areas.
Table 25. Leading States—Bioscience-Related Patents, 2009-2013
Bioscience-Related Patent Totals Bioscience-Related Patent Distributions
Leading States Count Leading States Per 1 M Population
California 29,832 Massachusetts 1,524
Massachusetts 10,198 Minnesota 1,346
New Jersey 7,385 Delaware 1,242
Minnesota 7,295 Connecticut 832
Pennsylvania 6,512 New Jersey 830
New York 6,376 California 778
Florida 4,291 New Hampshire 758
Illinois 4,040 Maryland 617
Texas 4,031 Iowa 579
Ohio 3,912 District of Columbia 551
Source: Battelle analysis of USPTO and Thomson Reuters Delphion Patent Analysis Database information and U.S. Census Bureau population estimate.
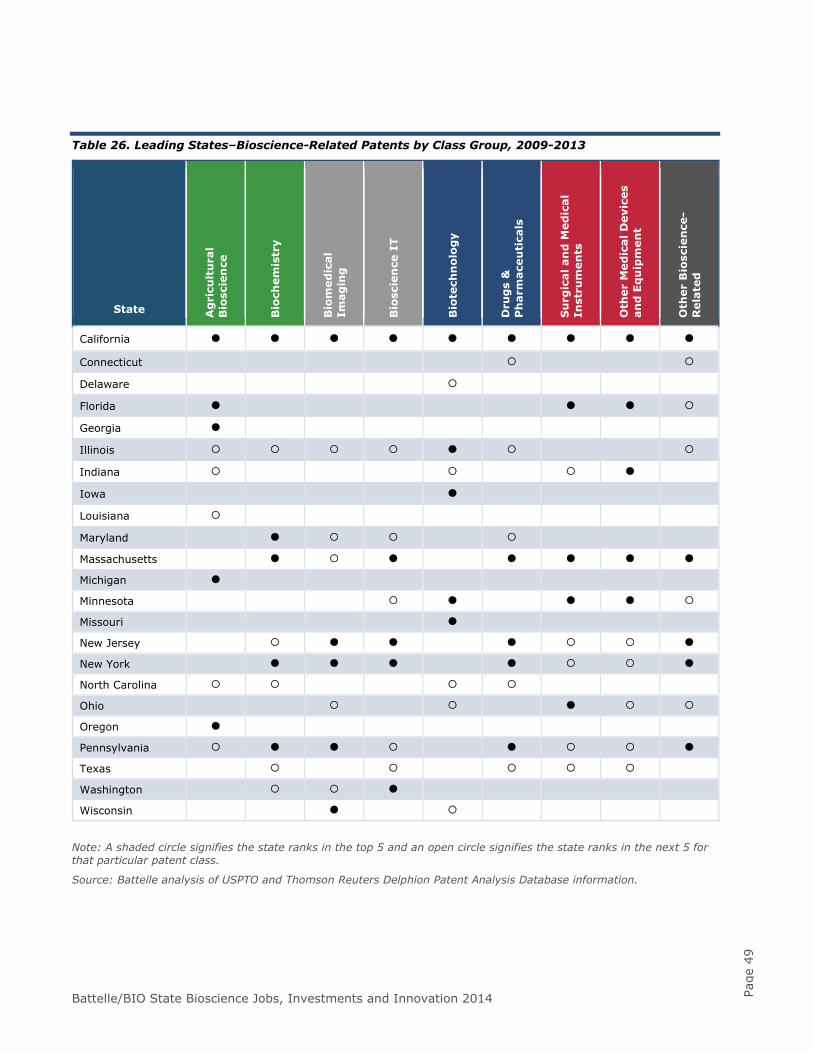
Battelle/BIO State Bioscience Jobs, Investments and Innovation 2014 Page
49
Table 26. Leading States–Bioscience-Related Patents by Class Group, 2009-2013
State Ag
ricu
ltu
ral
B
iosc
ien
ce
Bio
chem
istr
y
Bio
med
ical
Im
agin
g
Bio
scie
nce
IT
Bio
tech
nol
ogy
Dru
gs
&
Ph
arm
aceu
tica
ls
Su
rgic
al a
nd
Med
ical
In
stru
men
ts
Oth
er M
edic
al D
evic
es
and
Eq
uip
men
t
Oth
er B
iosc
ien
ce-
Rel
ated
California
Connecticut
Delaware
Florida
Georgia
Illinois
Indiana
Iowa
Louisiana
Maryland
Massachusetts
Michigan
Minnesota
Missouri
New Jersey
New York
North Carolina
Ohio
Oregon
Pennsylvania
Texas
Washington
Wisconsin
Note: A shaded circle signifies the state ranks in the top 5 and an open circle signifies the state ranks in the next 5 for that particular patent class.
Source: Battelle analysis of USPTO and Thomson Reuters Delphion Patent Analysis Database information.

Battelle/BIO State Bioscience Jobs, Investments and Innovation 2014 Page
51
Appendix A. Data & Methodology
Industry Employment, Establishments, and Wages
The bioscience industry employment analysis in this report examines national, state, and metropolitan area data and corresponding trends in the biosciences from 2001 through 2012. For employment analysis, Battelle used the Bureau of Labor Statistics (BLS) Quarterly Census of Employment and Wages (QCEW) data. The QCEW data provide the most current, detailed industry employment, establishment, and wage figures available at both a national and subnational level. Battelle utilizes an enhanced version of these data from a private vendor, the IMPLAN Group LLC.
The QCEW program is a cooperative program involving BLS and the State Employment Security Agencies. The QCEW program produces a comprehensive tabulation of employment and wage information for workers covered by state unemployment insurance (UI) laws and federal workers covered by the Unemployment Compensation for Federal Employees (UCFE) program. Publicly available files include data on the number of establishments, monthly employment, and quarterly wages, by NAICS (North American Industry Classification System) industry, by county, and by ownership sector, for the entire United States. These data are aggregated to annual levels, to higher industry levels (NAICS industry groups, sectors, and supersectors), and to higher geographic levels (national, state, and metropolitan statistical area [MSA]).
Since 2001, the QCEW has been producing and publishing data according to the NAICS. Federal statistical agencies have a mandate to publish industry data according to this improved classification system. Compared with the prior classification system—the 1987 Standard Industrial Classification (SIC) system, NAICS better incorporates new and emerging industries. Employment, establishment, and wage data
produced by the QCEW program for 2001 to present are not comparable with SIC-based industry data from prior years. This limits the ability to construct a longer time series for data analysis; however, 12 years of NAICS-based data (2001-2012) are now available.
Twenty-five NAICS industries at the most detailed (6-digit) level make up the Battelle definition of the biosciences and its subsectors. These detailed industries are aggregated up to five major subsectors of the bioscience industry. Four of the detailed NAICS industries, Testing Laboratories (NAICS 541380); R&D in the Physical, Engineering, and Life Sciences (NAICS 54171); Drug and Druggists’ Sundries Merchant Wholesalers (NAICS 424210); and Farm Supplies Merchant Wholesalers (NAICS 424910) are adjusted in this analysis by Battelle to include only the share of these industries directly involved in biological or other life science activities. To isolate these relevant life science components, Battelle used information and data from the U.S. Census Bureau’s Economic Census. The definition of the bioscience industry is presented in Table A-1.
National and state data were tabulated and presented in both summary analytical and state profile tables. Data for Puerto Rico and the District of Columbia are included in this report at both the “state” and national level. U.S. employment, establishment, and wage totals in this report reflect the sum of all state data and include both Puerto Rico and DC. All state and DC data are from the Minnesota IMPLAN Group; data for Puerto Rico are directly from BLS.
For more information on the BLS Quarterly Census of Employment and Wages, see http://www.bls.gov/cew/.
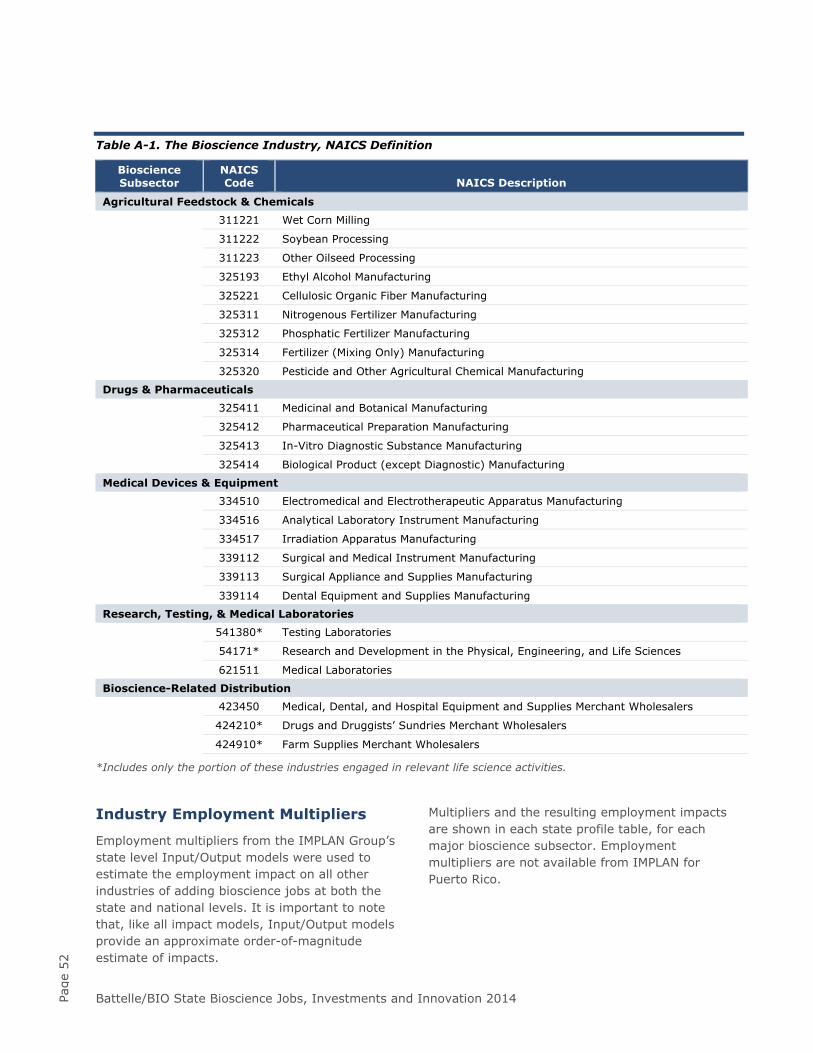
Battelle/BIO State Bioscience Jobs, Investments and Innovation 2014 Page
52
Table A-1. The Bioscience Industry, NAICS Definition
Bioscience Subsector
NAICS Code NAICS Description
Agricultural Feedstock & Chemicals
311221 Wet Corn Milling
311222 Soybean Processing
311223 Other Oilseed Processing
325193 Ethyl Alcohol Manufacturing
325221 Cellulosic Organic Fiber Manufacturing
325311 Nitrogenous Fertilizer Manufacturing
325312 Phosphatic Fertilizer Manufacturing
325314 Fertilizer (Mixing Only) Manufacturing
325320 Pesticide and Other Agricultural Chemical Manufacturing
Drugs & Pharmaceuticals
325411 Medicinal and Botanical Manufacturing
325412 Pharmaceutical Preparation Manufacturing
325413 In-Vitro Diagnostic Substance Manufacturing
325414 Biological Product (except Diagnostic) Manufacturing
Medical Devices & Equipment
334510 Electromedical and Electrotherapeutic Apparatus Manufacturing
334516 Analytical Laboratory Instrument Manufacturing
334517 Irradiation Apparatus Manufacturing
339112 Surgical and Medical Instrument Manufacturing
339113 Surgical Appliance and Supplies Manufacturing
339114 Dental Equipment and Supplies Manufacturing
Research, Testing, & Medical Laboratories
541380* Testing Laboratories
54171* Research and Development in the Physical, Engineering, and Life Sciences
621511 Medical Laboratories
Bioscience-Related Distribution
423450 Medical, Dental, and Hospital Equipment and Supplies Merchant Wholesalers
424210* Drugs and Druggists’ Sundries Merchant Wholesalers
424910* Farm Supplies Merchant Wholesalers
*Includes only the portion of these industries engaged in relevant life science activities.
Industry Employment Multipliers
Employment multipliers from the IMPLAN Group’s state level Input/Output models were used to estimate the employment impact on all other industries of adding bioscience jobs at both the state and national levels. It is important to note that, like all impact models, Input/Output models provide an approximate order-of-magnitude estimate of impacts.
Multipliers and the resulting employment impacts are shown in each state profile table, for each major bioscience subsector. Employment multipliers are not available from IMPLAN for Puerto Rico.
Battelle/BIO State Bioscience Jobs, Investments and Innovation 2014 Page
53
Additional Bioscience Performance Metrics Data
At the national level and for each of the state profiles, additional key bioscience performance metrics provide further insights into the current structure, recent performance, and capacity of the state’s bioscience infrastructure. These metrics and their data sources are briefly described in the following paragraphs.
Bioscience Academic R&D Expenditures
Based upon data from the National Science Foundation’s (NSF) Higher Education Research and Development Survey (and its predecessor the Survey of R&D Expenditures at Universities and Colleges), national and state totals (summation of all state’s responding institutions) are calculated for FY 2012 (most current year available) as well as the previous three years (FY 2009 – FY 2011). Data are provided for total R&D expenditures (including per capita measures) as well as in chart form for the bioscience fields including Medical Sciences, Biological Sciences, Agricultural Sciences, Bio/Biomedical Engineering, and Other Life Sciences.
For more information on the NSF Higher Education Research and Development Survey, see http://www.nsf.gov/statistics/infbrief/nsf14303/.
National Institutes of Health (NIH) Funding
NIH funding data for FY 2013 (the most current full year available) and for the previous four years (FY 2009 – FY 2012) were obtained using the NIH Awards by Location & Organization section within the NIH Research Portfolio Online Reporting Tool (RePORT) database, and separately collected funding for FY 2009 and FY 2010 from the American Recovery and Reinvestment Act (ARRA) website. Data are provided for total NIH funding, growth from FY 2009 through FY 2013 and FY 2013 per capita measures are also calculated.
For more information on the NIH Awards data, see http://report.nih.gov/award/index.cfm.
For more information on the additional grants awarded by NIH using funding made available through the American Recovery and Reinvestment Act (ARRA), see http://report.nih.gov/recovery.
Bioscience Venture Capital Investments
Venture capital investments, while not the only source of equity capital for bioscience firms, is often the largest and is typically the most publicly known and reported source of investment funds allowing for comparability among states.
Venture capital data were collected using the Thomson Reuters Thomson ONE venture capital database and include all venture capital deals from January 1, 2009 through December 31, 2013. The analysis includes all investments categorized in Thomson ONE in the Medical/Health/Life Sciences major category and five subcategories within the Information Technology major category that capture medical/health-related information technology applications. Additionally, investments in venture capital deals related to ethanol/biofuel/biodiesel-related companies were included from the Other Renewable Energy category maintained in Thomson ONE.
Bioscience Patents
The use of patent data provides a surrogate (though not perfect) approach to understanding those innovations that bioscience-related industrial organizations, research institutions, and general inventors deem significant enough to register and protect and provide some measure of comparability among regions in one facet of innovation. Furthermore, examining recent patent activity provides some insight into firms’ recent R&D areas, and hence, potential future lines of business. The three types of patents defined by the U.S. Patent and Trademark Office (USPTO) are:
Battelle/BIO State Bioscience Jobs, Investments and Innovation 2014 Page
54
Utility patents, which may be granted to anyone who invents or discovers any new and useful process, machine, article of manufacture, or composition of matter, or any new and useful improvement thereof.
Design patents, which may be granted to anyone who invents a new, original, and ornamental design for an article of manufacture.
Plant patents, which may be granted to anyone who invents or discovers and asexually reproduces any distinct and new variety of plant.
Additionally, patents have two geographic bases—the location of the inventors and the location of the assignee. For this analysis Battelle uses the location of the named inventor(s) as the geography of record. Hence, if a bioscience patent is invented by individuals in two states, each state will receive “credit” for the patent, but at a national level the patent is counted only once. Similarly, when two or
more named inventors are from the same state the patent only gets counted once.
USPTO assigns each patent with a specific numeric major patent “class” as well as supplemental secondary patent classes. By combining relevant patent classes across the wide array of bioscience-related activity, these class designations allow for an aggregation specific to the biosciences. Battelle has grouped these relevant patents into broader bioscience patent class groups for this analysis.
Patent data were collected using the Thomson Reuters Delphion patent analysis database and includes all published patents from January 1, 2009 through December 31, 2013. Table A-2 provides a listing of the patent classes and class groups were used in this analysis. For the 2014 Battelle/BIO report additional efforts were made to include bioscience patents in areas such as imaging, information technology.
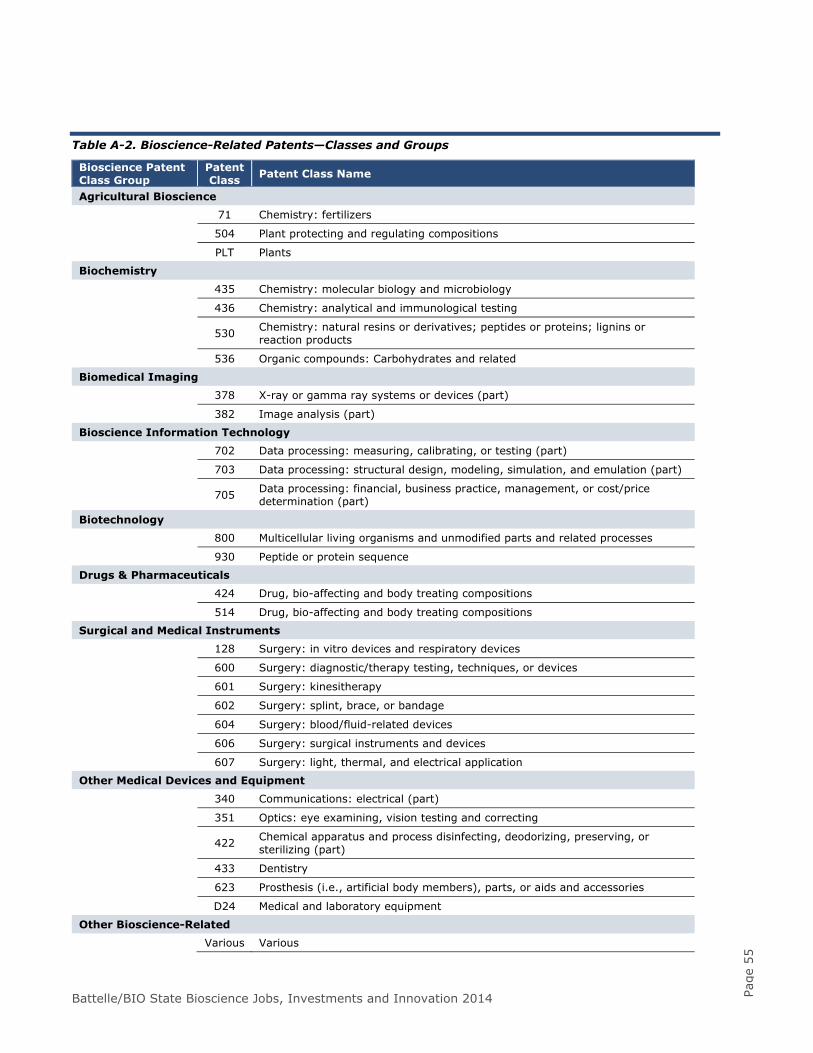
Battelle/BIO State Bioscience Jobs, Investments and Innovation 2014 Page
55
Table A-2. Bioscience-Related Patents—Classes and Groups
Bioscience Patent Class Group
Patent Class Patent Class Name
Agricultural Bioscience
71 Chemistry: fertilizers
504 Plant protecting and regulating compositions
PLT Plants
Biochemistry
435 Chemistry: molecular biology and microbiology
436 Chemistry: analytical and immunological testing
530 Chemistry: natural resins or derivatives; peptides or proteins; lignins or reaction products
536 Organic compounds: Carbohydrates and related
Biomedical Imaging
378 X-ray or gamma ray systems or devices (part)
382 Image analysis (part)
Bioscience Information Technology
702 Data processing: measuring, calibrating, or testing (part)
703 Data processing: structural design, modeling, simulation, and emulation (part)
705 Data processing: financial, business practice, management, or cost/price determination (part)
Biotechnology
800 Multicellular living organisms and unmodified parts and related processes
930 Peptide or protein sequence
Drugs & Pharmaceuticals
424 Drug, bio-affecting and body treating compositions
514 Drug, bio-affecting and body treating compositions
Surgical and Medical Instruments
128 Surgery: in vitro devices and respiratory devices
600 Surgery: diagnostic/therapy testing, techniques, or devices
601 Surgery: kinesitherapy
602 Surgery: splint, brace, or bandage
604 Surgery: blood/fluid-related devices
606 Surgery: surgical instruments and devices
607 Surgery: light, thermal, and electrical application
Other Medical Devices and Equipment
340 Communications: electrical (part)
351 Optics: eye examining, vision testing and correcting
422 Chemical apparatus and process disinfecting, deodorizing, preserving, or sterilizing (part)
433 Dentistry
623 Prosthesis (i.e., artificial body members), parts, or aids and accessories
D24 Medical and laboratory equipment
Other Bioscience-Related
Various Various


Presenting Sponsor: Agency Partner: