Embed Size (px)
Citation preview

/tt/file_convert/5af3e5387f8b9a5b1e8bc71f/document.docx
Project SE4206 – Appendices for Final Report.
Appendix 1: Original SID3 – Approaches and research plan
Outline the approaches to be used to achieve the objectives, describing the scientific context where appropriate. Set out the work plan for the life of the project stating clearly how you intend to proceed (please include a GANTT chart if appropriate). The Approaches should be given the same number, and in the same order, as the Objectives and must be clearly cross-referenced to the numbered Milestones set out in Section 8. Where there is more than one contractor, please show clearly the roles of each. If your application is accepted, the Approaches and Research Plan and Milestones will be included in any contract issued. Please, therefore, restrict your entry to the salient points and set these out clearly and concisely.
01 Descriptive analysis of poultry industry, identifying areas of missing data and obtaining estimates from appropriate industry experts.1.1. Evaluate the completeness of Defra’s poultry industry database for the purpose of
modelling poultry disease(s). 1.2. Plans to develop a poultry register database are currently in progress by Defra. A
database containing census data from Scotland, England & Wales; data from the Egg Marketing Inspectorate; VETNET data; plus data from the Scottish AHDO has been compiled by the Veterinary Laboratories Agency in collaboration with Defra. This database will be used as part of a wider plan by Defra to map the poultry industry.
1.3. Defra have begun discussions with the poultry industry to obtain a clearer picture of the poultry network within the UK. Commercial companies will be approached by Defra for key data sources; information to be collated will hopefully include details on the site (type of birds, number of sheds/houses, number of birds per shed/house) as well as network information (such as regional/area managers, catching crew details and veterinarians). These data will be collated and merged with the current poultry database. It is anticipated that these data will be captured by census data, hence the data provided by the company will link to records contained in the current poultry database.
1.4. With Defra’s agreement we are proposing to join up with this ongoing work in order to further develop a dataset on the UK poultry industry and therefore use this data source to model the spread of disease within the UK as part of R26. Our key objective at this stage will therefore be to identify data gaps in the dataset that will be required for modelling.
1.5. It is imagined that Defra’s approach will primarily target mid to large scale companies and therefore gaps in our knowledge will exist for the smaller-scale and hobby farm enthusiasts. As it is probable that data from the lower stratum (hobbyists/fancy bird keepers) will be scarce we will target this area to fill any data gaps (see 1.3). There may also be data gaps in the data provided by the poultry companies, such as feed supply networks and companies used to remove dead birds from farms, and so if necessary further work to address these gaps will be proposed.
1.6. The data collated by Defra will be reviewed and any caveats/data gaps identified. We will then hold a meeting with Defra to discuss these issues so that the next steps of the project can be planned.
1.7. If stakeholder meetings between Defra and the industry are ongoing during the lifetime of the proposal we would like to join up with these meetings where appropriate.
1.8. To map exotic bird and hobby bird import, movements and presence in the UK to address data gaps in the poultry database
1.8.1. Data from customs, PVPs for exotic birds and auctions will be collected to identify major importers.
1.8.2. The number of birds being imported into the UK will be sought from customs to identify bird movements/imports (this is likely to be from main importers).
1.8.3. Visit markets/auctions/shows to collate information on exotic/hobby bird movements. This output from this objective will be descriptive and will hopefully provide general information on the types of shows/bird movements. The information gathered here will help to support simulation work included in the model. Plans will be drawn up to document the approach taken.
Page 1 of 87 1
/tt/file_convert/5af3e5387f8b9a5b1e8bc71f/document.docx
02 Create network model of poultry industry from data and estimates obtained in 01.2.1 Data from 01 will identify the nodes and links of the network. The link weightings will be
parameterised according to the nature of the links involved (e.g. movement of poultry, shared veterinarians, shared catchers, etc.) and the extent of contact (e.g. the number of poultry moved, number of visits etc.). Data analysis will be carried out to determine the dependence of each type of link by property type, species, region, and other identified co-variates to determine whether there are generalisations that can be made in order to simplify the representation of the network, and to facilitate extrapolation where data is missing.
2.2 In addition, local spread will be included as additional, randomly determined links based on geographical proximity. Local spread could occur, for example, due to the carriage of virus of local waterfowl or by seasonal movements of passing migratory birds, but the means of transmission and therefore the magnitude and distance-dependence will vary according to each disease. For this project, we intend to consider a range of profiles of local spread, considering respiratory diseases (e.g. avian influenza, Newcastle disease), bacterial diseases (salmonella, campylobacter), and parasitic diseases (e.g. histominiasis). Advice from consultant ornithologists at the Central Science Laboratory, who have data available on bird movements and local wildlife, will assist in the appropriate representation of this source of transmission for each disease type.
03 Determine key parameters that determine network structure:A network analysis will be conducted, based on the data and parameters estimated in objective 01, and the network model developed in objective 02. Network analyses have identified the importance of degree distribution (Albert et al., Nature 406, 2000) and clustering of potentially infectious contacts (Watts & Strogatz, Nature 393, 1998) as key parameters in understanding the spread, persistence and control of infectious diseases. In addition, once a network has been defined, community structure analyses can be used to identify groups of premises at greater risk of transmitting disease to each other (Newman, Phys Rev E, 69, 2004). These analyses will be used to identify classes of premises that are important for purposes of disease spread and control, once the relationship between the presumed network and epidemiological parameters has been established using methodologies being developed by RRK at Oxford (see refs 1-3 RRK CV, “Demographic Structure and Pathogen Dynamics on a Well-characterised Network.”, by Kao, Danon, Green and Kiss, submitted) This model will be used to:
Examine the effect on the network of varying epidemiological parameters, such as the incubation period and the probability of transmission. A series of classifications of disease types will be considered e.g. short incubation period and high infectiousness versus long incubation period and low infectiousness, and the network properties of each disease type will be compared.
Key parameters (e.g. average number of links per node, distribution of number of links per node, clustering coefficients, etc.) that determine network structure will be identified.
Disease categories will be defined according to their epidemiological parameters and their relationships with the network, in order to classify a limited number of optimal strategies for disease surveillance and control.
For each disease type, the critical parts of the network where surveillance and control should be targeted will be identified.
Sensitivity analyses will be undertaken for critical epidemiological parameters on the network, in particular for those most poorly known.
Sensitivity analyses will be undertaken for critical network parameters.
04 Develop and apply stochastic simulation model of the Poultry industryThis will explicitly represent the links between each poultry unit in the GB poultry dataset. For each infectious unit at each time step, the weighting of the network link will determine the probability of transmission between the IP and the susceptible unit. The output of the stochastic simulation will be the location of the IPs at each time step.
Page 2 of 87 2

/tt/file_convert/5af3e5387f8b9a5b1e8bc71f/document.docx
4.1 Initially, the poultry industry will be separated into 3 strata: the large scale intensive flocks, the smaller scale flocks such as free-range flocks, and small units such as hobby flocks. Each stratum will be considered separately in the first instance, to investigate the relative risks of transmission and maintenance of infection within each stratum and to finalise the degree of complexity that would be practical in large scale simulations when the whole industry is considered.
4.2 This simulation will be used to validate the results of the theoretical model developed in objective 03, showing whether the characterisation of the network has correctly identified the properties for the range of disease classifications considered. This will lend confidence to using the critical network structures to investigate hypothetical scenarios or situations where detailed information is not available, and therefore data and parameter-heavy simulations less useful.
4.3 The network model investigated in 03 is likely to be subject to assumptions regarding the links between each unit; the data collection exercise is unlikely to yield comprehensive information on the industry. In particular, the quality of the collected data is likely to vary according to strata, for example, data on backyard poultry flocks may be more difficult than large industry units. Therefore, the relative importance of each strata in transmitting disease will be important in determining the sensitivity of the network to the assumptions made on missing or incomplete data.Therefore, the sensitivity of any conclusions to the assumptions made in objective 01 will be investigated using the stochastic simulations. This will inform future data collection needs.
4.4 The importance of within-flock transmission will also be investigated by studying the effect on between-flock transmission on various assumptions on the rate and scale of within-flock transmission. Models developed at the VLA on within-flock transmission (Hartnett, E; Kelly, L; Newell, D & Wooldridge, M., Epidemiology & Infection 127, 2001) will be used to inform the profile that flock infectiousness could take, taking into account estimates of the transmission rate and incubation period.
05 Apply network model to transmission of avian influenza in GBThe network models developed will be generic in nature and will be adaptable for any transmissible avian disease. However, the use of the model will be illustrated by applying it to avian influenza.5.1 The transmission parameters for an avian influenza epidemic are unknown and there is
no data on avian influenza outbreaks in the UK with which to estimate transmission parameters. However, the use of expert opinion is commonly used in risk assessment approaches to provide initial estimates of transmission parameters that reflect the main characteristics of the disease. Therefore, the risk assessment group at the Central Science Laboratory will obtain estimates of avian influenza transmission parameters via an expert opinion workshop.
5.2 These estimates will be incorporated into the stochastic simulation model and the spatio-temporal pattern of avian influenza outbreaks determined for the most likely routes of entry into the UK. The key control and surveillance strategies identified in the modelling in objectives 03 and 04 will be tested for avian influenza.
PID – Revised project plan (August 2007)
SE4206 Re-plan Project Aims 1. Adoption of an analytical framework (including tools) capable of determining the scale
of a poultry disease outbreak based on network and population data. More specifically:
Development of operationally-ready network model and simulation model capable of generating Policy user-friendly outputs.
Improvement of the existing network data together with use of the GBPR data and forward plans for maintaining its currency.
Identification of the key areas of future improvement to the tools and data.
Page 3 of 87 3

/tt/file_convert/5af3e5387f8b9a5b1e8bc71f/document.docx
SE4206 Re-plan Project Objectives Updates to existing data:
GBPR data extract Network data Other demographic data Further data collection and analysis:
The following data will be collected in the planned project: Catching company temporal and distance data Slaughterhouse data (broilers, spent hens) Movements within companies Egg collector data Expert opinion (e.g. BEIC, BPC, VLA Poultry Species Group) Reports from other modelling groups (e.g. Liverpool, Edinburgh) Feed lorry data
Improvements to modelling systems/tools: GBPR extract and poultry network database are linked or integrated. Real-time parameter estimate connection (Swansea) Updates to network and simulation models (including within-flock modelling) Improved poultry industry descriptions
Operational readiness: Tools and datasets ready “off-the-shelf” Connection to real-time parameter estimation tool (Swansea) Accompanying desktop instructions Commitment of key personnel Plans for maintaining the capability and readiness (training, exercise) A generic approach applied to AI together with an assessment of its applicability to
other poultry diseases, e.g. salmonella, campylobacter
Publications and Recommendations:
At least one paper will be submitted to a peer-reviewed journal.
Each stage of the project will provide recommendations on the current and future state of AI modelling, and suggestions for the next steps.
Page 4 of 87 4

/tt/file_convert/5af3e5387f8b9a5b1e8bc71f/document.docx
Appendix 2: CSL Wild birds as Vectors for the spread of AIV from poultry units
Andy Baxter, Sara Bone, Henrietta Pringle, April Eassom & Nicola Dennis.Report Status: Phase 2 reportIssue Date: 17/07/2007CSL Bird Management UnitSand HuttonYorkYO41 1LZ
Contents1. AIMS & OBJECTIVES:....................................................................................................2
1.1 REVIEW TECHNIQUES.................................................................................................21.2 BOUNDARIES OF THE STUDY......................................................................................3
2. INTRODUCTION..............................................................................................................33. PRESENCE OF WILD BIRDS AT POULTRY UNITS......................................................4
3.1 GENERAL REFERENCES.............................................................................................53.2 GREBES.................................................................................................................... 63.3 CORMORANTS...........................................................................................................63.4 HERONS.................................................................................................................... 73.5 WILDFOWL................................................................................................................73.6 BIRDS OF PREY.........................................................................................................73.7 GAMEBIRDS, CRAKES AND RAILS...............................................................................93.8 WADERS................................................................................................................... 93.9 GULLS...................................................................................................................... 93.10 PIGEONS.................................................................................................................103.11 OWLS.....................................................................................................................113.12 WOODPECKERS AND ALLIES....................................................................................123.13 PASSERINES............................................................................................................123.14 CORVIDS................................................................................................................. 14
4. LOCAL MOVEMENT PATTERNS AND HABITAT USAGE OF WILD BIRD SPECIES IDENTIFIED AT POULTRY UNITS........................................................................................16
4.1 GREBES..................................................................................................................164.2 CORMORANTS.........................................................................................................164.3 HERONS.................................................................................................................. 174.4 WILDFOWL..............................................................................................................174.5 BIRDS OF PREY.......................................................................................................184.6 GAMEBIRDS.............................................................................................................194.7 GULLS.................................................................................................................... 204.8 PIGEONS.................................................................................................................204.9 PASSERINES............................................................................................................224.10 CORVIDS................................................................................................................. 22
5. POTENTIAL RISK OF DISEASE SPREAD FROM POULTRY UNITS VIA WILD BIRD SPECIES................................................................................................................................ 24
5.1 RISK ASSUMPTIONS.................................................................................................255.2 KEY SPECIES...........................................................................................................255.3 SUMMARY...............................................................................................................28
6. RECOMMENDATIONS..................................................................................................296.1 OBSERVATIONS TO GATHER DATA TO ASSIST WITH THE DEVELOPMENT OF A QUANTITATIVE RISK ASSESSMENT..........................................................................................306.2 OBSERVATIONS AND MONITORING IN THE EVENT OF A DISEASE OUTBREAK AT A POULTRY UNIT......................................................................................................................30
7. REFERENCES...............................................................................................................31
Page 5 of 87 5

/tt/file_convert/5af3e5387f8b9a5b1e8bc71f/document.docx
Aims & objectives:
This study aims to review the available published literature to identify knowledge that can be used to assist with modelling the potential spread of Avian Influenza (AI) by UK birds. Following phase one of this report (Jackson et al, 2007), a list of species were recognised as potential carriers of AI. The literature was therefore reviewed to evaluate the potential risk of wild birds acting as vectors for the transmission of avian influenza from infected poultry units to the local environment. The following key areas were considered:
1. To review the literature and assess the potential for bird species identified in phase 1 of this study to be found at poultry units.
2. To assess the local movements of those species
3. To provide a preliminary risk assessment, based on available knowledge and expert opinion of the potential for wild birds to transmit Avian Influenza to other nearby units.
Review techniquesSearches were conducted across the published and grey literature. Central Science
Laboratory (CSL) Information Centre facilities were used to search for relevant peer-reviewed papers. Grey literature was sought through internet search engines and specialist contacts within CSL where appropriate.
Boundaries of the studyThis report specifically concentrates on the available literature and does not include the
use of questionnaires or direct contact with individuals or companies/organisations. The study does not include any aspect of fieldwork to confirm information from literature. Areas where insufficient data was available from the literature were used to make recommendations. A list references generated during the literature search can be found in Section 7.
IntroductionWild birds are known to act as vectors for a variety of potentially harmful diseases.
Salmonella, Newcastle disease, Histomoniosis, Campylobacter, and of most recent concern, strains of the H5N1 Avian Influenza virus have been identified in previous reports (Jackson et al, 2007). Whilst wild birds may have the potential to transmit these diseases to domestic poultry units, little information has been collated about which species of birds visit such sites and the probability they have of transferring such diseases between different poultry units and different individual birds.
Poultry units can range from free range smallholdings containing just one or two birds through to enclosed battery farms and broiler houses containing many thousands of birds (BBC 2007), (Defra 2006). Units may be utilised for hatcheries, meat or egg production, or a combination of the three. Sites may offer a variety of attractions to different wild bird species. This could include opportunities for scavenging or predating food in the form of poultry feed, insects, rodents, eggs, chicks and potentially adult birds. In addition, different units could offer a variety of shelter that may be utilised for nesting, roosting and loafing.
Defra Animal Health and Welfare (Defra 2006) confirm that strains of Highly Pathogenic Avian Influenza (HPAI) have occurred across the world. Whilst migratory birds have long been implicated in the spread of this particular virus over long distances (Domenech, Lubroth & Martin 2006; De Marco MA et al. 2003), their involvement in the localised spread of disease is less well understood.
The H5N1 strain of Avian Influenza has occurred in Britain, most recently at Cellardyke, Scotland with a Whooper Swan in April 2006 and at Upper Holton, Suffolk at a poultry unit in February 2007. The Cellardyke incident confirms Defra’s position that “Wild birds may be implicated in the introduction of the disease to domestic poultry” (Defra 2006). This hypothesis was rejected in the Upper Holton case although transcripts from interviews conducted by the BBC (Landeg 2007), confirmed that gulls were attracted to the outbreak site in large numbers.
In preparation for potential avian flu epidemics, Martin, Forman & Lubroth (2006), discuss the need to identify wild bird migratory patterns, timing and destination sites and to assess the
Page 6 of 87 6
/tt/file_convert/5af3e5387f8b9a5b1e8bc71f/document.docx
risk of close contact with domestic poultry providing an entry point for establishment of avian influenza. Recent legislation (Statutory Instruments 2006) therefore provides for control and monitoring zones, extending up to 10km in radius from an outbreak point, in the event of an HPAI outbreak in England. The implementation of any such monitoring or control procedure relies, however, upon the findings of an appropriate risk assessment.
Bird species that have the potential to transmit HPAI have therefore been identified in phase one of this report. This document reviews and summarises the available literature to confirm the presence of those, or other similar species at poultry units, and evidence of their local movements into the wider environment. From this, a summary matrix is produced to identify knowledge gaps from the literature. Where possible the species that may have the potential to create the greatest risk of disease transfer based on the literature reviewed are highlighted.
PRESENCE OF WILD BIRDS AT POULTRY UNITSThe presence of wild bird species at poultry units is reviewed here according to standard
family listings (arranged in Vouss order). Amendments are made to this structure to remove birds for which an extensive search of the literature reveals no evidence of their likelihood of utilising any form of poultry unit. Seabirds, assumed here to include Divers, Shearwaters, Gannets, Terns and Auks, are thus removed from this review. Due to the abundance of information available on species within the corvid (Corvidae) family, these birds have been split into a separate section from the remaining birds within the Passerines order (Passeriformes). Hagemeijer & Mundkar (2006) provide a risk of contact with poultry for each species or species group based on gregariousness, habitat use and density. This contact risk is described with a Risk Score (RS) of 0 = virtually zero, L = low, M = medium and H = high. The system is based on an assessment of the probability of long distance migrant species carrying Avian Influenza infections to poultry units in the UK, not on local movements. This contact risk score has been amended here and, where possible, each species is classified as follows:
0 = virtually zero: No evidence in the literature or from habitat usage that birds would visit poultry units of any sort.
L = low: No evidence in the literature but suggestion from habitat use that birds could visit poultry units.
M = Medium: Evidence that birds could visit poultry units but are solitary species.
H = High: Evidence that birds routinely visit poultry units and could visit a multitude of sites.
VH = Very High: Evidence that birds routinely visit poultry units, could visit a multitude of sites and may move to communal sites where transfer to same or other species is possible.
1.1 General ReferencesChanging habitats such as the loss of wetlands around the globe may force many
wild birds onto alternative sites such as farm ponds, slurry lagoons and paddy fields. This has the potential to bring them into direct contact with chickens, ducks, geese, and other domestic fowl. Poor planning in response to development pressures has led to the increasing loss or degradation of wild ecosystems. Displaced wild birds increasingly seek to feed and live in areas populated by domestic poultry (and humans) (International Scientific Task Force on Avian Influenza 2006).
There are two different species groups that impact on poultry units and potential disease transmission; those that create direct contact between species, and those that act as “Bridge species” (EMPRES Watch 2006); Atkinson et al., 2006, (International Scientific Task Force on Avian Influenza 2006) (EFSA 2006). These latter species are described as “wild birds that connect infected poultry farms to wild habitat by visiting farms where feed is plentiful and then spending time in more natural habitats”. By this mechanism, Bridge species have the potential to transmit H5N1 and other diseases of poultry. The species identified by the above authors include Eurasian Tree Sparrow (Passer montanus), magpies and crows (Corvus spp.). The authors suggest that these species may serve as the mechanism by which H5N1 over-winters in cold habitats. It is suggested that in future studies of bridge species
Page 7 of 87 7
/tt/file_convert/5af3e5387f8b9a5b1e8bc71f/document.docx
special attention should be paid to predators, scavengers and opportunistic feeders within the Accipitridae, Falconidae, Corvidae, Sturnidae and Passeridae species (Atkinson et al. 2006).
Certain passerine species will enter poultry houses in search of food, water, sheltered roost sites or nesting sites (EFSA 2006). These direct contact species are most notably Starling (Sturnus vulgaris) and House Sparrow (Passer domesticus), which traditionally have particularly close associations with farm buildings. Small-scale farms have also been reported discarding their dead animals by feeding them to wild birds such as raptors and crows (Bin Muzaffar, Ydenberg & Jones 2006).
The movements of wild birds acting as both direct or bridging species into poultry units may not necessarily be the only potential transmission route. Dumping of poultry farm litter onto fields has been reported and has been shown to attract hundreds of starlings (that made up to 50 trips in an afternoon between polluted farm fields and nearby farm buildings), dozens of crows, flocks of pigeons and a few hundred gulls (Hancock 2004). In a study of 169 poultry holdings in Switzerland, Schelling et al. (1999) reports the most frequently mentioned birds observed by poultry holders were birds of prey (70% of holders), and crows (15%). This included 54 reported instances of birds of prey or crows attacking poultry in small chicken flocks.
The following paragraphs summarise information from the literature that describes the presence of direct or bridging species at, or using, poultry units.
1.2 GrebesContact risk = L. There is no evidence in the literature of Grebes being present on
poultry units. It is considered highly unlikely that free-range poultry would come into direct contact with Grebes even if they were present on water bodies at a farm. The most recent outbreak in Germany (June / July 2007) confirms that a Black-necked grebe (Podiceps nigricollis), found dead in Kelbra near Erfurt, was infected with the H5N1 strain of avian influenza (Thomson Financial). Similarly Dr Hans Wyss (2007) confirms HPAI as the cause of a Little Grebe fatality in Switzerland in 2006.The risk of contact with other species was not available from the literature. The presence of an infected grebe carcass on the same waterbody as 153 other infected wild birds including Mute Swans (Cygnus olor) and Canada geese (Branta canadensis) during the recent outbreak in Germany (Friedrich Loeffler Institute 2007), however, suggests that contact is possible. Further work would be required to confirm the potential of Grebes to act as bridging species. Newcastle disease was also identified in a high proportion of individual birds (15%) within the Grebe family (Schelling et al. 1999).
1.3 CormorantsContact risk = 0. Cormorants occupy the same habitat types as Grebes. It is possible
that poultry could be located underneath Cormorant breeding or roosting sites in trees which could result in risk of contact through faeces. No literature was found to support this hypothesis and Cormorants were not identified in phase one of this review as disease carriers. According to Schelling et al. (1999), cormorants have never been observed near poultry flocks. Cormorants have been identified as a medium risk for acting as a bridge species for the transmission of H5N1 between water birds and poultry (Atkinson et al. 2006).
1.4 HeronsContact risk = Low. Grey Herons (Ardea cinerea) are common in areas of shallow freshwater and have a diet predominantly of fish, amphibians, small mammals and insects. They are not recorded in the literature as associating with poultry flocks. Grey Heron have, however, been identified as a medium risk species as they have the potential to act as ‘Bridging Species’ (Atkinson et al. 2006). Grey Herons were often seen in waterways near farms in Hong Kong (Moores 2006). Schelling et al. (1999), also recorded Grey Herons at 2 of 169 poultry farms. Poultry units in close proximity to Grey Heron habitat could, therefore, be at risk due to bridging of disease between species.
Page 8 of 87 8
/tt/file_convert/5af3e5387f8b9a5b1e8bc71f/document.docx
1.5 WildfowlContact risk = Low – High, dependent on species. Atkinson et al. (2006), classifies
Mute Swan, Greater White-fronted Goose, Greylag Goose, Wigeon and Teal as posing ‘medium contact risk with poultry’, with Mallard classed as high risk. The Swiss study confirmed that wild waterfowl were only observed in close contact to poultry in 3% of visited poultry holdings (Schelling et al. 1999). The same study shows that duck holders observed wild ducks nearby domestic flocks more often than chicken holders (Schelling et al. 1999). No evidence was available from the literature to confirm the direct appearance of any of these species on poultry farms. A study in Oklahoma found all species of dabbling ducks, including mallard, preferred natural wetlands to farm ponds, although farm ponds were used by breeding ducks in the northern prairies (Flake 1979). The authors of this report have also observed Mallard Ducks, Canada Geese and Mute Swan, using farm ponds in the UK that are adjacent to free range farmyard poultry units.
Coot and Moorhen are classed as posing ‘medium contact risk with poultry by Atkinson et al. (2006). No evidence in the literature was available to confirm the presence of any of these species on poultry farms. Field observations by the authors confirm these two species on small waterbodies adjacent to outdoor poultry units.
1.6 Birds of PreyContact risk = High. Larger birds of prey (eagles, kites and buzzards) and small birds
of prey (Accipiters & falcons) were responsible for mortalities reported by poultry-keepers in 2 locations in India (Conroy et al. 2007) (The remaining mortalities were due to crows). Raptors (goshawk, buzzard and unknown), were also responsible for 22% of depredation events in eastern France in 1999-2000 (Stahl, Ruette & Gros 2002). Goodwin, 1978 (in Cramp and Simmons 1980) found that in Europe, Goshawk and Black Kite were serious predators of domestic poultry.The Goshawk, a species that is known to predate medium sized birds, is occasionally recorded at, and can cause depredation problems to, free-ranging poultry units or large concentrations of game birds (Critter Control 2007d). Because they are thought to feed largely on poultry and game, Goshawks are not protected in the USA. According to farmers in a Nova Scotia study, however, there were no observations of Goshawks on poultry farms or any losses to goshawks despite their nests being located only half a mile from the farms (Bent 1937).
Sparrowhawk, a smaller cousin of the Goshawk is also known to predate poultry units and thus come into direct contact with units. Collins, 1927, found that the crop contents of 9 specimens examined contained 9.5% poultry. This confirms the findings of Archibald (1892) that the Sparrowhawk is “most dangerous to poultry”. Members of the Poultry Keepers Forum describe attacks on chickens in backyard collections by buzzards (The Poultry Keeper Forum. 2007a). In contrast, an Australian website discusses Buteo species as “rarely causing problems for poultry keepers” (Critter Control 2007d). Buzzards have, however, been recorded taking roadkills and offal at poultry farms (Schreiber, Stubbe & Stubbe 2001) and may therefore represent a possible bridging species. During the late seventeenth and early eighteenth centuries, Buzzards were very heavily persecuted because they preyed on farm poultry and young livestock (Jones 1972).
In Nigeria, Kestrels have been reported as regularly killing and eating young chicks in free-range poultry holdings in Nigeria (Funmilayo 1982). No other information on the use of poultry holdings by species that could visit poultry units in the UK (Peregrine Falcon & Merlin) could be found in the literature. Black Kite will regularly kill and eat young chicks in free-range poultry holdings in Nigeria (Funmilayo 1982). Kites were heavily persecuted in Britain in the late 17th and early 18th centuries because they preyed on farm poultry and young livestock (Jones 1972). Black Kite no longer breeds in the UK although reintroduction schemes across parts of Britain suggest the closely related Red Kite could fill a similar niche. This was confirmed (Davies and Davies, 1973) where ‘domestic fowl’ were found to play a particularly important part in the diet of Red Kites with larger birds taken as carrion but young birds possibly taken alive. Similarly, Brooks et al., 1985 quoted Wuttky who in 1963 found that the prey items at 427 nests in East Germany included 109 domestic fowl, some of which were taken as carrion.
Page 9 of 87 9
/tt/file_convert/5af3e5387f8b9a5b1e8bc71f/document.docx
There is limited literature studying predation rates by birds of prey on poultry units in the UK. Opportunistic predators such as birds of prey, have been offered special attention as bridging species (Atkinson et al. 2006).
1.7 Gamebirds, Crakes and RailsContact risk = M – H dependent on species. Pheasant (Phasianus colchicus) and Grey
Partridge (Perdix perdix) come into close proximity to poultry (EFSA 2006). Pheasants will regularly come to poultry farms to eat the chicken feed (The Poultry Keeper Forum. 2007a), and are regular visitors to feed on chicken pellets at poultry units. Pheasant and Grey Partridge are identified as “close contact species” due to their presence as a vector of mycobacteria to poultry and cattle (Hejlicek & Treml 1993c). Pheasant is therefore classed as ‘high contact risk with poultry’ (Atkinson et al. 2006).
There is no information to suggest crakes and rails come into contact with poultry.
1.8 WadersContact Risk = L - M depending on species. The Northern Lapwing (Vanellus
vanellus) is considered as a medium contact risk with poultry (Atkinson et al. 2006). They could come into contact with potentially infected species, although H5N1 has not been confirmed in this species. They frequent farmland habitat that could bring them into contact with free-range poultry (EFSA 2006). Other wader species are identified as having a low contact risk and include Eurasian Golden Plover (Pluvialis apricaria), Black-tailed Godwit (Limosa limosa) and Ruff (Philomachus pugnax) (Atkinson et al. 2006).
1.9 GullsContact risk M – H dependent on species. Black-headed Gulls (Larus ridibundus) are
recorded as a high contact risk species with poultry (Atkinson et al. 2006). They are associated with farmland used by domesticated poultry (EFSA 2006; Nicholson 1951) and H5N1 has been confirmed in this species (Atkinson et al. 2006). Common Gulls (Larus canus) are also classed as a high contact risk, as they again share farmland with poultry (EFSA 2006), although no H5N1 has been identified in this species (Atkinson et al. 2006). Gulls were observed at the recent ‘Bernard Matthews’ outbreak (Lean 2007) feeding on waste trimmings of meat in open-topped bins outside the processing plant. Observations confirmed gulls taking the trimmings into an area where live turkeys were raised (Lean 2007). Similar behaviour was previously observed at this plant (Revill et al. 2007), with large gatherings of gulls present on the farm 10 days preceding the Avian Influenza outbreak (Elliott 2006). The diet of Black-Headed Gulls is recorded as consisting of “invertebrates, small vertebrates, and waste from municipal landfills and farms” (Cizek et al. 2007). Moores (2006, 2005), records Black-headed gulls scavenging along waterways near poultry farms. Likewise Honza (1993) confirms Black-headed gulls using water-side poultry farms as their source of food in a study in the Czech Republic in 1991.
Evidence of the presence of gulls at poultry units is not limited to the UK. Poultry farmers that regularly discarded dead chickens, eggs and manure on to a large heap in Wellington, South Africa, found gulls were attracted to feed (The Cape Bird Club 2004). Herring Gull is presented as a low contact risk species (EFSA 2006). Although few specific references relating to Herring Gulls at poultry units have been identified, Faulkner (1966), records Herring gulls feeding on turkey, poultry and duck pellets on open ranges in America. In Wales, Herring gulls are also stated as associating with, amongst other habitats, farmyards (Threlfall 1967). There is also an indirect risk of contact with poultry waste or carcasses if they are disposed of on landfill sites where Herring and other gull species are present in large numbers (Hollmen et al. 2000; Baxter 2003).
The literature confirms the likelihood of small gulls (e.g. Black-headed Gulls) and large gulls (e.g. Herring Gulls) as likely to visit poultry units in the UK.
1.10 PigeonsContact Risk = H. Pigeon species (Columbus sp) are known to carry the avian flu
virus; studies have shown that of the 473 pigeons tested for bird flu virus, 92.6% of those carrying the virus were obtained from poultry farms (Rentokil 2007). Pigeons are a known cause of many problems around poultry houses (Jones 2007). As a species group of primarily grain and seed eaters, they frequently exploit improperly stored and spilt grain (Critter Control
Page 10 of 87 10
/tt/file_convert/5af3e5387f8b9a5b1e8bc71f/document.docx
2007b; Murton, Thearle & Thompson 1972; SACS 2007; Coombs et al. 1981). They are regularly recorded in the literature as present at poultry units (Boudreau 1975; Jones 1972; Jersey Environment Department 2007; Hejlicek & Treml 1993a; Hudson 1965; Hudson 1972; Murton & Westwood 1966; Coombs et al. 1981). A study of feral pigeons at Salford docks states that the birds fed from spilled bags of processed cattle and poultry feeds (Murton et al. 1972). This was confirmed in a study into the food of Rock Doves and Feral Pigeons where poultry mash was found in the crop of a Rock Dove (Murton & Westwood 1966). Around grain handling facilities, pigeons consume and contaminate large quantities of food destined for human or livestock consumption (Critter Control 2007b). Poultry holders in Switzerland, however, reported that ‘pigeons have rarely been observed nearby poultry’, with only five out of 169 holdings recording a presence (Schelling et al. 1999).
Collared Doves (Streptopelia decaocto) are described as a major agricultural pest, eating vast quantities of chicken feed (SACS 2007). They are also described as ‘essentially grain eaters and are particularly familiar wherever poultry are kept’ (Jersey Environment Department 2007). Hejlicek & Treml (1993a) also found Collared Dove coming into close contact with farm animals, including poultry on farms and Hudson (1965) also states that Collared Ddoves are familiarly associated with poultry farms ‘especially where hens are kept on open range’. A small flock was recorded in the UK feeding in an open chicken run at Carshalton, Surrey during the 1961-2 winter. Peak numbers occurred at poultry farms in autumn, when lots of juveniles were present. Lowest numbers occurred during early summer. In Kent, D.C.H. Worsfold (Hudson 1965) reported “poultry breeders say that [Collared Doves] are costing them a small fortune in meal, which they take from under the noses of the fowls.” Poultry keepers in Norfolk and Surrey “have expressed concern at the amount of corn taken from their hens” (Hudson 1965). In a later paper (Hudson 1972; Hudson 1965), mentioned Collared Doves at chicken farms, where grain is accessible and large flocks can build up and become a nuisance. Confirmation that Collared Doves utilise poultry feed has been gathered from ringing data that showed birds being caught, ringed and released from hen runs (Baxter, personal observation). Coombs et al. (1981), summarised the situation by stating that ‘Collared Doves in urban habitats are invariably associated with human settlements, both urban and rural, where grain is available’
The European Food Standards Agency (EFSA 2006) have therefore classified Wood Pigeon (Columba palumbus) as a high contact risk, as they share farmland habitat used by domestic poultry. In addition, Collared Dove is considered a high risk for transmitting avian flu (Atkinson et al. 2006). The literature agrees this is a high risk species in terms of direct contact. Feral pigeon is also classed as high contact risk species with poultry (EFSA 2006). In addition, Faulkner (1966) in the United States, recorded ‘domestic pigeons’ (assumed to be feral pigeons) that ‘fly from the cities out to the countryside during daytime to feed on duck and poultry ranges’. The literature confirms that ‘pigeon species’ present a high contact risk.
1.11 OwlsContact risk = L. There is limited information within the literature as to the potential for Owls (Strigiformes) to either transmit avian flu or frequent poultry units. Owls are a predatory species. They tend to be either nocturnal or crepuscular and such behaviour is unlikely to bring them into direct contact with poultry. In relation to pheasant rearing units, gamekeepers attributed 4·3% of chick deaths across 28 pens in southern England to buzzards, 0·7% to owls and 0·6% to Sparrowhawks. Before legal protection was introduced, Tawny Owls were known to exploit old fashioned pheasant rearing pens (Mead, 1999). There is little evidence in the literature, however, to suggest poultry units are affected by owls in the UK.
1.12 Woodpeckers and AlliesContact risk = 0. Woodpeckers (Picidae) are specialist climbers and feeders,
excavating nest holes in vertical tree trunks (Mullarney et al. 1999). As such their behaviour is unlikely to bring them into direct contact with poultry, although nest holes may be located on or near poultry units. No literature was found detailing the potential for woodpeckers to either transmit avian flu or frequent poultry units.
1.13 PasserinesContact risk = H. House Sparrows (Passer domesticus) were identified by Jones (2007),
as causing many problems around poultry houses with new farm houses providing them with breeding and roosting stations, while more extensive grain-growing provided them with food.
Page 11 of 87 11
/tt/file_convert/5af3e5387f8b9a5b1e8bc71f/document.docx
House Sparrows interfere with the production of livestock, particularly poultry, by consuming and contaminating feed (Critter Control 2007c). They consume grains in fields and in storage. They do not move great distances into grain fields, preferring to stay close to the shelter of hedgerows. Localized damage can be considerable since sparrows often feed in large numbers over a small area. Starlings (Sturnus vulgaris) and House Sparrow are closely associated with farm buildings and will enter poultry units for food, water and sheltered roost and nest sites (EFSA 2006; Jones 1972; Jones 2007; Faulkner 1966; Critter Control 2007c), as will Blackbird (Turdus merula). House and Tree Sparrows (Passer montanus) are classed as posing high contact risk with poultry (Atkinson et al. 2006), In addition, Starling, House and Tree Sparrow are considered as a high risk bridging species (Atkinson et al. 2006).House Sparrow nests were found in a hay-barn very close to a chicken-house (Ewing 1911). This author also reported that nests were also often lined with poultry feathers. The relationship between House Sparrows and the presence of livestock (including domestic fowl) due to additional food supplies (both vegetables and insects) was confirmed by Dyer, Pinowski & Pinowska (1977). 23 House Sparrows were captured on poultry farms in Georgia, between November 1997 and March 1999, (Luttrell et al. 2001)). 90% of poultry-holders mentioned house sparrows as frequently observed in the poultry yard (Schelling et al. 1999) and they were recorded as having direct contact with poultry by poultry holders. (Craven et al. 2000), report the collection of House Sparrow droppings on or near broiler chicken houses whilst Faulkner (1966) also reported the role of House Sparrows as contaminators of food and water set out for poultry. House Sparrows were recorded by Berry (2007) as one of the most common problems at poultry houses. This was confirmed where House Sparrows and Tree Sparrows were discussed in relation to direct transfer of mycobacteria to poultry and cattle on farms (Hejlicek & Treml 1993b). There seems little doubt from the literature that House Sparrows utilise poultry units wherever possible.
Tree Sparrows are routinely recorded in close contact with aquatic birds and domestic poultry’ (Kou et al. 2005) and around duck farms (Melville & Shortridge 2006). Eurasian Tree Sparrows were reported congregating at Poultry Units in Malaysia to feed on commercial mash provided to laying hens (Wong 1983). Sparrows caught at a poultry unit were confirmed as residents; ‘nesting in inaccessible sites of the masonry of nearby buildings, and returning regularly to feed on the mash.’ Stomachs of adult tree sparrows were also assessed and confirmed to contain 80-97% poultry mash by weight.
Starlings may have been involved in outbreaks of highly pathogenic infections in turkeys in eastern England (Alexander & Spackman 1981). They were also considered a risk as a bridge species; having potential to transmit H5N1 from wild waterbirds to poultry (Atkinson et al. 2006; EFSA 2006). They are routinely recorded at or near poultry units. Confirmation of a direct presence was obtained between November 1997 and March 1999 with 25 starlings captured at poultry farms during studies in Georgia, USA (Luttrell et al. 2001) Similarly, a large flock of starlings was reported roosting in maple trees on a poultry farm at Pennsylvania University (Ellis 1966). Direct reports of Starlings using hen runs were also recorded by Dunnet (1955), and, as with sparrows, starlings were recorded as one of the most common problem birds in poultry houses (Berry, 2007). At poultry feedlots, starlings are reported consuming and contaminating considerable amounts of food (Zajanc, 1962). Reference was again made to starlings on poultry farms and duck ranges ‘filling up’ on duck feed before entering roosts (Faulkner 1966). Reports of nesting in the roofs of poultry sheds at a farm in southern England have occurred (Pearson et al. 1993) and Craven et al. (2000) reported Starling droppings collected on or near broiler chicken houses. The presence of financial loss, where Murton and Westwood, 1966 quoted a loss of £33 000 per annum of food to Starlings at a large poultry farm in eastern England, confirmed a numerous presence at poultry units (Feare 1980b). Starlings and sparrows appear routinely in the literature as species directly associated with poultry units. Luttrell et al. (2001) also conducted a study on House Finches (linnets) and the spread of disease due to their association with poultry producing facilities and concluded that poultry farms offered suitable opportunities for feeding and nesting activities for house finches as well as other free-flying passerines. It was reported that 65 linnets were captured on 8 out of 17 poultry farms in 3 counties. They were often seen on ground adjacent to poultry houses, on one occasion nesting under the eaves of a poultry house. In southern England, Blue Tit, Great Tit, Blackbird, Chaffinch, Robin and Pied Wagtail were all caught on a poultry farm (Pearson et al. 1993). Additional species of passerine mentioned in the literature
Page 12 of 87 12

/tt/file_convert/5af3e5387f8b9a5b1e8bc71f/document.docx
included Wagtails, Fieldfare, Redwing, finches and buntings (EFSA 2006; Schelling et al. 1999).
1.14 CorvidsContact risk M – H dependent on species. Rook (Corvus frugilegus) and Carrion
Crow (Corvus corone) are classed as medium contact risk with poultry and a medium risk as a bridge species, with Magpie (Pica pica) and Jackdaw (Corvus monedula) classed as high risk and a high risk bridge species (Atkinson et al. 2006; EFSA 2006). Although Ravens (Corvus corax) have been reported scavenging on chicken waste in farms (Pembrokeshire Bird Group 2006), they are considered a low contact risk to poultry (EFSA 2006). Records of the various corvid species in the UK at poultry farms are extensive. Raven and other corvids were heavily persecuted in Britain in the late 17 th and early 18th centuries because they preyed on farm poultry and young livestock (Jones 1972). Crows (Hooded Crow or Rook) were one of the two most frequently mentioned species having direct contact with poultry by poultry holders in Switzerland (Schelling et al. 1999). Several instances of considerable loss to poultry raisers due to fondness of crows for young chickens and ducklings, are recorded (Cole 1909). Similarly, crows were responsible for 9% of depredation events of chickens on poultry farms in eastern France 1999-2000 (Stahl et al. 2002). A questionnaire circulated to readers of ‘Farm Journal’ showed 6397 reports of damage to poultry by Crows (Auk 1926). The Poultry Keeper Forum reports that ‘magpies and rooks will take ducklings, and crows will take eggs‘ (The Poultry Keeper Forum.2007).
Fragments of hen eggshell were found in the stomachs of crow and magpie, although it was not known if these were obtained from nest robbing or if they were discarded fragments. Foraging on poultry feed was also suggested after corn was found in the stomach of a crow (Kalmbach 1934). Magpies are also reported in the literature scavenging at poultry units (Moores 2005). They have also been filmed taking hen eggs from chicken runs (The Poultry Keeper Forum. 2007), and are suspected of eating guinea fowl eggs on farms (Farming friends 2007). Reports included magpies regularly occurring near poultry farms in Hong Kong (Moores 2006), with a reference to a statement saying “I once saw a magpie flying away from a hen coop with a hen’s egg in its bill”. In winter it was reported to “hang about the farmhouses, with an idea to pilfering from the poultry yard.” (Dawson 1892).
Magpies are often reported near livestock due to foraging opportunities on dung-and carrion-associated insects. Critter Control (2007a) states that “they rob wild bird and poultry nests of eggs and hatchlings” and can be very destructive to poultry during their nesting season. Dead magpies at poultry units have also been reported. In March 2004, 3 Korean magpies (Pica pica sericea) were found dead on a chicken farm in South Korea, and magpies were frequently seen at drying houses on an egg-production farm (Kwon et al. 2005). Common Magpies (Pica pica) were also reported dead in association with poultry farms in Japan and again in South Korea (Melville & Shortridge 2006).
Whilst little evidence exists for other species of corvid (e.g. Jackdaw and Raven), the Pembrokeshire Bird Group, on 19th February 2006, reported 188 ravens on Capeston chicken farm, Pembrokeshire which were feeding on chicken waste. It is also considered highly likely that Jackdaw would occupy a similar niche to other corvids and would utilise feeding opportunities presented by poultry units in the same way.
There is no evidence in the literature of Jays being present at or using poultry farms although their status as a predator of eggs and young chicks of other birds could present them in the same category as magpies.
local movement patterns And Habitat usage of wild bird species identified at poultry unitsIn order to evaluate the potential transfer of disease by birds that come into contact with,
or act as bridging species to, poultry units, an assessment of the literature to identify habitat use, flocking behaviour and movement observations is presented. Habitat usage is defined as, and limited to: agricultural land, woodland, freshwater and marine environment. Gregariousness is classified where birds can be confirmed as solitary, or flocking species. Where species groups are identified as having a no contact rating in section 4, above, they are precluded from this section.
Page 13 of 87 13

/tt/file_convert/5af3e5387f8b9a5b1e8bc71f/document.docx
1.15 GrebesThere was no evidence located during the literature search to suggest that Grebes
could come into direct contact with poultry units. Kontor (2005), confirms that some species (e.g. Great-crested grebe, Podiceps cristatus), are solitary or social with members of their own species. Home ranges of Grebes, however, were difficult to locate within the literature (e.g. Smith 2007). Great-crested Grebes limit their range to the territorial waterbody that they occupy during the breeding season (Cramp 1977). Greater detail is provided for the Slavonian Grebe (Podiceps auritus) for which the home range during the breeding season is recorded as 330 to 30,000 square meters (Stedman 2000). Many grebes moult their flight feathers during the late summer and remain sedentary on waterbodies (Piersma et al. 1998, Storer 1985). Winter movements can include dispersal to estuaries or larger waterbodies in Britain where the birds may remain throughout the winter months (Cramp 1977).
The available literature suggests that, during the breeding season at least, Grebes will not move away from waterbodies. As carriers of HPAI, however, they may have the potential to act as bridging species to other waterfowl.
1.16 CormorantsCormorants were identified as having a medium risk of acting as a bridging species. Their habitat use consists of freshwater and marine environments. They are known to aggregate in breeding colonies and are also gregarious outside the breeding season (Cramp & Simmons 1983). The UK and Ireland populations are non-migratory but show extensive dispersal although there has been a significant increase in the inland breeding and overwintering population over the last 30 years that is thought to arise from an influx of continental birds (British Trust for Ornithology 2002). A study by Newson (2000) estimated a mean natal dispersal distance of 101 km. Hughes et al. (1999) showed that 68% of feeding sites were within 10km of roost sites and 84% within 15km. Most radio-tagged birds fed within 5km. Other authors suggest distances ranging up to 65km (Warke et al. 1994), although Platteeuw & van Eerden (1995) suggest the average upper limit for foraging distance for cormorants where they maintain an energetic balance is 20km. This is generally accepted as the maximum distance the majority of cormorants will move each day. Cormorants create a potential risk of disease transmission if they are to come into contact with direct contact species such as Mallard, whilst on waterbodies.
1.17 Herons Grey Herons were identified as having a low contact risk and medium bridging risk. Their habitat use is freshwater. Grey Heron are solitary feeders and show limited flocking behaviour outside the breeding season (Brooks et al., 1985). During the breeding season, however, Herons aggregate into breeding colonies (Heronries). British and Irish populations are non-migratory, but are nomadic moving up to 150 km from their birthplace (Brooks et al., 1985). Information was located on the foraging ranges of Little Egret and White Stork but could not be isolated for Grey Heron. Further research would be required to investigate their potential interactions with direct contact species and their further information gathering on local movements in specific areas.
1.18 WildfowlWildfowl species have been identified as low to high contact risk species and are also
potential bridging species. Habitat use includes freshwater, marine environment, agricultural land and woodland. The key species of high contact risk for Britain is Mallard. They are generally gregarious and form large flocks throughout the year. They show a high degree of mixing with other species. Migrant and sedentary populations of mallard occur (Brooks et al., 1985), long distance migration routes to EU countries are via The Black or Aegean Seas, the Baltic and Adriatic Regions (EFSA 2006). Mauser, Jarvis & Gilmer (1994) suggested that the mean home range size (the area to which broods restricted their activities during the rearing period) in 1989 in studies in California was 1.27km2. This reduced to 0.62km2 in 1990 resulting in a combined result of 0.93km2 for 1989-1990. This was developed to include the total home range by Mack, Clark & Howerter (2003) in Canada. Results from these studies suggested home range size ranged from 3.9-1281.8ha (mean = 163.816.7ha).
The average minimum home range during the breeding season was 210ha for 12 ducks and 240ha for 12 drakes. Home ranges were usually elongate in shape. The long axis
Page 14 of 87 14

/tt/file_convert/5af3e5387f8b9a5b1e8bc71f/document.docx
of the home ranges of drakes and ducks averaged 2.8 and 2.7km respectively (Gilmer et al, 1975).
Data gathered by the Central Science Laboratory during two separate, many year studies in the Yorkshire Dales, and the greater London area (Allan & Stevens 1996), found that Canada Geese are sedentary in the UK. Breeding birds remain on site from the beginning of April through to the middle of July. Very few records involved birds undertaking daily commutes of more than 5km. Further research would assist the development of better models for key wildfowl species. The literature generally concurs that a precautionary range for Mallard sits within a 3km local axis and for common feral geese (Canada Geese), 5km.
1.19 Birds of PreyBirds of prey were identified as high contact risk species. Their habitat use includes
agricultural and woodland environments. Birds of prey are confirmed as predominantly sedentary and occupying a wide range of habitats. Species in the UK that include Kestrel, Sparrowhawk, Merlin, Peregrine, Buzzard and Goshawk are solitary, territorial, particularly during the breeding season (Village, 1990), and show a high degree of loyalty to particular sites. (Davies, Cross & Davies 2001; British Trust for Ornithology 2002; Shrubb 1993).
Lesser Kestrels are known to forage preferentially in areas close to the colonies (Garcia 2006). In 1938, Walpole-Bond found Peregrines, however, to have a larger home-range (Cramp & Simmons 1983). The extent of hunting beyond nesting territory, however, was not found for many peregrine populations. In north-east Scotland, Weir recorded in 1978 that most prey seem to be taken within 2km of the nest-site although hunting range may extend to 6km or more when females hunt (Cramp & Simmons 1983)). In continental Europe Glutz et al., (1971) found that breeders may hunt up to 15km or more from the nest site (Cramp & Simmons 1983)).Sparrowhawk are known to affect the distribution and success of prey species such that Pied Flycatcher boxes, for example, are more successful at greater distances (>330m) from Sparrowhawk nest sites than those situated closer by Thomson et al. (2006). Home ranges of other birds of prey vary, but generally remain within a territorial area, particularly during the breeding season. Buzzards, for example, (Kenward R.E., Walls S.S. & Hodder K.H 2001), show post natal dispersal up to 100km, but post nuptual movements were never more than 2km. Birds were generally sedentary when suitable worm rich soils were available within local agricultural land. Northern Goshawks are described by Wiens, Reynolds & Noon (2006) as having a post natal dispersal of between 0.1km and 58km, compared to a territorial breeding range of 3.8km.Red Kite movements vary between and within days. Birds were identified up to 10km apart in a single day, or 18km apart on different days. Glutz et al, (1971) suggested Central European birds travelled up to 20km from the roost (reported in Cramp and Simmons, (1983)). The home range was not defended except around nest sites and ranges could be overlapping. In Wales, hunting range varied in extent with some birds appearing to normally to feed within 2-3km radius of the nest, others may range up to 15km.It can therefore be concluded from the literature that the main species, which could be involved in direct contact with poultry units are either localised during the breeding season, or could disperse far greater distances outside this period.
1.20 GamebirdsGamebirds were identified as medium to high contact risk species. Their habitat use includes agricultural and woodland environments. Once released from rearing pens, pheasants can be found in small groups.
Genovesi, Besa & Toso (1999) confirmed the home range of pheasants in northern Italy averaged 22.36ha. No difference was observed by Smith, Stewart & Gates (1999) between the home ranges of either sex in north central Maryland. During studies undertaken between 1990 and 1994, mean linear movements between roost and morning locations ranged from 198 to 308m on one site and 196 to 340m on another. Behaviour was highly variable with total daily movements as small as 25m to greater than 1km. Perkins et al. (1997) found the individual home ranges for female pheasants differed significantly from less than 10ha to greater than 700ha.
Page 15 of 87 15

/tt/file_convert/5af3e5387f8b9a5b1e8bc71f/document.docx
Between day movements averaged 170.838.9m and home ranges averaged 36.611.9ha at Palo Alto, an area of high habitat diversity. Between day movements averaged 250.439.1m and home ranges averaged 47.718.9ha at a less diverse site (Schmitz & Clark 1999). Further work undertaken on male pheasants in spring showed dispersal to an average of 3.20.3km from wintering sites (Leif, 2005). One group of males had a mean home range size of 18.40.9ha. A second group of males had a mean home range size of 45.42.9ha. Woody cover was found to decrease the size of male home ranges and higher proportions of cropland resulted in an increase.
Carroll, Crawford & Schulz (1995) put the home range of Grey Partridge at between 2 and 11 ha. Home ranges of 10ha or more occurred where field sizes were greater. Ranges also increased to 100ha or more during the harvest period.
Rands (1985), states that the home range of unfledged chicks (i.e. with parents), was 0.2-2.2ha. Potts (2002), quoting Döring & Hefrich (2007) similarly places the home range when nesting at 2-3ha, and between 3-6ha with fledged broods in complex habitats. Blank (1980), observed a pair for 15 hours, during which they walked 1200m, and flew 150m. The BTO Migration Atlas quoted Birkan & Angibault (1990), confirming the home range when nesting at about 2-3ha and suggesting a movement of little more than 150m from the nest. In similarity to Carroll et al. (1995), the Migration Atlas quoting Birkan et al. (1992), again confirms the home range of 10ha or more when field sizes are greater.
Blank & Ash (1956) found a well watched territory during the month of April was formed across an irregular area of 2 acres. During continuous observations, the male made one flight out of this area by a distance estimated at approximately 100 yards. By mid-April the territory had shrunk to 1.25 acres.
Both pheasant and partridge, therefore, have small home ranges and are unlikely to spread disease from poultry units a significant distance.
1.21 GullsGulls are identified as high contact risk species. Their habitat use covers marine, freshwater and agricultural land. They are gregarious both through colonial nesting and through group roosting and foraging activities.
The key species identified as a high contact risk species, the Black-headed Gull, is recorded making winter daily movements between roosting sites and feeding sites of up to 50km by Horton, Brough & Rochard (1983). Cramp & Simmons (1983), quoting Zimmerman (1931), Makatsch (1952), Creutz (1963) and Viksne (1970), stated that individual breeding birds generally foraged a maximum distance of 12-30km from the colony. Over half of birds were found to range less than 10km from their colony.
Further literature is available on the movements of Herring Gull. Watson (1981) confirmed adult breeding Herring Gulls with dependent young travelling 21 and 63km from the breeding colony. Cramp & Simmons (1983) quotes a series of references stating the foraging distance from a Moroccan island colony to Spain as 50km. In southern Sweden, foraging distance from a colony was 22-28km and in the Caspian Sea foraging area around the colony was recorded as 30-40km. During winter in the Netherlands individual birds were observed to forage 50-100km from the roost area, and at dumps 40km away. In the breeding season birds were moving 35 to 40km over land and as far out as 20km from the coast (Spaans 1971). The literature reviewed confirms that gull species commute long distances during daylight hours on a routine basis both during the breeding and winter seasons.
1.22 Pigeons Contact risk for pigeon species is stated as high. Habitat use includes agricultural and
woodland. Several pigeon species are gregarious by nature and remain in flocks throughout the year. Movements of Wood Pigeons are generally localised between roosting and feeding sites. Haynes et al. (2003) showed home range size varied from 254 to 296 ha for adults and juveniles respectively in summer months increasing to 628 and 1283 ha during winter months. Feral pigeon movements were summarised by Rose, et al. (2006) from observations in 11 countries. Movements between 0.34 and 20km occurred with over 95.6% of movements less than 0.5km. Colquhoun (1951) records Wood Pigeon as territorial during the breeding season, but with feeding bouts routinely outside their breeding area. Tomialojć in 1976
Page 16 of 87 16
/tt/file_convert/5af3e5387f8b9a5b1e8bc71f/document.docx
recorded birds flying up to 65km between feeding grounds and roost sites within urban populations in Poland (Cramp & Simmons 1983). In studies around London Gatwick airport (Baxter and Cropper, 2007, unpubl), Wood Pigeons were observed moving between woodland roost sites and the nearest available agricultural foraging fields. Birds were only observed travelling longer distances when closer habitat was unavailable. Haynes et al. (2003) concentrated their woodpigeon foraging studies within a 35 Ha study area that included all the habitats required by this species during the breeding season.
Localised movements of pigeons varies between species. A feral population of Rock Dove/Feral Pigeon in Bruno (Czechoslovakia) roosted in town and fed by day on surrounding farmland (including grain stores); movements were generally 5-8km with a maximum recorded distance rarely over 18km. In 1979 Havlín suggested that longer movements were probably a result of birds dispersing away from the town (Brooks et al. 1985; Brooks et al. 1985). In 1970, Brion and Vacherin Paris found that birds travelled approximately 600m from their nest site (Brooks et al. 1985; Brooks et al. 1985). This concurs with reports by Bruns in 1959 and Reinke in 1959, where birds in Vienna were recorded moving c. 500-600m, and in Hamburg, where four flocks moved up to 400m between roosting and feeding sites but generally kept within an approximate 150m radius of feeding sites during the day (Brooks et al. 1985).
Two papers from Belgium by Lippens in 1935 and Delmée in 1954 provided breeding season data for Stock Dove that recorded an activity radius of 15-20km (Brooks et al. 1985). Turtle Dove, Britain’s only completely migratory species, has been recorded feeding away from the nest at ranges up to c. 3-6km (Glutz von Blotzheim & Bauer 1980). Collared Doves have often been found to move 200km or more in Britain (Coombs et al., 1981), but the age of these is not known, and they include no known breeding adults. Birds breeding near Soham, Cambridgeshire, flew 2km to feed at the local grain mill. Birds feeding at Trafford Park cereal factory occasionally joined another flock feeding at another corn products factory 2.5km away. Birds feeding here roosted in the evening at a farm 3km away. Birds from this study were, however, also reported from over 80km away.
Pigeon species appear to occupy a localised territory and feeding range. Some literature, however, suggests much greater movements can occur.
1.23 PasserinesOf those species identified as present and thus high contact risk species at poultry
units, Sparrow species and starling movements appear the most important. All occupy agricultural and woodland environments and are routinely flocking birds.
The BTO Migration Atlas records the median movements of Tree sparrows recovered dead from ringing studies as less than 1km. The recovery distribution matches the ringing locations, emphasising the sedentary nature of the bird and the limited movements undertaken. Cramp & Simmons (1994) confirm this finding with a description of “mainly sedentary, although can be eruptive in mainland Europe”. Dispersal is mostly small scale, less than 10km. Outside the breeding season birds from adjacent loose breeding colonies (each covering 1-10ha) tend to mix and wander over a home range of 10-100km2. Birds return to the colony to roost at night after moult at the end of September and October.
House Sparrow is also a highly sedentary species with little or no movement into or out of an area. Craggs (1967) found that an isolated population on an island 1.5 miles offshore showed almost no immigration and reported again in 1976 (Craggs 1976) that the population died out when the warden removed all stock (including hens) but re-established several years after hens were re-introduced.
House Sparrows flock to cereal crops in late summer with distances of 0.5 miles and 0.75 miles from breeding colonies reported (Summers-Smith 1954). The same author reported that “village and suburban birds made movements of up to 2km in Autumn to ripening grain” (Summers-Smith, 1963). Ringing recoveries in Britain showed that 91% are within 2km, and only 3% over 10km. Brooks et al. (1985) confirmed this sedentary nature with individuals seldom moving more than 1-3km from a colony area.
BWP (Brooks et al, 1985) also noted the presence of communal roosts with starlings in London, coming from at least 2.25km away. Summers & Cross (1987) suggested this species regularly moved 29km between feeding and roosting sites, and changed areas and
Page 17 of 87 17

/tt/file_convert/5af3e5387f8b9a5b1e8bc71f/document.docx
roosts through the winter. Feare (1980a) showed that Starlings had extreme fidelity to feeding and day-roost sites throughout the winter. A further paper by Feare (1984) concluded that during the breeding season most feeding occurs within 200m of the nest, but can range up to 500m.
1.24 CorvidsContact risk is considered high. Habitat use includes woodland and agricultural. Corvids are either partially or wholly arboreal and are often gregarious when feeding and roosting, although crow species can be more solitary when breeding (BWP Brooks et al, 1985). They are generally sedentary, commuting only short distances between roosting / breeding and feeding sites (British Trust for Ornithology 2002; Holyoak 1971; Loman 1985; 1986; 1986). Distances vary depending on the time of year, food availability, and the breeding season. Daily distances travelled are small, with a median distance for Carrion Crow of 2-6 km (British Trust for Ornithology, 2002) with a maximum distance of 5 km recorded by Loman (1985). Similarly, Rooks have a small home range between 2 – 3 km and 0.5 – 1 km during the breeding season and when food is readily available in spring, autumn and early winter. Outside the breeding season ranges can extend to 1 – 1.5 km with a maximum recorded of 19 km (Griffin & Thomas 2000; Macdonald & Whelan 1986; Patterson, Dunnet & Fordham 1971). Magpies are sedentary (Holyoak 1971), and highly territorial, they defend quite large territories of around 5 ha increasing to around 7 ha in winter (Birkhead 1991; Vines 1981) and tend only to leave to chase intruders, to join mobbing with other Magpies or to roost (Baeyens 1981).
The British Trust for Ornithology (2002) states that both Carrion and Hooded Crow are highly sedentary. The median distance travelled varied from 2-6km. Distances appear to be shorter in southern Britain, particularly the southeast, than elsewhere. Holyoak (1971) recorded only five birds moving more than 20 miles whilst Cramp & Simmons (1994) stated that flights to communal roosts were up to 6-8km. Loman (1985) provided an estimate of the longest distance travelled from feeding place to roost of 5km. 2 radio-tagged individuals frequently changed roost site. Picozzi (1975) measured the mean area used per pair each year as 33-49ha. This was similar to the size of the territories measured by Röell (1978) showing variation between 15 and 50ha. Charles, 1972 in Cramp & Simmons (1994), also provided a territory estimate for nesting pairs of 16-41ha.
For Rook, the British Trust for Ornithology (2002) showed from recoveries of dead birds a median distance moved of only 4km. For records of birds ringed in the breeding seasons and recovered in winter, only 21% were over 20km. Patterson et al. (1971), stated the maximum distances flown to various roosts as 10, 16, and 19km. This was comparable with other authors quoted by Patterson who showed maximum distances flown to roost of between 11 and 22km for specific birds.
Coombs (1961) stated the approximate area of 3 Rook parishes (based on the pattern of roosting when the winter roosts are at their maximum size) as 30-40 square miles, 40-45 and 40 square miles respectively. One rookery was used for roosting by birds from several other colonies, all of which were located within 2 miles (c.3km). In contrast, McKilligan (1980), reported winter movements resulting in a round trip of 90km each day. These distances were thought to be due to local food shortages. Coombs (1978), states that in winter Rooks may commute from up to 20km each day. Cramp & Simmons (1994) confirm urban roosting rooks commuting to agricultural land every day to feed over distances of 12km. These included the Ythan Valley where birds foraged further from a colony when breeding (average c. 1.5km) than in autumn and winter (c. 1km), but furthest immediately after breeding (c. 2.2km) (Cramp & Simmons 1994). In León, France, Cramp & Simmons (1994) report the foraging radius in the breeding season as approximately 3km compared to c.10km in autumn and winter. Variation in the distances travelled by rooks continues throughout the literature. Griffin & Thomas (2000), suggested that the typical flight distances of rooks observed during the breeding season are between 2-3km. Macdonald & Whelan (1986), suggested the maximum foraging range of rooks outside the breeding season is 6km.
Magpies generally only leave their territories to chase intruders, to join mobbing or gathering Magpies or to roost (Baeyens 1981). They roost up to 800m away from their territory. Mean territory size was 5.8ha. In Fochteloo (Netherlands) territory size was 7.5ha, and home-range was 15ha. Vines, 1981, found a similar situation with the mean home range in spring as 5ha, and in winter as 7ha. Birkhead et al. (1986), showed that Magpies in northern Europe usually defend a large territory, in which they nest, feed and spend most of
Page 18 of 87 18
/tt/file_convert/5af3e5387f8b9a5b1e8bc71f/document.docx
their time. In this study area the territory was about 4.9ha. Several other studies have shown territories of about 5ha, with contiguous boundaries.
Median distance between natal site and first breeding site was 425m (0-798m) in the Sheffield area, or c. 2 territories away. Females tended to move slightly further than males, but differences were not significant. Holyoak (1971), confirmed magpies are markedly sedentary in Britain, and only about a fifth move more than 5 miles (8 km). Jackdaws, which may also be a risk species to poultry units have feeding and roosting sites extending sometimes more than 10km from nest-sites (Röell, 1978). The mean feeding range of residents was identified as 0.39-0.81km, and for non-residents 0.48-0.92km. Colony members occasionally fed more than 1500m from the colony. Importantly, foraging areas of different colonies overlapped, especially at rich food sources. Most corvid species have limited movements and territories although these appear to be dependent on habitat features, time of year and species and some individuals can undertake relatively long distance commutes.
Potential risk of disease spread from poultry units via wild bird speciesThe evaluation of risk created by wild birds identified at poultry units relies on many
factors (Wetlands 2006) and (OIE 2007). In order to create a risk, wild birds must first be able to transmit and shed disease. They must then be able to either transfer an infection to, or collect an infection from, a poultry unit. Their movements must then take them either to other poultry units or in to contact with other species that could continue the transfer of disease to poultry. These other species / individuals must also be susceptible to the disease and must again be able to pass that disease to poultry. The precise route of transmission between individual birds is unclear. There is little literature to confirm whether direct contact with infected wild birds within a poultry flock is important. The Centre for Disease Control (CDC 2007) suggests that faecal to oral transmission is the most common mode of spread between birds. Infected birds can shed virus in saliva, nasal secretions, and faeces. Susceptible birds can then become infected with avian influenza virus when they have contact with contaminated nasal, respiratory, or faecal material from infected birds. A comprehensive risk assessment, therefore, requires baseline information on each factor for each species.
A mechanism needs to be described to produce a quantitative risk assessment for transmission of disease from poultry, via wild bird species, that is based on sound scientific data. Many papers are in agreement on the movement rates and contact risk of different species although high levels of variability are recorded. A qualitative assessment is therefore used for the purposes of this report and is based on a precautionary principle. The main criteria and assumptions made to specify risk are as follows:
1.25 Risk assumptions
1. Species identified as a potential carrier of disease in phase one of this review are assumed to be able to transmit disease to poultry and other wild bird species. This may not be the case.
2. Based on the literature the key species or species groups that create a potential risk of transmission to or from poultry units are those that are likely to visit sites and directly interact with poultry. It is assumed that wild birds will have access to poultry feed, shelters or birds themselves. This may not be the case depending on the type of unit involved.
3. It is assumed that the key species are those that are confirmed within the above two assumptions and that are gregarious (flocking) by nature. It is not possible to determine from the literature, however, whether flocking behaviour does increase the risk of disease transmission.
1.26 Key speciesThe key species that are highlighted in the available literature as having a high direct contact risk with poultry and a link to disease transmission are therefore: Mallard, Black-Headed Gull, House and Tree sparrow, pigeon species, pheasant and corvid species. The risk these species create is known to vary by both species and local habitat diversity.This does not preclude other species, which have been identified from this review and may require consideration at specific sites. The assessment should be used to highlight the species and areas that could not be identified in the literature and further work would
Page 19 of 87 19

/tt/file_convert/5af3e5387f8b9a5b1e8bc71f/document.docx
be required before a quantitative risk assessment methodology and procedure could be developed.Table 1 summarises the contact risk, habitat use, flocking behaviour and range, the species and areas for key consideration. Possible disease transmission potential has been assessed based on evidence from the literature and a subjective judgement by the authors. A suggested ranking system based on the following scores is provided to assimilate a transmission potential.
Contact risk is assigned a score of 2, for medium risk and 4 for high risk. Habitat use has been assigned an additional point if agricultural land is routinely used. Flocking behaviour provides 2 points, whilst range provides 1 point for 1-5km, 2 points for 6-10km and 3 points for over 10km as the reported ranges in the literature. I.e. there is a greater potential for disease spread if birds travel greater distances. The potential transmission to other species is ascribed 2 points for possible and 3 points for likely. This is based on the author’s subjective judgement of the literature. Totals are then used to provide a possible transmission potential rating based on:
Low = 0 – 4 pointsMedium = 5-7 pointsHigh = 8-10 pointsVery High = 11+ points
The data used are insufficient to apply a level of confidence to the assessment and Table 1 is intended to assist with the identification of the key species of concern based on the literature reviewed.
Page 20 of 87 20

/tt/file_convert/5af3e5387f8b9a5b1e8bc71f/document.docx
Table 1 – Summary of factors affecting potential transmission of disease by wild birds at poultry units
Species Contact risk
Habitat use
Flocking behaviour
Probable local range
Potential transmission to other direct species
Possible disease transmission potential
Grebes 0 Freshwater & Marine
Yes Less than 1km (single waters)
Possible to other waterfowl
Low
Cormorant 0 Freshwater & Marine
Yes Maximum energetically viable = 20km.
Possible to Mallard
Medium
Grey Heron Low Freshwater & Marine
Yes (at breeding)
No specific information
Possible to Mallard
Not known
Mallard High (3%)
Freshwater, Marine, Agricultural & woodland
Yes Generally lower than 2.8km
Likely to other waterfowl
High
Geese and swans
0 Freshwater, Marine, & Agricultural
Yes Variable between species.
Likely to other waterfowl
Medium / High
Goshawk High Agricultural & woodland
No 3.8km Unlikely Locally medium (scarce species)
Sparrow-hawk
High Agricultural & woodland
No Non-specific information but up to 1km
Unlikely Medium
Red Kite High Agricultural & woodland
Low Up to 15km Possible to gulls or corvids (e.g. at landfill)
Locally very high (scarce species)
Buzzard Medium
Agricultural & woodland
No 2km+. Longer dispersal movements.
Unlikely Low
Kestrel Medium
Agricultural & woodland
No ‘Local’ Unlikely Low
Peregrine falcon
0 Agricultural & woodland
No Foraging range during breeding 2-6km
Unlikely Low
Pheasant High Agricultural & woodland
Yes Less than 1km
Likely to passerines & corvids
High
Page 21 of 87 21
/tt/file_convert/5af3e5387f8b9a5b1e8bc71f/document.docx
Black-headed (small) gulls
High Freshwater, Marine, & Agricultural
Yes Mostly below 30km but higher recorded.
Likely to corvids & waterfowl
Very High
Herring (large) gulls
Medium
Freshwater, Marine, & Agricultural
Yes Mostly below 30km but higher recorded.
Likely to corvids & waterfowl
Very High
Owls 0 – Low
Agricultural & woodland
No Not discussed
Unlikely Not known
Woodpigeon
High Agricultural & woodland
Yes Most 1- 5km (but max 65km)
Possible to corvids and passerines
High
Stock Dove High Agricultural & woodland
Yes 15-20km Possible to corvids and passerines
Very high
Feral Pigeon
High Agricultural & woodland
Yes Mainly <1km (but 5-8km recorded)
Possible to corvids and likely to passerines
Very high
Collared Dove
High Agricultural & woodland
Yes 3km (but max 80km)
Likely to passerines
Very high
Sparrow (House & Tree)
High Agricultural & woodland
Yes Most less than 3km
Likely to pigeon spp.
High
Starling High Agricultural & woodland
Yes <3km (but max 29km)
Likely to pigeon spp, possible to Jackdaw.
High
Rook High Agricultural & woodland
Yes Generally 6-8km but roost up to 45km.
Possible to passerines & pigeons
Very high
Crow (Carrion & Hooded)
High Agricultural & woodland
Yes Generally 2-6km but up to 20 miles.
Possible to passerines & pigeons
Very high
Jackdaw High Agricultural & woodland
Yes Up to 1.5km.
Likely to passerines & possible to pigeons
High
Magpie High Agricultural & woodland
Yes 95% of movements less than 5 miles.
Possible to passerines & pigeons
Very high
1.27 SummaryThe priority species that have the potential to transmit disease within the groups suggested by the literature reviewed in this report are therefore:
Page 22 of 87 22

/tt/file_convert/5af3e5387f8b9a5b1e8bc71f/document.docx
Very High PotentialBlack-Headed Gull, Herring Gull, Stock Dove, Feral Pigeon, Collared Dove, Rook, Carrion Crow and Magpie. High Potential
Mallard, pheasant, Wood Pigeon, sparrow, Starling and Jackdaw.
These two groups of key species do not preclude other species although information from the literature suggests these are key targets for the development of models to evaluate risk of disease transmission to and from poultry units. Species that have direct contact with poultry or poultry feed/faeces appear to present the greatest threat. If they are solitary species however, they are less likely to pass disease on through the environment. Those that meet these criteria, flock, and are potentially sociable with other species, are considered high priority. However, they may not result in rapid spread of disease if they do not commute long distances each day. Such movements are not only influenced by the species involved (e.g. pheasants are bred for short movements), but also by local habitat characteristics and time of year (breeding season). It is important, therefore, that models developed account for local conditions and the abundance of particular bird species in that area. It is also assumed that different types of poultry unit (e.g. broiler house, free range, battery farm etc.) will have different levels of accessibility by wild birds. Further investigation is therefore required to evaluate whether proximity to different habitats could impact on risk, what the wild bird species make up at different poultry units in the UK is, whether individual birds visit different poultry units in the same area and how frequently species identified as of concern by this review, move between areas around poultry units.
RecommendationsRecommendations are made for two categories:1. Observations to gather data to assist with the development of a quantitative risk
assessment.2. Observations and monitoring in the event of a disease outbreak at a poultry unit.
1.28 Observations to gather data to assist with the development of a quantitative risk assessment
In order to decide where, and for what distance, biosecurity measures at disease outbreak sites may be required and what levels of wildlife control might be necessary, proactive observations including monitoring for other possible outbreaks in wildlife is required.
Evaluate the presence and behaviour of different wild bird species at different types of poultry units (e.g. battery farms, broiler houses, barns, free-range etc.)
Assess the actual exclusion levels of different unit designs.
Determine how many wild birds of each species actually visit poultry sites, what interactions they have with poultry and how far they move. Ideally undertake ornithological studies across at different sites in different areas and at different times of year.
Determine numbers, distance and frequency of movements of wild bird species between alternative poultry sites.
Evaluate the reasons for wild birds presence at different poultry sites (foraging, warmth, nesting sites, roosting sites etc.)
Determine actual potential for species to create ‘bridging contact’ with other species that may interact with poultry.
Page 23 of 87 23
/tt/file_convert/5af3e5387f8b9a5b1e8bc71f/document.docx
Evaluate the impact of biosecurity measures and whether they are effective at preventing contact with wild birds.
This information could then be combined with existing literature to develop an action plan in the event of a disease outbreak in poultry.
1.29 Observations and monitoring in the event of a disease outbreak at a poultry unit
The location, habitats, time of year, biosecurity measures implemented, speed of implementation and poultry unit type will impact on the likely risk of disease transmission by wild birds in the event of an outbreak.
Develop a targeted management programme using the data gathered from the recommendations suggested above.
Provide direct ornithological observations to determine the local species involved.
Evaluate probable movements of identified species to local habitats and determine potential risk of bridging to other species/areas or use modern survey techniques such as mobile bird detection radar to obtain instant evaluation of movements across the local area of wild birds to and from the poultry unit.
Target biosecurity based on observations of wild bird species present and their known foraging/commuting ranges at different times of year.
Ensure such a programme has been tested prior to its requirement in the event of a disease outbreak.
References
Alexander,D.J. & Spackman,D. (1981) Characterization of Influenza A viruses isolated from turkeys in England during March-May 1979. Avian Pathology, 10, 281-293.
Allan,J.A. & Stevens,M. (1996) Canada Goose movements in Yorkshire Dales – unpublished data, Central Science Laboratory, Sand Hutton, UK.
Archibald,C.F. (1892) Wild Birds, useful and Injurious. Journal R.agric.Society, Iii, 658-684.
Atkinson,P.W., Clark,J.A., Delany,S., Diagana,C.H., du Feu,C., Fiedler,W., Fransson,T., Gaulthier-Clerc,M., Grantham,M., Gschweng,M., Hagemeijer,H., Helmink,T., Johnson,A., Khomenko,S., Martakis,G., Overdijk,O., Robinson,R.A., Solokha,A., Spina,F., Sylla,S.I., Veen,J. & Visser,D. (2006)Urgent preliminary assessment of orntihological data relevant to the spread of Avian Influenza in Europe. Delany, S., Veen, J., and Clark, J.
Auk (1926) Notes and News. Auk, 43, 140-141.
Baeyens,G. (1981) The role of the sexes in territory defense in the Magpie. Ardea, 69, 69-82.
Baxter,A.T. (2003) Efficacy of Integrated Bird Management Strategies at UK Landfill Sites. 10th Wildlife Damage Management Conference, April 6-9, 2003, Clarion Resort on the Lake, Hot Springs, Arkansas.
Baxter, A.T. & Cropper, P (2007). Reducing the birdstrike risk from Woodpigeonsat London Gatwick Airport. Confidential report to BAA. 11pp.
BBC. (2007) Farmers tense as avian flu nears. http://news.bbc.co.uk/1/hi/uk/4730020.stm
Page 24 of 87 24
/tt/file_convert/5af3e5387f8b9a5b1e8bc71f/document.docx
Bent,A.C. (1937) Life Histories of North American Birds of Prey. US Nat.Mus.Bull., 167, 132-133.
Berry,J.G. (2007) Wild Bird Control in the Poultry House. Oklahoma Cooperative Extension Service . http://pods.dasnr.okstate.edu/docushare/dsweb/Get/Document-2106/ANSI-8209web.pdf
Bin Muzaffar,S., Ydenberg,R.C. & Jones,I.L. (2006) Avian influenza: An ecological and evolutionary perspective for waterbird scientists. Waterbirds, 29, 243-257.
Birkan,M. & Angibault,J.M. (1990) Utilisation de l'espace et rhythme d'activite chez la perdix grise (Perdix perdix). Hell, P. Proceedings from the sixteenth Congress of the International Union of Game Biologists. 822-831. Forest Research Institute, Zvolen, Czechoslovakia.
Birkan,M., Serre,D., Skibniewski,S. & Pelard,E. (1992) Spring-summer home range, habitat use and survival of Grey Partridges (Perdix perdix) in a semi-open habitat. Birkan, M., Potts, G. R., Aebischer, N. J., and Dowell, S. D. In Perdix VI, First International Symposium on Partridges, Quails and Francolins. 9, 431-442. Gibier Faune Sauvage.
Birkhead,T.R. (1991) Nest spacing and territorial behaviour. The Magpies: The ecology and behaviour of Black-billed and Yellow-billed Magpies pp. 42. T & AD Poyser.
Birkhead,T.R., Eden,S.F., Clarkson,K., Goodburn,S.F. & Pellatt,J. (1986) Social organisation of a Magpie Population. Ardea, 74, 59-68.
Blank,T.H. & Ash,J.S. (1956) The concept of territory in the partridge Perdix perdix. Ibis, 98, 379-389.
Boudreau,G.W. (1975) How to win the war with pest birds pp. 156-157. Wildlife Technology, Hollister, California.
British Trust for Ornithology (1986) The atlas of wintering birds in Britain and Ireland. Carlton. T & A D Poyser, London.
British Trust for Ornithology (2002) The Migration Atlas. Movements of the birds of Britain and Ireland. T & A D Poyser, London.
Brooks,D.J., Dunn,E., Gillmor,R., Hollom,P.A.D., Hudson,R., Nichalson,E.M., Ogilvie,M.A., Olney,P.J.S., Roselaar,C.S., Simmons,K.E.L., Voose,K.H., Wallace,D.I.M., Wattel,J. & Wilson,M. (1985) Handbook of the Birds of Europe, the Middle East and North Africa: The Birds of the Western Palearctic.Volume 4.
Carroll,J., Crawford,R.D. & Schulz,J.W. (1995) Gray partridge Winter Home Range and Use of habitat in North Dakota. Journal of Wildlife Management, 59, 98-103.
CDC. (2007) Centres for disease control and prevention – Department of health and Human services.
Cizek,A., Dolejska,M., Karpiskova,R., Dedicova,D. & Literak,I. (2007) Wild Black-headed Gulls (Larus ridibundus) as an environmental reservoir of Salmonella strains resistant to antimicrobial drugs. European Journal of Wildlife Research, 53, 55-60.
Cole,L.J. (1909) The Crow as a Menace to Poultry raising. 21st Annual Report, Rhode Island
Conroy,C., Sparks,N., Chandrasakeran,D., Sharma,A., Shindey,D., Singh,L.R., Natarajan,A. & Anitha,K. (2007) The significance of predation as a constraint in
Page 25 of 87 25
/tt/file_convert/5af3e5387f8b9a5b1e8bc71f/document.docx
scavenging poultry systems: some findings from India. Livestock Research for Rural Development 17. 21-5-2007. http://www.cipav.org.co/lrrd/lrrd17/6/conr17070.htm
Coombs,C.F.B., Isaacson,A.J., Murton,R.K., Thearle,R.J.P. & Westwood,N.J. (1981) Collared Doves (Streptopelia-Decaocto) in Urban Habitats. Journal of Applied Ecology, 18, 41-62.
Coombs,C.J.F. (1961) Rookeries and roosts of the Rook and Jackdaw in south-west Cornwall. Bird Study, 8, 55-70.
Coombs,F. (1978) The Crows - a study of the corvids of Europe. Batisfrd, London.
Craggs,J.D. (1967) Population studies of an isolated colony of House Sparrows, Passer domesticus. Bird Study, 14, 53-60.
Craggs,J.D. (1976) An Isolated colony of House Sparrows. Bird Study, 23, 281-284.
Cramp,S. (1977) Handbook of the Birds of Europe the Middle East and North Africa. Volume 1. Oxford University Press, Oxford, UK.
Cramp,S. & Simmons,K.E.L. (1980) Handbook of the Birds of Europe the Middle East and North Africa. Volume 2. Oxford University Press, Oxford, UK.
Cramp,S. & Simmons,K.E.L. (1983) Handbook of the Birds of Europe the Middle East and North Africa. Volume 3. Oxford University Press, Oxford, UK.
Cramp,S. & Simmons,K.E.L. (1994) Handbook of the Birds of Europe the Middle East and North Africa. Volume 8. Oxford University Press, Oxford, UK.
Craven,S.E., Stern,N.J., Line,E., Bailey,J.S., Cox,N.A. & Fedorka-Cray,P. (2000) Determination of the incidence of Salmonella spp., Campylobacter jejuni, and Clostridium perfringens in wild birds near broiler chicken houses by sampling intestinal droppings. Avian Diseases 44[3], 715-720.
Critter Control. (2007d) Hawks and Owls. 22-5-2007c. www.crittercontrol.com
Critter Control. (2007a) Magpies. 22-5-2007c. www.crittercontrol.com
Critter Control. (2007b) Pigeons. 22-5-2007c. www.crittercontrol.com
Critter Control. (2007c) Sparrows. 22-5-2007c. www.crittercontrol.com
Davies,P., Cross,T. & Davies,J. (2001) Movement, settlement, breeding and survival of Red Kites Milvus milvus marked in Wales. Welsh birds, 3, 19-43.
Dawson,W.L. (1892) The magpie in Washington. Wilson Bulletin, 4, 64-67.
De Marco MA, Foni GE, Campitelli L, Raffini E, Di Trani L, Delogu M, Guberti V, Barigazzi G & Donatelli I (2003) Circulation of influenza viruses in wild waterfowl wintering in Italy during the 1993-99 period: evidence of virus shedding and seroconversion in wild ducks. Avian Diseases, 47, 861-866.
Defra (2006) http://www.defra.gov.uk/animalh/diseases/notifiable/ai/index.htm#history
Domenech,J., Lubroth,J. & Martin,V. (2006) Avian Influenza: Global situation. Proceedings of the FAO & OIE International Scientific Conference on Avian influenza and wildbirds. Rome, May 30th-31st, 2006.
Page 26 of 87 26

/tt/file_convert/5af3e5387f8b9a5b1e8bc71f/document.docx
Döring,V. & Hefrich,R. (2007) Zur Ökologie einer Rebhuhnpopulations (Perdix perdix) im Unteren Naheland (Rheinland-Pfalz;BRD) Schriften. des Arbeitskreises Wildbiologie und Jagdwissenschaften an der Justus-Leibig-Universität Giessen 15. 2007. Ferdinand Enke Verlag, Stuttgart.
Dunnet,G.M. (1955) The breeding of the Starling Sturnus vulgaris in relation to its food supply. Ibis, 97, 619-662.
Dyer,M.I., Pinowski,J. & Pinowska,B. (1977) Population Dynamics. Granivorous Birds in Ecosystems (eds J. Pinowski & S. Kendeigh), Cambridge University Press, Cambridge.
EFSA. (2006) Scientific Report on Migratory Birds and their possible role in the spread of Highly Pathogenic Avian Influenza.
Elliott,V. (2006) Poultry farmers face export ban as vets warn threat is here to stay. The Times.
Ellis,C.R. (1966) Agonistic Behaviour in the male Starling. Wilson Bulletin, 78, 208-224.
EMPRES Watch (2006) Updated situation of Highly Pathogenic Avian Influenza (H5N1) in Asia. 23-5-2007.
Ewing,H.E. (1911) The English Sparrow as an agent in the dissemination of chicken and bird mites. Auk, 28, 335-340.
Farming friends. (2007) Magpies are eating my guinea fowl eggs. Farming Friends. http://www.farmingfriends.com/index.php?tag=interblog-guinea-fowl-project
Faulkner,C.E. (1966) Blackbird depredations in animal industry: poultry ranges and hog lots. Bird Control Seminars Proceedings.
Feare,C.J. (1980b) The Economics of Starling Damage. Bird Problems in Agriculture (eds E. N. Wright, I. R. Inglis & C. J. Feare), pp. 39-55. BCPC Publications, Croydon.
Feare,C.J. (1980a) Proceedings of the international ornithological Congress 17[2], 1331-1336.
Feare,C.J. (1984) The Starling. Oxford University Press, Oxford.
Flake. (1979) Perspectives on man-made ponds and waterfowl in the northern prairies. Annu.Meet.For.Comm., Great Plains Agric.Counc 31, 33-36.
Friedrich Loeffler Institute 2007 available from: http://news.avian-influenza.info/linkout/o.php?out=http://us.rd.yahoo.com/dailynews/rss/search/bird+flu+germany/SIG=12dmprfps/*http%3A//news.yahoo.com/s/afp/20070706/hl_afp/healthflugermany_070706184200
Funmilayo,O. (1982) Commensal rats: A threat to poultry production in Nigeria. Marsh, R. E. Proceedings of the Tenth Vertebrate Pest Conference .
Garcia,J.T. (2006) Foraging activity and use of space by Lesser Kestrel Falco naumanni in relation to agrarian management in central Spain. Bird conservation international, 16, 83-95.
Genovesi,P., Besa,M. & Toso,S. (1999) Habitat selection by breeding pheasants Phasianus colchicus in an agricultural area of northern Italy. Wildlife biology, 5, 193-201.
Glutz von Blotzheim,U.N. & Bauer,K.M. (1980) Handbuch der Vögel Mitteleuropas.
Page 27 of 87 27
/tt/file_convert/5af3e5387f8b9a5b1e8bc71f/document.docx
Griffin,L.R. & Thomas,C.J. (2000) The spatial distribution and size of Rook (Corvus frugilegus) breeding colonies is affected by both the distribution of foraging habitat and by intercolony competition. Proc.R.Soc.Lond.B, 267, 1463-1467.
Hagemeijer,W. & Mundkar,T. (2006) Migratory flyways in Europe, Africa and Asia and the spread of HPAI H5N1. Proceedings of the FAO & OIE International Scientific Conference on Avian influenza and wildbirds . Rome. May 30th-31st, 2006.
Hancock,D. (2004) The Real Story on Avian Influenza. Bannerline Communications 23-5-2007.
Haynes,P.J., Ingus,I.R., Isaacson,T.J. & Fryday,S.L. (2003) Woodpigeon Columba palumbus movements in eastern England. Bird Study, 50, 33-38.
Hejlicek,K. & Treml,F. (1993a) Epizootiology and pathogenesis of avian mycobacteriosis in doves (Streptopelia sp.). Veterinary Medicine (Praha) 38[10], 619-628.
Hejlicek,K. & Treml,F. (1993b) Epizootiology and pathogenesis of avian mycobacteriosis in the House Sparrow (Passer domesticus) and Tree Sparrow (Passer montanus). Veterinary Medicine (Praha) 38[11], 667-685.
Hejlicek,K. & Treml,F. (1993c) Epizootiology and pathogenesis of avian mycobacteriosis in the Ring-necked pheasant (Phasianus colchicus) and the Hungarian partridge (Perdix perdix). Veterinary Medicine (Praha) 38[11], 687-701.
Hollmen,T., Franson,J.C., Docherty,D.E., Kilpi,M., Hario,M., Creekmore,L.H. & Petersen,M.R. (2000) Infectous Bursal disease virus antibodies in eider ducks and herring gulls. Condor, 102, 688-691.
Holyoak,D. (1971) Movements and mortality of Corvidae. Bird Study, 18, 97-106.
Honza,M. (1993) Factors Influencing the Foraging Patterns of the Black-Headed Gull (Larus ridibundus) from Breeding Colonies. Folia Zoologica, 42, 243-249.
Horton,N., Brough,T. & Rochard,J. (1983) The importance of refuse tips to gulls wintering in an inland area of southeast England. Journal of Applied Ecology, 20, 751-765.
Hudson,R. (1965) The spread of the collared dove in Britain and Ireland. British Birds, 58, 105-139.
Hudson,R. (1972) Collared doves in Britain and Ireland. British Birds, 65, 139-155.
Hughes,B., Bevan,R.M., Bowler,J.M., Still,L., Carss,D.N., Marquiss,M., Hearn,R.D. & Bruce,J.H. (1999). Feeding behaviour of fish-eating birds in Great Britain. Department of transport, environment and the regions.
International Scientific Task Force on Avian Influenza. Avian Influenza and Wild Birds. (2006) Pamphlet
Jackson,V., Zimmer,I-A., Grant,R. & Taylor, M.A. (2007). SE4206 - To develop a model for analysing the potential spread of infectious diseases of poultry in the UK. Phase one report.
Jersey Environment Department. (2007) Research and Monitoring - Jersey Wildlife Image Database. States of Jersey Environment Department . 31-5-2007.
Page 28 of 87 28

/tt/file_convert/5af3e5387f8b9a5b1e8bc71f/document.docx
Jones,E.L. (1972) The Bird Pests of British Agriculture in recent centuries. The Agricultural History Review, 20, 107-125.
Jones,F. (2007) Wild Bird Control: Why and How. thepoultrysite.com . 22-5-2007. Ref Type: Electronic Citation
Kalmbach,E.R. (1934) Field Observation in Economic Ornithology. Wilson Bulletin, 46, 73-90.
Kenward R.E., Walls S.S. & Hodder K.H (2001) Life path analysis : Scaling indicates priming effects of social and habitat factors on dispersal distances. Journal of Applied Ecology, 70, 1-13.
Konter, A (2005) Annual Building-up of Great Crested Grebe Colonies: An Example from the Dutch IJsselmeer Waterbirds 28(3) September 2005. pp 351–358.
Kou,Z., Lei,F.M., Yu,J., Fan,Z.J., Yin,Z.H., Jia,C.X., Xiong,K.J., Sun,Y.H., Zhang,X.W., Wu,X.M., Gao,X.B. & Li,T.X. (2005) New genotype of avian influenza H5N1 viruses isolated from tree sparrows in China. Journal of Virology, 79, 15460-15466.
Kwon,Y.K., Joh,S.J., Kim,M.C., Lee,Y.J., Choi,J.G., Lee,E.K., Wee,S.H., Sung,H.W., Kwon,J.H., Kang,M.I. & Kim,J.H. (2005) Highly pathogenic avian influenza in magpies (Pica pica sericea) in South Korea. Journal of Wildlife Diseases, 41, 618-623.
Landeg,F. (2007) Transcript BBC1 One o'clock news, Friday 16 th February 2007, Bird Flu. Media Monitoring Unit, BBC, Bristol.
Lean,G. (2007) Defra investigators fails to test live wild birds for flu despite risk of infection. The Independent. 23-5-2007.
Loman,J. (1985) Social organisation in a population of the Hooded Crow. Ardea, 73, 61-75.
Luttrell,M.P., Stallknecht,D.E., Kleven,S.H., Kavanaugh,D.M., Corn,J.L. & Fischer,J.R. (2001) Mycoplasma gallisepticum in House Finches (Carpodacus mexicanus) and other wild birds associated with poultry production facilities. Avian Diseases, 45, 321-329.
Macdonald,R.A. & Whelan,J. (1986) Seasonal variations in feeding range and flock strcture of the rook Corvus frugilegus in eastern Ireland. Ibis, 128, 540-557.
Mack,G.G., Clark,R.G. & Howerter,D.W. (2003) Size and habitat composition of female mallard home ranges in the prairie-parkland region of Canada. Canadian Journal of Zoology, 81, 1454-1461.
Martin,V., Forman,A. & Lubroth,J. (2006) Preparing for Highly Pathogenic Avian Influenza. FAO Animal Production and Health Manual., Food and Agricultural Organisation of the United Nations. Rome 2006.
Mauser,D.M., Jarvis,R.L. & Gilmer,D.S. (1994) Movements and habitat use of mallard broods in Northeastern California. Journal of Wildlife Management, 58, 88-94.
McKilligan,N.G. (1980) The winter exodus of the Rook from a Scottish Highland valley. Bird Study, 27, 93-100.
Melville,D.S. & Shortridge,K.F. (2006) Migratory waterbirds and avian influenza in the East Asian-Australasian Flyway with particular reference to the 2003-2004 H5N1 outbreak. Boere, G. C., Galbraith, C. A., and Stroud, D. A. Waterbirds around the World. 432-438. Edinburgh, UK, The Stationery Office. 2004.
Page 29 of 87 29

/tt/file_convert/5af3e5387f8b9a5b1e8bc71f/document.docx
Moores,N. (2005) Poultry flu. Aiwatch and Pro-Med. Birds Korea. http://www.birdskorea.org/mail_aiwatch_10nov2005.asp
Moores,N. (2006) Highly Pathogenic avian influenza H5N1 and wild birds: a review of the evidence. Birds Korea. Symposium on Avian Influenza. 7-12-2006.
Mullarney,K., Svensson,L., Zetterstrom,D. & Grant,P.J. (1999) Bird Guide. Harper Collins, London.
Murton,R.K., Thearle,R.J.P. & Thompson,J. (1972) Ecological Studies of the Feral Pigeon Columba livia Var. I. Population, breeding biology and methods of control. Journal of Applied Ecology, 9, 835-874.
Murton,R.K. & Westwood,N.J. (1966) The foods of the Rock Dove and Feral Pigeon. Bird Study, 13, 130-146.
Nicholson,E.M. (1951) Birds and men. Collins.
OIE. Organisation of Animal Health. 2007. http://www.oie.int/eng/en_index.htm
Patterson,I.J., Dunnet,G.M. & Fordham,R.A. (1971) Ecological Studies of the Rook, Corvus frugilegus L. in north-east Scotland. Dispersion. Journal of Applied Ecology, 8, 815-833.
Pearson,A.D., Greenwood,M., Healing,T.D., Rollins,D., Shahamat,M., Donaldson,J. & Colwell,R.R. (1993) Colonization of broiler chickens by waterborne Campylobacter jejuni. Applied and Environmental Microbiology, 59, 987-996.
Pembrokeshire Bird Group. (2006) Lyndon's Monthly roundup. Pembrokeshire Bird Group . 2006.
Perkins,A.L., Clark,W.R., Riley,T.Z. & Vohs,P.A. (1997) Effects of landscape and weather on winter survival of Ring-necked pheasants. Journal of Wildlife Management, 61, 634-644.
Picozzi,N. (1975) A study of the Carrion/Hooded Crow in north-east Scotland. British Birds, 68, 409-419.
Piersma, T., Lindeboom, R., & van Eerden, M. R. (1998) Foraging rhythm of great crested grebes Podiceps cristatus adjusted to diel variations in the vertical distribution of their prey Osmerus eperlanus in a shallow eutrophic lake in The Netherlands. Oecologia 4. pp. 481-486.
Platteeuw,M. & van Eerden,M.R. (1995) Time and energy constraints of fishing behaviour in breeding cormorants Phalacrocorax carbo sinensis at lake IJsselmeer, The Netherlands. Ardea, 83, 93-102.
Potts,G.R. (2002) Grey Partridge Perdix perdix. The Migration Atlas: Movements of the birds of Britain and Ireland. (eds Wernham C., Toms M., J. Marchant, J. Clark, G. Sisiwardena & S. Baille), pp. 261. T & AD Poyser.
Rands,M.R.W. (1985) The Survival of gamebird (Galliformes) chicks in relation to pestiside use on cereals. Ibis, 128, 57-64.
Rentokil. (2007) What is Avian Influenza? Rentokil .
Revill,J., Barnetts,A., Khan,U. & McLaughlin,D. (2007) Grubby scandal shames our poultry industry. The Observer . 23-5-0007.
Page 30 of 87 30
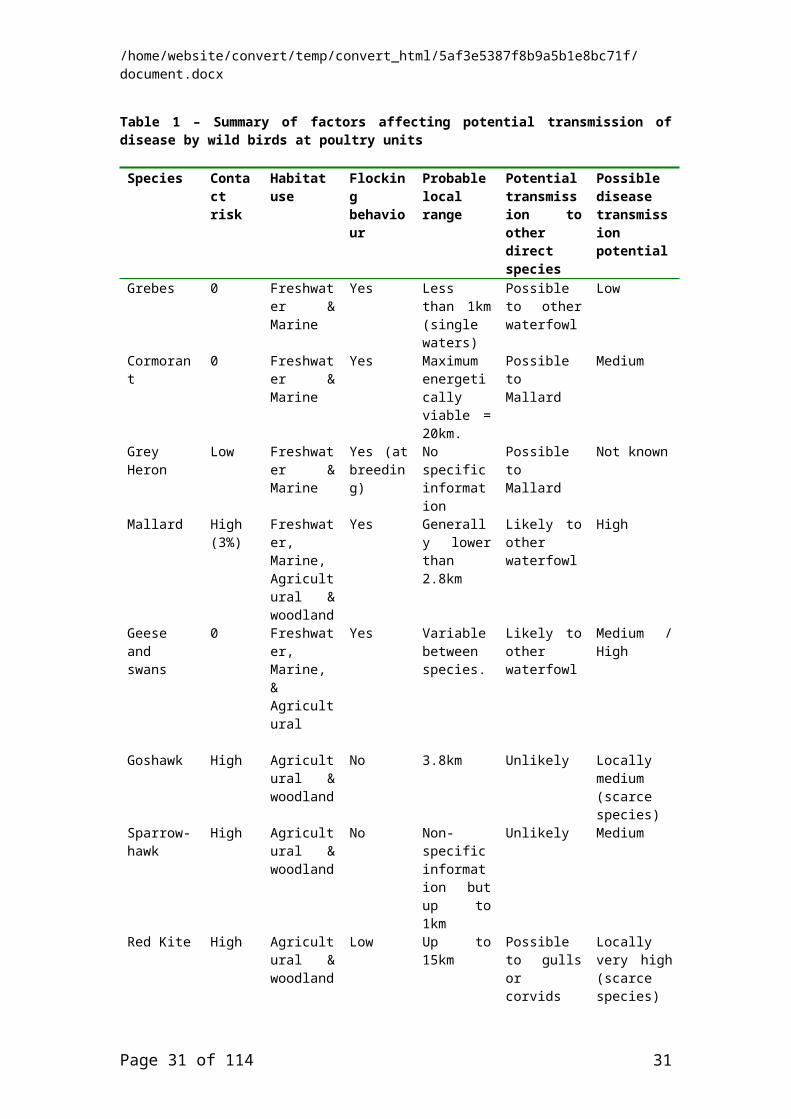
/tt/file_convert/5af3e5387f8b9a5b1e8bc71f/document.docx
Röell,A. (1978) Social behaviour of the Jackdaw in relation to its niche. Behaviour, 64, 1-124.
SACS. (2007) The Latest Plague? Clark, I. SACS Magazine 2007.
Schelling,E., Thur,B., Griot,C. & Audige,L. (1999) Epidemiological study of Newcastle disease in backyard poultry and wild bird populations in Switzerland. Avian Pathology, 28, 263-272.
Schmitz,A.R. & Clark,W.R. (1999) Survival of Ring-necked pheasant hens during spring in relation to landscape features. Journal of Wildlife Management, 63, 147-154.
Schreiber,A., Stubbe,A. & Stubbe,M. (2001) Common Buzzard (Buteo buteo): A raptor with hyperpolymorphic plumage morphs, but low allozyme heterozygosity. Journal fur Ornithologie, 142, 34-48.
Shrubb,M. (1993) The Kestrel. Hamlyn.
Smith, A (2007) Podilymbus podiceps- pied-billed grebe. Animal diversity web. University of Michigan. Available from: http://animaldiversity.ummz.umich.edu/site/accounts/information/Podilymbus_podiceps.html
Smith,S.A., Stewart,N.J. & Gates,J.E. (1999) Home ranges, habitat selection and mortality of ring-necked pheasants (Phasianus colchicus) in north-central Maryland. American midland naturalist, 141, 185-197.
Spaans,A.L. (1971) Feeding Ecology of Herring Gull. Ardea, 59, 73-188.
Stahl,P., Ruette,S. & Gros,L. (2002) Predation on free-ranging poultry by mammalian and avian predators: field loss estimates in a French rural area. Mammal Review, 32, 227-234.
Statutory Instruments. No. 3249. The Avian Influenza (H5N1 in Wild birds) (England) Order 2006. Part 2 (Article 6). 2006.
Stedman, S. (2000) Horned grebe (Podiceps auritus). Pp. 1-28 in A. Poole, F. Gill, eds. The Birds of North America, Vol. 505. Philadelphia, PA: The Birds of North America, Inc.
Storer R.W., & Jehl, J.R (Jr) 1985) Moult Patterns and Moult Migration in the Black-Necked Grebe Podiceps nigricollis. Ornis Scandinavica, 16(4), pp 253-260
Summers,R.W. & cross,S.J. (1987) Winter movements and habitat use of Starlings in Norfolk. Ringing and Migration, 18, 11-18.
Summers-Smith,D. (1954) Colonial Behaviour in the House Sparrow. British Birds, 47, 249-265.
The Cape Bird Club (2004) Western Cape Birding Forum. http://www.capebirdclub.org.za/ 9-10-2004.
The Poultry Keeper Forum. 2007a/b. http://forums.thepoultrykeeper.co.uk/viewtopic.php?t=2699
Thompson financial (2007) available from: http://www.forbes.com/markets/feeds/afx/2007/07/03/afx3881561.html
Page 31 of 87 31
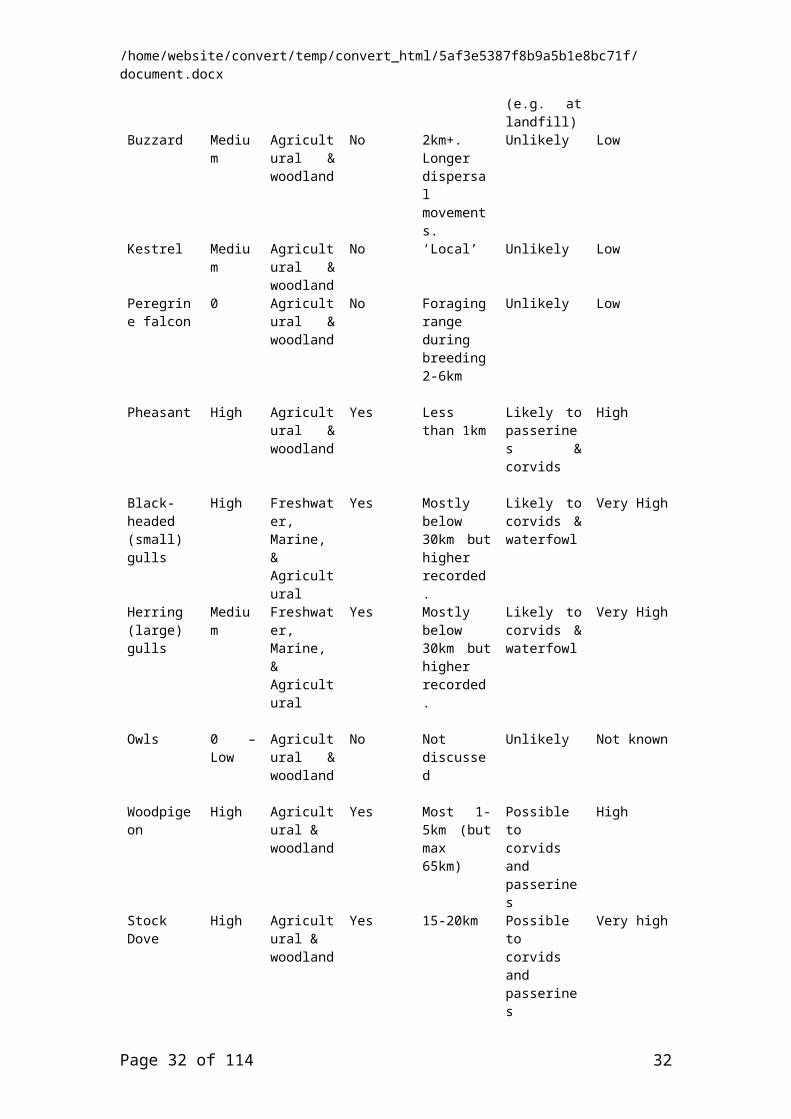
/tt/file_convert/5af3e5387f8b9a5b1e8bc71f/document.docx
Threlfall,W. (1967) Diseases and pathological conditions of the Herring gull Larus argentatus Pontopp.) excluding Helminth Infestations. Bulletin of Wildlife Disease Association, 3, 62-67.
Thomson, L., Forsman,R.T., Jukka, Sardà-Palomera, Francesc, Mönkkönen & Mikko (2006) Fear factor: prey habitat selection and its consequences in a predation risk landscape. Ecography, 29, 507-514.
Village,A. (1990) The Kestrel. T & AD Poyser.
Vines,G. (1981) The Socio-ecology of Magpies, Pica pica. Ibis, 123, 190-202.
Warke,G.M.A., Day,K.R., Greer,J.E. & Davidson,R.D. (1994) Cormorant populations and patterns of abundance at breeding and feeding sites in Northern Ireland, with particular reference to Lough Neagh. Hydrobiologia, 279, 91-100.
Watson,P.S. (1981) Seabird Observations from commercial trawlers in the Irish sea. British Birds, 82-90.
Wetlands. (2006) FAO and OIE Avian Influenza and Wild Birds. http://www.fao.org/newsroom/en/news/2006/1000306/index.html
Wiens,D.J., Reynolds,R.T. & Noon,B.R. (2006) Juvenile movement and natal dispersal of Northern Goshawks in Arizona. The Condor, 108, 253-269.
Wong,M. (1983) Effect of Unlimited Food Availability on the Breeding Biology of Wild Eurasian Tree Sparrows in West Malaysia. Wilson Bulletin, 95, 287-294.
Wyss, Dr Hans (2007) available from: http://www.oie.int/eng/info/hebdo/aIS_21.htm#Sec14
Zajanc,A. (1962) Methods of Controlling Starlings and Blackbirds. Proceedings of the 1st Vertebrate Pest Control Conference. 6-2-1962.
Page 32 of 87 32

/tt/file_convert/5af3e5387f8b9a5b1e8bc71f/document.docx
Appendix 3: Early-response toolkit (Swansea)Here we describe the elements of the project that can be used to provide real-time inference on a disease outbreak, and a list of the constituent parts of the toolkit that perform these tasks. We briefly illustrate the inference process with a set of examples. This component of SE4206 was led at Swansea, in collaboration with the partners at VLA, Glasgow and Sussex.
The ToolkitThe full early-response toolkit links the following elements.
1. Import Data for Networka. Import premises data.b. Import data on known links (up to 12 ‘layers’)c. Import custom ‘rules’ or modifications to the model e.g. transmission
multipliers due to premises size etc.d. Import restrictions on network spread e.g. ruling out certain paths of infection
based on field observations.e. Import data from observed outbreak.f. Import model settings e.g. which algorithm to use for measuring goodness of
model fit to observation, nature of local spatial kernel etc.2. Construct Inference Network
a. Build network from premises datab. Add known links between premises using layer data.c. Modify links using custom rules (see 1c).d. Modify links using restriction data (see 1d).e. Add additional spatial links representing unspecified local spread.
3. Path Findinga. Identify all possible orders of infection for premises known to have been
infected.b. Exclude all infection order sets that are made impossible by the restrictions
data (see 1d).4. Estimate Order Likelihood (of each order set)
a. Apply chosen algorithm to network to estimate likelihood.b. Measure convergence of model to maximum likelihood to identify burn-in.c. Report optimal parameter estimates that maximise likelihood.d. Apply MCMC methods to the converged model.e. Report marginal distributions for parameters of the converged model (in form
of percentiles).5. Combine results
a. Filter orders sets as requested in model specifications i.e. by likelihood, or ranking.
b. Combine parameter estimate percentiles (of requested order sets) with appropriate weighting to produce overall marginal estimates for parameters.
6. Reportinga. Collate optimal parameter estimates for each order set into report that can
then be used as an input file for re-analysis of converged models (should this be necessary)
b. Return all requested output in report file, coupled with all input files for full interpretation of results.
The outbreak response process is illustrated in figure 10. If this system is to provide real-time input to outbreak control, there are several key steps in the process that are severely constrained by processing time. The toolkit is therefore housed on a 2.3 teraflop high performance computing cluster, based around large shared-memory 16 cpu compute nodes, and steps requiring simulations or multiple runs are implemented in parallel (these include path identification, multiple runs of the model, multiple network scenarios and MCMC parameter estimation).
Page 33 of 87 33

/tt/file_convert/5af3e5387f8b9a5b1e8bc71f/document.docx
Compiled Code
Construct Network
Identify Paths
User Edited Input Network
Data
Optimise Models
Apply MCMC
Collate Marginals
FINAL REPORT
Order Set Solutions
Order Set Marginals
Overall Marginals
Order Sets
PARALLEL
Figure 10. Components of early-response toolkit
Page 34 of 87 34

/tt/file_convert/5af3e5387f8b9a5b1e8bc71f/document.docx
Illustrated example
Here we describe a ‘war-game’ scenario. In order to test the performance of the toolkit, we were provided with a simulated outbreak scenario by project partners at Glasgow, and combined this with network information provided by VLA. Since the underlying parameters and full course of the outbreak were known (not by the early-response team) the model predictions could be assessed under a range of scenarios, in particular those in which information was limited or incomplete.
Observed OutbreakWe begin with an outbreak in which a number of premises report infection (figure 11). At this stage we will request current data on links between premises and agree certain parameters for the behaviour of the disease (if they are known, for example the involvement of a catching company).
Figure 11. Simulated outbreak scenario for use in validating toolkit. Infected premises are located at the red circles. In this scenario, no information is provided on index case, and limited information is provided on the order in which premises were detected. Limited information is also provided on the network structure.
Possible outbreak pathsWe examine all possible paths. The number is extremely large but can be reduced as necessary by imposing restrictions on certain links that are based on epidemiological reports from the field. Restrictions can take the form of A infected B, or A did not infect B. This will however usually still leave a very large number of paths to be explored.
Page 35 of 87 35

/tt/file_convert/5af3e5387f8b9a5b1e8bc71f/document.docx
Figure 12. Most likely path of epidemic estimated from limited initial outbreak data. Index case located at the red star.
Model OptimisationEach path will then be explored to measure how likely it is to have been the actual course of the outbreak (most likely path illustrated in figure 12.). This is a lengthy process requiring the model (comprising many parameters) to be optimised for each path. This can only realistically be done on HPC with parallel processors. In figure 13 is an example of output for a simple model (1 layer only) with only a handful of simulated observations.
This output is taken from the marginal distributions of the output of an MCMC sequence for a single path. The final output can be filtered in many ways, for instance only studying:
A weighted average of paths The best x% of paths A combination of the above
Figure 13. Posterior probability distributions for parameter values estimated from data shown in figure 11, 12. Samples from these distributions can be used as input values in simulation models.
Simulating the Spread: Intervention Modelling & Risk Mapping
These model optimisation results can be disseminated to other groups working on the same project for them to use in their work, using their modelling tools. Simulations of continued disease spread can also be performed using the toolkit. This stage can be tailored to suit the current requirements and relies on simulating the continuing outbreak using the output of the inference procedure. We take the parameter estimates of the inference procedure and incorporate them in the simulator model. We run the model a very large number of times (1000 networks, each with 1000 simulated outbreaks).
Page 36 of 87 36

/tt/file_convert/5af3e5387f8b9a5b1e8bc71f/document.docx
Figure 14. A simulation of on-going spread (blue circles, dotted lines) from the initial outbreak (red circles) using the parameters estimated with the toolkit.
The results are collated to form a forecast of the likely path (and behaviour) of the disease. It is possible to introduce simple procedures to represent the different intervention options to be considered. A comparison can then be made of their impact on the spread of the disease. In figure 14, a single realisation of the simulation model is given to illustrate the premises infected in the next week of the outbreak, using the parameters estimated from the initial data. The results of 1000 simulations are summarised as a risk map (figure 15), which gives the probability of infection in the area surrounding the outbreak.
Figure 15. Risk map generated from 1000 simulations of on-going spread from the initial outbreak (black stars) using the parameters estimated with the toolkit. Note that the map indicates a combination of local spread, representing a ‘diffusion’ type epidemic process, but also a high risk of large jumps of infection (for example in the North) that reflects the underlying network structure (such as the involvement of shared industry characteristics).
Model checking and strategic modellingIn figure 16 we combine the risk map with the ‘true’ course of the outbreak revealed by colleagues after the inference process. We note a very good correspondence between predicted probability of infection and observed outbreak. However this should be interpreted in light of the huge potential number of scenarios that could occur. One of the most useful
Page 37 of 87 37
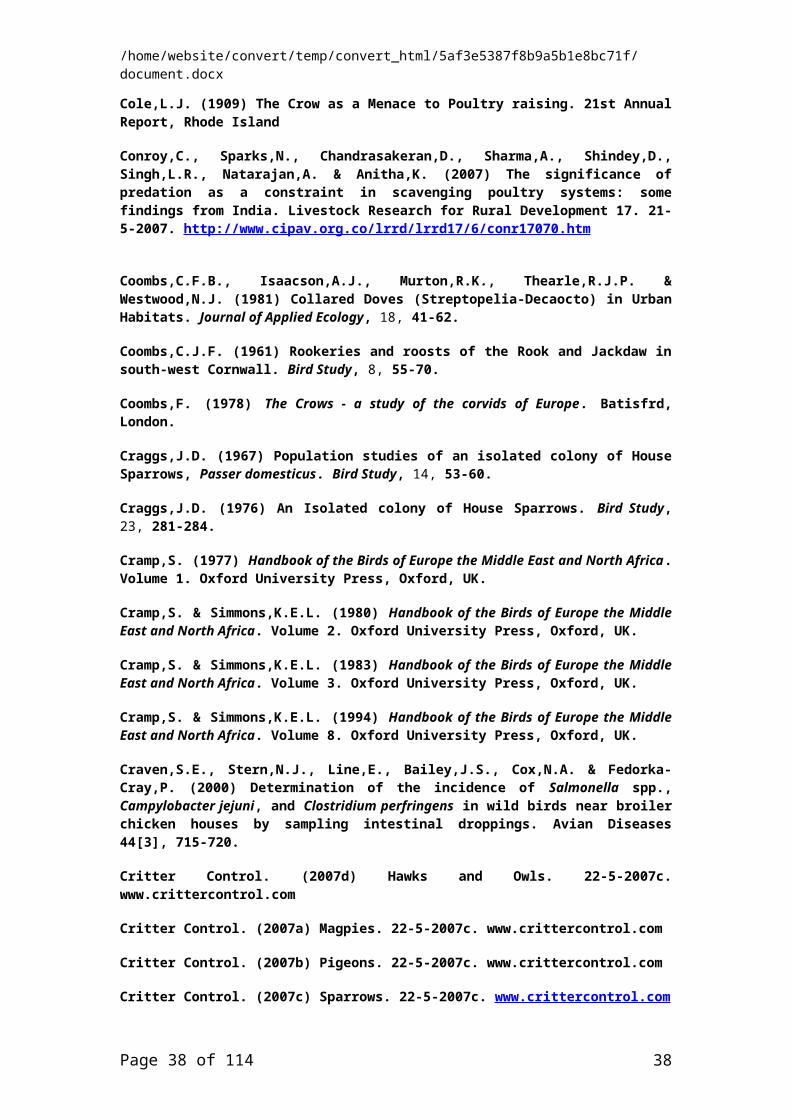
/tt/file_convert/5af3e5387f8b9a5b1e8bc71f/document.docx
outputs from this aspect of the project therefore is a system to explore, via simulation, a very wide range of outbreak conditions and determine under what circumstances reliable or useful parameter estimates can be obtained. The system can also be used in a further strategic sense, to explore a large range of scenarios in advance to determine broad categories of response that are most appropriate under given types of outbreak.
Figure 16. Risk map (as figure 15) overlayed with ‘real’ course of the initial epidemic in original simulation provided by Glasgow team. Outbreak data used for parameter estimation is given by the red stars. Next generation of cases is revealed by the black stars. Note that each newly infected premise was identified as high risk (red circle) by the risk map, and similarly those ‘low risk’ premises very close to cases remained uninfected (reflecting the underlying network structure).
Finalising the toolkit
All parts of the toolkit required for inference are now functional and mostly complete. The linking between the inference tool and the simulator (individually functional) are not yet complete but they are not necessary for the first stage of response, namely parameter estimation. Parameters can then be provided to other simulation tools such as those developed by VLA. Figure 16 illustrates the progression towards completion.
The modification necessary on the linkage stems from the fact that the toolkit has progressed since the simulator was initially developed and so the output from one does not match the input required by the other. The only other aspect of the toolkit that is still requires development work is the optimisation of the parallelised code. This will be optimised as part of on-going testing processes.
Page 38 of 87 38
/tt/file_convert/5af3e5387f8b9a5b1e8bc71f/document.docx
Model OutputOutbreak Data
Network Algorithms
KeyKeyBlue = DataBlue = DataGreen = Network ConstructionGreen = Network ConstructionBrown = AlgorithmBrown = Algorithm
EmptyNetworkModel
GeneralIndustryModel
SpecificOutbreak
Model
Prior to Outbreak
Expert OpinionRate ModifiersDistance Metrics
FieldInfected PremisesPath Constraints
ModelSet of PossiblePaths
GBPRPremises DataNetwork Links
Simulator ParameterEstimator
Figure 16. The ‘simulator’ component of the toolkit requires linking with the inference components. The simulator takes samples from the distributions of parameter estimates, and runs outbreak / control scenarios on a range of networks. Since the simulation and control scenarios are extremely varied, the updating and linking of this component is an on-going project.
Page 39 of 87 39
/tt/file_convert/5af3e5387f8b9a5b1e8bc71f/document.docx
Appendix 4: GB poultry network analysis (Istvan Zoltan Kiss – Sussex)
Department of Mathematics, University of Sussex, Falmer, Brighton BN1 9RF, UK.
1. Description of the network data
The network data characterizes three different routes of disease transmission:
Contacts between premises due to using or being serviced by the same catching company. Temporal aspects have been accounted for by using the exact timing when catching company teams visit various poultry premises. For example, according to current data compilation for network analysis purposes, if within a day, farm A, B, C, and D are visited by the same catching team, in this particular order, then this results in the following potentially infectious links A->B, B->C, C->D.
Contacts between premises that are using the same slaughterhouse on the same day. Contacts between premises due to the same vehicle (fork-lift truck) visiting sites on the same
day.
2. Static network analysis
In the previous section we explained how the daily timing is already incorporated into the links. Here, in this section, for static network analysis we assume that links are static in the sense that all links that happened within the time period of interest are considered all at once during network construction and analysis. The size of the GSCC (giant strongly connected component) in this network will give an upper estimate for the potential size of the epidemic. The GSCC is a largest subset of nodes/premises such that for any two distinct nodes from the subset a path exists such that these nodes can be connected. There were altogether N=415 distinct nodes in the network. These nodes represent all premises that were involved or linked through CC, SH or vehicle movement within the given timeframe of data collection. Independently of the analysis, the node structure stays the same and always includes all 415 nodes. Nodes do not include catching companies or slaughterhouses. 2.1. Individual network characteristics
2.1.1. Potential disease transmission network as a result of premises using the same catching company
There were altogether 18 148 links in the database. However a high proportion of links were self-loops (A->A) and links between the same premises on different days are only counted once, that is when all links during the whole time period are considered at once. Average number of connections per node
⟨k ⟩=3 .98 . When the growth of the GSCC is considered and a per link probability of transmission is assumed, multiple links between the same premises on different days become important and they increase the probability of diseases transmission between two premises. These remarks apply for the other two routes of transmission as well.
Page 40 of 87 40

/tt/file_convert/5af3e5387f8b9a5b1e8bc71f/document.docx
Fig 1: Degree distribution of premises that are potentially connected due to catching companies.
Fig 2: The growth of the GSCC as the probability of transmission per link is increased.
Page 41 of 87 41

/tt/file_convert/5af3e5387f8b9a5b1e8bc71f/document.docx
Fig 3a: Geographical distribution of premises in the GSCC when all links transmit with 100% transmission per link. There are no further components of sizes bigger than two to three but mostly just isolated nodes (i.e. nodes that have only in and out links or no links at all).
0
200000
400000
600000
800000
1000000
1200000
1400000
0 100000 200000 300000 400000 500000 600000 700000
Series1Series2Series3
Fig 3b: Geographical distribution of premises in the GSCC when all links transmit at 10% (two different realizations). Even with 10% transmission per link there are very few further components of sizes bigger than two to three premises.
The more spatially clustered components suggests that a group of premises are linked by many multiple links occurring on different days and premises that are spatially further are visited less often. The lack of components of various sizes suggests a network structure that has a group of core nodes and to some
extent this is supported by a mixing value of r≈0 .2 (discussed later, assortatively mixed networks have a core group of nodes). Keep in mind, that data is reduced size.
2.1.2. Potential disease transmission network as a result of premises using the same slaughterhouse
Page 42 of 87 42

/tt/file_convert/5af3e5387f8b9a5b1e8bc71f/document.docx
There were altogether 18 357 links in the database and an average number of connections per link
⟨k ⟩=15 . 33 .
Fig 4: Degree distribution of premises that are potentially connected due to using the same slaughterhouses.
Fig 5: The growth of the GSCC as the probability of transmission per link is increased.
Page 43 of 87 43

/tt/file_convert/5af3e5387f8b9a5b1e8bc71f/document.docx
Fig 6a: Geographical distribution of premises in the GSCC when all links transmit with 100% transmission per link. There are no further components of sizes bigger than two to three but mostly just isolated nodes (i.e. nodes that have only in and out links or no links at all).
0
200000
400000
600000
800000
1000000
1200000
1400000
0 100000 200000 300000 400000 500000 600000 700000
Series1Series2
Fig 6b: Geographical distribution of premises in the GSCC when all links transmit at 2% (one realizations). Even with 2% transmission per link there are very few further components of sizes bigger than two to three premises.
2.1.3. Potential disease transmission network as a result of vehicles (fork lift trucks)
There were altogether 19 004 links in the database and an average number of connections per link
⟨k ⟩=0 .84 .
Page 44 of 87 44
/tt/file_convert/5af3e5387f8b9a5b1e8bc71f/document.docx
Fig 7: Degree distribution of premises that are potentially connected due to using the same slaughterhouses.
Fig 8: The growth of the GSCC as the probability of transmission per link is increased.
Page 45 of 87 45

/tt/file_convert/5af3e5387f8b9a5b1e8bc71f/document.docx
Fig 9: Geographical distribution of premises in the GSCC when all links transmit with 100% transmission per link. There are no further components of sizes bigger than two to three but mostly just isolated nodes (i.e. nodes that have only in and out links or no links at all).
The degree distribution of the CC network and the network due to Vehicles show similar trends and
seems to be characterized by a p(k )=aexp(−bk ) type distribution (note the log scale on the x axis). The degree distribution of the SH network shows a different pattern and to some extent suggests a combination of exponential decay and Poisson type distributions.
The three networks have very different characteristics with the SH network being highly connected (i.e. high number of connections per node) with a small probability of transmission per connection resulting in a GSCC of considerable size.
The growth of the GSCC in the SH network is very fast and even a small probability of transmission per link can lead to a large potential epidemic. The growth of the GSCC in the CC network is less rapid with the potential for large GSCC only if the probability of transmission per link is high enough. The network as a result of vehicles shows a slow increase in the GSCC size. However, one has to keep in mind that the three different networks have very different number of connections. Given that there is no precise estimate for the probability of transmission through the different routes one can ask the question of what happens if a similar number of infections happen trough the different routes. A plot as a function of <k> is given below for all three scenarios considering the three various routes.
Page 46 of 87 46

/tt/file_convert/5af3e5387f8b9a5b1e8bc71f/document.docx
Fig 10: The growth of the GSCC as the average number of connections per node increases (red-SH, yellow-CC, blue-vehicle). Here <k> denotes the average number of links per node that have successfully transmitted the disease.
This plot shows that although the number of links within the different networks is the same, the way how nodes are connected up to form components is different. For example, for SH network, a small number of infectious links connect together a group of nodes that is larger than the components in the CC or VH network generated by the same number of infectious connections. A similar trend is observed when comparing assortatively and disassortatively mixed networks. In assortativley mixed networks, links are more likely to connect nodes of similar degree. For example, highly connected nodes tend to connect to other highly connected nodes. The opposite is true for disassortatively mixed networks where highly connected nodes typically connect to poorly connected nodes. For the same small number of links assortatively mixed networks support connected components that are of larger size than on diassortatively mixed networks although the number of links is the same. Figure 10 shows also shows that if the number of links due to vehicle movements increases, than a faster growth in the GSCC size in possible when compared to the network generated by CC or SH. Newman (2003) proposed a measure for determining the degree of assortativity
r1=∑ijik i−M
−1∑iji∑
lk l
√[∑i ji2−M−1(∑i ji)2 ][∑i k i2−M−1 (∑i k i)
2]. (1)
Here ji and
k i are the “excess” in degree and out degree of the nodes that the i th edge leads out of
and into respectively, and M is the number of edges. The excess degree is the real degree of the
node minus one, to account for the link that is considered. The values of r1 range from [−1,0 )for
disassortative networks, and from (0,1 ] for assortative networks. For random networks with no degree
correlation r1≈0
.
Values of rCC=0. 21r SH=0 .07 rVH=0 .18
are obtained when the full networks are considered. The CC networks tend to be the most assortatively mixed. Assortatively networks are known to be more resilient to link removal and this effectively means that control is harder since more links have to be removed to obtain a significant effect. However, the preferential mixing has to be considered in conjunction with other network properties such as in and out degree distribution, the observed effects are a result of the combination of all the various properties.
1) Newman M. E. J. 2003 Mixing patterns in networks, Phys. Rev. E 67, 026126.
3. How do networks change over time?
Page 47 of 87 47

/tt/file_convert/5af3e5387f8b9a5b1e8bc71f/document.docx
Fig 11: The size of the GSCC when static networks are considered in consecutive time periods of the same length (red - 4 weeks, yellow - 2 weeks, green – 1 week). These networks were built with 100% transmission per link using all three routes of transmission.
Fig 12: The size of the GSCC when static networks are built by cumulative addition of days. These networks were built with 100% transmission per link using all three routes of transmission.
These graphs show that there is no clear temporal trend in the movement and different time periods within the year do not seem to be more or less prone to disease transmission. This is partly because most premises are broiler premises and their activity is not seasonal.
4. Combining the three routes
In this part we address the interaction of the three different routes by plotting the size of the GSCC as a result of various fixed levels of contribution from each of the three routes in turn while combining the remaining two using the range 0 to 0.5 for the probability of transmission per link. This is useful in estimating the contribution of the different routes to the overall transmission.
Page 48 of 87 48
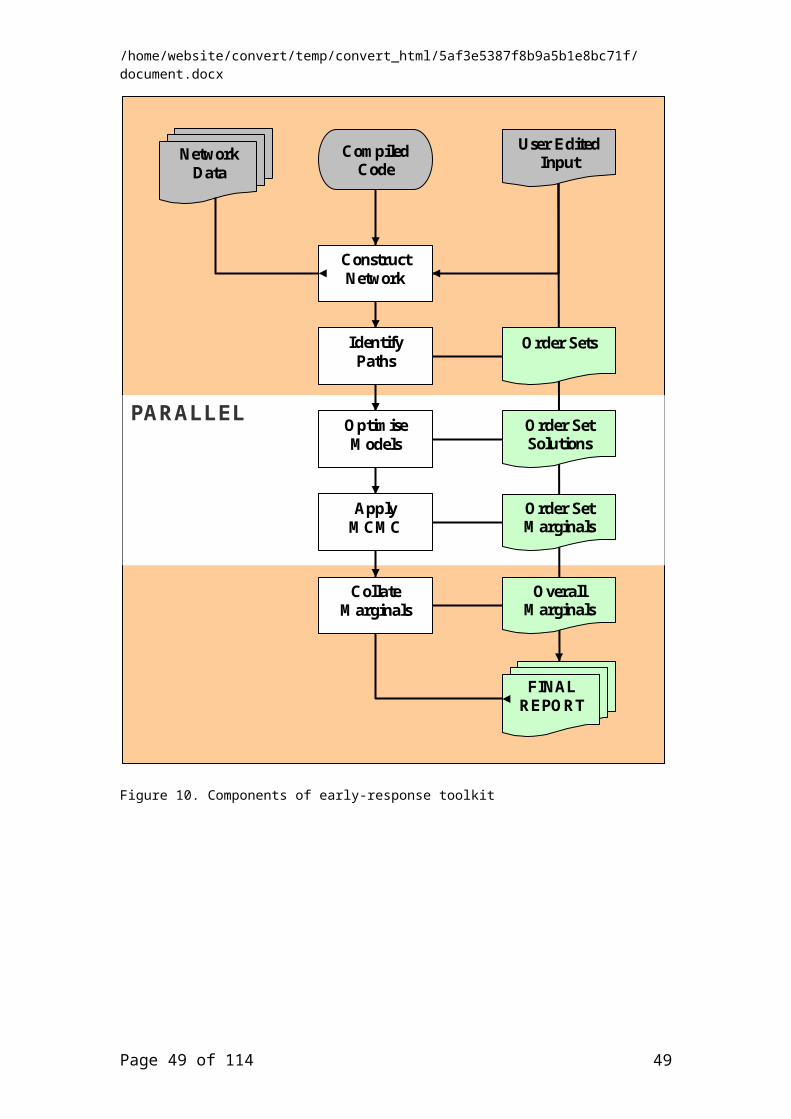
/tt/file_convert/5af3e5387f8b9a5b1e8bc71f/document.docx
Fig 13: The catching company contributes at levels of 0, 20, 40, 60, 80 and 100%. The remaining two routes are combined across the range of probabilities form 0 to 0.5. The graphs should be considered from left to right and from top to bottom.
Fig 14: The slaughter house contributes at levels of 0, 20, 40, 60, 80 and 100%. The remaining two routes are combined across the range of probabilities form 0 to 0.5. The graphs should be considered from left to right and from top to bottom.
Page 49 of 87 49
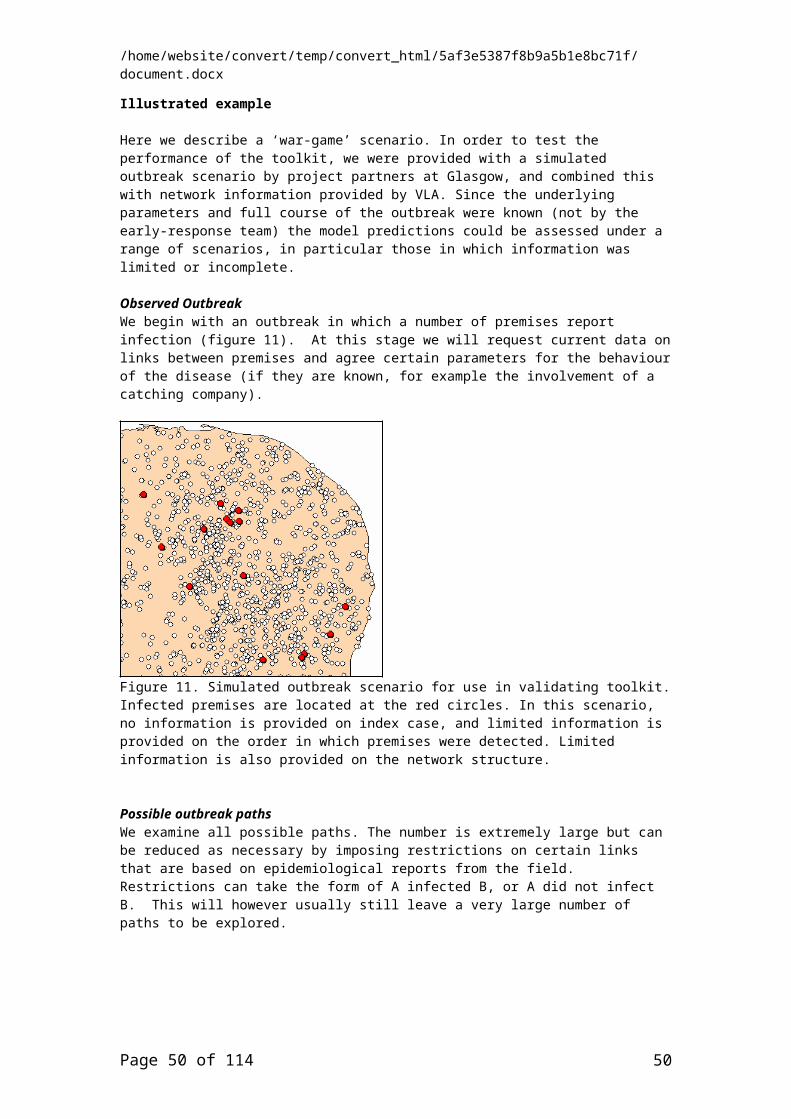
/tt/file_convert/5af3e5387f8b9a5b1e8bc71f/document.docx
Fig 15: The catching company contributes at levels of 0, 20, 40, 60, 80 and 100%. The remaining two routes are combined across the range of probabilities form 0 to 0.5. The graphs should be considered from left to right and from top to bottom.
Based on the previous sections, the contribution of vehicles is marginal but keep in mind that to some extant this might be data collection dependent (i.e. a very limited amount of data about vehicles was made available).
The catching companies have a noticeable contribution when transmission through the other routes is small. However, when transmission through the other routes is high the further addition of the CC links doesn’t alter the GSCC significantly. This means that most premises are connected by all routes and not by a typical single route.
The contribution of SH is evident as there is a dramatic change between the no-SH and SH-present scenarios. Higher contribution from SH leads to higher and higher GSCC meaning that some premises are exclusively linked by SH.
Page 50 of 87 50

/tt/file_convert/5af3e5387f8b9a5b1e8bc71f/document.docx
5. Varying infectious period versus probability of transmission
In the AIV modeling exercise, the numerical values of the infectious period and probability of transmission per link are crucial and not very well known or documented. Often these are estimated based on outbreak data and various models of disease spread. By using MCMC type fitting techniques model outputs are fitted to outbreak data and this leads to various parameter estimates. Here by using the network model we provide estimates for the worst case scenario for a wide range of infectious periods and probability of transmission. Here, days of movements correspond to infectious period length since movements are only relevant when premises are infectious. The only assumption here is that the overall characteristic of premises during different periods of time of same length is similar. This assumption to some extent is supported by figure 11 when there is no clear seasonal trend in the GSCC size when consecutive time periods of same lengths are considered. Here all three routes of transmission are considered at once and with the same probability of transmission per contact.
Page 51 of 87 51

/tt/file_convert/5af3e5387f8b9a5b1e8bc71f/document.docx
Page 52 of 87 52
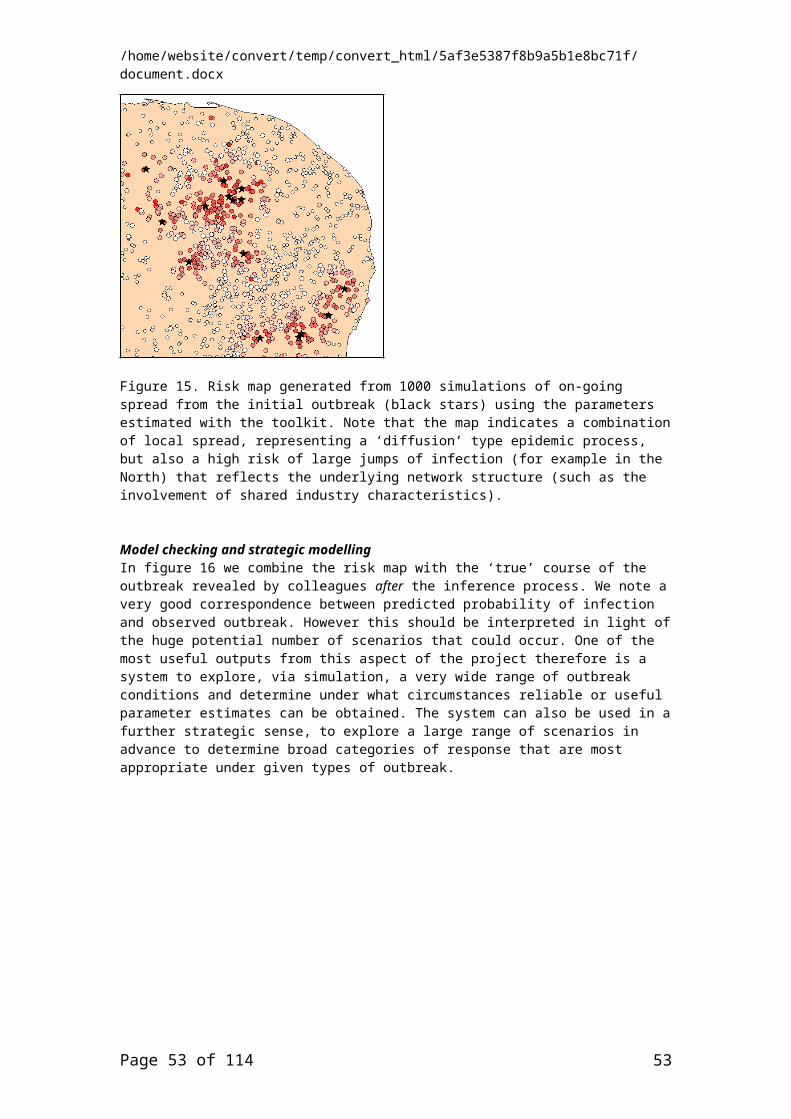
/tt/file_convert/5af3e5387f8b9a5b1e8bc71f/document.docx
Fig 16: GSCC size with movements 28 days worth of movement starting from day 1, 250, 450 and 750 (Note the different max GSCC on the four plots.)
The pattern of growth is similar for both plots. Very few days of movement or short infectious periods will result in a network that is poorly connected even if the probability of transmission per contact is high. In the top plot even with an infectious period of 10 days and high probability of transmission the size of the GSCC is small.
On both graphs an infectious period of roughly 10 days seems to needed before a considerable growth is seen. The infectious period as is used here represents the initial stages of the disease spread when the epidemic to some extent spreads freely without any control measures put in place. Given the current situation and lessons learnt from the 2001 FMD outbreak make it very unlikely that one can get an epidemic spreading unnoticed for such a long period of time (10 days). Therefore, the estimate for the number of premises infected should be even smaller.
Page 53 of 87 53

/tt/file_convert/5af3e5387f8b9a5b1e8bc71f/document.docx
Fig 17: Same as figure 16 but with surfaces plotted as GSCC size versus R0. This is possible since every combination of infectious period and probability of transmission results in a value of R0 in the epidemiological network (i.e. the network that contains only those links that have transmitted the infection).
The above graph illustrates that although we built networks using different time periods the growth of the GSCC is consistent al least in three out of the four cases that we considered. This suggests that during the 4th time period the network has changed in some fashion. It would be interesting to see the exact date when this happens since this might correspond to some special industry related event.
Page 54 of 87 54

/tt/file_convert/5af3e5387f8b9a5b1e8bc71f/document.docx
0
200000
400000
600000
800000
1000000
1200000
1400000
0 100000 200000 300000 400000 500000 600000 700000
7151910
Plots of the top 4 connected components when simulation is started on day one and considered up to day 10 with probability of transmission 100% and all three routes. There are 2 components that more localized and two that are widely spread.
0
200000
400000
600000
800000
1000000
1200000
1400000
0 100000 200000 300000 400000 500000 600000 700000
24
Plots of the one single biggest connected component when simulation is started on day 450 and up to day 460 with probability of transmission 100% and all three routes. The component is widely spread.
These plots illustrate the geographical spread of disease to premises if 10 days of free movement and 100% transmission is assumed. The typical number of premises infected in such a situations is around 20.
Page 55 of 87 55

/tt/file_convert/5af3e5387f8b9a5b1e8bc71f/document.docx
Appendix 5: Contact structures in the poultry industry in Great Britain: Exploring transmission routes for a potential avian influenza virus epidemic.
ABSTRACT
Background: The commercial poultry industry in United Kingdom (UK) is worth an estimated £3.4 billion at retail value, producing over 174 million birds for consumption per year. An epidemic of any poultry disease with high mortality or which is zoonotic, such as avian influenza virus (AIV), would result in the culling of significant numbers of birds, as seen in the Netherlands in 2003 and Italy in 2000. Such an epidemic would cost the UK government millions of pounds in compensation costs, with further economic losses through reduction of international and UK consumption of British poultry. In order to better inform policy advisers and makers on the potential for a large epidemic in GB, we investigate the role that interactions amongst premises within the British commercial poultry industry could play in promoting an AIV epidemic, given an introduction of the virus in a specific part of poultry industry in Great Britain (GB).
Results: Poultry premises using multiple slaughterhouses lead to a large number of premises being potentially connected, with the resultant potential for large and sometimes widespread epidemics. Catching companies can also potentially link a large proportion of the poultry population. Critical to this is the maximum distance traveled by catching companies between premises and whether or not between-species transmission could occur within individual premises. Premises closely linked by proximity may result in connections being formed between different species and or sectors within the industry.
Conclusion: Even quite well-contained epidemics have the potential for geographically widespread dissemination, potentially resulting in severe logistical problems for epidemic control, and with economic impact on a large part of the country. Premises sending birds to multiple slaughterhouses or housing multiple species may act as a bridge between otherwise separate sectors of the industry, resulting in the potential for large epidemics. Investment into further data collection and analyses on the importance of industry structure as a determinant for spread of AIV would enable us to use the results from this study to contribute to policy on disease control.
Keywords: Avian influenza, contact structures, poultry industry.
BACKGROUND
The GB commercial poultry industry is an important industry to the British government, the consumer and farmers alike, worth an estimated £3.4 billion at retail value, producing over 174 million birds for consumption per year [1], poultry diseases are of widespread interest, both from the point-of-view of understanding different poultry farming methods [2,3,4], and in terms of studying the potential impact of different diseases on poultry [5,6,7]. However, our knowledge of how poultry farms in GB are connected to each other by the movement of people and equipment is more limited, and this is essential for effective prevention and control for potential outbreaks of diseases transmitted by the movement of people and equipment between farms within the commercial poultry industry. Diseases spread in such a way include avian influenza viruses (AIV), Newcastle disease virus (NDV), salmonella and campylobacter spp. Motivated by recent outbreaks of AIV in the UK and across the world [8], we consider here how AIV may transmit between poultry farms in GB by the movement of people and equipment.
Avian influenza viruses (AIV) were first described in the late nineteenth century by Perroncito [9]. They are highly contagious viral infections that can affect avian species as well as other species such as pigs [7], cats [10] and humans [11]. High pathogenic strains of the virus (HPAI) have potentially high transmissibility and high mortality rates in poultry [12,13,14]. Although low pathogenic strains of the virus (LPAI) have a lower mortality rate, this renders them harder to detect, increasing the chances of silent spread. Furthermore, the H5 and H7 subtypes of LPAI have the ability to mutate into high-pathogenic strains as seen in 1999 in Italy, when H7N1 mutated from LPAI to HPAI [15]. In recent years, the H5N1 strain of the
Page 56 of 87 56
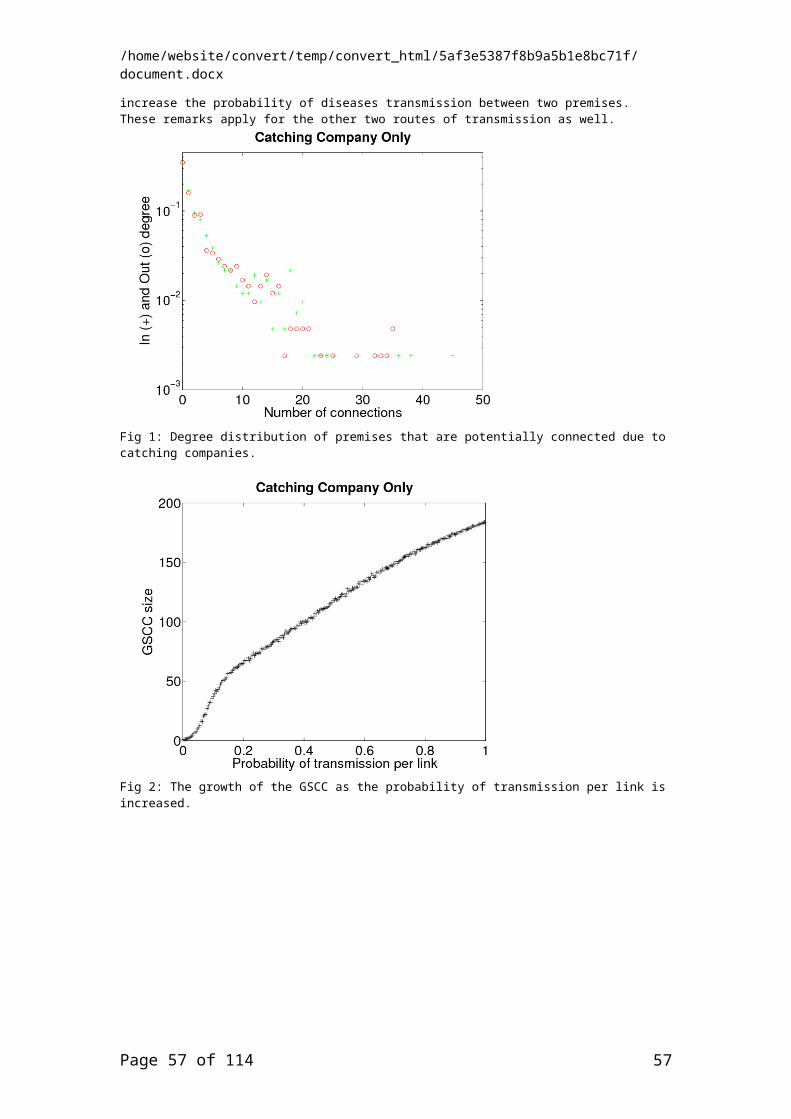
/tt/file_convert/5af3e5387f8b9a5b1e8bc71f/document.docx
virus has gradually spread westward in countries located between Hong Kong (2003) and GB (2007) and it is likely that AIV is endemic in poultry in many parts of the world [16].
In previous studies, AIV outbreak data from other countries has been analysed and models have been developed to describe the spread of the virus [13,16,17]. Recent publications have concentrated on the development of simulation models [8,17] but have not described in detail the contact structures within the industry over which transmission could occur. As it is unclear to what extent transmission parameters from other countries can be applied to models that include detailed industry structure, we attack the problem by using an analytical approach that considers the importance of the contact structures that occur within the poultry industry, with respect to the potential for disease transmission – in the absence of robust estimates of transmission parameters, this approach can be used to identify combinations of parameters that could result in a large epidemic, and critically, under those scenarios identifying key demographic features which lead into determining when infectious diseases may spread, as has previously been done in analyses of the sheep and cattle industries [18,19,20]. By identifying such key demographic features within the poultry industry, we can begin to scientifically attack this difficult problem.
In this study, the structure of the poultry industry in GB is investigated using the poultry network database collected and maintained by the Department for Environment, Food and Rural Affairs (Defra). While there have been no recent large outbreaks of AIV in the UK, HPAI, LPAI, NDV, Camplyobacter spp. and salmonella are all transmitted via the oral-faecal route, and so we infer likely routes of transmission for AIV by the transmission of these diseases in prior GB outbreaks. The presence of slaughterhouse personnel or equipment on a premises during depopulation has been implicated as a risk factor for infection of Campylobacter to remaining birds [21]. Slaughterhouses have also been implicated as a key checkpoint for the detection of pathogens such as Campylobacter [22] and salmonella [23,24], and in case of poor biosecurity measures implementation, this could also result in the spread of pathogens between premises where dirty equipment is reused. Catching companies (teams of people that catch birds for slaughter) have also been implicated in Campylobacter transmission [25], and within company spread includes fomite transmission as well as transmission via personnel, which is considered a major route of transmission of avian infection [2,26]. In addition, “local spread” may be important. Local spread has been identified in transmission of AIV between poultry flocks in the Netherlands [13,27] and environmental factors were highlighted by the literature review as being a potentially important factor for transmission of avian influenza virus between farms [2,6,12]. Such factors include the presence and circulation of wild birds. In this study we considered the effects of the presence and circulation of wild birds on the transmission of avian influenza in the poultry network in GB only in the context of “local transmission”, i.e. multiple premises infected from the same wildlife source. By considering associations amongst sub-populations defined by their interactions, e.g. associations with the same catching companies, slaughterhouses, common ownership or by “local spread”, we determine the extent to which industry structures might influence the demographic and geographic extent of a potential AIV epidemic in the GB poultry industry. Improvement of our understanding of how poultry premises are potentially connected will also identify where further data collection is necessary.
RESULTS
Network construction and properties
The analysis of the poultry industry was restricted to the principle commercial species, i.e. to premises housing turkeys, chickens, ducks and geese. Premises housing fewer than 50 birds are not included in the analysis as such premises are not required to register their birds. Premises with missing location data are also excluded from the analyses. Contact mechanisms between premises were categorised into people, fomites, vehicles and environmental factors, as shown in Table 1 [2,15,21,25,28]. These were then organised into their relevance to sub-populations within the poultry industry that may connect poultry premises that they are associated with. These sub-populations were identified as:
Page 57 of 87 57

/tt/file_convert/5af3e5387f8b9a5b1e8bc71f/document.docx
Slaughterhouses, whose vehicles are used to collect birds from farms before slaughter
Catching companies responsible for catching birds before they go to slaughter Egg collectors who visit multiple farms in one shift Feed companies responsible for delivering feed to premises Multi-site companies, whose personnel and vehicles may visit multiple sites belonging
to the same company Farms that are geographically close
Feed lorries and egg collectors have not been included here as data on these potential transmission routes was not available for analysis at the time of study. Contact data for the remaining transmission mechanisms was used to construct representations of contact structures occurring within the commercial poultry industry in GB. The collection of contact data was targeted at commercial poultry premises housing a minimum of 1000 birds, as smaller premises are more likely to catch and slaughter their own birds. From a target population of approximately 9075 premises (the number of premises housing >999 birds according to the GB poultry register), a sample of 4441 poultry premises was included and potentially infectious links between premises could occur as a result of premises using the same slaughterhouse, catching company, or belonging to the same multi-site company. Local spread was also included to represent environmental transmission. The sample used was taken from the poultry network database, which has been designed to show the links and movements between premises that either send birds to slaughter, use catching companies or belong to a multi-site company. The database was not designed to give population data and therefore cannot be used to represent an accurate cross section of the GB poultry industry. The database does however give an accurate representation of the potential links between premises that do fit the above criteria.
Of the premises included in the sample, 2973 premises use identifiable slaughterhouses (Figure 1A), 707 premises use identifiable catching companies (Figure 1B) and 1016 have company affiliations. Premises associated with a third party (slaughterhouse, catching company or multi-site company) are assumed to be potentially connected to any other premises associated with the same third party. Data is stored in the poultry network database. Data in the network database was compared with the Great BritainGB Poultry Register (GBPR) to look for biases. The GBPR contains information about all poultry premises housing 50 or more birds.
Industry Demographics
Based on a list of abattoirs licensed to slaughter poultry maintained by the Food Standards Agency (FSA), it is estimated that over 90% of slaughterhouse through-put (by number of birds) is accounted for in the network database. Further, the distribution of slaughterhouses and customers in the network database are similar to the overall pattern to that of the overall GB population [Jason Gittins, pers. comm.]. However, the number of premises in the network database that are recorded as having sent birds to slaughter represents only 13% of the number of premises in the GBPR, implying that larger premises are better represented in the network database. The number of customers per slaughterhouse ranges from one to over one thousand customers, with a median of ten customers (Figure 2).
Over 50% of the identified premises that use catching companies are comprised of housed broilers (reared for meat) chickens. This corresponds with expectations that over 50% of catchers are involved in the broiler chicken sector [29] though the database is not confirmed to be complete. The database contains information from 25 individual catching companies. It has been reported that 8 specialist catching companies, included in the database, account for 50% of the chicken sector [Jason Gittins, pers. comm.]. As all known large (catching from many premises) catching companies are included in the database, it is assumed that catching companies that are not included in the database are small companies that do not necessarily catch from many premises. For end of lay hens, most of the larger producers use specialist companies including those currently in the database. The number of catching company customers (over 45 catching company sites) ranges from one to 192 customers (Figure 3). Of
Page 58 of 87 58

/tt/file_convert/5af3e5387f8b9a5b1e8bc71f/document.docx
the premises visited by catching companies, fewer than 2% of premises (12 of 707 premises) are recorded as using more than one catching company, with no poultry premises using more than two different catching companies. The overlap between slaughterhouses is much greater, with over 30% of premises (913 of 2973 premises) using more than one slaughterhouse (Figure 4).
A total of 1003 (98.7%) of multi-site premises were matched to the GBPR. For multi-site sources, premises were identified as being part of a multi-site company via questionnaires completed by both individual premises and company representatives. The legislation requires the owners of all premises containing 50 or more birds kept for commercial purposes to register their poultry on the GBPR, we assume that the multi-site data gives a good representation of the population. The number of premises per multi-site company ranges from two to 113, with the median number of premises in a multi-site company being six.
Contact structures
The contact structure can be viewed as a social network of potentially infectious links amongst premises, these links are defined by associations via one or more of the four potential routes of interaction. Transmission networks can then be generated by assuming a probability of transmission p associated with those links, and then selecting or discarding them based on whether a random number, chosen from a uniform distribution from zero to one, is above or below that value p. The transmission networks can then be grouped into “components” wherein all premises within a component can be linked to any other member. In a transmission network, the size of a component is therefore an estimate of the size of an epidemic should any member of that component become infected, in the absence of intervention. A giant component (GC) is the largest component, and therefore the size (calculated as the number of nodes) of the GC represents an estimate for the upper bound for the potential size of an epidemic that starts with a single infected premises and in the absence of further intervention that would alter the network structure. While intervention will occur as soon as AIV is detected and therefore an epidemic of this size is unlikely to ever be reached, nevertheless in other similar scenarios, drastic increases in GC size has previously been shown to be a good indicator of when a population is vulnerable to a serious epidemic [19].
Contact structure analysis - Worst-Case Scenario
In order to gain an understanding of different parts of the industry, we have considered the four contact structures separately. When all contact structures are combined, the GC constantly covers the majority of premises thus making it difficult to determine how the different contact structures affect the potential for large epidemics. Links are established between all premises using the same slaughterhouse, catching company, owner or between premises that are geographically close (within 3km of each other). By assuming that all premises within a given contact structure are potentially connected, we can determine the worst-case scenario, where no interventions are made over time. Based on an analysis of movement data between farms using catching companies and sending birds to slaughter [Dent, unpub.] links between premises are not directional. As the probability of disease transmission occurring was increased, the proportion of premises in the transmission network GC increased until a maximum of approximately 2870 (97%) of premises linked by slaughterhouses, 295 (42%) of premises linked by catching companies, 113 (11%) of premises linked by owner and 111 (2%) of premises linked by being geographically close to one another, was reached for small probabilities of a link occurring (Figure 5). The GC for the slaughterhouse network noticeably covered a wider area and was denser than the GCs for the catching company and owner networks (Figure 6).
Network analysis - Removal of Key Players
A “key player” can be defined as an individual member of the network whose removal has a major impact on reducing the size of a potential epidemic, or equivalently the size of the GC [30]. Here, key players are premises that link otherwise separate components such as poultry
Page 59 of 87 59
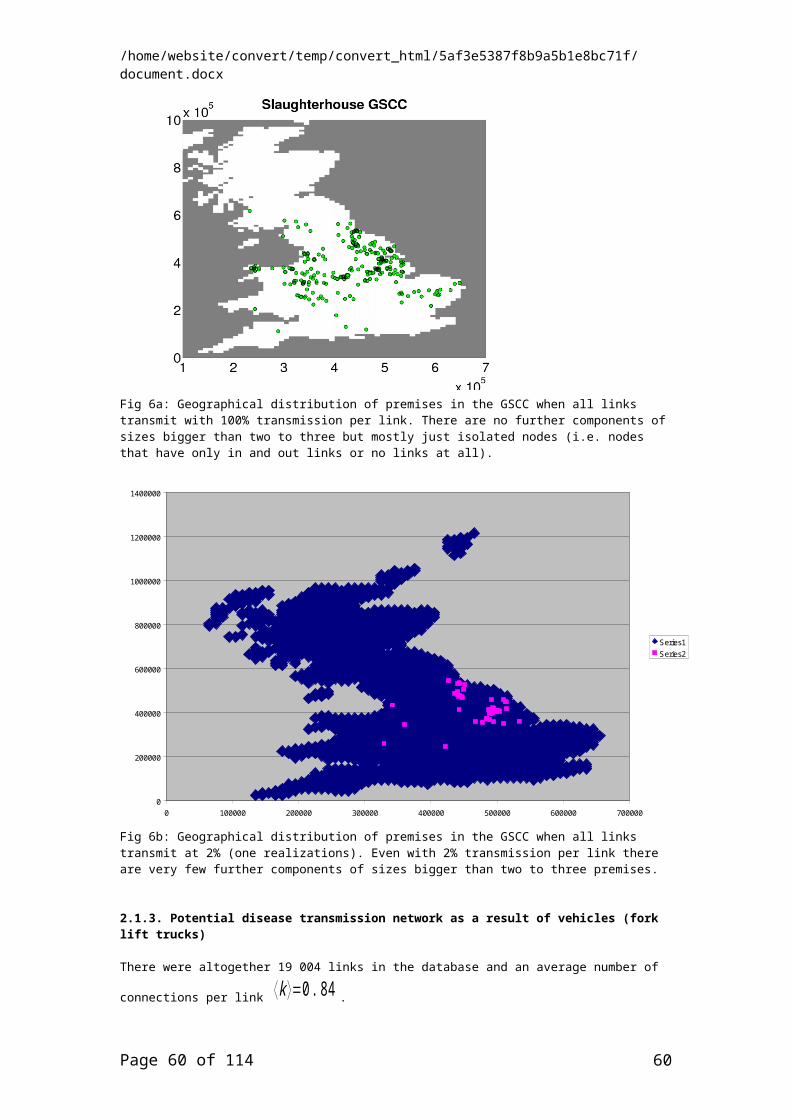
/tt/file_convert/5af3e5387f8b9a5b1e8bc71f/document.docx
premises that are the only links between companies using separate slaughterhouses or the slaughterhouse linking the most premises.
The three premises that use the most slaughterhouses (two using seven different slaughterhouses and one using eight) were removed from the network. However, the size of the GC remained close to 2870 showing that this had only a minor effect on the worst-case epidemic. Removal of premises from the network represents movement bans that are imposed during an outbreak. These results suggest that targeting surveillance or imposing movement bans at highly connected premises alone would not necessarily have a large impact on the potential size of an epidemic. Removal of the slaughterhouse with the largest number of customers (1208 customers) resulted in the number of premises sending birds to slaughter to fall by 883 (29%) premises, suggesting that if a large slaughterhouse were to be involved in an outbreak, there is some justification in spending money on forward and backward tracings as well as the local protection and surveillance zone that is required.
Sensitivity Analysis
Relative importance of different contact structures
The proportion of premises not connected to any other premises i.e. with zero degree, is significantly less (p<0.01) for premises connected by slaughterhouse than for those connected by catching company or by owner. Furthermore, as the probability of a link occurring increases, the proportion of zero-degree premises drops significantly more quickly for premises connected by slaughterhouses (p=0.028) than for premises connected by other potential transmission routes. This implies that individual premises are much more likely to be connected to other premises via the slaughterhouse route than any other route, and as the probability of spread via each route increases, the number of premises connected to at least one other premises increases more quickly for premises linked via slaughterhouses than for other routes. Although this suggests slaughterhouses are relatively more important than catching companies and owners in terms of the number of premises that they are likely to connect, it does not imply that they are more likely to spread disease, as these results do not take into account the quantitative probability of transmission via each route.
The role of premises using multiple slaughterhouses
According to the available contact data, the owners of poultry premises send birds to up to eight different slaughterhouses though according to Gittins [ADAS, pers. comm.] only a small number of single species farms would truly send birds to more than one slaughterhouse at any one time. When the number of slaughterhouses associated with a premises is restricted to one, the maximal size of the GC in the slaughterhouse transmission network is reduced to 970 (32.6%) premises. By reducing the number of slaughterhouse that premises can send birds to, we are able to comment on the impact that premises housing multiple species have on the potential for disease transmission.
Treating multi-species sites as separate epidemiological units
In the preliminary analyses of the contact structures described in this study, we made an assumption that catching teams within a catching company are able to catch from any farm that is associated with that company, and birds can be sent from a poultry premises to any slaughterhouse associated with that premises. This assumption may over estimate the number of contacts within the industry as catching teams and slaughterhouses often process only one species and/or production type e.g. spent chicken layers and meat chicken are not necessarily processed at the same slaughterhouse. Under the assumption that different species cannot be connected by slaughterhouse or catching company, multi-species sites can be treated as separate epidemiological units that are connected by location and company.
Properties of the contact structures are sensitive to the assumption that connections are likely to occur between different species and between different production-types within a species. This is shown by the fall in the size of the GC to1603 (53.9%) of premises connected by slaughterhouse and to 102 (14.4%) of premises connected by catching company when
Page 60 of 87 60
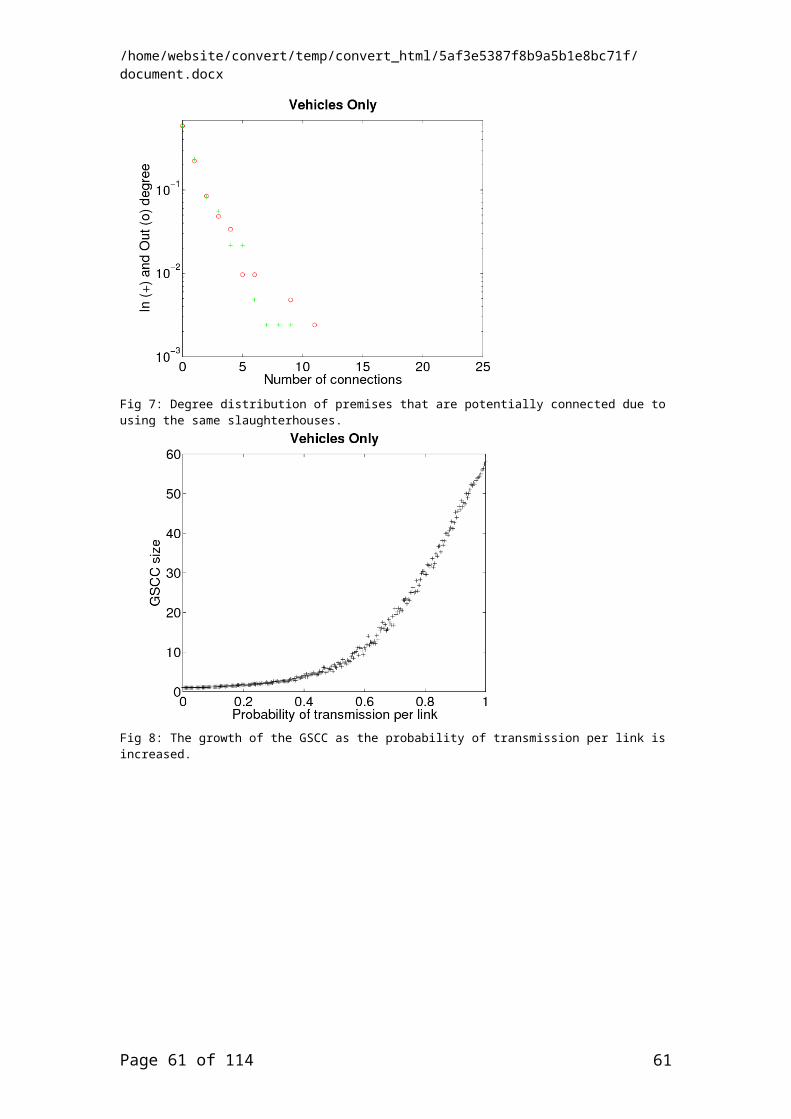
/tt/file_convert/5af3e5387f8b9a5b1e8bc71f/document.docx
between species transmission is not assumed (Figure 7). Furthermore, when we assume that different species are not processed together, we see a drop in the degree (number of links to other premises) of each premises. The mean degree size falls from 18.12 to 8.33 links and from 504.95 to 28.64 links for premises connected by catching companies and slaughterhouses respectively, when no between-species transmission occurs via these routes. As restricting contact between different species causes the number of premises with zero-degree to rise and the size of maximum degree to fall (Table 2), we can expect the basic reproduction number R0 for a disease to also fall if between species transmission can be controlled or prevented on multi-species sites.
Defining a maximum distance that any catching team can travel between two poultry premises
Some catching teams operate over broad regions of GB [29]. This may occur when the birds to be caught require specialist catching skills, such as for turkeys because of their size and weight. In order to determine if the area over which a catching team operates affects the contact structure of the poultry network, we restricted the distance over which a team could operate i.e. the distance that any one catching team within a company can physically travel between farms. Radii of different sizes were therefore used around premises and only allowing links to occur with other premises within the radii. Restricting this distance reduced the size of the GC from 295 (41.7%) of premises for no restrictions to 229 (32.4%) for a restriction of 50km and 84 (11.9%) of premises for a restriction of 25km (Figure 8). Evidence of some geographic isolation is found when the maximum distance is restricted to 50km; for transmission networks generated when the probability of transmission via catching companies passes through p = 0.05, the number of premises visited by a catching team, on average, takes a rapid jump from below ten to more than 13 premises (Figure 9).
DISCUSSION
By combining available data associated with prior outbreaks of poultry diseases associated with oral-faecal transmission routes (Table 1) we have constructed possible contact structures within the poultry industry in GB based on associations amongst poultry premises using the same slaughterhouses, catching companies, and belonging to the same multi-site companies. We have also included environmental spread in our analyses by assuming that disease can be transmitted between premises that are geographically close to each other.
Outbreak data from the Netherlands shows that local transmission of HPAI played an important role in the 2003 epidemic [13,32]. Boender (2007) suggests that epidemic spread is only possible in poultry dense areas of The Netherlands [32]. In the analyses shown here, only 2% of premises were connected, in the worst case scenario, via local transmission within 3km of an infected premises, suggesting that the British poultry industry is not densely enough populated for local transmission of the HPAI virus which devastated the Netherlands in 2003.
If one assumes that using the same slaughterhouse company implies a potential link, up to 97% of premises sending birds to slaughter are potentially connected, which could translate to almost the entire poultry industry, assuming that most commercial premises do not slaughter their birds on site. In contrast, only 42% of premises using catching companies and 11% of premises belonging to multi-site companies are potentially linked. Although this suggests that slaughterhouses potentially link the largest number of premises and therefore have the highest potential for widespread dissemination of virus, should virus transmit via this route, the size of the GC was highly sensitive to the number of slaughterhouses used per premises. It seems unlikely that over 30% of premises truly send birds to more than one slaughterhouse, as indicated in the network database. It is possible that when slaughterhouses were asked to provide a list of customers, some premises were listed that are no longer active customers. This could result in an overestimate in the number of slaughterhouses used per premises. This suggests that the structure of the industry may be very dynamic, with premises changing their potential interactions regularly. Thus regular updating of the database would be necessary if it is to be used for contact tracing purposes. Further, in the absence of contact data from an AIV epidemic in GB, we do not know the
Page 61 of 87 61
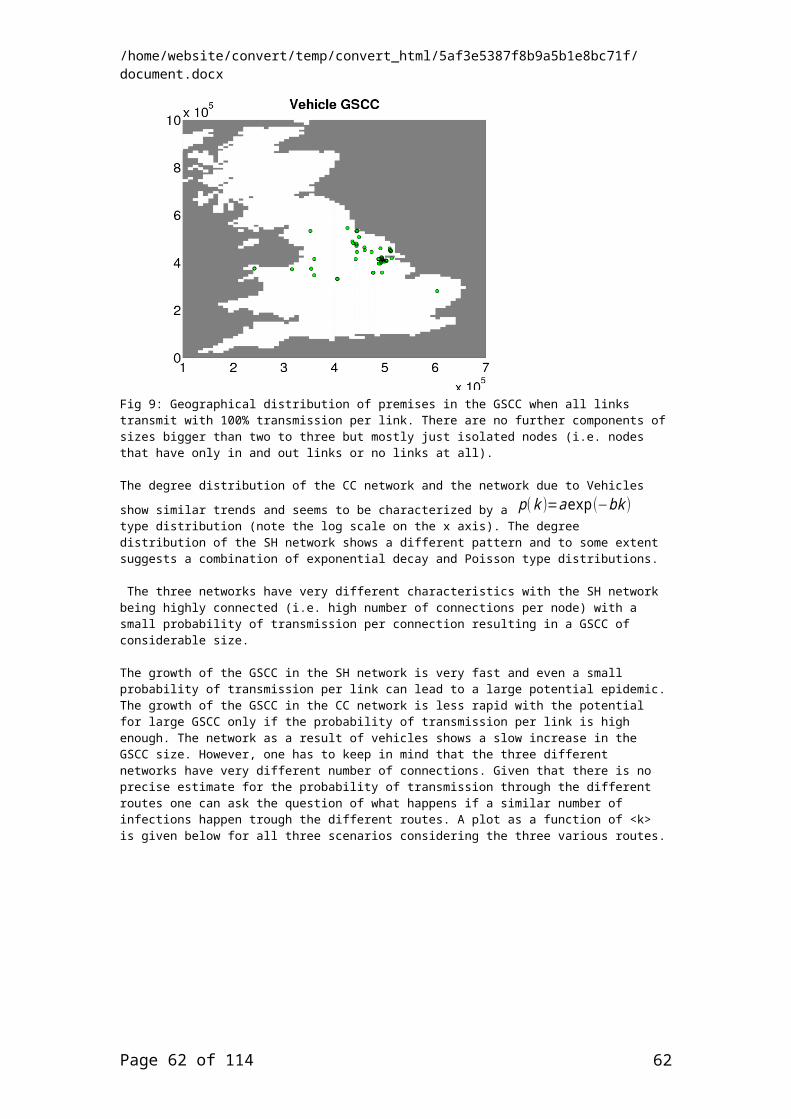
/tt/file_convert/5af3e5387f8b9a5b1e8bc71f/document.docx
parameter values that should be applied to each transmission mechanism and should therefore take care when comparing outputs, and it is generally believed that catching company teams, for example, are a more likely mode of transmission than slaughterhouses (cf. table 1). We also note that different research groups have approached this problem in different ways. Truscott at al (2007) [8] group movements of people and equipment together and assume a constant, density-independent contact rate between premises, where-as Sharkey et al (2007) [17] do not incorporate the movement of catching companies in their models but do consider the probability of transmission via slaughterhouses to be always greater than that of company movements for example. In adopting either approach, slaughterhouses remain the most important contact mechanism in this analysis in terms of the number of premises that may become infected. Further data collection is required to determine why the owners of poultry do not necessarily use local catching companies and slaughterhouses, and whether putting a smaller limit on the distance that live poultry can be transported would be a feasible standard for the industry to set.
The contact structures observed here are well connected with a high number of links between premises. This occurs because we have made the assumption that all premises using the same slaughterhouse, catching company or belonging to the same multi-site premises are potentially all connected. This means that targeting surveillance on the premises that use the most number of slaughterhouses, in particular, will not be beneficial in preventing or controlling an epidemic as there are other premises, using more than one slaughterhouse, that are able to keep the connectedness of the contact structure. We have shown that removal of the largest slaughterhouse greatly reduces the number of premises that are connected. While one cannot remove a slaughterhouse from the industry in real terms, one can target surveillance, through forward and backward tracings, at the premises that have had recent contact with the slaughterhouse. By ensuring that there is no infection passing through the largest slaughterhouse, we can be sure that at least 22% of premises that send birds to slaughter are not transmitting disease via this mechanism.
Multi-species sites are also potentially important, should transmission between species on a site be likely, as they can act as a bridge between different sectors of the poultry industry. Operating on a species-specific basis at the slaughterhouse and by the catching company can reduce the risk of a large epidemic, by reducing the number of potential contacts made between separate epidemiological units. This in turn reduces the R0 of a disease, making control more manageable. Housing multiple species on the same site so that species have the potential for interaction, either by being housed in the same building or through having access to the same feeding or watering ground for example, may also pose problems at the farm level as a result of the differences in species susceptibility to AI viruses. Ducks for example are able to carry both LPAI and HPAI virus without showing any clinical signs [2, 31]. Although outbreaks of HPAI in commercial ducks are rare, the ability of ducks to survive infection can increase the time to detection of an outbreak, and hence the number of premises potentially infected with an AI virus. This is particularly dangerous for premises housing ducks and chickens or turkeys, as ducks can shed high doses of the virus without any early warning signs. While further investigation into the range of values of within flock transmission is important, these analyses underline the value of good biosecurity at premises level to limit transmission across species within premises.
Biosecurity measures are not directly accounted for this analysis. Under good biosecurity measures, connections between species and connections between premises, over which disease can transmit, can be broken. Although biosecurity levels are difficult to measure, they can be represented here by a reducing the probability of an infectious link occurring between connected premises. This would result in a reduction of the number premises in the GC. The real risk of disease transmission through movements of people, vehicles and equipment should be investigated further, so that the impact of biosecurity at both the farm and slaughterhouse level can be simulated.
CONCLUSION
We have used potential transmission routes of poultry diseases, to identify potential contact structures within the poultry industry in GB over which AIV may transmit. Few premises are
Page 62 of 87 62

/tt/file_convert/5af3e5387f8b9a5b1e8bc71f/document.docx
connected as a result of being geographically close to one another, which reduces the concern for local spread of AIV, and limits the validity of applying data from the 2003 outbreak in the Netherlands to the GB situation.
Connections through slaughterhouses potentially links surprisingly large numbers of premises, over long distances. Further work as to whether these potential connections represent real risk, or are just an artefact of the data, must be investigated. Should it prove true, surveillance should be targeted at the premises connected to the largest slaughterhouse in order to prevent disease spreading to a large number of premises. As reducing the distance that catching companies travel between premises reduces the number of premises that are potentially connected, we also suggest controlling wide dissemination of disease by encouraging premises to use local catching companies and slaughterhouses.
If between species transmission occurs, then this has implications for the potential for large epidemics as multi-species sites may play an important role in the connectivity of otherwise separate sectors of the poultry industry, though expert opinion suggests that they are only likely to interact at the local level. This makes a difference to the maximum number of premises that may be connected and hence gives rise to the importance of further investigations into this area.
METHODSLiterature ReviewA literature review was undertaken in order to research the British poultry industry and to identify potential between farm transmission routes of AIV. The results were collated with expert opinion and categorised into sub-populations within the poultry industry that may connect poultry premises.
Construction of contact structures
A series of epidemiological contact structures were constructed in which commercial poultry premises are linked by potentially infectious contacts. The potential contacts between premises were informed by a NEEG/CERA (National Epidemiology Emergency Group/Centre for Epidemiology and Risk Analysis, Defra) data collection exercise, in which slaughterhouses and catching companies were approached to provide a list of the premises from which they collect birds and the species involved, and a sample of single and multi-site companies were sent a questionnaire on which they were asked for details about the frequency and type of movements from their premises. In addition, the poultry register (GBPR) data provided details on the location and species numbers in each poultry premises in GB housing more than 50 birds. The data in the network database was compared to the GBPR as well as data obtained from the Food Standards Agency and expert opinion [Jason Gittins, Howard Hellig, Ian Brown] in order to determine how representative the network database is of the contact structures being analysed.
Potentially infectious links between premises could occur either as a result of premises:
1. Using the same catching company, or2. Using the same slaughterhouse, or3. Belonging to the same multi-site company, or4. Environmental spread within a 3km radius of poultry premises.
We assumed that premises could be linked by catching company or multi-site companies by the direct movements of people (catching teams or company personnel), vehicles or equipment between poultry premises. For slaughterhouses, connections between premises can occur when slaughterhouse vehicles and equipment are used on multiple premises to collect birds. Vehicles may visit multiple premises en-route to the slaughterhouse, possibly connecting farms and transmitting infection, or they may return to a slaughterhouse between visits to premises. The use of slaughterhouse vehicles and equipment in the transportation of
Page 63 of 87 63

/tt/file_convert/5af3e5387f8b9a5b1e8bc71f/document.docx
birds to slaughter can connect farm to slaughterhouse to farm, or farm to farm to slaughterhouse.
A radius of 3km was chosen to be limit for environmental transmission based small probabilities of transmission of AIV via this route [32]. A 3km radius is also the radius of the protection zone put around infected premises in GB, during an outbreak situation.
Under the assumptions made, maximum connectivity between premises is represented in the contact structures. A potential epidemic supported by such a contact structure could be considered the worst-case scenario.
Contact structure analysis
Having identified the contact structures to be analysed, the number of nodes and links were calculated for each type of potentially infectious link. The four contact structures were analysed using a simulation programme. The programme, written in C language, uses Tarjan’s algorithm [33] to find the largest component within the given contact structure such that any premises in that component can be reached directly, or indirectly, by any other premises. This output represents an upper limit to the size of a potential epidemic that may occur as a result of transmission of disease via a particular transmission mechanism. The probability of a link occurring between two premises, which was varied between zero and one, represents the probability of transmission of disease.
Initially, the worst-case scenario was considered, where all links result in potentially infectious contacts. In order to test the sensitivity of the results to the assumption that all links result in potentially infectious contacts, the effects that removing key-players from the network have on the size of the GC was considered, as well as the effect of restricting poultry premises to the use of only one slaughterhouse, chosen at random from a list of slaughterhouses used by the premises.
Sensitivity Analysis
It should be noted that the sensitivity analysis performed here is used to investigate the impact of changes (e.g. restrictions on distance travelled by catching teams) on the properties of contact structures. By considering certain properties of the contact structures, we can investigate the relative sensitivity of the contact structure properties under different scenarios. In order to determine the relative importance of each contact structure, we consider how the degree distribution (the number links per premises) varies as the importance of the contact structure changes. The “importance” can be varied by varying the probability of a link occurring between two premises within the contact structure.
The sensitivity of the GC to the following scenarios was explored and areas for further data collection identified:
1. Limiting the number of slaughterhouses to one per premises. Slaughterhouses generally do not slaughter multiple species. By limiting the number of slaughterhouses used per premises, we were able to determine the effect that premises housing multiple species have on the connectivity of the contact structure represented by slaughterhouses, as such premises are the ones likely to be sending birds to multiple slaughterhouses. Where premises are recorded as sending birds to multiple slaughterhouses, one slaughterhouse was chosen at random.
2. Treating multi-species sites as separate epidemiological units. Different species housed on the same site are treated as separate epidemiological units, categorised into the five principal sectors of the British poultry industry: meat chicken, commercial layer, turkey, duck and goose industries [34]. We assume that between-species transmission can only occur via local (i.e. short distance) spread and not via slaughterhouse or catching company transmission. Under these assumptions, we can comment on the impact that the possibility of cross-species contamination,
Page 64 of 87 64

/tt/file_convert/5af3e5387f8b9a5b1e8bc71f/document.docx
particularly on multi-species farms, can have on the potential for disease transmission.
3. Imposing a maximum distance that any catching team can travel between two poultry premises. The Euclidean distance between two potentially connected premises was calculated, and the link could only result in disease transmission if two premises are within a given distance of each other (distances of 25km and 50km were tested). This analysis revealed the importance of obtaining more detailed catching company and slaughterhouse data.
List of Abbreviations
ADAS - Agricultural Development and Advisory ServiceAIV – avian influenza virusCERA - Centre for Epidemiology and Risk AnalysisDefra – Department for Environment, Food and Rural AffairsFSA – Food Standards AgencyGB – Great BritainGC – Giant componentHPAI – High-pathogenic avian influenzaLPAI – Low pathogenic avian influenzaNEEG - National Epidemiology Emergency GroupUK –United Kingdom
Authors’ Contributions
MA is responsible for the conception of the study. MA, RK, IK and JD contributed to the design of the study. JD and IK carried out the analyses of the data. Interpretation of the results was undertaken by all authors. The manuscript was written by JD with comments from all authors.
AcknowledgementsWe would like to thank Jason Gittins of ADAS for his expert industrial input to constructing the networks. This work has been supported by the Department for environment, Food and Rural affairs (Defra).
References
1. Farm Business Survey 05/06. [http://www.thepoultrysite.com/articles/855/poultry-production-in-england]
2. Alexander DJ: The epidemiology and control of avian influenza and Newcastle disease. Comp. Pathol. 1995, 112(2):105-126.
3. Cross GM: Newcastle disease. Vet C in North Am Small Anim Prac. 1991, 21(6): 1231-1239.
4. Swayne DE and King DJ: Avian influenza and Newcastle disease. Vet Med Assoc. 2003, 222(11):1534-40.
5. Webster RG, Sharp GB and Claas ECJ: Interspecies transmission of influenza viruses. AM J Respiratory and Critical Care Medicine. 1995, 152:25-30.
6. Alexander DJ: A Review of avian influenza in different bird species. Veterinary Microbiology 2000, 74:3-13.
7. Bragstad K, Jorgensen PH, Handberg KJ, Mellergaard S, Corbet S and Fomsgaard A: New avian influenza A virus subtype combination H5N7 identified in Danish Mallard ducks. Virus Research 2005, 9:181-190.
8. Truscott J, Garske T, Chris-Ster I, Guitian J, Pfeiffer D, Snow L, Wilesmith J, Ferguson NM and Ghani AC: Control of highly pathogenic H5N1 avian influenza outbreak in the GB poultry flock. Proc. R. Soc. B. 2007, 274(1623):2287-2295.
9. Saurez DL and Schultz-Cherry S: Immunology of avian influenza virus: A review. Development and Comparative Immunology 2000, 24:269-283.
Page 65 of 87 65

/tt/file_convert/5af3e5387f8b9a5b1e8bc71f/document.docx
10. Amonsin A, Payungporn S, Theamboonlers A, Thanawongnuwech R, Suradhat S, Pariyothorn N, et al: Genetic characterization of H5N1 influenza A viruses isolated from zoo tigers in Thailand. Virology 2006, 344:480–91.
11. Easterday BC and Tumova B: Avian influenza. Diseases of Poultry, 6th ed. Iowa state university Press, Ames IA 1972: 670-700.
12. Capua I, Marangon S, Dalla Pozza M, Terregino C and Cattoli G: Avian influenza in Italy 1997-2001. Avian Diseases 2003, 47:839-843.
13. Stegeman A, Bouma A, Elbers ARW, De Jong MCM, Nodelijk G, De Klerk F, Koch G and van Boven M: Avian influenza A virus (H7N7) epidemic in The Netherlands in 2003: Course of the epidemic and effectiveness of control measures. J Infect. Dis. 2004, 190(12):2088-95.
14. Tiensin T, Chaitaweesub P, Songserm T, Chaisingh A, Hoosuwan W, Buranathai C, Parakamawongsa T, Premashthira S, Amonsin A, Gilbert M, Nielen M and Stegeman A: Highly pathogenic avian influenza H5N1, Thailand, 2004. Emerging Infectious Diseases 2005, 11 (11):1664-1672.
15. Manelli A, Ferre N and Maragon S: Analysis of the 1999-2000 highly pathogenic avian influenza (H7N1) epidemic in the main poultry-production area of northern Italy. Preventive Veterinary Medicine 2006, 73(4):273-85.
16. Garske T, Clarke P and Ghani A: The transmissibility of highly pathogenic avian influenza in commercial poultry in industrialised countries. PloS ONE 2007, 2(4): e349. http://www.plosone.org
17. Sharkey KJ, Bowers RG, Morgan KJ, Robinson SE and Christley RM: Epidemiological consequences of an incursion of highly pathogenic avian influenza into the British poultry flock. Proc. R. Soc. B. 2007, doi:10.1098/rspb.2007.1100.
18. Kao RR, Danon L, Green DM and Kiss I: Demographic structure and pathogen dynamics on the network of livestock movements in Great Britain. Proc. R. Soc. B. 2006, 273:1999-2007.
19. Kao RR, Green DM, Johnson J and Kiss IZ: Disease dynamics over very different time-scales: foot-and-mouth disease and scrapie on the network of livestock movements in the UK. J.R. Soc. Interface. 2007, 4:907-916.
20. Kiss I, Green D and Kao RR: The network of sheep movements within Great Britain: Network properties and their implications for infectious disease spread. J.R. Soc. Interface 2006, 3:669-677.
21. Evans SJ and Sayers AR: A longitudinal study of campylobacter infection of broiler flocks in Great Britain. Preventive Veterinary Medicine 2000, 46:209-223.
22. Hartnett E, Kelly L, Newell D, Wooldridge M and Gettinby G: A quantitative risk assessment for the occurrence of campylobacter in chickens at the point of slaughter. Epideiol. Infect. 2001, 127:195-206.
23. Evers EG: Predicted quantitative effect of logistic slaughter on microbial prevalence. Preventive Veterinary Medicine 2004, 65:31-46.
24. Heyndrickx M, Vandekerchove D, Herman L, Rollier I, Grijspeert K and De Zutter L: Routes for salmonella contamination of poultry meat: Epidemiological study from hatchery to slaughterhouses. Epidemiol. Infect. 2002, 129:253-265.
25. Ramabu SS, Boxall NS, Madie P and Fenwick SG: Some potential sources for transmission of campylobacter jejuni to broiler chickens. Letters in Applied Microbiology 2004, 39:252-256.
26. Bahl AK, Langston A, Van Deussen RA, Pomeroy BS, Newman J, Karunakaran D and Halvorson D: Prevention and control of avian influenza in turkeys. Proceedings of the Annual Meeting of the US Animal Health Assoc. 1979, 83:355-363.
27. Elbers ARW, Fabri THF, de Vries TS, de Wit JJ, Pijpers A and Koch G: The highly pathogenic avian influenza A (H7N7) virus epidemic in the Netherlands in 2003 – Lessons learned from the first five outbreaks. Avian Diseases 2004, 48:691-705.
28. Sahin O, Morishita TY and Zhang Q: Campylobacter colonization in poultry. Animal Health Research reviews 2002, 3:95-105.
29. Gittins J. and Canning P: Review of the Poultry Catching Industry in England and Wales. 2006 [www.defra.gov.uk/animalh/diseases/pdf/catchersreview.pdf]
Page 66 of 87 66

/tt/file_convert/5af3e5387f8b9a5b1e8bc71f/document.docx
30. Borgatti SP: Identifying sets of key players in a social network. Comput Math Organiz Theory 2006, 12:21-34.
31. Highly Pathogenic Avian Influenza. April 2002. [http://www.oie.int/eng/maladies/fiches/a_a150.htm].
32. Boender GJ, Hagenaars TJ, Bouma A, Nodelijk G, Elbers ARW, de Jong MCM and van Boven M: Risk maps for the spread of highly pathogenic avian influenza in poultry. PloS Comput Biol. 2007, 3(4):e71 doi:10.1371/journal.pcbi.0030071.
33. Sedgewick R: Algorithms in C, part 5, graph algorithms. 3rd edn Reading, MA: Addison-Wesley 2002.
34. Structure of the United Kingdom Poultry Industry. June 2006 [http://www.defra.gov.uk/animalh/diseases/vetsurveillance/pdf/commercial-poultry-ind.pdf]
FIGURESFigure 1 – Poultry premises (red) using A) Slaughterhouses (yellow), and B) Catching companies (yellow).Figure 2 – Slaughterhouse customers (poultry premises) against the frequency of slaughterhouses with that many customersFigure 3 – Catching company customers (poultry premises) against the frequency of catching companies with that many customers.Figure 4 – The number of Slaughterhouses used per poultry premises against the frequency of poultry premisesFigure 5 – Proportions of premises contained in the Giant Component (GC) for each transmission route, for probability of a link occurring between connected premises varied between p = 0 and p = 0.2.Figure 6 – Location of poultry premises contained within the GC for premises connected by
A) Catching Company, B) Slaughterhouse C) Owner.
With between species transmission. Premises plotted on a 100km Grid, for probability of a link occurring between two premises equal to 0.2.Figure 7 – Location of poultry premises contained within the GC for premises connected by
A) Catching Company, B) Slaughterhouse
With no between species transmission. Premises plotted on a 100km Grid, for probability of a link occurring between two premises equal to 0.2.Figure 8 – The effect on the number of premises in the GC of restricting the distance that catching companies move between premises to a) no restriction (red), b) 50km restriction (green) and c) 25km restriction (blue).Figure 9 - Evidence of geographic isolation for transmission networks generated when the probability of transmission via catching companies passes through p = 0.05. Size of the GC at just below and just above the transition.
Table 1 - Potential between farm transmission routes of avian influenza virus. Vehicles
People2 Fomites Environment
Litter disposal Catchers and Thinners
Catching equipment Wildfowl
Catching Drivers Containers Water and FeedDisposal and replacement
Cleaning teams Pallets Airborne (dust)
Cleaning Artificial Insemination Teams
Culling equipment Flying insects
Dead bird collection Area Managers Workman’s clothes Game birds (shows)Imports Farm staff Dead bird collecting Hatching egg collection
Dead bird collectors Holding station
Page 67 of 87 67

/tt/file_convert/5af3e5387f8b9a5b1e8bc71f/document.docx
Feed delivery Vets Raw feed Material Visiting Vaccination Farm
Transmission routes are broken down into sub-categories, which are then ranked in order of potential risk of acting as a transmission route of disease, from most important to least important.
Table 2 – Difference in degree size for between species and no-between species transmission
Slaughterhouse: Between species transmission
Slaughterhouse: No between species transmission
Catching company:Between species transmission
Catching company: No between species transmission
Proportion of zero-degree epidemiological units
0.101 0.310 0.789 0.851
Largest degree 1457 700 223 107
Numbers correspond to number of epidemiological units, and not number of premises. By splitting multi-species premises into separate epidemiological units, the number of units associated with catching companies and slaughterhouses rise to 825 and 3418 respectively.
Page 68 of 87 68

/tt/file_convert/5af3e5387f8b9a5b1e8bc71f/document.docx
Appendix 6: Predicting links between premises using Route network data (Glasgow)
The transport network data used in this work a highly detailed, regularly updated dataset developed and maintained by Ordnance Survey Great Britain (OS). The Integrated Transport Network (ITN) dataset and the associated Road Routing Information (RRI) dataset is part of the OS MasterMap series of products. Further details about these datasets are available from the OS website:http://www.ordnancesurvey.co.uk/oswebsite/products/osmastermap/layers/itn/
A route network is a special type of vector dataset in a GIS. It consists of edges (lines, which in this case represent roads) and nodes (points representing junctions where edges meet). Edges and junction both have costs associated with them. In a transport network the cost is usually travel time, but it could also be distance (depending on the priorities of the analysis being conducted). Route network analysis is based on a branch of mathematics called graph theory. The route network is a mathematical graph to which algorithms can be applied to answer certain types of questions, usually optimization questions (e.g. what is the least-cost route between two points on the graph). We assume that the route people drive between two locations is approximately the least-cost route
The ITN and RRI datasets were used to create a route network that took into account road direction (i.e. one-way versus two-way streets), road type (Motorways, A roads, B roads, Minor roads and Local roads, Alleys, Private roads and Pedestrianised streets), and road speed based on road type. We deemed that Local roads, Alleys, Private roads and Pedestrianised streets were not relevant to this exercise because they most often represent small residential streets in cities and towns. Eliminating these records reduced the size of the dataset substantially (from 4 million to 1.3 million features), which greatly increased the performance of the route network analysis. We did not explicitly model bridge heights in this route network.
Travel time is a difficult metric to estimate in a route network for a number of reasons. First, speed limits on some roads are variable (particularly on motorways near large urban areas). Second, travel time is often unrelated to the legal speed limit and depends more on traffic and weather conditions. We adopted a best case scenario approach here whereby we assume that vehicles are able to travel at the legal speed limit:
Motorways 70mphA roads (dual carriageway) 70mphA roads (single carriageway) 60mphB roads 50mphMinor roads 45mph
For lorries these speed limits were all reduced by 10mph. When using the route network we are therefore able to specify whether we are solving it for a lorry or a smaller vehicle that can travel at the unrestricted speed limits.
Converting ITN data to a useful format
The ITN dataset contains road (and ferry link) data for every street in the UK (over 4 million features). It is a relational database delivered in Geographic Markup Language (GML) format, which is a file format designed to be completely software and platform independent. This data must be converted to formal GIS database before it can be used in a route network analysis. The use of this data poses an exceptional problem because there are no software utilities that import large quantities of this data (the GML for the entire UK dataset is over 10GB). ESRI UK™ produces software called the “Productivity Suite” that is designed to import this data. Upon testing it, however, I found that it could only process ITN data in small chunks and was extremely slow. It also failed to correctly import several of the attributes that were needed to build the route network. We therefore wrote an import tool that converts the GML file to an ESRI Geodatabase file format. The geodatabase contains vector road features and a series of non-spatial tables containing the relational data.
Page 69 of 87 69

/tt/file_convert/5af3e5387f8b9a5b1e8bc71f/document.docx
The final data conversion step is to create an ESRI Network Dataset in ArcCatalog. A cost field representing the travel speed in minutes along each edge was calculated based on the estimated travel speeds for that road type.
Route network analysis
We used ESRI ArcGIS software to perform route analyses. Network Analyst for ArcMap can be used to solve individual route network problems but has not interface for batch processing. Because we are seeking thousands of route network solutions we programmed an interface that processed the entire batch as expediently as possible. The input to the program is a table containing pairs of source and destination coordinates (x, y coordinates in the British National Grid projection). The output of this program is a vector (line) GIS file that contains the optimal route that was calculated, the total cost of traversing that route (number of minutes of travel time), and the distance of the route. The distance and travel time are the metrics we use in subsequent statistical and modeling analyses.
Although the ITN dataset is very detailed and of high quality, it does contain errors. Furthermore, the simplification of the dataset (removing local roads) can break the network, especially in remote areas. These two problems mean that no solution can be found for some pairs of coordinates. We currently estimate the failure rate at less than 3%. If we decide to use the route network in the future these failures should be eliminated by 1) tracing all failures to determine where the failure in the network occurred, and resolving any error found (e.g. miscoding a street as one-way), and 2) using the full network to attempt to solve the route if no solution could be found with the simplified network (this can be automated within the framework of the program we have developed).
Page 70 of 87 70
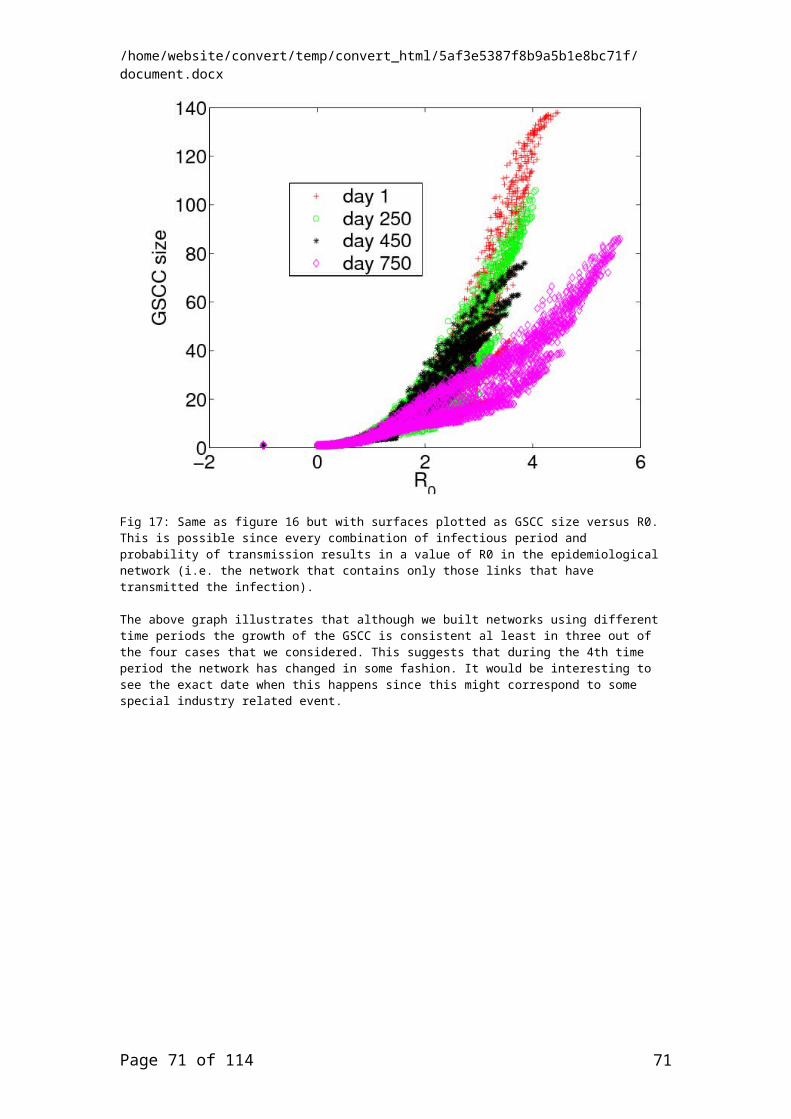
/tt/file_convert/5af3e5387f8b9a5b1e8bc71f/document.docx
Figure 1. A sample of the simplified route network dataset for the London/Bristol/ Birmingham area.
The difference between linear and route network distances
To illustrate the differences between linear and route network distances, and to better understand how the use of route network distances might improve our understanding of connectivity in epidemiological studies, we generated 719 pairs of random points on mainland Britain and calculated the optimal network route between them. We then modeled the percent difference between linear distance and route network distance as a function of the linear distance, the minimum x value, and the maximum y value. The minimum x and maximum y values were included to capture broad scale regional patterns that we expect might vary from east to west and from north to south in Britain, primarily associated with gradients in road densities.
Differences between linear and route network distances were gamma distributed (Figure 2). The mean difference (expressed as a percentage of the route network distance) was 24.3%. Linear distance and route network distance are highly correlated (r2=0.968), but this varies regionally. The linear model of the percent difference between linear distance and route network distance indicates that both the minimum x coordinate and the maximum y coordinate are statistically significant predictors of the percent difference (Figure 3). As expected, differences are higher in the west and north of Britain. This pattern is clearly driven by road densities which are lower in Scotland, Wales and the west of England than in the south and east of England.
The premise of this work is that 1) connectivity between premises (farms to farms, or farms to slaughterhouses) is related to the distance between them whereby the likelihood of connectivity declines with distance, 2) this distance based pattern in connectivity is
Page 71 of 87 71

/tt/file_convert/5af3e5387f8b9a5b1e8bc71f/document.docx
mechanistically driven in part by movement of vehicles between premises, 3) because route network distance is a measure of distance based on the mechanism that determines connectivity we hypothesize that it will be a better predictor of connectivity than the linear distance between premises. This would only be true in areas where there is a difference between the two distance measures. In the south-east of the UK where road densities are very high (see Figure 1), the difference is small relative to the differences in the north and west of the UK where road densities are much lower. Thus, as a predictor of connectivity, route network distance is likely to perform similarly to linear distance in the south and east of the UK (including the Midlands), and we predict it will perform better than linear distance in areas with lower road densities.
Figure 2. The frequency distribution of differences between linear distance and route network distance (TOP), also expressed as a percentage difference (BOTTOM).
Page 72 of 87 72
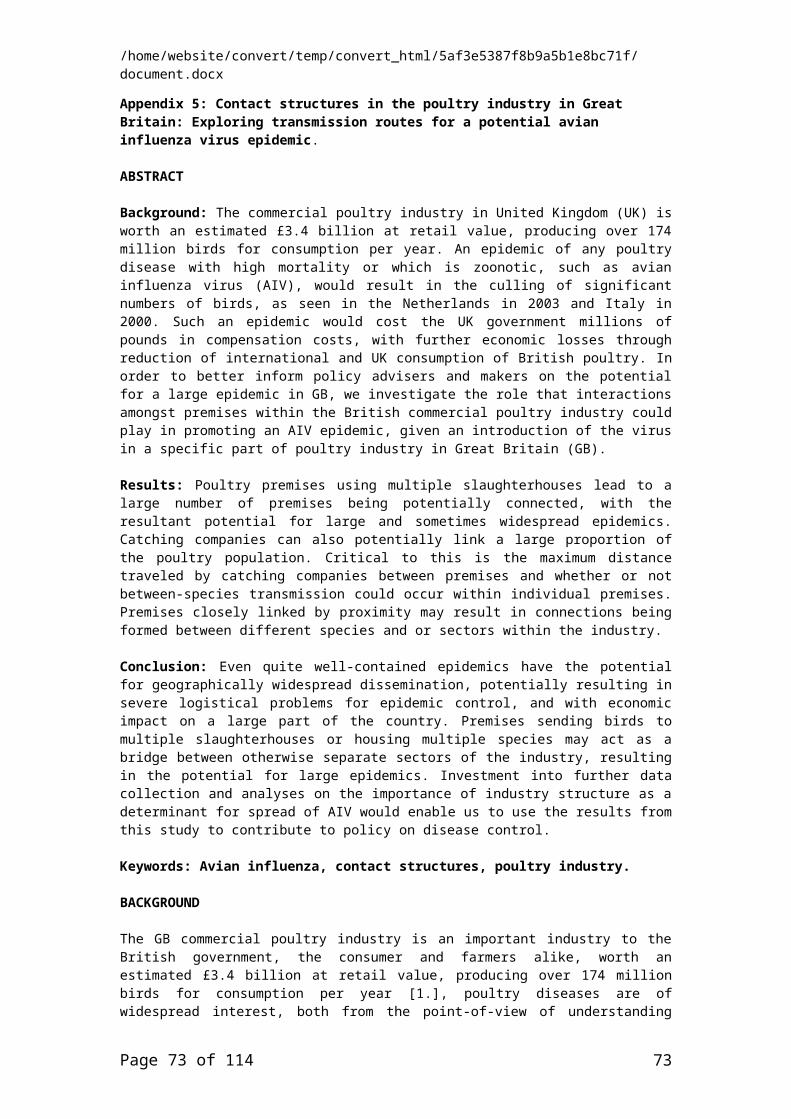
/tt/file_convert/5af3e5387f8b9a5b1e8bc71f/document.docx
Figure 3. The minimum x (TOP) and maximum y (BOTTOM) coordinates plotted against the percent difference between linear and route network distances. Note that the percent
differences are higher in the west and the north of Britain.
Predicting links between premises via catching company (VLA)A simulation programme was developed to predict where links between 415 poultry premises that are visited by the same catching company occur. A 415*415 matrix was set up and a value of one was assigned between farms where direct links exist according to the data. This does not account for any temporal aspects of the data, but allows us to determine if distance between farms and farm characteristics can be used to predict whether two farms will be linked by catching team.
Page 73 of 87 73
/tt/file_convert/5af3e5387f8b9a5b1e8bc71f/document.docx
Random links were created between farms, where the number of true links represents the expected number of links and the probability of a link occurring is dependent only on the expected number of links. The number of correct links, the number of missing links (where the predictor has not succeeded in assigning a value of one between farms where a link exists in the data) and the number of extra links (where the predictor has assigned a value of one between two farms no link exists in the data) are recorded. The number and proportion of correct links are calculated such that:
Four other link predictors are compared to the data, where:
1. Links are dependent on Euclidean distance between two premises.2. Links are dependent on Euclidean distance between two premises and number of
houses on both premises.3. Links are dependent on road distance between two premises.4. Links are dependent on road distance between two premises and number of houses
on both premises.
Links dependent on Euclidean and road distance between two premises: The Euclidean distance and road distance are calculated between all premises, where easting and northing location data were available. When the location of a premises was not known, it was not included in the analysis. Where links between two separate premises exist, the Euclidean distance between the premises was noted and these distances were fitted using maximum likelihood software in R (Wessa, 2008) to an exponential distribution with rate parameter 0.03055. Similarly, the road distance was calculated between linked premises and these distances fitted, using the same maximum likelihood software, to an exponential distribution with rate parameter 0.02018. On average, the expected number of links are then created within the simulation, so that the probability of a link occurring between two premises is dependent on the distance (Euclidean and road separately) between them such that
.
The expected number of links is taken directly from the data and the weighted probability for each premises is given by
where X represents all farms currently not linked with farm A
Using this formula, we infect one farm, on average, every time the loop is run. When a link is created between farms, the weighted probability is adjusted so that the probability of infecting one farm on average, from the remaining farms, is still equal to one. The results are compared to the true links as above.
Links dependent on distance between two premises and number of houses on both premises:We assign links between premises based on distance between premises and premises size. Using both distance and premises size (number of houses or number of birds) as predictors, we did not succeed in transforming the data so that the assumptions of a Generalised Linear Model (GLM) were met. Further analyses showed that the probability of and onward movement occurring does not seem to be affected directly by the number of houses on the first farm to be visited. We therefore test the assumption that catching teams move between premises that are similar in size (by number of houses) by considering whether the difference between the numbers of houses on two premises can be used as a predictor. This difference fits an exponential distribution (Wessa, 2008) with rate parameter 0.39846. In order to predict links dependent on distance and number of houses, we used the distance distributions to
Page 74 of 87 74
/tt/file_convert/5af3e5387f8b9a5b1e8bc71f/document.docx
choose a maximum distance within which premises were to be linked, and linked to these premises with probability
The weighted probability is calculated as for distance and the predicted links compared to the true links.In order to be able to determine which farms may be linked, where movement data is not available, we investigate different link predictors. We concentrate on using distance between farms as a predictor, as well as farm size, and determine whether road distance is a better predictor for links.
The expected number of links was taken from the data and links simulated according to each predictor. The number of links that matched the true links between premises was recorded. The results are shown in table 1.
Table 1:Results from link predictor programmeRandom Euclidean
DistanceRoad Distance
Euclidean Distance + House
Road Distance + House
Proportion of correctly matched links
0.032 0.117 0.110 0.174 0.072
The best link predictor was “Euclidean Distance + House”. There was little difference between using road distance and Euclidean distance as predictors. This may be as a result of most movements being made between farms that are relatively close to one another (see Figure 5). Combining road distance with houses reduces the number of links that are correctly predicted. This occurs as the number of premises that can be visited with a given distance is greater when road distance is used as a predictor, thus reducing the chance of “choosing” the correct premises.
Figure 4 shows how close linked farms are to each other, compared to other farms. Using road distances, the closest few premises are visited the most often, but as with Euclidean distances, we still see links between premises that are a long distance apart, compared to other premises. There is no evidence from our analyses to suggest that road distance is a better measure of distance between premises than Euclidean distance.
Page 75 of 87 75

/tt/file_convert/5af3e5387f8b9a5b1e8bc71f/document.docx
Figure 4 Closeness of linked farms. For each farm, all other farms are ranked according to their Euclidean distance and Road distance around. The number of farms that are closer than the linked farm are then recorded.
Wessa, P. (2008), Free Statistics Software, Office for Research Development and Education, version 1.1.22-r4, URL http://www.wessa.net/
Page 76 of 87 76

/tt/file_convert/5af3e5387f8b9a5b1e8bc71f/document.docx
Appendix 7: Network structure: farms and slaughterhouses (Glasgow)
Introduction
There are two types of nodes in the poultry network: farms and slaughterhouses. There are two mechanisms that create connectivity among these nodes: farm-slaughterhouse connections arising from the transport of poultry from farms to slaughterhouses for slaughter, and direct farm-farm connections arising from the movement of catching company crews between farms. Slaughterhouses are highly connected nodes in this network and have the potential to facilitate the spread of disease between farms via farm-slaughterhouse-farm connections resulting from the movement of vehicles that transport poultry. However, the degree to which an empty vehicle traveling to a farm to collect poultry could transport disease is not clear (a network link in this case does not necessarily represent a pathogen transmission route). Conversely, the direct movement of catching crews between farms results in low order connectivity (a loosely connected network with no highly connected nodes), but still may have an important influence on the spread of disease because: 1) less time elapses between direct farm-farm visits relative to farm-slaughterhouse-farm connections (and likelihood of transmission may decay with time), and 2) there may be a higher chance of transport of infected material directly between bird houses via the boots and clothing of the catching crews. Until more is understood about the transmission routes and mechanisms of the pathogen it is difficult to gauge the relative importance of these two types of links that connect the network.
This work explores the farm-slaughterhouse aspect of the network. We investigate what farm and slaughterhouse characteristics might most strongly influence the structure of the network. Ultimately the goal is to estimate the structure of the poultry network (farms and slaughterhouses) resulting from the movement of people and vehicles associated with catching and processing birds, i.e. to develop models that can be used to establish probabilistic network links based on the properties of the farms and slaughterhouses, such that the networks we derive are more realistic than networks that are created by connecting nodes at random.
This work is based on three datasets. The UK farm database (GBPR) represents all premises in the country with more than 50 birds (N=24,163), ranging in size from fifty to hundreds of thousand birds. It is not known which slaughterhouses these farms use, hence the need to estimate these links. More detailed data that includes the slaughterhouses used by a farm exists for a subset of the GBPR dataset in the poultry network (PN) database. Finally, the location and characteristics of the approximately 100 slaughterhouses in the UK are contained in the PN dataset. Thus, we use the known network links in the PN database, the slaughterhouse characteristics in the PN database, and the farm characteristics in the GBPR database to identify rules that govern the structure of the poultry network.
It is important to note that because we know so little about how the pathogen is transmitted, other transmission mechanisms may be much more important in facilitating the spread of the vector than the movement of people and vehicles between farms. For instance, the movement of wild birds or, perhaps, aerosol transmission over short distances may be important routes of transmission. However, these mechanisms cannot be explicitly modeled because we know nothing about them. The purpose of this effort is to better understand the anthropogenic network links that could be subject to regulation in an emergency in an effort to control the spread of disease, in the same way that movement restrictions were vital in controlling the foot and mouth epidemic in 2001.
Slaughterhouse characteristics
The slaughterhouse attributes that we considered potentially useful for modeling connectivity were: 1) the geographic location (coordinates) of the slaughterhouse, 2) the number of birds the slaughterhouse processes each year, and 3) the types of birds that the slaughterhouse processes. The location was considered important because we hypothesized that farms would tend to use slaughterhouses that were closer to them, or not more than a one day drive from the farm. The size of the slaughterhouse is important because small slaughterhouses
Page 77 of 87 77

/tt/file_convert/5af3e5387f8b9a5b1e8bc71f/document.docx
are less likely to be associated with farms that produce large numbers of birds. The type of bird the slaughterhouse processes is an obvious restriction on whether a farm is associated with that slaughterhouse: a slaughterhouse that only processes chickens clearly cannot service a farm producing ducks.
Due to missing data in the slaughterhouse records, not all slaughterhouses could be included in this analysis. Of the 97 slaughterhouses in the PN database, only 59 (60.8%) had values for all three of the above attributes. A total of 52,286,069 birds (of all types) were slaughtered at these 59 slaughterhouses.
We consider two categorizations of birds that are processed by slaughterhouses: 1) groupings based on species (chicken, duck, goose, pheasant, turkey, etc), and 2) the same species groups but with chickens further subdivided into broilers, breeders, and layers. We henceforth refer to the first grouping as “bird species” and the second grouping as “bird types”.
Clear patterns in the types and numbers of birds processed by slaughterhouses exist. 86.4% of the slaughterhouses specialize on processing a single type of bird, 81.4% specialize on processing a single species (figures 1 and 2). It is useful to distinguish between “specialist slaughterhouses” (those that process only one type/species of bird) and “generalist slaughterhouses” (those that process more than one type/species of bird). Generalist slaughterhouses tend to process small numbers (mean=39340 ± 60946 s.d.) of birds relative to specialist slaughterhouses (mean =1052000 ± 1499662 s.d.) (figures 3 and 4). Within the set of specialist slaughterhouses, however, one further distinction can be observed: 42.3% of the specialist slaughterhouses process relatively small numbers (<200000) of birds (figure 5). Thus, there appears to be a trichotomy in the characteristics of slaughterhouses: 1) generalist slaughterhouses that process relatively small numbers of more than one bird species, 2) specialist slaughterhouses that process relatively small numbers of birds, and 3) specialist slaughterhouses that process large numbers of birds.
Farm/premises characteristics
The distribution of the number of poultry produced on the 24163 farms in the GBPR database is strongly right skewed (mean=11640 birds, max=1.84 million birds) (figure 6). The largest 10% of farms generate 83.5% of the 269 million poultry produced across all farms, and the smallest 50% of farms produce only 0.51% of this total. Most farms (76.8%) specialize on the production of a single poultry species (figure 7). Farms that specialize in single species production tend to produce larger numbers of poultry than the farms that produce more than one species.
Poultry farms are most concentrated in the southwest (Devon, Somerset and Dorset), the east (Norfolk and Suffolk) and the west of England (Herefordshire, Worcestershire, and Shropshire) (figure 8). Poultry farms occur in very low density in the north, especially Scotland, the west of Wales, and the west of Cornwall. This distribution has important implications for the use of the route network in predicting connectivity. In the areas where poultry farms are most concentrated, the relationship between straight-line distance and transport network distance or travel time is linear (see Appendix 4: Route network data), and straight-line distance is therefore likely to be an equally good predictor of connectivity. The relationship between straight-line distance and travel distance is non-linear in the more remote parts of the country (like Scotland) and in these areas travel distance/time could be a stronger predictor of farm-slaughterhouse connectivity than straight-line distance. However, poultry farms occur only in low densities in these areas. Based on the geographic distribution of poultry farms and these regional patterns in the relationship between straight-line versus travel distance, we do not anticipate that travel distance will improve our ability to model farm-slaughterhouse connections. This is particularly the case for the PN dataset, which is largely based in the high density poultry farm areas.
Associations between farms and slaughterhouses
Page 78 of 87 78
/tt/file_convert/5af3e5387f8b9a5b1e8bc71f/document.docx
Linking the farm and slaughterhouse records from the PN database with the farm records from the GBPR database yields a sample of 2198 farm-slaughterhouse links that can be used to create predictive models of farm-slaughterhouse connectivity. These records cannot be considered a random sample, but the extent to which they are representative of all farm-slaughterhouse links is not known and cannot be estimated from this dataset. A key direction for future data collection efforts would be to collect an unbiased sample of farm-slaughterhouse links.
There are two types of relationships that are useful for predicting farm-slaughterhouse links: deterministic and stochastic relationships. Deterministic relationships identify links that are known to exist, and identify links that are impossible. In either case deterministic relationships are highly desirable because they reduce the scope of the stochastic modelling problem. An example of a deterministic relationship is that farms that produce broilers can only send these birds to a slaughterhouse that processes broilers. Another example would be that a farm belonging to a large corporation always sends birds to that company’s slaughterhouse. Stochastic relationships identify farm-slaughterhouse links probabilistically. An example of this would be that farms tend to use slaughterhouses that are closer to them, according to some probability density function. The problem with network links that are generated from a stochastic model is that a different network is created each time that model is implemented, and this makes interpretation of epidemiological models based on those networks much harder. Over time we would hope to build up our deterministic understanding of the network, and limit our stochastic understanding of the network.
I assume that a reasonable deterministic rule to apply to this system is that farms can only have links with slaughterhouses that process the type of bird produced by that farm. There are two potential problems with this assumption. First, it implies we are able to characterize what types of birds are processed at each slaughterhouse. The second potential problem is that it assumes slaughterhouses cannot easily accommodate any type of bird, i.e. to what extent is specialization on a single or a few types of bird is a matter of convenience or efficiency rather than necessity?
One simple modelling framework would be to use case controlled logistic regression in a use versus non-use design. Each case would be the use (1) of a slaughterhouse by a farm, and the set of non-used alternatives (0) is all other slaughterhouses that process the type of bird. The independent variables would include the distance from the farm to each slaughterhouse (this could be entered as a quadratic to capture non-linearities), and some measure of the size of the slaughterhouse and farm. There is a positive correlation between the number of birds processed at a slaughterhouse and the number of birds produced at a farm that uses that slaughterhouse (figure 9), i.e. large farms tend to use large slaughterhouses. A simple way of including this relationship in this model framework would be to simply include the size of the slaughterhouse (number of birds processed). This is somewhat unsatisfactory as it fails to really capture the trend that large farms tend to use large slaughterhouses. An alternative framework would be to explicitly model supply (from farms) and capacity (of slaughterhouses) and identify an optimised distribution of resources (poultry) among slaughterhouses using a procedure such as simulated annealing, but this is beyond the scope of this project.
Unfortunately, these approaches are likely to be sensitive to missing data in the slaughterhouse database, which we currently estimate to be approximately 40%. Slaughterhouses are highly connected nodes in the poultry network and therefore have the potential to have a disproportionately pronounced influence over the spread of disease across the network. Missing data in the slaughterhouse database could have an important impact on disease models. There are currently two forms of missing data in the slaughterhouses: slaughterhouses that are completely absent from the database (the extent of this problem is unknown), and instances where a record of a slaughterhouse exists but where the coordinates are missing (21.3%) and the slaughterhouse cannot, therefore, be used in the network modelling.
There is also likely to be bias in the types of slaughterhouses that are missing or suffer from missing coordinates: very large slaughterhouses are more likely to be represented in the database, but partial or missing data is more likely for the smaller slaughterhouses (which
Page 79 of 87 79
/tt/file_convert/5af3e5387f8b9a5b1e8bc71f/document.docx
tend to process a greater number of species of birds). The possible implications of this are: 1) farm-farm connectivity via slaughterhouses is overestimated, 2) the catchment area of slaughterhouses is overestimated (and therefore the spatial extent of connected farms is overestimated).
Although the slaughterhouse data is not at a level that allows us to develop these models, I have generated a model of slaughterhouse use by farms that produce broiler chickens as a proof of the concept. I selected this type of poultry because it is one of the most common in the PN database and therefore yields a large sample that can be used to parameterise the model. Use was modelled as a function of distance, distance2, and the size of the slaughterhouse. The form of the logistic model is:
P= eβ0+β1 X 1+. ..+βnX n
1+eβ 0+β1 X1+. ..+β n Xn
Where X1 … Xn are the independent variables, and the β’s are the coefficients that are estimated using maximum likelihood (using Survival package in R).
Both distance and slaughterhouse size were significant predictors of the use of a slaughterhouse. The relative probability of use declines with distance (figure 10), and increases as a function of slaughterhouse size:
coef se(coef) pDistance -1.81e-02 9.80e-04 0.0000Distance2 8.70e-06 2.89e-06 0.0026Slaughterhouse size 2.99e-07 1.44e-08 0.0000
Priorities for future work: filling gaps in knowledge
Improving the slaughterhouse database should be a priority for future work as the slaughterhouses are highly connected nodes in the network and therefore have the potential to play an important role in disease transmission. The issues that need to be addressed are:
1. Missing entries: it is not clear what proportion of records are completely missing. Missing farms will likely have a negligible affect on the network, but missing slaughterhouses could have a profound influence on our estimates of connectivity.
2. Missing location data (coordinates), which prevent these records from being used in the models of connectivity that use distance as a predictor variable.
3. Accurate and complete information on the types and numbers of birds processed at each slaughterhouse.
4. There appears to be a mismatch in the numbers of birds produced and the numbers of birds slaughtered. Based on the GBPR data it appears that 269 million birds are produced per year, but the slaughterhouse data we currently have only accounts for approximately 52 million birds. This may simply be a mismatch in the time scale over which production is measured. But it may indicate that large numbers of birds are disposed of in other ways, which may have implications for disease transmission.
5. We know that some of the large producers own their own slaughterhouses and the links between these farms and other farms may be relatively independent and exclusive. If these exclusive corporate relationships can be identified in the databases then we are able to i) establish these network links deterministically rather than stochastically, and ii) it simplifies the estimation of other network links by excluding these farms and slaughterhouses from consideration. A framework for collecting information on these corporate links and recording them in a useful format in the database should be developed.
Because the slaughterhouses are the most highly connected nodes in the network, targeting them would be an efficient means of collecting large amounts of data about the network.
Page 80 of 87 80

/tt/file_convert/5af3e5387f8b9a5b1e8bc71f/document.docx
There are only about one hundred slaughterhouses, and obtaining high quality information from them would be more likely to yield important information about the poultry network than targeting a sample of the 20,000+ poultry farms, which is a labour intensive process.
Another issue that needs to be addressed is the sample of network links that we use to develop the network models. Currently this comes from a single catching company and it is not clear to what extent this is representative of the entire industry. From the farm-slaughterhouse perspective, an attempt to acquire a random sample of farm-slaughterhouse links is not unrealistic, especially if this data can be acquired from the slaughterhouses in considerable volumes.
Further information on how different types of bird species are handled is also required. Do all bird species/types go to slaughter? The PN database does not cover all bird types, so we are currently limited to developing models for the most common bird types. Do small farms slaughter their own birds? Currently it appears that we known much about the large poultry producers, but little about the smaller farms.
Page 81 of 87 81

/tt/file_convert/5af3e5387f8b9a5b1e8bc71f/document.docx
Figures 1 & 2. Frequency distribution of number of species (top) or types (bottom) of poultry processed at slaughterhouses. Most slaughterhouses specialize on a single species/type.
Page 82 of 87 82

/tt/file_convert/5af3e5387f8b9a5b1e8bc71f/document.docx
Figures 3 & 4. Numbers of birds processed at a slaughterhouse in relation to the numbers of bird species (top) or types (bottom) processed. Specialist slaughterhouses tend to process larger numbers of poultry than the generalist slaughterhouses.
Page 83 of 87 83

/tt/file_convert/5af3e5387f8b9a5b1e8bc71f/document.docx
Figure 5. Frequency distribution of the numbers of birds processed at the ‘specialist’ slaughterhouses.
Figure 6. The distribution of the number of poultry produced per farm on the 24163 farms in the GBPR database.
Page 84 of 87 84

/tt/file_convert/5af3e5387f8b9a5b1e8bc71f/document.docx
.
Figure 7. The number of poultry species produced at each farm. The majority of farms specialize on the production of a single species.
Page 85 of 87 85

/tt/file_convert/5af3e5387f8b9a5b1e8bc71f/document.docx
Figure 8. Density of poultry farms (farms/km2) in the UK.
Page 86 of 87 86

/tt/file_convert/5af3e5387f8b9a5b1e8bc71f/document.docx
Figure 9. The relationship between the size of the slaughterhouse and the size of the farm that uses that slaughterhouse. The straight line is fitted using simple linear regression.
Figure 10. Relative probability of slaughterhouse use by a farm as a function of the distance between the farm and slaughterhouse, for broiler chickens.
Page 87 of 87 87