Embed Size (px)
Citation preview

1
Audio Engineering Project Report By Joe Bard c3218366
Contents 1.0 Project Overview p2 2.0 Tests, Results and Analysis p2
2.1 Frequency Response p2
2.2 Signal-to-Noise Ratio (SNR) and Dynamic Range p4
2.3 Total Harmonic Distortion (THD) p6
2.4 Total Harmonic Distortion + Noise (THD+N) p8
2.5 Intermodulation Distortion (IMD) p8
2.6 Reverberation p9
2.7 Transient and Delayed Resonance Colourations p13
2.8 Crossover p14
2.9 Realistic Imaging and Critical Listening p15
3.0 Evaluation p16 4.0 Appendices List p17
5.0 Bibliography p18 6.0 Appendices p19
2
1.0 Project Overview This report will analyse and evaluate the critical listening effectiveness of the Genelec Bi-amplified 1029a active studio monitors in the Newcastle-under-Lyme College Music Technology studio control room. Please view the project proposal for the reasons that I decided to conduct the following tests and appendix A) Test Explanations for how the tests were performed in detail. My proposal stated that I would perform tests that would require a fixed volume level at 70dB SPL A-weighted. However, upon reflection, research and feedback from my tutor, I decided to increase this to 78dB SPL A-weighted. The European Broadcasting Union states in their paper on Listening Conditions for the Assessment of Sound Programme Material that “the loudspeaker gains should be adjusted to achieve a reference listening level of 96 – 18 = 78 dB Sound Pressure Level” (European Broadcasting Union, 2004. p.4)
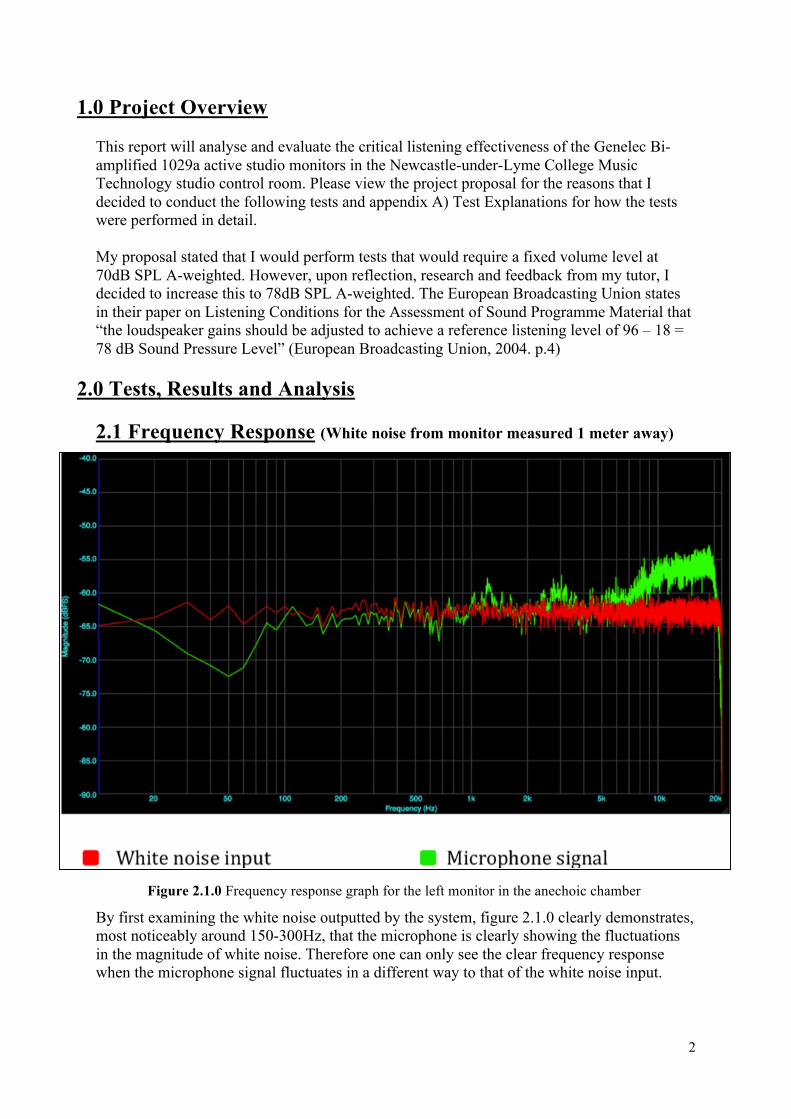
2.0 Tests, Results and Analysis 2.1 Frequency Response (White noise from monitor measured 1 meter away)
By first examining the white noise outputted by the system, figure 2.1.0 clearly demonstrates, most noticeably around 150-300Hz, that the microphone is clearly showing the fluctuations in the magnitude of white noise. Therefore one can only see the clear frequency response when the microphone signal fluctuates in a different way to that of the white noise input.
Figure 2.1.0 Frequency response graph for the left monitor in the anechoic chamber
er

3
There is a definite bass end roll off at 110Hz and the port resonant frequency is at 70-80Hz. A natural bass roll off is what many critics like about the sealed cabinet Yamaha NS-10s monitors which you can see from their frequency response (see appendix B). However, with the Genelec 1029a monitors, after the port bass boost, the slope of the roll off increases creating an unnatural sounding bottom end but with more overall energy. This is not shown on the specification sheet provided by Genelec (see appendix C). It is important to note that the the sub-bass response of the small anechoic chamber is limited by the cut-off frequency of 68Hz. Therefore, any information to the left of this is external noise such as traffic rumble or air con circulation. At the critical frequency range of the upper frequencies of the content of recorded speech, between 1 and 5kHz, the white noise fluctuates ± 6.6dBFS and the microphone fluctuates ± 8.9dBFS. Assuming the microphone is electrically transparent with regards to frequency, which it is not, this gives a deviation of ±2.3dB SPL in the monitor over this bandwidth. This is within the 2.5dB specifications provided by Genelec (see appendix C). There is a definite high frequency boost over 7kHz which, at its peak at 18.7kHz, is 7.9dB greater in amplitude to that of the white noise. This is definitely the characteristic of the speaker as this is supported by the test performed in Leeds Metropolitan University Studio in figure 2.1.1
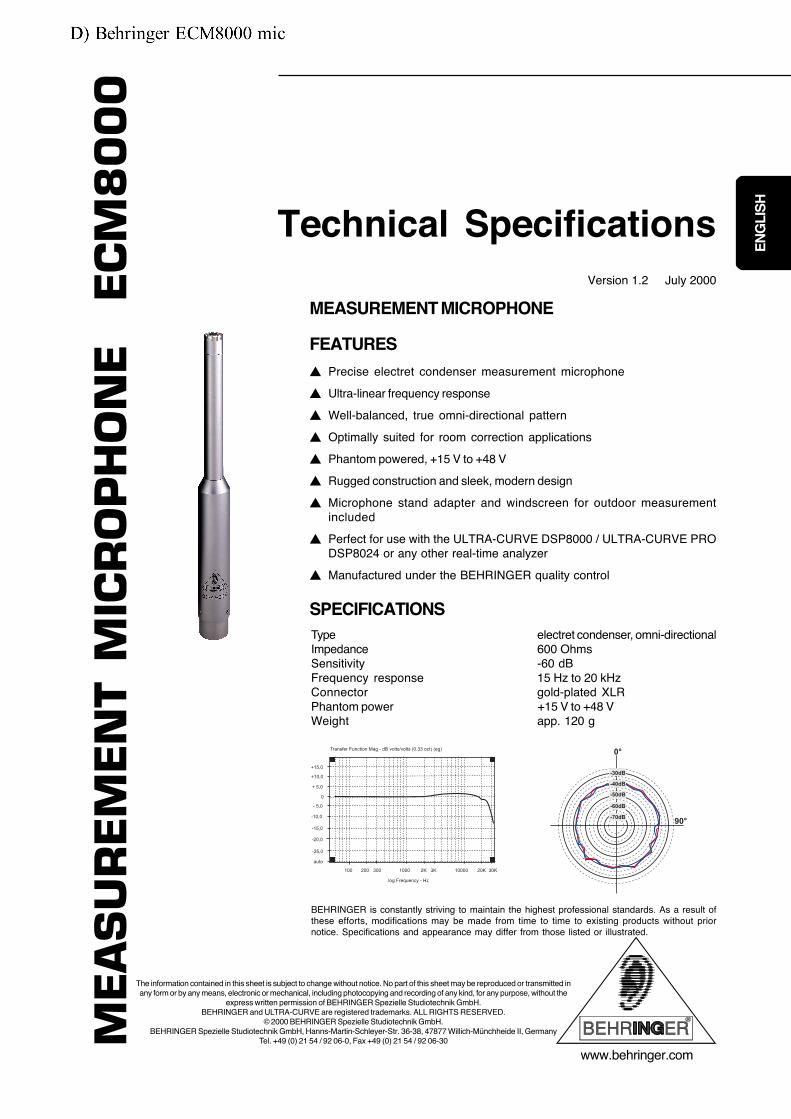
The Behringer ECM8000 microphone has a flat response until a gradual 2dB boost between 2 and 20kHz (see appendix D). This can explain a general subtle boost over the high frequencies but certainly not as much as the 7.9dB boost at 18.7kHz. This higher frequency
Figure 2.1.1 Frequency response graph for the left monitor in the Leeds Metropolitan University Studio. (Performed using an AKG C451 microphone)
er

4
boost is not stated by Genelec technical specifications (see appendix C) but it is supported by Robjohns in the 1997 Sound On Sound review of these monitors who states “I found the -2dB treble tilt a more acceptable balance for my tastes” (Sound On Sound, 1997). This leads me to believe that this high frequency boost is more accurate than the frequency response stated by stated by Genelec. 2.2 Signal-to-Noise Ratio (SNR) and Dynamic Range (Noise floor of space and of speaker and pink noise at maximum volume all measured) 10cm on-axis 1m on axis Dynamic
Range Headroom SNR Dynamic
Range Headroom SNR
Position in figure 2.2.1
(A) (B) (C) (D) (E) (F)
Anechoic Chamber
81 32.7 48.3 74.6 16.4 58.2
Leeds Metropolitan University Studio
77.8 34.7 43.1 67.3 18.6 48.7
Newcastle-under-Lyme College Studio
77 32.2 44.8 66.7 19.5 47.2
Figure 2.2.0 The dynamic range, headroom and SNR for the left monitor in the 3 spaces listed all measured in dB
Figure 2.2.1 Where the values from figure 2.2.0 should be placed in an easier to comprehend the data in a graphical manor
er

5
Note that all dB measurements in this section are stated across the whole 20Hz-20kHz Bandwidth using A-weighted filters at the distance stated, on axis. The anechoic chamber gives the monitors the highest readings of dynamic range and SNR as the noise floor is much quieter, however the loudest signal is actually slightly higher in the studios due to the acoustical energy the reverb provides. These anechoic results are similar to that of a free field. Genelec does not state the dynamic range or SNR of the system in the technical specifications (see appendix C), however it does state: “Self generated noise level in free field @ 1m on axis: < 10 dB (A-weighted)” “Maximum long term RMS acoustic output…(limited by driver unit protection circuit):@ 1m > 98 dB SPL” (Genelec, 2003) This allows the dynamic range to be calculated as being >88dB at 1m. From my results this is actually 74.6dB at 1m. I agree that the maximum output could be approximately > 98dB at 1m as in the anechoic chamber, I measured 94.4dB. However, the self generated noise is not realistic of that of my measurements which are always slightly above the noise floor of the space that I was measuring the monitor in. To approximate the actual noise floor of the monitors I used the following equation:
Anechoic Chamber Leeds Metropolitan
University Studio Newcastle-under-Lyme College Studio
Noise floor of space 19.2 29.2 30.5 Noise floor of monitor and space
19.8 29.3 30.8
Noise floor of monitor
10.9 12.9 19.0
The noise floor of the monitor in the anechoic chamber is similar to that stated by Genelec. Using this figure, the dynamic range can be quoted as 83.5dB at 1m which is still not as high as what Genelc quoted but is certainly closer. However, this is not as meaningful as the dynamic ranges quoted in figure 2.2.0 as the monitors are always going to be used in a studio type space. In the Newcastle-under-Lyme College studio, the dynamic range of 66.7dB is more than enough to accurately present any genre listed in the Suggested Minimum Dynamic Range (see appendix E) table stated by the Pleasurise Music Foundation who’s aim is to increase the dynamic range on almost all genres of music. This is also true when considering the SNR at 47.2dB and the monitors also allow for 19.5dB of headroom, which is ample for allowing uncompressed peaks to be well presented to the listener. In conclusion, the dynamic range, SNR and headroom could be similar to that stated by Genelec provided the <10dB self generated noise, which is realistic, is true. These figures give a very good indication that these speakers are fit for their purpose in the studio with regards to volume.
dBSpeaker Noise = 10log (10 - 10 ) dBOn 10
dBOff 10
Figure 2.2.2 The noise floor of the space, monitor and space and their subtraction to find the noise floor. All measured in dB at 1m from monitor on axis.
er

6
2.3 Total Harmonic Distortion (THD) (1kHz sine wave)
Please appendix F) for the mathematics I used to extrapolate the THD figures below from the raw results from similar graphs as 2.3.0 and 2.3.1 but for the data obtained from the Leeds Metropolitan University studio.
Figure 2.3.0 1kHz Sine wave sent of Mbox interface and looped back to input
Figure 2.3.1 1kHz Sine wave sent of left monitor in anechoic chamber and mic response plotted

7
THD of Interface: 0.0006516% 5th-order, +4dBu, 1kHz THD of Left Monitor: 0.2648% 5th-order, 78dB SPL A-weighted at 1m, 1kHz Note that the left monitor figure does not include the THD apparent in the preamp or mic. This figure is less than I was expecting as speaker/amp can often generate THD between 1 and 10%. Therefore, I checked the THD reading that I took during my preliminary results in the Leeds Metropolitan University studio; interface: 0.0008027%, left monitor: 0.2211%. The Interface THD should be identical however, the difference could be caused by me not testing exactly the same interface both times as when taking out the equipment from the help desk, I did not note serial numbers of the interfaces I used each time. The difference in the THD figures for the monitors could be due to the slightly different pre-amp gains applied for each result or possibly from acoustical reflections in the studio. These differences are very marginal and this leads me to the conclusion that this THD figure for the left monitor is accurate. Genelec do not quote a THD figure for the monitor, only for the amplifier section that is not useful in drawing any conclusions. However, my results show that the monitor does have low THD in comparison to what would be expected from such a system and therefore this give a good indication that these speakers are fit for their purpose in the studio with regards to unwanted harmonic distortion which presents the listener with this distortion which would make the musical signal sound more muddy/cloudy.
Figure 2.4.0 Before and after the 1kHz signal has been heavily attenuated using an 80dB graphic EQ filter
8
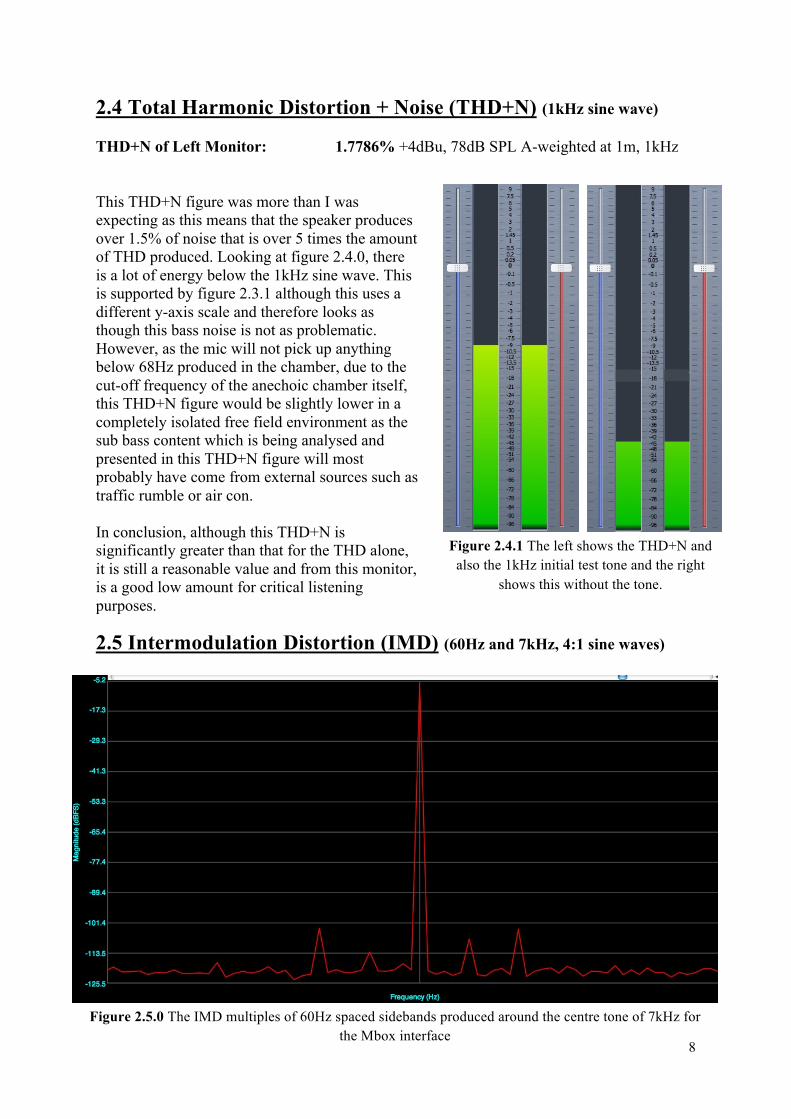
2.4 Total Harmonic Distortion + Noise (THD+N) (1kHz sine wave) THD+N of Left Monitor: 1.7786% +4dBu, 78dB SPL A-weighted at 1m, 1kHz This THD+N figure was more than I was expecting as this means that the speaker produces over 1.5% of noise that is over 5 times the amount of THD produced. Looking at figure 2.4.0, there is a lot of energy below the 1kHz sine wave. This is supported by figure 2.3.1 although this uses a different y-axis scale and therefore looks as though this bass noise is not as problematic. However, as the mic will not pick up anything below 68Hz produced in the chamber, due to the cut-off frequency of the anechoic chamber itself, this THD+N figure would be slightly lower in a completely isolated free field environment as the sub bass content which is being analysed and presented in this THD+N figure will most probably have come from external sources such as traffic rumble or air con. In conclusion, although this THD+N is significantly greater than that for the THD alone, it is still a reasonable value and from this monitor, is a good low amount for critical listening purposes.
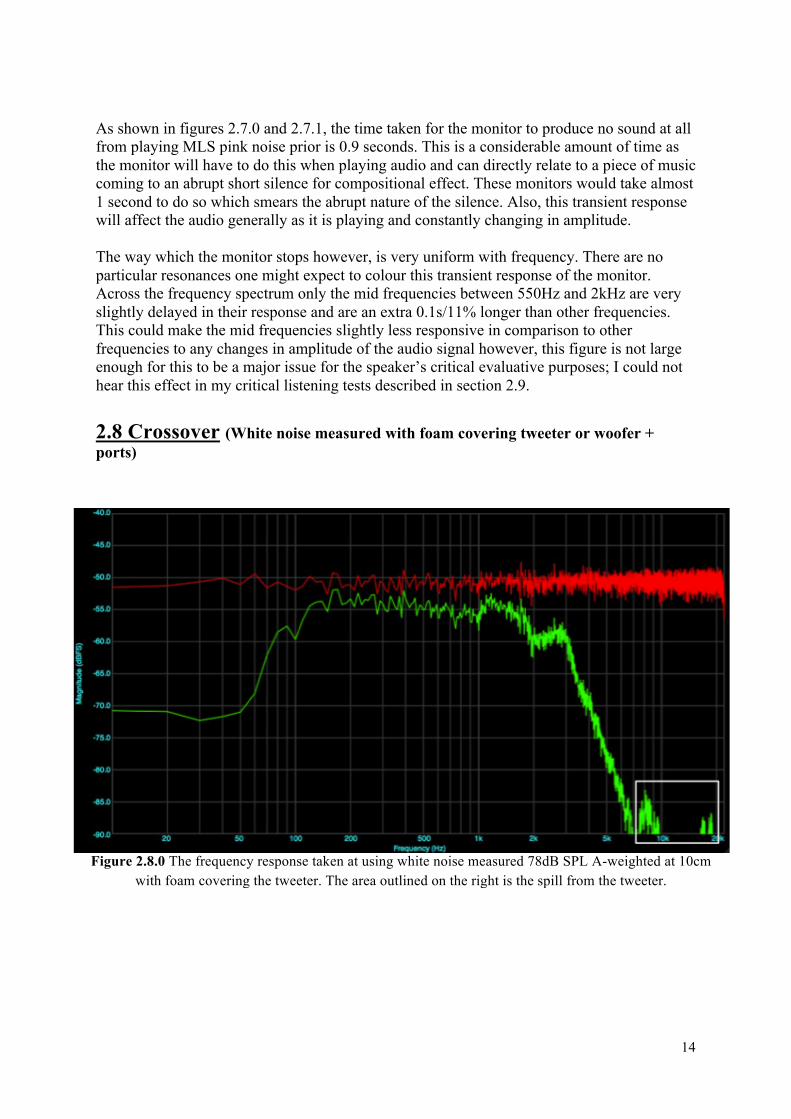
2.5 Intermodulation Distortion (IMD) (60Hz and 7kHz, 4:1 sine waves)
Figure 2.5.0 The IMD multiples of 60Hz spaced sidebands produced around the centre tone of 7kHz for the Mbox interface
Figure 2.4.1 The left shows the THD+N and also the 1kHz initial test tone and the right
shows this without the tone.

9
IMD of Interface: 0.002158% 60Hz/7kHz, 4:1, +4 dBu IMD of Left Monitor: 0.3346% 60Hz/7kHz, 4:1, + 4 dBu, 78dB SPL A-weighted at
1m Note that the left monitor figure does not include the IMD apparent in the preamp or mic.
The IMD of the left monitor is more than the THD and as IMD is perceived as being harsher and completely unwanted as it does not follow any harmonic, musical sounding pattern. However, this 0.3346% is still very low. Fryer, in his listening tests for intermodulation distortion, states that “2% - 4% distortion detectable in piano music, 5% in other types of test signals” (Fryer, 1979, quoted in Jones, 2007). As the IMD presented to the listener is to be 6 times less than this minimum perceivable IMD, this brings me to the conclusion that the IMD of the monitors is to have a minimal if any effect on the effectiveness of the monitors for use of critically listening to audio in the studio. 2.6 Reverberation (MLS pink interrupted noise in college studio)
Figure 2.5.0 The IMD multiples of 60Hz spaced sidebands produced around the centre tone of 7kHz for the left monitor
Figure 2.6.0 125Hz octave band pass filtered MLS pink noise from left monitor in the Newcastle-under-Lyme College studio. It is left to settle to a steady level and then interrupted to measure the T20 reverb time

10
The reverberation times were more complex to obtain using the method described in appendix A) than I had previously thought. The principle of recording the decay of MLS noise and analysing this decay in a wave-editing program seems straightforward but I encountered some problems with this as outlined below. Once the noise had been interrupted it should fall to a linear decay time once it had been reduced by 5dB. One should measure the T20 time between -5dB and -25dB drop from the original SPL however, as I am not measuring SPL but a drop in dBV of the audio file in Wavelab I decided that this would be very hard to achieve any degree of accuracy in as the time at which the sound decays by 5dB and -25dB would be very hard locate on the x axis. Instead, as the decay is of a linear nature, this meant that I could measure the time taken for a drop of 20dB anywhere on the x-axis between the -5dB and the noise floor in the y-axis. As can be seen from figure 2.6.0, the pseudo-random noise fluctuates in amplitude quite considerably. However, the decay of this is does follow a linear pattern and so I took my T20 readings where the start and end points were obviously between 5dB and the noise floor as shown in figure 2.6.1
125Hz 250Hz 500Hz 1kHz 2kHz 4kHz Position 1 T20 98ms 64ms 59ms 34ms 38ms 47ms Position 2 T20 86ms 65ms 62ms 33ms 35ms 50ms Average T20 92ms 64.5ms 60.5ms 33.5ms 36.5ms 48.5ms Scaled RT60 276ms 193.5ms 181.5ms 100.5ms 109.5ms 145.5ms
I initially tried to obtain T30 results from within Wavelab which worked well for the lower frequencies with more energy due to the MLS noise being pink filtered but for the higher frequency bands, this meant that the 30dB drop let the readings fall in to the noise floor. Therefore, I used T20 measurements; Figure 2.6.2 shows this. I decided to perform 2
Figure 2.6.1 The same signal as described in figure 2.6.0. The decay follows a linear pattern as shown and the T20 is measured of a 20dB drop in an obvious linear decay point at the end of the audio file
Figure 2.6.2 The various T20 times measured at 2 different source/mic combinations, averaged and converted to the RT60 times above

11
measurements in different source/mic combinations to conform to the British Standards Institution BS 3323-1 (British Standards Institution, 2009) survey specifications. Figure 2.6.3 shows the specifications for the reverb times of one of the Leeds Metropolitan University Booths. My measured reverb times for the Newcastle-under-Lyme College studio control room are much lower than is described by Alton Everest. Figure 2.6.3 shows the specifications for the reverb times of one of the Leeds Metropolitan University booth control rooms which is actually not that dissimilar to that of my results for the Newcastle-under-Lyme College studio. The college reverb times are higher than the universities in the lower and upper mid and treble frequencies whilst being almost identical at 1kHz. This leads me to believe that my results are accurate and that the RT60 specifications when building the college studio were not as low as that of the university studio. This is supported by the fact that the college studio cost approximately £100,000 to build and the university booth would have cost above £150,000. The higher lower mid reverb time at 125Hz is something, which may make audio sound boomy, muddy or smeared in comparison to the other frequencies. This higher reverb time towards the bass end of the frequency spectrum is normal within studio control room environments and is would not be problematic for the purposes of critical listening in this space. “According to the Master Handbook of Acoustics by F. Alton Everest, the ideal reverb time for a typical control room is about 400-500 milliseconds.” (Alton Everest, 2009, quoted in Winer, 2004). However, the EBU Tech 3276 states that “nominal reverberation time, Tm, should lie in the range: 0.2 < Tm < 0.4 s” (European Broadcasting Union, 2004. p.6). This should follow figure 2.6.4.
Figure 2.6.3 The specifications for the reverb times of the Leeds Metropolitan University Blue Booth control room in seconds
Figure 2.6.4 The EDU Tech 3276 specifications for the reverb times of a space for the assessment of multi-channel audio.

12
Comparing my results (figure 2.6.5) with the EDU Tech 3276 (figure 2.6.4), the college reverb times follow a similar pattern in the bass end but rise above 2kHz. All of the reverb is substantially lower than the EDU Tech (0.2 < Tm < 0.) specifications as the Tm of the college is 0.168. In conclusion, the reverb time of the college control room is appropriate if not somewhat lower than the ideal time quoted from Alton Everest and from the EDU Tech specifications. This will provide a good analytical space to critically evaluate audio and possibly could help the students at the college understand how if they compensate for this by adding reverb to their mixes, they could sound much too cloudy/muddy in more reverberant space.
125 250 500 1000 2000 4000 0
0.01
0.02
0.03
0.04
0.05
0.06
0.07
0.08
0.09
0.1
Tim
e / s
Frequency / Hz
Reverb Times in the College Studio
Figure 2.6.5 Reverb time graph plotted from results in figure 2.6.2

13
2.7 Transient and Delayed Resonance Colourations (MLS pink interrupted noise in anechoic chamber)
Figure 2.7.0 A waterfall plot from above showing the transient response of the left monitor in the anechoic chamber
Figure 2.7.1 A waterfall plot from the side showing the transient response of the left monitor in the anechoic chamber
14
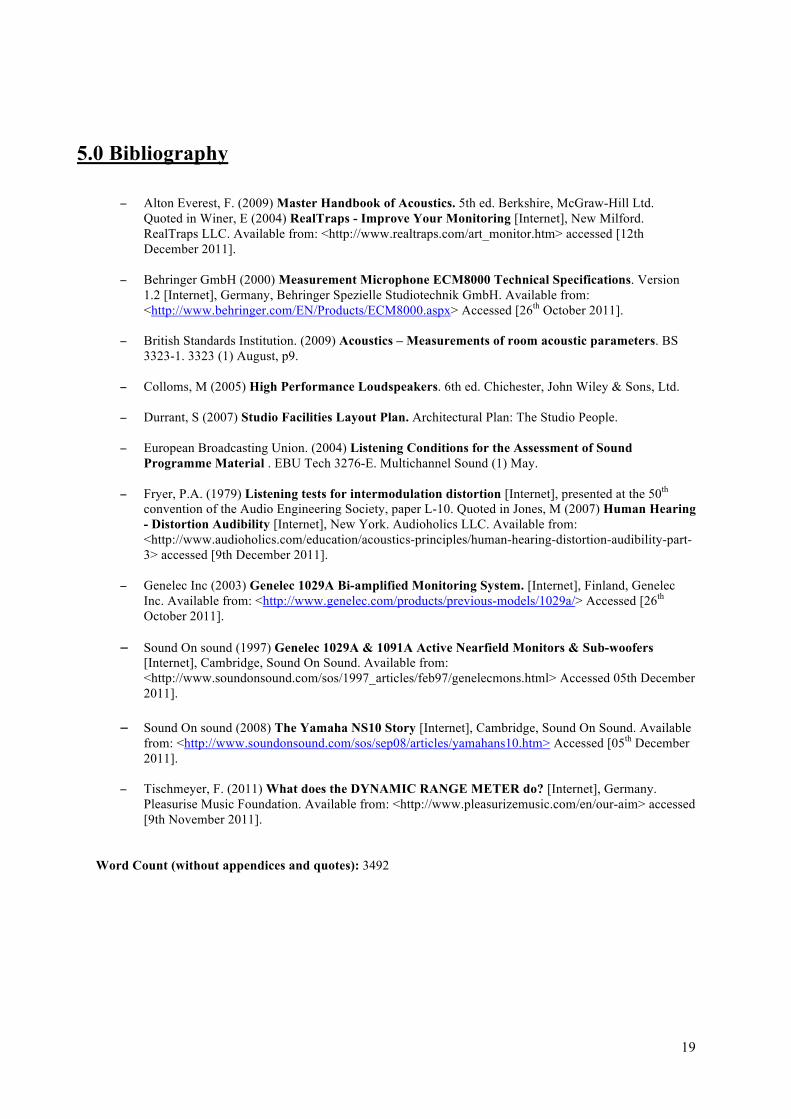
As shown in figures 2.7.0 and 2.7.1, the time taken for the monitor to produce no sound at all from playing MLS pink noise prior is 0.9 seconds. This is a considerable amount of time as the monitor will have to do this when playing audio and can directly relate to a piece of music coming to an abrupt short silence for compositional effect. These monitors would take almost 1 second to do so which smears the abrupt nature of the silence. Also, this transient response will affect the audio generally as it is playing and constantly changing in amplitude. The way which the monitor stops however, is very uniform with frequency. There are no particular resonances one might expect to colour this transient response of the monitor. Across the frequency spectrum only the mid frequencies between 550Hz and 2kHz are very slightly delayed in their response and are an extra 0.1s/11% longer than other frequencies. This could make the mid frequencies slightly less responsive in comparison to other frequencies to any changes in amplitude of the audio signal however, this figure is not large enough for this to be a major issue for the speaker’s critical evaluative purposes; I could not hear this effect in my critical listening tests described in section 2.9. 2.8 Crossover (White noise measured with foam covering tweeter or woofer + ports)
Figure 2.8.0 The frequency response taken at using white noise measured 78dB SPL A-weighted at 10cm with foam covering the tweeter. The area outlined on the right is the spill from the tweeter.

15
Figure 2.8.2 shows the frequency response information for port drivers around the cross over frequency. The white lines of best fit I have drawn show the roll of slopes defined by the active crossover section of the monitor. By marking this crossover point on the diagram and referring this back to the original, more accurate results in Electroacoustic Toolbox, I have been able to find out that this crossover frequency is at 3.1kHz. The accuracy of this result is determined by the accuracy of the crossover slopes which is detailed below but figure 2.8.2 shows that the pink noise fluctuation could mean that this crossover frequency is around ±0.15Hz. Genelec states the crossover frequency to be 3.3kHz. This figure does not seem realistic for the monitor in its current state. However, these monitors are 7 years old and whilst the component degradation of the crossover components would not effect the fourth-
Figure 2.8.1 The frequency response taken at using white noise measured 78dB SPL A-weighted at 10cm with foam covering the woofer and ports. The area outlined on the left is the spill from the woofer and ports.
Figure 2.4.0 THD+N Test: Before and after the 1kHz signal has been heavily attenuated using an 80dB graphic EQ filter
Figure 2.8.2 The woofer and port response (figure 2.8.0) and tweeter frequency response (figure 2.8.1) overlay to show the crossover information

16
order slope due to the order simply being controlled by the number of resister/capacitors in series (and so will never deviate from 6dB, 12dB, 18dB or 24dB), it could definitely effect the crossover frequency. This, coupled with the quality of the components of the crossover, mainly with respect to tolerances, will have altered this crossover frequency. The white lines of best fit in figure 2.8.2 also give the crossover slope values shown below: Woofer slope: 23 dB/octave ±3dB Tweeter slope: 22 dB/octave ±3dB The Genelec technical specifications (see appendix 3) state “Crossover acoustical slopes: 24–32 dB/octave” (Genelec, 2003). This slope is changed by the tone control switches but with these left as default both the low-pass and high-pass cross over frequencies should be 24dB. Although my results differ from this slightly, as can bee seen by figure 2.8.2, the white noise input from the interface, plotted in red, varies in amplitude and this gives accuracy limitations of the results. This has a ±3dB fluctuation in the frequency response producing a ±3dB error bar on my crossover slopes. Therefore, the cross over values from my results are accurate enough to state that the slopes stated by Genelec are a reasonable figure but my results are not precise enough to evaluate how precise this figure is. 2.9 Realistic Imaging and Critical Listening (Critically analysing the monitors in the college studio control room) As stated in the initial findings presentation, I decided to change the test tracks I was using to critically analyse using the monitors to discuss a wider range of aspects of their fidelity. I measured all of the tracks at approximately 78dB A-weighted at listening position in the college studio at the most compressed and loudest part of the track unless stated otherwise. Angel by Massive Attack (44.1kHz 16bit .flac) This track has a very low sub bas and bass line spanning right down to 20Hz (shown in figure 2.9.0) and slightly later very dry panned percussion hits during the intro. The 1029a monitors managed to audibly reproduce more of the sub bass response in the college studio than in the anechoic chamber however, frequencies lower than around 100Hz sounded very unnatural and inaccurate. This was worsened by very excessive port turbulence which was not tolerable above around 70dB SPL A-weighted at listening position. This volume of the port turbulence shifted between the 2 monitors and therefore tended to miss-present this bass coming from the centre of the stereo image. Comparing the Genelec’s to a pair of bigger Dynaudio BM5A similarly priced monitors, the bass seemed much more convincing from the Dynaudio’s and although the port turbulence was still audible, it was quieter due to the port being on the rear and at a slightly lower frequency. The 1029a’s did not produce enough THD or IMD that would allow me to audibly pick these distortions out on this track. Are You In? by Incubus (44.1kHz 16bit .wav) This track has a long subtle intro with lots of dynamic drum rolls and synth style effect that are placed at specific points in the stereo image. The monitors did a very good job of
Figure 2.9.0 Angel by Massive Attack bass and sub bass content in intro

17
presenting this stereo image and for the repeated tom rolls, I could pick out very fine 2D spaces where the dry tom rolls had been placed with regards to their frequency content and stereo positioning. “While the practice of stereo recording remains poorly understood and stereo production in the home is simply an approximation to the clear transmission of two independent signal channels to the listener, it is permissible to ask whether a more critical discussion of stereo imaging is worthwhile.” (Colloms, 2005. P.490) Colloms makes a good point here about the tolerance of the public with regard to poor stereo imaging. I would agree for a lot of systems, stereo imaging does not need to be of utmost importance. However, the use of these monitors in a studio means that they will be used to evaluate important stereo mix discussions and therefore the good stereo imaging of the monitors is a great characteristic that adds to their ability to reprocess high-fidelity audio for critical listening purposes. After the intro a very high in the mix low note punchy bass line is introduced. The monitors did a very good job of presenting all notes of the bass line at an almost equal volume. This is both a good quality of the monitors and also of the studio reducing standing waves. The method of not using parallel walls in the design specifications of the studio is show in appendix G). The bass however, did not extend down to the fundamental of all of the notes but was accurate enough to ensure all notes sounded fairly convincing. The vocals sat slightly further back into the mix behind the snare hits but more noticeable was the dry backing vocals that were panned hard left and right which were presented as coming from in front of the speakers rather than from them. This seemed to be the case with the mix as a whole as normally the reverberant synth tracks would be presented to the listener from much further behind the line of the monitors than the 1029a’s could reveal. The subtle synth parts played underneath the prominent bass line were dynamically well presented and the headroom allowed for the transient peaks of the kick and other drums to enforce enough impact even from the commercially compressed mix. Although I felt that the trebles over 7kH were highly presented in the mix, I preferred this sound over that with the -2dB treble tilt activated as preferred by Robjohns and it also felt more natural in the space I was listening in.
3.0 Evaluation
My results are very useful in evaluating the critical listening capability of the monitors. However, these results cannot be used without understanding their limits. Although for some tests, I performed them in 3 different spaces, I did not perform them more than once in each. For enhanced accuracy, it would have been better to perform each test numerous times and then to average the results. All of my results in Electroacoustic Toolbox used an averaged result of 10 to slow the data presented on the graph, if I had more time, I would have used a higher average value to smoothen out the fluctuating amplitude of the different types of noise; this would have particularly worked well to obtain more accurate crossover slope and frequency data. My results, research and conclusions in sections 2.1-2.9 show that the Genelc 1029a monitors are capable of reproducing hi-fidelity audio in the Newcastle-under-Lyme College studio control room for the purposes of critical listening. Their adequately large SNR and dynamic range, low THD, THD+N and IMD figures and fairly low but almost uniform in frequency content transient and delayed resonance colourations provide a good sound reproduction system for the studio. Whilst the reverberation of the control room is not uniform with frequency, the bass end of the spectrum is not as problematic as over that measured above 1kHz. Although this does not pose a particularly major problem, this could cloud ones ability

18
to make critical judgments about mix levels and especially reverb levels in the high mid and low treble reverb areas. The lack of bass extension even with the dual ported design could be a problem for critical listening. Robjohns in his review of the monitors in Sound on Sound states: “These diminutive speakers pack a mighty wallop, offering stunning sound quality of truly professional calibre. The matching sub-woofer is, however, an essential part of the package.” (Sound On Sound, 1997). Although I have not heard the system with the matching subwoofer, I would have to agree that the bass extension of these monitors would not be sufficient especially on genres that rely heavily upon this area of the spectrum.
4.0 Appendices
A) Test Explanations
B) Yamaha NS10 Frequency Response
C) Genelec 1029A Technical Specifications
D) Behringer ECM8000 mic
E) Suggested Minimum Dynamic Range
F) THD Mathematics
G) TSP-NULC Layout Plan
19
5.0 Bibliography
! Alton Everest, F. (2009) Master Handbook of Acoustics. 5th ed. Berkshire, McGraw-Hill Ltd. Quoted in Winer, E (2004) RealTraps - Improve Your Monitoring [Internet], New Milford. RealTraps LLC. Available from: <http://www.realtraps.com/art_monitor.htm> accessed [12th December 2011].
! Behringer GmbH (2000) Measurement Microphone ECM8000 Technical Specifications. Version 1.2 [Internet], Germany, Behringer Spezielle Studiotechnik GmbH. Available from: <http://www.behringer.com/EN/Products/ECM8000.aspx> Accessed [26th October 2011].
! British Standards Institution. (2009) Acoustics – Measurements of room acoustic parameters. BS
3323-1. 3323 (1) August, p9.
! Colloms, M (2005) High Performance Loudspeakers. 6th ed. Chichester, John Wiley & Sons, Ltd.
! Durrant, S (2007) Studio Facilities Layout Plan. Architectural Plan: The Studio People.
! European Broadcasting Union. (2004) Listening Conditions for the Assessment of Sound Programme Material . EBU Tech 3276-E. Multichannel Sound (1) May.
! Fryer, P.A. (1979) Listening tests for intermodulation distortion [Internet], presented at the 50th
convention of the Audio Engineering Society, paper L-10. Quoted in Jones, M (2007) Human Hearing - Distortion Audibility [Internet], New York. Audioholics LLC. Available from: <http://www.audioholics.com/education/acoustics-principles/human-hearing-distortion-audibility-part-3> accessed [9th December 2011].
! Genelec Inc (2003) Genelec 1029A Bi-amplified Monitoring System. [Internet], Finland, Genelec
Inc. Available from: <http://www.genelec.com/products/previous-models/1029a/> Accessed [26th October 2011].
! Sound On sound (1997) Genelec 1029A & 1091A Active Nearfield Monitors & Sub-woofers
[Internet], Cambridge, Sound On Sound. Available from: <http://www.soundonsound.com/sos/1997_articles/feb97/genelecmons.html> Accessed 05th December 2011].
! Sound On sound (2008) The Yamaha NS10 Story [Internet], Cambridge, Sound On Sound. Available
from: <http://www.soundonsound.com/sos/sep08/articles/yamahans10.htm> Accessed [05th December 2011].
! Tischmeyer, F. (2011) What does the DYNAMIC RANGE METER do? [Internet], Germany.
Pleasurise Music Foundation. Available from: <http://www.pleasurizemusic.com/en/our-aim> accessed [9th November 2011].
Word Count (without appendices and quotes): 3492

Test Explanations !!"#$%&'()**
• "#$%&&'!()*+!,-.$*/&#$&01*)$!2&&-%&3!• 4.+/)56./!,7"8999!• :.5.-.$!;9<=#!"&5)*&/1!• ">?0@)&!A#1*/#$'!B5*./C#$.!• <!-&56!DE!2FG!H#$'!*&!,B2I,F!1#J.!&/!KLF!• ;!1+&/*!DE!2FG!H#$'!*&!DE!2FG!H#$'!• GML!J.*./!ISO-TECH SLM-1352A or Norsonic Type 118!• Meter ruler!
*+,'"#'(-.*/'0%1(0'**
• DE!H#$'!&0*N0*!*&!)5N0*!;!• ")$!;J.*./!#(#O!P!#@Q01*!R+)*.!5&)1.!1)65#-!1&!*+#*!J.*./!/.#@1!S8@4!
GML!#!(.)6+*.@!T)5N0*!<U!!• AA2!?5#-O1./!P!.510/.!)5N0*1!#/.!$&//.$*!#5@!@)1N-#O!%#/1!)@.5*)$#-!• M./C&/J!/.#@)56!&V./!#NN/&3)J#*.-O!;91.$&5@1!• F.N.#*!C&/!F)6+*!1N.#'./W!
!23/*4(5*6.(4&$-*/4(7'**
• ".#10/.!5&)1.!C-&&/!()*+!GML!J.*./!• X1.!-&(!1.**)561!&5!N)5'!5&)1.!1)6!6.5!#5@!C0--!6#)5!&5!J&5)*&/!P!
J.#10/.!S8@4!GML!#*!;J.*./!#(#O!!!• 7-)$'!&CC!1)6!6.5!#5@!J.#10/.!-&(.1*!5&)1.!#*!;9$J!#(#O!#5@!;J!01)56!
GML!J.*./!• G)65#-!TC&/!GYFU!)1!S8@%!• 7/#5'!*+.!1O1*.J!0N!*&!C0--!V&-0J.!#5@!J.#10/.!GML!#*!;9$J!#5@!;J!
F.N.#*!C&/!/)6+*!1N.#'./!*
896**
• G.*!0N!1N.#'./!#5@!J)$!;J!#(#OW*• G)6!6.5!;'!1)5.!(#V.!TJ01*!%.!Z[@40!#*!1)6!1.5U!#5@!J.#10/.!S8@4!
GML!#*!;J!#(#O*• DE!H#$'!&0*N0*!*&!)5N0*!;!*• X1.!AA2!6/#N+!C&/!%&*+!)5N0*1!P!$+.$'!)5N0*1!#5@!1$#-.1!#/.!)@.5*)$#-*• F.N.#*!C&/!/)6+*!1N.#'./!#5@!C&/!;9$J*
*?C*./(#/@1!>!#@@!0N!#--!&C!*+.!+#/J&5)$!1N)'.1!#5@!01.!*+)1!#1!#!/#*)&!&C!*+.!)5)*)#-!;'!1N)'.W!!
!***

!"#$%$&'()*$$
• !"#"$%&$'()"&#*(+",-*"&'-%&./0#12&*"+(*,&.(-3,.&/3%(&4*(5((1.&&
67%"*8$*,.&9&-."&"3(-:;&:*$#;/+&<=.&/3&1(:/+&%(&$%%"3-$%"&%;"&>?&%(&'"1(8&%;"&3(/."&71((*@&'(-3+"&$3,&1($,&/3%(&8$)"1$'&%(&:"%&$3&!AB&*"$,/3:C&D."&0$%;"0$%/+.&%(&7/3,&%;"&/3/%/$1&>?&$0#1/%-,"C&E/3,&%;"&*$%/(&(7&%;"&5FGHI&%(&%;"&/3/%/$1&>?&.#/?"&-./3:&&,J&*$%/(&"K-$%/(3C&$+,#$$
• B"%&-#&.#"$?"*&$3,&0/+&>0&$8$2&$• Signal gen 60Hz at 100% amplitude and 7kHz at 25% amplitude $3,&
0"$.-*"&LM,J&6N8"/:;%",&$%&>0&7(*&*"7"*"3+"&9&$1%"*/3:&0(3/%(*&:$/3$• OP&Q$+?&(-%#-%&%(&/3#-%&>&$• D."&EE5&:*$#;&7(*&'(%;&/3#-%.&9&+;"+?&/3#-%.&$3,&.+$1".&$*"&/,"3%/+$1$• !"+(*,$• !"#"$%&7(*&*/:;%&.#"$?"*&$
$67%"*8$*,.&R&$,,&-#&$11&(7&%;"&RAG&.#/?".&$3,&-."&%;/.&$.&$&*$%/(&(7&%;"&/3/%/$1&.#/?".&&-*.*/0$$&
• B"%&-#&>&.#"$?"*&/3&(3"&;$17&(7&*((0&• S-#-%&ATB&7/1%"*",&#/3?&3(/."&8/%;&'$3,&#$..&7/1%"*&(3&$%&+;(."3&7*"K&
$%&>UMV&+"3%.&7*(0&./:&:"3&/3%(&.#"$?"*&.(&%;$%&$%&0/+&#(./%/(3&%;"&B4T&/.&MV,J&6N8"/:;%",&
• B"%&-#&%;"&0/+&.(&%;$%&/%&/.&*(-:;12&>&0"%"*&$8$2&7$+/3:&%;"&.#"$?"*&• !"+(*,&%;"&0/+&(-%#-%&/3%(&4*(5((1.&• A$?"&%;"&#/3?&ATB&3(/."&7/1%"*&3(/."&.(-3,&7(*&*(-:;12&U."+.C&• B%(#&*"+(*,/3:&$7%"*&3(&*")"*'C&• !"#"$%&7(*&3"W%&7*"K-"3+2&'$3,&• A()"&%;"&0/+&$3,&.#"$?"*&%(&$3(%;"*&#$*%&(7&%;"&*((0&.%/11&*(-:;12&>0&
$8$2&$3,&*"#"$%&7(*&$11&7*"K-"3+/".&X>UV@&UVY@&VYY@&>?@&U?@&Z?[&&67%"*&%".%&9&/0#(*%&%;/.&./:3$1&/3%(&8$)"1$'&$3,&0"$.-*"&%;"&%/0"&/%&%((?&7(*&%;"&.(-3,&%(&,"+$2&'2&\Y,'&%(&:/)"&5\YC&5;/.&8/11&:/)"&%8(&5\Y%/0".&9&$)"*$:"&%;"."&-./3:&,J&0$%;.&$3,&"W%*$#(1$%"&%(&!5N]Y&%/0".&
&!/12)(*23$-*)4'2)*$$
• OP&Q$+?&(-%#-%&%(&/3#-%&>&• A/+&>0"%"*&$8$2&9&$,^-.%&ATB&#/3?&3(/."&./:3$1&.(&%;$%&0"%"*&*"$,.&
LM,J&XR3#-%&U[&• D."&%;"&B#"+%*(:*$0&&• B%$*%&7(*&$##*(W/0$%"12&U&."+(3,.&$3,&.%(#&%;"&ATB&%(&:"%&,"+$2&
:*$#;C&

• !"#"$%&'()&!*+,%&-#"$.")&
!&
"#$%%$&'#!&
• -"%&/#&0#"$.")&$12&3*4&(1&$5*0&46(0"&#)(5*3*%7&%(&8(('")&9&4(:")*1+&
%8""%")&8*%,&'($3!• ;<&=$4.&(/%#/%&%(&*1#/%&>&&!• Signal gen white noise $12&3"$0/)"&?@2A&$%&>3&'()&)"'")"14"&9&$6%")*1+&
3(1*%()&+$*1&B*4&*1#/%&C!• !"4()2&
• !"#"$%&'()&%8""%")&$12&)*+,%&0#"$.")D&&
&
(')*+%,+-!./)0+10!)12!"#+,+-)*!3+%,'1+10!!!
• -"%&/#&BAE&(/%#/%&%(&F"&(/%&('&/1*%&$12&2*04/00&2"#%,&$12&8*2%,&/0*1+&
G1+"6&F7&B$00*:"&G%%$4.H&G)"&I(/&J1K&F7&J14/F/0&$12&LMNO6(4.&F7&P)"$3&Q,"$%)"D!
&&
&
&


Genelec 1029ABi-amplified Monitoring System
Data Sheet1029A
1029A_DA.IND 1 27.1.2003, 12:57:06
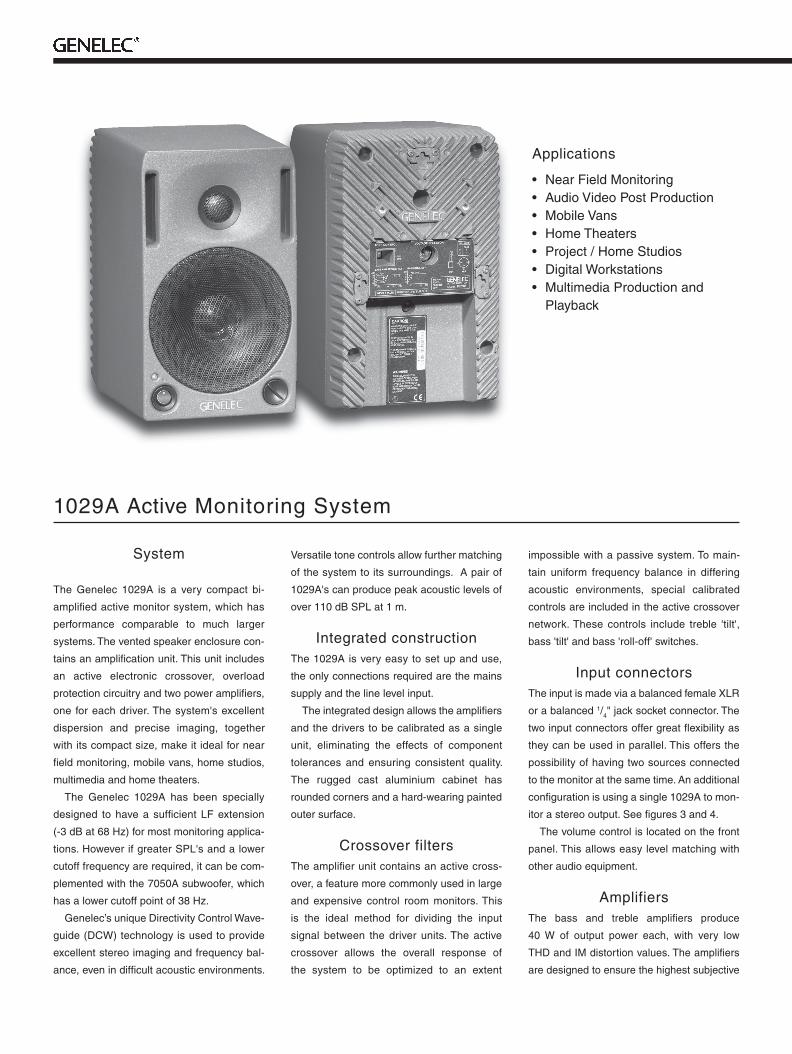
1029A Active Monitoring System
System
The Genelec 1029A is a very com pact bi-
amplifi ed active monitor system, which has
performance comparable to much larger
sys tems. The vented speaker en clo sure con-
tains an am pli fi ca tion unit. This unit includes
an active electronic crossover, over load
protection circuitry and two power amplifi ers,
one for each driver. The system's excellent
dis per sion and precise imaging, to geth er
with its compact size, make it ideal for near
fi eld mon i tor ing, mobile vans, home studios,
multimedia and home theaters.
The Genelec 1029A has been spe cial ly
designed to have a suffi cient LF extension
(-3 dB at 68 Hz) for most monitoring applica-
tions. However if greater SPL's and a lower
cutoff frequency are re quired, it can be com-
plemented with the 7050A subwoofer, which
has a lower cutoff point of 38 Hz.
Genelec’s unique Directivity Con trol Wave-
guide (DCW) tech nol o gy is used to provide
excellent ster eo imaging and frequency bal-
ance, even in diffi cult acoustic en vi ron ments.
Versatile tone con trols al low further matching
of the system to its surroundings. A pair of
1029A's can produce peak acoustic levels of
over 110 dB SPL at 1 m.
Integrated constructionThe 1029A is very easy to set up and use,
the only con nec tions re quired are the mains
supply and the line level input.
The integrated design allows the am pli fi ers
and the drivers to be cal i brat ed as a single
unit, elim i nat ing the effects of com po nent
tolerances and en sur ing con sist ent quality.
The rugged cast alu min i um cabinet has
round ed cor ners and a hard-wear ing paint ed
outer surface.
Crossover filtersThe amplifi er unit contains an ac tive cross-
over, a feature more com mon ly used in large
and ex pen sive control room monitors. This
is the ideal method for di vid ing the input
signal between the driver units. The active
crossover allows the overall response of
the system to be optimized to an ex tent
im pos si ble with a passive system. To main-
tain uniform fre quen cy bal ance in differing
acous tic en vi ron ments, special calibrated
controls are included in the active crossover
network. These con trols include treble 'tilt',
bass 'tilt' and bass 'roll-off' switch es.
Input connectorsThe input is made via a balanced female XLR
or a balanced 1/4" jack socket connector. The
two input connectors offer great fl exibility as
they can be used in parallel. This offers the
possibility of hav ing two sources connected
to the monitor at the same time. An additional
confi guration is using a single 1029A to mon-
itor a stereo output. See fi gures 3 and 4.
The volume control is located on the front
panel. This allows easy level matching with
other audio equipment.
AmplifiersThe bass and treble amplifi ers produce
40 W of output power each, with very low
THD and IM distortion values. The amplifi ers
are designed to ensure the high est subjective
Applications
• Near Field Monitoring• Audio Video Post Pro duc tion• Mobile Vans• Home Theaters• Project / Home Studios• Digital Workstations• Multimedia Production and Playback
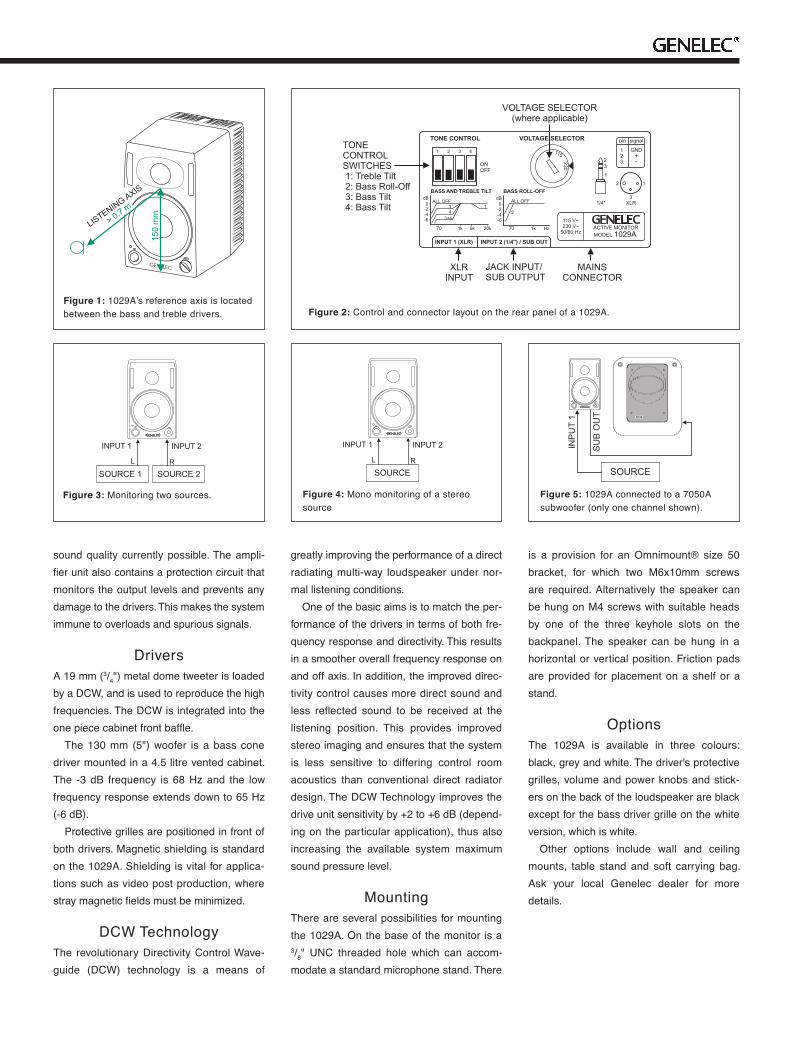
Figure 1: 1029A’s reference axis is located between the bass and treble drivers. Figure 2: Control and connector layout on the rear panel of a 1029A.
sound quality cur rent ly possible. The ampli-fi er unit also contains a protection cir cuit that monitors the output levels and prevents any damage to the driv ers. This makes the system im mune to overloads and spu ri ous signals.
DriversA 19 mm (3/4") metal dome tweeter is loaded by a DCW, and is used to reproduce the high fre quen cies. The DCW is integrated into the one piece cabinet front baffl e.
The 130 mm (5") woofer is a bass cone driver mounted in a 4.5 litre vented cabinet. The -3 dB fre quen cy is 68 Hz and the low fre quen cy response extends down to 65 Hz (-6 dB).
Protective grilles are positioned in front of both drivers. Magnetic shielding is standard on the 1029A. Shielding is vital for applica-tions such as video post production, where stray mag net ic fi elds must be minimized.
DCW TechnologyThe revolutionary Directivity Con trol Wave-guide (DCW) tech nol o gy is a means of
greatly improving the performance of a direct ra di at ing multi-way loudspeaker un der nor- mal listening conditions.
One of the basic aims is to match the per-formance of the drivers in terms of both fre-quency re sponse and directivity. This results in a smoother overall frequency re sponse on and off axis. In ad di tion, the improved direc-tivity control causes more direct sound and less refl ected sound to be re ceived at the listening position. This provides improved stereo imaging and ensures that the sys tem is less sensitive to differing control room acoustics than con ven tion al direct radiator design. The DCW Technology improves the drive unit sensitivity by +2 to +6 dB (depend-ing on the par tic u lar application), thus also in creas ing the available system maximum sound pressure level.
MountingThere are several pos si bil i ties for mounting the 1029A. On the base of the monitor is a 3/8" UNC thread ed hole which can ac com -mo date a standard mi cro phone stand. There
is a provision for an Om n i mount® size 50 bracket, for which two M6x10mm screws are re quired. Al ter na tive ly the speak er can be hung on M4 screws with suitable heads by one of the three key hole slots on the backpanel. The speaker can be hung in a hor i zon tal or vertical position. Fric tion pads are pro vid ed for place ment on a shelf or a stand.
OptionsThe 1029A is available in three colours: black, grey and white. The driver's protective grilles, volume and power knobs and stick-ers on the back of the loud speak er are black except for the bass driver grille on the white version, which is white.
Oth er op tions in clude wall and ceiling mounts, ta ble stand and soft car ry ing bag. Ask your local Genelec dealer for more details.
Figure 3: Monitoring two sources. Figure 4: Mono monitoring of a stereo source
Figure 5: 1029A connected to a 7050A subwoofer (only one channel shown).
1029A_DA.IND 3 27.1.2003, 12:57:15

Figure 6: The curve above shows the effect of the ‘treble tilt’, ‘bass tilt’ and ‘bass roll-off ’ controls on the free field response.
Figure 7: The curve group shows the horizontal directivity characteristics of the 1029A in its vertical configuration measured at 1m. The lower curve shows the systems power response.
Bass amplifier output power with an 8 Ohm load: 40 W
Treble amplifier output power with an 8 Ohm load: 40 W
Long term output power is limited by driver unit protection circuitry.
Amplifier system distortion at nominal output: THD < 0.08% SMPTE-IM < 0.08% CCIF-IM < 0.08% DIM 100 < 0.08%
Signal to Noise ratio, referred to full output: Bass > 90 dB Treble > 90 dB
Mains voltage: 100/200, 115/230 or 230 V according to region
Voltage operating range: ±10%
Power consumption: Idle 9 VA Full output 80 VA
Lower cut-off frequency, –3 dB: < 68 Hz
Upper cut-off frequency, –3 dB: > 20 kHz
Free field frequency response of system: 70 Hz –18 kHz (± 2.5 dB)
Maximum short term sine wave acoustic output on axisin half space, averaged from 100 Hz to 3 kHz: @ 1m > 100 dB SPL @ 0.5m > 106 dB SPL
Maximum long term RMS acoustic output in same conditions with IEC weighted noise (limited by driver unit protection circuit): @ 1m > 98 dB SPL @ 0.5m > 104 dB SPL
Maximum peak acoustic output per pair on top of console, @ 1 m from the engineer with music material: > 110 dB
Self generated noise level in free field @ 1m on axis: < 10 dB (A-weighted)
Harmonic distortion at 85 dB SPL @ 1m on axis: Freq: 75…150 Hz < 3% > 150 Hz < 1%
Drivers: Bass 130 mm (5") cone Treble 19 mm (3/4") metal dome Both drivers are magnetically shielded
Weight: 5.7 kg (12.5 lb)
Dimensions: Height 247 mm (93/4") Width 151 mm (515/16") Depth 191 mm (71/2")
Inputs: Input 1: XLR female, balanced 10 kOhm Input 2: 1/4 " Jack socket, balanced 10 kOhm Input level for 100 dB SPL output at 1 m: -6 dBu at volume control max
Volume control range: >70 dB relative to max output
Subsonic filter below 68 Hz : 18 dB/octave
7050A/1091A Subwoofer output (input 2) at 100db SPL: –23 dBu into 33kOhm load
Ultrasonic filter above 25 kHz: 12 dB/octave
Crossover frequency, Bass/Treble: 3.3 kHz
Crossover acoustical slopes: 24–32 dB/octave
Treble tilt control operating range: 0 to –2 dB @ 15 kHz
Bass roll-off control operating in a –6 dB step @ 85 Hz (to be used in conjunction with 7050A or 1091A subwoofer)
Bass tilt control operating range in –2 dB steps: 0 to –6 dB @ 150 Hz
The ‘CAL’ position is with all tone controls set to ‘off ’ and the input sensitivity control to maximum (fully clockwise).
AMPLIFIER SECTIONCROSSOVER SECTIONSYSTEM SPECIFICATIONS
International enquiries: Genelec Oy, Olvitie 5FIN-74100, Iisalmi, FinlandPhone +358 17 83 881Fax +358 17 812 267Email [email protected]
In the U.S. please contact Genelec Inc., 7 Tech CircleNatick, MA 01760Phone +1 508 652 0900Fax +1 508 652 0909Email [email protected]
www.genelec.com
Genelec Document BBA29001a. Copyright Genelec Oy 1.2003. All data subject to change without prior notice
1029A Data Sheet
1029A_DA.IND 4 27.1.2003, 12:57:16
Technical Specifications
The information contained in this sheet is subject to change without notice. No part of this sheet may be reproduced or transmitted inany form or by any means, electronic or mechanical, including photocopying and recording of any kind, for any purpose, without the
express written permission of BEHRINGER Spezielle Studiotechnik GmbH.BEHRINGER and ULTRA-CURVE are registered trademarks. ALL RIGHTS RESERVED.
© 2000 BEHRINGER Spezielle Studiotechnik GmbH.BEHRINGER Spezielle Studiotechnik GmbH, Hanns-Martin-Schleyer-Str. 36-38, 47877 Willich-Münchheide II, Germany
Tel. +49 (0) 21 54 / 92 06-0, Fax +49 (0) 21 54 / 92 06-30
Type electret condenser, omni-directionalImpedance 600 OhmsSensitivity -60 dBFrequency response 15 Hz to 20 kHzConnector gold-plated XLRPhantom power +15 V to +48 VWeight app. 120 g
BEHRINGER is constantly striving to maintain the highest professional standards. As a result ofthese efforts, modifications may be made from time to time to existing products without priornotice. Specifications and appearance may differ from those listed or illustrated.
MEASUREMENT MICROPHONE
FEATURES! Precise electret condenser measurement microphone! Ultra-linear frequency response! Well-balanced, true omni-directional pattern! Optimally suited for room correction applications! Phantom powered, +15 V to +48 V! Rugged construction and sleek, modern design! Microphone stand adapter and windscreen for outdoor measurement
included! Perfect for use with the ULTRA-CURVE DSP8000 / ULTRA-CURVE PRO
DSP8024 or any other real-time analyzer! Manufactured under the BEHRINGER quality control
SPECIFICATIONS
!"#$%&"!"'()!*+&,-.,'"))"+!/000
www.behringer.com
ENGL
ISH
Version 1.2 July 2000

Note: “(The Dynamic Range Number) is the average cumulative difference between peak and loudness
(RMS) over a specific period of time (duration of a song or album) and is a whole number value given
in decibels. Just the top 20% of the loudness are taken into consideration to ensure that songs with a
long intro and over compressed refrain doesn´t appear with a too high DR value. The DR value
represents the grade of compression of released music in an easy to understand and standardised
whole number system.” (Tischmeyer, 2011)
!