Embed Size (px)
Citation preview
Project REAL Rural Early Adolescent Learning
Social and Academic Interventions for Rural Schools
National Rural Education Association Kansas City, Missouri
October 23
Allen MurrayDirector of Intervention Services
Victoria A. SchaeferResearch Assistant & Intervention Consultant
National Research Center on Rural Education Support
University of North Carolina at Chapel Hill
Overview of Rural Education
• Of America’s almost 50 million public school students, 30% attend rural schools.
• Despite their large number, rural schools and students from rural areas have not received the attention that urban and suburban schools have.
• Yet, rural schools do face challenges – and struggle to meet the needs of their students just as other schools do.
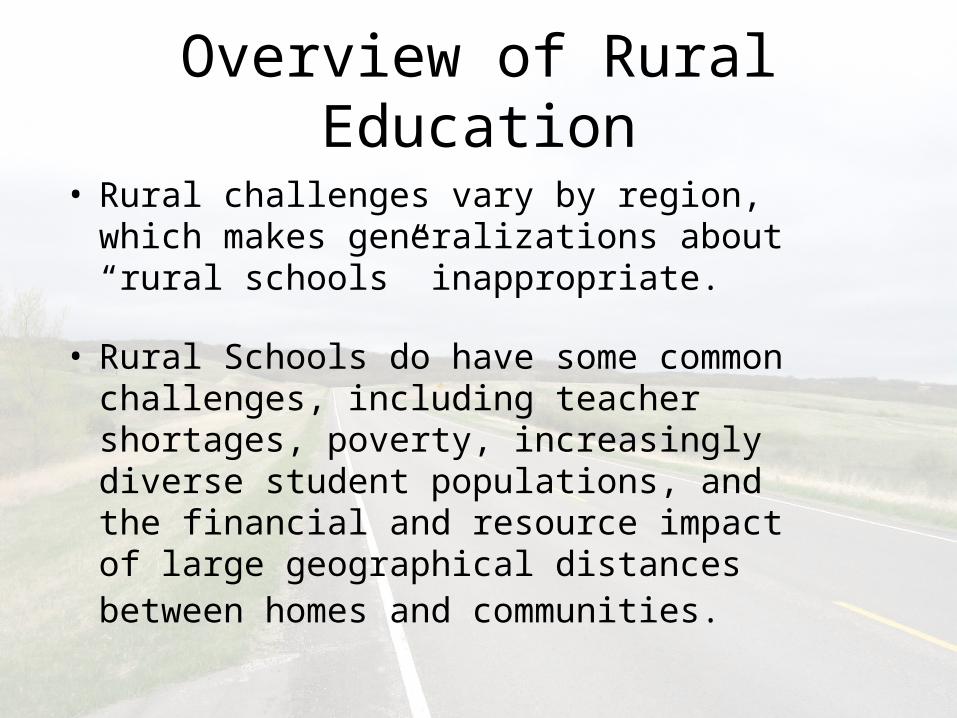
• Rural challenges vary by region, which makes generalizations about “rural schools” inappropriate.
• Rural Schools do have some common challenges, including teacher shortages, poverty, increasingly diverse student populations, and the financial and resource impact of large geographical distances between homes and communities.
Overview of Rural Education
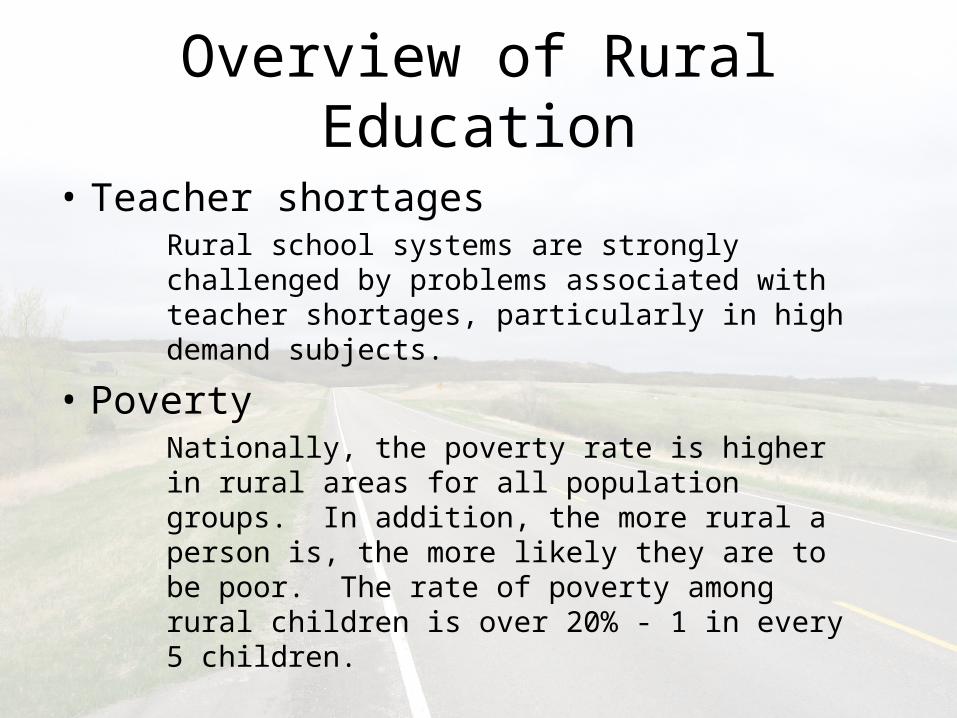
• Teacher shortages Rural school systems are strongly challenged by problems associated with teacher shortages, particularly in high demand subjects.
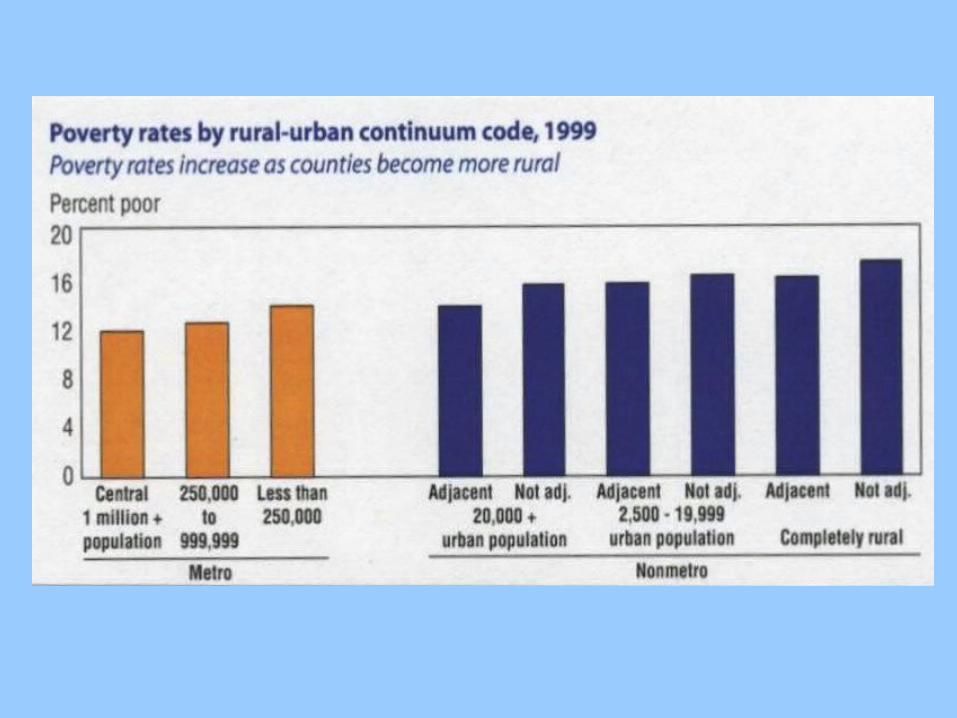
• PovertyNationally, the poverty rate is higher in rural areas for all population groups. In addition, the more rural a person is, the more likely they are to be poor. The rate of poverty among rural children is over 20% - 1 in every 5 children.
Overview of Rural Education
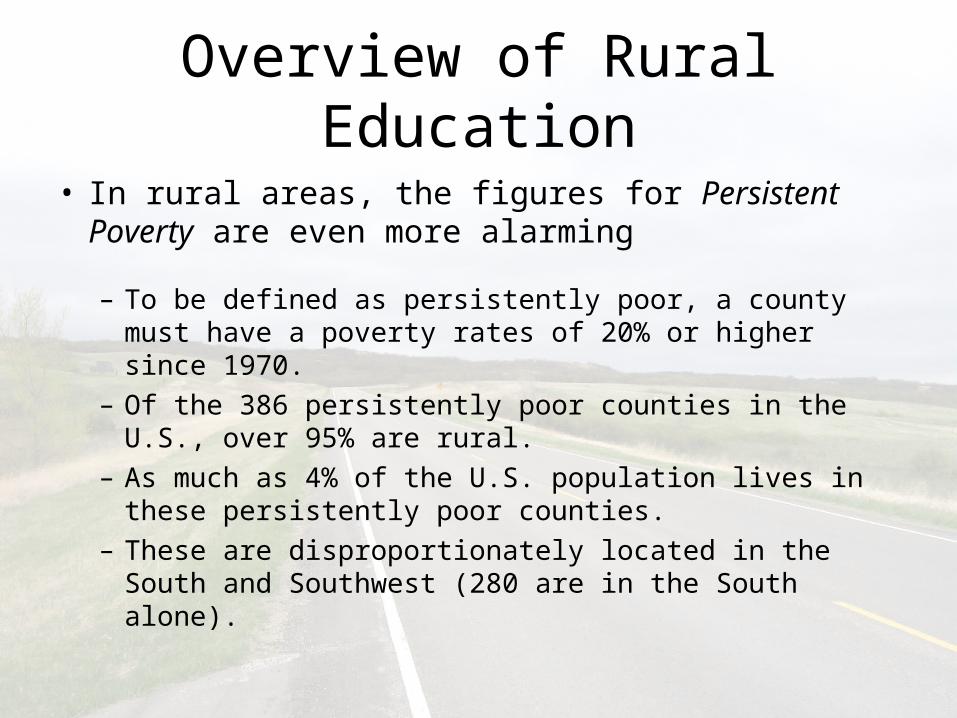
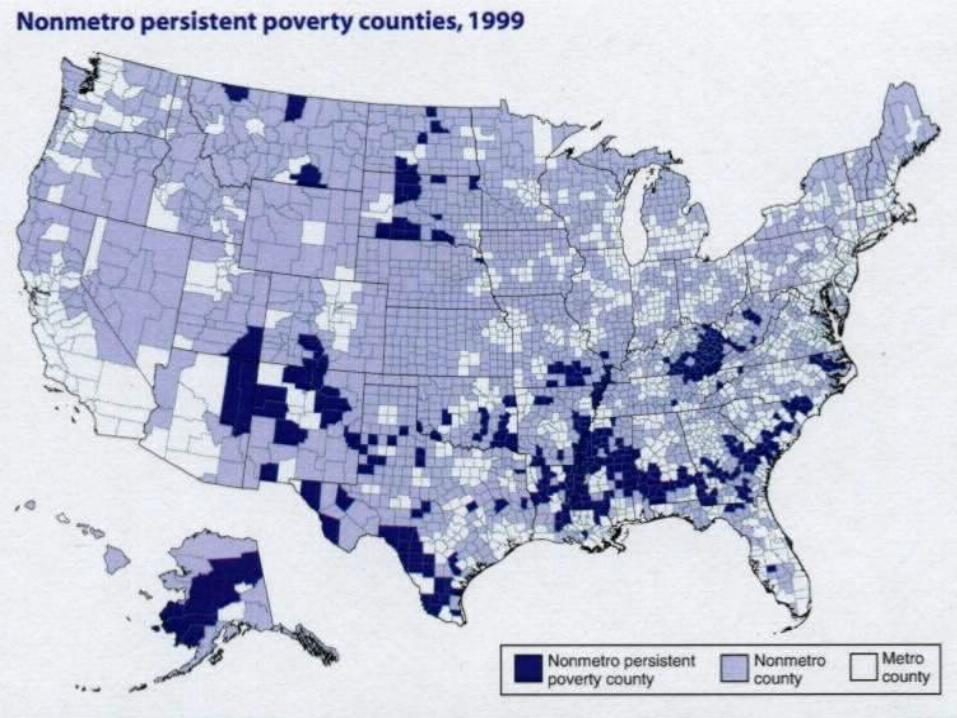
• In rural areas, the figures for Persistent Poverty are even more alarming
– To be defined as persistently poor, a county must have a poverty rates of 20% or higher since 1970.
– Of the 386 persistently poor counties in the U.S., over 95% are rural.
– As much as 4% of the U.S. population lives in these persistently poor counties.
– These are disproportionately located in the South and Southwest (280 are in the South alone).
Overview of Rural Education
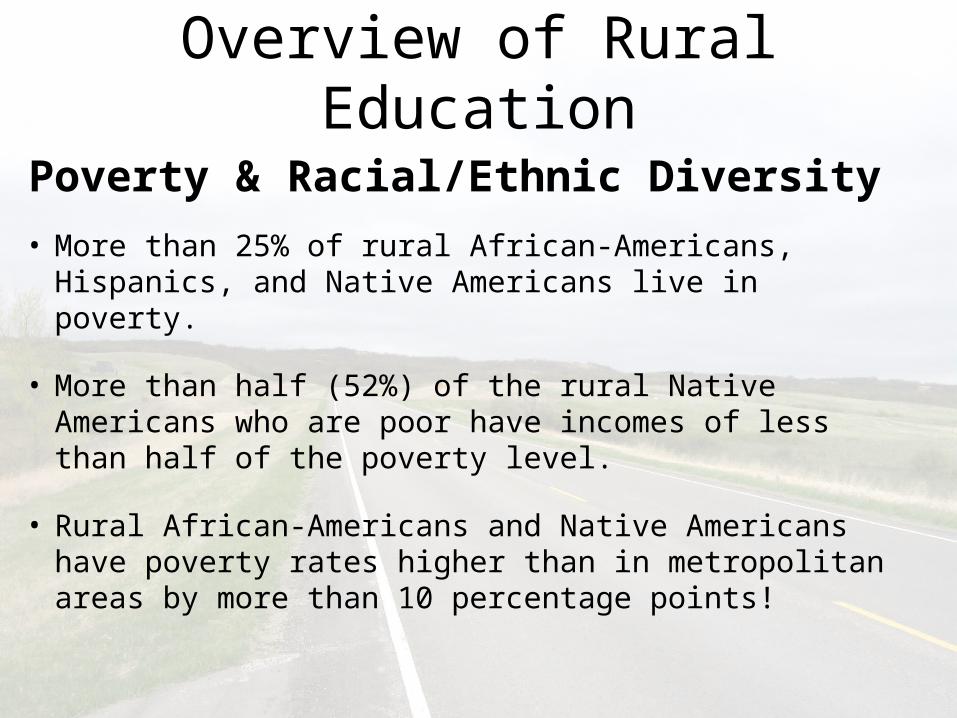
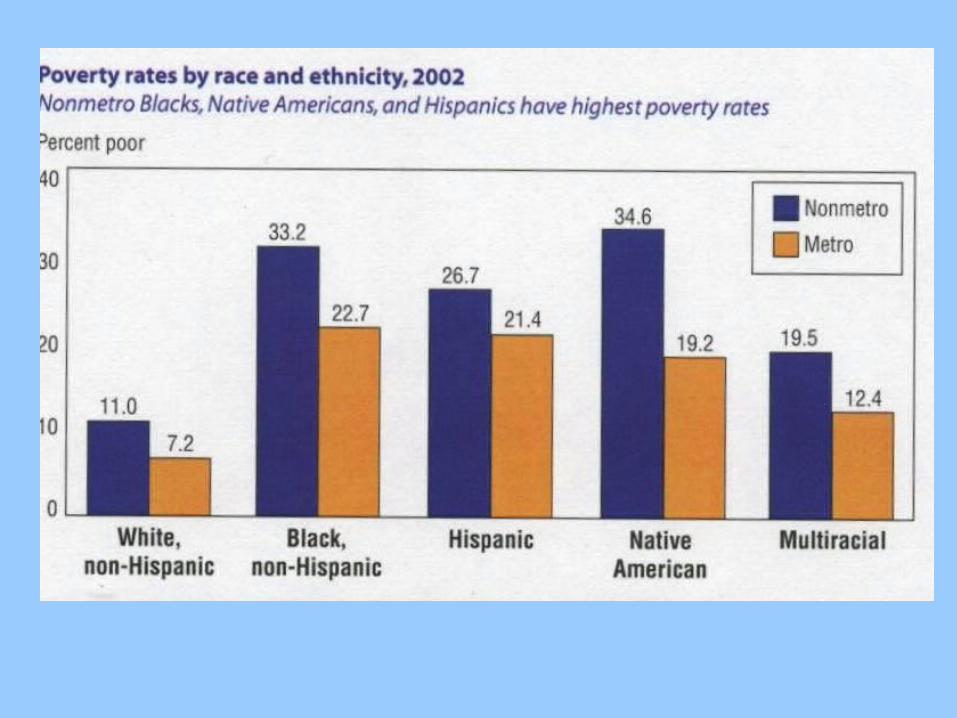
Poverty & Racial/Ethnic Diversity
• More than 25% of rural African-Americans, Hispanics, and Native Americans live in poverty.
• More than half (52%) of the rural Native Americans who are poor have incomes of less than half of the poverty level.
• Rural African-Americans and Native Americans have poverty rates higher than in metropolitan areas by more than 10 percentage points!
Overview of Rural Education
• Diversity – Special Needs• English Language Learners (ELL) &
Immigration– The Department of Education estimates that 10
million children aged 5-17 speak a language other than English at home.
– In 2003-2004, 8% of public school students were classified as LEP/ELL. This varies widely by state.
– Some scholars suggest we are in an immigration boom, comparable to that seen at around the turn of the last century. Rural areas are attracting new immigrants at a faster rate than ever before.
Overview of Rural Education
Overview of Rural Education
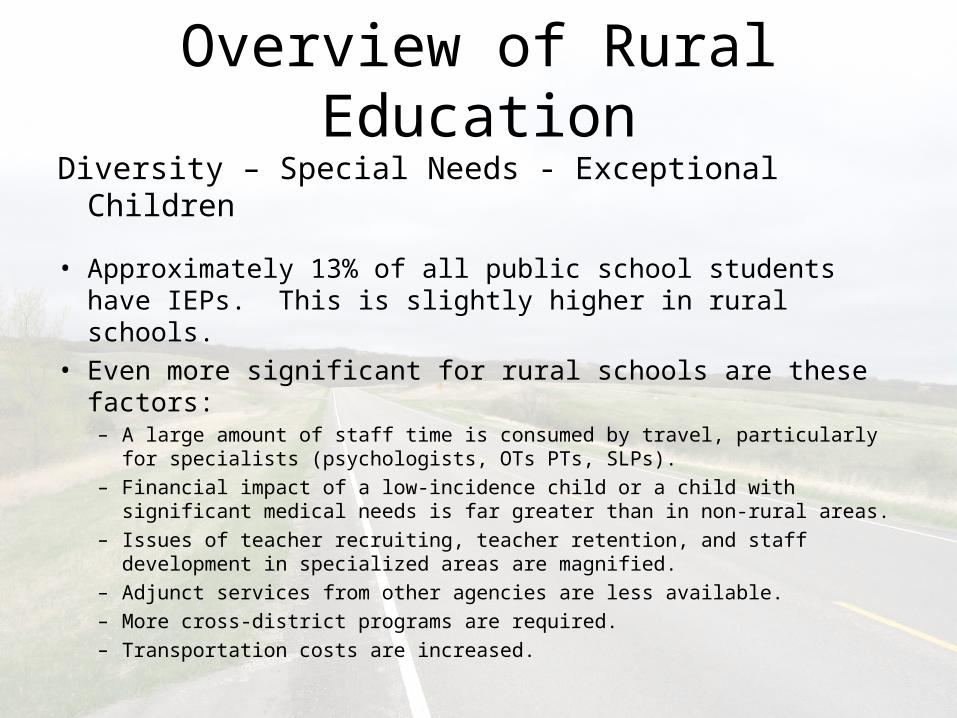
Diversity – Special Needs - Exceptional Children
• Approximately 13% of all public school students have IEPs. This is slightly higher in rural schools.
• Even more significant for rural schools are these factors:– A large amount of staff time is consumed by travel, particularly for
specialists (psychologists, OTs PTs, SLPs).
– Financial impact of a low-incidence child or a child with significant medical needs is far greater than in non-rural areas.
– Issues of teacher recruiting, teacher retention, and staff development in specialized areas are magnified.
– Adjunct services from other agencies are less available.
– More cross-district programs are required.
– Transportation costs are increased.
Overview of Rural Education
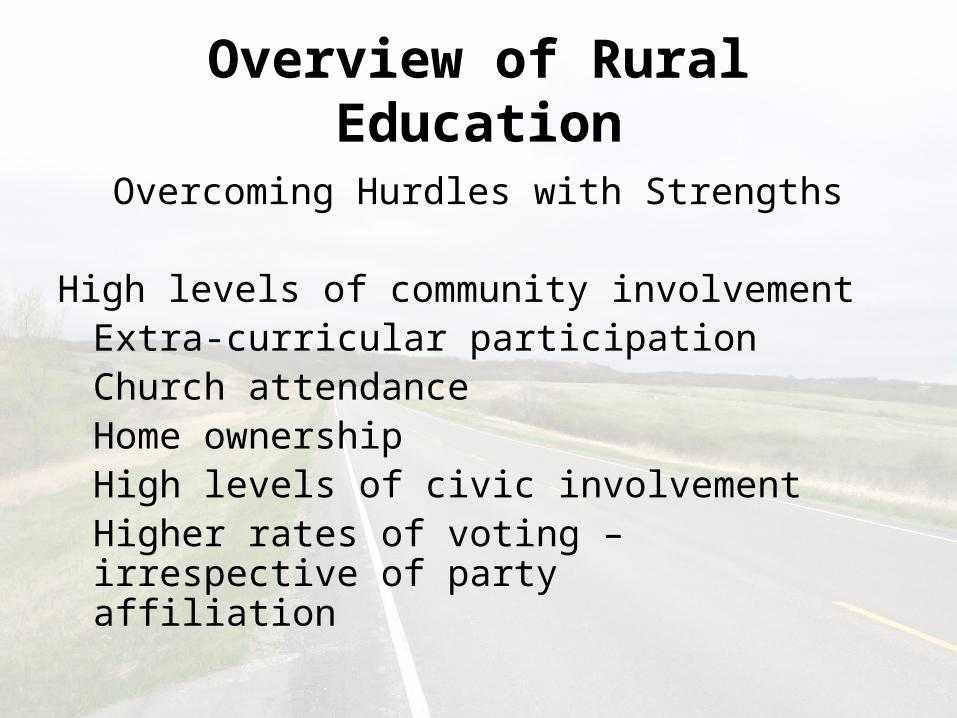
Overcoming Hurdles with Strengths
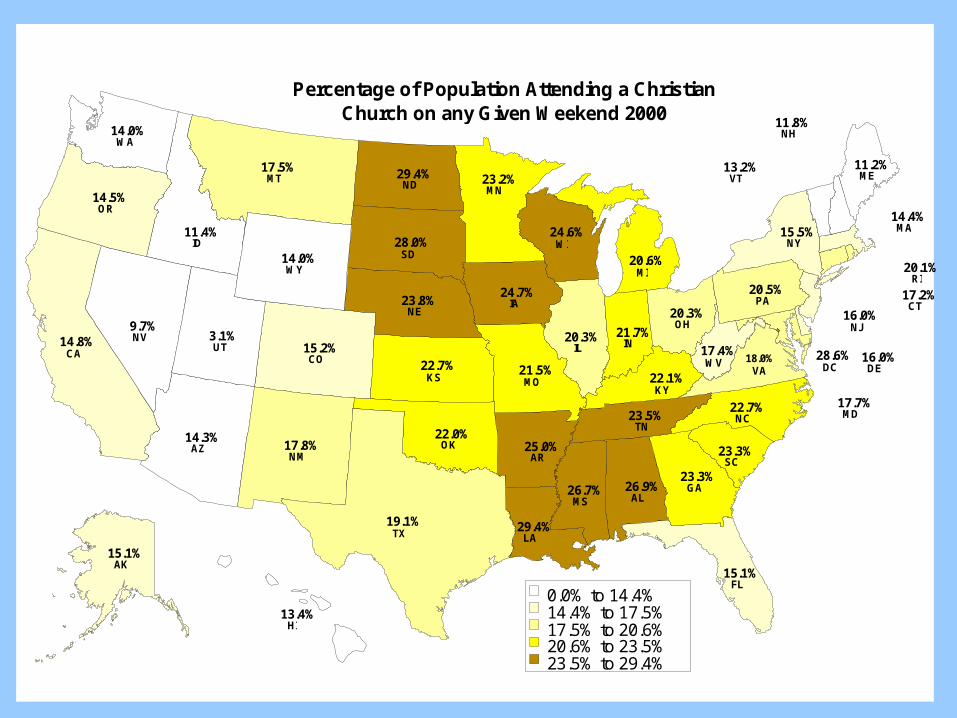
High levels of community involvementExtra-curricular participationChurch attendanceHome ownershipHigh levels of civic involvementHigher rates of voting – irrespective of party affiliation
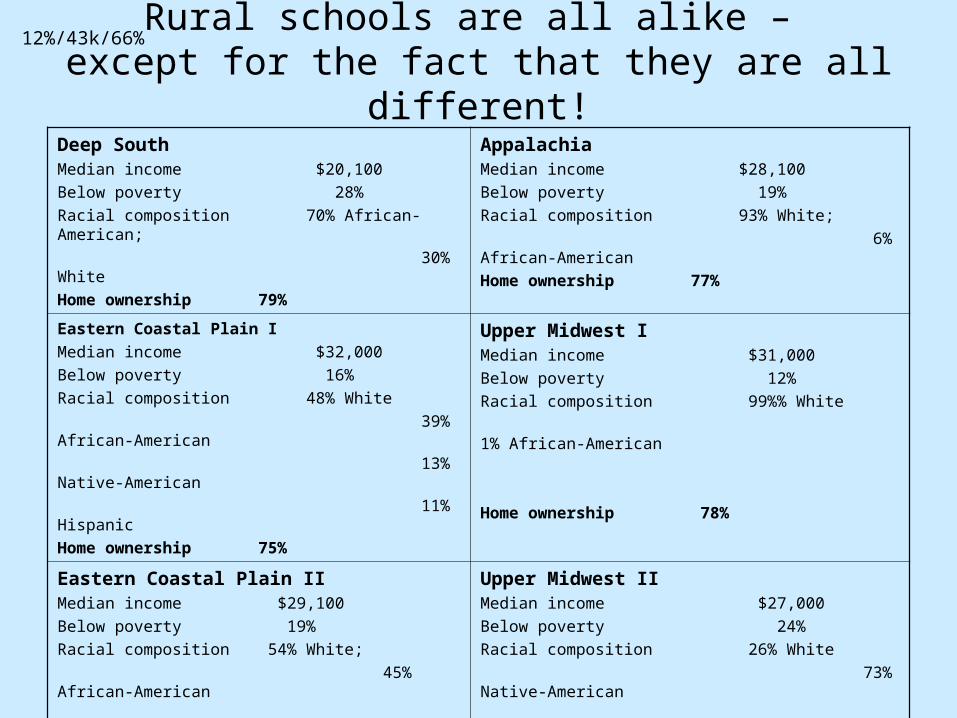
Rural schools are all alike – except for the fact that they are all different!
Deep SouthMedian income $20,100
Below poverty 28%
Racial composition 70% African-American;
30% White
Home ownership 79%
AppalachiaMedian income $28,100
Below poverty 19%
Racial composition 93% White;
6% African-American
Home ownership 77%
Eastern Coastal Plain I
Median income $32,000
Below poverty 16%
Racial composition 48% White
39% African-American
13% Native-American
11% Hispanic
Home ownership 75%
Upper Midwest IMedian income $31,000
Below poverty 12%
Racial composition 99%% White
1% African-American
Home ownership 78%
Eastern Coastal Plain IIMedian income $29,100
Below poverty 19%
Racial composition 54% White;
45% African-American
Home ownership 73%
Upper Midwest IIMedian income $27,000
Below poverty 24%
Racial composition 26% White
73% Native-American
1% Hispanic
Home ownership 68%
12%/43k/66%
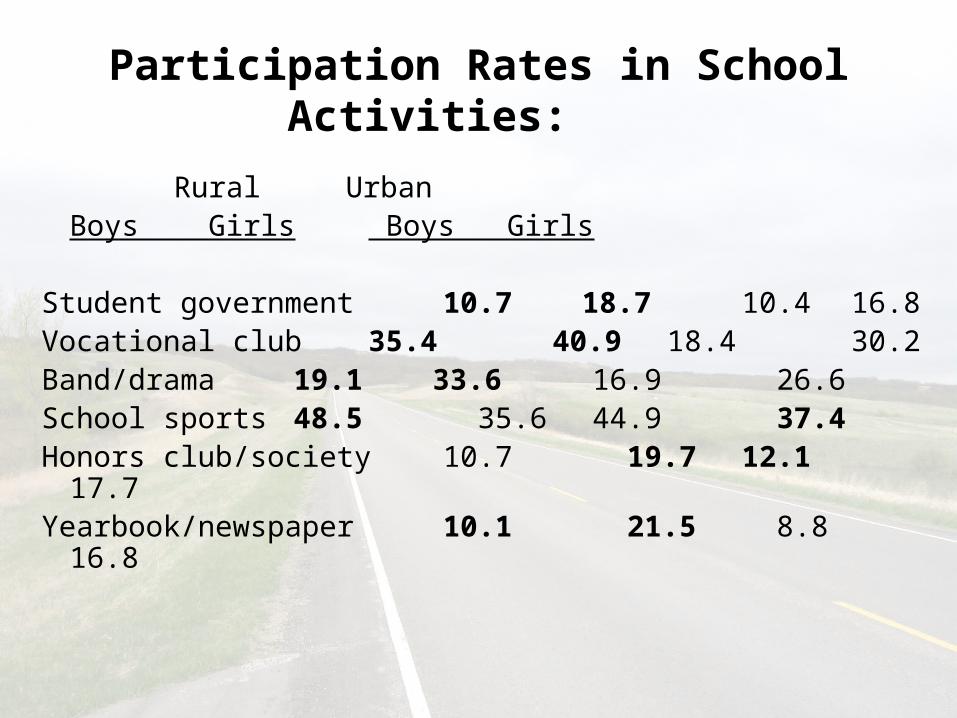
Participation Rates in School Activities:
Rural UrbanBoys Girls Boys
Girls
Student government 10.7 18.7 10.4 16.8Vocational club 35.4 40.9 18.4 30.2Band/drama 19.1 33.6 16.9 26.6School sports 48.5 35.6 44.9 37.4Honors club/society 10.7 19.7 12.1 17.7Yearbook/newspaper 10.1 21.5 8.8 16.8
3.1%UT
9.7%NV
11.2%ME
11.4%ID
11.8%NH
13.2%VT
13.4%HI
14.0%WY
14.0%WA
14.3%AZ
14.4%MA
14.5%OR
14.8%CA
15.1%AK
15.1%FL
15.2%CO
15.5%NY
16.0%NJ
16.0%DE
17.4%WV
17.5%MT
17.7%MD
17.8%NM
18.0%VA
17.2%CT
19.1%TX
20.1%RI
20.3%IL
20.3%OH
20.5%PA
20.6%MI
21.5%MO
21.7%IN
22.0%OK
22.1%KY
22.7%KS
22.7%NC
23.2%MN
23.3%SC
23.3%GA
23.5%TN
23.8%NE
24.6%WI
24.7%IA
25.0%AR
26.7%MS
26.9%AL
28.0%SD
28.6%DC
29.4%ND
29.4%LA
0.0% to 14.4%14.4% to 17.5%17.5% to 20.6%20.6% to 23.5%23.5% to 29.4%
Percentage of Population Attending a ChristianChurch on any Given Weekend 2000
So, what are the common assumptions that are incorrect
• About Rural Students . . .?
• About Rural Teachers . . .?
• About Rural Parents . . .?
• About Rural Communities . . .?
And what are the common assumptions that are correct
• About Rural Students . . . ?
• About Rural Teachers . . . ?
• About Rural Parents . . . ?
• About Rural Communities . . . ?
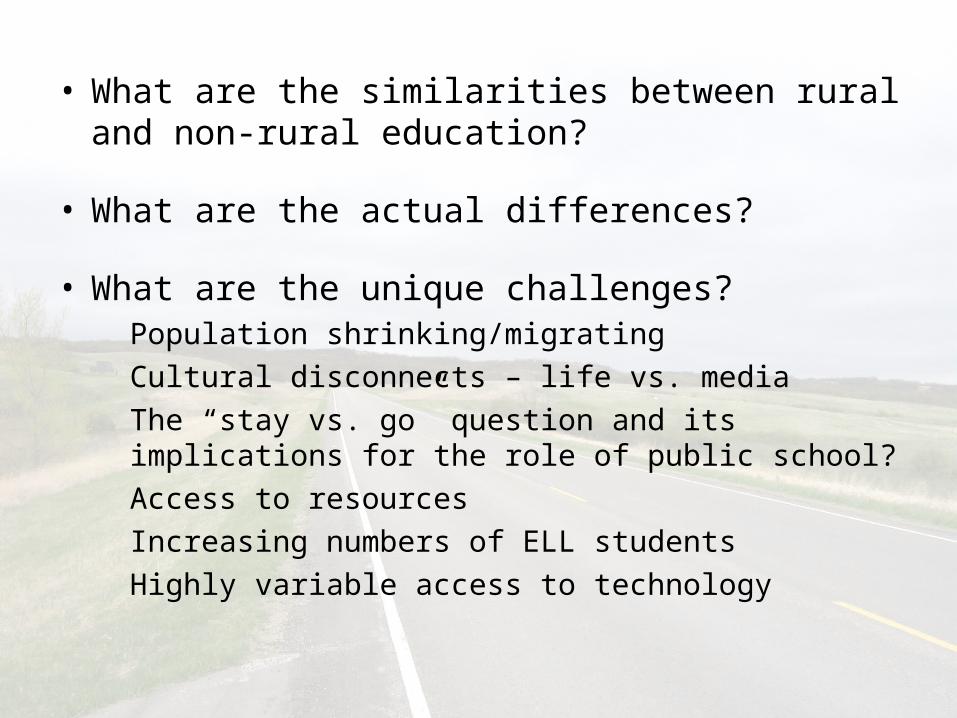
• What are the similarities between rural and non-rural education?
• What are the actual differences?
• What are the unique challenges?Population shrinking/migratingCultural disconnects – life vs. mediaThe “stay vs. go” question and its implications for the role of public school?Access to resourcesIncreasing numbers of ELL studentsHighly variable access to technology
Rationale for a new paradigm
• Teachers constantly are called on to adopt new techniques or curricula – though sometimes this is by their own choice, sometimes it is through no choice of their own.
• More than any other professional group, teachers work in isolation, with little opportunity to see others model a behavior.
• Teachers have an increasingly diverse group of students, both in terms of learning needs, language needs, and demographics.
• There is no one “right way” to teach.
Framework• Adopting a new technique involves
more than just technical proficiency.
• New techniques are adopted because someone believes they work.
• But no matter why you adopt a new method you want to get the most mileage possible from what you do.
• To get the best from what we do we need to go beyond the intended purpose.
Technique or Practice
• What is the specific instructional practice, or particular curricula?
• Who wants you to use it? • Who else is going to use it? • What is the stated reason for doing this?• What are the anticipated hurdles? • What do we expect the class to be able to
do when we’re finished (expected positive outcomes)?
Rural Implications• Was a particular strategy or curriculum written
with a rural community in mind?
• Does this technique depend on either a wider variety of, or just different, experiences than your students may have?
• Are there issues in your community that make the adoption of any new strategy controversial?
• Which is more valued in most rural communities – stability or innovation?
• Is it common (due to small community size) for you to have social relationships with the parents of your students? How does this impact teaching of content? How does this impact teaching of social or behavioral curricula?
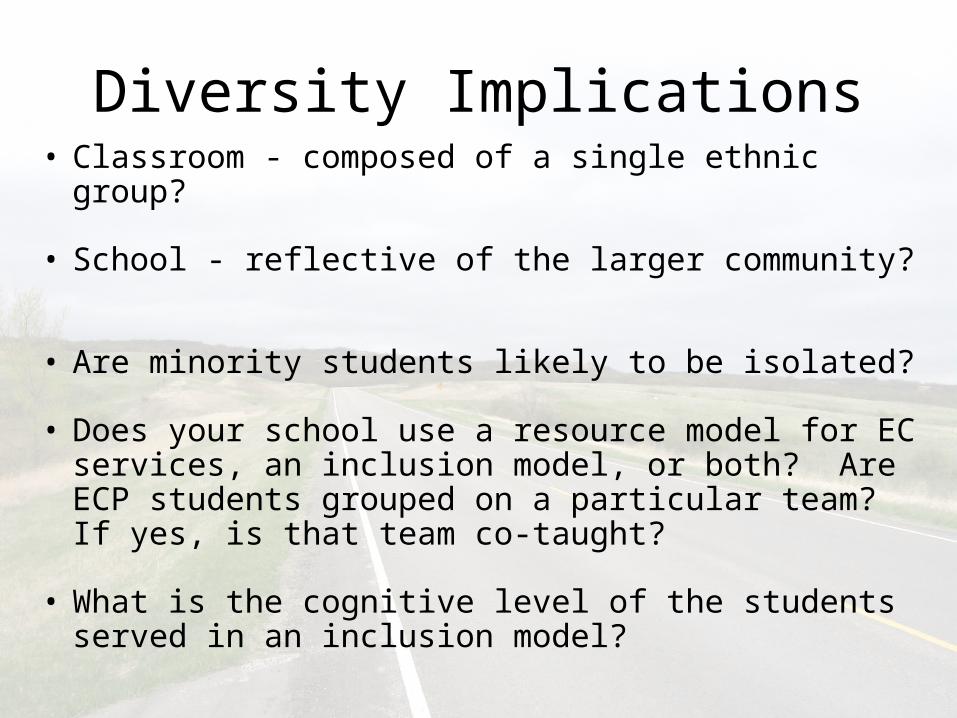
Diversity Implications• Classroom - composed of a single ethnic
group?
• School - reflective of the larger community?
• Are minority students likely to be isolated?
• Does your school use a resource model for EC services, an inclusion model, or both? Are ECP students grouped on a particular team? If yes, is that team co-taught?
• What is the cognitive level of the students served in an inclusion model?
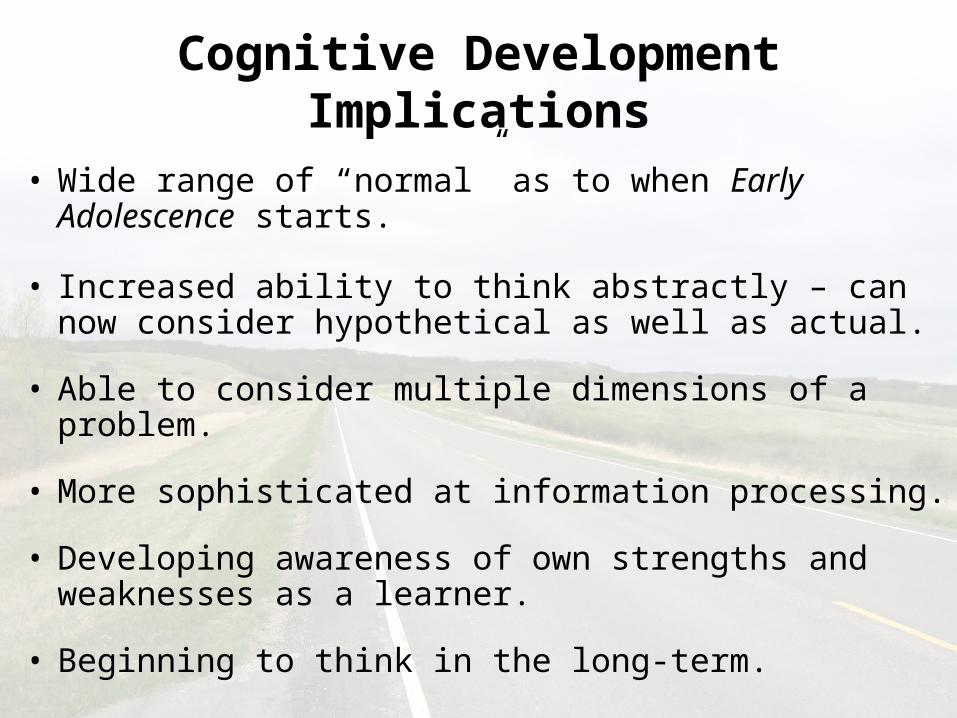
Cognitive Development Implications
• Wide range of “normal” as to when Early Adolescence starts.
• Increased ability to think abstractly – can now consider hypothetical as well as actual.
• Able to consider multiple dimensions of a problem.
• More sophisticated at information processing.
• Developing awareness of own strengths and weaknesses as a learner.
• Beginning to think in the long-term.
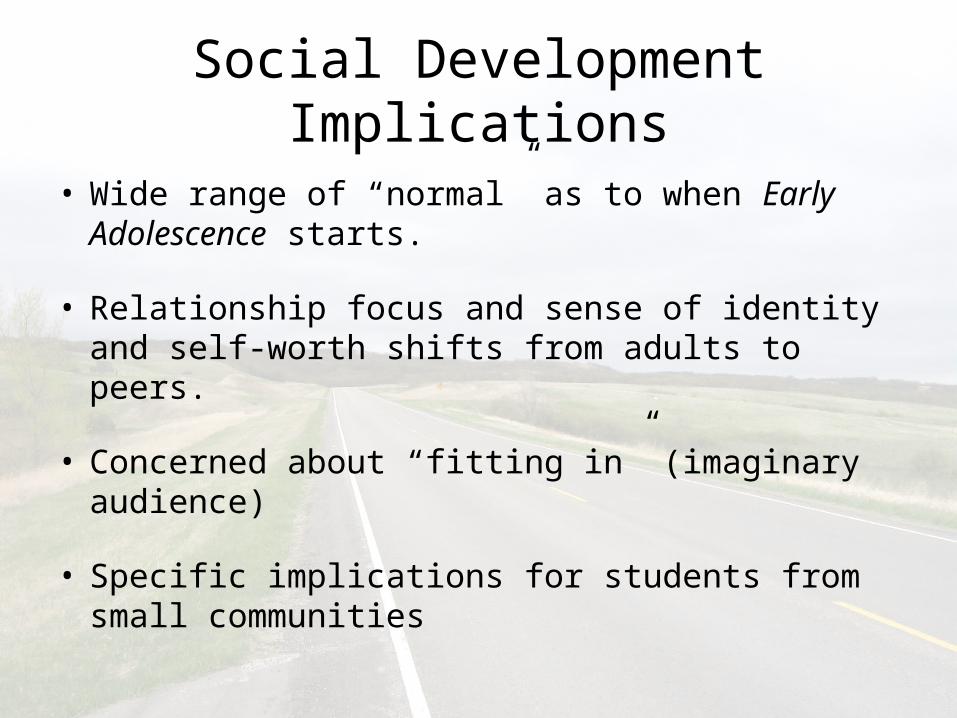
Social Development Implications
• Wide range of “normal” as to when Early Adolescence starts.
• Relationship focus and sense of identity and self-worth shifts from adults to peers.
• Concerned about “fitting in” (imaginary audience)
• Specific implications for students from small communities
ReferencesGoodwin, A.L. (2002). Teacher Preparation and The Education of Immigrant Children , Education and Urban Society,
34 (2), 156-172.
The Secretary’s Fourth Annual Report on Teacher Quality: A Highly Qualified Teacher in Every Classroom . (2005). US Department of Education.
U.S. Department of Agriculture. Economic Research Service. (July 2004) Rural Poverty At a Glance. Rural Development Research Report Number 100. retrieved online October 17, 2006 from http://www.ers.usda.gov/publications/rdrr100/rdrr100_lowres.pdf
U.S. Department of Education, Condition of Education 2006, (2006).
US Department of Education, National Center for Education Statistics, Common Core of Data.