Embed Size (px)
Citation preview

Ministry of Health, Labour and Welfare
Project to Provide Planning Guidance for the Water Supply
Project – FY2017- (Phase 1)
Project for Improvement of Water
Quality Management in Cagayan de Oro Water District,
Republic of the Philippines
Final Report
March, 2018
Pacific Consultants Co., Ltd.

Table of Contents
i
Table of Contents Summary
Basic Indicators
Location Map
Photographs
Abbreviations
Chapter 1 Introduction ................................................................................................................ 1-1 1.1 Purpose ............................................................................................................................. 1-1
1.1.1 Background ................................................................................................................ 1-1 1.1.2 Purpose ...................................................................................................................... 1-1
1.2 Schedule and Methods ...................................................................................................... 1-2 1.2.1 Schedule ..................................................................................................................... 1-2 1.2.2 Schedule and Methods Used in Field Study ................................................................ 1-2
1.3 Study Team Members ........................................................................................................ 1-2 Chapter 2 Matters Related to Clarifying the Current State of this Project .................................... 2-1
2.1 Water Services in the Philippines and Problems therein ..................................................... 2-1 2.1.1 Current State of Water Supply Sector (at the national level) ....................................... 2-1 2.1.2 Problems in Water Services (at the national level) ...................................................... 2-4 2.1.3 Problems Concerning Hygiene and Waterborne Disease (at the national level) ........... 2-5 2.1.4 Current State of Water Services (in the target area (Cagayan de Oro Water District
(COWD)) ............................................................................................................................ 2-5 2.1.5 Problems in Supply of Drinking Water (in the target area (COWD)) ......................... 2-13 2.1.6 Problems Concerning Hygiene and Waterborne Diseases (in the target area (COWD))2-21 2.1.7 Other Matters Concerning Problems in Water Supply Sector .................................... 2-21
Chapter 3 Matters Concerning Program/Project to be Formed ..................................................... 3-1 3.1 Problem Solution Methods ................................................................................................ 3-1
3.1.1 Relationship between Problems in Water Supply Sector (at the national level) and
Project to Be Formed .......................................................................................................... 3-1 3.1.2 Relationship between Current State of Water Service and Problems in Supply of
Drinking Water (in target area (COWD)) ............................................................................. 3-1 3.1.3 Scope of Assistance .................................................................................................... 3-1 3.1.4 Type of Assistance ...................................................................................................... 3-1 3.1.5 Time of Implementation ............................................................................................. 3-1 3.1.6 Other Matters Concerning Problem Solution Methods ................................................ 3-2
3.2 Purposes of Project ........................................................................................................... 3-2 3.2.1 Short-term Purposes ................................................................................................... 3-2 3.2.2 Medium- to Long-term Purposes ................................................................................ 3-2
3.3 Project Details................................................................................................................... 3-2 3.3.1 Outline Plan ............................................................................................................... 3-2
Project to Provide Planning Guidance for the Water Supply Project – FY2017- (Phase 1)
ii
3.3.2 Details, Scale and Quantities of Input of Project ......................................................... 3-4 3.3.3 Details, Scale and Quantities of Input of Dispatch of Experts and Provision of Materials
and Equipment .................................................................................................................... 3-4 3.3.4 Project Cost Estimation .............................................................................................. 3-5 3.3.5 Other Matters Concerning Project Details .................................................................. 3-6
3.4 Site Conditions ................................................................................................................. 3-6 3.4.1 Location (availability of sites, land use, facilities that can be potential sources of
pollution, etc.) ..................................................................................................................... 3-6 3.4.2 Natural Conditions ..................................................................................................... 3-6 3.4.3 Access ........................................................................................................................ 3-7 3.4.4 Power Supply and Means of Communication .............................................................. 3-7 3.4.5 Security ...................................................................................................................... 3-8 3.4.6 Other Matters Concerning Site Conditions ................................................................. 3-8
Chapter 4 Matters Concerning Outcome/Impact of Program/Project to be Formed ...................... 4-1 4.1 Outcome of Project Implementation .................................................................................. 4-1
4.1.1 Contribution to Improvement of Water Supply Sector ................................................. 4-1 4.1.2 Contribution to Solution of Problems in Drinking Water Supply ................................. 4-1 4.1.3 Contribution to Solution of Problems related to Hygiene and Waterborne Diseases .... 4-1 4.1.4 Other Matters Concerning Project Outcome ............................................................... 4-1
4.2 Impact of Project Implementation ..................................................................................... 4-1 4.2.1 Political Impact .......................................................................................................... 4-1 4.2.2 Social Impact ............................................................................................................. 4-2 4.2.3 Economic Impact ....................................................................................................... 4-2 4.2.4 Technical Impact ........................................................................................................ 4-2 4.2.5 Diplomatic and Publicity Impact ................................................................................ 4-2 4.2.6 Other Matters Concerning Project Impact ................................................................... 4-2
Chapter 5 Matters Concerning Relevancy of Project to be Formed .............................................. 5-1 5.1 Results of Comparative Study with Major Alternative Plans .............................................. 5-1 5.2 Organizational Relevance and Sustainability of Project Implementation ........................... 5-1
5.2.1 Organizational Capacity for Business Management .................................................... 5-1 5.2.2 Organizational Capacity for Construction Work .......................................................... 5-1 5.2.3 Organizational Capacity for Maintenance ................................................................... 5-2 5.2.4 Relationship with Local Residents .............................................................................. 5-2 5.2.5 Other Matters Concerning Organizational Relevance and Sustainability ..................... 5-2
5.3 Financial Relevance and Sustainability of Project Implementation .................................... 5-2 5.3.1 Source of Funding for Work Borne by the Philippine Side .......................................... 5-2 5.3.2 Indicators of Current Water Service ............................................................................ 5-3 5.3.3 Changes in Financial Balance ..................................................................................... 5-3 5.3.4 Financial Balance Projection ...................................................................................... 5-3 5.3.5 Other Matters Concerning Financial Relevance and Sustainability ............................. 5-3
Table of Contents
iii
5.4 Technical Relevance and Sustainability of Project Implementation ................................... 5-4 5.4.1 Conformity with Technical Level of Counterpart ........................................................ 5-4 5.4.2 Assignment and Retention of Personnel ...................................................................... 5-4 5.4.3 State of Facilities and Equipment Maintenance ........................................................... 5-4 5.4.4 Other Matters Concerning Technical Relevance and Sustainability ............................. 5-4
5.5 Environmental Considerations ........................................................................................... 5-4 5.5.1 Expected Environmental Impact ................................................................................. 5-4 5.5.2 Assessment of Environmental Impact ......................................................................... 5-4 5.5.3 Other Matters Concerning Environmental Considerations ........................................... 5-7
Chapter 6 Conclusion.................................................................................................................. 6-1 6.1 Matter of Special Note ...................................................................................................... 6-1 6.2 Matters to be Noted during Project Implementation .......................................................... 6-1 6.3 Conclusion ........................................................................................................................ 6-1 6.4 Observations ..................................................................................................................... 6-1
【Appendices】
Appendix-1. Schedule
Appendix-2. List of Interviewees
Appendix-3. List of Collected Documents
Appendix-4. Minutes of Meeting
Appendix-5. PDM (Draft) and Schedule (Draft)


Summary
v
Summary 1. Background of the Project
1.1 Background
The Republic of the Philippines (hereinafter “the Philippines”) is a country in Southeast Asia
consisting of approximately 7,000 islands. 1.98 million people live in this country of 299,404 km2
(2015 Census of Population of the Philippines). Its per capita GDP was USD 2,920 and its GDP
grew at a rate of 5.8% in 2015. It is one of the most urbanized developing countries in Asia. Its
economy is expected to continue to grow at a high rate. On the other hand, a large disparity in
wealth is found in this country: the rich who account for 10% of the population own 76% of
national wealth. Therefore, poverty eradication is one of the problems to be tackled urgently by the
government. The new Duterte Administration established in 2016 regards the shortage of
infrastructure as the largest problem for economic growth and aims at increasing the budget for
infrastructure development to 5% - 7% of GDP.
The counterpart organization of this project, the Cagayan de Oro City Water District (COWD),
established on August 1, 1973a, is the oldest water district (WD) in the Philippines. Therefore, it is
expected to fulfil two missions, namely, “to be the best WD in the country” and “to provide the
most excellent water service.” It occupies an important position among WDs in the country and
has strong influence on the other WDs. As COWD is operating the water service and its
organization soundly under the strong leadership of the General Manager, it has a potential to be
the model WD of the country. However, the non-revenue water (NRW) rate of COWD is high and
the quality of the water it supplies is substandard. Therefore, COWD needs to continue improving
its technical capacity to be a model for other WDs in the Philippines. The aim of this project is to
improve the technical capacity of COWD and to extend the improved capacity nationwide to
improve the technical capacity of other WDs.
1.2 Purpose
COWD struggles to maintain the balance between water supply and demand while also suffering
from the serious problems of a “high NRW rate” and “distribution of piped water that does not
satisfy the Philippine National Standards for Drinking Water (PNSDW).” Although COWD is
focused on solving the former problem using a Master Plan prepared by JICA, assistance from the
United States Agency for International Development (USAID) and its own budget, it is not taking
any measures to solve the latter. The water supplied to most of the service area of COWD does not
satisfy the standards for chlorination defined in PNSDW and the cause for this failure has not been
identified.
a Water districts have been established in cities in rural areas that have populations of 20,000 and more since 1973 in accordance with Presidential Decree No. 198. They are now classified into ranks based on the number of connections.
Project to Provide Planning Guidance for the Water Supply Project – FY2017- (Phase 1)
vi
Therefore, a study of the current state of the water service was to be conducted by the Study
Team with a focus on the problem of residual chlorine (Cl) in order to teach COWD how to solve
this problem. These activities will be utilized to improve the capacity of COWD in the formation
of water supply projects and to support its efforts for the project formulation.
2. Problems in Supply of Drinking Water (in the target area (COWD))
2.1 Identification of Problems
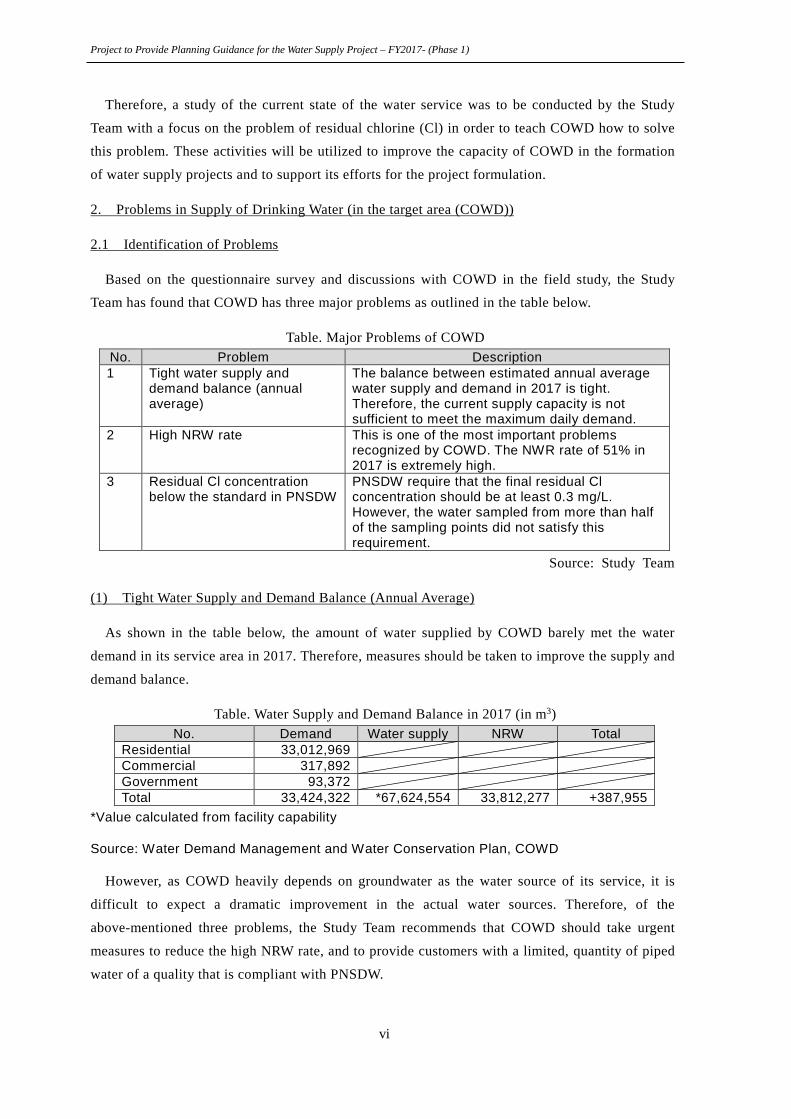
Based on the questionnaire survey and discussions with COWD in the field study, the Study
Team has found that COWD has three major problems as outlined in the table below.
Table. Major Problems of COWD No. Problem Description 1 Tight water supply and
demand balance (annual average)
The balance between estimated annual average water supply and demand in 2017 is tight. Therefore, the current supply capacity is not sufficient to meet the maximum daily demand.
2 High NRW rate This is one of the most important problems recognized by COWD. The NWR rate of 51% in 2017 is extremely high.
3 Residual Cl concentration below the standard in PNSDW
PNSDW require that the final residual Cl concentration should be at least 0.3 mg/L. However, the water sampled from more than half of the sampling points did not satisfy this requirement.
Source: Study Team
(1) Tight Water Supply and Demand Balance (Annual Average)
As shown in the table below, the amount of water supplied by COWD barely met the water
demand in its service area in 2017. Therefore, measures should be taken to improve the supply and
demand balance.
Table. Water Supply and Demand Balance in 2017 (in m3) No. Demand Water supply NRW Total
Residential 33,012,969 Commercial 317,892 Government 93,372 Total 33,424,322 *67,624,554 33,812,277 +387,955
*Value calculated from facility capability
Source: Water Demand Management and Water Conservation Plan, COWD
However, as COWD heavily depends on groundwater as the water source of its service, it is
difficult to expect a dramatic improvement in the actual water sources. Therefore, of the
above-mentioned three problems, the Study Team recommends that COWD should take urgent
measures to reduce the high NRW rate, and to provide customers with a limited, quantity of piped
water of a quality that is compliant with PNSDW.
Summary
vii
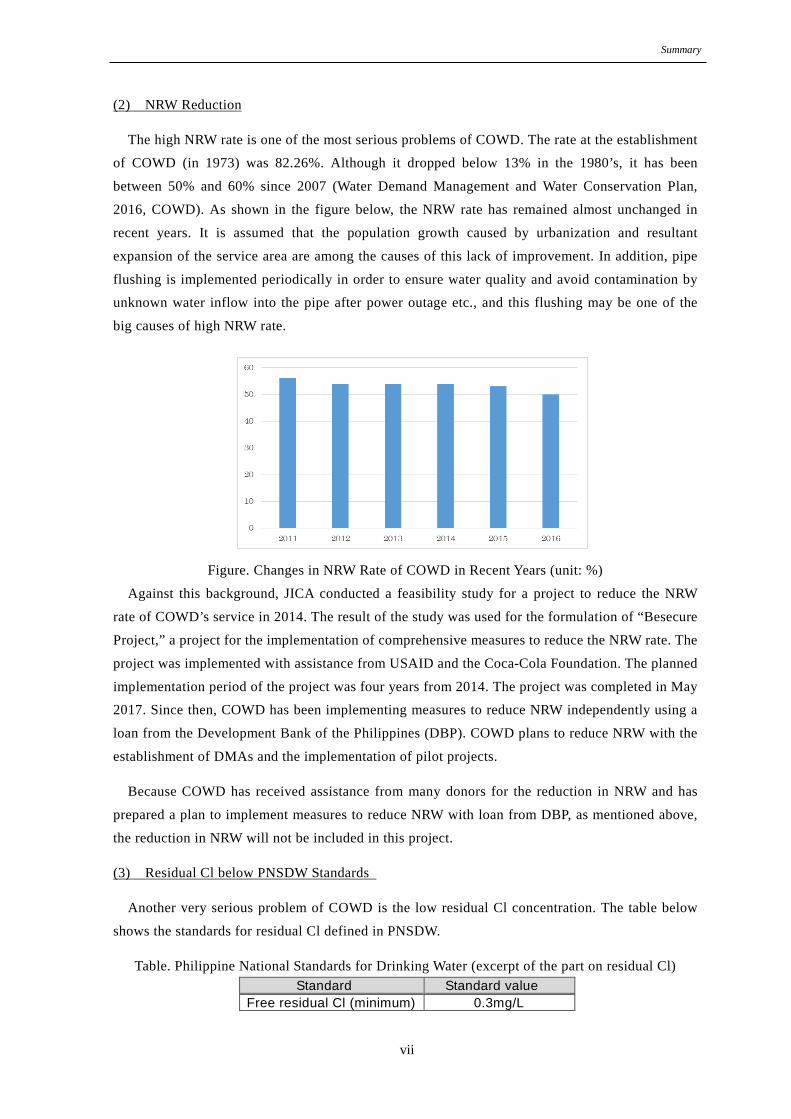
(2) NRW Reduction
The high NRW rate is one of the most serious problems of COWD. The rate at the establishment
of COWD (in 1973) was 82.26%. Although it dropped below 13% in the 1980’s, it has been
between 50% and 60% since 2007 (Water Demand Management and Water Conservation Plan,
2016, COWD). As shown in the figure below, the NRW rate has remained almost unchanged in
recent years. It is assumed that the population growth caused by urbanization and resultant
expansion of the service area are among the causes of this lack of improvement. In addition, pipe
flushing is implemented periodically in order to ensure water quality and avoid contamination by
unknown water inflow into the pipe after power outage etc., and this flushing may be one of the
big causes of high NRW rate.
Figure. Changes in NRW Rate of COWD in Recent Years (unit: %)
Against this background, JICA conducted a feasibility study for a project to reduce the NRW
rate of COWD’s service in 2014. The result of the study was used for the formulation of “Besecure
Project,” a project for the implementation of comprehensive measures to reduce the NRW rate. The
project was implemented with assistance from USAID and the Coca-Cola Foundation. The planned
implementation period of the project was four years from 2014. The project was completed in May
2017. Since then, COWD has been implementing measures to reduce NRW independently using a
loan from the Development Bank of the Philippines (DBP). COWD plans to reduce NRW with the
establishment of DMAs and the implementation of pilot projects.
Because COWD has received assistance from many donors for the reduction in NRW and has
prepared a plan to implement measures to reduce NRW with loan from DBP, as mentioned above,
the reduction in NRW will not be included in this project.
(3) Residual Cl below PNSDW Standards
Another very serious problem of COWD is the low residual Cl concentration. The table below
shows the standards for residual Cl defined in PNSDW.
Table. Philippine National Standards for Drinking Water (excerpt of the part on residual Cl) Standard Standard value
Free residual Cl (minimum) 0.3mg/L

Project to Provide Planning Guidance for the Water Supply Project – FY2017- (Phase 1)
viii
Standard Standard value Residual Cl (maximum) 1.5mg/L
Source: Department of Health (DOH), the Philippines
Meanwhile, the figure below shows the residual Cl concentration in piped water sampled in the
service area of COWD. Water samples taken at approximately 78% of the sampling points did not
satisfy the standards mentioned above (as of May 2016).
Source: COWD
Figure. Residual Cl in Piped Water in the Service Area of COWD
As mentioned above, the Government of the Philippines recognizes COWD as one of the
country’s important WDs. COWD endeavors to operate its service as soundly as possible to
become a model for other WDs and intends to take measures to solve this problem as it considers
the solution of this problem to be a highest priority tasks alongside the NRW reduction. However,
despite these intentions, COWD has not been able to implement improvement activities as it does
not have the means or capacity to comprehensively survey more than 500 km of water distribution
pipes and a service area of close to 500 km2.
2.2 Causes of Low Residual Cl Concentration
From discussions with COWD held in the field study, the Study Team learned that complex
factors had been involved as causes of the residual Cl problem. Because these factors have a
Summary
ix
significant influence on not only the residual Cl problem but also COWD’s water services and
water quality control in the future, urgent measures will have to be taken with regard to these
factors.
(1) Water Distribution Management
In discussions with COWD, the Study Team confirmed the locations of COWD’s water
distribution pipe network, water sources and the areas where low Cl concentration in the piped
water is frequently observed. The team also noted the rapid increase in water demand and
uncontrolled development of residential areas by housing developers in the entire service area.
Because a bulk water supply service is being implemented and large-diameter pipelines have been
installed in certain parts, there is a correlation between the distance of pipelines from the reservoir/
detention time, and consumption of Cl in the West Service Area. Meanwhile, in the East Service
Area, diameter of the pipelines is insufficient to meet the water demand, and it tends to be in low
water pressure in the pipelines below the standard level (suspension of water supply or creation of
negative pressure in water pipes) and the Cl consumption seems to increase rapidly when the
pressure has dropped. In addition, COWD and the Study Team confirmed that the elevated
reservoirs of COWD have not functioned due to no inflow into the elevated reservoirs (described
later, see figure 2-9), and water is supplied eight hours per day instead of 24 hours per day in
certain parts of the service area because of these factors.
As mentioned above, there is a high NRW rate (50%) for COWD’s service. Water leakage is
presumed to account for a significant proportion of the NRW. If water in a distribution pipe is
appropriately pressurized, water in the pipe is expected to leak out. If water in a pipe is negatively
pressurized, unknown water may flow into the pipe. In fact, the Study Team was informed that
negative pressure in a pipe had caused an inflow of water into the pipe not only at the time of the
shortage of pressure during ordinary operation but also at the time of power outages. As sewage
generated near water distribution pipelines is drained through infiltration trenches and treated in
septic tanks in some areas, there is concern over the infiltration of domestic wastewater in
groundwater. As this infiltration may increase the concentration of contaminants such as
ammonium in groundwater, such a high concentration of contaminants is suspected to contribute
considerably to the high Cl consumption.
Due to this situation, it is possible that the water distribution pipe network and allotment of
water sources which are not suited to meeting the increasing water demand are basic causes of the
problem. The Cl concentration problem does not seem to be serious in the West Service Area
because water is received from the bulk water supply service and there is some margin in the water
transport capacity of the pipelines that were installed with consideration for anticipated demand.
Meanwhile, in the East Service Area, such pipeline installation as considering for anticipated
demand is not implemented, and therefore, there may be a continued shortage of water sources and
pipeline capacity. COWD has reservoirs in its service area, and mainly the reservoirs are two
types: elevated or on-ground. Elevated reservoirs are called Balancing Reservoir, and it has only

Project to Provide Planning Guidance for the Water Supply Project – FY2017- (Phase 1)
x
one pipe which has roles of inflow and outflow at the same time. Therefore, it is also considered as
regulated reservoirs (see the following figure).
Source: Study team
Figure. Image of elevated reservoir
However, for the elevated reservoirs, due to the tight supply and demand balance, water is
pumped directly from the sources to consumers without using the elevated reservoirs, as described
above figure. This distribution method is a potential cause of the insufficient water pressure in the
terminal parts of the pipelines.
(2) Water Quality Control
COWD conducts the microbiological examinations prescribed in PNSDW. Meanwhile, it
outsources the physical and chemical examinations to external laboratories. An expert qualified in
chemistry must put his/her signature on the reports on the physical and chemical examinations to
make the examination results official. At present, COWD has to outsource these examinations
because it does not employ such a qualified expert.
This has led to a situation in which COWD cannot analyze the effect on residual Cl
concentration from iron contained in raw water or from chloramine generated from the inflow of
unknown water containing NH3, and cannot manage the smell of water. Therefore, the training of
such experts is urgently required.
(3) Management of Materials and Equipment including Pipes and Meters
COWD was established in 1973. The oldest pipes in its waterworks have been in use for 44
years. Mortar lining steel pipes and PVC pipes are mainly used in the waterworks. As it is not
possible to line welded joints of the steel pipes with mortar, rust may develop on such joints and
Currently, due to tight supply and demand balance, water is distributed directly without stored in the reservoir (no inflow into the reservoirs)
One pipe for inflow and outflow
Water from water resource Distributed depending on demand

Summary
xi
the rust may increase Cl consumption. Iron, manganese and other metals retained in pipes for a
long period may capture suspended materials, thereby increasing Cl consumption.
COWD mainly uses Cl gas for chlorination. It uses the automatic injectors shown in the figure
below for Cl gas injection. However, COWD informed the Study Team that it was unable to
control the Cl concentration because Cl sensors were not functioning normally. The Study Team
studied the photographs of the meters and confirmed that their detection parts had turned brown
with the deposition of iron or manganese. This may be the reason why the sensors are not
functioning. It will be impossible to control the residual Cl concentration without carrying out
urgent repairs on the instruments concerned.
Source: COWD
Figure. Automatic Cl Gas Injector (left) and Cl Sensor (right)
(4) Selection of Appropriate Disinfectant
Although COWD mainly chlorinates with Cl gas, there is an unstable supply in CDO because
there is only one Cl gas supplier in the city. Therefore, chlorine dioxide (ClO2) is also used, and
the ratio of usage is 80% of Cl gas and 20% of ClO2, respectively.
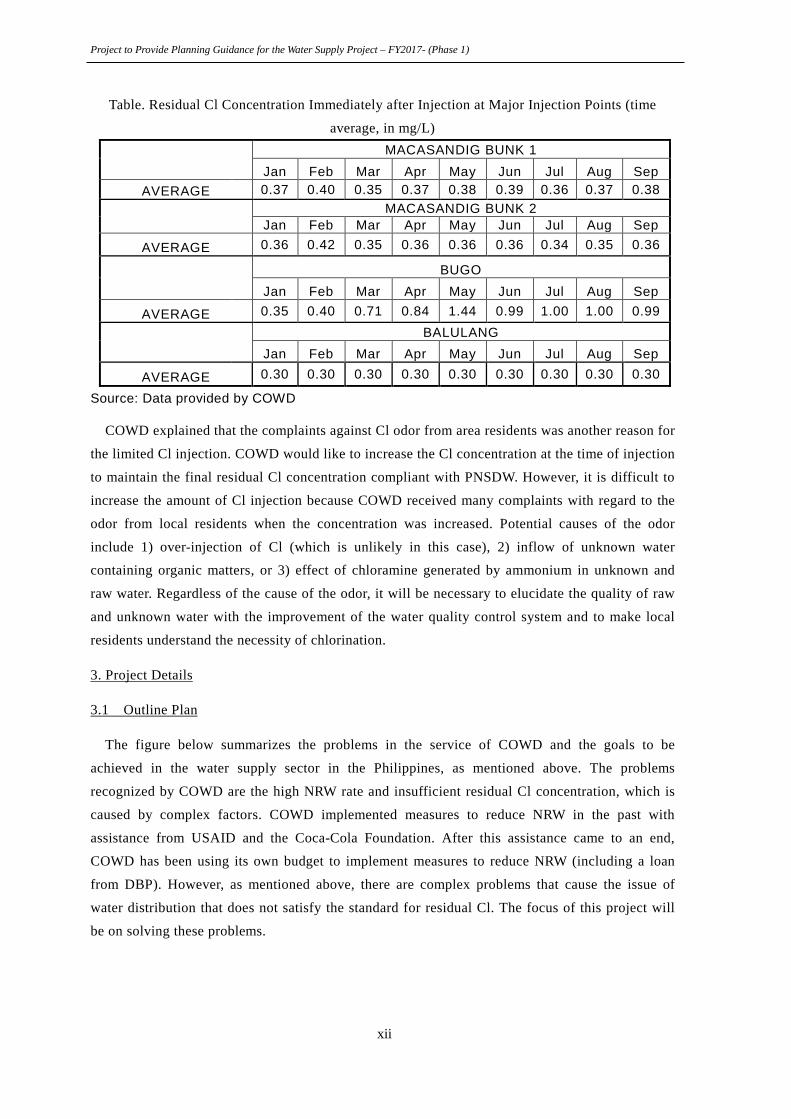
The table below shows the time average residual Cl concentration immediately after Cl gas
injection at major injection points of COWD. Because of the unstable availability of Cl gas, as
mentioned above, COWD is controlling the concentration while minimizing the amount of
disinfectant injection. Consequently, COWD is only able to maintain the concentration
immediately after the injection between 0.3 and 0.4 mg/L. The concentration in Baluland BPS (in
the West Service Area) immediately after the injection was 0.3 mg/L, which is the lowest
allowable limit of the concentration in PNSDW, at this point.
Project to Provide Planning Guidance for the Water Supply Project – FY2017- (Phase 1)
xii
Table. Residual Cl Concentration Immediately after Injection at Major Injection Points (time
average, in mg/L)
MACASANDIG BUNK 1 Jan Feb Mar Apr May Jun Jul Aug Sep
AVERAGE 0.37 0.40 0.35 0.37 0.38 0.39 0.36 0.37 0.38 MACASANDIG BUNK 2
Jan Feb Mar Apr May Jun Jul Aug Sep
AVERAGE 0.36 0.42 0.35 0.36 0.36 0.36 0.34 0.35 0.36
BUGO Jan Feb Mar Apr May Jun Jul Aug Sep
AVERAGE 0.35 0.40 0.71 0.84 1.44 0.99 1.00 1.00 0.99 BALULANG
Jan Feb Mar Apr May Jun Jul Aug Sep
AVERAGE 0.30 0.30 0.30 0.30 0.30 0.30 0.30 0.30 0.30
Source: Data provided by COWD
COWD explained that the complaints against Cl odor from area residents was another reason for
the limited Cl injection. COWD would like to increase the Cl concentration at the time of injection
to maintain the final residual Cl concentration compliant with PNSDW. However, it is difficult to
increase the amount of Cl injection because COWD received many complaints with regard to the
odor from local residents when the concentration was increased. Potential causes of the odor
include 1) over-injection of Cl (which is unlikely in this case), 2) inflow of unknown water
containing organic matters, or 3) effect of chloramine generated by ammonium in unknown and
raw water. Regardless of the cause of the odor, it will be necessary to elucidate the quality of raw
and unknown water with the improvement of the water quality control system and to make local
residents understand the necessity of chlorination.
3. Project Details
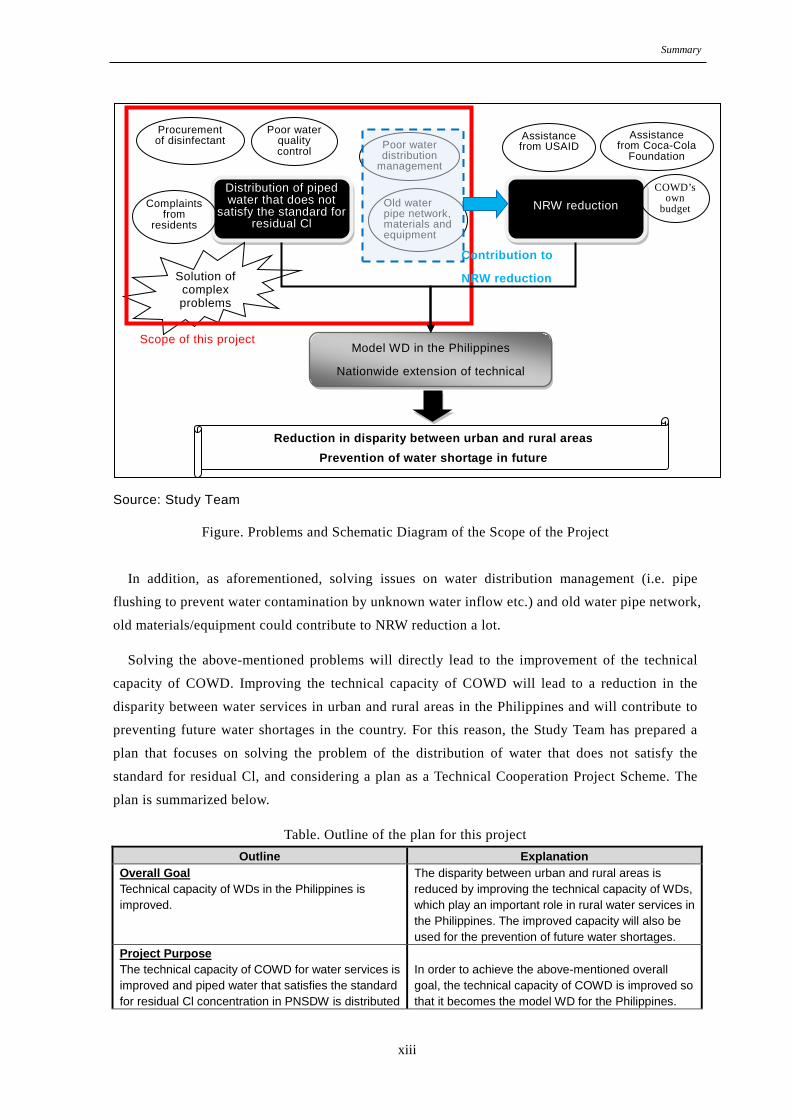
3.1 Outline Plan
The figure below summarizes the problems in the service of COWD and the goals to be
achieved in the water supply sector in the Philippines, as mentioned above. The problems
recognized by COWD are the high NRW rate and insufficient residual Cl concentration, which is
caused by complex factors. COWD implemented measures to reduce NRW in the past with
assistance from USAID and the Coca-Cola Foundation. After this assistance came to an end,
COWD has been using its own budget to implement measures to reduce NRW (including a loan
from DBP). However, as mentioned above, there are complex problems that cause the issue of
water distribution that does not satisfy the standard for residual Cl. The focus of this project will
be on solving these problems.
Summary
xiii
Source: Study Team
Figure. Problems and Schematic Diagram of the Scope of the Project
In addition, as aforementioned, solving issues on water distribution management (i.e. pipe
flushing to prevent water contamination by unknown water inflow etc.) and old water pipe network,
old materials/equipment could contribute to NRW reduction a lot.
Solving the above-mentioned problems will directly lead to the improvement of the technical
capacity of COWD. Improving the technical capacity of COWD will lead to a reduction in the
disparity between water services in urban and rural areas in the Philippines and will contribute to
preventing future water shortages in the country. For this reason, the Study Team has prepared a
plan that focuses on solving the problem of the distribution of water that does not satisfy the
standard for residual Cl, and considering a plan as a Technical Cooperation Project Scheme. The
plan is summarized below.
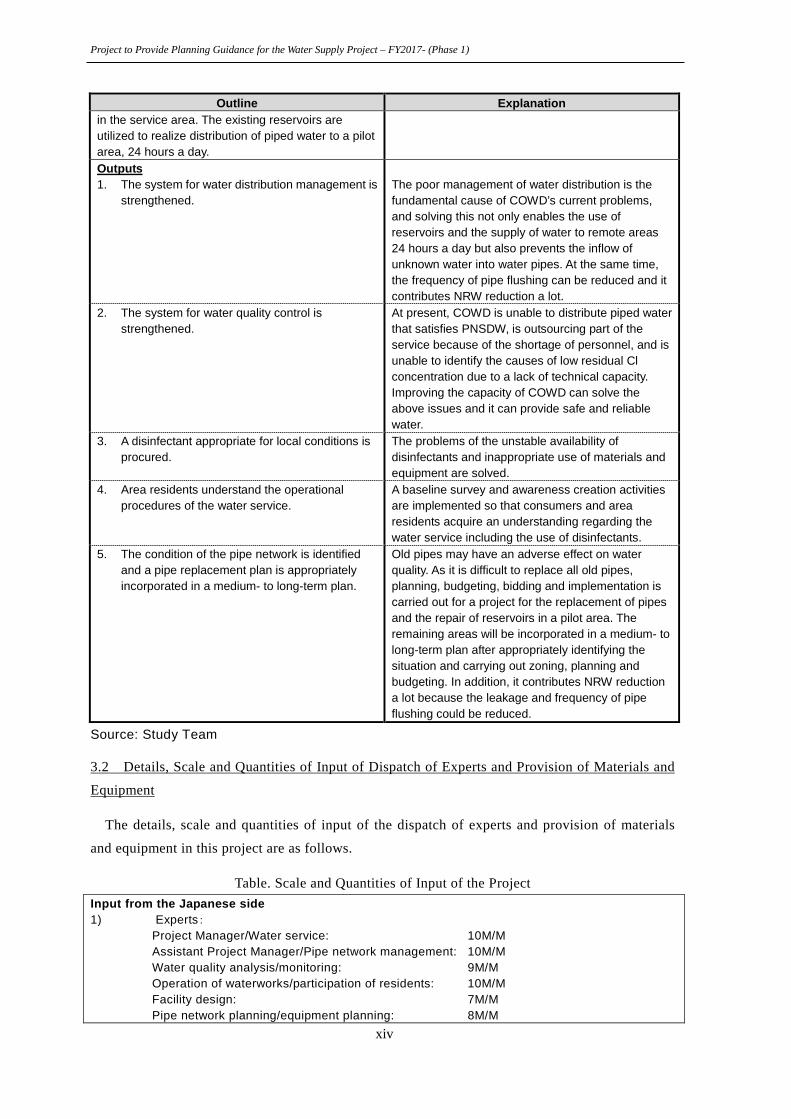
Table. Outline of the plan for this project Outline Explanation
Overall Goal Technical capacity of WDs in the Philippines is improved.
The disparity between urban and rural areas is reduced by improving the technical capacity of WDs, which play an important role in rural water services in the Philippines. The improved capacity will also be used for the prevention of future water shortages.
Project Purpose The technical capacity of COWD for water services is improved and piped water that satisfies the standard for residual Cl concentration in PNSDW is distributed
In order to achieve the above-mentioned overall goal, the technical capacity of COWD is improved so that it becomes the model WD for the Philippines.
Distribution of piped water that does not
satisfy the standard for residual Cl
Poor water distribution
management
Poor water quality control
Procurement of disinfectant
Complaints from
residents
Old water pipe network, materials and equipment
Solution of complex problems
NRW reduction
Assistance from USAID
Assistance from Coca-Cola
Foundation
Scope of this project Model WD in the Philippines
Nationwide extension of technical
Reduction in disparity between urban and rural areas Prevention of water shortage in future
Contribution to
NRW reduction
COWD’s own
budget
Project to Provide Planning Guidance for the Water Supply Project – FY2017- (Phase 1)
xiv
Outline Explanation in the service area. The existing reservoirs are utilized to realize distribution of piped water to a pilot area, 24 hours a day. Outputs 1. The system for water distribution management is
strengthened.
The poor management of water distribution is the fundamental cause of COWD’s current problems, and solving this not only enables the use of reservoirs and the supply of water to remote areas 24 hours a day but also prevents the inflow of unknown water into water pipes. At the same time, the frequency of pipe flushing can be reduced and it contributes NRW reduction a lot.
2. The system for water quality control is strengthened.
At present, COWD is unable to distribute piped water that satisfies PNSDW, is outsourcing part of the service because of the shortage of personnel, and is unable to identify the causes of low residual Cl concentration due to a lack of technical capacity. Improving the capacity of COWD can solve the above issues and it can provide safe and reliable water.
3. A disinfectant appropriate for local conditions is procured.
The problems of the unstable availability of disinfectants and inappropriate use of materials and equipment are solved.
4. Area residents understand the operational procedures of the water service.
A baseline survey and awareness creation activities are implemented so that consumers and area residents acquire an understanding regarding the water service including the use of disinfectants.
5. The condition of the pipe network is identified and a pipe replacement plan is appropriately incorporated in a medium- to long-term plan.
Old pipes may have an adverse effect on water quality. As it is difficult to replace all old pipes, planning, budgeting, bidding and implementation is carried out for a project for the replacement of pipes and the repair of reservoirs in a pilot area. The remaining areas will be incorporated in a medium- to long-term plan after appropriately identifying the situation and carrying out zoning, planning and budgeting. In addition, it contributes NRW reduction a lot because the leakage and frequency of pipe flushing could be reduced.
Source: Study Team
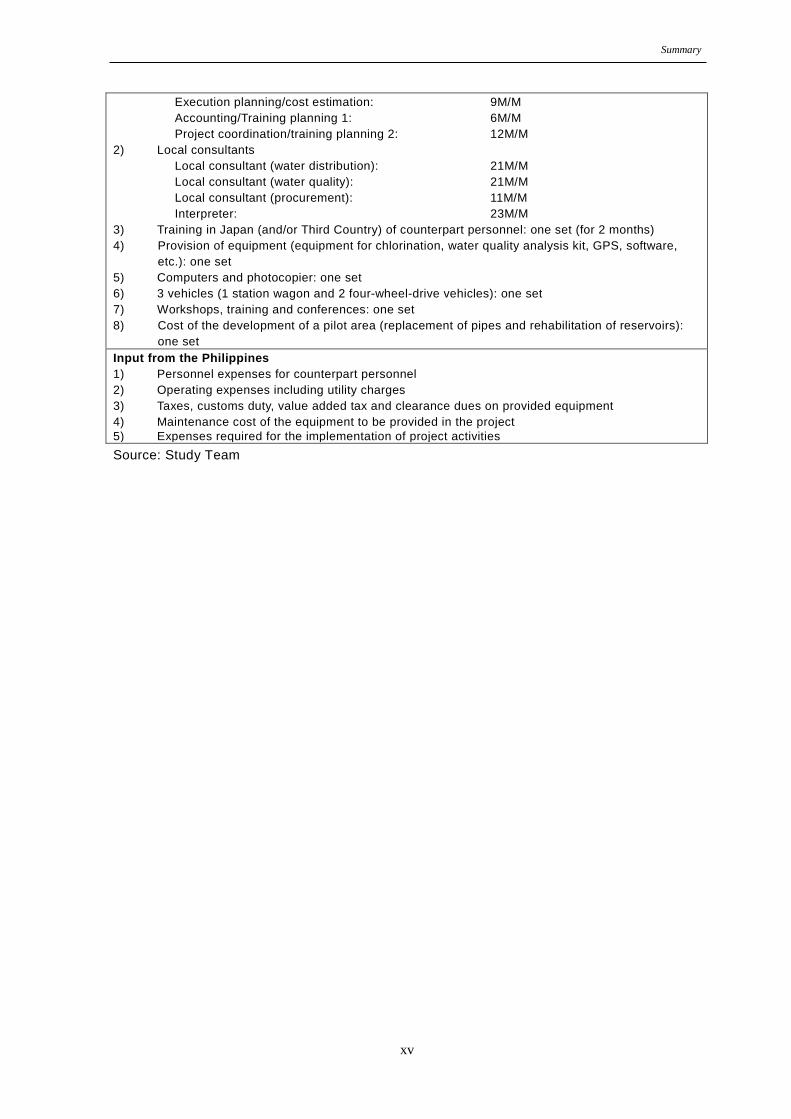
3.2 Details, Scale and Quantities of Input of Dispatch of Experts and Provision of Materials and
Equipment
The details, scale and quantities of input of the dispatch of experts and provision of materials
and equipment in this project are as follows.
Table. Scale and Quantities of Input of the Project Input from the Japanese side 1) Experts:
Project Manager/Water service: 10M/M Assistant Project Manager/Pipe network management: 10M/M Water quality analysis/monitoring: 9M/M Operation of waterworks/participation of residents: 10M/M Facility design: 7M/M Pipe network planning/equipment planning: 8M/M
Summary
xv
Execution planning/cost estimation: 9M/M Accounting/Training planning 1: 6M/M Project coordination/training planning 2: 12M/M
2) Local consultants Local consultant (water distribution): 21M/M Local consultant (water quality): 21M/M Local consultant (procurement): 11M/M Interpreter: 23M/M
3) Training in Japan (and/or Third Country) of counterpart personnel: one set (for 2 months) 4) Provision of equipment (equipment for chlorination, water quality analysis kit, GPS, software,
etc.): one set 5) Computers and photocopier: one set 6) 3 vehicles (1 station wagon and 2 four-wheel-drive vehicles): one set 7) Workshops, training and conferences: one set 8) Cost of the development of a pilot area (replacement of pipes and rehabilitation of reservoirs):
one set Input from the Philippines 1) Personnel expenses for counterpart personnel 2) Operating expenses including utility charges 3) Taxes, customs duty, value added tax and clearance dues on provided equipment 4) Maintenance cost of the equipment to be provided in the project 5) Expenses required for the implementation of project activities Source: Study Team

Basic Indicators
xvii
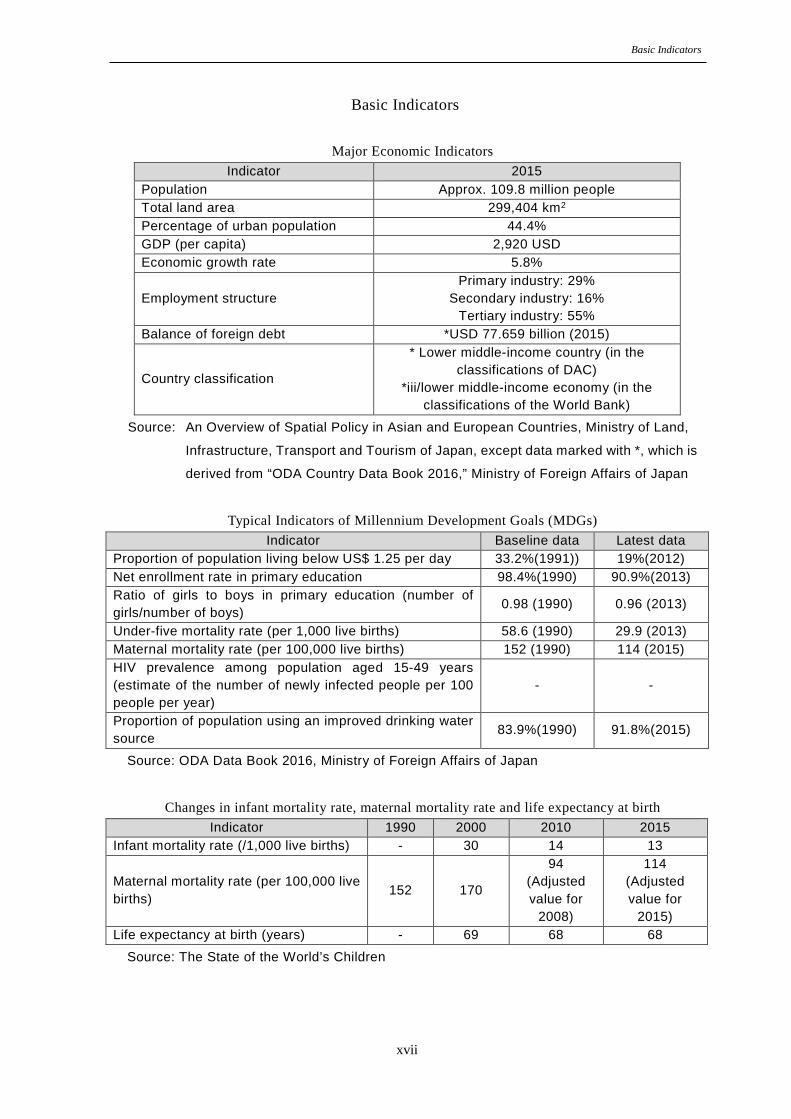
Basic Indicators
Major Economic Indicators Indicator 2015
Population Approx. 109.8 million people Total land area 299,404 km2 Percentage of urban population 44.4% GDP (per capita) 2,920 USD Economic growth rate 5.8%
Employment structure Primary industry: 29%
Secondary industry: 16% Tertiary industry: 55%
Balance of foreign debt *USD 77.659 billion (2015)
Country classification
* Lower middle-income country (in the classifications of DAC)
*iii/lower middle-income economy (in the classifications of the World Bank)
Source: An Overview of Spatial Policy in Asian and European Countries, Ministry of Land,
Infrastructure, Transport and Tourism of Japan, except data marked with *, which is
derived from “ODA Country Data Book 2016,” Ministry of Foreign Affairs of Japan
Typical Indicators of Millennium Development Goals (MDGs) Indicator Baseline data Latest data
Proportion of population living below US$ 1.25 per day 33.2%(1991)) 19%(2012) Net enrollment rate in primary education 98.4%(1990) 90.9%(2013) Ratio of girls to boys in primary education (number of girls/number of boys) 0.98 (1990) 0.96 (2013)
Under-five mortality rate (per 1,000 live births) 58.6 (1990) 29.9 (2013) Maternal mortality rate (per 100,000 live births) 152 (1990) 114 (2015) HIV prevalence among population aged 15-49 years (estimate of the number of newly infected people per 100 people per year)
- -
Proportion of population using an improved drinking water source 83.9%(1990) 91.8%(2015)
Source: ODA Data Book 2016, Ministry of Foreign Affairs of Japan
Changes in infant mortality rate, maternal mortality rate and life expectancy at birth Indicator 1990 2000 2010 2015
Infant mortality rate (/1,000 live births) - 30 14 13
Maternal mortality rate (per 100,000 live births) 152 170
94 (Adjusted value for
2008)
114 (Adjusted value for
2015) Life expectancy at birth (years) - 69 68 68
Source: The State of the World’s Children

Project to Provide Planning Guidance for the Water Supply Project – FY2017- (Phase 1)
xviii
Location Map

Photographs
xix
Photographs
Visit to San Jose Del Monte Water District (November 27, 2017)
Treatment Flow of San Jose Del Monte Water District (November 27, 2017)
Explanation by Dr. Rachel M. Beja (GM of COWD) at San Jose Del Monte Water District, water treatment plant(Right:Mr. Yamaguchi, Expert of water supply, Center: Mr. Mitsuno, Project Manager (November 27, 2017)
SCADA is ready at San Jose Del Monte Water District, which was supported by Yen loan project by Japan (November 27, 2017)
Sampling point at San Jose Del Monte Water District. Test for residual Cl with colorimetric method. COWD uses the same method. (November 27, 2017)
Sampling point at San Jose Del Monte Water District. Test by the simple kit brought from Japan. The results were the same as the one done by colorimetric method. (November 27, 2017)

Project to Provide Planning Guidance for the Water Supply Project – FY2017- (Phase 1)
xx
Visit to water source (groundwater) at San Jose Del Monte Water District. Depth is approx. 300m. (November 27, 2017)
Discussion with COWD. Three consecutive days from November 28 to 30, at meeting room in Jing Jan Inn. (November 29, 2017)
Discussion by a whiteboard and an enlarged drawing. Three consecutive days from November 28 to 30, at meeting room in Jing Jan Inn. (November 29, 2017)
After the discussion and field visit with COWD for four days (November 30, 2017)
Faucet extraction system in Manila. This system is called “Stub-out” and used a lot in the Philippines. (December 1, 2017)
Service pipes connected to “Stub-out system”. Mainly the pipes are on-ground. From the view of the pipes, it is called “spaghetti piping” and seen in Balangay water supply in the Philippines. December 1, 2017)
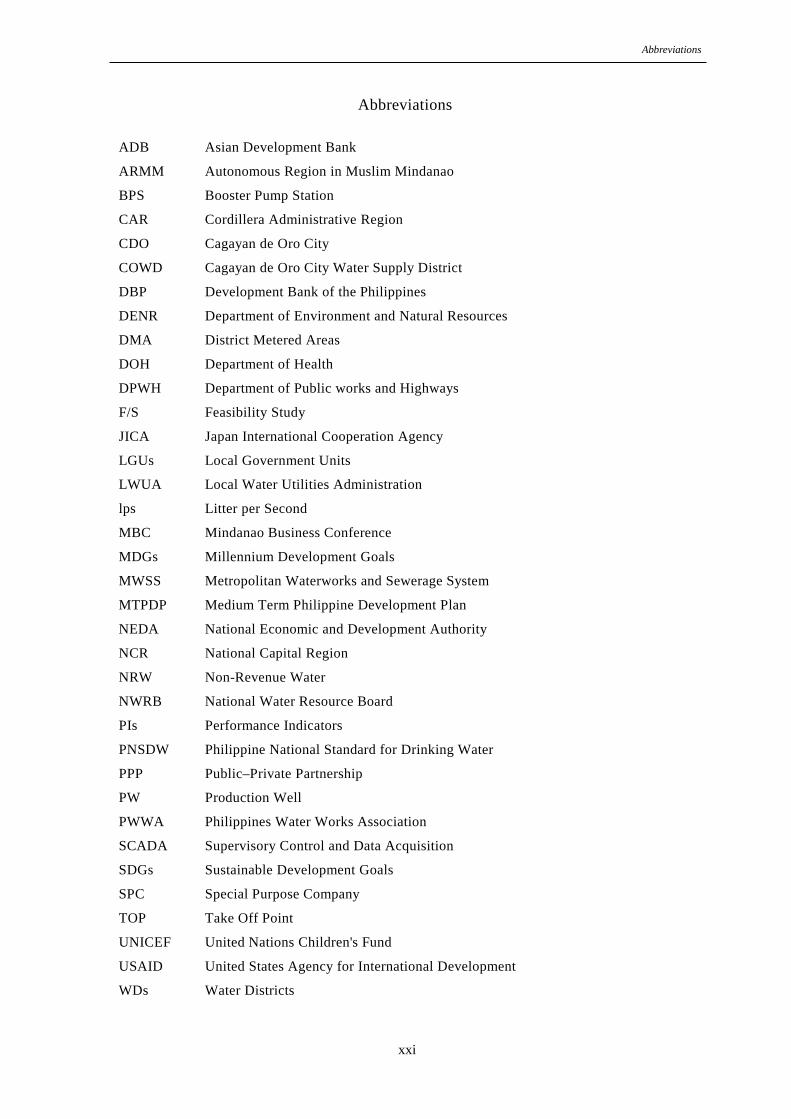
Abbreviations
xxi
Abbreviations ADB Asian Development Bank
ARMM Autonomous Region in Muslim Mindanao
BPS Booster Pump Station
CAR Cordillera Administrative Region
CDO Cagayan de Oro City
COWD Cagayan de Oro City Water Supply District
DBP Development Bank of the Philippines
DENR Department of Environment and Natural Resources
DMA District Metered Areas
DOH Department of Health
DPWH Department of Public works and Highways
F/S Feasibility Study
JICA Japan International Cooperation Agency
LGUs Local Government Units
LWUA Local Water Utilities Administration
lps Litter per Second
MBC Mindanao Business Conference
MDGs Millennium Development Goals
MWSS Metropolitan Waterworks and Sewerage System
MTPDP Medium Term Philippine Development Plan
NEDA National Economic and Development Authority
NCR National Capital Region
NRW Non-Revenue Water
NWRB National Water Resource Board
PIs Performance Indicators
PNSDW Philippine National Standard for Drinking Water
PPP Public–Private Partnership
PW Production Well
PWWA Philippines Water Works Association
SCADA Supervisory Control and Data Acquisition
SDGs Sustainable Development Goals
SPC Special Purpose Company
TOP Take Off Point
UNICEF United Nations Children's Fund
USAID United States Agency for International Development
WDs Water Districts
Project to Provide Planning Guidance for the Water Supply Project – FY2017- (Phase 1)
xxii
WHO World Health Organization
WRI World Resources Institute

Final Report
1-1
Chapter 1 Introduction
1.1 Purpose
1.1.1 Background
The Republic of the Philippines (hereinafter “the Philippines”) is a country in Southeast Asia
consisting of approximately 7,000 islands. 1.98 million people live in this country of 299,404 km2
(2015 Census of Population of the Philippines). Its per capita GDP was USD 2,920 and its GDP
grew at a rate of 5.8% in 2015. It is one of the most urbanized developing countries in Asia. Its
economy is expected to continue to grow at a high rate. On the other hand, a large disparity in
wealth is found in this country: the rich who account for 10% of the population own 76% of
national wealth. Therefore, poverty eradication is one of the problems to be tackled urgently by the
government. The new Duterte Administration established in 2016 regards the shortage of
infrastructure as the largest problem for economic growth and aims at increasing the budget for
infrastructure development to 5% - 7% of GDP.
The counterpart organization of this project, the Cagayan de Oro City Water District (COWD),
established on August 1, 19732, is the oldest water district (WD) in the Philippines. Therefore, it is
expected to fulfil two missions, namely, “to be the best WD in the country” and “to provide the
most excellent water service.” It occupies an important position among WDs in the country and
has strong influence on the other WDs. As COWD is operating the water service and its
organization soundly under the strong leadership of the General Manager, it has a potential to be
the model WD of the country. However, the non-revenue water (NRW) rate of COWD is high and
the quality of the water it supplies is substandard. Therefore, COWD needs to continue improving
its technical capacity to be a model for other WDs in the Philippines. The aim of this project is to
improve the technical capacity of COWD and to extend the improved capacity nationwide to
improve the technical capacity of other WDs.
1.1.2 Purpose
COWD struggles to maintain the balance between water supply and demand while also suffering
from the serious problems of a “high NRW rate” and “distribution of piped water that does not
satisfy the Philippine National Standards for Drinking Water (PNSDW).” Although COWD is
focused on solving the former problem using a Master Plan prepared by JICA, assistance from the
United States Agency for International Development (USAID) and its own budget, it is not taking
any measures to solve the latter. The water supplied to most of the service area of COWD does not
satisfy the standards for chlorination defined in PNSDW and the cause for this failure has not been
identified.
2 Water districts have been established in cities in rural areas that have populations of 20,000 and more since 1973 in accordance with Presidential Decree No. 198. They are now classified into ranks based on the number of connections.
Fiscal Year 2017 Project Formation Program in Water Supply Sector (Phase 1)
1-2
Therefore, a study of the current state of the water service was to be conducted by the Study
Team with a focus on the problem of residual chlorine (Cl) in order to teach COWD how to solve
this problem. These activities will be utilized to improve the capacity of COWD in the formation
of water supply projects and to support its efforts for the project formulation.
1.2 Schedule and Methods
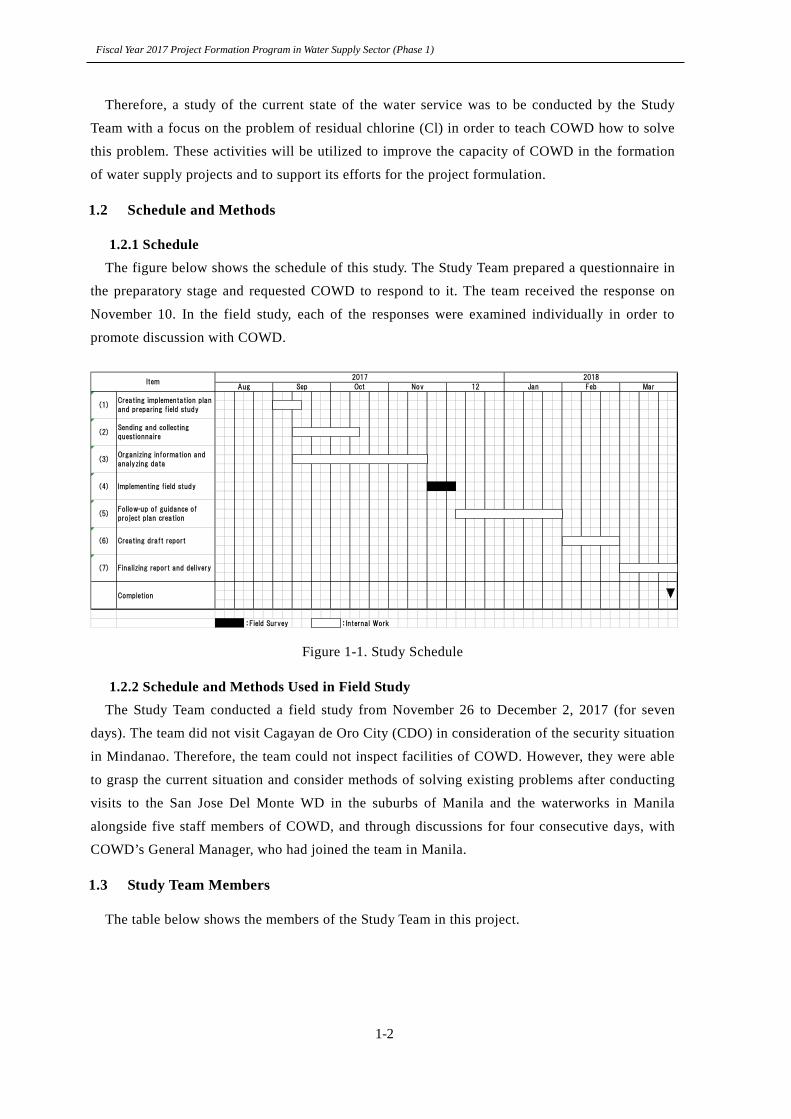
1.2.1 Schedule The figure below shows the schedule of this study. The Study Team prepared a questionnaire in
the preparatory stage and requested COWD to respond to it. The team received the response on
November 10. In the field study, each of the responses were examined individually in order to
promote discussion with COWD.
:Field Survey :Internal Work
Feb MarItem
Oct Nov 12 Jan
(3)Organizing information andanalyzing data
(1)Creating implementation planand preparing field study
SepAug
2017 2018
Completion
(7) Finalizing report and delivery
(4) Implementing field study
(5)Follow-up of guidance ofproject plan creation
(6) Creating draft report
(2)Sending and collectingquestionnaire
Figure 1-1. Study Schedule
1.2.2 Schedule and Methods Used in Field Study The Study Team conducted a field study from November 26 to December 2, 2017 (for seven
days). The team did not visit Cagayan de Oro City (CDO) in consideration of the security situation
in Mindanao. Therefore, the team could not inspect facilities of COWD. However, they were able
to grasp the current situation and consider methods of solving existing problems after conducting
visits to the San Jose Del Monte WD in the suburbs of Manila and the waterworks in Manila
alongside five staff members of COWD, and through discussions for four consecutive days, with
COWD’s General Manager, who had joined the team in Manila.
1.3 Study Team Members
The table below shows the members of the Study Team in this project.

Final Report
1-3
Table 1-1. Study Team Members Name Affiliation Position/duty
USHIO Ryota Office of Global Health Cooperation, International Affairs Division, Minister’s Secretariat, Ministry of Health, Labour and Welfare of Japan
Team Leader/ supervision of the study
MITSUNO Shiro Chief Engineer, Global Environment Department, International Division. Pacific Consultants Co., Ltd.
Project Manager/ management of the study
MORIMOTO Tatsuo
Chief Project Manager, International Division, Pacific Consultants Co., Ltd.
Guidance in project formation in water supply sector/study for a project for improving water purification facilities
TSUTSUMI Ena Engineer, Global Environment Department, International Division. Pacific Consultants Co., Ltd.
Data collection and analysis/cost estimation/ coordination
YAMAGUCHI Takeo - Expert in water supply sector
Councilor on Water Supply Technology, Japan International Corporation of Welfare Services (JICWELS)
Improvement of distribution pipe network/study on applicable technologies


Final Report
2-1
Chapter 2 Matters Related to Clarifying the Current State of this Project
2.1 Water Services in the Philippines and Problems therein
2.1.1 Current State of Water Supply Sector (at the national level)
(1) Current State of Water Services The Department of Public Works and Highways (DPWH) develops and operates small-scale
water services and provides technical assistance to water services in rural areas in the Philippines.
Local Government Units (LGUs) are responsible for Level-1 and Level-2 water services3 in their
respective service areas. WDs, which operate water services independently of LGUs, have
jurisdiction mainly over Level-3 water services, developing and managing local waterworks and
setting and collecting water charges. The Local Water Utilities Administration (LWUA) supports
the establishment of WDs and their operation and provides them with loans and technical
assistance.
The figure below depicts the relationship among the governmental organizations in the drinking
water supply sector in the Philippines mentioned above.
Source: 2015 Emerging Market Development Project – Project to Support the Construction of the Partner Country’s Industrial Policy and System (Ministry of Economy, Trade and Industry of Japan 2016), edited by the study team
Figure 2-1. Governmental Organizations Involved in Water Services in the Philippines
The Metropolitan Waterworks and Sewerage System (MWSS) controls the water supply and
sewerage services in the National Capital Region (NCR). MWSS manages and operates the water
3 The method of using water pumped up from “point” sources, such as wells, with equipment such as handpumps without using piping is referred to as a Level-1 water service. Water supply services through communal faucets and house connections are referred to as Level-2 and Level-3 water services, respectively.
Department of the Interior and Local
Government DILG
Department of Public works and Highways DPWH
Department of Health DOH
Department of Environment and
Natural Resources DOH
Local Government Units
LGUs
Local Water Utilities Administration
LWUA
Environmental Management
Bureau (EMB)
National Water Resource
Board (NWRB) Water District
Jurisdiction over Level-1 and Level-2
water services
Jurisdiction over Level-3 water service
National Economic and Development Authority
NEDA
Fiscal Year 2017 Project Formation Program in Water Supply Sector (Phase 1)
2-2
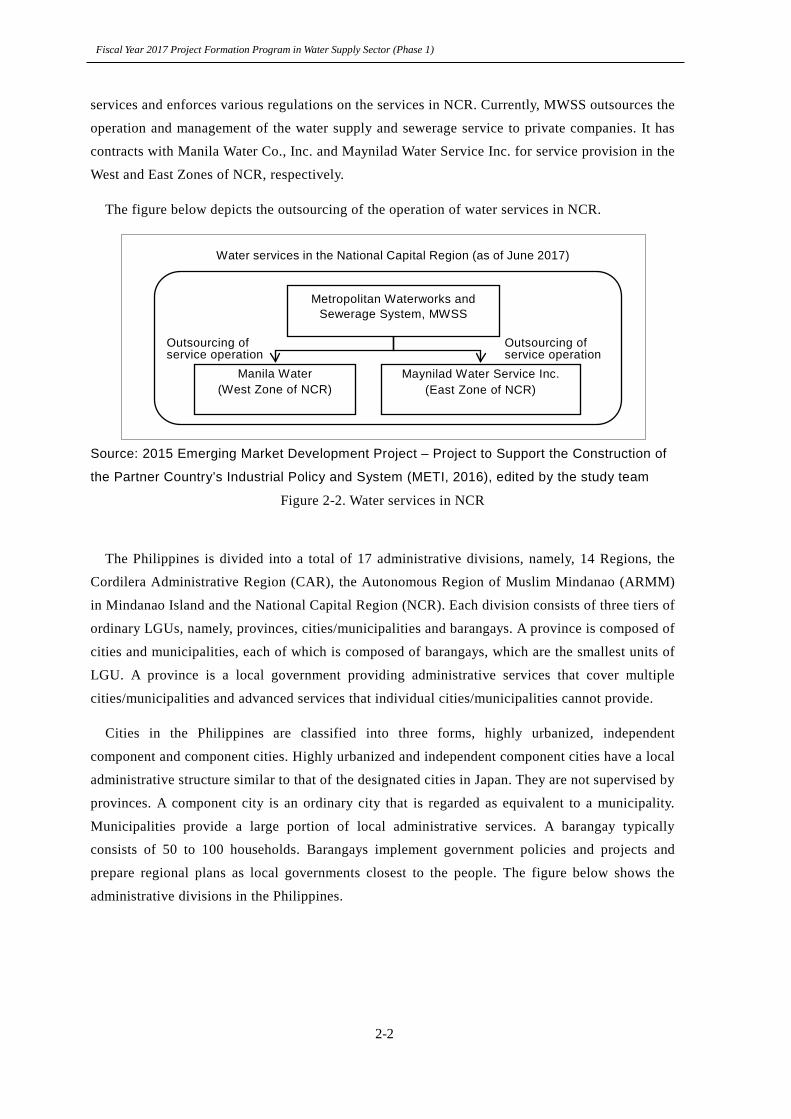
services and enforces various regulations on the services in NCR. Currently, MWSS outsources the
operation and management of the water supply and sewerage service to private companies. It has
contracts with Manila Water Co., Inc. and Maynilad Water Service Inc. for service provision in the
West and East Zones of NCR, respectively.
The figure below depicts the outsourcing of the operation of water services in NCR.
Source: 2015 Emerging Market Development Project – Project to Support the Construction of
the Partner Country’s Industrial Policy and System (METI, 2016), edited by the study team
Figure 2-2. Water services in NCR
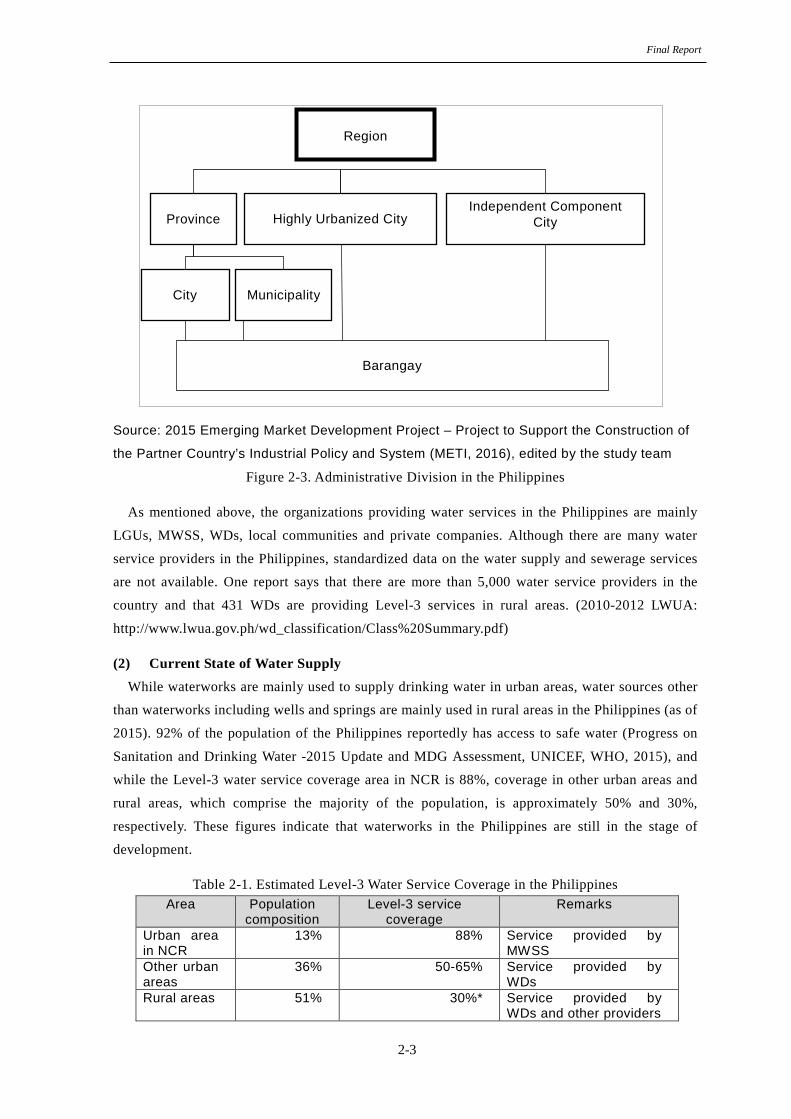
The Philippines is divided into a total of 17 administrative divisions, namely, 14 Regions, the
Cordilera Administrative Region (CAR), the Autonomous Region of Muslim Mindanao (ARMM)
in Mindanao Island and the National Capital Region (NCR). Each division consists of three tiers of
ordinary LGUs, namely, provinces, cities/municipalities and barangays. A province is composed of
cities and municipalities, each of which is composed of barangays, which are the smallest units of
LGU. A province is a local government providing administrative services that cover multiple
cities/municipalities and advanced services that individual cities/municipalities cannot provide.
Cities in the Philippines are classified into three forms, highly urbanized, independent
component and component cities. Highly urbanized and independent component cities have a local
administrative structure similar to that of the designated cities in Japan. They are not supervised by
provinces. A component city is an ordinary city that is regarded as equivalent to a municipality.
Municipalities provide a large portion of local administrative services. A barangay typically
consists of 50 to 100 households. Barangays implement government policies and projects and
prepare regional plans as local governments closest to the people. The figure below shows the
administrative divisions in the Philippines.
Metropolitan Waterworks and Sewerage System, MWSS
Manila Water (West Zone of NCR)
Maynilad Water Service Inc. (East Zone of NCR)
Outsourcing of service operation
Outsourcing of service operation
Water services in the National Capital Region (as of June 2017)
Final Report
2-3
Source: 2015 Emerging Market Development Project – Project to Support the Construction of
the Partner Country’s Industrial Policy and System (METI, 2016), edited by the study team
Figure 2-3. Administrative Division in the Philippines
As mentioned above, the organizations providing water services in the Philippines are mainly
LGUs, MWSS, WDs, local communities and private companies. Although there are many water
service providers in the Philippines, standardized data on the water supply and sewerage services
are not available. One report says that there are more than 5,000 water service providers in the
country and that 431 WDs are providing Level-3 services in rural areas. (2010-2012 LWUA:
http://www.lwua.gov.ph/wd_classification/Class%20Summary.pdf)
(2) Current State of Water Supply While waterworks are mainly used to supply drinking water in urban areas, water sources other
than waterworks including wells and springs are mainly used in rural areas in the Philippines (as of
2015). 92% of the population of the Philippines reportedly has access to safe water (Progress on
Sanitation and Drinking Water -2015 Update and MDG Assessment, UNICEF, WHO, 2015), and
while the Level-3 water service coverage area in NCR is 88%, coverage in other urban areas and
rural areas, which comprise the majority of the population, is approximately 50% and 30%,
respectively. These figures indicate that waterworks in the Philippines are still in the stage of
development.
Table 2-1. Estimated Level-3 Water Service Coverage in the Philippines Area Population
composition Level-3 service
coverage Remarks
Urban area in NCR
13% 88% Service provided by MWSS
Other urban areas
36% 50-65% Service provided by WDs
Rural areas 51% 30%* Service provided by WDs and other providers
Province Highly Urbanized City Independent Component
City
City
Region
Municipality
Barangay
Fiscal Year 2017 Project Formation Program in Water Supply Sector (Phase 1)
2-4
Area Population composition
Level-3 service coverage
Remarks
Total 100% 42-48% Source: Water supply and Sanitation Sector Assessment Strategy, and Road Map, Asian
Development bank, 2012, edited by Pacific Consultants
The source of the figure marked with * is the World Bank
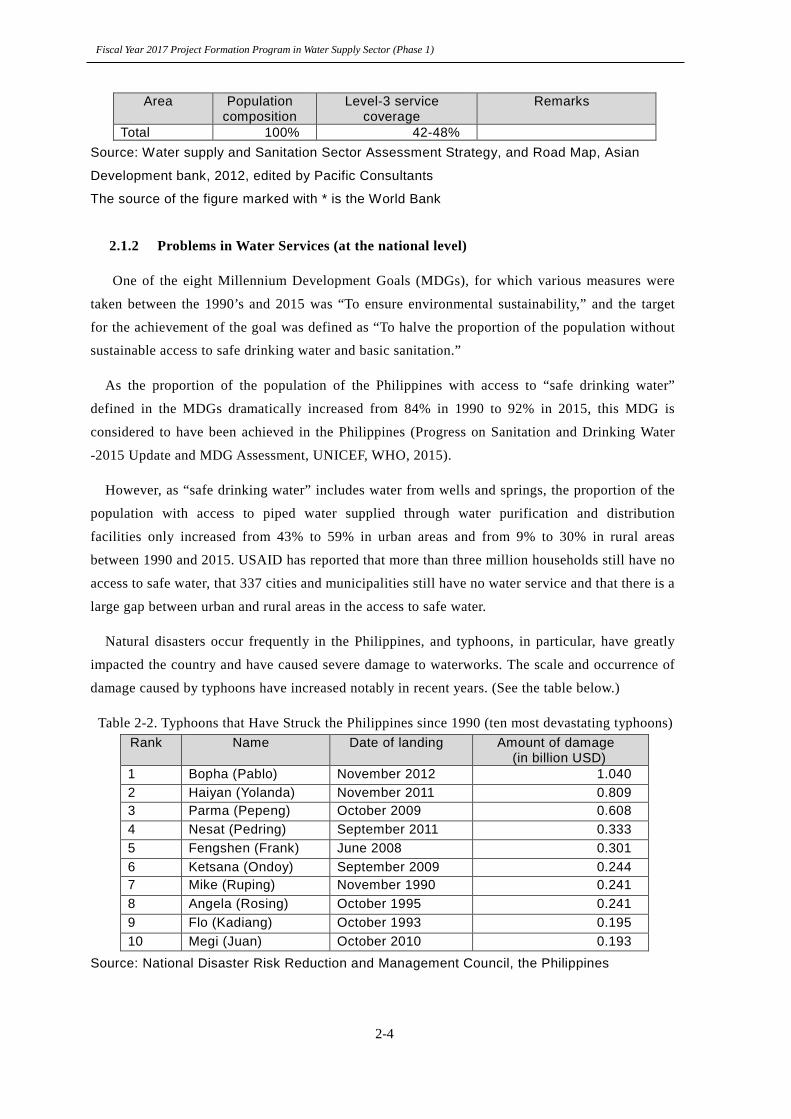
2.1.2 Problems in Water Services (at the national level)
One of the eight Millennium Development Goals (MDGs), for which various measures were
taken between the 1990’s and 2015 was “To ensure environmental sustainability,” and the target
for the achievement of the goal was defined as “To halve the proportion of the population without
sustainable access to safe drinking water and basic sanitation.”
As the proportion of the population of the Philippines with access to “safe drinking water”
defined in the MDGs dramatically increased from 84% in 1990 to 92% in 2015, this MDG is
considered to have been achieved in the Philippines (Progress on Sanitation and Drinking Water
-2015 Update and MDG Assessment, UNICEF, WHO, 2015).
However, as “safe drinking water” includes water from wells and springs, the proportion of the
population with access to piped water supplied through water purification and distribution
facilities only increased from 43% to 59% in urban areas and from 9% to 30% in rural areas
between 1990 and 2015. USAID has reported that more than three million households still have no
access to safe water, that 337 cities and municipalities still have no water service and that there is a
large gap between urban and rural areas in the access to safe water.
Natural disasters occur frequently in the Philippines, and typhoons, in particular, have greatly
impacted the country and have caused severe damage to waterworks. The scale and occurrence of
damage caused by typhoons have increased notably in recent years. (See the table below.)
Table 2-2. Typhoons that Have Struck the Philippines since 1990 (ten most devastating typhoons) Rank Name Date of landing Amount of damage
(in billion USD) 1 Bopha (Pablo) November 2012 1.040 2 Haiyan (Yolanda) November 2011 0.809 3 Parma (Pepeng) October 2009 0.608 4 Nesat (Pedring) September 2011 0.333 5 Fengshen (Frank) June 2008 0.301 6 Ketsana (Ondoy) September 2009 0.244 7 Mike (Ruping) November 1990 0.241 8 Angela (Rosing) October 1995 0.241 9 Flo (Kadiang) October 1993 0.195 10 Megi (Juan) October 2010 0.193
Source: National Disaster Risk Reduction and Management Council, the Philippines
Final Report
2-5
Due to such factors as the continuous population growth and the discharge of untreated sewage,
the water supply in the Philippines is expected to fall into crisis in the future unless effective
measures are taken against those factors. In fact, a study conducted by the World Resources
Institute (WRI) predicts that the Philippines is likely to experience severe water shortage by 2040
due to the combined impact of these factors (Aqueduct Projected Water Stress Country Rankings,
WRI, 2015). In a study of the list of countries ranked by vulnerability to water shortage conducted
by WRI, the Philippines ranks 57th among the 167 countries studied. For these reasons,
comprehensive measures to improve water services need to be taken urgently (Aqueduct Projected
Water Stress Country Rankings, WRI, 2015).
The Government of the Philippines is aware that the improvement of the capacity of WDs is
essential for the prevention of such a water shortage because WDs play a significant role in the
piped water supply in rural areas. However, as there are more than 400 WDs in the entire country,
it is extremely difficult to improve the capacity of all of them in a single project. Therefore, it is
recommended that a model WD for water services in the Philippines is developed with a high level
of capacity for the sound operation of water services and that the capacity of this model WD is
extended nationwide. The Metropolitan Cebu WD and LWUA have been the main beneficiaries of
assistance from Japan to the Philippines in the rural water supply sector.
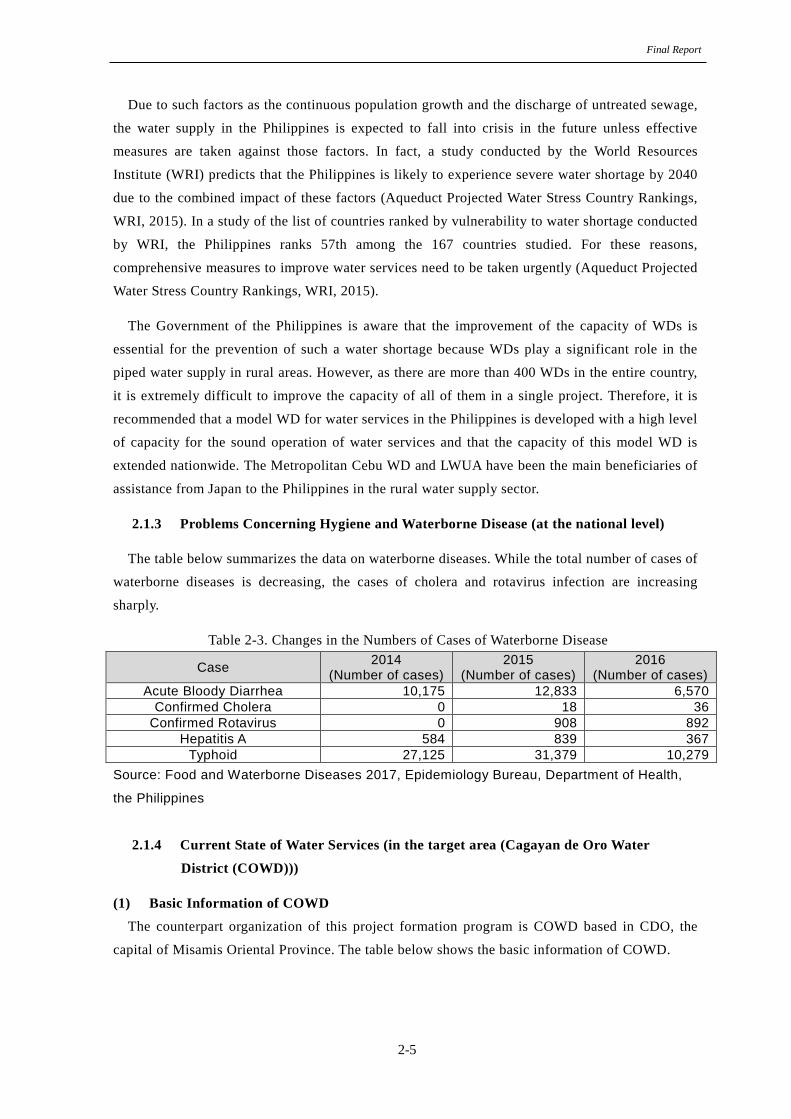
2.1.3 Problems Concerning Hygiene and Waterborne Disease (at the national level)
The table below summarizes the data on waterborne diseases. While the total number of cases of
waterborne diseases is decreasing, the cases of cholera and rotavirus infection are increasing
sharply.
Table 2-3. Changes in the Numbers of Cases of Waterborne Disease
Case 2014 (Number of cases)
2015 (Number of cases)
2016 (Number of cases)
Acute Bloody Diarrhea 10,175 12,833 6,570 Confirmed Cholera 0 18 36
Confirmed Rotavirus 0 908 892 Hepatitis A 584 839 367
Typhoid 27,125 31,379 10,279 Source: Food and Waterborne Diseases 2017, Epidemiology Bureau, Department of Health,
the Philippines
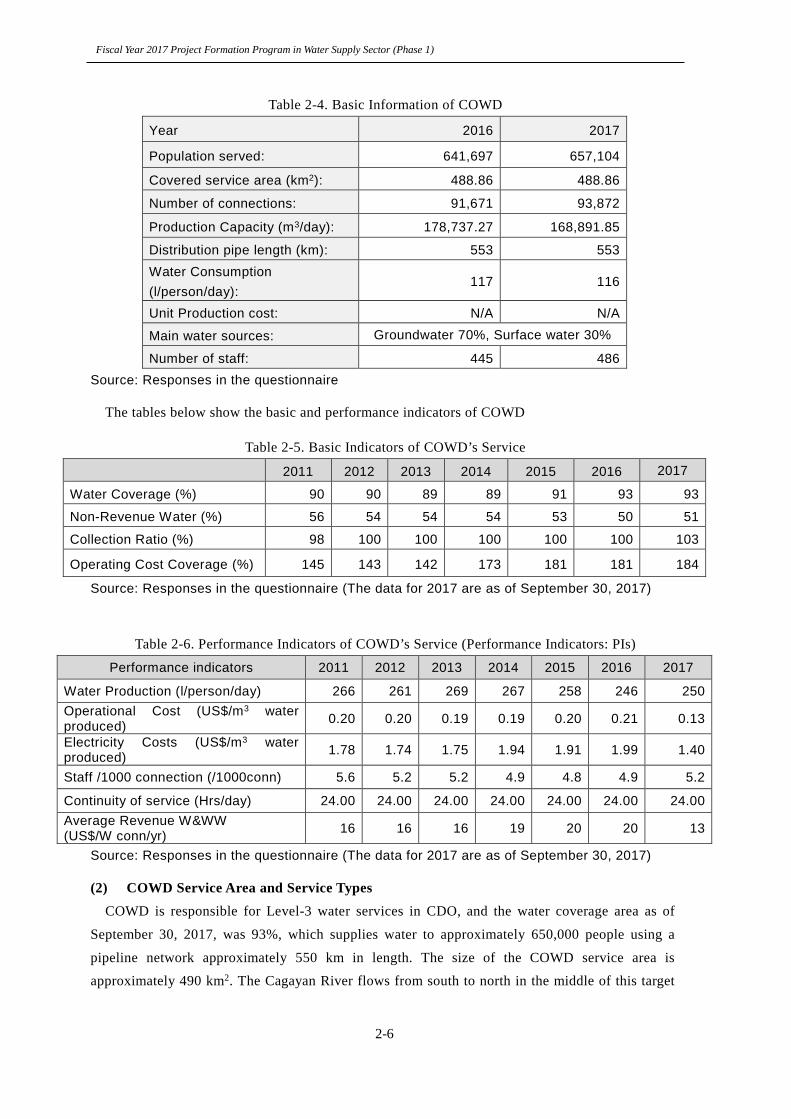
2.1.4 Current State of Water Services (in the target area (Cagayan de Oro Water
District (COWD)))
(1) Basic Information of COWD The counterpart organization of this project formation program is COWD based in CDO, the
capital of Misamis Oriental Province. The table below shows the basic information of COWD.
Fiscal Year 2017 Project Formation Program in Water Supply Sector (Phase 1)
2-6
Table 2-4. Basic Information of COWD
Year 2016 2017
Population served: 641,697 657,104
Covered service area (km2): 488.86 488.86
Number of connections: 91,671 93,872
Production Capacity (m3/day): 178,737.27 168,891.85
Distribution pipe length (km): 553 553 Water Consumption (l/person/day):
117 116
Unit Production cost: N/A N/A
Main water sources: Groundwater 70%, Surface water 30%
Number of staff: 445 486 Source: Responses in the questionnaire
The tables below show the basic and performance indicators of COWD
Table 2-5. Basic Indicators of COWD’s Service
2011 2012 2013 2014 2015 2016 2017
Water Coverage (%) 90 90 89 89 91 93 93
Non-Revenue Water (%) 56 54 54 54 53 50 51
Collection Ratio (%) 98 100 100 100 100 100 103
Operating Cost Coverage (%) 145 143 142 173 181 181 184
Source: Responses in the questionnaire (The data for 2017 are as of September 30, 2017)
Table 2-6. Performance Indicators of COWD’s Service (Performance Indicators: PIs)
Performance indicators 2011 2012 2013 2014 2015 2016 2017
Water Production (l/person/day) 266 261 269 267 258 246 250 Operational Cost (US$/m3 water produced) 0.20 0.20 0.19 0.19 0.20 0.21 0.13
Electricity Costs (US$/m3 water produced) 1.78 1.74 1.75 1.94 1.91 1.99 1.40
Staff /1000 connection (/1000conn) 5.6 5.2 5.2 4.9 4.8 4.9 5.2
Continuity of service (Hrs/day) 24.00 24.00 24.00 24.00 24.00 24.00 24.00 Average Revenue W&WW (US$/W conn/yr) 16 16 16 19 20 20 13
Source: Responses in the questionnaire (The data for 2017 are as of September 30, 2017)
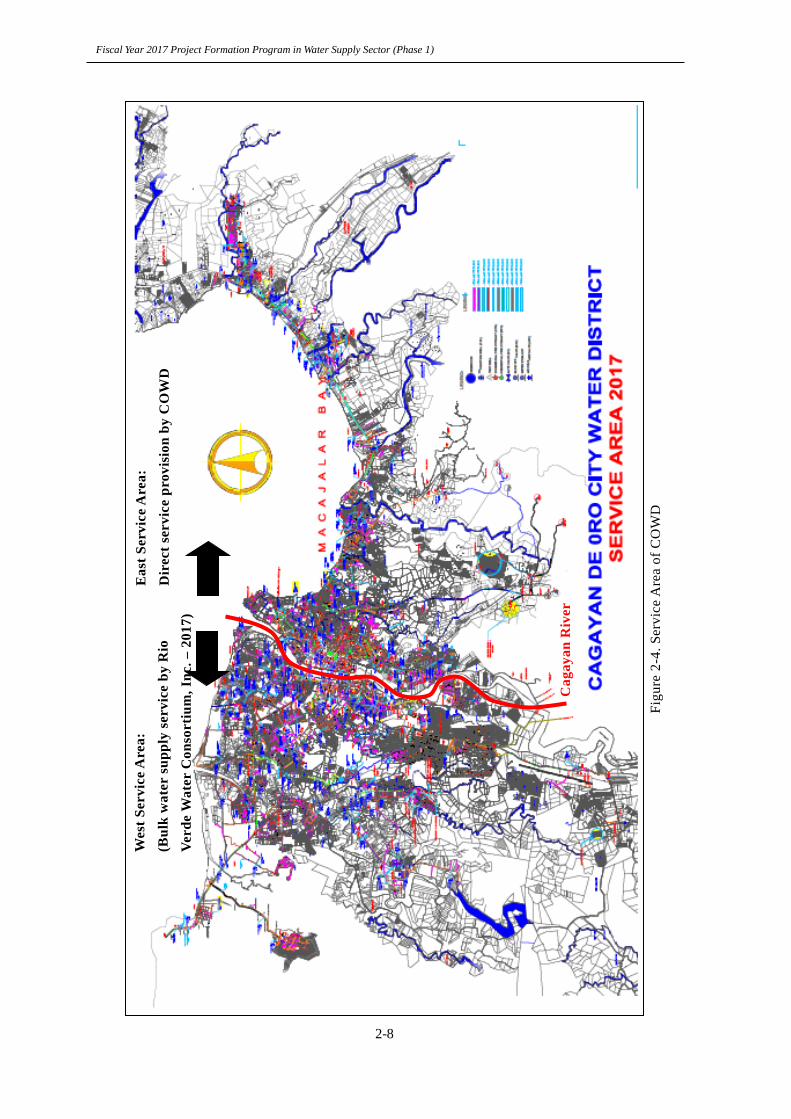
(2) COWD Service Area and Service Types COWD is responsible for Level-3 water services in CDO, and the water coverage area as of
September 30, 2017, was 93%, which supplies water to approximately 650,000 people using a
pipeline network approximately 550 km in length. The size of the COWD service area is
approximately 490 km2. The Cagayan River flows from south to north in the middle of this target

Final Report
2-7
area. COWD divides the service area into East and West Service Areas along the river and provides
services separately in the two areas. (See “Service Area of COWD” on the next page.)
Fiscal Year 2017 Project Formation Program in Water Supply Sector (Phase 1)
2-8
Wes
t Ser
vice
Are
a:
(Bul
k w
ater
sup
ply
serv
ice
by R
io
Verd
e W
ater
Con
sort
ium
, Inc
. – 2
017)
Eas
t Ser
vice
Are
a:
Dir
ect s
ervi
ce p
rovi
sion
by
CO
WD
Cag
ayan
Riv
er
Figu
re 2
-4. S
ervi
ce A
rea
of C
OW
D

Final Report
2-9
Rio Verde Water Consortium, Inc. provided bulk water supply services in the West Service Area
from 2007 until 2017 under a contract with COWD. The conditions of the contract included a daily
water supply of 40,000m3 and water pressure requirement of 70 psi at the take-off point (TOP).
Cagayan de Oro Bulk Water, Inc., a special purpose company (SPC) established by COWD and
Metro Pacific Water Investment, Inc., was scheduled to begin bulk water supply services in the
West Service Area in January 2018. In addition to the bulk water supply service, direct water
supply by COWD is used for water services in the West Service Area.
Meanwhile, COWD directly operates water services in the East Service Area at present.
However, this direct service is planned to be replaced by a bulk water supply service. The Study
Team was informed that COWD was making preparations for various procedures required for this
replacement and the new service is scheduled to begin in January 2019. The table below
summarizes the current state and future plans for the water services as mentioned above.
Table 2-7. Water Services of COWD Item West Service Area East Service Area
Current Service Bulk water supply service by Rio Verde Water Consortium Inc. (2007-2017) and water supply by COWD
Direct service provision by COWD
Future service Bulk water supply service by a SPC (2018 -)
Bulk water supply service (to begin in 2019)
Main water source Surface water (from the Cagayan River), groundwater
Groundwater
Source: Study Team
(3) Water Sources of Water Service of COWD COWD uses surface water mainly derived from the Cagayan River, spring water and
groundwater as the main water sources for its services. The Cagayan River is the water source of
the bulk water supply service in the West Service Area. The water taken from the river is stored
and distributed after being treated in a purification plant. This plant for the treatment of water
taken from the Cagayan River is the only purification plant owned by COWD. Groundwater (in
deep wells) is the main source of water in the areas where COWD provides the direct water supply
service in both the East and West Service Areas. Production wells (PWs) at 25 locations are
currently in use. These water sources are listed in the table below.
Table 2-8. List of Water Sources of COWD
Water resource Amount of intake Remarks (Depth, water quantity, etc. for wells)
PW No. 1 114 lps Deep Well PW No. 2 63 lps Deep Well PW No. 3A 16 lps Deep Well PW No. 4 50 lps Deep Well PW No. 5 50 lps Deep Well PW No. 7 50 lps Deep Well PW No. 8 63 lps Deep Well
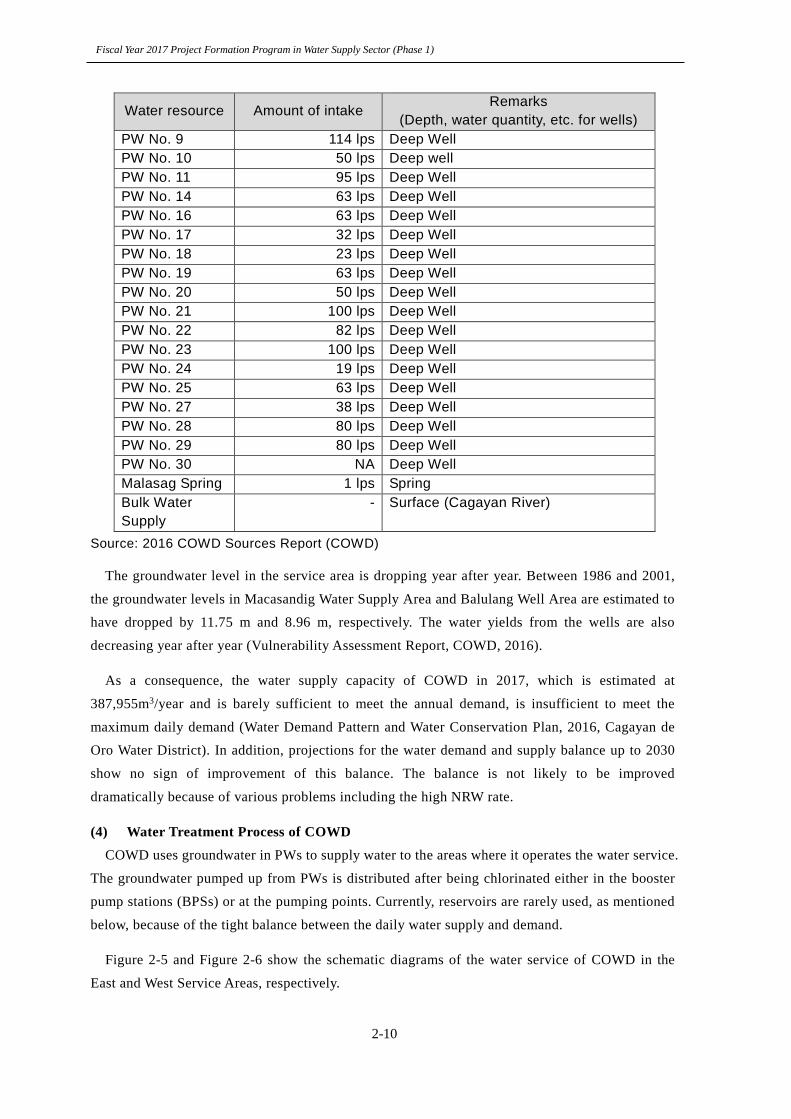
Fiscal Year 2017 Project Formation Program in Water Supply Sector (Phase 1)
2-10
Water resource Amount of intake Remarks (Depth, water quantity, etc. for wells)
PW No. 9 114 lps Deep Well PW No. 10 50 lps Deep well PW No. 11 95 lps Deep Well PW No. 14 63 lps Deep Well PW No. 16 63 lps Deep Well PW No. 17 32 lps Deep Well PW No. 18 23 lps Deep Well PW No. 19 63 lps Deep Well PW No. 20 50 lps Deep Well PW No. 21 100 lps Deep Well PW No. 22 82 lps Deep Well PW No. 23 100 lps Deep Well PW No. 24 19 lps Deep Well PW No. 25 63 lps Deep Well PW No. 27 38 lps Deep Well PW No. 28 80 lps Deep Well PW No. 29 80 lps Deep Well PW No. 30 NA Deep Well Malasag Spring 1 lps Spring Bulk Water Supply
- Surface (Cagayan River)
Source: 2016 COWD Sources Report (COWD)
The groundwater level in the service area is dropping year after year. Between 1986 and 2001,
the groundwater levels in Macasandig Water Supply Area and Balulang Well Area are estimated to
have dropped by 11.75 m and 8.96 m, respectively. The water yields from the wells are also
decreasing year after year (Vulnerability Assessment Report, COWD, 2016).
As a consequence, the water supply capacity of COWD in 2017, which is estimated at
387,955m3/year and is barely sufficient to meet the annual demand, is insufficient to meet the
maximum daily demand (Water Demand Pattern and Water Conservation Plan, 2016, Cagayan de
Oro Water District). In addition, projections for the water demand and supply balance up to 2030
show no sign of improvement of this balance. The balance is not likely to be improved
dramatically because of various problems including the high NRW rate.
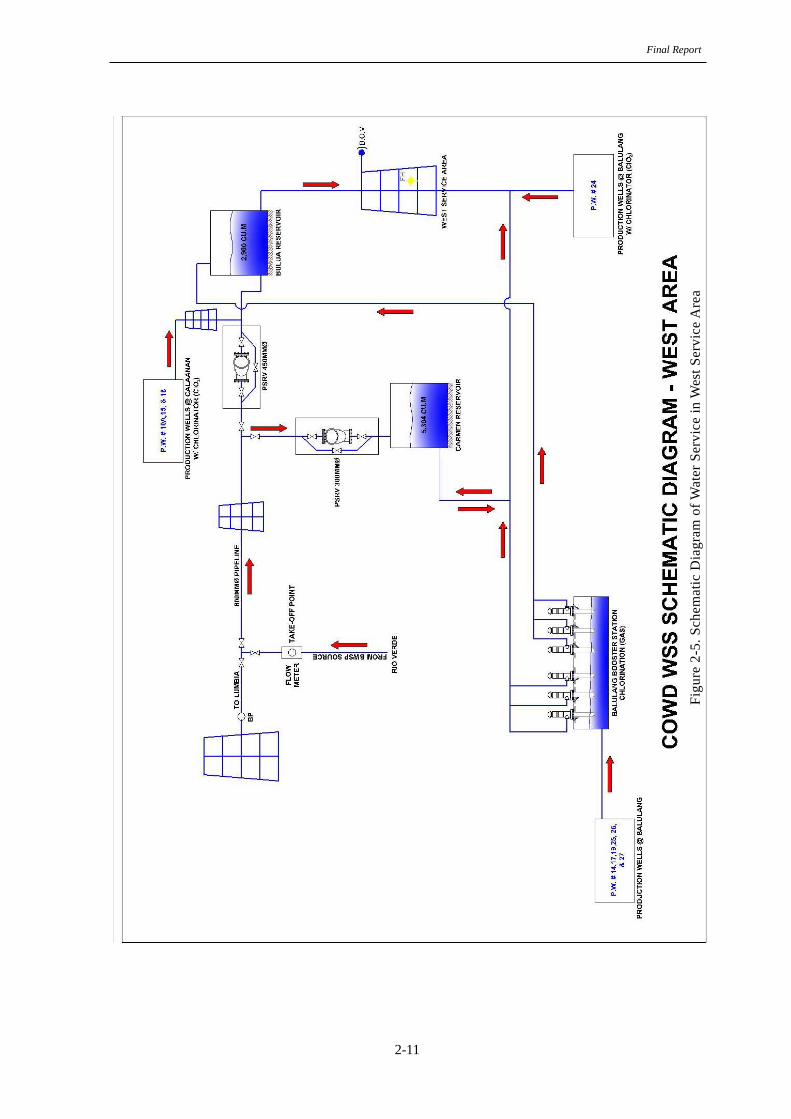
(4) Water Treatment Process of COWD COWD uses groundwater in PWs to supply water to the areas where it operates the water service.
The groundwater pumped up from PWs is distributed after being chlorinated either in the booster
pump stations (BPSs) or at the pumping points. Currently, reservoirs are rarely used, as mentioned
below, because of the tight balance between the daily water supply and demand.
Figure 2-5 and Figure 2-6 show the schematic diagrams of the water service of COWD in the
East and West Service Areas, respectively.
Final Report
2-11
Figu
re 2
-5. S
chem
atic
Dia
gram
of W
ater
Ser
vice
in W
est S
ervi
ce A
rea

Fiscal Year 2017 Project Formation Program in Water Supply Sector (Phase 1)
2-12
(5) 財務状況
Figu
re 2
-6. S
chem
atic
Dia
gram
of W
ater
Ser
vice
in E
ast S
ervi
ce A
rea
Final Report
2-13
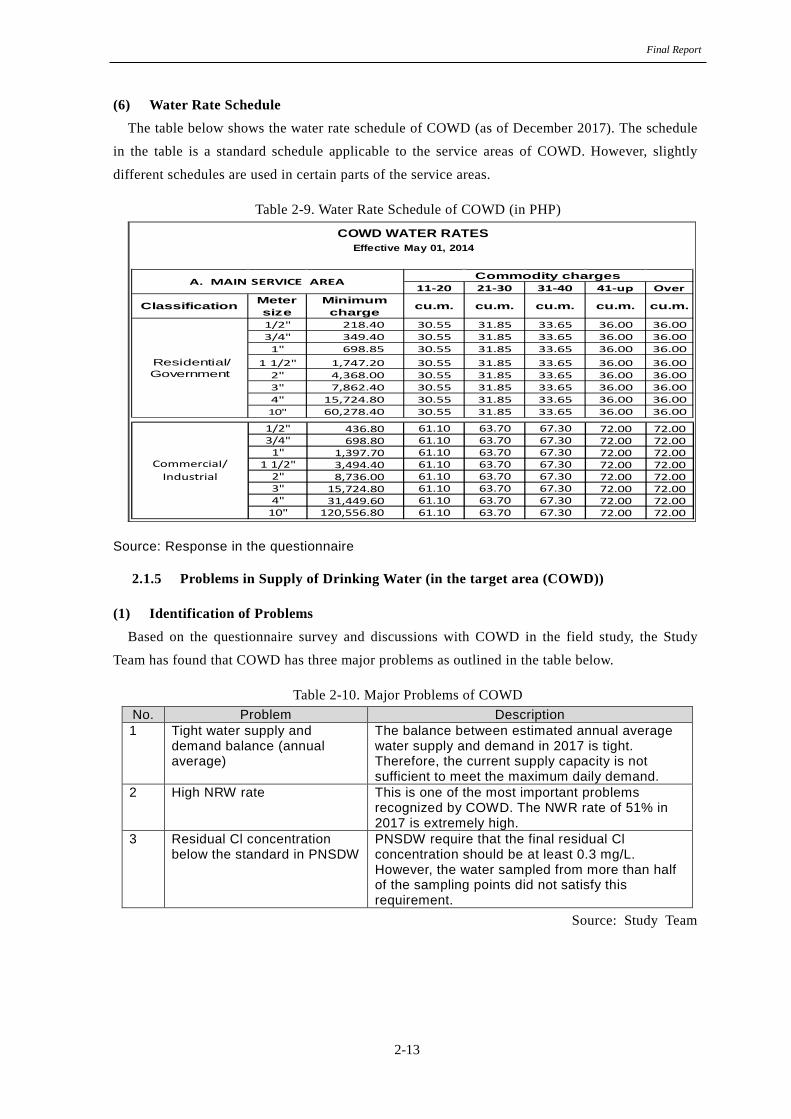
(6) Water Rate Schedule The table below shows the water rate schedule of COWD (as of December 2017). The schedule
in the table is a standard schedule applicable to the service areas of COWD. However, slightly
different schedules are used in certain parts of the service areas.
Table 2-9. Water Rate Schedule of COWD (in PHP)
COWD WATER RATESEffective May 01, 2014
11-20 21-30 31-40 41-up Over
Classification Meter size
Minimum charge cu.m. cu.m. cu.m. cu.m. cu.m.
1/2" 218.40 30.55 31.85 33.65 36.00 36.003/4" 349.40 30.55 31.85 33.65 36.00 36.001" 698.85 30.55 31.85 33.65 36.00 36.00
1 1/2" 1,747.20 30.55 31.85 33.65 36.00 36.002" 4,368.00 30.55 31.85 33.65 36.00 36.003" 7,862.40 30.55 31.85 33.65 36.00 36.004" 15,724.80 30.55 31.85 33.65 36.00 36.0010" 60,278.40 30.55 31.85 33.65 36.00 36.00
Commodity chargesA. MAIN SERVICE AREA
Residential/ Government
1/2" 436.80 61.10 63.70 67.30 72.00 72.003/4" 698.80 61.10 63.70 67.30 72.00 72.001" 1,397.70 61.10 63.70 67.30 72.00 72.00
1 1/2" 3,494.40 61.10 63.70 67.30 72.00 72.002" 8,736.00 61.10 63.70 67.30 72.00 72.003" 15,724.80 61.10 63.70 67.30 72.00 72.004" 31,449.60 61.10 63.70 67.30 72.00 72.00
10" 120,556.80 61.10 63.70 67.30 72.00 72.00
CommerciaI/ Industrial
Source: Response in the questionnaire
2.1.5 Problems in Supply of Drinking Water (in the target area (COWD))
(1) Identification of Problems Based on the questionnaire survey and discussions with COWD in the field study, the Study
Team has found that COWD has three major problems as outlined in the table below.
Table 2-10. Major Problems of COWD No. Problem Description 1 Tight water supply and
demand balance (annual average)
The balance between estimated annual average water supply and demand in 2017 is tight. Therefore, the current supply capacity is not sufficient to meet the maximum daily demand.
2 High NRW rate This is one of the most important problems recognized by COWD. The NWR rate of 51% in 2017 is extremely high.
3 Residual Cl concentration below the standard in PNSDW
PNSDW require that the final residual Cl concentration should be at least 0.3 mg/L. However, the water sampled from more than half of the sampling points did not satisfy this requirement.
Source: Study Team

Fiscal Year 2017 Project Formation Program in Water Supply Sector (Phase 1)
2-14
1) Tight Water Supply and Demand Balance (Annual Average)
As shown in the table below, the amount of water supplied by COWD barely met the water
demand in its service area in 2017. Therefore, measures should be taken to improve the supply and
demand balance.
Table 2-11. Water Supply and Demand Balance in 2017 (in m3) No. Demand Water supply NRW Total
Residential 33,012,969 Commercial 317,892 Government 93,372 Total 33,424,322 *67,624,554 33,812,277 +387,955
*Value calculated from facility capability
Source: Water Demand Management and Water Conservation Plan, COWD
However, as COWD heavily depends on groundwater as the water source of its service, it is
difficult to expect a dramatic improvement in the actual water sources. Therefore, of the
above-mentioned three problems, the Study Team recommends that COWD should take urgent
measures to reduce the high NRW rate, and to provide customers with a limited, quantity of piped
water of a quality that is compliant with PNSDW.
2) NRW Reduction
The high NRW rate is one of the most serious problems of COWD. The rate at the establishment
of COWD (in 1973) was 82.26%. Although it dropped below 13% in the 1980’s, it has been
between 50% and 60% since 2007 (Water Demand Management and Water Conservation Plan,
2016, COWD). As shown in the figure below, the NRW rate has remained almost unchanged in
recent years. It is assumed that the population growth caused by urbanization and resultant
expansion of the service area are among the causes of this lack of improvement. In addition, pipe
flushing is implemented periodically in order to ensure water quality and avoid contamination by
unknown water inflow into the pipe after power outage etc., and this flushing may be one of the
big causes of high NRW rate.
Figure 2-7. Changes in NRW Rate of COWD in Recent Years (unit: %)

Final Report
2-15
Against this background, JICA conducted a feasibility study for a project to reduce the NRW
rate of COWD’s service in 2014. The result of the study was used for the formulation of “Besecure
Project,” a project for the implementation of comprehensive measures to reduce the NRW rate. The
project was implemented with assistance from USAID and the Coca-Cola Foundation. The planned
implementation period of the project was four years from 2014. The project was completed in May
2017. Since then, COWD has been implementing measures to reduce NRW independently using a
loan from the Development Bank of the Philippines (DBP). COWD plans to reduce NRW with the
establishment of DMAs and the implementation of pilot projects.
Because COWD has received assistance from many donors for the reduction in NRW and has
prepared a plan to implement measures to reduce NRW with loan from DBP, as mentioned above,
the reduction in NRW will not be included in this project.
3) Residual Cl below PNSDW Standards
Another very serious problem of COWD is the low residual Cl concentration. The table below
shows the standards for residual Cl defined in PNSDW.
Table 2-12. Philippine National Standards for Drinking Water (excerpt of the part on residual Cl) Standard Standard value
Free residual Cl (minimum) 0.3mg/L Residual Cl (maximum) 1.5mg/L
Source: Department of Health (DOH), the Philippines
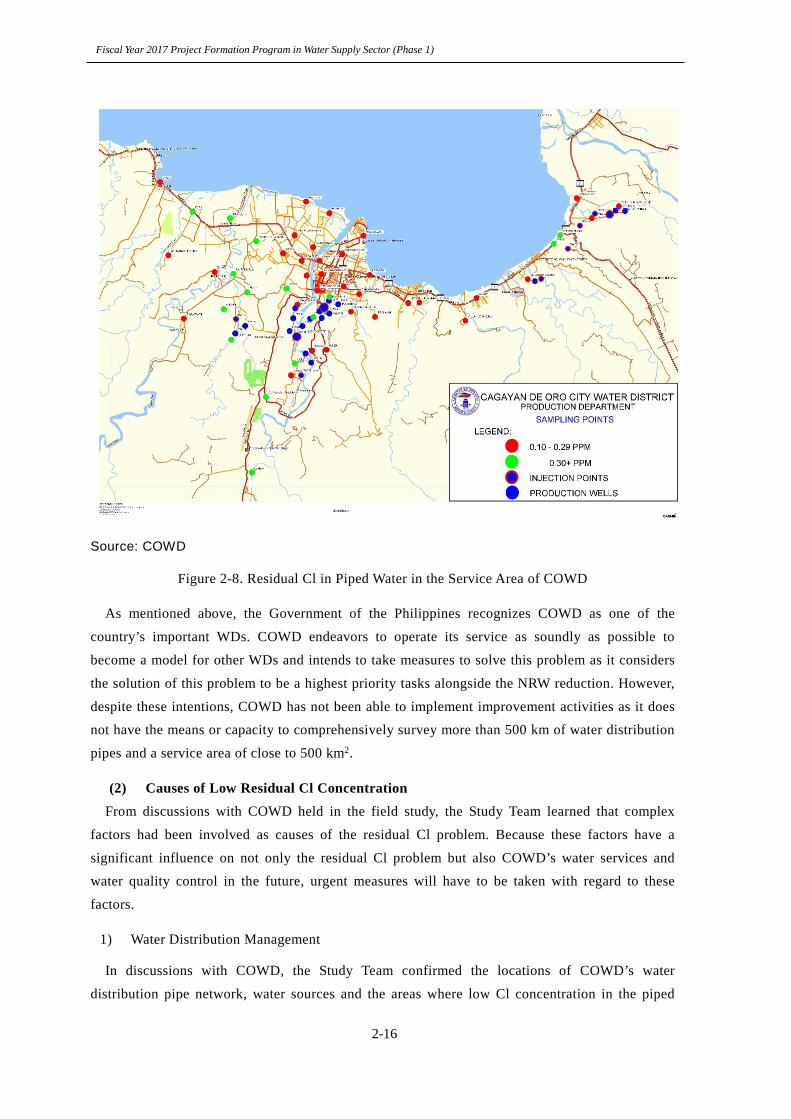
Meanwhile, the figure below shows the residual Cl concentration in piped water sampled in the
service area of COWD. Water samples taken at approximately 78% of the sampling points did not
satisfy the standards mentioned above (as of May 2016).
Fiscal Year 2017 Project Formation Program in Water Supply Sector (Phase 1)
2-16
Source: COWD
Figure 2-8. Residual Cl in Piped Water in the Service Area of COWD
As mentioned above, the Government of the Philippines recognizes COWD as one of the
country’s important WDs. COWD endeavors to operate its service as soundly as possible to
become a model for other WDs and intends to take measures to solve this problem as it considers
the solution of this problem to be a highest priority tasks alongside the NRW reduction. However,
despite these intentions, COWD has not been able to implement improvement activities as it does
not have the means or capacity to comprehensively survey more than 500 km of water distribution
pipes and a service area of close to 500 km2.
(2) Causes of Low Residual Cl Concentration From discussions with COWD held in the field study, the Study Team learned that complex
factors had been involved as causes of the residual Cl problem. Because these factors have a
significant influence on not only the residual Cl problem but also COWD’s water services and
water quality control in the future, urgent measures will have to be taken with regard to these
factors.
1) Water Distribution Management
In discussions with COWD, the Study Team confirmed the locations of COWD’s water
distribution pipe network, water sources and the areas where low Cl concentration in the piped

Final Report
2-17
water is frequently observed. The team also noted the rapid increase in water demand and
uncontrolled development of residential areas by housing developers in the entire service area.
Because a bulk water supply service is being implemented and large-diameter pipelines have been
installed in certain parts, there is a correlation between the distance of pipelines from the reservoir/
detention time, and consumption of Cl in the West Service Area. Meanwhile, in the East Service
Area, diameter of the pipelines is insufficient to meet the water demand, and it tends to be in low
water pressure in the pipelines below the standard level (suspension of water supply or creation of
negative pressure in water pipes) and the Cl consumption seems to increase rapidly when the
pressure has dropped. In addition, COWD and the Study Team confirmed that the elevated
reservoirs of COWD have not functioned due to no inflow into the elevated reservoirs (described
later, see figure 2-9), and water is supplied eight hours per day instead of 24 hours per day in
certain parts of the service area because of these factors.
As mentioned above, there is a high NRW rate (50%) for COWD’s service. Water leakage is
presumed to account for a significant proportion of the NRW. If water in a distribution pipe is
appropriately pressurized, water in the pipe is expected to leak out. If water in a pipe is negatively
pressurized, unknown water may flow into the pipe. In fact, the Study Team was informed that
negative pressure in a pipe had caused an inflow of water into the pipe not only at the time of the
shortage of pressure during ordinary operation but also at the time of power outages. As sewage
generated near water distribution pipelines is drained through infiltration trenches and treated in
septic tanks in some areas, there is concern over the infiltration of domestic wastewater in
groundwater. As this infiltration may increase the concentration of contaminants such as
ammonium in groundwater, such a high concentration of contaminants is suspected to contribute
considerably to the high Cl consumption.
Due to this situation, it is possible that the water distribution pipe network and allotment of
water sources which are not suited to meeting the increasing water demand are basic causes of the
problem. The Cl concentration problem does not seem to be serious in the West Service Area
because water is received from the bulk water supply service and there is some margin in the water
transport capacity of the pipelines that were installed with consideration for anticipated demand.
Meanwhile, in the East Service Area, such pipeline installation as considering for anticipated
demand is not implemented, and therefore, there may be a continued shortage of water sources and
pipeline capacity. COWD has reservoirs in its service area, and mainly the reservoirs are two
types: elevated or on-ground. Elevated reservoirs are called Balancing Reservoir, and it has only
one pipe which has roles of inflow and outflow at the same time. Therefore, it is also considered as
regulated reservoirs (see the following figure).
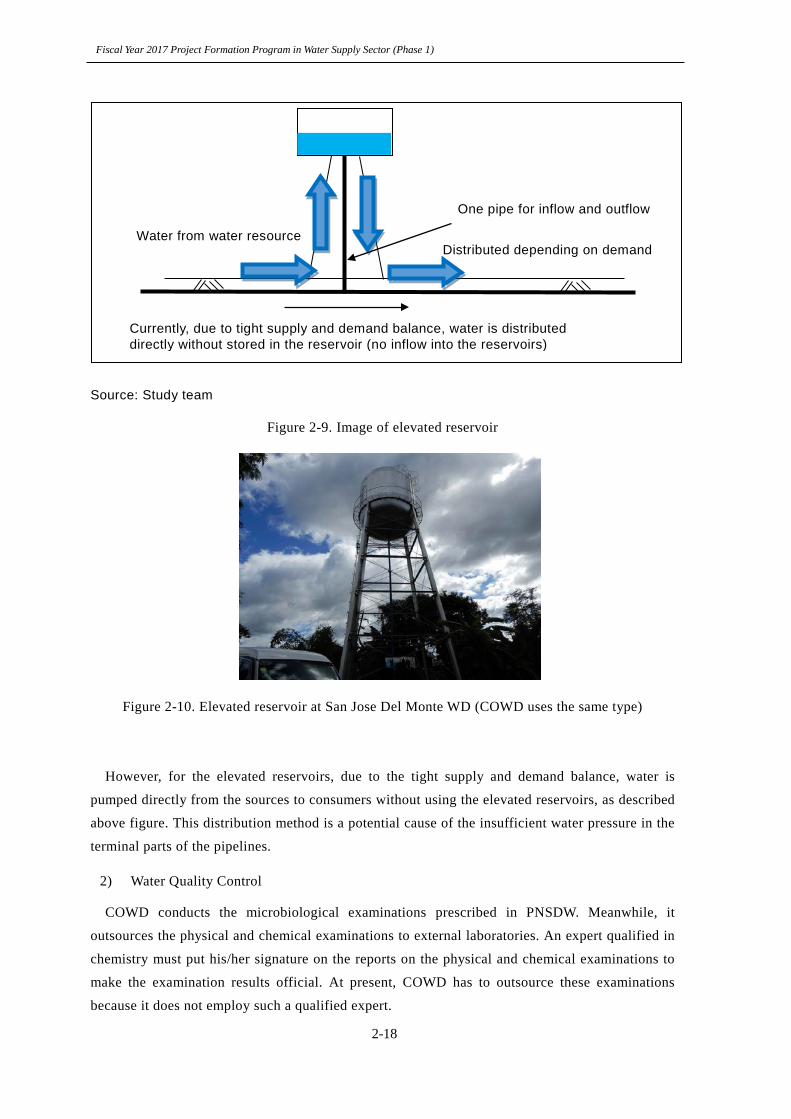
Fiscal Year 2017 Project Formation Program in Water Supply Sector (Phase 1)
2-18
Source: Study team
Figure 2-9. Image of elevated reservoir
Figure 2-10. Elevated reservoir at San Jose Del Monte WD (COWD uses the same type)
However, for the elevated reservoirs, due to the tight supply and demand balance, water is
pumped directly from the sources to consumers without using the elevated reservoirs, as described
above figure. This distribution method is a potential cause of the insufficient water pressure in the
terminal parts of the pipelines.
2) Water Quality Control
COWD conducts the microbiological examinations prescribed in PNSDW. Meanwhile, it
outsources the physical and chemical examinations to external laboratories. An expert qualified in
chemistry must put his/her signature on the reports on the physical and chemical examinations to
make the examination results official. At present, COWD has to outsource these examinations
because it does not employ such a qualified expert.
Currently, due to tight supply and demand balance, water is distributed directly without stored in the reservoir (no inflow into the reservoirs)
One pipe for inflow and outflow
Water from water resource Distributed depending on demand
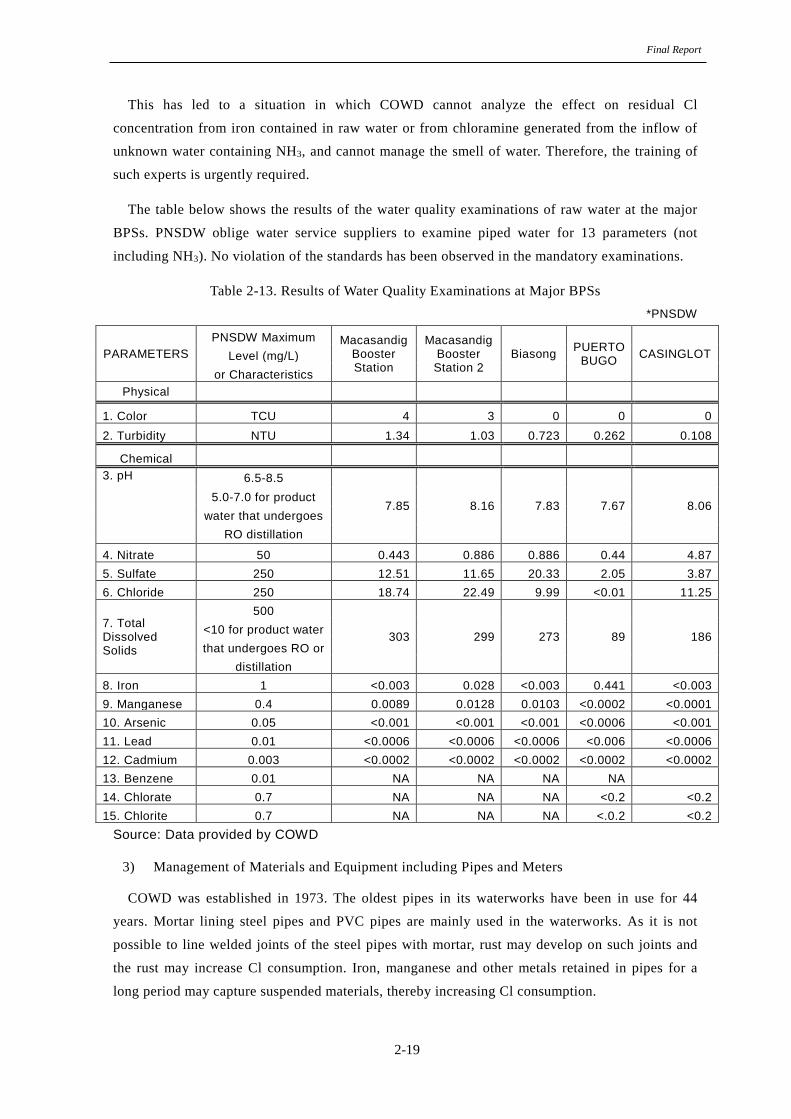
Final Report
2-19
This has led to a situation in which COWD cannot analyze the effect on residual Cl
concentration from iron contained in raw water or from chloramine generated from the inflow of
unknown water containing NH3, and cannot manage the smell of water. Therefore, the training of
such experts is urgently required.
The table below shows the results of the water quality examinations of raw water at the major
BPSs. PNSDW oblige water service suppliers to examine piped water for 13 parameters (not
including NH3). No violation of the standards has been observed in the mandatory examinations.
Table 2-13. Results of Water Quality Examinations at Major BPSs
*PNSDW
PARAMETERS PNSDW Maximum Macasandig
Booster Station
Macasandig Booster Station 2
Biasong PUERTO BUGO CASINGLOT Level (mg/L)
or Characteristics Physical
1. Color TCU 4 3 0 0 0 2. Turbidity NTU 1.34 1.03 0.723 0.262 0.108
Chemical 3. pH 6.5-8.5
7.85 8.16 7.83 7.67 8.06 5.0-7.0 for product
water that undergoes RO distillation
4. Nitrate 50 0.443 0.886 0.886 0.44 4.87 5. Sulfate 250 12.51 11.65 20.33 2.05 3.87 6. Chloride 250 18.74 22.49 9.99 <0.01 11.25
7. Total Dissolved Solids
500
303 299 273 89 186 <10 for product water that undergoes RO or
distillation 8. Iron 1 <0.003 0.028 <0.003 0.441 <0.003 9. Manganese 0.4 0.0089 0.0128 0.0103 <0.0002 <0.0001 10. Arsenic 0.05 <0.001 <0.001 <0.001 <0.0006 <0.001 11. Lead 0.01 <0.0006 <0.0006 <0.0006 <0.006 <0.0006 12. Cadmium 0.003 <0.0002 <0.0002 <0.0002 <0.0002 <0.0002 13. Benzene 0.01 NA NA NA NA 14. Chlorate 0.7 NA NA NA <0.2 <0.2 15. Chlorite 0.7 NA NA NA <.0.2 <0.2
Source: Data provided by COWD
3) Management of Materials and Equipment including Pipes and Meters
COWD was established in 1973. The oldest pipes in its waterworks have been in use for 44
years. Mortar lining steel pipes and PVC pipes are mainly used in the waterworks. As it is not
possible to line welded joints of the steel pipes with mortar, rust may develop on such joints and
the rust may increase Cl consumption. Iron, manganese and other metals retained in pipes for a
long period may capture suspended materials, thereby increasing Cl consumption.
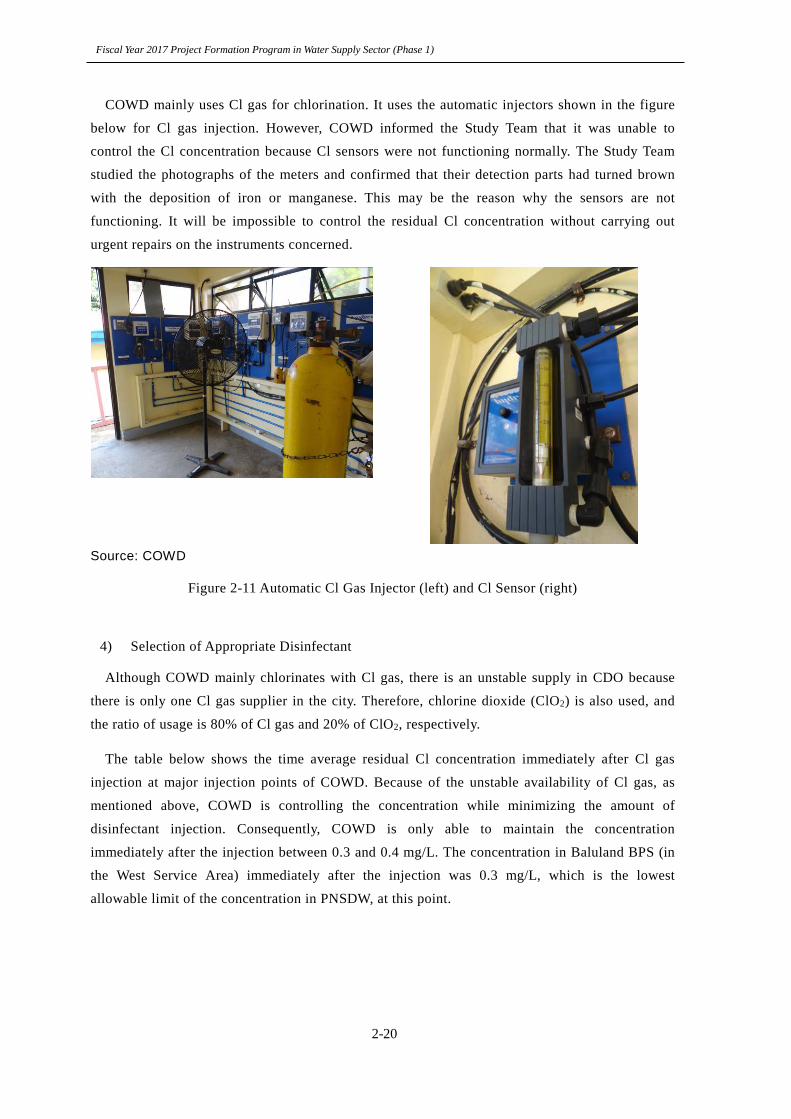
Fiscal Year 2017 Project Formation Program in Water Supply Sector (Phase 1)
2-20
COWD mainly uses Cl gas for chlorination. It uses the automatic injectors shown in the figure
below for Cl gas injection. However, COWD informed the Study Team that it was unable to
control the Cl concentration because Cl sensors were not functioning normally. The Study Team
studied the photographs of the meters and confirmed that their detection parts had turned brown
with the deposition of iron or manganese. This may be the reason why the sensors are not
functioning. It will be impossible to control the residual Cl concentration without carrying out
urgent repairs on the instruments concerned.
Source: COWD
Figure 2-11 Automatic Cl Gas Injector (left) and Cl Sensor (right)
4) Selection of Appropriate Disinfectant
Although COWD mainly chlorinates with Cl gas, there is an unstable supply in CDO because
there is only one Cl gas supplier in the city. Therefore, chlorine dioxide (ClO2) is also used, and
the ratio of usage is 80% of Cl gas and 20% of ClO2, respectively.
The table below shows the time average residual Cl concentration immediately after Cl gas
injection at major injection points of COWD. Because of the unstable availability of Cl gas, as
mentioned above, COWD is controlling the concentration while minimizing the amount of
disinfectant injection. Consequently, COWD is only able to maintain the concentration
immediately after the injection between 0.3 and 0.4 mg/L. The concentration in Baluland BPS (in
the West Service Area) immediately after the injection was 0.3 mg/L, which is the lowest
allowable limit of the concentration in PNSDW, at this point.
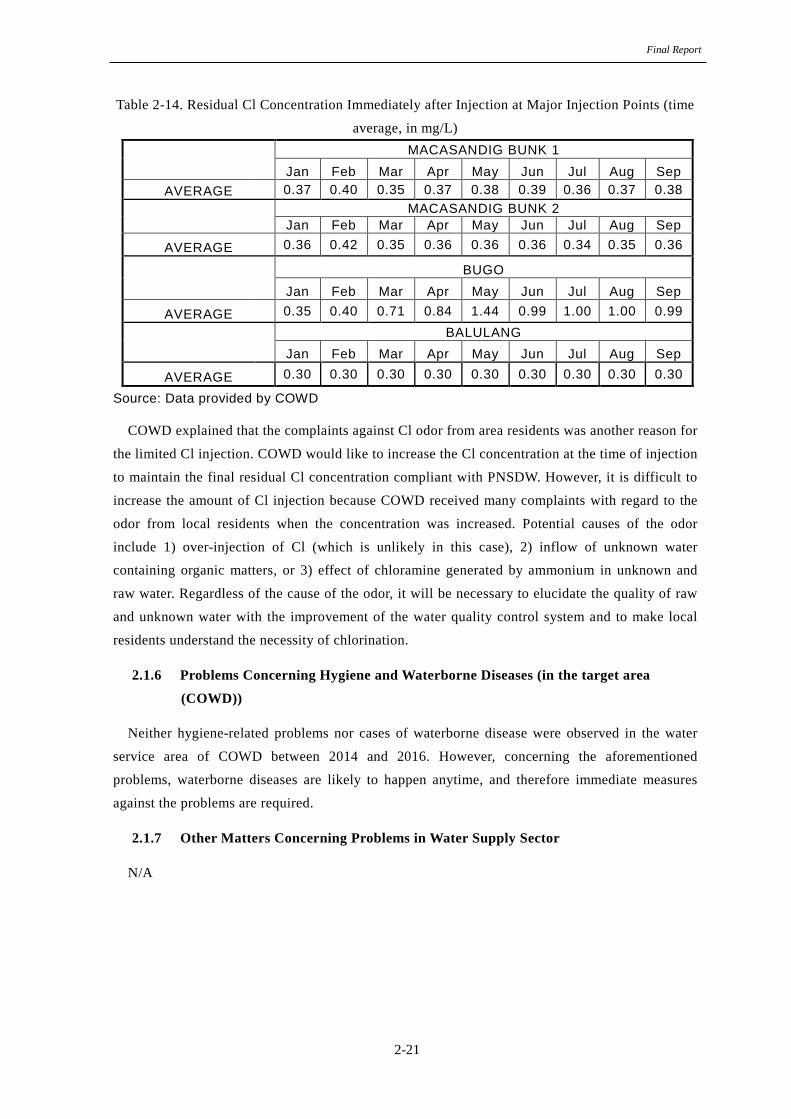
Final Report
2-21
Table 2-14. Residual Cl Concentration Immediately after Injection at Major Injection Points (time
average, in mg/L)
MACASANDIG BUNK 1 Jan Feb Mar Apr May Jun Jul Aug Sep
AVERAGE 0.37 0.40 0.35 0.37 0.38 0.39 0.36 0.37 0.38 MACASANDIG BUNK 2
Jan Feb Mar Apr May Jun Jul Aug Sep
AVERAGE 0.36 0.42 0.35 0.36 0.36 0.36 0.34 0.35 0.36
BUGO Jan Feb Mar Apr May Jun Jul Aug Sep
AVERAGE 0.35 0.40 0.71 0.84 1.44 0.99 1.00 1.00 0.99 BALULANG
Jan Feb Mar Apr May Jun Jul Aug Sep
AVERAGE 0.30 0.30 0.30 0.30 0.30 0.30 0.30 0.30 0.30
Source: Data provided by COWD
COWD explained that the complaints against Cl odor from area residents was another reason for
the limited Cl injection. COWD would like to increase the Cl concentration at the time of injection
to maintain the final residual Cl concentration compliant with PNSDW. However, it is difficult to
increase the amount of Cl injection because COWD received many complaints with regard to the
odor from local residents when the concentration was increased. Potential causes of the odor
include 1) over-injection of Cl (which is unlikely in this case), 2) inflow of unknown water
containing organic matters, or 3) effect of chloramine generated by ammonium in unknown and
raw water. Regardless of the cause of the odor, it will be necessary to elucidate the quality of raw
and unknown water with the improvement of the water quality control system and to make local
residents understand the necessity of chlorination.
2.1.6 Problems Concerning Hygiene and Waterborne Diseases (in the target area
(COWD))
Neither hygiene-related problems nor cases of waterborne disease were observed in the water
service area of COWD between 2014 and 2016. However, concerning the aforementioned
problems, waterborne diseases are likely to happen anytime, and therefore immediate measures
against the problems are required.
2.1.7 Other Matters Concerning Problems in Water Supply Sector
N/A

Implementation Report
3-1
Chapter 3 Matters Concerning Program/Project to be Formed
3.1 Problem Solution Methods
3.1.1 Relationship between Problems in Water Supply Sector (at the national level) and
Project to Be Formed
The disparity in access to safe water between urban and rural areas and the huge water shortage
expected in the future are problems at the national level in the water supply sector. This project
will contribute significantly to the solution of these problems because it aims to improve water
services in rural areas and to distribute a limited amount of available water as safe and reliable
water.
3.1.2 Relationship between Current State of Water Service and Problems in Supply of
Drinking Water (in target area (COWD))
The three serious problems for COWD are tight water supply and demand balance, the high
NRW rate and the low residual Cl concentration derived from complex reasons including poor
water pressure and quality control. This project will aim to directly solve the lo residual Cl
problem.
3.1.3 Scope of Assistance
The problem of residual Cl concentration is derived from complex causes including poor water
distribution management, poor water quality control, selection of inappropriate disinfectant, lack
of awareness creating activities for consumers and old and malfunctioning materials and
equipment. The Study Team recommends the dispatch of experts specialized in the respective
causal problems and the provision of materials and equipment required to solve those problems.
The team also suggests the replacement of the old water distribution pipes by COWD.
3.1.4 Type of Assistance
The Study Team recommends that this project is implemented as a Technical Cooperation
Project. COWD has a general manager with strong leadership and staff members with basic
professional knowledge and technical capacity. Further improvements will be made so that COWD
becomes the leading WD for the Philippines, and a reduction in the disparity between urban and
rural areas can be expected by expanding the technical capacity of COWD throughout the country.
3.1.5 Time of Implementation
The water COWD is supplying currently in the service area does not satisfy the water quality
standards at the terminal taps. Therefore, it is considered necessary to implement this project as
soon as possible.
Fiscal Year 2017 Project Formation Program in Water Supply Sector (Phase 1)
3-2
3.1.6 Other Matters Concerning Problem Solution Methods
N/A
3.2 Purposes of Project
3.2.1 Short-term Purposes
The project aims to solve the above-mentioned problems in order to provide consumers with
safe quality water containing residual Cl at a concentration satisfying PNSDW. It also aims to
distribute piped water with sufficient water pressure to the entire service area 24 hours a day with
the effective use of reservoirs, which are currently not in use because of the shortage of water.
3.2.2 Medium- to Long-term Purposes
COWD is recognized as an important WD in the Philippines. Therefore, the project aims to
improve the technical capacity of COWD and to transform it into the model WD in the Philippines.
Another aim is to reduce the disparity between water services in urban and rural areas by
expanding this model to WDs throughout the country in order to improve the technical capacities
of all WDs.
3.3 Project Details
3.3.1 Outline Plan
The figure below summarizes the problems in the service of COWD and the goals to be
achieved in the water supply sector in the Philippines, as mentioned above. The problems
recognized by COWD are the high NRW rate and insufficient residual Cl concentration, which is
caused by complex factors. COWD implemented measures to reduce NRW in the past with
assistance from USAID and the Coca-Cola Foundation. After this assistance came to an end,
COWD has been using its own budget to implement measures to reduce NRW (including a loan
from DBP). However, as mentioned above, there are complex problems that cause the issue of
water distribution that does not satisfy the standard for residual Cl. The focus of this project will
be on solving these problems.
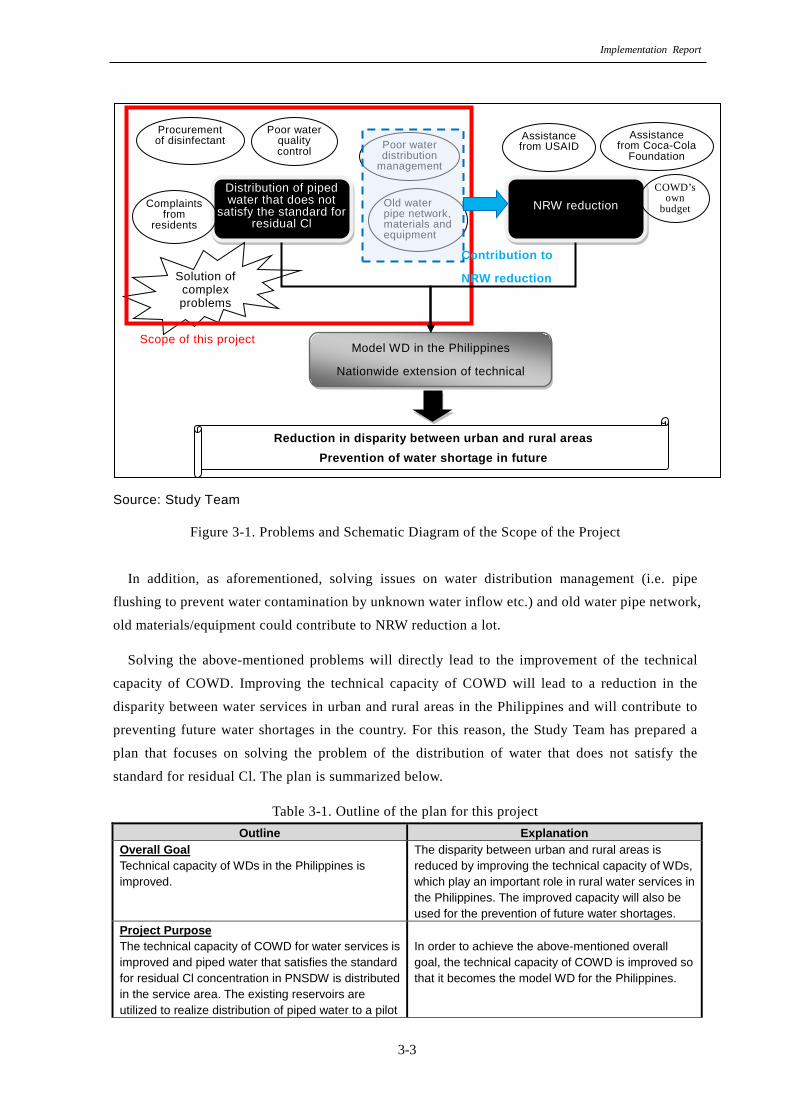
Implementation Report
3-3
Source: Study Team
Figure 3-1. Problems and Schematic Diagram of the Scope of the Project
In addition, as aforementioned, solving issues on water distribution management (i.e. pipe
flushing to prevent water contamination by unknown water inflow etc.) and old water pipe network,
old materials/equipment could contribute to NRW reduction a lot.
Solving the above-mentioned problems will directly lead to the improvement of the technical
capacity of COWD. Improving the technical capacity of COWD will lead to a reduction in the
disparity between water services in urban and rural areas in the Philippines and will contribute to
preventing future water shortages in the country. For this reason, the Study Team has prepared a
plan that focuses on solving the problem of the distribution of water that does not satisfy the
standard for residual Cl. The plan is summarized below.
Table 3-1. Outline of the plan for this project Outline Explanation
Overall Goal Technical capacity of WDs in the Philippines is improved.
The disparity between urban and rural areas is reduced by improving the technical capacity of WDs, which play an important role in rural water services in the Philippines. The improved capacity will also be used for the prevention of future water shortages.
Project Purpose The technical capacity of COWD for water services is improved and piped water that satisfies the standard for residual Cl concentration in PNSDW is distributed in the service area. The existing reservoirs are utilized to realize distribution of piped water to a pilot
In order to achieve the above-mentioned overall goal, the technical capacity of COWD is improved so that it becomes the model WD for the Philippines.
Distribution of piped water that does not
satisfy the standard for residual Cl
Poor water distribution
management
Poor water quality control
Procurement of disinfectant
Complaints from
residents
Old water pipe network, materials and equipment
Solution of complex problems
NRW reduction
Assistance from USAID
Assistance from Coca-Cola
Foundation
Scope of this project Model WD in the Philippines
Nationwide extension of technical
Reduction in disparity between urban and rural areas Prevention of water shortage in future
Contribution to
NRW reduction
COWD’s own
budget
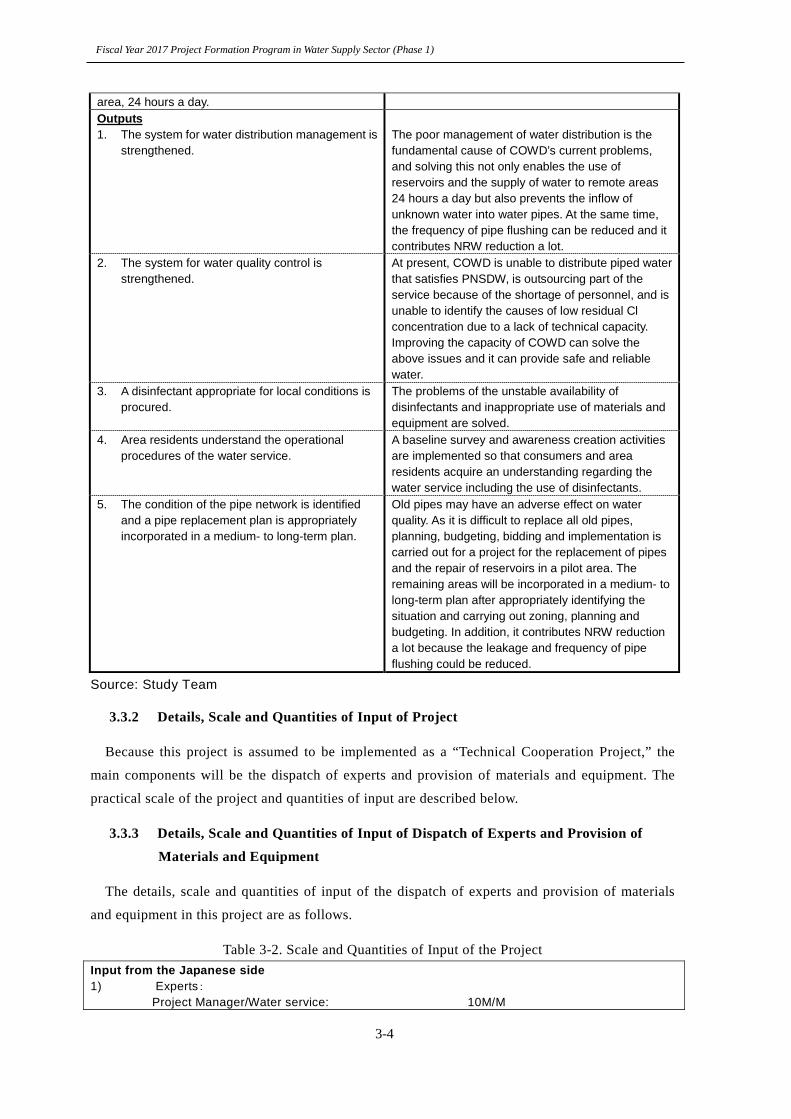
Fiscal Year 2017 Project Formation Program in Water Supply Sector (Phase 1)
3-4
area, 24 hours a day. Outputs 1. The system for water distribution management is
strengthened.
The poor management of water distribution is the fundamental cause of COWD’s current problems, and solving this not only enables the use of reservoirs and the supply of water to remote areas 24 hours a day but also prevents the inflow of unknown water into water pipes. At the same time, the frequency of pipe flushing can be reduced and it contributes NRW reduction a lot.
2. The system for water quality control is strengthened.
At present, COWD is unable to distribute piped water that satisfies PNSDW, is outsourcing part of the service because of the shortage of personnel, and is unable to identify the causes of low residual Cl concentration due to a lack of technical capacity. Improving the capacity of COWD can solve the above issues and it can provide safe and reliable water.
3. A disinfectant appropriate for local conditions is procured.
The problems of the unstable availability of disinfectants and inappropriate use of materials and equipment are solved.
4. Area residents understand the operational procedures of the water service.
A baseline survey and awareness creation activities are implemented so that consumers and area residents acquire an understanding regarding the water service including the use of disinfectants.
5. The condition of the pipe network is identified and a pipe replacement plan is appropriately incorporated in a medium- to long-term plan.
Old pipes may have an adverse effect on water quality. As it is difficult to replace all old pipes, planning, budgeting, bidding and implementation is carried out for a project for the replacement of pipes and the repair of reservoirs in a pilot area. The remaining areas will be incorporated in a medium- to long-term plan after appropriately identifying the situation and carrying out zoning, planning and budgeting. In addition, it contributes NRW reduction a lot because the leakage and frequency of pipe flushing could be reduced.
Source: Study Team
3.3.2 Details, Scale and Quantities of Input of Project
Because this project is assumed to be implemented as a “Technical Cooperation Project,” the
main components will be the dispatch of experts and provision of materials and equipment. The
practical scale of the project and quantities of input are described below.
3.3.3 Details, Scale and Quantities of Input of Dispatch of Experts and Provision of
Materials and Equipment
The details, scale and quantities of input of the dispatch of experts and provision of materials
and equipment in this project are as follows.
Table 3-2. Scale and Quantities of Input of the Project Input from the Japanese side 1) Experts:
Project Manager/Water service: 10M/M
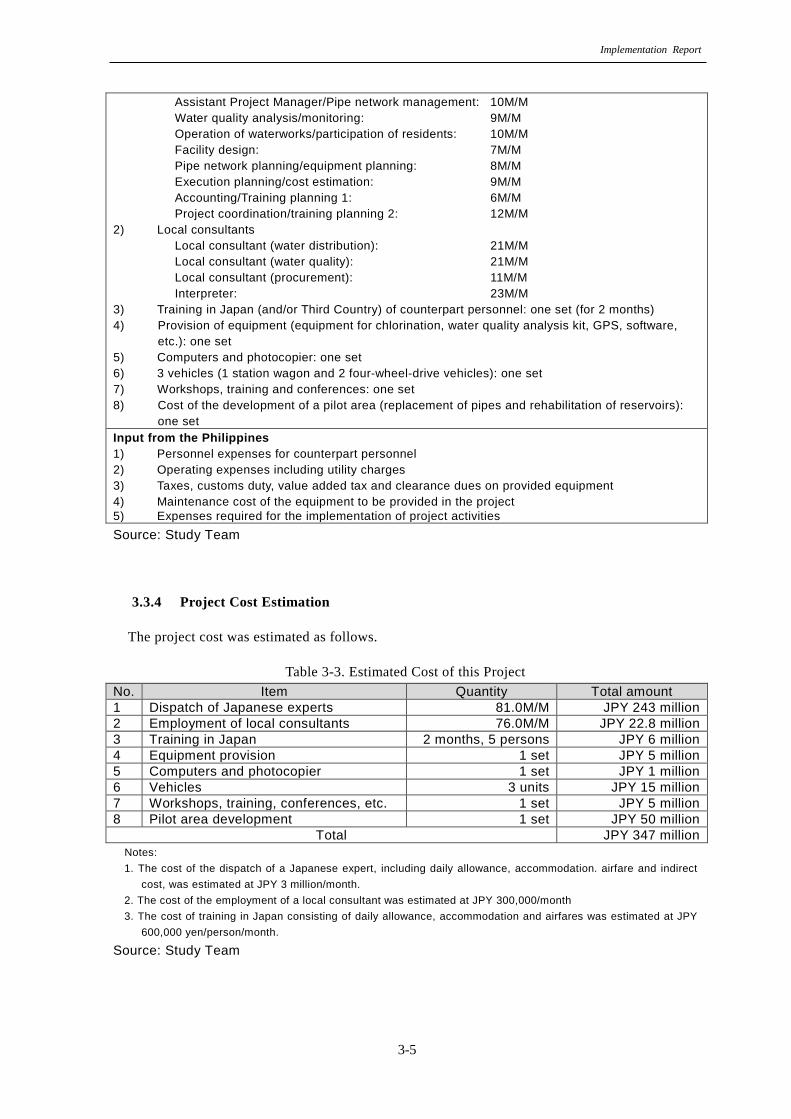
Implementation Report
3-5
Assistant Project Manager/Pipe network management: 10M/M Water quality analysis/monitoring: 9M/M Operation of waterworks/participation of residents: 10M/M Facility design: 7M/M Pipe network planning/equipment planning: 8M/M Execution planning/cost estimation: 9M/M Accounting/Training planning 1: 6M/M Project coordination/training planning 2: 12M/M
2) Local consultants Local consultant (water distribution): 21M/M Local consultant (water quality): 21M/M Local consultant (procurement): 11M/M Interpreter: 23M/M
3) Training in Japan (and/or Third Country) of counterpart personnel: one set (for 2 months) 4) Provision of equipment (equipment for chlorination, water quality analysis kit, GPS, software,
etc.): one set 5) Computers and photocopier: one set 6) 3 vehicles (1 station wagon and 2 four-wheel-drive vehicles): one set 7) Workshops, training and conferences: one set 8) Cost of the development of a pilot area (replacement of pipes and rehabilitation of reservoirs):
one set Input from the Philippines 1) Personnel expenses for counterpart personnel 2) Operating expenses including utility charges 3) Taxes, customs duty, value added tax and clearance dues on provided equipment 4) Maintenance cost of the equipment to be provided in the project 5) Expenses required for the implementation of project activities Source: Study Team
3.3.4 Project Cost Estimation
The project cost was estimated as follows.
Table 3-3. Estimated Cost of this Project No. Item Quantity Total amount 1 Dispatch of Japanese experts 81.0M/M JPY 243 million 2 Employment of local consultants 76.0M/M JPY 22.8 million 3 Training in Japan 2 months, 5 persons JPY 6 million 4 Equipment provision 1 set JPY 5 million 5 Computers and photocopier 1 set JPY 1 million 6 Vehicles 3 units JPY 15 million 7 Workshops, training, conferences, etc. 1 set JPY 5 million 8 Pilot area development 1 set JPY 50 million
Total JPY 347 million Notes: 1. The cost of the dispatch of a Japanese expert, including daily allowance, accommodation. airfare and indirect
cost, was estimated at JPY 3 million/month. 2. The cost of the employment of a local consultant was estimated at JPY 300,000/month 3. The cost of training in Japan consisting of daily allowance, accommodation and airfares was estimated at JPY
600,000 yen/person/month.
Source: Study Team

Fiscal Year 2017 Project Formation Program in Water Supply Sector (Phase 1)
3-6
3.3.5 Other Matters Concerning Project Details
N/A
3.4 Site Conditions
3.4.1 Location (availability of sites, land use, facilities that can be potential sources of
pollution, etc.)
CDO is in the northern part of the Mindanao Island in the Philippines. It is approximately 1,400
km southeast of the capital, Manila, as shown in the map below.
Source: DIVA-GIS Data edited by the Study Team
Figure 3-2. Location Map of Project Site
3.4.2 Natural Conditions
Life in CDO is relatively comfortable because it is warm throughout the year. The rainy season
begins in June and last through December. Annual precipitation in 2016 was approx. 2,300 mm.
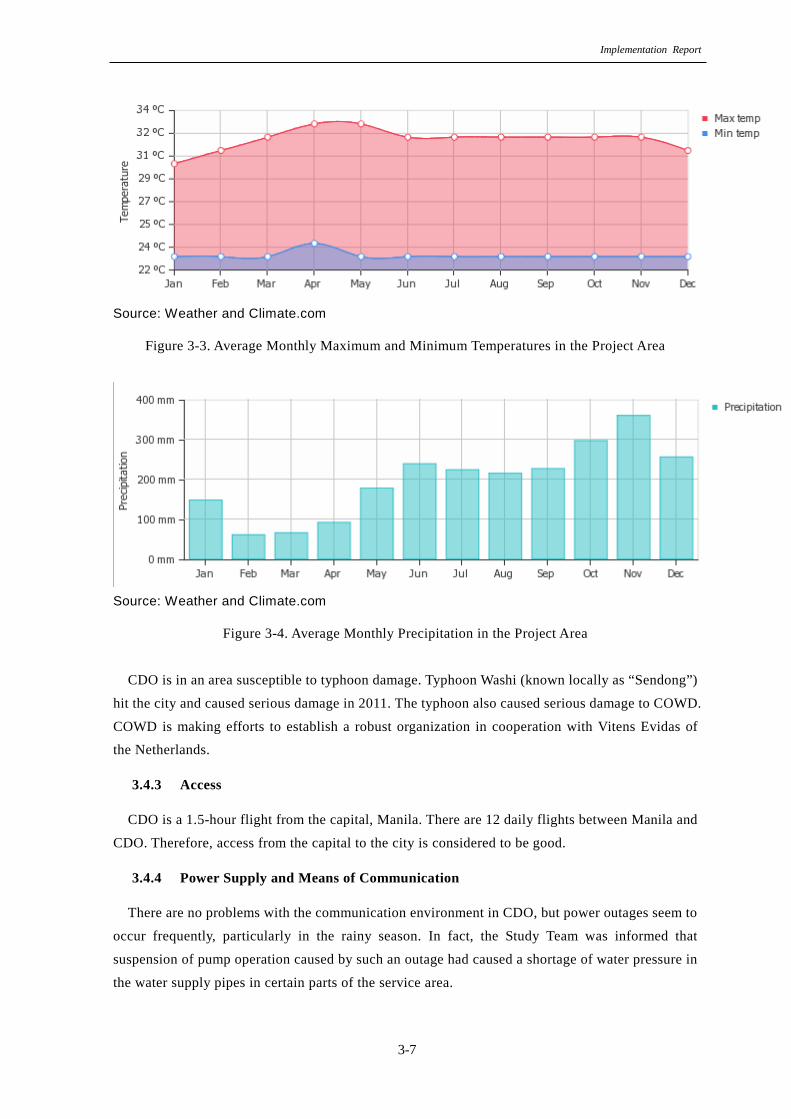
Implementation Report
3-7
Source: Weather and Climate.com
Figure 3-3. Average Monthly Maximum and Minimum Temperatures in the Project Area
Source: Weather and Climate.com
Figure 3-4. Average Monthly Precipitation in the Project Area
CDO is in an area susceptible to typhoon damage. Typhoon Washi (known locally as “Sendong”)
hit the city and caused serious damage in 2011. The typhoon also caused serious damage to COWD.
COWD is making efforts to establish a robust organization in cooperation with Vitens Evidas of
the Netherlands.
3.4.3 Access
CDO is a 1.5-hour flight from the capital, Manila. There are 12 daily flights between Manila and
CDO. Therefore, access from the capital to the city is considered to be good.
3.4.4 Power Supply and Means of Communication
There are no problems with the communication environment in CDO, but power outages seem to
occur frequently, particularly in the rainy season. In fact, the Study Team was informed that
suspension of pump operation caused by such an outage had caused a shortage of water pressure in
the water supply pipes in certain parts of the service area.
Fiscal Year 2017 Project Formation Program in Water Supply Sector (Phase 1)
3-8
3.4.5 Security
While MOFA sets the level of security risk in the northern Philippines at Level 1, it sets the
level in Mindanao at Level 2 or Level 3. The occupation of the City of Marawi in Mindanao by
guerrillas in May 2017 indicates the existence of a terrorist threat on the island. Although the
project site in CDO is several hundred kilometers away from Marawi, the project personnel should
pay sufficient attention to their own security while staying on the island.
3.4.6 Other Matters Concerning Site Conditions
N/A
Implementation Report
4-1
Chapter 4 Matters Concerning Outcome/Impact of Program/Project to be Formed
4.1 Outcome of Project Implementation
4.1.1 Contribution to Improvement of Water Supply Sector
The major problems in the water supply sector in the Philippines are the disparity between urban
and rural areas and the future water shortage. Solving these problems is closely related to the role
of the more than 400 WDs in the country. Therefore, training one such WD, COWD, and
expanding its improved technical capacity throughout the country in the future is expected to solve
the problems in the water supply sector in the Philippines by contributing significantly to the
solution of the above-mentioned problems.
4.1.2 Contribution to Solution of Problems in Drinking Water Supply
The implementation of this project is expected to produce the following outcomes.
・ Establishment of stable water supply 24 hours a day
・ Distribution of piped water satisfying PNSDW
・ Improved awareness of area residents regarding the water service
・ Preparation of a highly-accurate plan for the replacement of materials and equipment in the future
・ Improvement of NRW
4.1.3 Contribution to Solution of Problems related to Hygiene and Waterborne Diseases
At present, there are no waterborne disease epidemics in the water service area of COWD.
However, the possibility of the occurrence of such an epidemic is very high if the existing system
for distributing piped water continues to be used. Such a future risk can be reduced with the
implementation of this project.
4.1.4 Other Matters Concerning Project Outcome
N/A
4.2 Impact of Project Implementation
4.2.1 Political Impact
COWD is the oldest WD in the Philippines and is considered the most politically important WD.
The current administration declared its intention to increase investment and improve infrastructure
in Mindanao at the 26th Mindanao Business Conference (MBC) held on July 9, 2017. Therefore,
supporting COWD is expected to have a significant political impact.
Fiscal Year 2017 Project Formation Program in Water Supply Sector (Phase 1)
4-2
4.2.2 Social Impact
In regions in which COWD provides water services, there are various social problems such as
the low water pressure in the periphery of the service area, the availability of service only eight
hours a day in certain parts and complaints from residents. The implementation of this project is
expected to have a large social impact because it will eliminate the sense of unfairness felt by local
residents.
4.2.3 Economic Impact
As mentioned in 4.2.1, the current administration regards investment in Mindanao as a priority
issue. As the availability of basic infrastructure is an important precondition for investment, this
project, which aims to improve the water service, will play a significant role in investment
promotion. The implementation of this project will be important not only because it will have the
economic impact mentioned above but also because the increase in investment is expected to
extend the improvement to other sectors.
4.2.4 Technical Impact
There are various technical problems among the more than 400 WDs in the Philippines. By
improving the technical capacity of COWD so that it becomes the leading model WD for the
country, the improved capacity can be extended to WDs in the entire country due to the political
importance of COWD. Therefore, the improvement of the technical capacity of COWD is
considered to have significant impact on the improvement of rural water services in the Philippines
4.2.5 Diplomatic and Publicity Impact
It is thought that Japan’s assistance for the improvement of the technical capacity of COWD,
which is expected to be extended throughout the Philippines in the future, as mentioned above,
will widely demonstrate Japan’s contribution to the water supply sector in the Philippines. The use
of Japanese technologies and products in this project will also lead to Japanese companies finding
a way into the water supply sector in the Philippines. For these reasons, this project is expected to
have a significant diplomatic and publicity impact.
4.2.6 Other Matters Concerning Project Impact
N/A

Implementation Report
5-1
Chapter 5 Matters Concerning Relevancy of Project to be Formed
5.1 Results of Comparative Study with Major Alternative Plans
Because this project is to be implemented as a Technical Cooperation Project, there is no need to
consider alternative plans.
5.2 Organizational Relevance and Sustainability of Project Implementation
5.2.1 Organizational Capacity for Business Management
COWD operates its organization in accordance with the annual Balanced Scorecard (BSC) (see
the collected documents). BSC describes the targets of COWD’s strategies and programs in each
fiscal year. It sets the target values of strategies and programs for each quarter. The table below
shows the main targets described in BSC 2017.
Table 5-1. Main Targets in BSC 2017 Sector number
Target sector Main target
P1 Customer service To provide excellent customer service, including the supply of piped water 24 hours a day
P2 Financial affairs To improve the efficiency of water rate collection, including cancellation of dormant bank accounts and NRW reduction
P3 Organizational management
Efforts for the improvement of service efficiency, development of an organization for the provision of safe water that is robust against climate change
P4 Learning/capacity development
Strengthening of the capacity assessment, linking of the assessment with performance, incentives for performance, etc.
Source: Information provided by COWD
BSC describes these targets with numerical targets. BSC is revised every year and targets
corresponding to the current situation and needs are set and are shared with staff members. These
findings suggest that COWD has an excellent capacity for organizational management.
5.2.2 Organizational Capacity for Construction Work
COWD has a Construction Division under the Engineering Department. The Construction
Division consists of the Pipeline and General Construction Section, Meter Stub-out Installation
Section and Electro-Mechanical Installation Section. This organizational structure is appropriate
for performing construction work. However, there is a doubt about the experience of the
Construction Division in the types of work required in this project (except the construction of
production wells, for which the division has ample experience) because the pipes have not been
renewed for a long time and the reservoirs have not been utilized. This point should be noted
during the preparation and implementation of this project.

Fiscal Year 2017 Project Formation Program in Water Supply Sector (Phase 1)
5-2
5.2.3 Organizational Capacity for Maintenance
COWD has a Maintenance Department under the Office of the Assistant General Manager for
Technical Services. The Maintenance Department consists of the Pipeline Division and
Electro-Mechanical Equipment Division. This organizational structure is appropriate for the
maintenance of waterworks. Although the Study Team was not able to visit the warehouse of
COWD to inspect the storage of materials and equipment, the team confirmed COWD manages
materials and equipment in almost the same way as San Jose Del Monte WD does. There is no big
problem on materials and equipment management in San Jose Del Monte WD, and therefore
COWD’s management can also be considered as appropriate.
Figure 5-1. Water meter and materials management in San Jose Del Monte WD
5.2.4 Relationship with Local Residents
COWD receives complaints about the Cl odor mainly from people living near the PWs and BPSs
at which chlorination is performed. As these complaints have had a significant influence on the
residual Cl concentration issue, the aim is to provide a solution in the scope of this Technical
Cooperation Project.
5.2.5 Other Matters Concerning Organizational Relevance and Sustainability
N/A
5.3 Financial Relevance and Sustainability of Project Implementation
5.3.1 Source of Funding for Work Borne by the Philippine Side
In this project, the Philippine side will only have to bear the expenses required for ordinary
organizational operation, such as wages of counterpart personnel and utility charges. After the
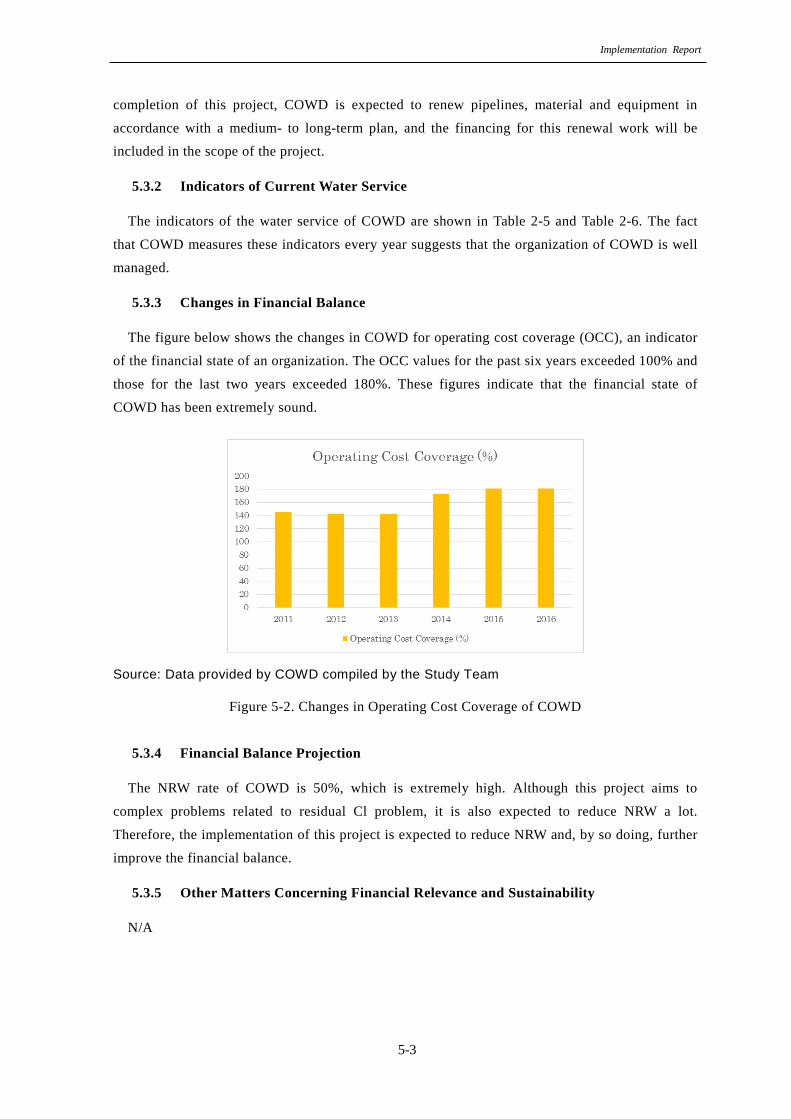
Implementation Report
5-3
completion of this project, COWD is expected to renew pipelines, material and equipment in
accordance with a medium- to long-term plan, and the financing for this renewal work will be
included in the scope of the project.
5.3.2 Indicators of Current Water Service
The indicators of the water service of COWD are shown in Table 2-5 and Table 2-6. The fact
that COWD measures these indicators every year suggests that the organization of COWD is well
managed.
5.3.3 Changes in Financial Balance
The figure below shows the changes in COWD for operating cost coverage (OCC), an indicator
of the financial state of an organization. The OCC values for the past six years exceeded 100% and
those for the last two years exceeded 180%. These figures indicate that the financial state of
COWD has been extremely sound.
Source: Data provided by COWD compiled by the Study Team
Figure 5-2. Changes in Operating Cost Coverage of COWD
5.3.4 Financial Balance Projection
The NRW rate of COWD is 50%, which is extremely high. Although this project aims to
complex problems related to residual Cl problem, it is also expected to reduce NRW a lot.
Therefore, the implementation of this project is expected to reduce NRW and, by so doing, further
improve the financial balance.
5.3.5 Other Matters Concerning Financial Relevance and Sustainability
N/A
Fiscal Year 2017 Project Formation Program in Water Supply Sector (Phase 1)
5-4
5.4 Technical Relevance and Sustainability of Project Implementation
5.4.1 Conformity with Technical Level of Counterpart
The Study Team confirmed from discussions in the field study that COWD staff members have a
basic technical capacity. The team also confirmed that they have the basic skills required for
organizational management by examining reports on the regular microbiological and chemical
water quality examinations and documents describing the preparation, dissemination and
enforcement of strategies and policies. Therefore, it is considered feasible to improve the technical
capacity of COWD further in this project and to establish it as the model WD in the Philippines.
5.4.2 Assignment and Retention of Personnel
The assignment of counterpart personnel is essential for the implementation of this project, as it
is to be implemented as a Technical Cooperation Project. At present, COWD outsources some
chemical examinations because of the shortage of qualified staff members specializing in
chemistry. If new materials and equipment are provided to COWD in this project, new staff
members will be required to operate and manage such materials and equipment. These problems
will be resolved through technical assistance to be provided in this project.
5.4.3 State of Facilities and Equipment Maintenance
COWD seems to have appropriately maintained and managed almost all of the main materials
and equipment. However, the sensors on the Cl injectors are currently out of order and a method to
repair them has not been found. As maintenance and management of materials and equipment is in
the scope of the Technical Cooperation Project, the sensors will be repaired in this project.
5.4.4 Other Matters Concerning Technical Relevance and Sustainability
N/A
5.5 Environmental Considerations
5.5.1 Expected Environmental Impact
As this project is planned as a Technical Cooperation Project, it will not include a plan to
construct new large-scale structures. The only construction work in this project shall be the
renewal of water pipelines and rehabilitation of reservoirs in a pilot area. Therefore, the
implementation of this project is expected to have very little environmental impact.
5.5.2 Assessment of Environmental Impact
To assess the scale of environmental and social impact of this project, the Study Team evaluated
the project using the screening form for the environmental and social considerations published on
the website of JICA. The completed form is shown below.

Implementation Report
5-5
Question 1. Please describe the scale and contents (approximate size of land development, facility
building area, production volume, power output, etc.) of the project briefly.
1-1 Project outline
As described in Chapter 3 of this document
1-2 How was the necessity of the project confirmed?
Is the project consistent with higher programs/policies?
■ YES: (Higher program name: “Philippine Water Supply Sector Roadmap (2010-2025)”)
□ NO
1-3 Did the proponent consider alternatives before this request?
□ YES: Please describe the outline of the alternatives
■ NO
1-4 Did the proponent hold meetings with stakeholders to confirm the necessity before this
request?
■ YES □ No
If YES, please check the stakeholders participated in the meetings.
□ Relevant administrative bodies
□ Local residents
□ NGOs
■ Others (COWD)
Question 2: Is the project new or ongoing? In the case of an ongoing project, have you received
strong complaints or other comments from local residents?
□ New □ Ongoing (with complaints) □ Ongoing (without complaints)
■ None of the above (This question is not relevant to this project because it is to be
implemented as a Technical Cooperation Project. However, some local residents
complain about Cl odor.)
Question 3: Is environmental assessment (e.g. EIA and IEE) required for the implementation of the
project by a law or guidelines of the recipient country? If required, has the assessment
been implemented or is it being planned?
□ Required (□ Implemented □ being implemented/planned)
(Reason for the requirement: )
■ Not required
□ Neither of the above ( )
Question 4: If an environmental or social permit or license other than the environmental
assessment is required for the project implementation, please describe the name of such a
permit or license. Have you acquired the said permit/license?
□ Already acquired □ required but not acquired ■ not required □ None of the above
( )
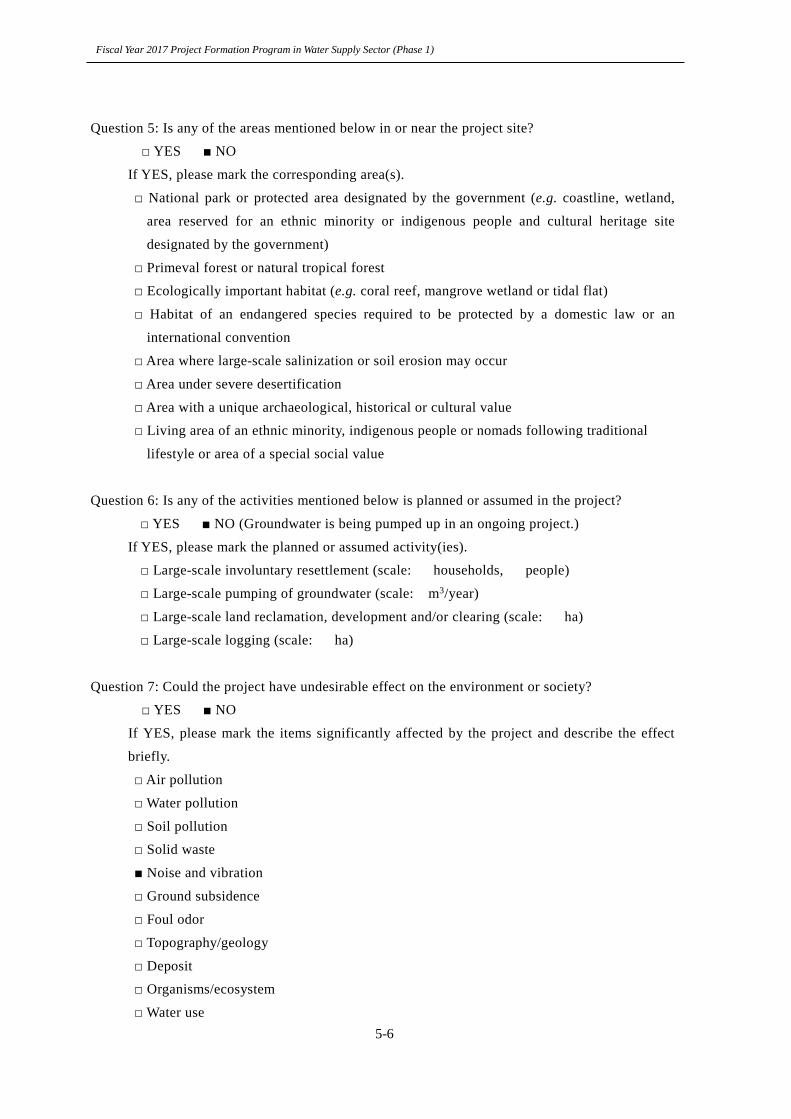
Fiscal Year 2017 Project Formation Program in Water Supply Sector (Phase 1)
5-6
Question 5: Is any of the areas mentioned below in or near the project site?
□ YES ■ NO
If YES, please mark the corresponding area(s).
□ National park or protected area designated by the government (e.g. coastline, wetland,
area reserved for an ethnic minority or indigenous people and cultural heritage site
designated by the government)
□ Primeval forest or natural tropical forest
□ Ecologically important habitat (e.g. coral reef, mangrove wetland or tidal flat)
□ Habitat of an endangered species required to be protected by a domestic law or an
international convention
□ Area where large-scale salinization or soil erosion may occur
□ Area under severe desertification
□ Area with a unique archaeological, historical or cultural value
□ Living area of an ethnic minority, indigenous people or nomads following traditional
lifestyle or area of a special social value
Question 6: Is any of the activities mentioned below is planned or assumed in the project?
□ YES ■ NO (Groundwater is being pumped up in an ongoing project.)
If YES, please mark the planned or assumed activity(ies).
□ Large-scale involuntary resettlement (scale: households, people)
□ Large-scale pumping of groundwater (scale: m3/year)
□ Large-scale land reclamation, development and/or clearing (scale: ha)
□ Large-scale logging (scale: ha)
Question 7: Could the project have undesirable effect on the environment or society?
□ YES ■ NO
If YES, please mark the items significantly affected by the project and describe the effect
briefly.
□ Air pollution
□ Water pollution
□ Soil pollution
□ Solid waste
■ Noise and vibration
□ Ground subsidence
□ Foul odor
□ Topography/geology
□ Deposit
□ Organisms/ecosystem
□ Water use
Implementation Report
5-7
□ Accident
□ Global warming
□ Involuntary resettlement
□ Local economy including employment and means of livelihood
□ Use of land and local resources
□ Social capital and social structure including local decision-making organizations
□ Existing social infrastructure and social services
□ The poor, indigenous people, ethnic minorities
□ Uneven distribution of damage and benefit
□ Conflict of interests in a local area
□ Gender equality
□ Children’s rights
□ Cultural heritage
□ Infectious disease including HIV/AIDS
□ Others ( )
Question 8: Information disclosure and discussions with local stakeholders
If the project requires environmental and social considerations, do you agree to disclose
information and hold discussions with local stakeholders on the project in accordance
with JICA Guidelines for Environmental and Social Considerations?
■ YES □ NO
5.5.3 Other Matters Concerning Environmental Considerations
N/A

Implementation Report
6-1
Chapter 6 Conclusion
6.1 Matter of Special Note
COWD will be required to reliably perform the duties of constructing counterpart systems,
assigning personnel and allocating the budget required for the implementation of this project.
6.2 Matters to be Noted during Project Implementation
COWD is located in northern Mindanao Island. Travelling to and working in Mindanao requires
special attention to the security situation because the Overseas Safety Information of MOFA
advises that the risk level in Mindanao is high. Currently, according to the JICA Philippines Office,
there are requirements in place when visiting the island, including limited periods of stay and the
need to be accompanied by security personnel, so future trends will have to be monitored.
6.3 Conclusion
The water supply sector in the Philippines has serious problems including the disparity between
urban and rural areas and water shortage expected in the future. The policy to solve these problems
is explicitly mentioned in MTPDP, the medium-term development plan of the Philippines, and the
Philippine Water Supply Sector Roadmap (2010-2025). More than 400 WDs in the entire country
will play a key role in solving these problems.
COWD is a WD in CDO. Assisting this WD is consistent with the above-mentioned higher
programs. If COWD is developed as the model WD for the Philippines, the technical capacity of
WDs in the entire country is expected to improve in the future. Because the implementation of this
project will contribute significantly to the improvement of water services in the Philippines as
mentioned above, there is considered to be a high necessity for project implementation.
6.4 Observations
The Study Team made the following observations during the study for this project.
At present, piped water that does not satisfy PNSDW is distributed in the service area, and
this situation will have to be rectified immediately.
Based on technical discussions and the study of collected documents, the team has
confirmed that COWD staff members have the basic professional knowledge, skills and
attitude toward the work required for the implementation of this project. Further
improvement of knowledge, skills and attitude is expected to lead to further improvement
of the water service.
The General Manager of COWD shows strong leadership and the senior staff members are
well-aware of the seriousness of the problems. These findings indicate that COWD has
succeeded in developing a robust organization. The leadership, awareness and robust
organization are considered important factors contributing to the successful implementation
of this project.
Fiscal Year 2017 Project Formation Program in Water Supply Sector (Phase 1)
6-2
COWD has been operating its water service soundly and is highly regarded among WDs in
the Philippines.
The outputs of this Technical Cooperation Project may become a model case for other WDs,
which is expected to be extended nationwide.
The Study Team considers that the urgency of implementing this project is high and that there is
a great significance to implementation based on the above-mentioned observations. The team also
considers that COWD satisfies the basic conditions for the implementation of this project, and so
the project should be implemented as soon as possible.

[APPENDICES]
Appendix-1. Schedule
Appendix-2. List of Interviewees
Appendix-3. List of Collected Documents
Appendix-4. Minutes of Meeting
Appendix-5. PDM (Draft) and Schedule (Draft)

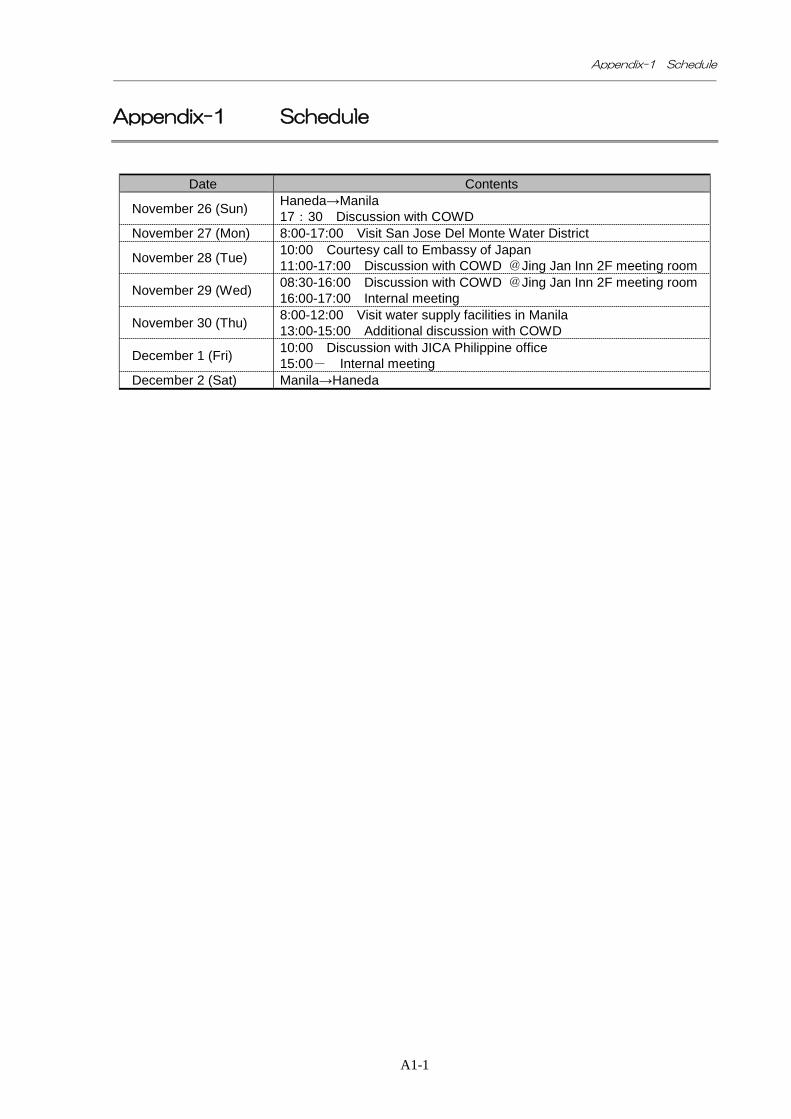
Appendix-1 Schedule
A1-1
Appendix-1 Schedule
Date Contents
November 26 (Sun) Haneda→Manila 17:30 Discussion with COWD
November 27 (Mon) 8:00-17:00 Visit San Jose Del Monte Water District
November 28 (Tue) 10:00 Courtesy call to Embassy of Japan 11:00-17:00 Discussion with COWD @Jing Jan Inn 2F meeting room
November 29 (Wed) 08:30-16:00 Discussion with COWD @Jing Jan Inn 2F meeting room 16:00-17:00 Internal meeting
November 30 (Thu) 8:00-12:00 Visit water supply facilities in Manila 13:00-15:00 Additional discussion with COWD
December 1 (Fri) 10:00 Discussion with JICA Philippine office 15:00- Internal meeting
December 2 (Sat) Manila→Haneda


Appendix-2 List of Interviewees
A2-1
Appendix-2 List of Interviewees
Cagayan de Oro Water District(COWD)
Dr, Rachel M. Beja General Manager
Mr. Elezar Linaac Assistant General Manager
Mr. Edward P. Tesoro Manager, Production Department
Ms. Farah Gamboa Head, Water Quality Unit
Ms. Babie Jane Sulapas Water Quality Unit
San Jose Del Monte Water District
Mr. Loreto G. Limcolioc General Manager
Development Bank of the Phillippines
Mr. Rustico Noli D. Cruz Senior Assistant Vice President
Embassy of Japan
Ms. Tomoyo SATO Second Secretary
JICA Philippine Office
Mr. Tomihara TAKAYUKI Project Formulator
JICA Global Environment Department
Ms. Eriko TAMURA Manager, Global Environment Department
Ms. Akiko FUJITA Chief, Global Environment Department


Appendix-3 List of Collected Documents
A3-1
Appendix-3 List of Collected documents
No. Name of documents Issuer Year Format
1 COWD Balanced Scorecard 2017 Initiative COWD 2017 Soft copy
2 COWD Investment Plan 2017 COWD 2017 Soft copy
3 COWD Chlorination Data COWD 2017 Soft copy
4 COWD Physical and Chemical Analysis COWD 2017 Soft copy
5 List of Equipment COWD 2017 Soft copy
6 Production Well, Monthly Production Report COWD 2015-2017 Soft copy
7 Sampling Points Map COWD 2017 Soft copy
8 Summary Report of Water Quality Analysis COWD 2015-2017 Soft copy
9 Summary Report of Residual Cl COWD 2013-2017 Soft copy
10 Monthly Report on Microbiological Analysis
Results
COWD 2013-2017 Soft copy
11 Summary and Evaluation Report of
Production Wells Microbiological Analysis
COWD 2015-2017 Soft copy
12 Specific Capacity of Production Well COWD 2012 Soft copy
13 Physical Chemical Analysis Results for
Production Wells
COWD 1998-2014 Soft copy
14 Production Well Design and Coordinates COWD - Soft copy
15 Profile and log for Production Well COWD - Soft copy
16 Groundwater Withdrawn (2006-2015) COWD 2006-2015 Soft copy
17 COWD Service Area Map COWD 2017 Soft copy
Hard copy
18 Answered questionnaire COWD 2017 Soft copy

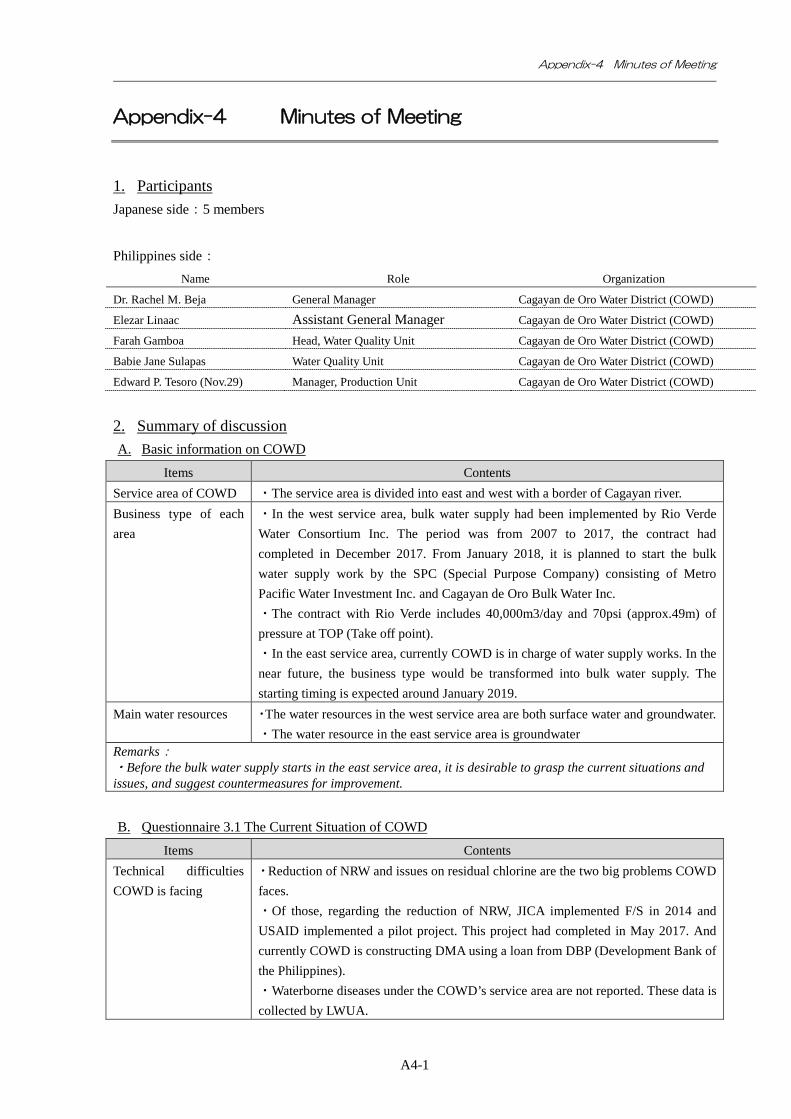
Appendix-4 Minutes of Meeting
A4-1
Appendix-4 Minutes of Meeting
1. Participants Japanese side:5 members
Philippines side: Name Role Organization
Dr. Rachel M. Beja General Manager Cagayan de Oro Water District (COWD)
Elezar Linaac Assistant General Manager Cagayan de Oro Water District (COWD)
Farah Gamboa Head, Water Quality Unit Cagayan de Oro Water District (COWD)
Babie Jane Sulapas Water Quality Unit Cagayan de Oro Water District (COWD)
Edward P. Tesoro (Nov.29) Manager, Production Unit Cagayan de Oro Water District (COWD)
2. Summary of discussion A. Basic information on COWD
Items Contents Service area of COWD ・The service area is divided into east and west with a border of Cagayan river. Business type of each area
・In the west service area, bulk water supply had been implemented by Rio Verde Water Consortium Inc. The period was from 2007 to 2017, the contract had completed in December 2017. From January 2018, it is planned to start the bulk water supply work by the SPC (Special Purpose Company) consisting of Metro Pacific Water Investment Inc. and Cagayan de Oro Bulk Water Inc. ・The contract with Rio Verde includes 40,000m3/day and 70psi (approx.49m) of pressure at TOP (Take off point). ・In the east service area, currently COWD is in charge of water supply works. In the near future, the business type would be transformed into bulk water supply. The starting timing is expected around January 2019.
Main water resources ・The water resources in the west service area are both surface water and groundwater. ・The water resource in the east service area is groundwater
Remarks: ・Before the bulk water supply starts in the east service area, it is desirable to grasp the current situations and issues, and suggest countermeasures for improvement.
B. Questionnaire 3.1 The Current Situation of COWD
Items Contents Technical difficulties COWD is facing
・Reduction of NRW and issues on residual chlorine are the two big problems COWD faces. ・Of those, regarding the reduction of NRW, JICA implemented F/S in 2014 and USAID implemented a pilot project. This project had completed in May 2017. And currently COWD is constructing DMA using a loan from DBP (Development Bank of the Philippines). ・Waterborne diseases under the COWD’s service area are not reported. These data is collected by LWUA.
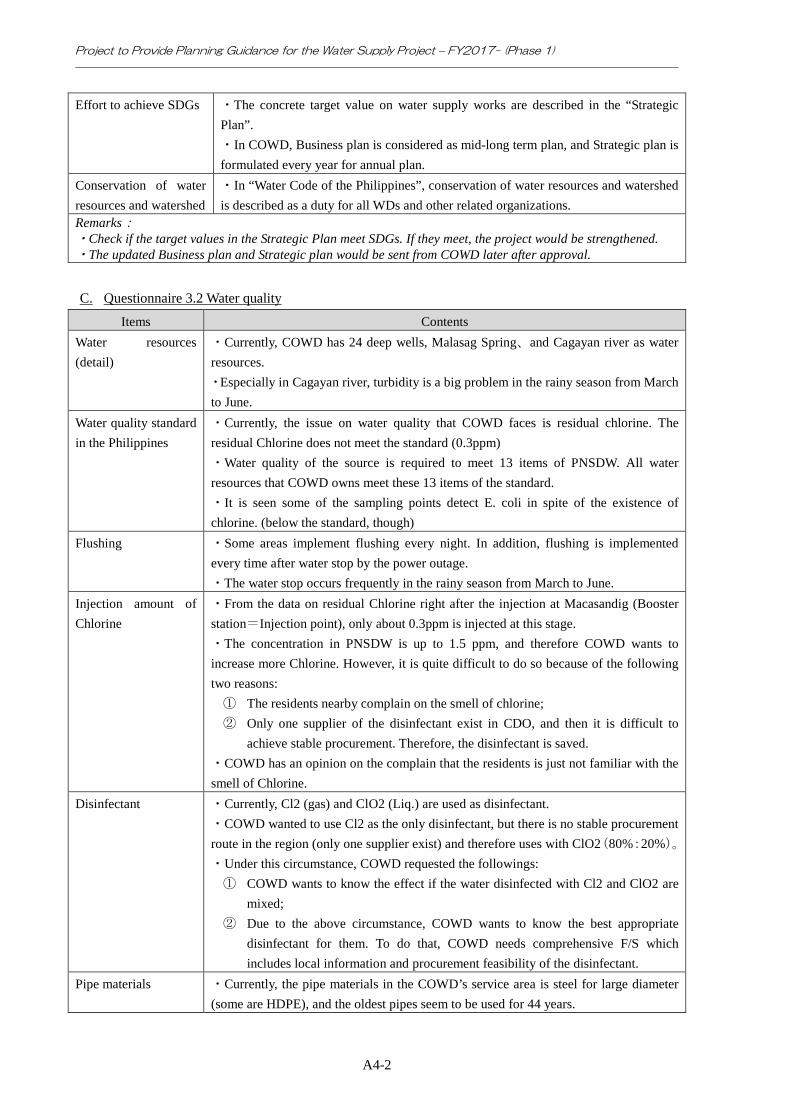
Project to Provide Planning Guidance for the Water Supply Project – FY2017- (Phase 1)
A4-2
Effort to achieve SDGs ・The concrete target value on water supply works are described in the “Strategic Plan”. ・In COWD, Business plan is considered as mid-long term plan, and Strategic plan is formulated every year for annual plan.
Conservation of water resources and watershed
・In “Water Code of the Philippines”, conservation of water resources and watershed is described as a duty for all WDs and other related organizations.
Remarks: ・Check if the target values in the Strategic Plan meet SDGs. If they meet, the project would be strengthened. ・The updated Business plan and Strategic plan would be sent from COWD later after approval.
C. Questionnaire 3.2 Water quality
Items Contents Water resources (detail)
・Currently, COWD has 24 deep wells, Malasag Spring、and Cagayan river as water resources. ・Especially in Cagayan river, turbidity is a big problem in the rainy season from March to June.
Water quality standard in the Philippines
・Currently, the issue on water quality that COWD faces is residual chlorine. The residual Chlorine does not meet the standard (0.3ppm) ・Water quality of the source is required to meet 13 items of PNSDW. All water resources that COWD owns meet these 13 items of the standard. ・It is seen some of the sampling points detect E. coli in spite of the existence of chlorine. (below the standard, though)
Flushing ・Some areas implement flushing every night. In addition, flushing is implemented every time after water stop by the power outage. ・The water stop occurs frequently in the rainy season from March to June.
Injection amount of Chlorine
・From the data on residual Chlorine right after the injection at Macasandig (Booster station=Injection point), only about 0.3ppm is injected at this stage. ・The concentration in PNSDW is up to 1.5 ppm, and therefore COWD wants to increase more Chlorine. However, it is quite difficult to do so because of the following two reasons: ① The residents nearby complain on the smell of chlorine; ② Only one supplier of the disinfectant exist in CDO, and then it is difficult to
achieve stable procurement. Therefore, the disinfectant is saved. ・COWD has an opinion on the complain that the residents is just not familiar with the smell of Chlorine.
Disinfectant ・Currently, Cl2 (gas) and ClO2 (Liq.) are used as disinfectant. ・COWD wanted to use Cl2 as the only disinfectant, but there is no stable procurement route in the region (only one supplier exist) and therefore uses with ClO2(80%:20%)。 ・Under this circumstance, COWD requested the followings: ① COWD wants to know the effect if the water disinfected with Cl2 and ClO2 are
mixed; ② Due to the above circumstance, COWD wants to know the best appropriate
disinfectant for them. To do that, COWD needs comprehensive F/S which includes local information and procurement feasibility of the disinfectant.
Pipe materials ・Currently, the pipe materials in the COWD’s service area is steel for large diameter (some are HDPE), and the oldest pipes seem to be used for 44 years.
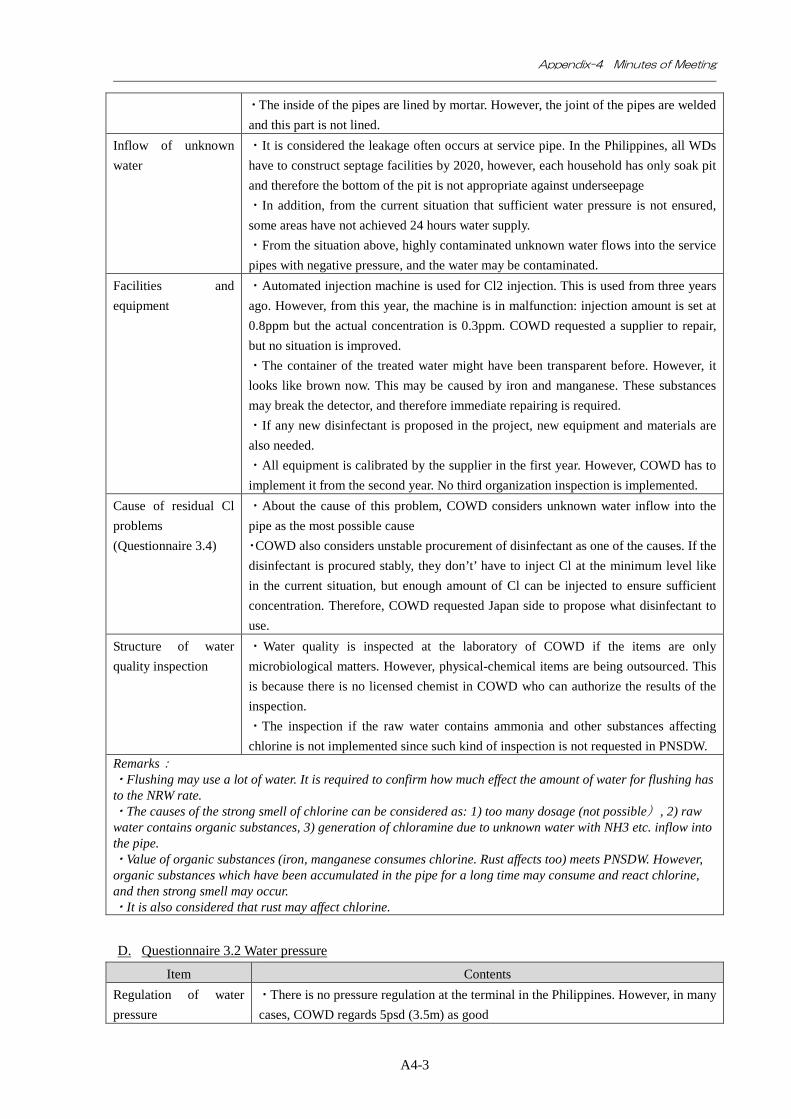
Appendix-4 Minutes of Meeting
A4-3
・The inside of the pipes are lined by mortar. However, the joint of the pipes are welded and this part is not lined.
Inflow of unknown water
・It is considered the leakage often occurs at service pipe. In the Philippines, all WDs have to construct septage facilities by 2020, however, each household has only soak pit and therefore the bottom of the pit is not appropriate against underseepage ・In addition, from the current situation that sufficient water pressure is not ensured, some areas have not achieved 24 hours water supply. ・From the situation above, highly contaminated unknown water flows into the service pipes with negative pressure, and the water may be contaminated.
Facilities and equipment
・Automated injection machine is used for Cl2 injection. This is used from three years ago. However, from this year, the machine is in malfunction: injection amount is set at 0.8ppm but the actual concentration is 0.3ppm. COWD requested a supplier to repair, but no situation is improved. ・The container of the treated water might have been transparent before. However, it looks like brown now. This may be caused by iron and manganese. These substances may break the detector, and therefore immediate repairing is required. ・If any new disinfectant is proposed in the project, new equipment and materials are also needed. ・All equipment is calibrated by the supplier in the first year. However, COWD has to implement it from the second year. No third organization inspection is implemented.
Cause of residual Cl problems (Questionnaire 3.4)
・About the cause of this problem, COWD considers unknown water inflow into the pipe as the most possible cause ・COWD also considers unstable procurement of disinfectant as one of the causes. If the disinfectant is procured stably, they don’t’ have to inject Cl at the minimum level like in the current situation, but enough amount of Cl can be injected to ensure sufficient concentration. Therefore, COWD requested Japan side to propose what disinfectant to use.
Structure of water quality inspection
・Water quality is inspected at the laboratory of COWD if the items are only microbiological matters. However, physical-chemical items are being outsourced. This is because there is no licensed chemist in COWD who can authorize the results of the inspection. ・The inspection if the raw water contains ammonia and other substances affecting chlorine is not implemented since such kind of inspection is not requested in PNSDW.
Remarks: ・Flushing may use a lot of water. It is required to confirm how much effect the amount of water for flushing has to the NRW rate. ・The causes of the strong smell of chlorine can be considered as: 1) too many dosage (not possible), 2) raw water contains organic substances, 3) generation of chloramine due to unknown water with NH3 etc. inflow into the pipe. ・Value of organic substances (iron, manganese consumes chlorine. Rust affects too) meets PNSDW. However, organic substances which have been accumulated in the pipe for a long time may consume and react chlorine, and then strong smell may occur. ・It is also considered that rust may affect chlorine.
D. Questionnaire 3.2 Water pressure
Item Contents Regulation of water pressure
・There is no pressure regulation at the terminal in the Philippines. However, in many cases, COWD regards 5psd (3.5m) as good
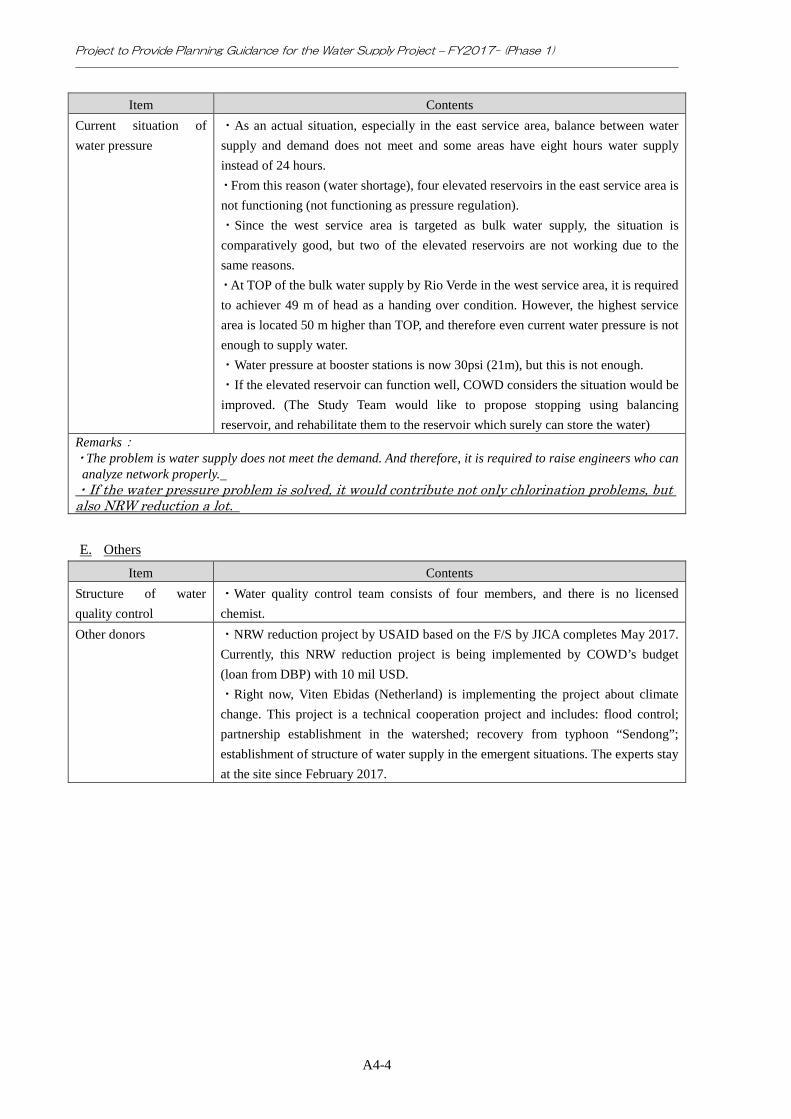
Project to Provide Planning Guidance for the Water Supply Project – FY2017- (Phase 1)
A4-4
Item Contents Current situation of water pressure
・As an actual situation, especially in the east service area, balance between water supply and demand does not meet and some areas have eight hours water supply instead of 24 hours. ・From this reason (water shortage), four elevated reservoirs in the east service area is not functioning (not functioning as pressure regulation). ・Since the west service area is targeted as bulk water supply, the situation is comparatively good, but two of the elevated reservoirs are not working due to the same reasons. ・At TOP of the bulk water supply by Rio Verde in the west service area, it is required to achiever 49 m of head as a handing over condition. However, the highest service area is located 50 m higher than TOP, and therefore even current water pressure is not enough to supply water. ・Water pressure at booster stations is now 30psi (21m), but this is not enough. ・If the elevated reservoir can function well, COWD considers the situation would be improved. (The Study Team would like to propose stopping using balancing reservoir, and rehabilitate them to the reservoir which surely can store the water)
Remarks: ・The problem is water supply does not meet the demand. And therefore, it is required to raise engineers who can
analyze network properly. ・If the water pressure problem is solved, it would contribute not only chlorination problems, but also NRW reduction a lot.
E. Others
Item Contents Structure of water quality control
・Water quality control team consists of four members, and there is no licensed chemist.
Other donors ・NRW reduction project by USAID based on the F/S by JICA completes May 2017. Currently, this NRW reduction project is being implemented by COWD’s budget (loan from DBP) with 10 mil USD. ・Right now, Viten Ebidas (Netherland) is implementing the project about climate change. This project is a technical cooperation project and includes: flood control; partnership establishment in the watershed; recovery from typhoon “Sendong”; establishment of structure of water supply in the emergent situations. The experts stay at the site since February 2017.

Appendix-5 PDM(Draft) and Schedule(Draft)
A5-1
Appendix-5 PDM(Draft) and Schedule(Draft)
Project title: Project for Improvement of Water Quality Management in Cagayan de Oro Water District, The Philippines
Schedule: Two years
Implementing Agency: Cagayan de Oro Water District (COWD)
Target Area: Cagayan de Oro city
Beneficiaries of the Project:[Direct beneficiaries] staff of COWD、[Indirect beneficiaries] Residents in the project area(Approx. 700,000 people)
Made on : February 1, 2018
Project Summary Objectively Verifiable Indicators
Means of Verification
Important Assumptions
Overall Goal Skills of WDs in the Philippines are improved.
1. The number of occurrence of waterborne diseases are halved to 2016.
Report by the Department of Health
Project Purpose Skills of the staff of COWD is improved, and the water satisfying PNSDW on residual Cl is enabled. In addition, by utilizing the existing reservoir, water supply for 24 hours in the pilot area is achieved.
1. Water produced by COWD meets PNSDW on residual Cl.
2. 80% of those staff of COWD received trainings of this project improves technical skill for water supply.
1. Survey report 2. End-line
report Targets and policies related to the strategy plan and business plan are not changed.
Outcome 1. The system for water distribution management is strengthened.
1. Water pressure at terminal faucet is ensured as positive in a pilot area. (Areas where 24 hours water supply has not achieved is halved compared to 2016)
1. Endline survey report
Administrative organization is not changed.
2. The system for water quality control is strengthened.
2. At least 1 chemist (licensed) starts working in COWD with appropriate environment, and physical-chemical inspection test which is now being outsourced can be done inside of COWD
2. Budgetary report
3. A disinfectant appropriate for local conditions is procured
3. At Macasandig pumping station, concentration of residual Cl with more than 0.8ppm immediately after injection is increases.
3. Water quality inspection report
4. Area residents understand the operational procedures of the
4. Complains on smell from the residents is halved compared to 2016
4. Questionnaire to residents (baseline/end line)

Project to Provide Planning Guidance for the Water Supply Project – FY2017- (Phase 1)
A5-2
water service.
5. The condition of the pipe network is identified and a pipe replacement plan is appropriately incorporated in a medium- to long-term plan.
5. Update plan based on zoning and cost estimation is reflected clearly to COWD’s mid/long term plan. Also, pilot projects are implemented as a model in the service area, and skills of the staff are improved.
5. Business plan, Strategic plan
Input Input from Japanese side 1) "Experts:
Project Manager/Water service Assistant Project Manager/Pipe network management Water quality analysis/monitoring Operation of waterworks/participation of residents Facility design Pipe network planning/equipment planning Execution planning/cost estimation Accounting/Training planning 1 Project coordination/training planning 2"
2) Local consultants Local consultant (water distribution) Local consultant (water quality) Local consultant (procurement) Interpreter
3) Training in Japan (and/or Third Country) of counterpart personnel: one set (for 2 months)
4) Provision of equipment (equipment for chlorination, water quality analysis kit, GPS, software, etc.): one set
5) Computers and photocopier: one set 6) 3 vehicles (1 station wagon and 2 four-wheel-drive vehicles): one set 7) Workshops, training and conferences: one set 8) Cost of the development of a pilot area (replacement of pipes and
rehabilitation of reservoirs): one set Input from the Philippines 1) Personnel expenses for counterpart personnel 2) Operating expenses including utility charges 3) Taxes, customs duty, value added tax and clearance dues on provided
equipment 4) Maintenance cost of the equipment to be provided in the project 5) Expenses required for the implementation of project activities
Most staff who are trained in the project continues working in COWD
Premises
(1) Counterparts of water quality monitoring, water pressure management, training/human resources development are clarified and they should join the project.
(2) Security
situation in the Philippines is not getting worse than now.
Overall project:81.00M/M
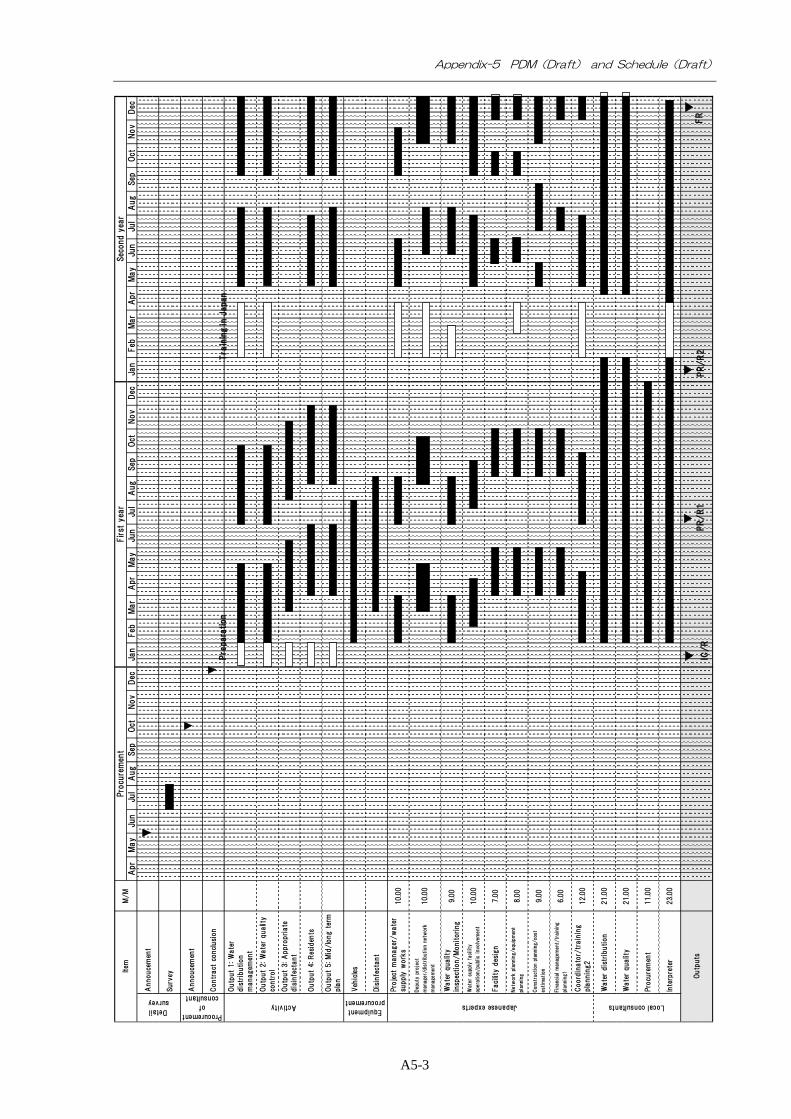
Appendix-5 PDM(Draft) and Schedule(Draft)
A5-3
Sec
ond y
ear
Apr
May
Jun
Jul
Aug
Sep
Oct
Nov
Dec
Jan
Feb
Item
M/M
Pro
cure
men
tFirst
yea
r
Dec
Jan
Feb
Mar
Apr
May
Jun
Jul
Aug
Surv
ey
Procurement
of
consultant
Annouce
men
t
Contr
act
conclusi
on
Sep
Oct
Nov
Dec
Detail
survey
Annouce
men
t
Mar
Apr
May
Jun
Jul
Aug
Sep
Oct
Nov
Activity
Outp
ut
1: W
ate
r
dis
trib
ution
managem
ent
Outp
ut
2: W
ate
r qualit
y
contr
ol
Outp
ut
3: A
ppro
priate
dis
infe
ctant
Outp
ut
4: Res
iden
ts
Outp
ut
5: M
id/lo
ng t
erm
pla
n
Dep
uty
proj
ect
man
ager
/dis
trib
utio
n ne
twor
k
man
agem
ent
10.0
0
Wate
r qualit
y
insp
ection/M
onitoring
9.0
0
Equipment
procurement
Veh
icles
Dis
infe
ctant
Japanese experts
Pro
ject
manager
/w
ate
r
supply
work
s10.0
0
Wat
er s
uppl
y fa
cilit
y
oper
atio
n/pu
blic
inv
olve
ment
10.0
0
Con
stru
ctio
n pla
nnin
g/c
ost
estim
atio
n9.0
0
Fina
ncia
l m
ana
gem
ent
/tra
inin
g
plan
ning
16.0
0
Coord
inato
r/tr
ain
ing
pla
nnin
g2
12.0
0
Faci
lity d
esig
n7.0
0
Net
wor
k pl
anni
ng/e
quip
men
t
plan
ning
8.0
0
Inte
rpre
ter
23.0
0
Outp
uts
Local consultants
Wate
r dis
trib
ution
21.0
0
Wate
r qualit
y21.0
0
Pro
cure
men
t11.0
0
Pre
para
tion
IC/R
PR
/R
1PR
/R
2
Tra
inin
g in J
apan
FR