Embed Size (px)
Citation preview

University of Wisconsin MilwaukeeUWM Digital Commons
Theses and Dissertations
August 2018
Biogas Quality Improvement Using Water Washand Phosphorus Recovery as Struvite in JonesIsland WwtpMD ABUL BASHARUniversity of Wisconsin-Milwaukee
Follow this and additional works at: https://dc.uwm.edu/etdPart of the Civil Engineering Commons, and the Environmental Engineering Commons
This Thesis is brought to you for free and open access by UWM Digital Commons. It has been accepted for inclusion in Theses and Dissertations by anauthorized administrator of UWM Digital Commons. For more information, please contact [email protected].
Recommended CitationBASHAR, MD ABUL, "Biogas Quality Improvement Using Water Wash and Phosphorus Recovery as Struvite in Jones Island Wwtp"(2018). Theses and Dissertations. 1746.https://dc.uwm.edu/etd/1746

BIOGAS QUALITY IMPROVEMENT USING WATER WASH
AND PHOSPHORUS RECOVERY AS STRUVITE IN JONES
ISLAND WWTP
by
Md Abul Bashar
A Thesis Submitted in
Partial Fulfillment of the
Requirements for the Degree of
Master of Science
in Engineering
at
The University of Wisconsin-Milwaukee
August 2018

ii
ABSTRACT
BIOGAS QUALITY IMPROVEMENT USING WATER WASH
AND PHOSPHORUS RECOVERY AS STRUVITE IN JONES
ISLAND WWTP by
Md Abul Bashar
The University of Wisconsin-Milwaukee, 2018
Under the Supervision of Professor Jin Li
Raw biogas from anaerobic digestion has a methane content of 50 to 60% and a carbon dioxide
content of 40 to 50% on a molar basis (Bortoluzzi, Gatti, Sogni, & Consonni, 2014). Milwaukee
Metropolitan Sewerage District (MMSD)’s Jones Island Waste Water Treatment Plant (WWTP)
uses the biogas supplied from South Shore WWTP in drying Milorganite, a slow-release phosphate
fertilizer. But with only 45% methane, the gas cannot be used for sophisticated purposes. To
maximize its potential as energy source, the methane content must be upgraded to its market
competitor natural gas. Based on simulation results from Aspen Plus software - High Pressure
Water Scrubbing (HPWS) or water wash seems to be the best option. The process requires running
the impure gas through pressurized water. Based on Henry’s law, CO2 is dissolved easily because
of low partial pressure. The integrated process doesn’t need additional water or pressure, as it can
use wastewater from WWTP and the gas is already supplied at an optimal pressure. It can also
remove most of the H2S, present as a trace amount in the biogas. Furthermore, struvite, a better-
quality phosphate fertilizer can be recovered with adequate aeration and adding NaOH. From
simulation results, the methane content can be improved up to 98.7 % at pressures up to 150 psi.
Key Words: Biogas, Water Wash, Struvite, Anaerobic Digestion, Aspen Plus Simulation

iii
TABLE OF CONTENTS
ABSTRACT .................................................................................................................................... ii
LIST OF FIGURES ......................................................................................................................... v
LIST OF TABLES ........................................................................................................................ vii
LIST OF ABBREVIATIONS ....................................................................................................... viii
ACKNOWLEDGEMENTS ........................................................................................................... ix
CHAPTER I: INTRODUCTION ................................................................................................ 1
CHAPTER II: LITERATURE REVIEW .................................................................................. 2
BIOGAS WATERWASH ........................................................................................................... 2
COMPONENTS OF BIOGAS ................................................................................................. 2
Primary Components ............................................................................................................... 2
Methane ................................................................................................................................... 3
Carbon Dioxide........................................................................................................................ 5
Hydrogen Sulfide ..................................................................................................................... 6
Other Trace Components ......................................................................................................... 7
FACTORS AFFECTING BIOGAS CAPTURE IN WATER WASH ................................. 7
Solubility and Henry’s Law ..................................................................................................... 7
Pressure .................................................................................................................................... 9
Temperature ........................................................................................................................... 10
Relation Between Factors ...................................................................................................... 10
DIFFERENT METHODS OF BIOGAS PURIFICATION ................................................ 12
Amine-Based Chemical Absorption (CHEM) ....................................................................... 12
Organic Solvent-Based Physical Absorption (PHY) ............................................................. 15
Water Wash (WW) ................................................................................................................ 17
Pressure Swing Adsorption (PSA) ........................................................................................ 21
Membrane Separation ............................................................................................................ 23
Comparison Between Upgrading Technologies .................................................................... 27
MECHANICAL COMPONENTS OF WATER WASH ..................................................... 27
Absorber ................................................................................................................................ 27
Flash....................................................................................................................................... 29
Compressor ............................................................................................................................ 30

iv
Cooler .................................................................................................................................... 30
Stripper .................................................................................................................................. 31
PHOSPHORUS RECOVERY AS STRUVITE ........................................................................ 32
PHOSPHORUS RECOVERY ............................................................................................... 32
Importance of Phosphorus Recovery ..................................................................................... 32
Significance of Struvite for MMSD ...................................................................................... 33
AVAILABLE PHOSPHORUS RECOVERY TECHNOLOGIES ..................................... 34
Crystal Green ......................................................................................................................... 34
Struvite Recovery in Canada ................................................................................................. 34
Struvite Recovery in US (HRSD, Virginia) .......................................................................... 37
Struvite Recovery in UK ....................................................................................................... 39
CHAPTER III: EXPERIMENTAL MODELING AND CALCULATION .......................... 40
ASPEN PLUS SIMULATION OF BIOGAS WATERWASH ............................................ 40
RESULTS OF SIMULATION ............................................................................................... 43
Result of Simulation for Pilot Scale ...................................................................................... 46
Result of Simulation for Full Scale ....................................................................................... 47
CALCULATION FOR PHOSPHORUS RECOVERY ....................................................... 50
CHAPTER IV: PROPOSED MODIFICATION OF JIWWTP ............................................. 57
CHAPER V: RESULTS AND DISCUSSION .......................................................................... 59
REFERENCES ............................................................................................................................ 61

v
LIST OF FIGURES
Figure 2. 1: (a) Map based on the gridded 2012 methane data – National Total ; (b) Map based
on the gridded 2012 methane data – Agricultural and (c) Map based on the gridded
2012 methane data – WWTP & Landfill, Source: (Maasakkers et al., 2016). ............ 5
Figure 2. 2: Solubility of carbon dioxide in high pressures under different temperatures (○ 0°C; □
10 °C; Δ20°C) (Pierantozzi, 2003). ............................................................................ 8
Figure 2. 4: Amine-Based Chemical Absorption. Illustration Credit: (Mazari et al., 2015) ........ 13
Figure 2. 5: CO2 Absorption in Amines. Chart Credit: (Lallemand et al., 2012) ......................... 13
Figure 2. 6: Physical Solvent Scrubber Process Diagram. Illustration Credit: (ÖKOBIT GmbH,
2014) .......................................................................................................................... 16
Figure 2. 7: Biogas Water Scrubber System Design. Illustration Credit: (Hudde, 2010)............. 19
Figure 2. 8: Pressure Swing Adsorption Process Diagram. Source: (Zhao et al., 2010) .............. 22
Figure 2. 9: Gas Separation Membrane Permeation Rates. Source: (Suda & Haraya, 1997) ....... 23
Figure 2. 10: (i) Schematic representation of the separation principle (ii) Two-stage process with
recycle and a compressor [Raw biogas (Rohbiogas) enters the system from left].
Illustration Credit: (Harasek, 2006) ........................................................................... 24
Figure 2. 11: Biogas Production to Supply Using High-Pressure Gas Separation Membrane
Design at DMT-CGS ................................................................................................. 26
Figure 2. 12: Random Packing (left) and Mellapak Structured Packing (right). Source:
sulzer.com .................................................................................................................. 28
Figure 2. 13: Schematic Diagram of WW Treatment with Struvite Recovery (AT Britton et al.,
2007) .......................................................................................................................... 35
Figure 2. 14: Struvite pPS in digester supernatant and distilled water as a function of pH .......... 36

vi
Figure 2. 15: Typical Layout of Nansemond Treatment Plant (HRSD), Virginia. ....................... 37
Figure 2. 16: Struvite Recovery at Nansemond Treatment Plant (HRSD), Virginia. Source:
Hazen and Sawyer ..................................................................................................... 38
Figure 3. 1: Solubility of biogas components in water: (a) CO2, (b) CH4, (c) H2S, (d) N2, (e) O2
(adapted upon Cozma et al. 2013; reproduced from Environmental Engineering and
Management Journal) (Mao el al. 2011) .................................................................... 42
Figure 3. 2: ASPEN PLUS Flow Diagram with two absorbers. ................................................... 43
Figure 3. 3: Column Internal for absorber 1. ................................................................................ 44
Figure 3. 4: Column Internal for absorber 2. ................................................................................ 44
Figure 3. 5: Hydraulic Plot for Absorber Column 1. .................................................................... 45
Figure 3. 6: Hydraulic Plot for Absorber Column 2. .................................................................... 45
Figure 3. 7: Pilot Scale Biogas water wash simulation result at varying temperature.................. 47
Figure 3. 8: Full Scale Biogas simulation result at varying temperature at 45psi ........................ 48
Figure 3. 9: Full Scale Biogas simulation result at varying temperature at 150psi ...................... 48
Figure 3. 10: MMSD’s Jones Island waste water influent data for a. phosphorus b. Ammonia c.
BOD & COD and d. Magnesium ............................................................................... 51
Figure 3. 11: Dissolved PO4-P concentrations in anaerobic effluent solutions from the LW lagoon
(a) and RM lagoon (b) after equilibrating for 24 h and forming struvite. Curves are
predicted PO4-P concentrations using multiple linear regression. ............................. 52
Figure 3. 12: Biogas Waterwash at 87 psi with varying temperature [Aspen Plus Modeling]..... 54
Figure 3. 13: Total Phosphorus in Sludge as % of Dry Weight [Source: MMSD] ...................... 55
Figure 4. 1: Existing Jones Island Biosolids Facility [Source: MMSD]....................................... 57
Figure 4. 2: Proposed Simplified Jones Island Biosolids Facility ................................................ 57

vii
LIST OF TABLES
Table 2. 1: Content of methane, carbon dioxide, oxygen, nitrogen, and hydrogen sulfide in
biogas from the different biogas producing plants in Norway .................................... 3
Table 2. 2: Different components of Biogas and their Henry’s Law Constant ............................... 9
Table 2. 3: Comparison Between Biogas Upgrading Technologies. [Source: (Beil & Beyrich,
2013); (Severn Wye Energy Agency, 2013); (Starr, Gabarrell, Villalba, Talens, &
Lombardi, 2012)] ....................................................................................................... 27
Table 2. 4: Chemical Composition of Struvite ............................................................................. 33
Table 2.5: Summary of pilot scale struvite recovery test run results. Results are average for each
test run. Source: (AT Britton et al., 2007) ................................................................. 35
Table 3. 1: Summary of Simulation Input for Pilot Scale............................................................. 46
Table 3. 2: Pilot Scale simulation data at 60ºF Temperature and 45 psi pressure ........................ 46
Table 3. 3: Simulation result for Pilot of Biogas water wash at varying temperature .................. 46
Table 3. 4: Full Scale Biogas simulation result at varying temperature at 45psi.......................... 47
Table 3. 5: Full Scale Biogas simulation result at varying temperature at 150psi........................ 48

viii
LIST OF ABBREVIATIONS
HPWS High Pressure Water Scrubbing
WW Water Wash
PSA Pressure Swing Absorption
MMSD Milwaukee Metropolitan Sewerage District
WWTP Waste Water Treatment Plant
WAS Waste Activated Sludge
DMS Dimethyl Sulfide
EOR Enhanced Oil Recovery
VOC Volatile Organic Compounds
TS Total Solids
MEA Monoethanolamine
MDEA Methyldiethanolamine
AMP 2-amino-2-methyl-1-propanol
SHA Sterically Hindered Amine
PIP Piperidine
PZ Piperazine
PZEA Piperazinyl-1,2-ethylamine
IPCC Intergovernmental Panel on Climate Change
CMS Carbon Molecular Sieve
BNR Biological Nutrient Removal
MGD Million Gallons per Day

ix
ACKNOWLEDGEMENTS
First, I would like to thank my thesis advisor Dr. Jin Li of the Department of Civil and Environmental
Engineering for her tireless effort with my thesis. She has been an inspiration and a mentor for my higher
education. I wouldn’t be here without her faith in me. She has always been helpful to me with guidelines,
conference information and technical supports. She also helped me with the expensive but very important
Aspen Plus software which was crucial for this study.
I would also like to thank Mr. Bryan Johnson from Energy Tech Innovations and Mr. Matt Magruder from
MMSD for providing valuable data used in this study. Without their passionate effort and valued input, this
work could not have been successfully performed.
I would also like to acknowledge Prof Qian Liao of the Civil and Environmental Engineering and Prof
Timothy Grundl of Department of Geosciences at University of Wisconsin Milwaukee as the thesis
committee members. I am grateful for their valuable input on this thesis.
Finally, I’m thankful to my parents, friends and well-wishers for their continuous support. I’m indebted and
humbled for their trust in me.

1
CHAPTER I: INTRODUCTION
Methane has a high energy content of 55.5 MJ/kg compared to 46.4 MJ/kg for gasoline.
To gain the possible maximum amount of energy, biogas should be as pure as possible.
Depending on source raw biogas from anaerobic digestion has a methane content of 50 to
60 % and carbon dioxide of 40 to 50 % on a molar basis (Bortoluzzi et al., 2014). To
maximize the its potential as an energy source, the methane content must be upgraded to
match its market competitor natural gas. Comparing to other energy sources such as coal
and gasoline, biogas has only one major pollutant – CO2. If CO2 is removed, then biogas
can be used in the national gas grid or can be used for any industrial purpose. Luckily,
removing CO2 is not complex. Simulated results of Aspen Plus software and the pilot
project, High Pressure Water Scrubbing (HPWS) also known as Water Wash seems to be
the best option. It is essentially running the impure gas through pressurized water. The
process depends on the fact that, CO2 has a lower partial pressure than methane. One major
advantage of water scrubbing is that the entire process relies on readily available substances
like water and no other chemical is needed. It can also remove trace amount of H2S present
in biogas. From our simulated result, the methane content can be improved as high as
98.7% at a pressure of 150 psi.
Considerable attention has been given in recent years to the impact of gasoline on air
quality specifically as it relates to the toxic pollutants including carbon monoxide and lead
while coal contains heavy metals and potential toxic substances (Gaffney & Marley, 2009).
Natural gas is more efficient and emits 50 to 60 percent less carbon dioxide when
combusted in a new, efficient natural gas power plant compared with emissions from a
typical new coal plant (NETL, 2013). From financial point of view, natural gas and biogas
are close in competitiveness. Considering the projected electricity and natural gas prices
and the value of offsetting energy purchases, using biogas for electricity production may
be more profitable than supplying it to the pipeline (Murray, Galik, & Vegh, 2014). After
treatment, biogas also can reach a higher methane content of 98% which is comparable to
typical natural gas supply of 90 to 95% methane with 4 to 7% higher hydrocarbon
(US5390499A, 1993). With our proposed technology, homeowners and small businesses
can install their own biogas purification plant with minimal cost.

2
CHAPTER II: LITERATURE REVIEW
BIOGAS WATERWASH
COMPONENTS OF BIOGAS
Primary Components
Biogas is produced in different environments and WWTP is one of the best and readily
available sources. In landfills and in WWTPs, biogas is naturally produced by anaerobic
degradation of organic materials. Usually biogas contains 45-70 % methane (CH4) and 30-
45 % carbon dioxide (CO2), very little amount of nitrogen (N2) and trace amount of
hydrogen sulfide (H2S). The main component methane is a reliable source of energy and is
produced with very minimal cost but can be detrimental for the environment if released to
atmosphere. Some countries burn the raw gas because there is a lack of good purification
process for biogas. Even though it’s not an innocuous solution as it produces carbon
dioxide but methane is roughly 30 times more potent as a heat-trapping gas.
Biogas from sewage digesters of WWTP typically has higher methane content than landfill
or biogas plant. It usually contains 55-65 % methane, 35-45 % carbon dioxide and < 1 %
nitrogen and negligible amount of hydrogen sulfide. Biogas from organic waste digesters
usually contains from 60-70 % methane, 30-40 % carbon dioxide and < 1 % nitrogen, while
in landfills methane content is usually from 45 to 55 %, carbon dioxide from 30-40 % and
nitrogen from 5-15 % (Jönsson et al., 2003). In Germany the typical biogas plant has
methane content of about 53.7%, carbon dioxide 45.2% and hydrogen sulfide 101.8 ppm
(Götz, Köppel, Reimert, & Graf, 2012).
Table 2.1 shows the biogas component variation depending on its source in plants located
in Scandinavia(Rasi, 2009).

3
Table 2. 1: Content of methane, carbon dioxide, oxygen, nitrogen, and hydrogen sulfide in
biogas from the different biogas producing plants in Norway
Methane
The simplest alkane methane is one of the most readily available gas naturally found in the
atmosphere. As the main component of natural gas methane has heat of combustion of 55.5
MJ/kg. Based on data from 1990 to 2012, U.S. methane emission dropped from 635.2
TgCO2e to 567.3 TgCO2e (Murray et al., 2014). The trend continues for U.S. methane
emissions from landfills as it decreased from 147.8 TgCO2e to 102.8 TgCO2e. But, U.S.
methane emissions from WWTPs remained rather stable around 13 TgCO2e. U.S. methane
emissions from manure management has increased from 31.5 TgCO2e to 52.9 TgCO2e due
to the increasing use of liquid systems facilitated by a shift to larger facilities (EPA, 1999).
Type of Plant CH4 [%] CO2 [%] O2 [%] N2 [%] H2S [ppm]
Landfills:
Mustankorkea 47-57 37-43 <1 <1-17 36-230
Koukkujarvi 47-62 37-41 n.a. n.a. 27-32
Tarastenjarvi 1 49-57 32-35 n.a. n.a. 108-125
Tarastenjarvi 2 51-61 35-37 n.a. n.a. 53-84
Ammassuo 50-52 36-38 n.a. n.a. 300-500
WWTPs
Jayvaskyla 60-65 34-38 <1 <1 <1-4
Tampere 1 61-67 33-38 n.a. n.a. 2-4
Tampere 2 61-66 35-36 n.a. n.a. <1-2
Espoo 64-66 34-36 n.a. n.a. <1-2
Biogas Plants
Kupferzell 56 n.a. n.a. n.a. 300
Remlingen 55 44 n.a. n.a. 300
Vaasa 56-65 38-40 n.a. n.a. 500-1000
Ilmajoki 65-70 29 n.a. n.a. 3-5
Laukaa 55-58 37-38 <1 <1-2 32-169

4
In fact, the U.S. has the highest methane emissions from manure management of any
country—twice as much as second and third place, India and China, respectively. Yet, this
only accounts for about 9% of the U.S.’s total methane emissions (EPA, 2015).
Under the United Nations Framework Convention on Climate Change (UNFCCC), every
country must report their national anthropogenic greenhouse gas emissions (or gas
emission caused by human activity) calculated using similar methods (United Nations,
1992).
It says,
The Intergovernmental Panel on Climate Change (IPCC) provides three different methods
or “tiers” for calculating emissions (IPCC, 2008). All are bottom-up approaches in which
emissions from individual source types are generally calculated as the product of activity
data and emission factors. Based on the data provided by (Maasakkers et al., 2016) the
national total methane emission is shown in the following Map.
Article 4
(1)
All Parties, taking into account their common but differentiated responsibilities and
their specific national and regional development priorities, objectives and
circumstances, shall:
(a).
Develop, periodically update, publish and make available to the Conference of the
Parties, in accordance with Article 12, national inventories of anthropogenic emissions
by sources and removals by sinks of all greenhouse gases not controlled by the Montreal
Protocol, using comparable methodologies to be agreed upon by the Conference of the
Parties;

5
Figure 2. 1: (a) Map based on the gridded 2012 methane data – National Total ; (b) Map
based on the gridded 2012 methane data – Agricultural and (c) Map based on the gridded
2012 methane data – WWTP & Landfill, Source: (Maasakkers et al., 2016).
Carbon Dioxide
When sludge from wastewater is kept under anaerobic condition, hydrogen sulfide and
other sulfide compounds are produced in biogas in several different ways (Wilber &
(a)
(b) (c)

6
Murray, 1990). For instance, degradation of sulfur containing amino acids forms
methanethiol and dimethyl sulfide (DMS). When DMS is reduced after methanogenic
conversion, methane and methanethiol are formed. This methanethiol later forms the basic
components of biogas - methane, carbon dioxide and hydrogen sulfide (Lomans, Pol, &
Op den Camp, 2002).
The separation of carbon dioxide from nitrogen or hydrogen has been the center of attention
in recent years for gas separation and membrane research. The reason is the necessity and
requirement to reduce carbon dioxide emissions to tackle the greenhouse gas effect and
global temperature rise. Any source of carbon dioxide production should be focused in
reducing emission. Wastewater treatment plants and landfills are not the biggest players in
carbon dioxide emission, but fossil fuel fired power plants are. (Czyperek et al.,
2010)(Merkel, Lin, Wei, & Baker, 2010)
Hydrogen Sulfide
The biogas water wash process can remove halogenated and sulfur compounds from the
landfill gas at a low pressure, although higher pressure would need significantly lower
water flow. The study by Rasi (2009) concludes at 290 psi (20 bar) most sulfides can be
removed albeit these concentrations in the raw gas were low compared to those found in
other studies (Stoddart et al., 1999)(Shin et al., 2002). The presence of sulfur compounds
in biogas is especially harmful because they are corrosive in the presence of free water or
the moisture, which is easily available in the engine oil, and/or landfill gas. These
compounds wear out the engine piston rings as well as cylinder linings. This also affects
oil quality, leading to the need for more frequent oil changes (SEPA, 2004). Overall lower
than the concentrations of over 250 mg organic Cl/Nm3 and over 1500 ppm of hydrogen
sulfide considered damaging (corrosive) to gas engines (Stoddart et al., 1999). To use the
gas in vehicles and to add it into the natural gas grid harsher limits have to be satisfied, <
23 mg/m3 or < 30 mg/m3 for total sulfur, < 1 mg/m3 for chlorine and < 10 mg/m3 for
fluorine (Persson et al. 2006). Apart from all that, engine manufacturers have set minimum
limits on methane content to ensure engine performance. Most manufacturers for light-
duty stoichiometric engines currently specify between 85 and 90 percent minimum

7
methane content, between 2 and 9 percent maximum propane content and between 1 and 5
percent maximum butane content. The methane content of 95 is mandatory for heavy duty
engines such as turbo charged engines (Bradley, 2005).
Other Trace Components
Halogenated compounds are other impurities that need to be mentioned although most
often they are found in landfill gases and their presence is uncommon in biogases produced
from sewage sludge or organic wastes. Organochlorides become a major issue when biogas
is used for energy production as they cause corrosion in vehicle or combustion engines as
well as forming dioxins and furans under certain conditions (Persson et al. 2006). The other
concern is aromatic and chlorinated compounds. Those have been heavily used in industry
as solvents while fluorinated compounds have been used as refrigerating aggregates,
foaming agents, solvents and propellants (Scheutz, Mosbaek, & Kjeldsen, 2004). So, it
depends on the levels of alkanes and aromatic compounds as well as those of halogenated
and oxygenated compounds that are present in the composition and stage of decomposition
of waste (Allen, Braithwaite, & Hills, 1997). Allen et al. (1997) and (Jaffrin, Bentounes,
Joan, & Makhlouf, 2003) detected total chloride in amounts from 118 to 735 and 169
mg/m3 and total fluorine in amounts from 63 to 256 and 25.9 mg/m3 in their studies on
halocarbons in landfill gases.
FACTORS AFFECTING BIOGAS CAPTURE IN WATER WASH
Solubility and Henry’s Law
Henry’s law is the relationship between the partial pressure and solubility in a gas-liquid
system. Introduced by English chemist William Henry, it states that, the solubility of gas
into water is dependent on factors such as pressure, temperature, liquid/gas ratio etc.
According to Henry’s law there is a linear relationship between the partial pressure of a
gas and its concentration in dilute solution:
PA = XA*HA ………………………………………………………………………….(2.1)

8
Where, PA = vapor pressure of component A above the liquid mixture,
XA = mole fraction of A in the liquid mixture,
and HA = Henry’s law constant
The relationship works best at low pressure. At higher pressures Henry’s law is no longer
valid in its simple form (Lekvam & Bishnoi, 1997), and temperature becomes a more
crucial factor than pressure for gas solubility (Pierantozzi, 2003). Carbon dioxide solubility
is the focus of this study as it is the principal contaminant in raw biogas. Carbon dioxide
solubility at high pressures under different temperatures is given in Figure 2.2
pressure [bar]
Figure 2. 2: Solubility of carbon dioxide in high pressures under different temperatures (○
0°C; □ 10 °C; Δ20°C) (Pierantozzi, 2003).
Figure 2.2 shows that the relationship between pressure and solubility is nonlinear after 50
psi, which means higher pressure, is not necessarily the solution for biogas water wash.
The combination of pressure and temperature is important.
Henry’s law also helps to understand the solubility of methane, sulfur dioxide and nitrogen
in water. Because methane has a very low partial pressure as compared to H2S or CO2, it’ll
escape the system at moderate pressure. H2S has a very high partial pressure and stays
dissolved in water almost entirely and so does most of the carbon dioxide.
CO
2 s
olu
bil
ity (
gC
O2/1
00g H
2O
)
0 1
2
3
4
5
6
7
8
9
0 50 100 150 200 250

9
Following is the list of Henry’s law constants for different gasses from various sources.
The table indicates similar KH value for the selected gasses.
Component Henry’s Law Constant (KH) Source
Carbon Dioxide
(CO2)
3.4×10⁻²
3.4×10⁻²
3.5×10⁻²
3.6×10⁻²
(Jacob, 1986)
(Lelieveld & Crutzen, 1991)
(Lide, 1998)
(Zheng, Guo, & Knapp, 1997)
Methane
(CH4)
1.5×10⁻³
1.3×10⁻³
1.5×10⁻³
1.4×10⁻³
(Hine & Mookerjee, 1975)
(Mackay & Shiu, 1981)
(Yaws, 1999)
(Lide, 1998)
Hydrogen
Sulfide
(H2S)
1.0×10⁻¹
1.0×10⁻¹
1.0×10⁻¹
1.0×10⁻¹
(Edwards, Maurer, Newman, & Prausnitz, 1978)
(Carroll & Mather, 1989)
(Dean, 1990)
(Lide, 1998)
Nitrogen
(N2)
6.5×10⁻⁴
6.1×10⁻⁴
(Wilhelm, Battino, & Wilcock, 1977)
(Kavanaugh & Trussell, 1980)
Table 2. 2: Different components of Biogas and their Henry’s Law Constant
Pressure
Pressure is the most important factor in biogas purification when pressure swing absorption
(PSA) or water wash/water scrubbing (WW) is used as means of treatment. Pressure swing
is a solid adsorbent-based process that relies on the selective adsorption of carbon dioxide
on the surface of special porous solid adsorbents. At elevated pressure the adsorption
occurs, and separation occurs when the pressure is reduced on the adsorbent. On the other
hand, water wash is liquid based, when pressurized gas flows through water, CO2 and other
impurities are absorbed in water. Liquids other than water are used in absorption processes,
and in some locations membrane technology is used (Persson, Jonsson, & Wellinger,
2007). As the upgrading of biogases from sewage and biowaste digesters is rapidly
increasing in some countries (Appels, Baeyens, Degrève, & Dewil, 2008) it becomes
important that an integrated water treatment and biogas purification process is used. This

10
study analyzes the possible ways that can be achieved. The colder climate of midwestern
United States and its impact on the selected process has also been considered.
Henry’s constant is an indirect measurement of the solubility of a gas in liquid. The
solubility is influenced by temperature, pressure, and system type used in absorption. The
solubility decreases with increasing temperature and increases with increasing pressure. It
is anticipated that CO2 capture (%) will increase by increasing the feed biogas pressure in
the absorption column and will decrease under low pressure because of the enhanced CO2
solubility at higher pressures (Marzouk, Al-Marzouqi, El-Naas, Abdullatif, & Ismail,
2010).
Temperature
Temperature is the second most important factor after pressure in water wash as at higher
pressure Henry’s law doesn’t accurately predict the absorption and with higher temperature
it only makes the prediction worse. Temperature also plays a significant role in anaerobic
digestion. Different microbial communities respond differently to the same feedstock.
Biogas composition is mostly dependent upon its source (Williams, Kaffka, & Oglesby,
2014). Feedstock material, microbial communities, reactor conditions such as temperature
and pH and operating parameters (e.g., hydraulic retention time) will produce minor
variations in gas quality and composition.
The reason why solubility of gases varies with changing temperature is diffusion (Sjöstrand
& Yazdi, 2009; Sohrabi, Marjani, Moradi, Davallo, & Shirazian, 2011). The solubility of
gases in water decreases by increasing temperature, according to Henry’s law, meanwhile
the liquid-phase diffusion coefficients decrease with decreasing the temperature (Sohrabi
et al., 2011), lowering the CO2 removal efficiency.
Relation Between Factors
Physical absorption of gases in water is governed by Henry’s Law, which implies
knowledge of the solubility of biogas components in water is necessary. This is an essential
condition for an optimum design and optimization of HPWS process (Cozma et al., 2014)

11
The Henry's constant for a specific gas is only valid at one specific temperature and plays
a key role at higher pressure. After the temperature is increased, the solubility decreases
and vice versa. The equation introduced by Dutch Chemist van't Hoff is one that can be
used to get an approximation of how the solubility varies with the temperature (Sander,
2011).
𝐾H (𝑇2) = 𝐾H (𝑇1) exp [𝐶 (1
𝑇2 –
1
𝑇1 )] …………………………………………….... (2.2)
In Eq. 2.2, T1 and T2 are the absolute temperatures for the known and unknown constant
respectively, and C is a specific coefficient which is defined as C=dln(kH))/d(1/T). For
CO2 in water, the value of C is 2400. Figure 2.3 shows how the solubility of CO2 changes
between 10°C and 25°C according to Eq. 2.2. As shown in the figure, the relative solubility
is doubled at 10°C than at 25°C. A similar graph was also published earlier (Petersson &
Wellinger, 2009).
1,8
1,6
1,4
1,2
1
0,8
0,6
0,4
0,2
0
Figure 2. 3: Relative solubility of CO2 in water in the temperature interval between 10°C
and 40°C. Solubility normalized to the value at 25°C.
Figure 2.3 Shows that the solubility falls sharply at lower temperature but at higher
temperature it falls at a slower rate. This can have a profound impact on the treatment
Re
lati
ve s
olu
bili
ty o
f C
O2
in w
ate
r
10 15 20 25 30 35 40
Temperature [°C]

12
process in the Midwest, where the average daytime temperature in the winter is generally
20-40ºF (Adresen, Hilberg, & Kunkel, 2014) (Walsh, 2018)
DIFFERENT METHODS OF BIOGAS PURIFICATION
Amine-Based Chemical Absorption (CHEM)
In most commercial CO2 capture processes an aqueous solution of MEA (amine-based
solvent) is used (Singh, 1979). The commercialized amine-based chemical absorption
technology for CO2 capture is a reactive absorption by amines, such as monoethanolamine
(MEA) and methyldiethanolamine (MDEA)(Li, Yan, & Campana, 2012). The CO2
absorption process into amine-based solvents occurs in two steps: (i) in the absorption
column, absorption of CO2 happens by countercurrent contact between gas and solvent,
and (ii) the solvent is regenerated of in a second column by heating supply releasing a
concentrated CO2 flux (Dubois & Thomas, 2012).
Separating CO2 from flue streams gas got popularity in the 1970s and it was not because
of the concern about the greenhouse effect. It became popular because of its potential as
an economic source primarily from enhanced oil recovery (EOR) operations. Several
commercial CO2 capture plants were constructed in the U.S. in the late 1970s and early
1980s (DuPart, Bacon, & Edwards, 1993) For chemical absorption in gas treating the use
of an alkanolamine based solution such as mono-ethanolamine (MEA) is still the preferred
choice. But it’s not perfect and alternative solvents are required when different aspects are
taken into account, the aspects include absorption performances and energy consumption
for solvent regeneration and solvent resistance to degradation (Eide-Haugmo et al.,
2011)(Lepaumier, Picq, & Carrette, 2009).

13
Figure 2. 3: Amine-Based Chemical Absorption. Illustration Credit: (Mazari et al., 2015)
Amine solutions includes monoethanolamine (MEA), a primary alkanolamine which is
considered as benchmark in most studies; methyldiethanolamine (MDEA), a tertiary
alkanolamine; 2-amino-2-methyl-1-propanol (AMP), a sterically hindered amine (SHA),
and three cyclical amines usually applied as absorption activators, namely piperidine (PIP),
a cyclical monoamine, piperazine (PZ), a cyclical diamine, and piperazinyl-1,2-ethylamine
(PZEA), a cyclical triamine with the particularity of containing three amine functions
(primary, secondary, and tertiary).
Figure 2. 4: CO2 Absorption in Amines. Chart Credit: (Lallemand et al., 2012)

14
Chemical absorption ensures a total methane recovery while the water scrubbing has higher
methane losses which means it depends more on the solvent flowrate than in the case of
chemical absorption. Amines have a high selectivity and loading for CO2 (Figure 2.5)—
one to two orders of magnitude more CO2 can be dissolved per unit volume in amines than
in water. Since amine based absorption has low CH4 absorption it also provides low
methane slip, i.e. the methane lost to the off -gas stream, of 0.04 – 0.1%, which is an order
of magnitude less than other absorption and scrubbing technologies (Murray et al., 2014).
However, amine-based absorption is not devoid of downsides. The two advantages of the
chemical absorption here highlighted present a drawback: due to the lower pressure and
the higher temperature in absorber, the purified gas coming from a chemical absorption has
higher water content than the gas obtained from the water scrubbing or water wash. Among
the MEA 30 % w/w solution and the MEA 15 % w/w solution, the last one ensures lower
water content in the gas due to the lower absorption temperature. In addition to these
factors, several other characteristics should be considered before deciding when and if
water scrubbing is preferred over the chemical scrubbing.
Amine based absorption requires regeneration and an exhaustive technical-economic
analysis is necessary to consider whether heating sources at no or moderate costs are
available for this purpose or not, and the quantification of the revenue losses if a fraction
of the produced biogas is used for the amine regeneration. As mentioned earlier amine-
based absorption can have higher water content and the water content of the purified gas
impacts on the subsequent gas drying facilities. As a result, if chemical scrubbing is used,
the absorption pressure could be slightly increased in order to obtain an acceptable
compromise between the drying costs and the costs due to the gas compression work.
Lastly, the pumping work for the solvent circulation must be considered which might be
already included in water wash if integrated in a waste water treatment plant. So, lots of
different factors must be considered when deciding what biogas upgrading purification
should be preferred (also depending on the biogas source which, as in the case of biogas
from municipal wastewater treatment plant sludge, could be linked to the absorbent
source), but the correct calculation of the performances of the techniques to be potentially
chosen is a necessary starting point (Gamba & Pellegrini, 2013).

15
Organic Solvent-Based Physical Absorption (PHY)
The impurities carbon dioxide and hydrogen sulfide can also be absorbed using organic
liquid solvents other than water. Organic glycols are the most common absorbents in this
case (e.g., polyethylene glycol). Physical organic solvents allow for greater H2S and CO2
solubility than in water, allowing for lower solvent demand and reduced pumping. The
process can be greatly beneficial where water is not abundant for Waterwash. Glycols for
scrubbing biogas are commercially found with such names as Genosorb® 1753,
SELEXOL, Purisol, Rectisol, Ifpexol, and Sepasolv (Murray et al., 2014).
The physical absorption is comparable to water wash. To improve absorption, gas is
compressed to 4 – 8 bar (around 60 – 115 psi) and the temperature is lowered to 10 – 20
°C (50 - 70°F). Physical solvent scrubbers also operate in a similar manner to water
scrubbers, using counter‐current flows and a packed media bed. It also has absorber and
flash like water wash. To regenerate the saturated solvent, it passes through a flash column,
heated to 40 – 80 °C, and then run through a packed air stripper/desorption column.
Depending on the pressure and temperature and other factors the product gas is normally
made to consist of 95 – 98% methane with 1.5 – 4% methane slip. To get the physical
solvent back and reuse it in the system depressurization in a flash column is necessary.
Along with pressure reduction, heating (40 – 80 °C), and steam or air stripping is also
necessary to regenerate the solvent. Although the solvent can be regenerated, it cannot be
used forever and needs eventual replacement, producing some hazardous liquid waste.
However, only a minor addition of solvent roughly once a year is usually required. Also,
the stripper exhaust gas cannot be released without treatment and must be treated by
regenerative thermal oxidation (at 800 °C). Because its methane concentration is too low
for flameless oxidation it cannot be burnt.
Figure 2.6 shows a typical layout of a physical absorption system. The raw biogas goes
through the compressor after it goes through the H2O separator. The compressed gas then
goes through the absorber where methane is separated through the absorption of other
gases. The impurity absorbed solvent then goes through the flash and stripper to regenerate
purified form the solvent which can be reused in the system. The system has a heat

16
exchanger as maintaining right temperature has significant effect on the purification
process.
Figure 2. 5: Physical Solvent Scrubber Process Diagram. Illustration Credit: (ÖKOBIT
GmbH, 2014)
When using glycols for physical absorption no precision desulphurization is generally
required. Another advantage over water scrubbing and chemical absorption is that glycols
are hygroscopic, meaning that they will absorb water by forming crystalline structures.
This provides co‐adsorption of H2S, and CO2, and H2O. Nonetheless, moisture
pretreatment by refrigeration is preferred in order to minimize the burden on glycol
regeneration. Glycols will also scrub halogenated hydrocarbons and ammonia, but they
will react with ammonia to form unwanted reaction products. N2 or O2 may only slightly
be removed, but it is likely to be insignificant.
Scrubbing with organic solvents has several other advantages over using water. Firstly,
greater contaminant solubilization into glycols permits glycol systems to have smaller
designs and lower circulation rates. Organic solvents are also anticorrosive, so pipework
does not need to be made of stainless steel. Secondly, their low freezing point allows low
temperature operation, which is better for absorption. In places with water shortages, they
may additional gain support from the fact that no water or antifoaming agent is consumed.
Despite these benefits, physical solvents are more expensive for small‐scale applications
than pressurized water scrubbing or pressure swing adsorption. They also require a larger
total energy demand, although this largely consists of the heat needed for solvent

17
regeneration. The electricity requirement tends to be lower than most other upgrading
technologies. Physical solvent scrubbing can be energy‐competitive if waste heat from
another process is utilized. Similar to pressurized water scrubbing, maintenance costs are
close to 2 – 3% of the investment cost. Maintenance includes occasional turnovers of the
organic solvent, compressor lubricant, and any adsorbent used for preliminary H2S
removal.
Water Wash (WW)
Water wash is one of the most common and readily applicable purification systems where
compounds can be physically dissolved into water. Water is commonly used due to low
cost, low toxicity, and high availability. Integrating it to the wastewater treatment plant can
also help with water availability as the water itself doesn’t have to be pure to be used in the
biogas treatment process and no pumping would be required as well.
CO2 and H2S preferentially dissolve into water compared to CH4 due to lower partial
pressure of methane. Carbon dioxide and hydrogen sulfide are 26 and 75 times,
respectively, more soluble than methane in water1. H2S can also be selectively removed by
water scrubbing because it is even more soluble in water than CO2. However, the H2S
desorbed after contacting can result in fugitive emissions and odor problems. Pre‐removal
of H2S is a more practical and environmentally friendly approach but is not required.
Similar to pressure swing adsorption (PSA), water wash is also a popular process for gas
treatment because of its ability to simultaneously remove many contaminants including
ammonia, sulfur dioxide, chlorine, hydrogen chloride, hydrogen fluoride, aldehydes,
organic acids, alcohol, silicon tetrachloride, silicon tetrafluoride, and siloxanes.
1Solubilities in water: Carbon dioxide 8.2E‐4 mole fraction at 15°C, hydrogen sulfide 2.335E‐3 mole fraction
at 15°C, methane 3.122E‐5 mole fraction at 15°C.

18
A gaseous compound’s dissolution into water is greater at higher pressures. When water
scrubbing is used for CO2 removal, the biogas is pressurized typically at 50 to 250 psi with
a two‐stage compressor, before entering the bottom of the column. These high pressures
require less water in the process.
Absorber is the most important instrument in a water wash system. The absorber column
typically contains a packed bed consisting of a high surface‐area plastic media, allowing
for efficient contact between the water and gas phases. The bed height and packing type
determine the removal efficiency, while the bed diameter determines the gas throughput
capacity. The CO2‐saturated water is continuously withdrawn from the bottom of the
column and the cleaned gas exits from the top. The product gas is around 93 – 98%
methane, but the process loses about 1 – 2% methane into the tail gas—more than most
other systems. In an ideal system with 100% CO2 absorption, at least 4% of the methane
will also be dissolved into the water. The waste CO2 and H2S enriched water can be
regenerated in a flash tank where the pressure is reduced, releasing the dissolved gases.
Again, due to CH4’s low water solubility, CH4 is released first and can be recirculated to
another scrubbing column, effectively increasing the biogas CH4 concentration. Air
stripping the waste water may also be done to remove H2S since H2S may clog pipes in the
regenerative system. However, air stripping introduces oxygen into the water which will
desorb into the biogas, so this may not be suitable for applications where high methane
concentrations are required. The treated waste water is then recycled into the scrubber unit.
The exhaust gas can be treated by regenerative thermal oxidation or flameless oxidation to
avoid SO2 emissions. Figure 2.7 shows the design and fluid flow through a biogas
regenerative water scrubber system.
19
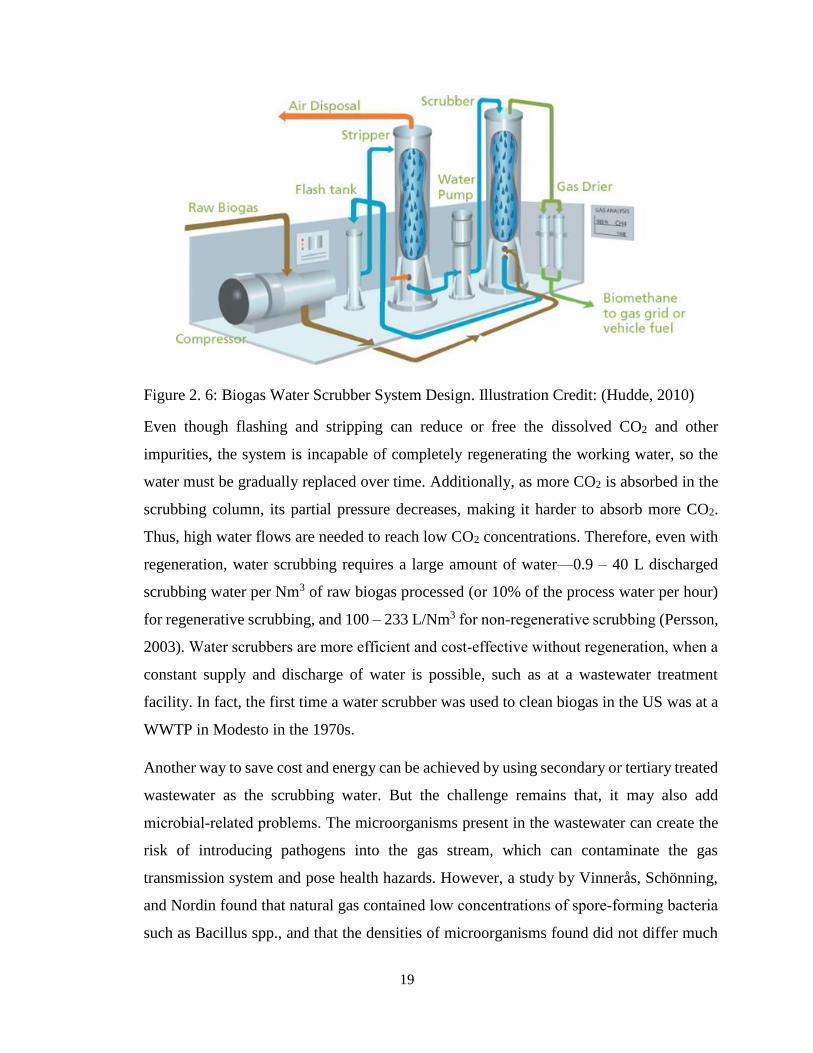
Figure 2. 6: Biogas Water Scrubber System Design. Illustration Credit: (Hudde, 2010)
Even though flashing and stripping can reduce or free the dissolved CO2 and other
impurities, the system is incapable of completely regenerating the working water, so the
water must be gradually replaced over time. Additionally, as more CO2 is absorbed in the
scrubbing column, its partial pressure decreases, making it harder to absorb more CO2.
Thus, high water flows are needed to reach low CO2 concentrations. Therefore, even with
regeneration, water scrubbing requires a large amount of water—0.9 – 40 L discharged
scrubbing water per Nm3 of raw biogas processed (or 10% of the process water per hour)
for regenerative scrubbing, and 100 – 233 L/Nm3 for non‐regenerative scrubbing (Persson,
2003). Water scrubbers are more efficient and cost‐effective without regeneration, when a
constant supply and discharge of water is possible, such as at a wastewater treatment
facility. In fact, the first time a water scrubber was used to clean biogas in the US was at a
WWTP in Modesto in the 1970s.
Another way to save cost and energy can be achieved by using secondary or tertiary treated
wastewater as the scrubbing water. But the challenge remains that, it may also add
microbial‐related problems. The microorganisms present in the wastewater can create the
risk of introducing pathogens into the gas stream, which can contaminate the gas
transmission system and pose health hazards. However, a study by Vinnerås, Schönning,
and Nordin found that natural gas contained low concentrations of spore‐forming bacteria
such as Bacillus spp., and that the densities of microorganisms found did not differ much

20
from what was found in biogas upgraded by wastewater scrubbing (Vinnerås, Schönning,
& Nordin, 2006). Gas intoxication and explosions were more likely occur at a low
biological concentrations, before ingesting a dose of pathogens high enough to cause an
infection. The pumping cost can be saved and with regards to the possible issue of plugging
by biological growth, the water scrubber should be internally and externally cleaned several
times a year. The saving from pumping will have a larger impact than occasional cleaning.
Biogas water scrubbing, or water wash process is the most prevalent upgrading technology,
as it is simple, robust, flexible, proven, and has relatively low investment and operational
costs. It is best implemented in medium and large applications, with competitive pricing
for larger projects, and especially for higher concentration H2S streams. There are
significant economies of scale for all the technologies investigated, the specific investment
costs are similar for plants with a throughput capacity of 1500 Nm3 raw biogas per hour
(950 cfm) or larger (Bauer, Hulteberg, Persson, & Tamm, 2013).
In order to minimize the methane slip from the water scrubber, the pressure is first
decreased from 100-150 psi in absorber to around 2.5–3.5 bar (35-50 psi) in a flash column.
The main share of absorbed methane, as well as a small share of the carbon dioxide, is
released from the water and recirculated to the compressor and mixed with the raw biogas
entering the scrubber.
However, water wash can be slightly less energy efficient than most other systems,
typically requiring close to 0.3 kWh/Nm3 of cleaned gas. But as explained this limitation
can be overcome by integrating it with waste water treatment plant. There are also
limitations in H2S removal. The pH of H2S or CO2 absorbed water will be lower and the
tank and pipe will be prone to corrosion and thus would require to be made of PVC or
stainless steel. Additionally, water scrubbers can be sensitive to environmental conditions
such as temperature. Maintenance costs are typically 2 – 3% of the investment cost.
If the water consumption is an issue , a variant of conventional water scrubbers can be
used. It is a high-pressure batch‐wise water scrubber that uses pressures above 2,100 psi.
It operates by first filling the scrubbing columns with compressed biogas then pressurized
water is then pumped into the columns that displaces the gas. The water is afterwards
purged and regenerated by a flash tank and a desorption column similar to a general water

21
wash system. The system produces a 92 – 95% methane gas and because of higher pressure
the methane slip is higher in around 1 – 3%. Compared to conventional systems while it
uses significantly less water (33.4 – 66.8 L/Nm3 of product gas) but consumes more energy
(0.4 – 0.5 kWh/Nm3 raw biogas).
While batch wise scrubber uses high pressure another variation of conventional water
scrubbers, rotary coil water scrubber commercially named as Biosling can be used at low
pressure. It works by water and gas flowing through a rotating coiled tubing. Water is first
fed into the outermost coil turn at 29 psi (2 bar). As the coils rotates, water columns are
forced inward and compress the gas effectively increasing the pressure to 145 psi (10 bar).
This results in efficient carbon dioxide absorption, producing a gas with 94% methane with
about 1% methane slip. To increase the methane content further to 97%, the rotary coil can
be equipped with a post‐process conventional water column (Biosling AB, 2012). The
Biosling is claimed to be more energy efficient than conventional water scrubbers,
consuming only 0.26 – 0.44 kWh/Nm3 of product gas. Although the Biosling is
commercially available, there are no full‐scale commercial installations at this time.
Pressure Swing Adsorption (PSA)
Like other methods the goal of Pressure swing adsorption (PSA) is to separate carbon
dioxide from methane. The process is performed by adsorption/desorption of carbon
dioxide on zeolites or activated carbon at different pressure levels. The technology is very
common in gas treatment industry as it is also effectively removes volatile organic
compounds (VOC), nitrogen and oxygen from industrial gas streams. PSA requires varying
pressure between 1 – 10 bar, but often 4 – 7 bar, and a temperature of 5 – 35 °C (Williams,
Kaffka, & Oglesby, 2014). After the pressure is applied, CO2 with other contaminants are
adsorb onto the media. The remaining unabsorbed gas, mostly methane, is transferred out
of the vessel. After the pressure is reduced in the vessel, the unwanted captured gases
desorb and are ready to be sent in a different location. In most cases, multiple vessels are
used in parallel to get a high production rate and better-quality gas that can improve energy
efficiency.

22
Figure 2.8 shows a four‐vessel pressure swing adsorption system using carbon molecular
sieves, cycling between absorption and regeneration.
Figure 2. 7: Pressure Swing Adsorption Process Diagram. Source: (Zhao et al., 2010)
Pressure Swing Adsorption is also highly efficient in removing impurities from biogas.
PSA can provide upgraded biogas with methane concentrations as high as 95‐98%. The
methane recovery rate can range from 60 to 80% which means the rest of methane leaves
the system in the tail gas with the desorbed CO2 (which would be 10‐20% methane by
volume). It’s one of the disadvantages that the methane slip is higher than other typical
recovery processes. Among other possibilities, the tail gas can be combusted to destroy the
bypass methane for heat recovery.
On the other hand, the waste gas can be sent through another PSA cycle for additional
methane recovery. By mixing the blowdown gas with the raw biogas, methane recovery
can be increased by up to 5%. Carbon beds have an operating life of 4,000 to 8,000 hours
but are longer at low H2S levels. Thus, hydrogen sulfide pretreatment may be preferred.
But if the pretreatment of H2S is chosen, moisture content should be a concern since water
can block the absorbent’s micropore thus system performance can be reduced.
One of the advantages of installing PSA is that, a simple PSA can be cost‐effective at small
scale as low as 10 Nm3/h of raw biogas. Thus, PSA systems have also been used as a
follow‐up polishing step for other upgrading processes, using long (several hour) cycles to
remove small fractions of CO2. But the methane loss still would be an issue.

23
However, a PSA can be fast when variant of PSA - rapid cycle PSA (RPSA) is used, which
operates at 5 – 20 times the cycle speed by using multi‐port selector rotary valves and a
multitude of smaller adsorption chambers. Rapid cycle PSA systems boast smaller sizes,
lower capital costs, simple control interfaces, lower pressure drops, and higher throughputs.
Overall, RPSA takes the shortest time comparing to similar recovery techniques (Torkkeli,
2003). However, their high speed comes at the cost of lower methane recovery. Their
complexity also makes it difficult to personally perform maintenance, and valve wearing
becomes more of an issue. Nevertheless, rapid cycle PSA systems have proven their
efficacy with many successful full‐scale operating projects. One of the largest suppliers of
rapid cycle PSA technology is Xebec Adsorption Inc., which sells biogas purification with
a capacity range from 150 to 5,000 Nm3/h (100 – 3000 cfm) of raw biogas (xebecinc.com).
According to Xebec, their plant in Cincinnati, OH can upgrade biogas from a mere 20% to
an impressive 98% (XEBEC, 2012). The plant has a capacity of 3270 Nm3/h or 2000 cfm.
Membrane Separation
Unlike other purification processes, membrane separation uses pressure and membrane
instead of an absorbent solution. Membrane separation utilizes high gas pressures to create
a large pressure differential across a nano porous membrane causing gas separation. The
process can use several different mechanisms including molecular sieving (size exclusion),
Knudsen diffusion (mean path difference), solution‐diffusion (solubility difference),
surface diffusion (polarity difference), and capillary condensation (adsorption). However,
the permeation rate of different gasses can be different depending upon the membrane pore
size (Figure 2.9).
Figure 2. 8: Gas Separation Membrane Permeation Rates. Source: (Suda & Haraya, 1997)
Contaminant or target molecules are forced through the membrane by pressurizing the feed
gas side to somewhere between 100 – 600 psi (7 – 10 bar), depending upon the biomethane
quality requirements as well as the design and manufacturer. The feed gas is passed across
Relative Permeation Rates
Fast H2O He H2 NH3 CO2 H2S O2 Ar CO N2 CH4 C2H4 C3H6 Slow

24
the membrane at an optimal velocity to allow for optimal contaminant gas permeation and
minimal methane permeation. After membrane treatment, the majority of carbon dioxide,
water, hydrogen, and ammonia will pass through the membrane and be removed. The feed
gas will retain most of the methane, with some hydrogen sulfide, nitrogen, and oxygen.
Figure 2.10 (i) shows typical gas permeability through a membrane.
Figure 2. 9: (i) Schematic representation of the separation principle (ii) Two-stage
process with recycle and a compressor [Raw biogas (Rohbiogas) enters the system from
left]. Illustration Credit: (Harasek, 2006)
For membrane safety, biogas generally requires pretreatment to remove aggressive
substances that can destroy the membrane material. The pretreatment is also necessary
because the membrane separation does not remove H2S or inert (e.g., O2, N2) very well.
(i)
(ii)

25
The substances that can damage the membrane include water, hydrogen sulfide, ammonia,
VOCs, siloxanes, particulates, and oil vapor. Water is removed to prevent condensation
during compression, and hydrogen sulfide is removed since it is not sufficiently removed
by membranes. Oils that are naturally present or picked up from the compressor should be
removed to prevent membrane fouling. Ammonia can cause membrane swelling, while
siloxanes and particles can physically damage the compressor and membrane structure.
The pretreatment has other disadvantages as well. Despite the use of gas pretreatment
systems, the membranes can still suffer from plasticization, compaction, aging, competitive
sorption, and fouling. Eventually, the membranes must be replaced. The membranes should
be replaced in every 2-5 years.
Gas separation membranes are mostly constructed from bundled polymeric (e.g.,
polysulfone, polyimide, polydimethylsiloxane) hollow‐fiber membrane or carbon
membrane, as opposed to natural organic or sheet, for superior structural integrity and
higher surface‐area‐to‐volume ratios. In recent years carbon molecular sieve (CMS)‐based
membranes have attracted great attention because of their outstanding gas‐separation
performance (Wang, Ren, Zhang, Zhang, & Jin, 2018).
At present DMT Clear Gas Solutions LLC (dmt-cgs.com) provides their Carborex®MS
technology to upgrade biogas using membrane separation. The entire system is built on a
skid or in a container, which results in a small footprint and an easily transportable system.
The spaghetti looking hollow fibers are used to create the membranes inside the
Carborex®MS. The hollow fibers themselves are non-porous and made of polymers.
DMT-CGS has their biggest plant in Ashland, KY, USA with a gas flow of 4000 cfm.
The hollow‐fibers are bundled within small self‐contained vessels, allowing for easy
membrane unit replacement.

26
Figure 2. 10: Biogas Production to Supply Using High-Pressure Gas Separation
Membrane Design at DMT-CGS
Illustration Credit: dmt-cgs.com (2018)
High‐pressure gas separation systems are highly reliable, easy to operate, have a simple
and compact plant design, and can also be used for gas dehydration. But unlike Pressure
Swing, Membrane Separation has limitation due to permeation through the membrane and
the separation is only reasonable at flow rates of more than 500 m3/h (300 cfm). There is a
tradeoff between gas recovery and gas slip. If the pressure is increased the gas would better
in quality but the gas slip would be higher (Coker, Freeman, & Fleming, 1998)
Nevertheless, this process often has more methane slip (0.5 – 15%) than other upgrading
technologies, which increases with higher product gas methane requirements.
In order to achieve higher methane content in the product, several stages can be used. For
instance, biogas can be upgraded to around 92% methane content with a single membrane,
or 96% with two or three membranes in series. According to DMT-CGS the membrane can
upgrade methane to 98% using multi-stage process. However, the use of more membranes
leads to higher methane loses and greater energy consumption. Membrane separation
processes can have low or high energy consumption (0.18 – 0.77 kWh/Nm³), with the
potential for low power consumption (< 0.22 kWh/Nm³) with highly selective membranes.
Additionally, the gas liquid membrane technology can prevent typical problems like
foaming and channeling by using a membrane between the gas‐liquid interface.

27
Comparison Between Upgrading Technologies
Biogas
Upgradi
ng
Process
Press.
(psi)
T
(°C)
Product
CH₄
Cont.
CH4
Slip
CH4
Recov.
Sulfur
Pre-
Treatm
ent
Consumables
PSA 14 –
145
5 – 30 95 –
98%
1 – 3.5% 60 –
98.5%
Required Adsorbent
Amine
Absorp.
(CHEM)
0 (<
150)
35 – 50 99% 0.04 –
0.1%
99.9% Prefer
red /
Requi
red
Amine
solution; Anti-
fouling agent;
Drying agent
Water
Wash
(WW)
100 –
300
20 – 40 93 –
98%
1 – 3% 82
-
99
%
Not
needed /
Preferred
Water; Anti-
fouling agent;
Drying agent
Phy.
Sol.
Scrubbing
(PHY)
58 –
116
10 – 20 95 –
98%
1.5 – 4% 87–99% Not
needed /
Preferred
Physical
solvent
Mem.
Sep.
100 –
600
25 – 60 85 –
99%
0.5
–
20%
75–
99.5%
Preferred Membranes
Table 2. 3: Comparison Between Biogas Upgrading Technologies. [Source: (Beil &
Beyrich, 2013); (Severn Wye Energy Agency, 2013); (Starr, Gabarrell, Villalba, Talens,
& Lombardi, 2012)]
MECHANICAL COMPONENTS OF WATER WASH
Absorber
Absorber is the most important mechanical component in a gas treatment system and there
is still room for innovation to make it even more efficient. The primary function of an
absorber is to increase the area of contact between the liquid and the gas phases to facilitate
mass transfer. The process usually works by dividing the gas into small bubbles in a
continuous liquid phase, spreading the liquid into films that flow through a continuous gas
phase or forming the liquid into small drops in a continuous gas phase (Kohl & Nielsen,
1997). Depending on selected process the different absorbent solutions are chosen. It can
be amine solution; glycol solution or water and the success of the process also depends on
adapting proper absorber. The even distribution of liquid and gas in the absorption column

28
is another vital aspect that can be helpful in avoiding gas channeling, which causes a
decrease in the removal efficiency of gas components (Hunter & Oyama, 2000).
For water wash, pressurized biogas is injected into the bottom of the absorption column
and water is injected to the top of the column. The counterflow of gas and water is essential
to minimize the energy consumption and methane loss as well as to maximize contact.
After absorption the water leaves the absorber rich with carbon dioxide and other impurities
while due to low partial pressure methane escapes and captured via an outflow system. The
success of water wash system depends on water containing as much carbon dioxide as
possible and as little methane as possible.
Packing materials and their orientation determines the efficiency of absorption. The
packing material used in the gas absorption process can be either random packing or
structured packing (Arachchige & Melaaen, 2012). There are several packing types
available in the Aspen Plus process simulation tool. Random packing includes Pall ring,
IMTP and Raschig rings while Structured packing includes Flexipac, Mellapak, Gempak
and BX. In this study ceramic Raschig rings were used because they are easy to maintain.
The other reason being water from waste water treatment plant has solids in it and can
cause obstruction for water flow in structured packing. Sulzer is a multinational company
working in more than 40 countries has innovative gas purification components including
absorbers. The following figures would give an idea about their packing materials.
Figure 2. 11: Random Packing (left) and Mellapak Structured Packing (right). Source:
sulzer.com

29
The height of the bed and the type of packing determines the efficiency of separation in the
column, whereas the diameter determines the gas throughput capacity (Strigle, 1994).
Therefore, a higher bed is better in cleaning biogas with lower methane concentration while
a wider column is helpful in cleaning larger volume of biogas. While a bigger diameter is
better for higher gas flow, it can be problematic if the flow is low due to minimum contact
between gas and water. If the load is too low, the water will not be evenly distributed over
the cross-section area and the biogas will be mixed with the water in a suboptimal way.
The minimum load varies between 20% and 50% of the maximum capacity, depending on
the design (Gamba & Pellegrini, 2013).
Flash
After the unwanted gasses are absorbed in the absorber, the waste CO2 and H2S enriched
water can be regenerated in a flash tank where the pressure is reduced, releasing the
dissolved gases. Depending on the pressure there is always methane slip that is absorbed
by the water in the absorption column. To recover the methane the water is transported into
a flash column. In the flash column, the pressure is decreased by around 30-50% to 30-50
psi from 100-150 psi in absorber. Due to different partial pressure, some of the carbon
dioxide and most of the methane is released from the water and circulated back to the
compressor for further absorption. At this point, methane concentration in water is very
low and CO2 concentration is very high. Although multiple flash units can be installed if
the methane slip is high due to high pressure in absorber. Finally, the water that is
transported to the stripper which will contain the main part of the carbon dioxide but
typically less than 1% of the methane.
The pressure in the flash column is decreased to maintain the same methane slip if the
methane concentration in the raw biogas increases. Because more methane and less carbon
dioxide is transported with the water into the flash column, it changes the composition –
more CH4 and less CO2 – in the flash column gas volume. If the pressure is kept constant,
the partial pressure of methane will increase significantly resulting in higher solubility in
the water. If the incoming raw biogas has a higher methane content, then there will be

30
higher methane slip which as well in return would require even lower pressure in flash to
facilitate escaping of absorbed methane.
Unlike the absorber the flash column has no packing and is designed with a diameter wide
enough to decrease the vertical speed of the water to such an extent that even small gas
bubbles are able to rise instead of being dragged into the stripper. The top of the flash
column should be designed so that water is not sucked into the gas going back to the
compressor. The volume of this gas stream going back to the compressor is usually 20-
30% of the incoming raw gas flow.
After removing most of the slipped methane from the water in the flash column, the carbon
dioxide is released from the water in the stripper also known as desorption column. The
water enters the top of the desorption column, while air is entering at the bottom. The
pressure in stripper is kept at atmospheric level to facilitate the gas escaping especially
carbon dioxide. The stripper is also filled with random packing to increase the contact
surface between the air and the water. The water leaving the desorption column is almost
free from carbon dioxide and is pumped back to absorber and it usually takes around 1-5
minutes for stripping depending on design and loading.
Compressor
As the Biogas waterwash process works based on supplied pressure and temperature,
compressor is an essential element in the process. The process needs anywhere between
25-150 psi pressure based on water use and other parameters. The raw biogas passes
through the compressor attaining a high pressure then it goes through the absorber. After
the absorption of CO2, H2S and some methane, the water passes through the Flash. Because
of low pressure in Flash, some of the carbon dioxide as well as the main part of the methane
is released from the water and circulated back to the compressor.
Cooler
Gas compression increases temperature but the biogas waterwash process works best at
low temperature. Temperature between 40-60 F is quite satisfactory for biogas waterwash
and can be easily obtained most of time of the year in Midwest. With 2 absorbers, the
31
process uses 3 coolers to keep the water temperature at optimum level to provide better
efficiency in biogas purification.
Stripper
Air stripping the waste water may also be done using the stripper unit to remove H2S since
H2S may clog pipes in the regenerative system. Air stripping introduces oxygen into the
water which will desorb into the biogas, so in this way the absorbed gasses can be taken
out from the water and can be reused in the system. But, Flashing and air stripping are
incapable of completely regenerating the working water, so the water must be gradually
replaced over time. But there is another issue with air stripping that is H2S will be partly
oxidized to elementary sulfur and sulfuric acid (Ryckebosch, Drouillon, & Vervaeren,
2011). The rate of oxidation of H2S in air saturated water has been studied and a clear
correlation with both the temperature and the pH of the water has been shown (Millero,
Hubinger, Fernandez, & Garnett, 1987). The rate of oxidation was increased around 3 times
when the temperature was increased with 20 degrees and around 4 times when the pH was
increased from 4 to 8 at the investigated conditions. The formation of acid in stripper would
lower pH and can cause corrosion on various components, such as water pumps and pipes,
especially if these are made of cast iron.

32
PHOSPHORUS RECOVERY AS STRUVITE
PHOSPHORUS RECOVERY
Importance of Phosphorus Recovery
Phosphorus recovery has been one of the biggest concerns in a WWTP. The primary
concern is the environmental regulation the secondary reason being phosphorus is a limited
natural resource. The Department of Natural Resources (DNR) has approved the
phosphorus effluent level of 1 mg/L for waste water treatment plants under the Clean Water
Act (Department of Natural Resources, 2013). The limitation is imposed under WPDES
permits approved by DNR. The regulation reads as follows,
The common approach to recover phosphorous is by binding to the solid fraction of the
digestate. It can be separated but because of the local chemical environment struvite forms
almost immediately. Struvite is a magnesium mineral with ammonium and phosphate
(MgNH4PO4.6H2O). It’s only sparingly soluble in water, it precipitates both on pipe-work
and as crystals in solution causing blockages which cannot be removed without significant
and costly mechanical or chemical intervention(Cwm Harry Land Trust, 2013).
Chemical Formula of Struvite: (NH4)MgPO4•6(H2O)
Table 2. 4 provides the chemical composition of struvite. As percent of weight almost
29% P2O5 is present in struvite.
An effluent limitation equal to 1 mg/L total phosphorus as a monthly average shall apply
to publicly owned treatment works and privately owned domestic sewage works subject
to ch. NR 210 which discharge wastewater containing more than 150 pounds of total
phosphorus per month, unless an alternative limitation is provided.

33
Table 2. 4: Chemical Composition of Struvite
Component Composition
Magnesium 9.90 % Mg as 16.42 % MgO
Phosphorus 12.62 % P as 28.92 % P2O5
Hydrogen 4.93 % H as 44.05 % H2O
Nitrogen 5.71 % N as 10.61 % (NH4)2O
Oxygen 65.20 Oxygen
Significance of Struvite for MMSD
Milorganite, the famous fertilizer produced in Milwaukee Metropolitan Sewerage District
(MMSD)’s Jones Island WWTP has a phosphorus content of 2.88% as P2O5 (Rehling &
Truog, 1939) while commercially available Diammonium Phosphate (DAP) has 46%
Phosphorus as P2O5 (IPNI, 2018). Struvite has 29% of P2O5 and can be a useful source for
phosphorus. Besides, struvite breaks down biologically rather than chemically and it is
therefore marketed as a slow-release fertilizer (Cwm Harry Land Trust, 2013).
Struvite formation has long been considered either as a curse or an opportunity,
particularly by the waste water industry. (Münch, Benesovsky-Scott, Josey, & Barr,
2001).
It can be hugely detrimental, naturally forming a crystalline deposit to foul and clog pipe-
work and thus needing costly and intensive remediation to remove (Doyle, Oldring,
Churchley, Price, & Parsons, 2003).
It has also been heralded as a possible source of phosphates for agriculture, since stocks
of rock phosphates are dwindling or are becoming too expensive to buy (Ueno & Fujii,
2001).
34
AVAILABLE PHOSPHORUS RECOVERY TECHNOLOGIES
Crystal Green
Crystal Green is the phosphorus recovery product commercialized by Ostara Nutrient
Recovery Technologies Inc. Formulated with continuous release phosphorus, plus nitrogen
and magnesium, Crystal Green is Root-Activated™, releasing in response to the organic
acids produced by the roots with a healthy release of nutrients. Crystal Green gradually
releases phosphorus according to root demand; safely supplying the soil solution with
nutrients needed for optimal plant growth. This citrate soluble mode of action provides
continuous nutrient release which minimizes phosphorus tie up in the soil, lowers the risk
of leaching and runoff, and provides a season-long supply of phosphorus
(crystalgreen.com, 2018).
Crystal Green is called 5-28-0 with 10% Mg because it has 5% Nitrogen, 28%
Phosphorus, 0% Potassium and 10% Magnesium.
Struvite Recovery in Canada
Nutrient recovery from sludge dewatering reject water has been a subject of considerable
research and development efforts in Europe, Japan and North America over the past decade
(Jeanmaire 2001; Ueno and Fuji, 2001, Adnan et al., 2002). Since 1999, the University of
British Columbia has been developing a proprietary struvite recovery process, which has
recently been launched commercially by Ostara Nutrient Recovery Technologies Inc. To
date the technology has been tested at pilot scale in four wastewater treatment plants: The
City of Penticton, BC, the Lulu Island WWTP in Richmond, BC, the Gold Bar WWTP in
Edmonton, AB, and the Nansemond WWTP in Suffolk, VA (Hampton Roads Sanitation
District, HRSD). The technology has also been pilot tested for applications in greenhouse
and animal waste treatment. The first full scale demonstration of this technology is adopted
at the City of Edmonton Gold Bar WWTP after successful completion of a 6-month pilot
study (AT Britton et al., 2007).

35
A pilot scale struvite recovery system was operated at the city of Edmonton’s Gold Bar
WWTP for a period of approximately 6 months from March to November 2006. The
objectives of this pilot demonstration were to demonstrate that the system could cost
effectively recover 75% of soluble phosphate from the sludge lagoon supernatant. The pilot
project made use of UBC’s proprietary reactor design described below and tested several
combinations of magnesium and sodium hydroxide dosage rates to determine the range of
possible conditions capable of meeting the treatment target, leading to an optimum
economic operating regime. Figure 2.13 shows how such a system would work whereas
Table 2.5 shows the removal efficiency. According to AT Britton et al., (2007) on average
71% phosphorus can be removed when the influent phosphorus concentration (as [PO4-P])
was an average of 207 mg/L i.e. 69 mg/L of phosphorus (as [P]).
Figure 2. 12: Schematic Diagram of WW Treatment with Struvite Recovery (AT Britton
et al., 2007)
Table 2.5: Summary of pilot scale struvite recovery test run results. Results are average
for each test run. Source: (AT Britton et al., 2007)
Test
No.
Feed
flow
(L/min)
Feed
[NH4-N]
(mg/L)
Feed
[PO4-P]
(mg/L)
Effluent
pH
Effluent
[NH4-N]
(mg/L)
Effluent
[PO4-P]
(mg/L)
P
removal
(%)
N
removal
(%)
#1 2.4 810 180 7.90 610 28 80% 19%
#2 1.7 690 160 7.98 616 64 64% 11%
#3 1.9 780 150 7.85 717 50 81% 9%
#4 3.3 680 170 7.79 663 73 54% 3%
#5 2.9 720 200 7.87 710 61 67% 7%
#6 1.9 740 225 7.67 650 60 71% 12%
#7 2.3 790 230 7.83 600 61 65% 21%
#8 1.2 1226 340 7.80 676 70 82% 39%
Avg 2.2 805 207 7.84 655 58 71% 15%
Inputs Alternative Scenario: WW Treatment with Struvite Recovery Outputs
Raw Wastewater
Equipment
Chemicals Energy
Maintenance
Wastewater
Treatment
Struvite Fertilizer
Production
Treated WW : ↓
NH3 and PO43-
Struvite Fertilizer :
↓ GHG & Metals
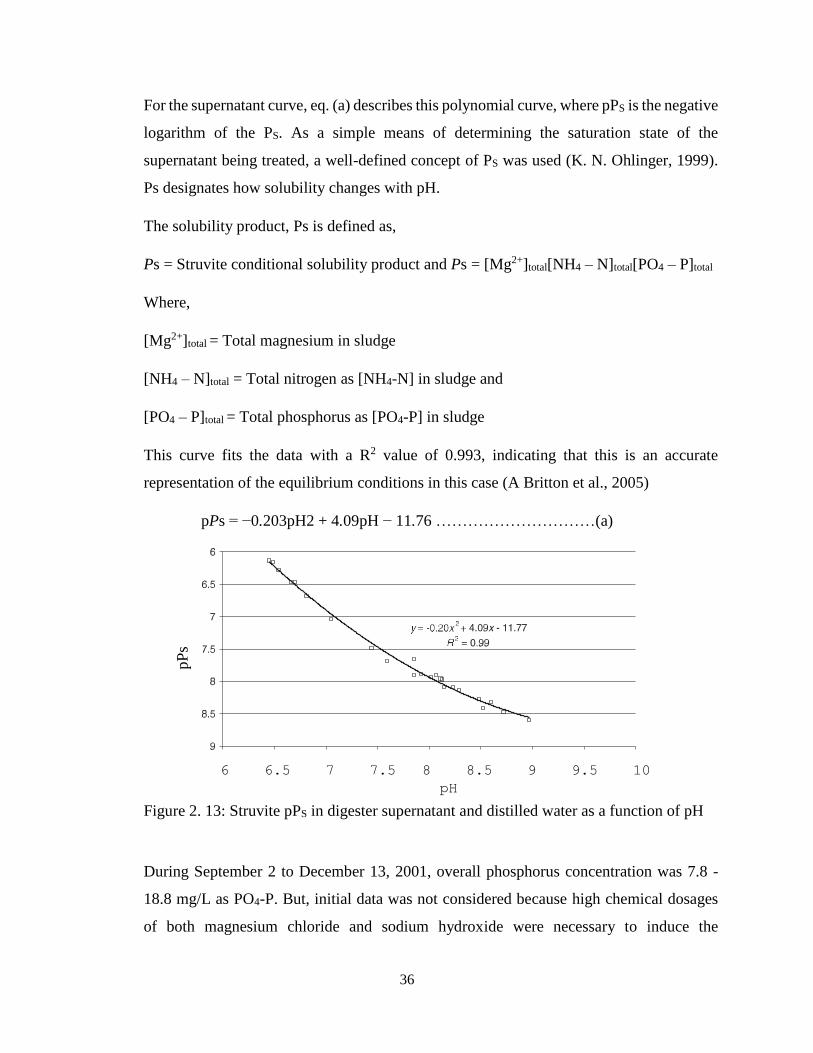
36
For the supernatant curve, eq. (a) describes this polynomial curve, where pPS is the negative
logarithm of the PS. As a simple means of determining the saturation state of the
supernatant being treated, a well-defined concept of PS was used (K. N. Ohlinger, 1999).
Ps designates how solubility changes with pH.
The solubility product, Ps is defined as,
Ps = Struvite conditional solubility product and Ps = [Mg2+]total[NH4 – N]total[PO4 – P]total
Where,
[Mg2+]total = Total magnesium in sludge
[NH4 – N]total = Total nitrogen as [NH4-N] in sludge and
[PO4 – P]total = Total phosphorus as [PO4-P] in sludge
This curve fits the data with a R2 value of 0.993, indicating that this is an accurate
representation of the equilibrium conditions in this case (A Britton et al., 2005)
pPs = −0.203pH2 + 4.09pH − 11.76 …………………………(a)
Figure 2. 13: Struvite pPS in digester supernatant and distilled water as a function of pH
During September 2 to December 13, 2001, overall phosphorus concentration was 7.8 -
18.8 mg/L as PO4-P. But, initial data was not considered because high chemical dosages
of both magnesium chloride and sodium hydroxide were necessary to induce the
6 6.5 7 7.5 8 8.5 9 9.5 10
pH
pP
s

37
crystallization of struvite. These early data are not presented here, because phosphate
removal to <5 mg/L by struvite crystallization requires high operating cost (A Britton et
al., 2005).
Later a method of transferring WAS from the gravity belt thickener was devised, thus
allowing the transfer of much thicker sludge (approximately 5% solids). This practice
allowed much more WAS to be transferred to the digester without hydraulic overloading,
and the phosphate concentration could increase without high suspended solids in the
supernatant. At this period, PO4-P ranged from 37 to 71 mg/L, whereas the NH4-N
concentration ranged from 197 to 436 mg/L and the Mg concentration ranged from 11 to
35 mg/L (A Britton et al., 2005).
Struvite Recovery in US (HRSD, Virginia)
Nansemond Treatment Plant- HRSD is a 30 MGD facility that employs a 5-stage biological
nutrient removal (BNR) process for N and P removal. Recovery Efficiency: 80-90% P and
10-40% NH3-N. They considered both traditional “Ferric Addition” and “Ostara” (Latimer,
Hanson, Khunjar, & Pitt, 2012).
Figure 2. 14: Typical Layout of Nansemond Treatment Plant (HRSD), Virginia.

38
But they found Capital purchase option from Ostara was most profitable. The traditional
ferric addition has similar efficiency but has a high maintenance cost (Latimer et al., 2012).
The plant has been operating for two years and has produced around 1100 lbs. of
struvite/day. Figure 2.16 shows that the plant was able to recover 90% of the phosphorus.
Figure 2. 15: Struvite Recovery at Nansemond Treatment Plant (HRSD), Virginia.
Source: Hazen and Sawyer
The plant was modified and upgraded to meet a total nitrogen limit of 8 mg/L year-round
and 1 mg/L total phosphorus year-round. This includes new supplemental carbon feed
facilities capable of utilizing methanol, ethanol, glycerin, MicroC, corn syrup, or acetic
acid.
It was also upgraded to provide sidestream treatment of centrate i.e. cleaner water leaving
after settlement, using the Ostara process and a backup ferric chloride addition system
using an abandoned pretreatment structure to precipitate phosphorus and equalize the
return stream (hazenandsawyer.com).
39
Struvite Recovery in UK
A £2m ($2.8m) reactor that turns sewage into fertilizer has been installed by Thames Water
at a plant in Berkshire (Tames Water, Slough). The nutrient-recovery facility takes waste
water from the Slough Trading Estate and turns the phosphorus in it into crystalline
fertilizer pellets. The company says it is the first of its kind in Europe and will save it
£200,000 ($280k) a year, which it will pass on to its 14 million customers (BBC.com).
About 150 tons a year of fertilizer will be produced and sold to farmers. Slough operates
mesophilic anaerobic digestion and centrifuge dewatering. From the time that biological
nutrient removal (BNR) for nitrogen and phosphorus became operational problems of
struvite (Mg(NH4)PO4.6H2O) scaling in the pipeline were experienced. BNR works well
at Slough because of the enormous amounts of soluble carbon from the confectionary
companies on the industrial estate; BNR also works well at Reading, another recovery plant
in UK because of the soluble carbon from a large brewery. At most other works,
supplemental C is needed. When the surplus activated sludge becomes anaerobic in the
digester, the P is released from the biomass (Evans & Lane, 2006).
40
CHAPTER III: EXPERIMENTAL MODELING AND CALCULATION
ASPEN PLUS SIMULATION OF BIOGAS WATERWASH
Aspen Plus is a simulation software used in oil and gas refinery as well as in pharmaceutical
industry developed by Aspen Technologies. The physical property selection for modeling
is a very important step in successful prediction of methane recovery. Among many
models, the following thermodynamic models were tested: UNIQUAC (with ideal gas and
Henry’s Law), NRTL (non-random-two-liquid/ with ideal gas and Henry’s Law), NRTL-
RK (non-random two- liquid/Redlich–Kwong equation of state with Henry’s law), UNIQ-
RK (UNIQUAC/Redlich–Kwong equation of state with Henry’s Law); ELECNRTL (the
electrolytic non-random two liquids thermodynamic model with the Redlich–Kwong
equation of state for aqueous and mixed solvent applications Henry’s law) (Aspen Physical
Property System 2010; Cozma et al. 2013). The success or predictability of a model
depends on how well it can consider the variables like temperature and pressure as well as
the mixture ratio and absorber internal setup. The selection of the models is supported by
those parameters that are necessary to describe the gas solubility.
The Electrolyte-NRTL activity coefficient model meaning ELECNRTL works best for
simulations with electrolytes. ELECNRTL calculates liquid phase properties from the
Electrolyte-NRTL activity coefficient model. Vapor phase properties are calculated from
the Redlich-Kwong equation of state (Aspen Tech, 1999). ELECNRTL can represent
aqueous and aqueous/organic electrolyte systems over the entire range of electrolyte
concentrations with a single set of binary interaction parameters. In the absence of
electrolytes, the model reduces to the standard NRTL model. Aspen Plus contains a
databank of binary interaction parameters between water and over 600 electrolyte ion pairs.
The ELECNRTL model works well for biogas water wash because the process does
produce acid solution or hydrogen ions. But the UNIQUAC model or Universal Quasi
Chemical model considers independent central and local molecule or lattice formation,
which does not fit for an acid solution such as biogas water wash.

41
The importance of gas–water relationship in environmental protection, geological science,
or biological field is immense and several experimental measurements have been made by
different authors on the solubility of binary systems of CO2–water, methane–water, H2S–
water, nitrogen–water, and oxygen–water, over a wide ranges of pressures and
temperatures. Based on this knowledge and different theoretical models the solubility of
gases in pure water has been developed (Cozma et al. 2013).
Understanding the different components of biogas waster wash is essential in modeling.
The previous analysis on related components can help us selecting appropriate model.
Based on this analysis, the most relevant data were selected for each binary system (carbon
dioxide–water, methane–water, H2S–water, nitrogen–water, and oxygen–water) and
compared with findings of (Cozma et al. 2013). The results are plotted in Figure 3.1.
To understand the results, the following aspects were considered,
o Data calculated from Figure 3.1a were compared with experimental data of (Lide,
2003);
o The solubility of CH4 in water is calculated using experimental data of (Antonin
Chapoy, Mohammadi, Richon, & Tohidi, 2004) and (A. Chapoy, 2004) and compared
with experimental data of (Mao et al., 2011) and (Stoessell & Byrne, 1982); the
compilation of the last two references is plotted in the same line (Fig. 3.1b).
Considering the results from Fig. 3.1, the following aspects were noted (Cozma et al.,
2014):
o Results from UNIQUAC and NRTL models did not show a good agreement with
the experimental CO2 solubility for higher pressures (above 10 bars);
o NRTL-RK, UNIQ-RK, and ELECNRTL showed a good agreement with
experimental data in all conditions presented.
Based on the finding, ELECNRTL, NRTL and UNIQUAC methods are proper for
simulations pressure up to 10 bars without including the critical region, as stated by Carlson
(1996). Since ELECNRTL demonstrates a better comparability of physical properties for
methane, carbon dioxide and H2S in water this thesis used ELECNRTL property model for
further analysis.

42
Figure 3. 1: Solubility of biogas components in water: (a) CO2, (b) CH4, (c) H2S, (d) N2,
(e) O2 (adapted upon Cozma et al. 2013; reproduced from Environmental Engineering
and Management Journal) (Mao el al. 2011)

43
RESULTS OF SIMULATION
Absorption is a complex process and depends on many factors. Increasing the number of
equilibrium stages favors the absorption rate in water. More CO2 is dissolved and therefore
higher percentage of methane is obtained. The flow diagram has two absorber connected
in series with 2 flashes to recover slipped CH4 and at the end of the system a stripper to
strip out all the dissolved gasses from water so that the water can be recirculated in the
system. WWTP integrated system will not need a stripper as recirculation is unnecessary.
Figure 3. 2: ASPEN PLUS Flow Diagram with two absorbers.
Designing the absorbers in Aspen Plus modeling is sophisticated and precise sizing of
packing materials and column diameter is necessary. Figure 3.3 and 3.4 shows the internal
features of column 1 and 2 used in a pilot scale or for the gas flow of 20 cfm at 45psi.

44
Figure 3. 3: Column Internal for absorber 1.
Figure 3. 4: Column Internal for absorber 2.
Another important consideration is flooding of absorber columns due to unfitting pressure
or flow of gas and water. To avoid flooding, the height and diameter along with flow must
be adjusted. The pilot simulation shows satisfactory hydraulic plots for both absorber
column 1 and 2. Hydraulic plots are shown in figure 3.5 and 3.6.

45
Figure 3. 5: Hydraulic Plot for Absorber Column 1.
Figure 3. 6: Hydraulic Plot for Absorber Column 2.
The properties of the columns for the pilot scale have been summarized in table 3.1. The
water flow in both columns is different as it provides a better methane recovery. As the
absorbers are connected in series in the pilot study, the CO2 concentration is higher in
absorber 1 than in absorber 2. After absorption in column 1 most of the carbon dioxide is
dissolved in water and only a small fraction is left to be absorbed in absorber 2. The
simulation results show that for 150 psi pressure and water to gas ratio of 1 to 4, 91%
methane is recovered in absorber 1 and with the help of second absorber the recovery rate
can be raised to 97.7%.

46
Input
Characters Absorber1 Absorber 2 Cooler Compressor Gas Flow
Water Flow 12 cfm 8 cfm 60F 45 psi 20 cfm
Diameter 12 in 12 in
Stages 2 2
Internal Type Packed Packed
Dimension 35 mm 15 mm
Section
Packed Ht.
6ft 6ft
Table 3. 1: Summary of Simulation Input for Pilot Scale
Result of Simulation for Pilot Scale
Off Gas Off Water
Component CH4 H2O H2S H2O CO2 CH4
Amount 98% 0.6% 0.65% 99.99% ~0% ~0%
Table 3. 2: Pilot Scale simulation data at 60ºF Temperature and 45 psi pressure
2 ABS|45 PSI|GAS 90F|WATER FR: 12 & 8 CFM
WATER
FLOW RATE
(CFM)
Biogas
(cfm)
Water Temp
(F)
Methane
PDRTGAS(%)
Methane Loss
(%)
12 AND 8 20 40 98.8 0.55
12 AND 8 20 60 98 0.55
12 AND 8 20 70 97.3 0.55
12 AND 8 20 80 96.3 0.55
Table 3. 3: Simulation result for Pilot of Biogas water wash at varying temperature

47
Figure 3. 7: Pilot Scale Biogas water wash simulation result at varying temperature
Result of Simulation for Full Scale
2 ABS|45 PSI, F-20 PSI|GAS 90F|Water FR: 150 & 100 cfm
Water Flow
(cfm)
Biogas
(cfm)
Water Temp
(F)
Methane
PDRTGAS(%)
Methane Loss
(%)
150 and 100 250 40 98.8 5.20
150 and 100 250 60 98 5.21
150 and 100 250 70 97.3 5.22
150 and 100 250 80 96.3 5.24
Table 3. 4: Full Scale Biogas simulation result at varying temperature at 45psi
98.8
98
97.3
96.3
96
96.5
97
97.5
98
98.5
99
99.5
0 10 20 30 40 50 60 70 80 90
Met
han
e C
onte
nt
(%)
Water Temp (F)
2 ABS|45 PSI|GAS 90F|Water FR: 12 & 8 cfm

48
Figure 3. 8: Full Scale Biogas simulation result at varying temperature at 45psi
2 ABS|A: 150 PSI, F: 60 PSI|GAS 90F, 60F-COOLER|Water FR: 38 & 25 cfm
Water Flow
(cfm)
Biogas (cfm) Water Temp (F) Methane
PDRTGAS(%)
Methane
Loss (%)
38 and 25 250 40 98.7 2.94
38 and 25 250 60 97.6 2.98
38 and 25 250 70 96.6 3.01
38 and 25 250 80 95.3 3.10
Table 3. 5: Full Scale Biogas simulation result at varying temperature at 150psi
Figure 3. 9: Full Scale Biogas simulation result at varying temperature at 150psi
98.8
98
97.3
96.3
96
96.5
97
97.5
98
98.5
99
99.5
0 10 20 30 40 50 60 70 80 90
Met
han
e C
onte
nt
(%)
Water Temp (F)
2 ABS|45 PSI|GAS 90F|Water FR: 150 & 100 cfm
98.7
97.6
96.6
95.3
95
95.5
96
96.5
97
97.5
98
98.5
99
99.5
0 10 20 30 40 50 60 70 80 90
Met
han
e C
onte
nt
(%)
Water Temp (F)
2 ABS @ 150 PSI| Water Flow Rate: 38 & 25 cfm

49
As shown in Table 3.4 and 3.5, less water is needed to achieve the methane content over
95% under higher temperature. For the pilot project, with 45 psi pressure 20 cfm water can
treat 20 cfm gas flow. The number of absorbers was increased to two in series to provide
satisfactory result. The pressure in the Flash has been reduced to half. Only 20 psi flash
pressure has been applied when the absorber pressure is 45 psi. The 6 ft packed column, 2
stage ceramic absorber was chosen for simulation. There is no flooding issue in the
absorber. As the tables 3.3 and 3.4 show with sufficient water flow, the methane content
can be satisfactory (up to 98.8%) but the absorber has to be designed accordingly. As
previously discussed ELECNRTL model has been used to run the simulation. Temperature
plays a significant role as seen from the graphical representation in figure 3.7, 3.8 and 3.9.
The methane content increased from 95% to 98% because of the change in temperature
from 40ºF to 80ºF (Fig. 3.9). The colder climate in Midwest can facilitate the gas
purification in water wash approach.

50
CALCULATION FOR PHOSPHORUS RECOVERY
MMSD treats 68.2 billion gallons of waste water every year (Don, 2017) or about 180 million
gallons every day. Jones Island treats a larger share of it (about 62-220 MGD depending on
the season.
Based on the data provided by MMSD [Figure 3.10(a)] (from May 2017 to April 2018) the
average influent phosphorus concentration was 3.5 mg/L. But as advised in the study of Britton
(A Britton et al., 2005) the desired P-PO4 concentration is 50-70 mg/L for struvite recovery to
be economically feasible. To obtain such a high phosphorus concentration, a waste activated
sludge gravity thickener is necessary.
3
3
3
3
44 4
4
44
4
3
0
1
1
2
2
3
3
4
4
5
Ph
osp
horu
s (m
g/L
)
Month (May 2017 - April 2018)
Influent Phosphorus
0.02.04.06.08.0
10.012.014.016.018.020.0
Am
mo
nia
(m
g/L
)
Month (May 2017 - April 2018)
Ammonia Influent (mg/L)
a
b

51
Figure 3. 10: MMSD’s Jones Island waste water influent data for a. phosphorus b.
Ammonia c. BOD & COD and d. Magnesium
BOD and COD have significant impact in enhanced biological phosphorus removal but
it’s magnesium that plays a central role in recovering phosphorus as struvite. As figure
3.10 (c) and (d) shows BOD of 300 mg/L and magnesium of 25 mg/L is present in influent
of Jones Island WWTP. A much higher magnesium concentration is necessary to recover
struvite at high rate. A theoretical calculation at the end of this chapter will discuss required
magnesium addition.
0
100
200
300
400
500
600
700
mg/L
Month (May 2017 - April 2018)
BOD & COD Influent
BOD-5
COD
0
5
10
15
20
25
30
35
40
Mg (
mg/L
)
Month (May 2017 - April 2018)
Influent Magnesium
c
d
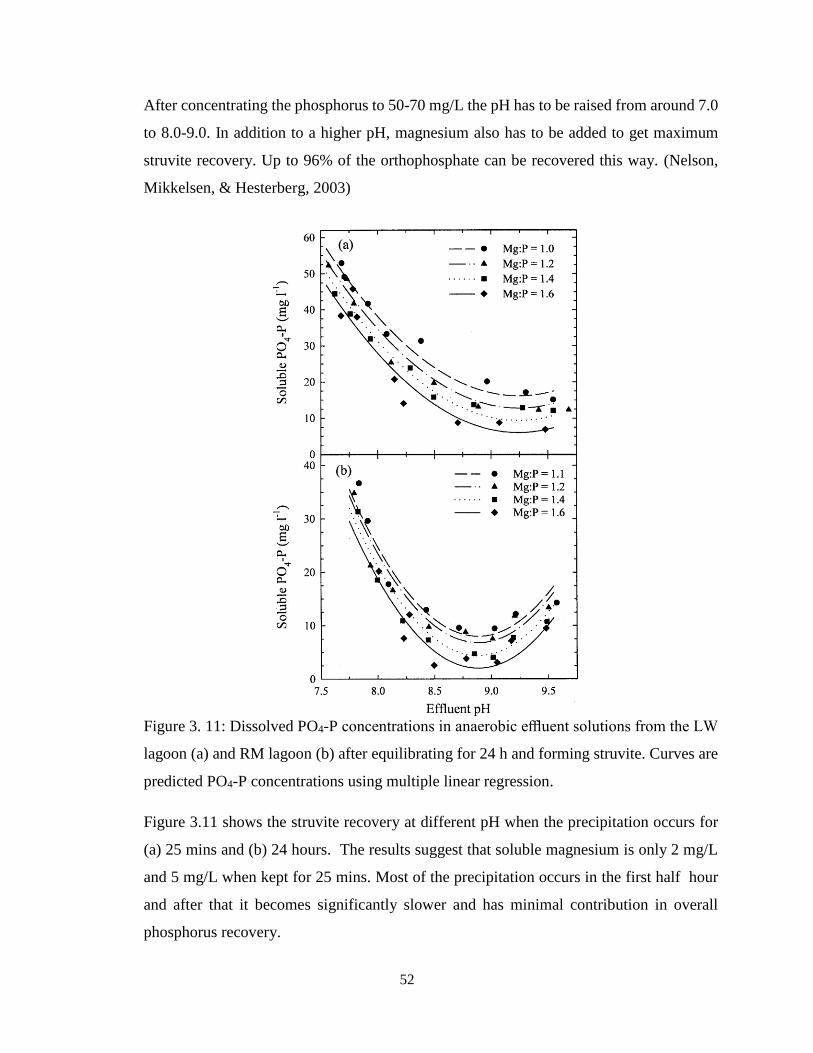
52
After concentrating the phosphorus to 50-70 mg/L the pH has to be raised from around 7.0
to 8.0-9.0. In addition to a higher pH, magnesium also has to be added to get maximum
struvite recovery. Up to 96% of the orthophosphate can be recovered this way. (Nelson,
Mikkelsen, & Hesterberg, 2003)
Figure 3. 11: Dissolved PO4-P concentrations in anaerobic effluent solutions from the LW
lagoon (a) and RM lagoon (b) after equilibrating for 24 h and forming struvite. Curves are
predicted PO4-P concentrations using multiple linear regression.
Figure 3.11 shows the struvite recovery at different pH when the precipitation occurs for
(a) 25 mins and (b) 24 hours. The results suggest that soluble magnesium is only 2 mg/L
and 5 mg/L when kept for 25 mins. Most of the precipitation occurs in the first half hour
and after that it becomes significantly slower and has minimal contribution in overall
phosphorus recovery.
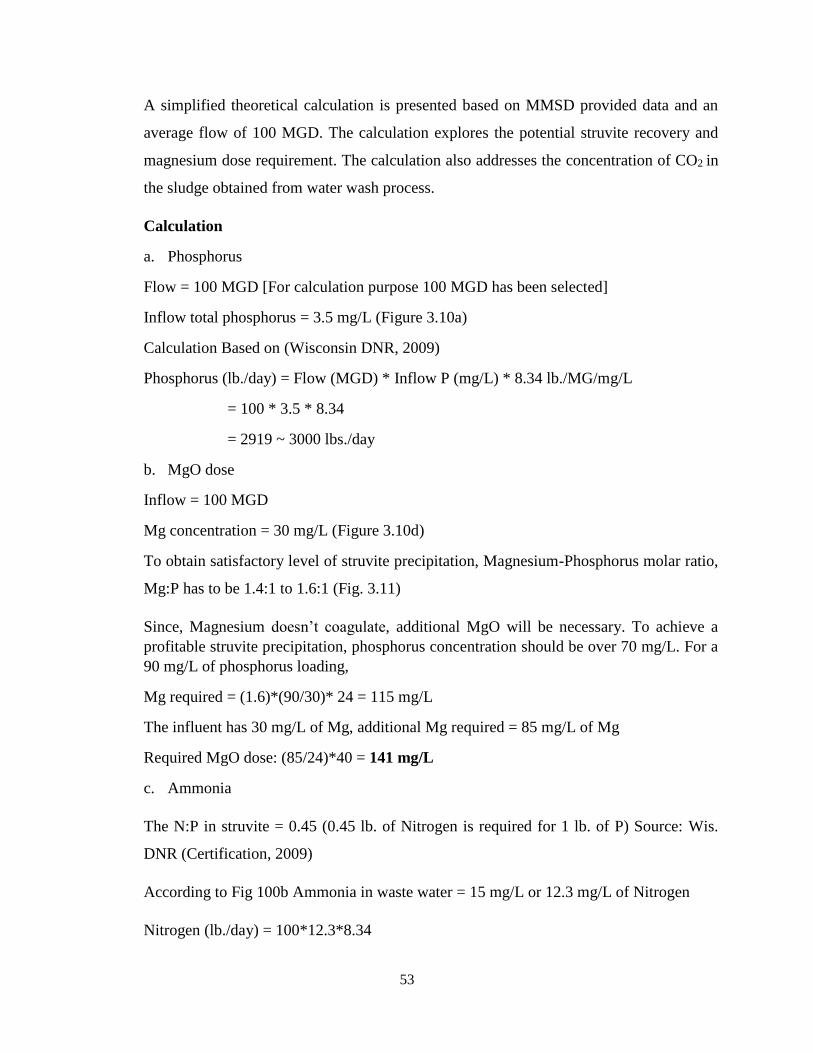
53
A simplified theoretical calculation is presented based on MMSD provided data and an
average flow of 100 MGD. The calculation explores the potential struvite recovery and
magnesium dose requirement. The calculation also addresses the concentration of CO2 in
the sludge obtained from water wash process.
Calculation
a. Phosphorus
Flow = 100 MGD [For calculation purpose 100 MGD has been selected]
Inflow total phosphorus = 3.5 mg/L (Figure 3.10a)
Calculation Based on (Wisconsin DNR, 2009)
Phosphorus (lb./day) = Flow (MGD) * Inflow P (mg/L) * 8.34 lb./MG/mg/L
= 100 * 3.5 * 8.34
= 2919 ~ 3000 lbs./day
b. MgO dose
Inflow = 100 MGD
Mg concentration = 30 mg/L (Figure 3.10d)
To obtain satisfactory level of struvite precipitation, Magnesium-Phosphorus molar ratio,
Mg:P has to be 1.4:1 to 1.6:1 (Fig. 3.11)
Since, Magnesium doesn’t coagulate, additional MgO will be necessary. To achieve a
profitable struvite precipitation, phosphorus concentration should be over 70 mg/L. For a
90 mg/L of phosphorus loading,
Mg required = (1.6)*(90/30)* 24 = 115 mg/L
The influent has 30 mg/L of Mg, additional Mg required = 85 mg/L of Mg
Required MgO dose: (85/24)*40 = 141 mg/L
c. Ammonia
The N:P in struvite = 0.45 (0.45 lb. of Nitrogen is required for 1 lb. of P) Source: Wis.
DNR (Certification, 2009)
According to Fig 100b Ammonia in waste water = 15 mg/L or 12.3 mg/L of Nitrogen
Nitrogen (lb./day) = 100*12.3*8.34

54
= 10250 lb./day which is 7.8 times of the required nitrogen.
d. CO2 from biogas water wash
At a temperature of 40ºC and pressure of 87 psi for a full-scale biogas purification unit
If water: gas = 1:4 then methane content can be achieved as high as 96.2% when 2 absorbers
are added with two flashes. Flash Pressure is 35 psi.
Figure 3. 12: Biogas Water wash at 87 psi with varying temperature [Aspen Plus
Modeling]
For each full-scale plant
Based on Figure 3.8 water needed,
= 63 cfm water or 2.5 MGD
Based on this biogas rate, the daily CO2 absorption = 8.3 tons/day.
And this would correspond to a [CO2] level = 2,942 mg/L
MMSD has 8 full scale gas delivery system which would provide 66.4 tons of CO2/day
And after mixing with 100 MGD water the [CO2] level = 588 mg/L
This dissolved CO2 would lower the pH and increase solubility of phosphorus.
96.2
92.4
89.9
87.2
86
88
90
92
94
96
98
0 10 20 30 40 50 60 70 80 90
Met
han
e C
onte
nt
(%)
Water Temp (F)
2 ABS @ 87 PSI| Water Flow Rate: 38 & 25 cfm

55
But, to recover this phosphorus excess CO2 has to be removed. Aeration and mixing can
be a good solution for bringing the pH to 7.0 by stripping out CO2. NaOH has to be added
to raise pH to 8.7.
e. NaOH
After the pH has been raised to neutral by aeration NaOH is needed to raise pH to
facilitate struvite precipitation. Based on the data provided by MMSD, the average of
total phosphorus content in dry sludge is 2.1%.
Figure 3. 13: Total Phosphorus in Sludge as % of Dry Weight [Source: MMSD]
Based on the Data provided by MMSD the solid content in the waste activated sludge
(WAS) is ~1%. To achieve higher solid content thickening is necessary. The Total Solid
content is 3.86% in WAS after thickening and 2% (simplified for 2.1%) of phosphorus is
present in dry sludge.
Phosphorus concentration in secondary clarifier,
= 3000 lbs. * 0.4536 /[3000 lbs. * 0.4536 / (0.02)/0.0386]
= 772 mg/L
And the WAS volume is 1762694L or 466,000 gallons.
0.0
0.5
1.0
1.5
2.0
2.5
To
tal
Pho
spho
rus
(% o
f D
ry w
t.)
Month
Total Phosphorus in Solid

56
According to Dhakal (2008), pH over 8.7 doesn’t have an effect on phosphorus
precipitation. The required NaOH to raise pH of the sludge from 7.0 to 8.6 [based on
Figure 3.7] is
[H3O+] at pH 7.0 = 10-7.0 * 1762694 = 0.1763 mol
[H3O+] at pH 8.6 = 10-8.6 * 1762694 = 0.0044 mol
If 1M NaOH solution is used the volume of required NaOH,
= (0.1763 -0.0044)* 1000 = 172 ml
The mass of the NaOH,
C = 1000𝑤
𝑀∗𝑉
w = 6.88 g where, C = molar concentration = 1M
M = molar mass of NaOH = 40 g
V = volume in ml = 172 ml
w = mass of NaOH in g.
Summary of simulation and calculation:
Biogas Waterwash
With 2 absorbers and 2 flashes at 40ºC with water : gas = 1:4
@ 150 psi absorber pressure methane content = 98.7%
@ 87 psi absorber pressure methane content = 96.2%
@ 45 psi absorber pressure methane content = 98.8% [when water: gas = 1:1]
Phosphorus Recovery
Theorical daily phosphorus recovery = 3000 lbs. or 23770 lbs. of Struvite
Carbon dioxide in total volume = 588 mg/L
Phosphorus in sludge = 772 mg/L
NaOH needed for sludge to raise pH at 8.6 = 6.88 g
Magnesium dose (MgO) = 141 mg/L. No additional Ammonia is necessary.
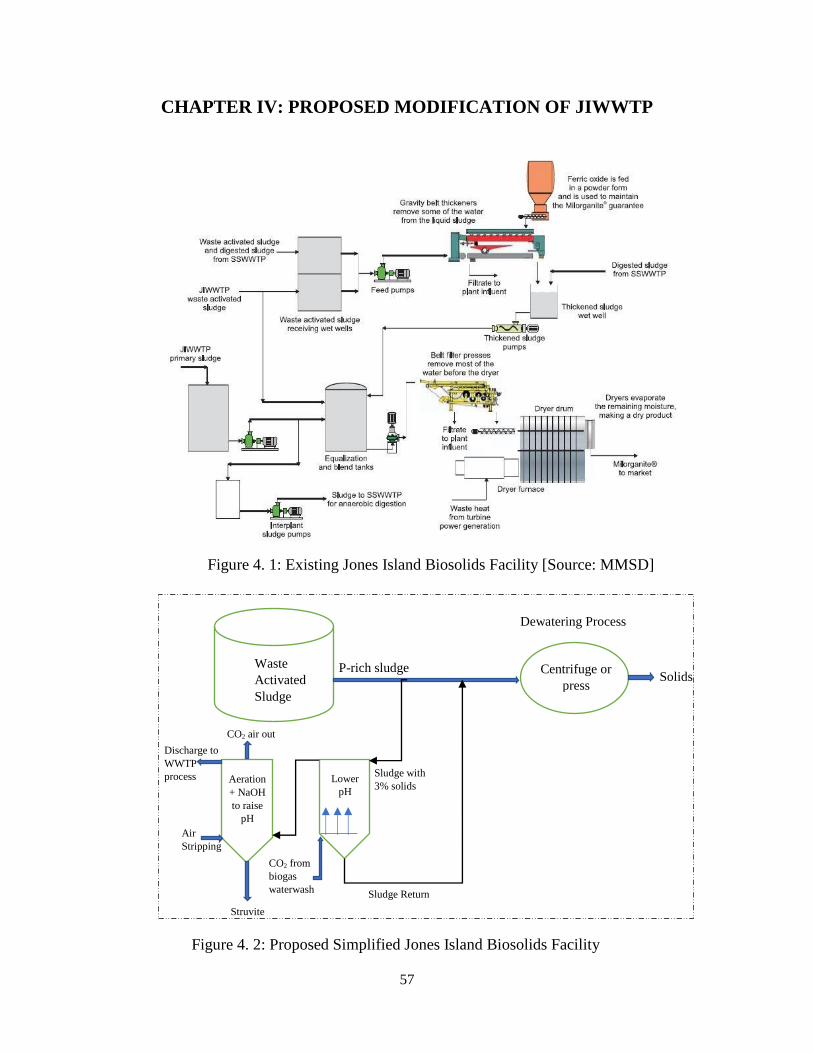
57
CHAPTER IV: PROPOSED MODIFICATION OF JIWWTP
Figure 4. 1: Existing Jones Island Biosolids Facility [Source: MMSD]
Figure 4. 2: Proposed Simplified Jones Island Biosolids Facility
CO2 from
biogas
waterwash
Lower
pH
Aeration
+ NaOH
to raise
pH
Air
Stripping
Struvite
Centrifuge or
press
Waste
Activated
Sludge
Solids
Dewatering Process
P-rich sludge
CO2 air out
Sludge Return
Sludge with
3% solids
Discharge to
WWTP
process
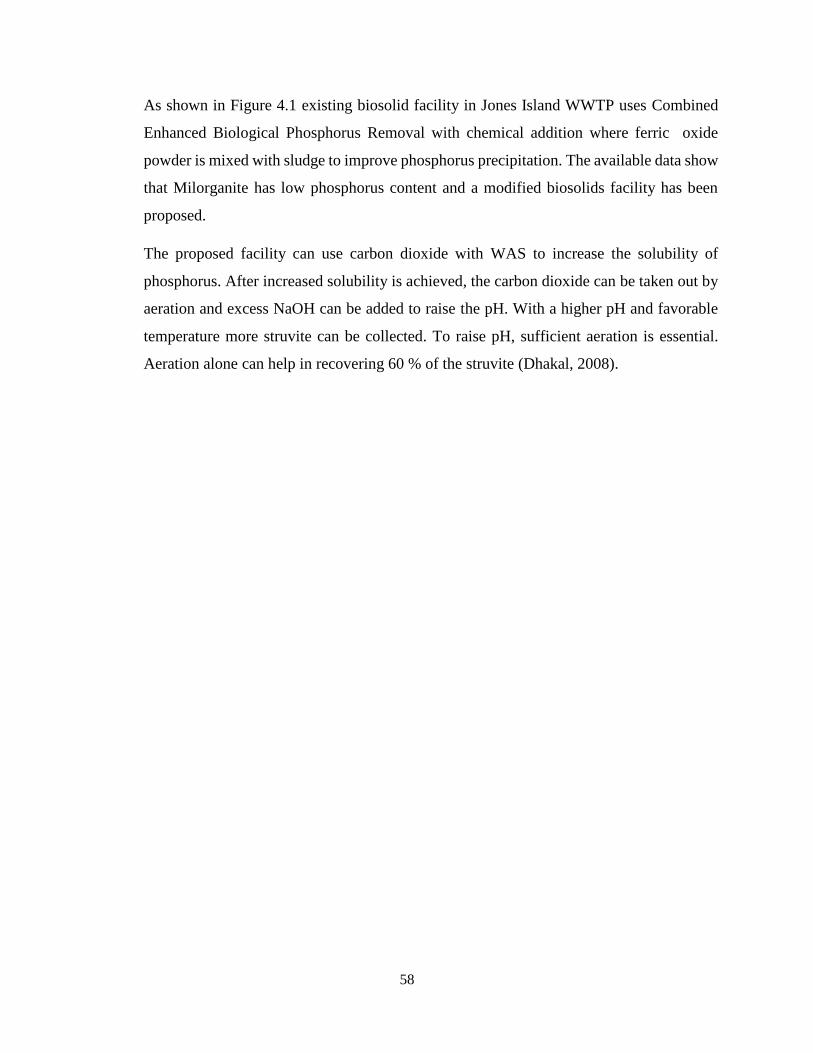
58
As shown in Figure 4.1 existing biosolid facility in Jones Island WWTP uses Combined
Enhanced Biological Phosphorus Removal with chemical addition where ferric oxide
powder is mixed with sludge to improve phosphorus precipitation. The available data show
that Milorganite has low phosphorus content and a modified biosolids facility has been
proposed.
The proposed facility can use carbon dioxide with WAS to increase the solubility of
phosphorus. After increased solubility is achieved, the carbon dioxide can be taken out by
aeration and excess NaOH can be added to raise the pH. With a higher pH and favorable
temperature more struvite can be collected. To raise pH, sufficient aeration is essential.
Aeration alone can help in recovering 60 % of the struvite (Dhakal, 2008).

59
CHAPER V: RESULTS AND DISCUSSION
Overall, this study shows that biogas upgrading is a promising technology with limited
economic information and technical information. The production cost of biogas varies from
5% - 25% of the cost of product gas. The selection of upgrading technology depends on
the highest purity that can be achieved. The factors related to economics are the investment,
operating and maintenance costs. There are also technical factors, which influence the
placement of biogas upgrading plants such as the demand for heat and power generation,
an existing facility that produces large amounts of heat that could be utilized by the biogas
process. MMSD has been using its biogas for heating purposes and the upgraded biogas
can provide better heating with compact methane. Water wash is considered because of the
location and availability of the biogas upgrading components. From an economic
viewpoint large scale biogas upgrading plants are the most profitable and with 2000 cfm
biogas MMSD can certainly be considered as a large-scale plant. Additionally, an upgraded
methane of over 98% as the simulation suggests would certainly be a big incentive for a
plant like Jones Island and based on previous works of Cozma et al. (2014), 96.6% methane
can be obtained from water wash process which is a positive benchmark for the pending
pilot.
Even though the goal was to utilize the system for large-scale plant, smaller plants were
also considered in the study. The pilot simulation offers a better understanding of the
process. For small-scale plants the lowest amount of gas that can be produced with the
upgrading plant being economically viable is as low as 20 cfm. Small-scale plants are still
popular and commonplace in Europe.
Considering the selected biogas upgrading technology’s cost, the larger the plant size the
cheaper the cost of production for the upgraded biomethane. Regardless of the process
being used, the plant must be closed for maintenance once a year. In the United States
biogas upgrading technology is not widely used. The use of carbon tax and better
technological advancement can accelerate the process. Carbon taxes are in place in 14
countries in Europe to curb emissions from power plants and large industrial installations
(Andersen, 2016). The carbon tax is not meant to be a punishment for industries rather
obtains an economical leverage on industries to encourage a better and advanced emission
practice. The use of tax and incentives are not unified across Europe and this should be

60
changed by member states as it is in the states’ interest to increase the use of biomass for
the production of vehicle fuel, heat and power.
Phosphorus recovery is important due to the discharge limit of 1 mg/L set by the DNR. But
at present Jones Island using the technology from 1930s and Milorganite only has 2.88%
phosphorus. Struvite is a better product as it has ammonia and magnesium as well,
ingredients important for plant growth. Since wastewater treatment plants already have
both ammonia and Mg in influent further addition is not required. But, the pH has to be
raised and this work tried to establish a general scenario for those requirements for Jones
Island WWTP.
Other than pH temperature is another factor related to struvite recovery and as described
by Ohlinger & Mahmood (2003) a 10ºC difference from 15 ºC to 25 ºC can increase the
struvite collection by 25%. The effect of temperature has not been considered in this study
because temperature in Wisconsin varies greatly and needs in depth analysis. The other
important factor is, the recovery efficiency is not 100%. With a pH of 8.6 and preferable
temperature usually 80-85% of phosphorus can be recovered which is satisfactory for
environmental regulation set by DNR. The goal of this study was to integrate the gas
purification process and phosphorus recovery process. The results are positive and with
further analysis such an approach can be viable for Jones Island and other WWTPs in the
Midwest.
In the summer of 2018 a pilot project has been approved and funded by MMSD to see if
biogas water wash can be viable for Jones Island. The success of the pilot can help MMSD
to upgraded gas supply and pave the way to test the phosphorus recovery technology.

61
REFERENCES
Adresen, J. A., Hilberg, S. D., & Kunkel, K. E. (2014). Historical climate and climate trends in
the Midwestern United States. Climate Change in the Midwest: A Synthesis Report for the
National Climate Assessment, (March), 8–36.
Allen, M. R., Braithwaite, A., & Hills, C. C. (1997). Trace Organic Compounds in Landfill Gas
at Seven U.K. Waste Disposal Sites. Environmental Science & Technology.
https://doi.org/10.1021/es9605634
Andersen, M. S. (2016). An Introductory Note on Carbon Taxation in Europe A Vermont
Briefing, 1–6.
Appels, L., Baeyens, J., Degrève, J., & Dewil, R. (2008). Principles and potential of the
anaerobic digestion of waste-activated sludge. Progress in Energy and Combustion Science.
https://doi.org/10.1016/j.pecs.2008.06.002
Arachchige, U. S. P. R., & Melaaen, M. C. (2012). Selection of Packing Material for Gas
Absorption. European Journal of Scientific Research, 87(1), 1450–216. Retrieved from
http://www.europeanjournalofscientificresearch.com
Aspen Tech. (1999). Modelling Processes with Eletrolytes. Aspen. Retrieved from
https://chemengr.ucsb.edu/~ceweb/courses/che184b/aspenplus/GettingStartedElectrolytes.p
%5Cn%5Cndf
Bauer, F., Hulteberg, C., Persson, T., & Tamm, D. (2013). Biogas upgrading – Review of
commercial technologies. Swedish Gas Technology Centre, SGC, 82. https://doi.org/SGC
Rapport 2013:270
Beil, M., & Beyrich, W. (2013). Biogas upgrading to biomethane. In The Biogas Handbook:
Science, Production and Applications. https://doi.org/10.1533/9780857097415.3.342
Biosling AB. (2012). A new plant system for biogas upgrading on a small scale , farm size level.
Jukkasjärvi, Sweden. Retrieved from
http://biosling.se/en/files/2012/11/productsheet_En.pdf

62
Bortoluzzi, G., Gatti, M., Sogni, A., & Consonni, S. (2014). Biomethane production from
agricultural resources in the Italian scenario: Techno-Economic analysis of water wash.
Chemical Engineering Transactions, 37, 259–264. https://doi.org/10.3303/CET1437044
Bradley, M. J. (n.d.). Natural Gas as a Transportation Fuel : Best Practices for Achieving
Optimal Emissions Reductions.
Britton, A., Koch, F. A., Mavinic, D. S., Adnan, A., Oldham, W. K., & Udala, B. (2005). Pilot-
scale struvite recovery from anaerobic digester supernatant at an enhanced biological
phosphorus removal wastewater treatment plant. Journal of Environmental Engineering and
Science, 4(4), 265–277. https://doi.org/10.1139/s04-059
Britton, A., Sacluti, F., Oldham, W. K., Mohammed, A., Mavinic, D. S., & Koch, F. A. (2007).
Value from waste: struvite recovery at the city of Edmontons Gold Bar WWTP. Proc. IWA
Specialist Conference: Moving Forward - Wastewater Biosolids Sustainability., 575–581.
Carlson, E. C. (1996). Don’t gamble with physical properties for simulations. Chemical
Engineering Progress.
Carroll, J. J., & Mather, A. E. (1989). The solubility of hydrogen sulphide in water from 0 to
90°C and pressures to 1 MPa. Geochimica et Cosmochimica Acta.
https://doi.org/10.1016/0016-7037(89)90053-7
Certification, W. O. (2009). Wisconsin Department of Natural Resources Wastewater Operator
Certification Advanced Phosphorus Removal Study Guide, (January).
Chapoy, A. (2004). Phase behaviour in water/hydrocarbon mixtures involved in gas production
systems. Ecole des Mines de Paris.
Chapoy, A., Mohammadi, A. H., Richon, D., & Tohidi, B. (2004). Gas solubility measurement
and modeling for methane-water and methane-ethane-n-butane-water systems at low
temperature conditions. Fluid Phase Equilibria. https://doi.org/10.1016/j.fluid.2004.02.010
Coker, D. T., Freeman, B. D., & Fleming, G. K. (1998). Modeling multicomponent gas
separation using hollow-fiber membrane contactors. AIChE Journal, 44(6), 1289–1302.
https://doi.org/10.1002/aic.690440607

63
Cozma, P., Wukovits, W., Mămăligă, I., Friedl, A., & Gavrilescu, M. (2014). Modeling and
simulation of high pressure water scrubbing technology applied for biogas upgrading. Clean
Technologies and Environmental Policy, 17(2). https://doi.org/10.1007/s10098-014-0787-7
Cwm Harry Land Trust. (2013). Feasibility study: Conversion of Struvite via gas infusion
acidification. Retrieved from http://www.wrap.org.uk/
Czyperek, M., Zapp, P., Bouwmeester, H. J. M., Modigell, M., Ebert, K., Voigt, I., … Stöver, D.
(2010). Gas separation membranes for zero-emission fossil power plants: MEM-BRAIN.
Journal of Membrane Science, 359(1–2), 149–159.
https://doi.org/10.1016/j.memsci.2010.04.012
Dean, J. A. (1990). Lange’s handbook of chemistry. Materials and Manufacturing Processes.
https://doi.org/10.1080/10426919008953291
Department of Natural Resources. (2013). Chapter NR 217: effluent standards and limitations for
phosphorus. Effluent Standards and Limitations, (217), 8 pp. Retrieved from
http://water.epa.gov/scitech/swguidance/standards/wqslibrary/upload/wiwqs_nr217.pdf%5C
nhttp://nlquery.epa.gov/epasearch/epasearch?querytext=Chapter+NR+217&typeofsearch=ar
ea&cluster=no&areaname=WQS+Repository&filter=sample4filt.hts&fld=%7Cwater.epa.g
ov/sci
Dhakal, S. (2008). A laboratory study of struvite precipitation for phosphorus removal from
concentrated animal feeding operation wastewater, 86.
Don, B. (2017). MMSD treated 99.8% of wastewater in 2016. Milwaukee Journal Sentinel.
Retrieved from https://www.jsonline.com/story/news/local/milwaukee/2017/01/05/mmsd-
treated-998-wastewater-2016/96197894/
Doyle, J. D., Oldring, K., Churchley, J., Price, C., & Parsons, S. A. (2003). Chemical Control of
Struvite Precipitation. Journal of Environmental Engineering.
https://doi.org/10.1061/(ASCE)0733-9372(2003)129:5(419)
Dubois, L., & Thomas, D. (2012). Screening of Aqueous Amine-Based Solvents for
Postcombustion CO2Capture by Chemical Absorption. Chemical Engineering and
Technology, 35(3), 513–524. https://doi.org/10.1002/ceat.201100523

64
DuPart, M. S., Bacon, T. R., & Edwards, D. J. (1993). Understanding corrosion in alkanolamine
gas treating plants. Hydrocarbon Processing, 72(5), 89–94.
Edwards, T. J., Maurer, G., Newman, J., & Prausnitz, J. M. (1978). Vapor‐liquid equilibria in
multicomponent aqueous solutions of volatile weak electrolytes. AIChE Journal.
https://doi.org/10.1002/aic.690240605
Eide-Haugmo, I., Lepaumier, H., Einbu, A., Vernstad, K., Da Silva, E. F., & Svendsen, H. F.
(2011). Chemical stability and biodegradability of new solvents for CO2 Capture. Energy
Procedia, 4, 1631–1636. https://doi.org/10.1016/j.egypro.2011.02.034
EPA. (1999). Method TO-13A: Determination of Polycyclic Aromatic Hydrocarbons ( PAHs ) in
Ambient Air Using Gas Chromatography / Mass Spectrom. Environmental Protection
Agency, (April), 2–4.
EPA. (2015). The 2014 Annual Effluent Guidelines Review Report. Washington, DC.
https://doi.org/EPA-821-R-16-002
Evans, T. D., & Lane, P. (2006). Recovering ammonium and struvite fertilisers from digested
sludge dewatering liquors. IWA Specialist Conference: Moving Forward–Wastewater
Biosolids Sustainability, (June), 713–722.
Gaffney, J. S., & Marley, N. A. (2009). The impacts of combustion emissions on air quality and
climate - From coal to biofuels and beyond. Atmospheric Environment.
https://doi.org/10.1016/j.atmosenv.2008.09.016
Gamba, S., & Pellegrini, L. A. (2013). Biogas upgrading: Analysis and comparison between
water and chemical scrubbings. Chemical Engineering Transactions, 32, 1273–1278.
https://doi.org/10.3303/CET1332213
Götz, M., Köppel, W., Reimert, R., & Graf, F. (2012). Optimierungspotenzial von Wäschen zur
Biogasaufbereitung. Chemie-Ingenieur-Technik. https://doi.org/10.1002/cite.201100129
Harasek, M. (2006). Biogas upgrading with membrane separation process. Retrieved June 10,
2018, from http://membran.at/Biogasaufbereitung_mit_Membrantrennverfahren
65
Hine, J., & Mookerjee, P. K. (1975). The Intrinsic Hydrophilic Character of Organic
Compounds. Correlations in Terms of Structural Contributions. Journal of Organic
Chemistry. https://doi.org/10.1021/jo00891a006
Hudde, J. (2010). Experience with the Application of Water Scrubbing Biogas Upgrading
Technology: On the Road with CNG and Biomethane European Best Practice Examples:
The Madegascar Project. In The Madegascar Project Final Conference. Prague, Czech
Republic.
Hunter, P., & Oyama, S. T. (2000). Control of Volatile Organic Compound
Emissions:Conventional and Emerging Technologies. New York: John Wiley & Sons.
IPCC. (2008). 2006 IPCC Guidelines for National Greenhouse Inventories – A primer, Prepared
by the National Greenhouse Gas Inventories Programme,. Intergovernmental Panel on
Climate Change National Greenhouse Gas Inventories Programme, 20.
IPNI. (2018). Nutrient Source Specifics. Norcross, GA. Retrieved from
http://www.ipni.net/specifics
Jacob, D. J. (1986). Chemistry of OH in remote clouds and its role in the production of formic
acid and peroxymonosulfate. Journal of Geophysical Research.
https://doi.org/10.1029/JD091iD09p09807
Jaffrin, A., Bentounes, N., Joan, A. M., & Makhlouf, S. (2003). Landfill biogas for heating
greenhouses and providing carbon dioxide supplement for plant growth. Biosystems
Engineering. https://doi.org/10.1016/S1537-5110(03)00110-7
Jönsson, O., Polman, E., Jensen, J. K., Eklund, R., Schyl, H., & Ivarsson, S. (2003). Sustainable
gas enters the european gas distribution system. Danish Gas Technology Center, 1–9.
Kavanaugh, M. C., & Trussell, R. R. (1980). Design of aeration towers to strip volatile
contaminants from drinking water. Journal / American Water Works Association.
Kohl, A., & Nielsen, R. (1997). Gas Purification. Houston, TX: Gulf Publishing Company.

66
Lallemand, F., Perdu, G., Matetto, C., Weiss, C., Magne-Drisch, J., & Lucquin, A. C. (2012).
Solutions for the treatment of highly sour gases: Process technologies for the cost-effective
treatment of natural gas with high and ultra-high acid gas content. Retrieved June 1, 2018,
from
http://www.digitalrefining.com/article/1000356,Solutions_for_the_treatment_of_highly___
_sour_gases.html#.WxzhaUgvxPY
Latimer, R., Hanson, T., Khunjar, W., & Pitt, P. (2012). Nutrient Recovery as a Green
Technology for Managing Phosphorus Removal. Texas WET, (May/June), 17–21.
Lekvam, K., & Bishnoi, P. R. (1997). Dissolution of methane in water at low temperatures and
intermediate pressures. Fluid Phase Equilibria. https://doi.org/10.1016/S0378-
3812(96)03229-3
Lelieveld, J., & Crutzen, P. J. (1991). The role of clouds in tropospheric photochemistry. Journal
of Atmospheric Chemistry. https://doi.org/10.1007/BF00048075
Lepaumier, H., Picq, D., & Carrette, P. L. (2009). Degradation study of new solvents for CO2
capture in post-combustion. Energy Procedia, 1(1), 893–900.
https://doi.org/10.1016/j.egypro.2009.01.119
Li, H., Yan, J., & Campana, P. E. (2012). Feasibility of integrating solar energy into a power
plant with amine-based chemical absorption for CO2capture. International Journal of
Greenhouse Gas Control, 9(July), 272–280. https://doi.org/10.1016/j.ijggc.2012.04.005
Lide, D. R. (1998). CRC Handbook of Chemistry and Physics (79th ed.). CRC Press, Inc.
Lide, D. R. (2003). CRC Handbook of Chemistry and Physics, 84th Edition, 2003-2004.
Handbook of Chemistry and Physics. https://doi.org/10.1136/oem.53.7.504
Lomans, B. P., Pol, A., & Op den Camp, H. J. (2002). Microbial cycling of volatile organic
sulfur compounds in anoxic environments. Water Science and Technology.
Maasakkers, J. D., Jacob, D. J., Sulprizio, M. P., Turner, A. J., Weitz, M., Wirth, T., … Fischer,
M. L. (2016). Gridded National Inventory of U.S. Methane Emissions. Environmental
Science and Technology, 50(23), 13123–13133. https://doi.org/10.1021/acs.est.6b02878

67
Mackay, D., & Shiu, W. Y. (1981). A critical review of Henry’s law constants for chemicals of
environmental interest. Journal of Physical and Chemical Reference Data.
https://doi.org/10.1063/1.555654
Mao, S., Duan, Z., Zhang, D., Shi, L., Chen, Y., & Li, J. (2011). Thermodynamic modeling of
binary CH4-H2O fluid inclusions. Geochimica et Cosmochimica Acta.
https://doi.org/10.1016/j.gca.2011.07.021
Marzouk, S. A. M., Al-Marzouqi, M. H., El-Naas, M. H., Abdullatif, N., & Ismail, Z. M. (2010).
Removal of carbon dioxide from pressurized CO2-CH4 gas mixture using hollow fiber
membrane contactors. Journal of Membrane Science. https://doi.org/DOI:
10.1016/j.memsci.2010.01.023
Mazari, S. A., Si Ali, B., Jan, B. M., Saeed, I. M., & Nizamuddin, S. (2015). An overview of
solvent management and emissions of amine-based CO2capture technology. International
Journal of Greenhouse Gas Control. https://doi.org/10.1016/j.ijggc.2014.12.017
Merkel, T. C., Lin, H., Wei, X., & Baker, R. (2010). Power plant post-combustion carbon
dioxide capture: An opportunity for membranes. Journal of Membrane Science, 359(1–2),
126–139. https://doi.org/10.1016/j.memsci.2009.10.041
Millero, F. J., Hubinger, S., Fernandez, M., & Garnett, S. (1987). Oxidation of H2S in Seawater
as a Function of Temperature, pH, and Ionic Strength. Environmental Science and
Technology. https://doi.org/10.1021/es00159a003
Münch, E. v., Benesovsky-Scott, A., Josey, J., & Barr, K. (2001). Making a Business from
Struvite Crystallisation from Waste Water Treatment: Turning Waste into Gold. Brisbane,
Australia.
Murray, B. C., Galik, C. S., & Vegh, T. (2014). Biogas in the United States: An Assessment of
Market Potential in a Carbon-Constrained Future., (February), 1–59. https://doi.org/NI R
14-02
Nelson, N. O., Mikkelsen, R. L., & Hesterberg, D. L. (2003). Struvite precipitation in anaerobic
swine lagoon liquid: Effect of pH and Mg:P ratio and determination of rate constant.
Bioresource Technology, 89(3), 229–236. https://doi.org/10.1016/S0960-8524(03)00076-2

68
NETL. (2013). Cost and Performance Baseline for Fossil Energy Plants Volume 1: Bituminous
Coal and Natural Gas to Electricity. National Energy Technology Laboratory.
https://doi.org/DOE/NETL-2010/1397
Ohlinger, K., & Mahmood, R. (2003). Struvite Scale Potential Determination Using a Computer
Model. World Water & Environmental Resources Congress 2003, (916), 1–9.
https://doi.org/10.1061/40685(2003)267
Ohlinger, K. N. (1999). Struvite controls in anaerobic digestion and postdigestion wastewater
treatment processes. University of California, Davis, Calif.
ÖKOBIT GmbH. (2014). The Biogas Upgrading Processes. Retrieved May 15, 2018, from
https://www.oekobit-biogas.com/
Persson, M. (2003). Evaluation of Upgrading Techniques for Biogas. Environmental
Engineering. https://doi.org/SGC142
Persson, M., Jonsson, O., & Wellinger, A. (2007). Biogas Upgrading To Vehicle Fuel Standards
and Grid Injection. IEA Bioenergy, 1–32.
Petersson, A., & Wellinger, A. (2009). Biogas upgrading technologies–developments and
innovations. IEA Bioenergy. https://doi.org/10.1016/j.wasman.2011.09.003
Pierantozzi, R. (2003). Carbon Dioxide. In Kirk-Othmer Encyclopedia of Chemical Technology.
John Wiley & Sons, New York.
Rasi, S. (2009). Biogas Composition and Upgrading to Biomethane Saija Rasi Biogas
Composition and Upgrading to Biomethane. https://doi.org/978-951-39-3607-5
Rehling, C. J., & Truog, E. (1939). Activated sludge--Milorganite. Industrial & Engineering
Chemistry Analytical Edition, 11(5), 281–283. https://doi.org/10.1021/ac50133a017
Rhoades, George D. Golueke, R. J. (1993). US5390499A. United States.
Ryckebosch, E., Drouillon, M., & Vervaeren, H. (2011). Techniques for transformation of biogas
to biomethane. Biomass and Bioenergy. https://doi.org/10.1016/j.biombioe.2011.02.033
Sander, R. (2011). Carbon dioxide: Henry’s Law data. Retrieved June 5, 2018, from
https://webbook.nist.gov/cgi/cbook.cgi?ID=C124389&Mask=10#Solubility

69
Scheutz, C., Mosbaek, H., & Kjeldsen, P. (2004). Attenuation of methane and volatile organic
compounds in landfill soil covers. Journal of Environmental Quality.
https://doi.org/10.2134/jeq2004.0061
SEPA. (2004). Guidance on gas treatment technologies for landfill gas engines Lfd Statement of
Use. Bristol, UK. Retrieved from https://www.sepa.org.uk/media/28989/ep165-part-1-
guidance-on-gas-treatment-technologies-for-landfill-gas-engines.pdf
Severn Wye Energy Agency. (2013). Introduction to the Production of A Guide for England and
Wales, 46.
Shin, H. C., Park, J. W., Park, K., & Song, H. C. (2002). Removal characteristics of trace
compounds of landfill gas by activated carbon adsorption. Environmental Pollution.
https://doi.org/10.1016/S0269-7491(01)00331-1
Singh, P. (1979). Amine Based Solvent for CO 2 Absorption From Molecular Structure to
Process. https://doi.org/10.3990/1.9789036532006
Sjöstrand, F., & Yazdi, R. (2009). Absorption of CO 2 Diploma work.
Sohrabi, M. R., Marjani, A., Moradi, S., Davallo, M., & Shirazian, S. (2011). Mathematical
modeling and numerical simulation of CO2 transport through hollow-fiber membranes.
Applied Mathematical Modelling, 35(1), 174–188.
https://doi.org/10.1016/j.apm.2010.05.016
Starr, K., Gabarrell, X., Villalba, G., Talens, L., & Lombardi, L. (2012). Life cycle assessment of
biogas upgrading technologies. Waste Management (New York, N.Y.).
https://doi.org/10.1016/j.wasman.2011.12.016
Stoddart, J., Zhu, M., Staines, J., E., R., & Lewicki, R. (1999). Experience with Halogenated
Hydrocarbons Removal from Landfill Gas. In Seventh International Waste Management
and Landfill Symposium (p. Volume II: 489-498). Cagliari, Sardinia, Italy.
Stoessell, R. K., & Byrne, P. A. (1982). Salting-out of methane in single-salt solutions at 25°C
and below 800 psia. Geochimica et Cosmochimica Acta. https://doi.org/10.1016/0016-
7037(82)90268-X

70
Strigle, R. F. (1994). Packed tower design and applications: random and structured packings
(2nd ed.). Houston, TX: Gulf Pub. Co.
Suda, H., & Haraya, K. (1997). Gas Permeation through Micropores of Carbon Molecular Sieve
Membranes Derived from Kapton Polyimide. The Journal of Physical Chemistry B,
101(20), 3988–3994. https://doi.org/10.1021/jp963997u
Torkkeli, A. (2003). Droplet microfluidics on a planar surface. VTT Publications, 52(504), 3–
194. https://doi.org/10.1002/aic
Ueno, Y., & Fujii, M. (2001). Three years experience of operating and selling recovered struvite
from full-scale plant. Environmental Technology (United Kingdom).
https://doi.org/10.1080/09593332208618196
United Nations. (1992). United Nations Framework Convention on Climate Change.
Fccc/Informal/84, 1(3), 270–277. https://doi.org/10.1111/j.1467-9388.1992.tb00046.x
Vinnerås, B., Schönning, C., & Nordin, A. (2006). Identification of the microbiological
community in biogas systems and evaluation of microbial risks from gas usage. Science of
the Total Environment, 367(2–3), 606–615. https://doi.org/10.1016/j.scitotenv.2006.02.008
Walsh, K. (2018, April 25). Typical Climate of the Midwestern United States. USA Today.
Retrieved from http://traveltips.usatoday.com/typical-climate-midwestern-united-states-
103926.html
Wang, Z., Ren, H., Zhang, S., Zhang, F., & Jin, J. (2018). Carbon Molecular Sieve Membranes
Derived from Tröger’s Base-Based Microporous Polyimide for Gas Separation.
ChemSusChem, 11(5), 916–923. https://doi.org/10.1002/cssc.201702243
Wilber, C., & Murray, C. (1990). Odor source evaluation. BioCycle, 31(3), 68–72.
Wilhelm, E., Battino, R., & Wilcock, R. J. (1977). Low-Pressure Solubility of Gases in Liquid
Water. Chemical Reviews. https://doi.org/10.1021/cr60306a003
Williams, R. B., Kaffka, S. R., & Oglesby, R. (2014). DRAFT INTERIM PROJECT REPORT
DRAFT Comparative Assessment of Technology Options for Biogas Clean ‐ up.
71
Wisconsin DNR. (2009). Wisconsin Department of Natural Resources Wastewater Operator
Certification Introduction to Phosphorus Removal Study Guide, (January).
XEBEC. (2012). Product Range - Biogas Upgrading, www.xebexinc.com, 2(450), 8700.
Retrieved from http://www.xebecinc.com/pdf/Biogas-Reference-Installations.pdf
Yaws, C. L. (1999). Chemical Properties Handbook: Physical, Thermodynamic, Environmental,
Transport, Safety, and Health Related Properties for Organic and Inorganic Chemicals.
McGrawHill handbooks. https://doi.org/http://dx.doi.org/10.1016/B978-075067766-
0/50019-1
Zhao, Q., Leonhardt, E., MacConnell, C., Frear, C., & Chen, S. (2010). Purification
Technologies for Biogas Generated by Anaerobic Digestion. Climate Friendly Farming:
Improving the Carbon Footprint of Agriculture in the Pacific Northwest. CSANR Research
Report 2010-00.
Zheng, D. Q., Guo, T. M., & Knapp, H. (1997). Experimental and modeling studies on the
solubility of CO2, CHClF2, CHF3, C2H2F4 and C2H4F2 in water and aqueous NaCl
solutions under low pressures. Fluid Phase Equilibria. https://doi.org/10.1016/S0378-
3812(96)03177-9