Embed Size (px)
Citation preview
Programmable Host-Network Traffic Management
Peng Sun†, Minlan Yu‡, Michael J. Freedman†, Jennifer Rexford†, David Walker††Princeton University ‡University of Southern California
ABSTRACTData-center administrators perform traffic-management tasks(e.g., performance monitoring, server load balancing, andtraffic engineering) to optimize network performance for di-verse applications. Increasingly, traffic-management func-tionality is moving from the switches to the end hosts, whichhave more computational resources and better visibility intoapplication behavior. However, traffic management is com-plicated by the heterogeneous interfaces for monitoring andcontrolling hosts and switches, and the scalability challengesof collecting and analyzing measurement data across the datacenter. We present a scalable and programmable platformfor joint HOst-NEtwork (HONE) traffic management. HONE’sprogramming environment gives a simple, integrated, andlogically-centralized view of the data center for defining mea-surement, analysis, and control tasks across hosts and swit-ches. Programmers can think globally and rely on HONE todistribute the program for local execution and scalable ag-gregation of data across hosts and switches. HONE success-fully balances the inherent tension between ease-of-use andperformance. We evaluate HONE by implementing severalcanonical traffic-management applications, measuring its ef-ficiency with micro-benchmarks, and demonstrating its scal-ability with larger-scale experiments on Amazon EC2.
1. INTRODUCTIONModern data centers run diverse applications that
generate a large amount of network traffic. To opti-mize performance, data-center administrators performmany traffic-management tasks, such as performancemonitoring, server load balancing, access control, flowscheduling, rate limiting, and traffic engineering. In-creasingly, data-center traffic management capitalizeson the opportunity to move functionality from the swit-ches to the end hosts [10, 14, 15, 24, 27, 28, 32, 34, 37].Compared to hardware switches, hosts have better vis-ibility into application behavior, greater computationalresources, and more flexibility to adopt new function-ality. By harnessing both the hosts and the switches,data-center administrators can improve application per-formance and make more efficient use of resources.
To build an effective joint host-network traffic-ma-
nagement system, we need to achieve three main goals:Uniform interface: Data-center administrators use
a variety of interfaces on hosts to collect socket logs, ker-nel statistics, and CPU/memory utilization (e.g., Win-dows ETW [1], Web10G [31], and vCenter [30]), andperform rate limiting, access control, and routing (e.g.,Linux tc [16], iptables [19], and Open vSwitch [21]).Similarly, switches offer various measurement and con-trol interfaces (e.g., NetFlow/sFlow, SNMP, OpenFlow,and command-line interfaces). Data-center administra-tors rely on numerous scripts and configuration files toautomate their management tasks. A good manage-ment system would shield the administrators from thesedetails by offering an uniform interface for measure-ment, analysis, and control across hosts and switches.
Programmability: Rather than settle on a singletraffic-management solution in advance, a good sys-tem would be programmable, so administrators can sup-port multiple management tasks at a time, and adoptnew solutions as the application mix and network de-sign evolve. The most general programming frameworkwould allow administrators to deploy arbitrary code onthe hosts, but this by itself does little to lower the bar-rier to creating new management applications. Instead,the system should raise the level of abstraction by of-fering a simple, logically-centralized view of the datacenter, and automatically handling the details of collect-ing and analyzing data, and enforcing control actions,across a distributed collection of hosts and switches.
Efficiency and scalability: Data centers have alarge number of switches and hosts, each with manyconnections. Collecting and analyzing a diverse set ofmeasurement from these devices in real time introducesa major scalability challenge. Parallelizing the collec-tion and analysis of the data is crucial. Although au-tomatically parallelizing an arbitrary program is noto-riously difficult, a carefully designed programming lan-guage can expose opportunities to distribute the workover components in the system. In particular, the hostsshould collect measurement data, and locally filter andaggregate the data, to reduce the load on the controller.
In this paper, we present a scalable, programmable
Network
Server OS
HONE Agent
APP
Controller
HONE Runtime System
Management Program
Hosts
Legend: Programmer’s work HONE Component
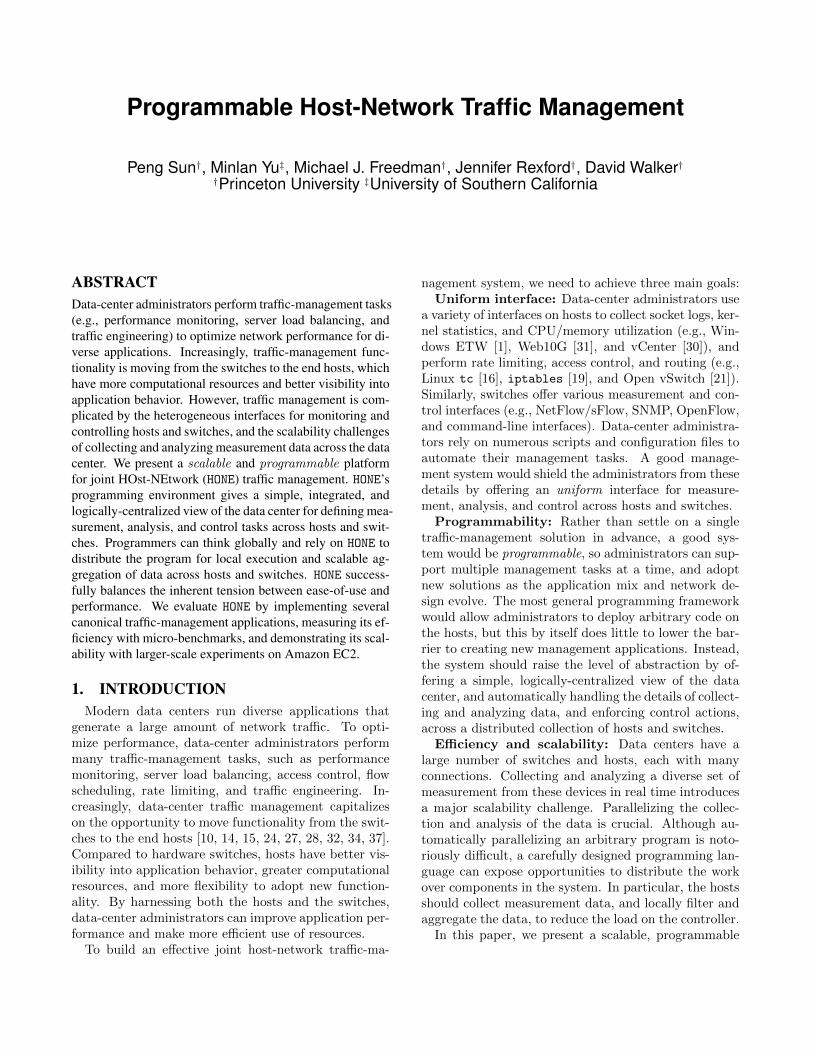
Figure 1: Overview of HONE system
platform for joint HOst-NEtwork (HONE) traffic manage-ment. As shown in Figure 1, a management programrunning on the controller defines what measurementdata to collect, what analysis to perform, and whatcontrol actions to take. HONE’s declarative program-ming environment enables programmers to think glob-ally without worrying about how the hosts and switchesact locally to execute the program. The controller di-vides the program logic, and scalably filters and aggre-gates the results. On each host, a HONE agent performsfine-grained measurement across several layers, and per-forms local analysis, at the behest of the controller.
To balance the inherent tension between ease-of-useand performance, we make several contributions:
Uniform host-network data model: HONE ab-stracts the data center as a database, using global tablesof statistics to uniformly represent data from a diversearray of sources. The controller handles the low-leveldetails of collecting the necessary measurement datafrom hosts and switches using a variety of interfaces.
Lazy materialization of measurement data: Theuniform data model, with diverse statistics available atarbitrary time granularity, is too expensive to supportdirectly. Instead, the controller analyzes the queries tohave the hosts collect only the necessary statistics forthe appropriate connections and time periods.
Uniform data-processing interface: Programs an-alyze measurement data using data-parallel streamingoperators, allowing programmers to think globally andsequentially. The controller handles the low-level de-tails of distributing the computation, communicatingwith hosts and switches, and combining the results.
Host-based filtering and aggregation: The con-troller automatically partitions the analysis to use end-host resources to filter and aggregate the data locally.The controller groups hosts into a hierarchy to applyuser-defined (commutative and associative) functions tocombine analysis results across the data center.
Case studies of management applications: Todemonstrate the power of our programming environ-ment, we build a collection of canonical managementapplications, such as flow scheduling [3, 8], distributed
Measure servers’
utilization and request incoming rates
Compute total request rate and a target
distribution of requests
Reconfigure load balancing policies to
enforce the target
Server Load Balancing
Measure sockets’ backlog traffic
demand
Detect elephant flows. Compute routes for
them
Install routing rules in network
Elephant Flow Scheduling
Measurement Analysis Control
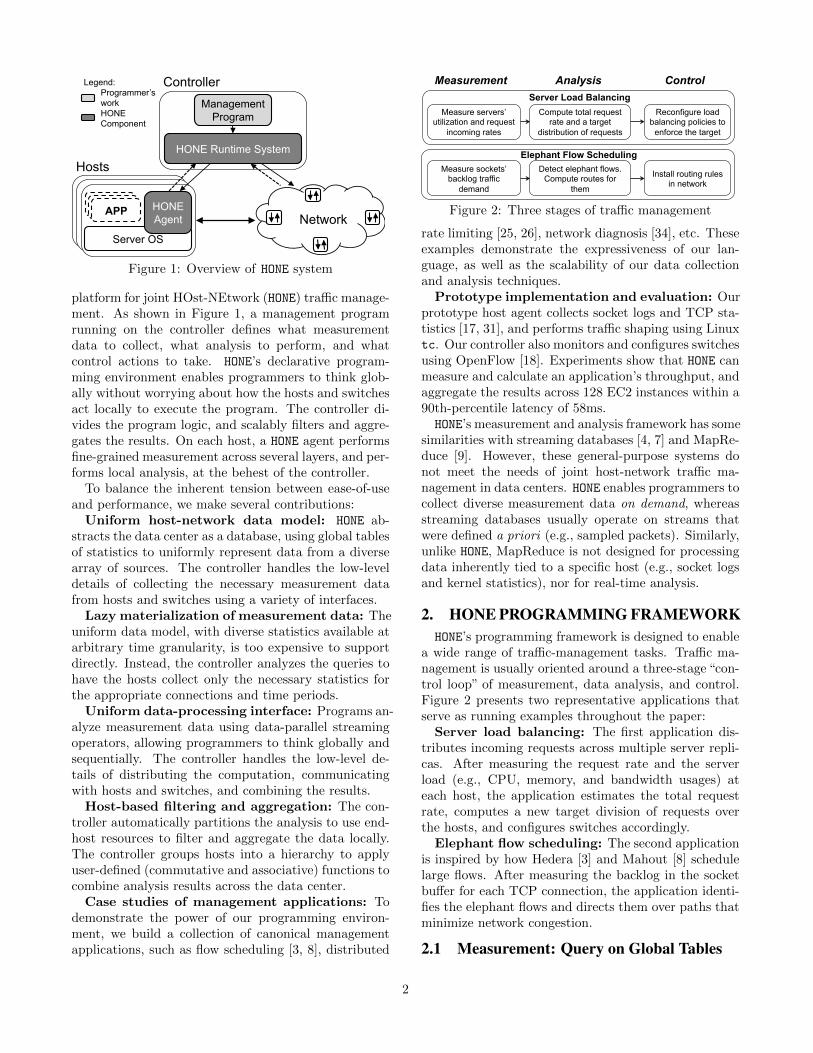
Figure 2: Three stages of traffic management
rate limiting [25, 26], network diagnosis [34], etc. Theseexamples demonstrate the expressiveness of our lan-guage, as well as the scalability of our data collectionand analysis techniques.
Prototype implementation and evaluation: Ourprototype host agent collects socket logs and TCP sta-tistics [17, 31], and performs traffic shaping using Linuxtc. Our controller also monitors and configures switchesusing OpenFlow [18]. Experiments show that HONE canmeasure and calculate an application’s throughput, andaggregate the results across 128 EC2 instances within a90th-percentile latency of 58ms.HONE’s measurement and analysis framework has some
similarities with streaming databases [4, 7] and MapRe-duce [9]. However, these general-purpose systems donot meet the needs of joint host-network traffic ma-nagement in data centers. HONE enables programmers tocollect diverse measurement data on demand, whereasstreaming databases usually operate on streams thatwere defined a priori (e.g., sampled packets). Similarly,unlike HONE, MapReduce is not designed for processingdata inherently tied to a specific host (e.g., socket logsand kernel statistics), nor for real-time analysis.
2. HONE PROGRAMMING FRAMEWORKHONE’s programming framework is designed to enable
a wide range of traffic-management tasks. Traffic ma-nagement is usually oriented around a three-stage “con-trol loop” of measurement, data analysis, and control.Figure 2 presents two representative applications thatserve as running examples throughout the paper:
Server load balancing: The first application dis-tributes incoming requests across multiple server repli-cas. After measuring the request rate and the serverload (e.g., CPU, memory, and bandwidth usages) ateach host, the application estimates the total requestrate, computes a new target division of requests overthe hosts, and configures switches accordingly.
Elephant flow scheduling: The second applicationis inspired by how Hedera [3] and Mahout [8] schedulelarge flows. After measuring the backlog in the socketbuffer for each TCP connection, the application identi-fies the elephant flows and directs them over paths thatminimize network congestion.
2.1 Measurement: Query on Global Tables
2
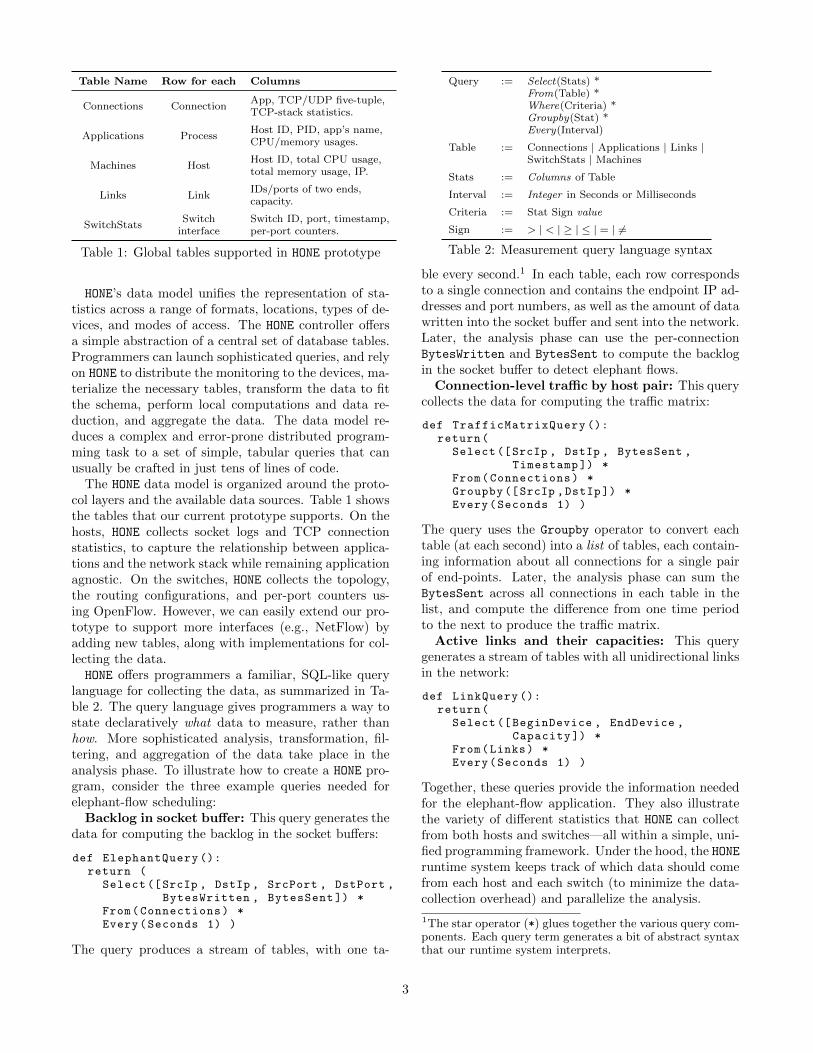
Table Name Row for each Columns
Connections ConnectionApp, TCP/UDP five-tuple,TCP-stack statistics.
Applications ProcessHost ID, PID, app’s name,CPU/memory usages.
Machines HostHost ID, total CPU usage,total memory usage, IP.
Links LinkIDs/ports of two ends,capacity.
SwitchStatsSwitch Switch ID, port, timestamp,
interface per-port counters.
Table 1: Global tables supported in HONE prototype
HONE’s data model unifies the representation of sta-tistics across a range of formats, locations, types of de-vices, and modes of access. The HONE controller offersa simple abstraction of a central set of database tables.Programmers can launch sophisticated queries, and relyon HONE to distribute the monitoring to the devices, ma-terialize the necessary tables, transform the data to fitthe schema, perform local computations and data re-duction, and aggregate the data. The data model re-duces a complex and error-prone distributed program-ming task to a set of simple, tabular queries that canusually be crafted in just tens of lines of code.
The HONE data model is organized around the proto-col layers and the available data sources. Table 1 showsthe tables that our current prototype supports. On thehosts, HONE collects socket logs and TCP connectionstatistics, to capture the relationship between applica-tions and the network stack while remaining applicationagnostic. On the switches, HONE collects the topology,the routing configurations, and per-port counters us-ing OpenFlow. However, we can easily extend our pro-totype to support more interfaces (e.g., NetFlow) byadding new tables, along with implementations for col-lecting the data.HONE offers programmers a familiar, SQL-like query
language for collecting the data, as summarized in Ta-ble 2. The query language gives programmers a way tostate declaratively what data to measure, rather thanhow. More sophisticated analysis, transformation, fil-tering, and aggregation of the data take place in theanalysis phase. To illustrate how to create a HONE pro-gram, consider the three example queries needed forelephant-flow scheduling:
Backlog in socket buffer: This query generates thedata for computing the backlog in the socket buffers:
def ElephantQuery ():return (
Select ([SrcIp , DstIp , SrcPort , DstPort ,BytesWritten , BytesSent ]) *
From(Connections) *Every(Seconds 1) )
The query produces a stream of tables, with one ta-
Query := Select(Stats) *From(Table) *Where(Criteria) *Groupby(Stat) *Every(Interval)
Table := Connections | Applications | Links |SwitchStats | Machines
Stats := Columns of Table
Interval := Integer in Seconds or Milliseconds
Criteria := Stat Sign value
Sign := > | < | ≥ | ≤ | = | 6=
Table 2: Measurement query language syntax
ble every second.1 In each table, each row correspondsto a single connection and contains the endpoint IP ad-dresses and port numbers, as well as the amount of datawritten into the socket buffer and sent into the network.Later, the analysis phase can use the per-connectionBytesWritten and BytesSent to compute the backlogin the socket buffer to detect elephant flows.
Connection-level traffic by host pair: This querycollects the data for computing the traffic matrix:
def TrafficMatrixQuery ():return(
Select ([SrcIp , DstIp , BytesSent ,Timestamp ]) *
From(Connections) *Groupby ([SrcIp ,DstIp]) *Every(Seconds 1) )
The query uses the Groupby operator to convert eachtable (at each second) into a list of tables, each contain-ing information about all connections for a single pairof end-points. Later, the analysis phase can sum theBytesSent across all connections in each table in thelist, and compute the difference from one time periodto the next to produce the traffic matrix.
Active links and their capacities: This querygenerates a stream of tables with all unidirectional linksin the network:
def LinkQuery ():return(
Select ([ BeginDevice , EndDevice ,Capacity ]) *
From(Links) *Every(Seconds 1) )
Together, these queries provide the information neededfor the elephant-flow application. They also illustratethe variety of different statistics that HONE can collectfrom both hosts and switches—all within a simple, uni-fied programming framework. Under the hood, the HONEruntime system keeps track of which data should comefrom each host and each switch (to minimize the data-collection overhead) and parallelize the analysis.
1The star operator (*) glues together the various query com-ponents. Each query term generates a bit of abstract syntaxthat our runtime system interprets.
3
2.2 Analysis: Data-Parallel OperatorsHONE enables programmers to analyze data across mul-
tiple hosts, without worrying about the low-level de-tails of communicating with the hosts or tracking theirfailures. HONE’s functional data-parallel operators allowprogrammers to say what analysis to perform, ratherthan how. Programmers can associate their own func-tions with the operators to apply these functions acrosssets of hosts, as if the streams of tabular measurementdata were all available at the controller. Yet, HONE givesthe programmers a way to express whether their func-tions can be (safely) applied in parallel across data fromdifferent hosts, to enable the runtime system to reducethe bandwidth and processing load on the controller byexecuting these functions at the hosts. HONE’s data-parallel operators include the following:
• MapSet(f): Apply function f to every element of astream in the set of streams, producing a new set ofstreams.• FilterSet(f): Create a new set of streams that
omits stream elements e for which f(e) is false.• ReduceSet(f,i): “Fold” function f across each ele-
ment for each stream in the set, using i as an initial-izer. In other words, generate a new set of streamswhere f(. . . f(f(i, e1), e2) . . . , en) is the nth elementof each stream when e1, e2, ..., en were the first nelements of the original stream.• MergeHosts(): Merge a set of streams on the hosts
into one single global stream. (Currently in HONE,the collection of switches already generate a singleglobal stream of measurement data, given that ourprototype integrates with an SDN controller to accessdata from switches.)
MapSet, FilterSet, and ReduceSet operate in pa-rallel on each host, and MergeHosts merges the re-sults of multiple analysis streams into a single streamon the controller. HONE also enables analysis on a sin-gle global stream with corresponding operators, suchas MapStream, FilterStream, and ReduceStream. Tocombine queries and analysis into a single program, theprogrammer simply associates his functions with the op-erators, and “pipes” the result from one query or oper-ation to the next (using the >> operator).
Consider again the elephant-flow scheduling applica-tion, which has three main parts to the analysis:
Identifying elephant flows: Following the approachsuggested by Curtis et al. [8], the function IsElephant
defines elephant flows as the connections with a socketbacklog (i.e., the difference between bytes bw written bythe application and the bytes bs acknowledged by therecipient) in excess of 100KB:
def IsElephant(row):[sip ,dip ,sp,dp ,bw,bs] = rowreturn (bw-bs > 100)
def DetectElephant(table):return (FilterList(IsElephant , table))
EStream = ElephantQuery () >>MapSet(DetectElephant) >>MergeHosts ()
DetectElephant uses FilterList (the same as fil-
ter in Python) to apply IsElephant to select only therows of the connection table that satisfy this condition.Finally, DetectElephant is applied to the outputs ofElephantQuery, and the results are merged across allhosts to produce a single stream EStream of elephantflows at the controller.
Computing the traffic matrix: The next analy-sis task computes the traffic matrix, starting from ag-gregating the per-connection traffic volumes by source-destination pair, and then computing the difference acrossconsecutive time intervals:
TMStream = TrafficMatrixQuery () >>MapSet(MapList(SumBytesSent) >>ReduceSet(CalcThroughput , {}) >>MergeHosts () >>MapStream(AggTM)
The query produces a stream of lists of tables, whereeach table contains the per-connection traffic volumesfor a single source-destination pair at a point in time.MapList (i.e., the built-in map in Python) allows us toapply a custom function SumBytesSent that aggregatesthe traffic volumes across connections in the same table,and MapSet applies this function over time. The result isa stream of tables, which each contains the cumulativetraffic volumes for every source-destination pair at apoint in time. Next, the ReduceSet applies a customfunction CalcThroughput to compute the differences inthe total bytes sent from one time to the next. Thelast two lines of the analysis merge the streams fromdifferent hosts and apply a custom function AggTM tocreate a global traffic matrix for each time period atthe controller.
Constructing the topology: A last part of ouranalysis builds a network topology from the link tablesproduced by LinkQuery, which is abstracted as a singledata stream collected from the network:
TopoStream = LinkQuery () >>MapStream(BuildTopo)
The auxiliary BuildTopo function (not shown) convertsa single table of links into a graph data structure usefulfor computing paths between two hosts. The MapStreamoperator applies BuildTopo to the stream of link tablesto generate a stream of graph data structures.
2.3 Control: Uniform and Dynamic PolicyIn controlling hosts and switches, the data-center ad-
ministrators have to use various interfaces. For exam-ple, administrators use tc, iptables, or Open vSwitch
4
Policy := [Rule]+
Rule := if Criteria then Action
Criteria := Predicate [(and | or) Predicate]*
Predicate := Field = value
Field := AppName | SrcHost | DstHost | Headers
Headers := SrcIP | DstIP | SrcPort | DstPort | · · ·Action := rate-limit value | forward-on-path path
Table 3: Control policy supported in HONE prototype
on hosts to manage traffic, and they use SNMP or Open-Flow to manage the switches. For the purpose of man-aging traffic, these different control interfaces can beunified because they share the same pattern of generat-ing control policies: for a group of connections satisfyingcriteria, define what actions to take. Therefore, HONEoffers administrators a uniform way of specifying con-trol policies as criteria + action clauses, and HONE takescare of choosing the right control implementations, e.g.,we implement rate-limit using tc and iptables in thehost agent.
The criteria can be network identifiers (e.g., IP ad-dresses, port numbers, etc.). But this would force theprogrammer to map his higher-level policies into lower-level identifiers, and identify changes in which connec-tions satisfy the higher-level policies. Instead, we allowprogrammers to identify connections of interest basedon higher-level attributes, and HONE automatically trackswhich traffic satisfies these attributes as connectionscome and go. Our predicates are more general thannetwork-based rule-matching mechanisms in the sensethat we can match connections by applications with thehelp of hosts. Table 3 shows the syntax of control poli-cies, each of which our current prototype supports.
Continuing the elephant-flow application, we definea function Schedule that takes inputs of the detectedelephant flows, the network topology, and the currenttraffic matrix. It assigns a routing path for each ele-phant flow with a greedy Global First Fit [3] strategy,and creates a HONE policy for forwarding the flow alongthe picked path. Other non-elelphant flows are ran-domly assigned to an available path. The outputs ofpolicies by Schedule will be piped into RegisterPol-
icy to register them with HONE.
def Schedule(elephant , topo , traffic ):routes = FindRoutesForHostPair(topo)policies = []for four_tuples in elephant:
path = GreedilyFindAvailablePath(four_tuples , routes , traffic)
criteria = four_tuplesaction = forward -on-path pathpolicies.append ([criteria , action ])
return policies
2.4 All Three Stages Together
Combining the measurement, analysis, and controlphases, the complete program merges the data streams,feeds the data to the Schedule function, and registersthe output of policies. With this concrete example ofan elephant-flow detection and scheduling application,we have demonstrated the simple and straightforwardway of designing traffic-management tasks in HONE pro-gramming framework.
def ElephantFlowDetectionScheduling ():MergeStreams (
[EStream , TopoStream , TMStream ]) >>MapStream(Schedule) >>RegisterPolicy ()
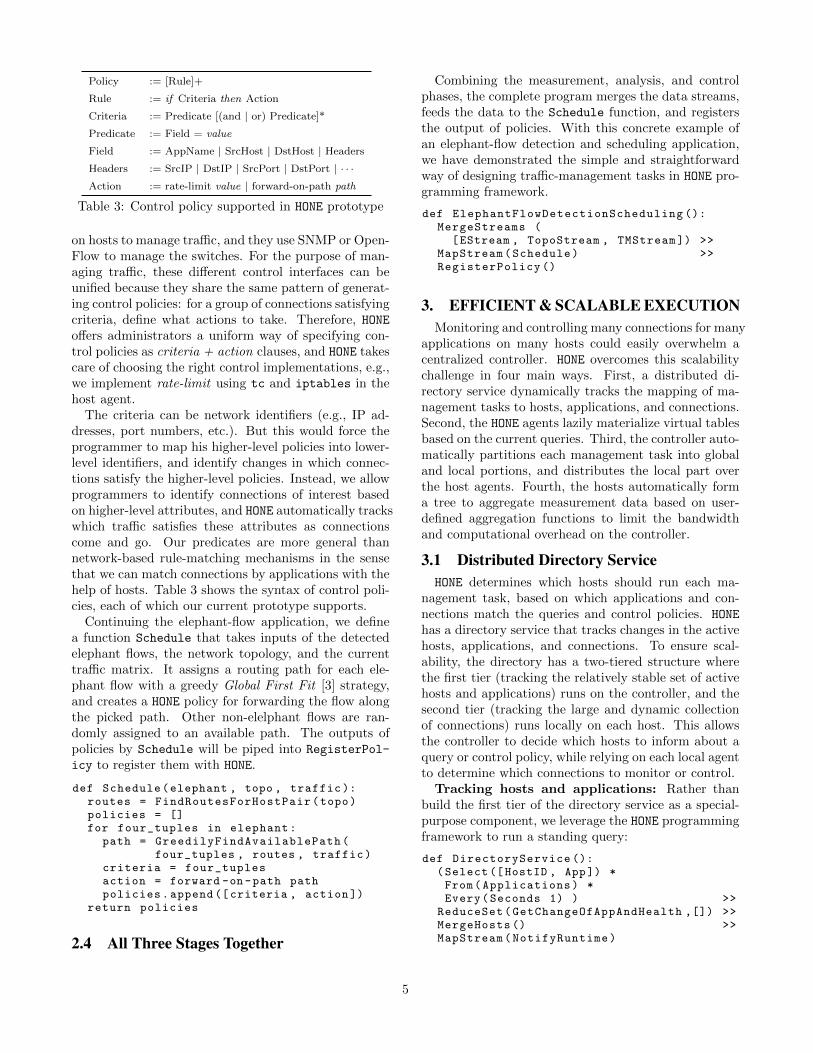
3. EFFICIENT & SCALABLE EXECUTIONMonitoring and controlling many connections for many
applications on many hosts could easily overwhelm acentralized controller. HONE overcomes this scalabilitychallenge in four main ways. First, a distributed di-rectory service dynamically tracks the mapping of ma-nagement tasks to hosts, applications, and connections.Second, the HONE agents lazily materialize virtual tablesbased on the current queries. Third, the controller auto-matically partitions each management task into globaland local portions, and distributes the local part overthe host agents. Fourth, the hosts automatically forma tree to aggregate measurement data based on user-defined aggregation functions to limit the bandwidthand computational overhead on the controller.
3.1 Distributed Directory ServiceHONE determines which hosts should run each ma-
nagement task, based on which applications and con-nections match the queries and control policies. HONE
has a directory service that tracks changes in the activehosts, applications, and connections. To ensure scal-ability, the directory has a two-tiered structure wherethe first tier (tracking the relatively stable set of activehosts and applications) runs on the controller, and thesecond tier (tracking the large and dynamic collectionof connections) runs locally on each host. This allowsthe controller to decide which hosts to inform about aquery or control policy, while relying on each local agentto determine which connections to monitor or control.
Tracking hosts and applications: Rather thanbuild the first tier of the directory service as a special-purpose component, we leverage the HONE programmingframework to run a standing query:
def DirectoryService ():(Select ([HostID , App]) *From(Applications) *Every(Seconds 1) ) >>
ReduceSet(GetChangeOfAppAndHealth ,[]) >>MergeHosts () >>MapStream(NotifyRuntime)
5
Hosts’ Execution Plans Controller Execution Plan Estream TMStream TopoStream
ToController
MergeHosts MapSet DetectElephant()
ReduceSet CalcThroughput()
Measure
MapStream AggTM()
MergeStreams
Network Measure
MapStream BuildTopo()
MapStream Schedule() RegisterPolicy
MapSet SumBytesSent()
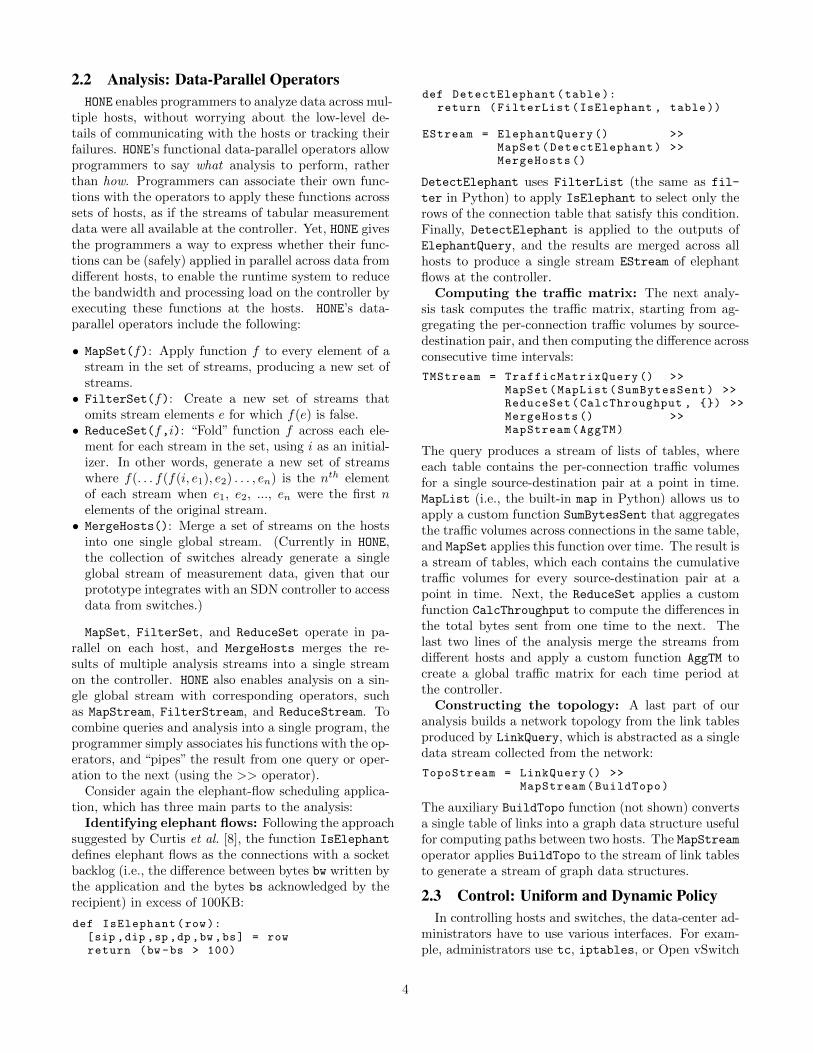
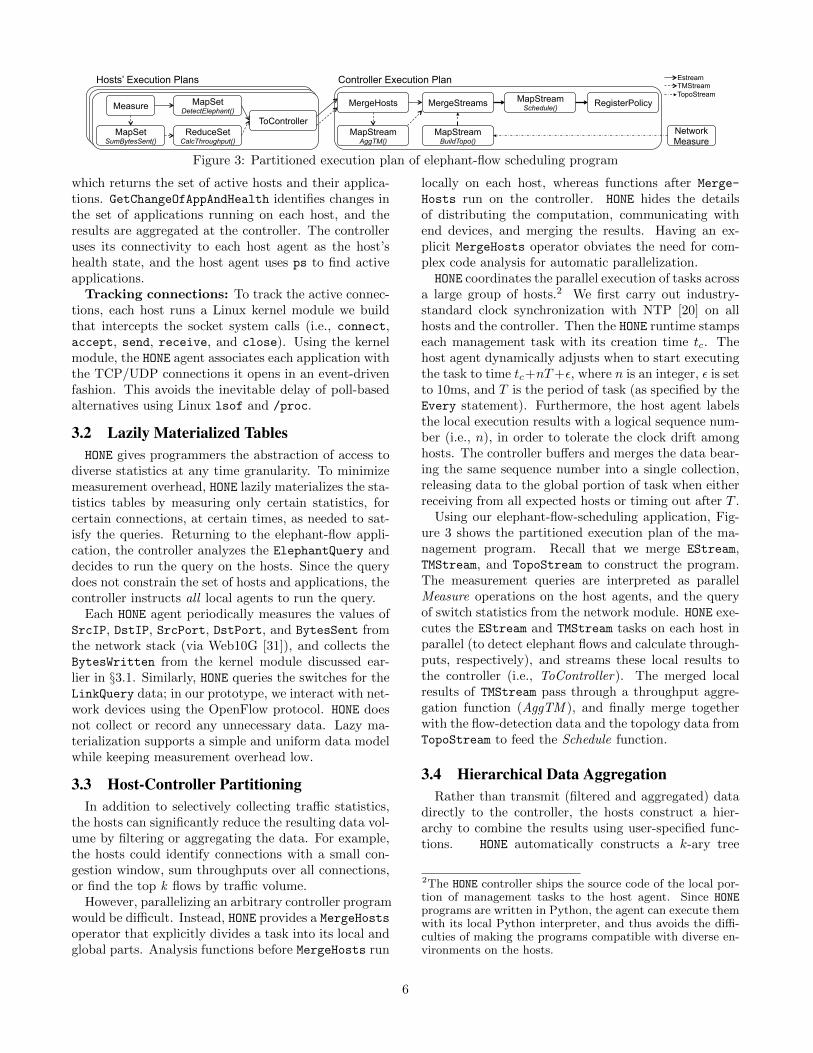
Figure 3: Partitioned execution plan of elephant-flow scheduling program
which returns the set of active hosts and their applica-tions. GetChangeOfAppAndHealth identifies changes inthe set of applications running on each host, and theresults are aggregated at the controller. The controlleruses its connectivity to each host agent as the host’shealth state, and the host agent uses ps to find activeapplications.
Tracking connections: To track the active connec-tions, each host runs a Linux kernel module we buildthat intercepts the socket system calls (i.e., connect,accept, send, receive, and close). Using the kernelmodule, the HONE agent associates each application withthe TCP/UDP connections it opens in an event-drivenfashion. This avoids the inevitable delay of poll-basedalternatives using Linux lsof and /proc.
3.2 Lazily Materialized TablesHONE gives programmers the abstraction of access to
diverse statistics at any time granularity. To minimizemeasurement overhead, HONE lazily materializes the sta-tistics tables by measuring only certain statistics, forcertain connections, at certain times, as needed to sat-isfy the queries. Returning to the elephant-flow appli-cation, the controller analyzes the ElephantQuery anddecides to run the query on the hosts. Since the querydoes not constrain the set of hosts and applications, thecontroller instructs all local agents to run the query.
Each HONE agent periodically measures the values ofSrcIP, DstIP, SrcPort, DstPort, and BytesSent fromthe network stack (via Web10G [31]), and collects theBytesWritten from the kernel module discussed ear-lier in §3.1. Similarly, HONE queries the switches for theLinkQuery data; in our prototype, we interact with net-work devices using the OpenFlow protocol. HONE doesnot collect or record any unnecessary data. Lazy ma-terialization supports a simple and uniform data modelwhile keeping measurement overhead low.
3.3 Host-Controller PartitioningIn addition to selectively collecting traffic statistics,
the hosts can significantly reduce the resulting data vol-ume by filtering or aggregating the data. For example,the hosts could identify connections with a small con-gestion window, sum throughputs over all connections,or find the top k flows by traffic volume.
However, parallelizing an arbitrary controller programwould be difficult. Instead, HONE provides a MergeHosts
operator that explicitly divides a task into its local andglobal parts. Analysis functions before MergeHosts run
locally on each host, whereas functions after Merge-
Hosts run on the controller. HONE hides the detailsof distributing the computation, communicating withend devices, and merging the results. Having an ex-plicit MergeHosts operator obviates the need for com-plex code analysis for automatic parallelization.HONE coordinates the parallel execution of tasks across
a large group of hosts.2 We first carry out industry-standard clock synchronization with NTP [20] on allhosts and the controller. Then the HONE runtime stampseach management task with its creation time tc. Thehost agent dynamically adjusts when to start executingthe task to time tc+nT+ε, where n is an integer, ε is setto 10ms, and T is the period of task (as specified by theEvery statement). Furthermore, the host agent labelsthe local execution results with a logical sequence num-ber (i.e., n), in order to tolerate the clock drift amonghosts. The controller buffers and merges the data bear-ing the same sequence number into a single collection,releasing data to the global portion of task when eitherreceiving from all expected hosts or timing out after T .
Using our elephant-flow-scheduling application, Fig-ure 3 shows the partitioned execution plan of the ma-nagement program. Recall that we merge EStream,TMStream, and TopoStream to construct the program.The measurement queries are interpreted as parallelMeasure operations on the host agents, and the queryof switch statistics from the network module. HONE exe-cutes the EStream and TMStream tasks on each host inparallel (to detect elephant flows and calculate through-puts, respectively), and streams these local results tothe controller (i.e., ToController). The merged localresults of TMStream pass through a throughput aggre-gation function (AggTM ), and finally merge togetherwith the flow-detection data and the topology data fromTopoStream to feed the Schedule function.
3.4 Hierarchical Data AggregationRather than transmit (filtered and aggregated) data
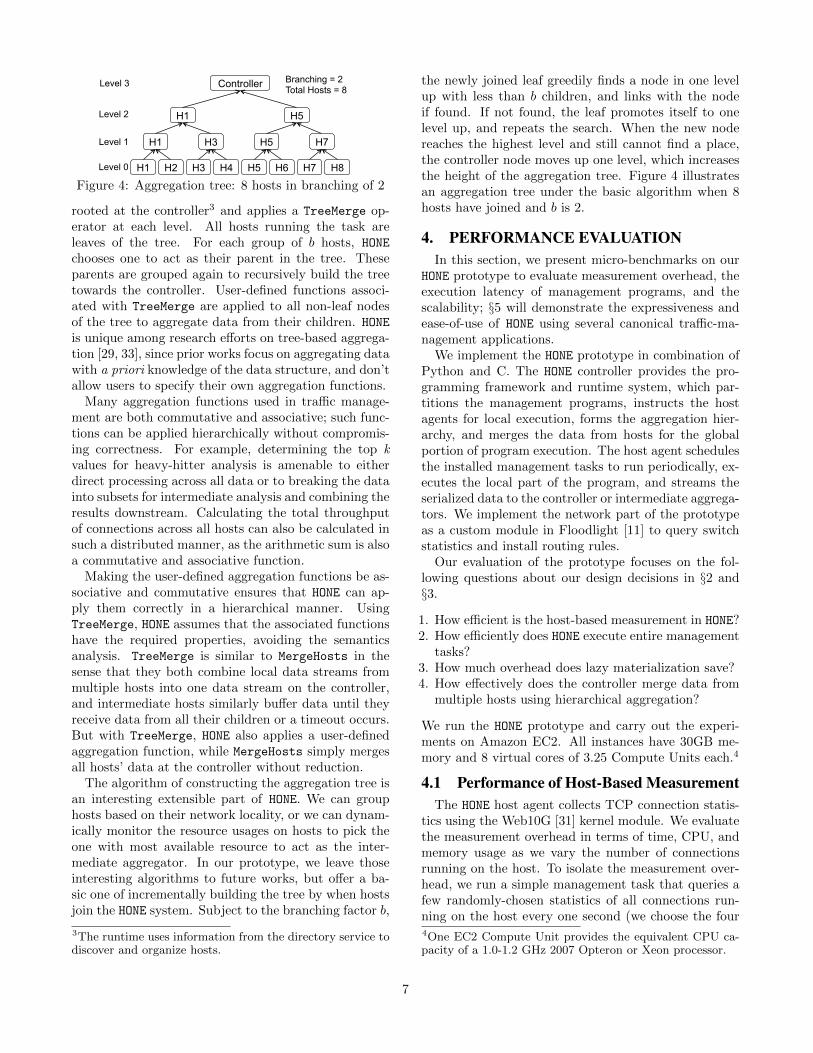
directly to the controller, the hosts construct a hier-archy to combine the results using user-specified func-tions. HONE automatically constructs a k-ary tree
2The HONE controller ships the source code of the local por-tion of management tasks to the host agent. Since HONEprograms are written in Python, the agent can execute themwith its local Python interpreter, and thus avoids the diffi-culties of making the programs compatible with diverse en-vironments on the hosts.
6
H1 H2 H3 H4 H8 H7 H6 H5
H1 H3 H5 H7
H1 H5
Controller Branching = 2 Total Hosts = 8
Level 0
Level 1
Level 2
Level 3
Figure 4: Aggregation tree: 8 hosts in branching of 2
rooted at the controller3 and applies a TreeMerge op-erator at each level. All hosts running the task areleaves of the tree. For each group of b hosts, HONE
chooses one to act as their parent in the tree. Theseparents are grouped again to recursively build the treetowards the controller. User-defined functions associ-ated with TreeMerge are applied to all non-leaf nodesof the tree to aggregate data from their children. HONE
is unique among research efforts on tree-based aggrega-tion [29, 33], since prior works focus on aggregating datawith a priori knowledge of the data structure, and don’tallow users to specify their own aggregation functions.
Many aggregation functions used in traffic manage-ment are both commutative and associative; such func-tions can be applied hierarchically without compromis-ing correctness. For example, determining the top kvalues for heavy-hitter analysis is amenable to eitherdirect processing across all data or to breaking the datainto subsets for intermediate analysis and combining theresults downstream. Calculating the total throughputof connections across all hosts can also be calculated insuch a distributed manner, as the arithmetic sum is alsoa commutative and associative function.
Making the user-defined aggregation functions be as-sociative and commutative ensures that HONE can ap-ply them correctly in a hierarchical manner. UsingTreeMerge, HONE assumes that the associated functionshave the required properties, avoiding the semanticsanalysis. TreeMerge is similar to MergeHosts in thesense that they both combine local data streams frommultiple hosts into one data stream on the controller,and intermediate hosts similarly buffer data until theyreceive data from all their children or a timeout occurs.But with TreeMerge, HONE also applies a user-definedaggregation function, while MergeHosts simply mergesall hosts’ data at the controller without reduction.
The algorithm of constructing the aggregation tree isan interesting extensible part of HONE. We can grouphosts based on their network locality, or we can dynam-ically monitor the resource usages on hosts to pick theone with most available resource to act as the inter-mediate aggregator. In our prototype, we leave thoseinteresting algorithms to future works, but offer a ba-sic one of incrementally building the tree by when hostsjoin the HONE system. Subject to the branching factor b,
3The runtime uses information from the directory service todiscover and organize hosts.
the newly joined leaf greedily finds a node in one levelup with less than b children, and links with the nodeif found. If not found, the leaf promotes itself to onelevel up, and repeats the search. When the new nodereaches the highest level and still cannot find a place,the controller node moves up one level, which increasesthe height of the aggregation tree. Figure 4 illustratesan aggregation tree under the basic algorithm when 8hosts have joined and b is 2.
4. PERFORMANCE EVALUATIONIn this section, we present micro-benchmarks on our
HONE prototype to evaluate measurement overhead, theexecution latency of management programs, and thescalability; §5 will demonstrate the expressiveness andease-of-use of HONE using several canonical traffic-ma-nagement applications.
We implement the HONE prototype in combination ofPython and C. The HONE controller provides the pro-gramming framework and runtime system, which par-titions the management programs, instructs the hostagents for local execution, forms the aggregation hier-archy, and merges the data from hosts for the globalportion of program execution. The host agent schedulesthe installed management tasks to run periodically, ex-ecutes the local part of the program, and streams theserialized data to the controller or intermediate aggrega-tors. We implement the network part of the prototypeas a custom module in Floodlight [11] to query switchstatistics and install routing rules.
Our evaluation of the prototype focuses on the fol-lowing questions about our design decisions in §2 and§3.
1. How efficient is the host-based measurement in HONE?2. How efficiently does HONE execute entire management
tasks?3. How much overhead does lazy materialization save?4. How effectively does the controller merge data from
multiple hosts using hierarchical aggregation?
We run the HONE prototype and carry out the experi-ments on Amazon EC2. All instances have 30GB me-mory and 8 virtual cores of 3.25 Compute Units each.4
4.1 Performance of Host-Based MeasurementThe HONE host agent collects TCP connection statis-
tics using the Web10G [31] kernel module. We evaluatethe measurement overhead in terms of time, CPU, andmemory usage as we vary the number of connectionsrunning on the host. To isolate the measurement over-head, we run a simple management task that queries afew randomly-chosen statistics of all connections run-ning on the host every one second (we choose the four4One EC2 Compute Unit provides the equivalent CPU ca-pacity of a 1.0-1.2 GHz 2007 Opteron or Xeon processor.
7
1000 2000 3000 4000 5000 6000 7000 8000 90000
200
400
600
800
1000
Number of connections to measure
Tim
e (
ms)
Measure statistics of the connectionsOrganize measurement results for analysis phaseIdentify connections to measure
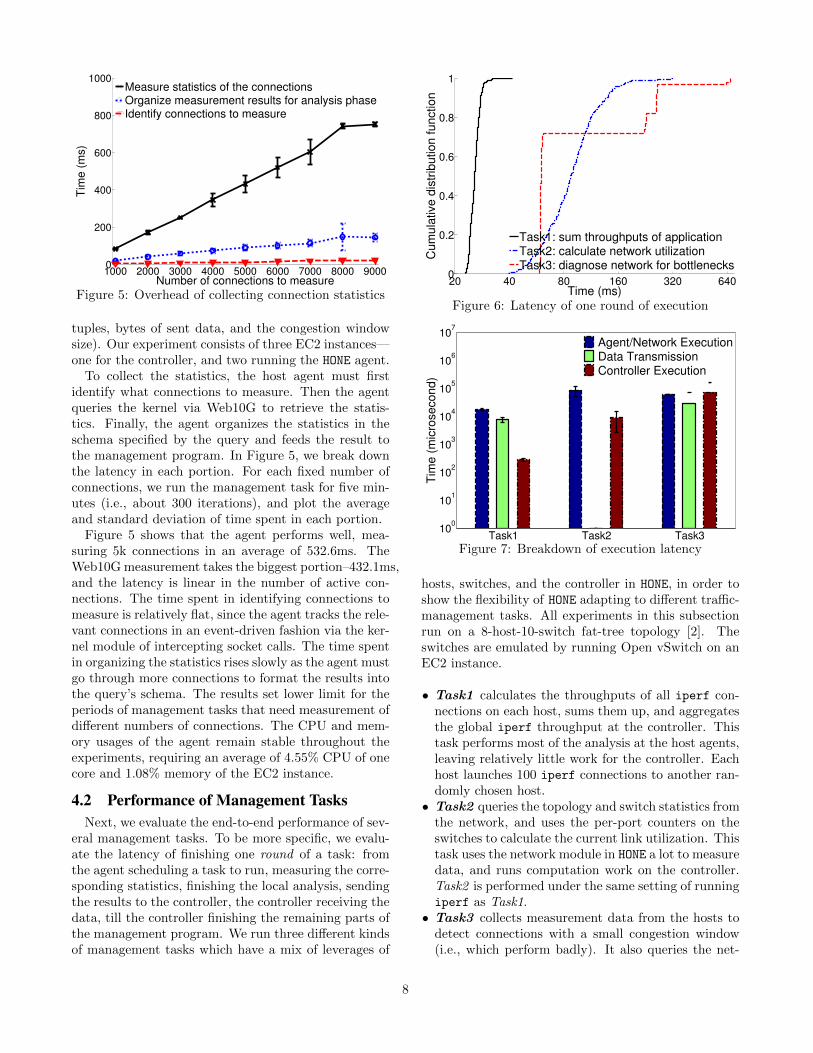
Figure 5: Overhead of collecting connection statistics
tuples, bytes of sent data, and the congestion windowsize). Our experiment consists of three EC2 instances—one for the controller, and two running the HONE agent.
To collect the statistics, the host agent must firstidentify what connections to measure. Then the agentqueries the kernel via Web10G to retrieve the statis-tics. Finally, the agent organizes the statistics in theschema specified by the query and feeds the result tothe management program. In Figure 5, we break downthe latency in each portion. For each fixed number ofconnections, we run the management task for five min-utes (i.e., about 300 iterations), and plot the averageand standard deviation of time spent in each portion.
Figure 5 shows that the agent performs well, mea-suring 5k connections in an average of 532.6ms. TheWeb10G measurement takes the biggest portion–432.1ms,and the latency is linear in the number of active con-nections. The time spent in identifying connections tomeasure is relatively flat, since the agent tracks the rele-vant connections in an event-driven fashion via the ker-nel module of intercepting socket calls. The time spentin organizing the statistics rises slowly as the agent mustgo through more connections to format the results intothe query’s schema. The results set lower limit for theperiods of management tasks that need measurement ofdifferent numbers of connections. The CPU and mem-ory usages of the agent remain stable throughout theexperiments, requiring an average of 4.55% CPU of onecore and 1.08% memory of the EC2 instance.
4.2 Performance of Management TasksNext, we evaluate the end-to-end performance of sev-
eral management tasks. To be more specific, we evalu-ate the latency of finishing one round of a task: fromthe agent scheduling a task to run, measuring the corre-sponding statistics, finishing the local analysis, sendingthe results to the controller, the controller receiving thedata, till the controller finishing the remaining parts ofthe management program. We run three different kindsof management tasks which have a mix of leverages of
20 40 80 160 320 6400
0.2
0.4
0.6
0.8
1
Time (ms)
Cu
mu
lative
dis
trib
utio
n f
un
ctio
n
Task1: sum throughputs of applicationTask2: calculate network utilizationTask3: diagnose network for bottlenecks
Figure 6: Latency of one round of execution
Task1 Task2 Task310
0
101
102
103
104
105
106
107
Tim
e (
mic
rose
co
nd
)
Agent/Network Execution Data Transmission Controller Execution
Figure 7: Breakdown of execution latency
hosts, switches, and the controller in HONE, in order toshow the flexibility of HONE adapting to different traffic-management tasks. All experiments in this subsectionrun on a 8-host-10-switch fat-tree topology [2]. Theswitches are emulated by running Open vSwitch on anEC2 instance.
• Task1 calculates the throughputs of all iperf con-nections on each host, sums them up, and aggregatesthe global iperf throughput at the controller. Thistask performs most of the analysis at the host agents,leaving relatively little work for the controller. Eachhost launches 100 iperf connections to another ran-domly chosen host.• Task2 queries the topology and switch statistics from
the network, and uses the per-port counters on theswitches to calculate the current link utilization. Thistask uses the network module in HONE a lot to measuredata, and runs computation work on the controller.Task2 is performed under the same setting of runningiperf as Task1.• Task3 collects measurement data from the hosts to
detect connections with a small congestion window(i.e., which perform badly). It also queries the net-
8
CPU Mem CPU MemAgent Agent Controller Controller
Task1 3.71% 0.94% 0.67% 0.10%
Task2 N/A N/A 0.76% 1.13%
Task3 7.84% 1.64% 1.03% 0.11%
Table 4: Avg. CPU and memory usages of execution
work to determine the forwarding path for each hostpair. The task then diagnoses the shared links amongthose problematic flows as possible causes of the badnetwork performance. Task3 is a joint host-networkjob, which runs its computation across hosts, net-work, and the controller. Task3 is still under thesame setting, but we manually add rules on two linksto drop 50% of packets for all flows traversing thelinks, emulating a lossy network.
Figure 6 illustrates the cumulative distribution func-tion (CDF) of the latency for finishing one round ofexecution, as we run 300 iterations for each task. Wefurther break down the latency into three parts: theexecution time on the agent or the network, the data-transmission time from the host agent or network mod-ule to the controller, and the execution time on thecontroller. In Figure 7, we plot the average latencyand standard deviation for each part of the three tasks.Task1 finishes one round with a 90th-percentile latencyof 27.8ms, in which the agent takes an average of 17.8msfor measurement and throughput calculation, the datatransmission from 8 hosts to the controller takes an-other 7.7ms, and the controller takes the rest. Havinga different pattern with Task1, Task2 ’s 140.0ms 90th-percentile latency is consisted of 87.5ms of queryingthe switches via Floodlight and 8.9ms of computationon the controller (the transmission time is near zerosince Floodlight is running on the controller machine).Task3 ’s latency increases as it combines the data fromboth hosts and the network, and its CDF also has twostairs due to different responsiveness of the host agentsand the network module.
Table 4 summarizes the average CPU and memoryusages on the host agent and the controller when run-ning the task. The CPU percentage is for one core of8 cores of our testbed machines. The results show thatHONE’s resource usages are bind to the running manage-ment tasks: Tasks3 is the most complex one with flowdetection/rate calculation on the hosts, and having thecontroller join host and network data.
4.3 Effects of Lazy MaterializationHONE lazily materializes the contents of the statistics
tables. We evaluate how much overhead the feature cansave for measurement efficiency in HONE.
We set up two applications (A and B) with 1k ac-tive connections each on a host. We run multiple ma-
Query1 Query2 Query3 Query4 Query5 Query60
200
400
600
800
1000
1200
Late
ncy o
f one m
easure
ment ro
und (
ms)
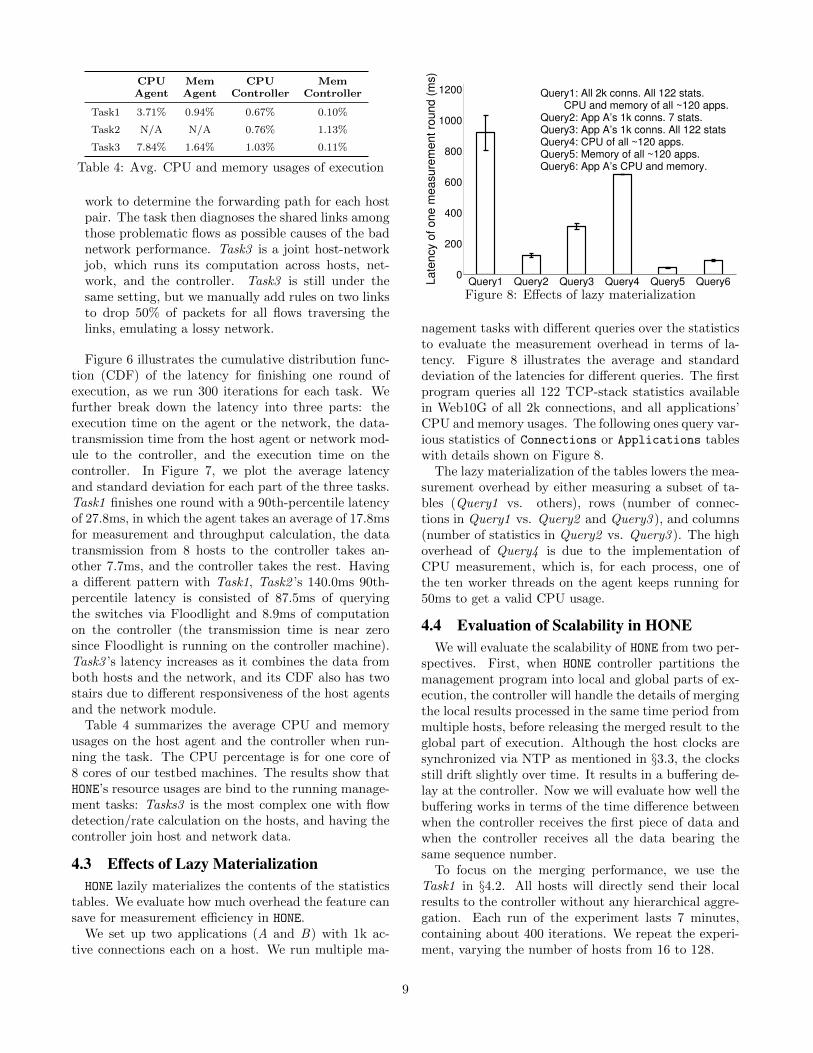
Query1: All 2k conns. All 122 stats. CPU and memory of all ~120 apps.Query2: App A’s 1k conns. 7 stats.Query3: App A’s 1k conns. All 122 statsQuery4: CPU of all ~120 apps.Query5: Memory of all ~120 apps.Query6: App A’s CPU and memory.
Figure 8: Effects of lazy materialization
nagement tasks with different queries over the statisticsto evaluate the measurement overhead in terms of la-tency. Figure 8 illustrates the average and standarddeviation of the latencies for different queries. The firstprogram queries all 122 TCP-stack statistics availablein Web10G of all 2k connections, and all applications’CPU and memory usages. The following ones query var-ious statistics of Connections or Applications tableswith details shown on Figure 8.
The lazy materialization of the tables lowers the mea-surement overhead by either measuring a subset of ta-bles (Query1 vs. others), rows (number of connec-tions in Query1 vs. Query2 and Query3 ), and columns(number of statistics in Query2 vs. Query3 ). The highoverhead of Query4 is due to the implementation ofCPU measurement, which is, for each process, one ofthe ten worker threads on the agent keeps running for50ms to get a valid CPU usage.
4.4 Evaluation of Scalability in HONEWe will evaluate the scalability of HONE from two per-
spectives. First, when HONE controller partitions themanagement program into local and global parts of ex-ecution, the controller will handle the details of mergingthe local results processed in the same time period frommultiple hosts, before releasing the merged result to theglobal part of execution. Although the host clocks aresynchronized via NTP as mentioned in §3.3, the clocksstill drift slightly over time. It results in a buffering de-lay at the controller. Now we will evaluate how well thebuffering works in terms of the time difference betweenwhen the controller receives the first piece of data andwhen the controller receives all the data bearing thesame sequence number.
To focus on the merging performance, we use theTask1 in §4.2. All hosts will directly send their localresults to the controller without any hierarchical aggre-gation. Each run of the experiment lasts 7 minutes,containing about 400 iterations. We repeat the experi-ment, varying the number of hosts from 16 to 128.
9
0.5 2 8 320
0.2
0.4
0.6
0.8
1
Time (ms)
Cu
mu
lative
dis
trib
utio
n f
un
ctio
n
Number of Hosts: 16Number of Hosts: 32Number of Hosts: 64Number of Hosts: 128
Figure 9: Controller’s buffering delay ofmerging data from multiple host agents
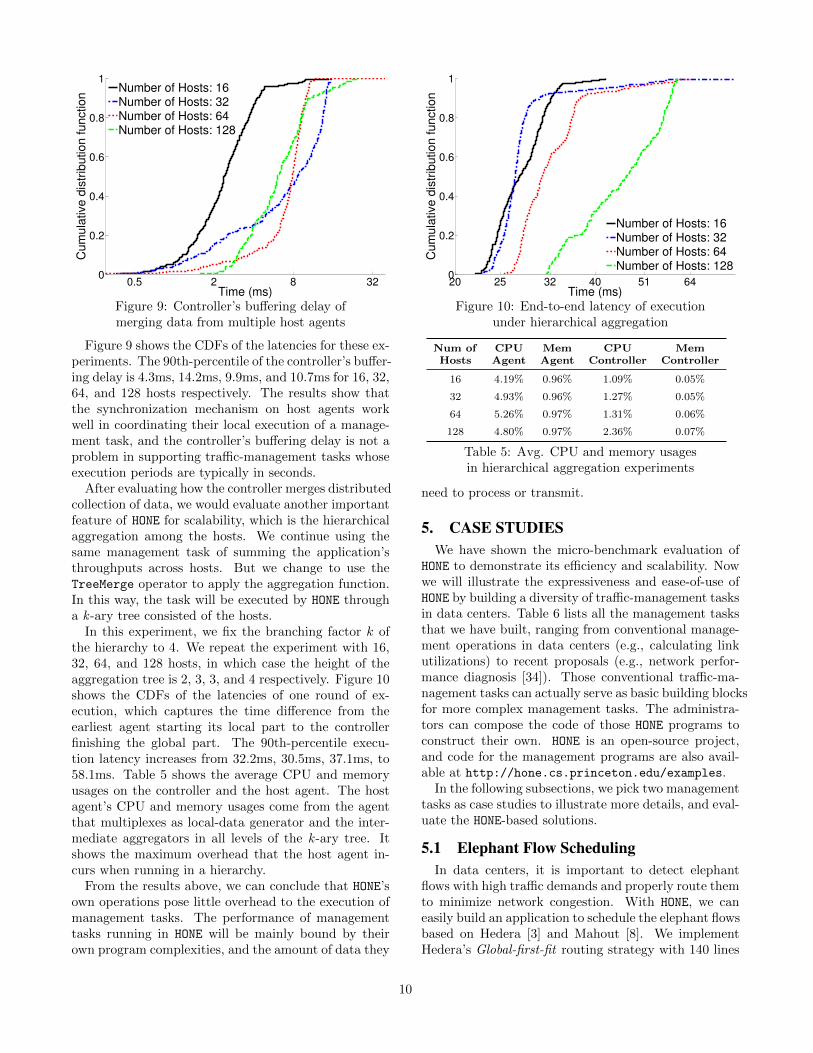
Figure 9 shows the CDFs of the latencies for these ex-periments. The 90th-percentile of the controller’s buffer-ing delay is 4.3ms, 14.2ms, 9.9ms, and 10.7ms for 16, 32,64, and 128 hosts respectively. The results show thatthe synchronization mechanism on host agents workwell in coordinating their local execution of a manage-ment task, and the controller’s buffering delay is not aproblem in supporting traffic-management tasks whoseexecution periods are typically in seconds.
After evaluating how the controller merges distributedcollection of data, we would evaluate another importantfeature of HONE for scalability, which is the hierarchicalaggregation among the hosts. We continue using thesame management task of summing the application’sthroughputs across hosts. But we change to use theTreeMerge operator to apply the aggregation function.In this way, the task will be executed by HONE througha k -ary tree consisted of the hosts.
In this experiment, we fix the branching factor k ofthe hierarchy to 4. We repeat the experiment with 16,32, 64, and 128 hosts, in which case the height of theaggregation tree is 2, 3, 3, and 4 respectively. Figure 10shows the CDFs of the latencies of one round of ex-ecution, which captures the time difference from theearliest agent starting its local part to the controllerfinishing the global part. The 90th-percentile execu-tion latency increases from 32.2ms, 30.5ms, 37.1ms, to58.1ms. Table 5 shows the average CPU and memoryusages on the controller and the host agent. The hostagent’s CPU and memory usages come from the agentthat multiplexes as local-data generator and the inter-mediate aggregators in all levels of the k -ary tree. Itshows the maximum overhead that the host agent in-curs when running in a hierarchy.
From the results above, we can conclude that HONE’sown operations pose little overhead to the execution ofmanagement tasks. The performance of managementtasks running in HONE will be mainly bound by theirown program complexities, and the amount of data they
20 25 32 40 51 640
0.2
0.4
0.6
0.8
1
Time (ms)
Cu
mu
lative
dis
trib
utio
n f
un
ctio
n
Number of Hosts: 16Number of Hosts: 32Number of Hosts: 64Number of Hosts: 128
Figure 10: End-to-end latency of executionunder hierarchical aggregation
Num of CPU Mem CPU MemHosts Agent Agent Controller Controller
16 4.19% 0.96% 1.09% 0.05%
32 4.93% 0.96% 1.27% 0.05%
64 5.26% 0.97% 1.31% 0.06%
128 4.80% 0.97% 2.36% 0.07%
Table 5: Avg. CPU and memory usagesin hierarchical aggregation experiments
need to process or transmit.
5. CASE STUDIESWe have shown the micro-benchmark evaluation of
HONE to demonstrate its efficiency and scalability. Nowwe will illustrate the expressiveness and ease-of-use ofHONE by building a diversity of traffic-management tasksin data centers. Table 6 lists all the management tasksthat we have built, ranging from conventional manage-ment operations in data centers (e.g., calculating linkutilizations) to recent proposals (e.g., network perfor-mance diagnosis [34]). Those conventional traffic-ma-nagement tasks can actually serve as basic building blocksfor more complex management tasks. The administra-tors can compose the code of those HONE programs toconstruct their own. HONE is an open-source project,and code for the management programs are also avail-able at http://hone.cs.princeton.edu/examples.
In the following subsections, we pick two managementtasks as case studies to illustrate more details, and eval-uate the HONE-based solutions.
5.1 Elephant Flow SchedulingIn data centers, it is important to detect elephant
flows with high traffic demands and properly route themto minimize network congestion. With HONE, we caneasily build an application to schedule the elephant flowsbased on Hedera [3] and Mahout [8]. We implementHedera’s Global-first-fit routing strategy with 140 lines
10
Management Task Lines of Code
Summing application’s throughputs 70
Monitoring CPU and memory usages 24
Collecting connection TCP statistics 19
Calculating traffic matrix 85
Calculating link utilizations 48
Discovering network topology 51
Network performance diagnosis 56
HONE’s directory service 31
Elephant flow scheduling 140
Distributed rate limiting 74
Table 6: Traffic-management tasks we build in HONE.Source available at http://hone.cs.princeton.edu/
of code in HONE. The code of the management task hasbeen already shown in previous sections as an example.
We deploy HONE on EC2 instances to emulate a data-center network with a 8-host-10-switch fat-tree topology(the switches are instances running Open vSwitch). Werepeat an all-to-all data shuffle of 500MB (i.e., a 28GBshuffle) for 10 times. The HONE-based solution finishesthe data shuffle with an average of 82.7s, compared to103.1s of using ECMP. The improvement over shuffletime is consistent with Hedera’s result.
5.2 Distributed Rate LimitingDistributed rate limiting in data centers is used to
control the aggregate network bandwidth used by anapplication, which runs on multiple hosts. It can helpthe application’s owner to control the total cost of usinga pay-per-use cloud provider.
Prior works [25, 26] proposed mechanisms to makedistributed rate-limiters collaborate as a single, aggre-gate global limiter inside the network. HONE enablesdistributed rate limiting from the host side, which in-troduces less overhead as the hosts have more compu-tational power than the switches, and better visibilityinto the traffic demand of applications.
In HONE, the administrators do not need to worryabout the complexity of collecting throughputs frommultiple hosts in a synchronized way. Instead, they justneed to write a simple program that sums up through-puts of an application’s connections on each host, aggre-gates the throughputs across hosts, and then calculatestheir rate-limiting policies accordingly. The code writ-ten in HONE are shown below:
def DistributedRateLimiting ():(Select ([App , SrcIp , DstIp ,
BytesSent , Timestamp ]) *From(Connections) *Where(App == X) *Every(Seconds 1) ) >>
ReduceSet(CalculateThroughput , {}) >>
0 10 30 50 70 90 110 130 1500
20
40
60
80
100
120
140
Time (second)
Rate
(M
bps)
AggregateHost 1Host 2Host 3Host 4Host 5
Figure 11: Time series of rates for an application.Every 10 seconds, a host launches the application.
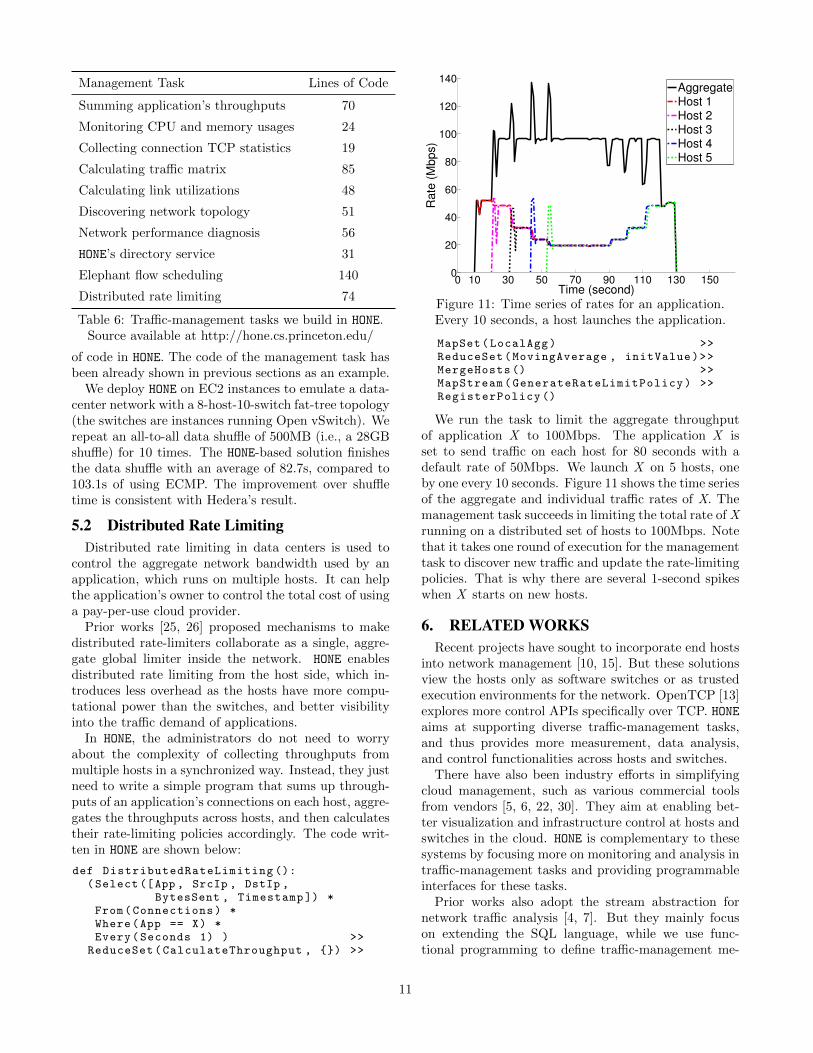
MapSet(LocalAgg) >>ReduceSet(MovingAverage , initValue)>>MergeHosts () >>MapStream(GenerateRateLimitPolicy) >>RegisterPolicy ()
We run the task to limit the aggregate throughputof application X to 100Mbps. The application X isset to send traffic on each host for 80 seconds with adefault rate of 50Mbps. We launch X on 5 hosts, oneby one every 10 seconds. Figure 11 shows the time seriesof the aggregate and individual traffic rates of X. Themanagement task succeeds in limiting the total rate of Xrunning on a distributed set of hosts to 100Mbps. Notethat it takes one round of execution for the managementtask to discover new traffic and update the rate-limitingpolicies. That is why there are several 1-second spikeswhen X starts on new hosts.
6. RELATED WORKSRecent projects have sought to incorporate end hosts
into network management [10, 15]. But these solutionsview the hosts only as software switches or as trustedexecution environments for the network. OpenTCP [13]explores more control APIs specifically over TCP. HONEaims at supporting diverse traffic-management tasks,and thus provides more measurement, data analysis,and control functionalities across hosts and switches.
There have also been industry efforts in simplifyingcloud management, such as various commercial toolsfrom vendors [5, 6, 22, 30]. They aim at enabling bet-ter visualization and infrastructure control at hosts andswitches in the cloud. HONE is complementary to thesesystems by focusing more on monitoring and analysis intraffic-management tasks and providing programmableinterfaces for these tasks.
Prior works also adopt the stream abstraction fornetwork traffic analysis [4, 7]. But they mainly focuson extending the SQL language, while we use func-tional programming to define traffic-management me-
11
chanisms more expressively. Further, some of theseworks [4, 23] focus on a specific problem (e.g., intru-sion detection) when designing their programming lan-guage, while HONE aims for a more generic programminginterface for traffic management.
Finally, there are recent works proposing network pro-gramming languages, such as ProgME [36], Frenetic [12],OpenSketch [35], and Netcalls [27]. They focus on amuch narrower class of programming units–raw packetsor traffic counters on a single switch, while HONE mainlymoves the programmability to the end hosts, aims at anextensible platform for various types of measurement,and encompasses a joint host-network scenario.
7. CONCLUSIONHONE is a programmable and scalable platform for
joint host-network traffic management in data centers.HONE offers data-center administrators (i) an integratedmodel of diverse, fine-grained statistics from both hostsand switches and (ii) a simple, expressive, centralizedprogramming framework for defining the measurement,analysis, and control functionality of traffic-managementtasks. The programming framework combines a domain-specific query language with a data-parallel analysisframework and a reactive control schema. The systemscales through lazy materialization of the measurementdata, filtering and aggregating data on each host, andperforming hierarchical aggregation of data across mul-tiple hosts. Micro-benchmarks and experiments withreal management tasks demonstrate the performanceand expressiveness of our system.
In our future work, we plan to build a wider range ofmanagement tasks, both to further demonstrate HONE’sexpressiveness and to continue optimizing our proto-type’s performance. In addition, we plan to includemore support for virtual-machine environment, such asadding VM-level monitoring and migration, and sup-port for more robustness, such as preventing the hostagents and the controller from becoming overloaded.We believe that these capabilities, along with our exist-ing support for programmable and scalable traffic ma-nagement, can make HONE an invaluable platform fordata-center administrators.
References[1] Event Tracing for Windows. http://support.microsoft.
com/kb/2593157.[2] M. Al-Fares, A. Loukissas, and A. Vahdat. A Scalable, Com-
modity Data Center Network Architecture. In ACM SIG-COMM, 2008.
[3] M. Al-Fares, S. Radhakrishnan, B. Raghavan, N. Huang,and A. Vahdat. Hedera: Dynamic Flow Scheduling for DataCenter Networks. In USENIX NSDI, April 2010.
[4] K. Borders, J. Springer, and M. Burnside. Chimera: ADeclarative Language for Streaming Network Traffic Ana-lysis. In USENIX Security, 2012.
[5] Boundary. http://www.boundary.com/.[6] Cisco Cloud Management Tools. http://www.cisco.com/en/
US/netsol/ns1133/index.html.
[7] C. Cranor, T. Johnson, O. Spataschek, and V. Shkapenyuk.Gigascope: A Stream Database for Network Applications. InACM SIGMOD, 2003.
[8] A. Curtis, W. Kim, and P. Yalagandula. Mahout: Low-Overhead Datacenter Traffic Management using End-Host-Based Elephant Detection. In IEEE INFOCOM, 2011.
[9] J. Dean and S. Ghemawat. MapReduce: Simplified DataProcessing on Large Clusters. In USENIX OSDI, 2004.
[10] C. Dixon, H. Uppal, V. Brajkovic, D. Brandon, T. Anderson,and A. Krishnamurthy. ETTM: A Scalable Fault TolerantNetwork Manager. In USENIX NSDI, 2011.
[11] FloodLight. http://floodlight.openflowhub.org/.[12] N. Foster, R. Harrison, M. J. Freedman, C. Monsanto,
J. Rexford, A. Story, and D. Walker. Frenetic: A NetworkProgramming Language. In ACM ICFP, 2011.
[13] M. Ghobadi, S. H. Yeganeh, and Y. Ganjali. Rethinking End-to-End Congestion Control in Software-Defined Networks. InACM HotNets, Oct. 2012.
[14] C.-Y. Hong, M. Caesar, and P. B. Godfrey. Finishing FlowsQuickly with Preemptive Scheduling. In ACM SIGCOMM,2012.
[15] T. Karagiannis, R. Mortier, and A. Rowstron. Network Ex-ception Handlers: Host-network Control in Enterprise Net-works. In ACM SIGCOMM, 2008.
[16] Linux Advanced Routing & Traffic Control. http://www.lartc.org/.
[17] M. Mathis, J. Heffner, and R. Raghunarayan. TCP ExtendedStatistics MIB. RFC 4898, May 2007.
[18] N. McKeown, T. Anderson, H. Balakrishnan, G. Parulkar,L. Peterson, J. Rexford, S. Shenker, and J. Turner. Open-Flow: Enabling Innovation in Campus Networks. ACMCCR, 38(2):69–74, 2008.
[19] Netfilter.org. http://www.netfilter.org/.[20] NTP: The Network Time Protocol. http://www.ntp.org/.[21] Open vSwitch. http://openvswitch.org/.[22] OpenTSDB Project. http://www.opentsdb.net/.[23] X. Ou, S. Govindavajhala, and A. W. Appel. MulVAL: A
Logic-based Network Security Analyzer. In USENIX Secu-rity, 2005.
[24] B. Pfaff, J. Pettit, K. Amidon, M. Casado, T. Koponen, andS. Shenker. Extending networking into the virtualizationlayer. In ACM HotNets, Oct. 2009.
[25] L. Popa, G. Kumar, M. Chowdhury, A. Krishnamurthy,S. Ratnasamy, and I. Stoica. FairCloud: Sharing the Net-work in Cloud Computing. In ACM SIGCOMM, 2012.
[26] B. Raghavan, K. Vishwanath, S. Ramabhadran, K. Yocum,and A. C. Snoeren. Cloud Control with Distributed RateLimiting. In ACM SIGCOMM, 2007.
[27] J. Sherry, D. C. Kim, S. S. Mahalingam, A. Tang, S. Wang,and S. Ratnasamy. Netcalls: End Host Function Callsto Network Traffic Processing Services. Technical ReportUCB/EECS-2012-175, U.C. Berkeley, 2012.
[28] A. Shieh, S. Kandula, A. Greenberg, C. Kim, and B. Saha.Sharing the Data Center Network. In USENIX NSDI, 2011.
[29] R. van Renesse and A. Bozdog. Willow: DHT, Aggregation,and Publish/Subscribe in One Protocol. In IPTPS, 2004.
[30] VMWare vCenter Suite. http://www.vmware.com/products/datacenter-virtualization/vcenter-operations-management/overview.html.
[31] Web10G Project. http://web10g.org/.[32] C. Wilson, H. Ballani, T. Karagiannis, and A. Rowtron. Bet-
ter Never Than Late: Meeting Deadlines in Datacenter Net-works. In ACM SIGCOMM, 2011.
[33] P. Yalagandula and M. Dahlin. A Scalable Distributed In-formation Management System. In ACM SIGCOMM, 2004.
[34] M. Yu, A. Greenberg, D. Maltz, J. Rexford, L. Yuan, S. Kan-dula, and C. Kim. Profiling Network Performance for Multi-tier Data Center Applications. In USENIX NSDI, 2011.
[35] M. Yu, L. Jose, and R. Miao. Software Defined Traffic Mea-surement with OpenSketch. In USENIX NSDI, April 2013.
[36] L. Yuan, C.-N. Chuah, and P. Mohapatra. ProgME: TowardsProgrammable Network Measurement. In ACM SIGCOMM,August 2007.
[37] D. Zats, T. Das, P. Mohan, D. Borthakur, and R. Katz. De-Tail: Reducing the Flow Completion Time Tail in DatacenterNetworks. In ACM SIGCOMM, 2012.
12