Embed Size (px)
Citation preview

Productivity and geography
John Daley, CEO, Grattan Institute Productivity Commission Conference, Canberra
12 December 2016

2
Productivity and geography Allowing jobs to concentrated in the centre of big cities may increase productivity • Services are growing much faster than other sectors • This services growth is concentrated towards the centre of big cities • Employer choices and outcomes suggest that there are productivity
benefits (and perhaps rents?) from agglomeration
Government can fail to support central city growth; it can’t do much to encourage regional growth • Infrastructure investment has not matched economic growth • Reforming planning and housing policy may well yield economic benefits
These economic patterns have political costs • In Australia and around the world, politics is dividing between
cosmopolitanism and nationalism – corresponding to cities and regions • The divisions are both economic and cultural

3
0
20
40
60
80
1960 1965 1970 1975 1980 1985 1990 1995 2000 2005 2010
Goods
Services
Notes: Excludes “rents and dwelling costs” and “other goods and services”. Based on seasonally adjusted current prices data Source: http://grattan.edu.au/wp-content/uploads/2015/10/Capital-City-Lord-Mayors-for-web-pptx.pdf
People are consuming more services Share of total nominal household expenditure
4 Source: ABS 6291
Services growth accelerated in the last 5 years Cumulative employment growth since 2010 000 people, trend
-200
-100
0
100
200
300
400
500
2010 2012 2014 2016 2010 2012 2014 2016
Mining
Manufacturing
W’sale, retail, logistics
Construction
Ag, utilities
Education & health
Business & other services
Admin, public admin
Accomm, food, recreation
5
0 10 20 30 40 50 60 70 80 90
100
$bn
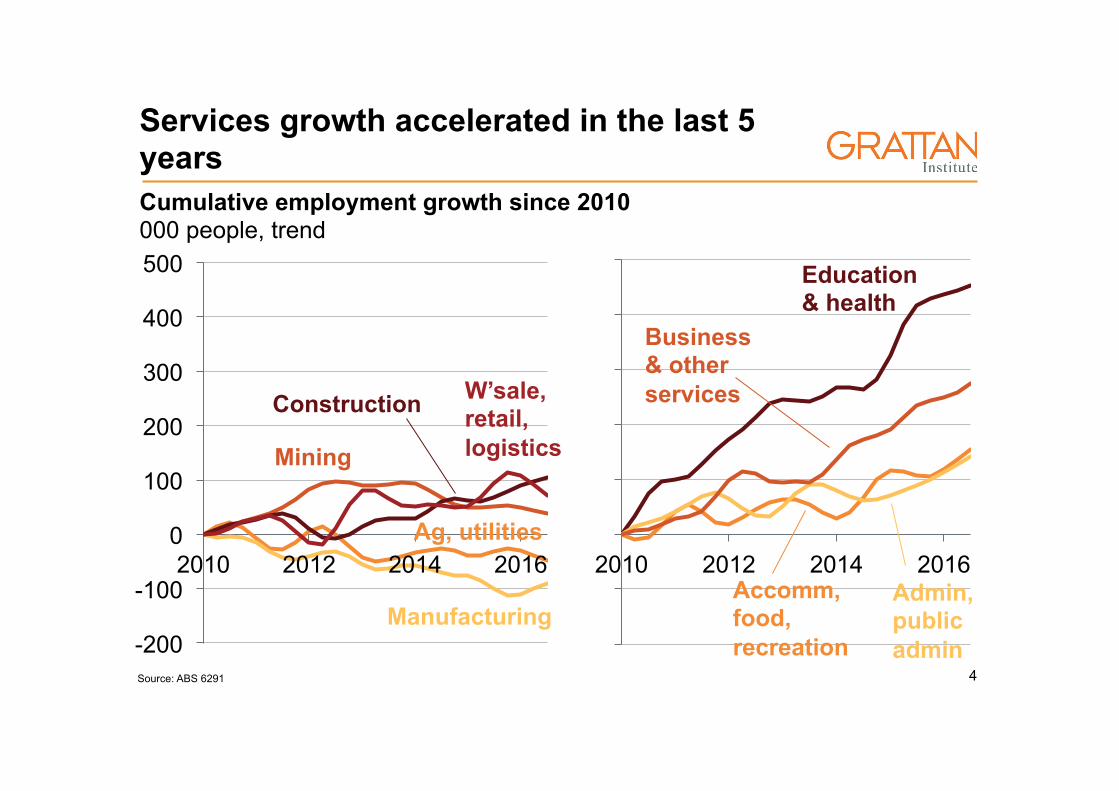
Australia’s economy is now dominated by its big cities Australian economic activity, 2015-16 Per cent of State total
NSW Vic Qld WA SA Tas/ ACT/NT
Sydney Melbourne Brisbane Perth
Ade
laid
e
0 200 400 600 800 1000 1200
SE Qld
SGS Economics & Planning , GDP by major capital city, 2015-16
Hob
art/C
anbe
rra/
Dar
win
1400 1600

6
-10 0
10 20 30 40 50 60 70
The geography of job growth changed about 2008 Employment growth, Sydney and Melbourne
Inner (~0-2km)
‘000
Grattan analysis, BITRE
Employment growth, United States
Did central city growth happen because of or despite government policy?
-500
0
500
1000
1500
2000
2500
3000
‘000
2002-07 2007-11
City Observatory, Surging city centre job growth
Middle (~2-15km)
Outer (>15km)
City centre
Metro ex centre
2001 -06
2006 -11
Sydney Melbourne

7
Small business is increasingly dispersed Change in number of businesses, Payroll < $500,000
Change in businesses Increase Decrease
2007-2011
2011-2016
Bruce Rasmussen, VU, using Workcover data, http://www.vises.org.au/documents/2016_%20Rasmussen_MEF_Changing_Business_Location.pdf
200 400 600
200 400 600

8
Big business is increasingly centralised Change in number of businesses, Payroll $1m to $10m
Change in businesses
200 400 600
Increase Decrease
2007-2011
2011-2016
Bruce Rasmussen, VU, using Workcover data, http://www.vises.org.au/documents/2016_%20Rasmussen_MEF_Changing_Business_Location.pdf
200 400 600

9
Economic output per hour is particularly concentrated in Melbourne Economic activity per working hour, 2011-12, Melbourne
Grattan analysis of ABS data in Mapping Australia’s Economy
Airport: $63
CBD: $86
Southbank:$76
Docklands: $103
Dandenong: $44kilometres0 10
>$90$80-90$70-80$60-70$50-60$40-50<$40Insufficient data

10
Sydney is a little less concentrated, with an unusual “northern arc” Economic activity per working hour, 2011-12
Grattan analysis of ABS data in Mapping Australia’s Economy
Parramatta:$68
Macquarie Park: $81
North Sydney:$91
CBD: $100
Airport: $65
kilometres0 10
>$90$80-90$70-80$60-70$50-60$40-50<$40Insufficient data
11
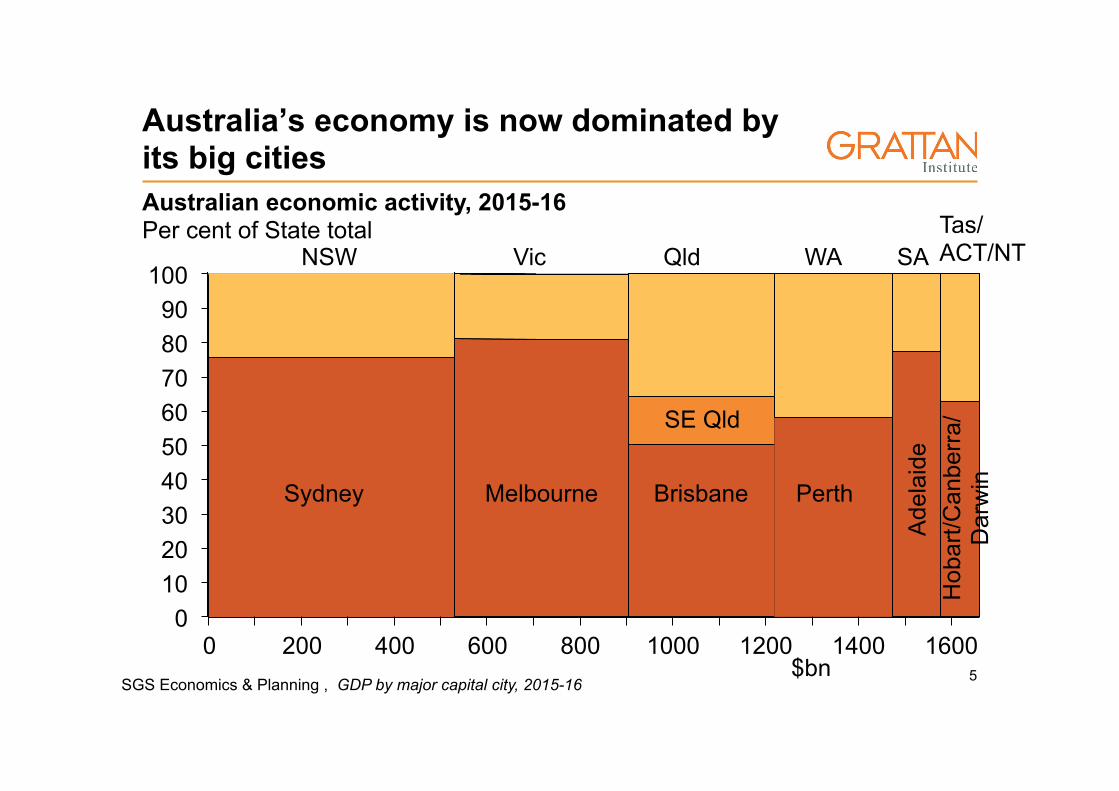
Why are the centres of big cities growing so fast? In a services economy, physical proximity matters • Medial papers are more likely to be influential if the authors sit close
together • People in businesses in bigger cities communicate more with people in other
companies – in person, over the phone, and over the internet • Before we do real business with another company, our first instinct is to
meet face to face
Communications technology increases the importance of being close to others • The rise of communications technology (telegraph, telephone, fax, internet)
has consistently increased the value of being physically close to each other • The first companies to limit remote working and insist on physical proximity
between their staff were … technology companies

12
Productivity and geography Allowing jobs to concentrated in the centre of big cities may increase productivity • Services are growing much faster than other sectors • This services growth is concentrated towards the centre of big cities • Employer choices and outcomes suggest that there are productivity
benefits (and perhaps rents?) from agglomeration
Government can fail to support central city growth; it can’t do much to encourage regional growth • Infrastructure investment has not matched economic growth • Reforming planning and housing policy may well yield economic benefits
These economic patterns have political costs • In Australia and around the world, politics is dividing between
cosmopolitanism and nationalism – corresponding to cities and regions • The divisions are both economic and cultural
13
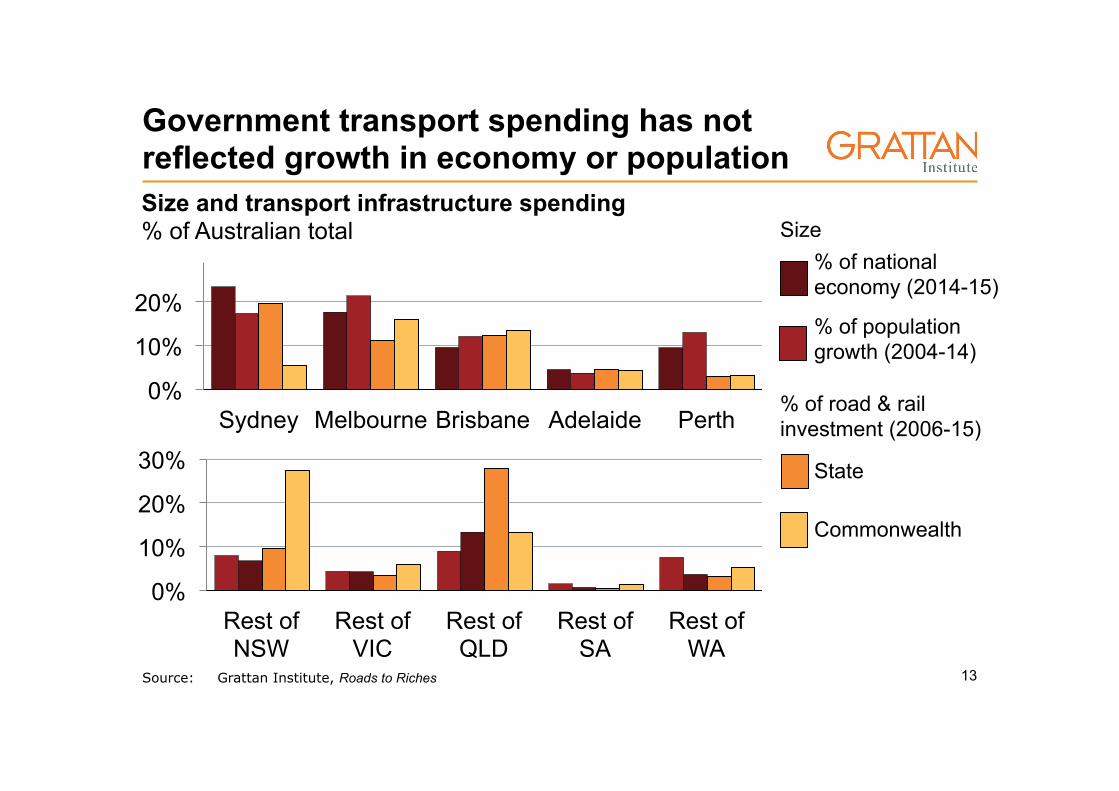
0%
10%
20%
Sydney Melbourne Brisbane Adelaide Perth
0%
10%
20%
30%
Rest of NSW
Rest of VIC
Rest of QLD
Rest of SA
Rest of WA
% of national economy (2014-15)
% of population growth (2004-14)
% of road & rail investment (2006-15)
State
Commonwealth
Size Size and transport infrastructure spending % of Australian total
Government transport spending has not reflected growth in economy or population
Source: Grattan Institute, Roads to Riches

14
Those living in Sydney’s west can’t reach many jobs by car Percentage of Sydney jobs that can be reached in 45 minutes by car
SGS Economics & Planning
>5040-5030-4020-3010-20<10
Parramatta
MacquariePark
CBD
Airport
kilometres0 10

15
Women in poorly-connected areas face especially difficult compromises Differences in male and female workforce participation by suburb, Sydney 2011
Grattan analysis of ABS data in Productive Cities

16
0
1,000
2,000
3,000
4,000
5,000
6,000
Population density has increased, but not much in the middle ring
Sydney Melbourne Brisbane Perth Adelaide
Population density, 1981 and 2011
5 10 15 20 25 30 Distance to GPO, km
1981 2011
Source: Coffee et al, “Visualising 30 Years of Population Density Change”

17
Productivity and geography Allowing jobs to concentrated in the centre of big cities may increase productivity • Services are growing much faster than other sectors • This services growth is concentrated towards the centre of big cities • Employer choices and outcomes suggest that there are productivity
benefits (and perhaps rents?) from agglomeration
Government can fail to support central city growth; it can’t do much to encourage regional growth • Infrastructure investment has not matched economic growth • Reforming planning and housing policy may well yield economic benefits
These economic patterns have political costs • In Australia and around the world, politics is dividing between
cosmopolitanism and nationalism – corresponding to cities and regions • The divisions are both economic and cultural

18
Perth
Adelaide
Melbourne
Sydney
Brisbane
Source: AEC, Grattan Institute analysis
Political geography in Australia is reflecting economic and social trends 1st preference Senate votes 2016 to larger parties (LNP, Labor, Greens) More than:
85% 80% 75% 70% 65% 60% <60%
“Ordinary Australians do have a common enemy, but it is not Aborigines, Asians, or people of any particular colour, race or creed. Our common oppressors are a class of raceless, placeless cosmopolitan elites who are exercising almost absolute power over us.”
Pauline Hanson, The Truth (1997) Source: AEC, Grattan Institute analysis

19
The geographic divide is growing wider politically
0%
10%
20%
30%
40%
1 10 100 1000
2004
2007
2010 2013
2016
Source: AEC, Grattan Institute analysis
1st preference Senate votes to minor parties (not LNP, Labor, Greens) LOIS
Distance to State GPO (km)

20 Source: AEC, Grattan Institute analysis
Distance to State GPO (km) (log scale)
0% 10% 20% 30% 40% 50%
1 10 100 1000
0% 10% 20% 30% 40%
1 10 100 1000
10% 20% 30% 40% 50%
1 10 100 1000
Proportion minor parties
20,000 30,000 40,000 50,000 60,000
1 10 100 1000
Average income
Qld SA
NT
ACT NSW
Vic
Tas WA
Qld SA
NT
ACT NSW Vic
Tas
WA
Qld
SA
NT ACT
NSW Vic
Tas WA
Qld
SA
NT ACT
NSW
Vic Tas WA
Minor party votes and geography also correlate with education, income, & migrants Proportion higher education
Proportion foreign born

21
Productivity and geography Allowing jobs to concentrated in the centre of big cities may increase productivity • Services are growing much faster than other sectors • This services growth is concentrated towards the centre of big cities • Employer choices and outcomes suggest that there are productivity
benefits (and perhaps rents?) from agglomeration
Government can fail to support central city growth; it can’t do much to encourage regional growth • Infrastructure investment has not matched economic growth • Reforming planning and housing policy may well yield economic benefits
These economic patterns have political costs • In Australia and around the world, politics is dividing between
cosmopolitanism and nationalism – corresponding to cities and regions • The divisions are both economic and cultural

![Bill Daley Owes Chicagoans More Than Rhetoric … Daley Parking Meter Pres...Crain’s Chicago Business. June 28, 2007.] VallasForAllChicago.com 4 ! In 2008, while Bill Daley was Midwest](https://img.pdfslide.us/doc/110x75/5f2b8bc91107834737095cde/bill-daley-owes-chicagoans-more-than-rhetoric-daley-parking-meter-pres-crainas.jpg)