Embed Size (px)
Citation preview
Environment for Development
Discussion Paper Series October 2009 EfD DP 09-22
Production Risk and Farm Technology Adoption in Rain-Fed, Semi-Arid Lands of Kenya
Maur ice Juma , Wi l f red Nya ngena , and Mahm ud Yesuf
Environment for Development
The Environment for Development (EfD) initiative is an environmental economics program focused on international research collaboration, policy advice, and academic training. It supports centers in Central America, China, Ethiopia, Kenya, South Africa, and Tanzania, in partnership with the Environmental Economics Unit at the University of Gothenburg in Sweden and Resources for the Future in Washington, DC. Financial support for the program is provided by the Swedish International Development Cooperation Agency (Sida). Read more about the program at www.efdinitiative.org or contact [email protected].
Central America Environment for Development Program for Central America Centro Agronómico Tropical de Investigacíon y Ensenanza (CATIE) Email: [email protected]
China Environmental Economics Program in China (EEPC) Peking University Email: [email protected]
Ethiopia Environmental Economics Policy Forum for Ethiopia (EEPFE) Ethiopian Development Research Institute (EDRI/AAU) Email: [email protected]
Kenya Environment for Development Kenya Kenya Institute for Public Policy Research and Analysis (KIPPRA) Nairobi University Email: [email protected]
South Africa Environmental Policy Research Unit (EPRU) University of Cape Town Email: [email protected]
Tanzania Environment for Development Tanzania University of Dar es Salaam Email: [email protected]
© 2009 Environment for Development. All rights reserved. No portion of this paper may be reproduced without permission of the authors.
Discussion papers are research materials circulated by their authors for purposes of information and discussion. They have not necessarily undergone formal peer review.
Production Risk and Farm Technology Adoption in Rain-Fed, Semi-Arid Lands of Kenya
Maurice Juma, Wilfred Nyangena, and Mahmud Yesuf
Abstract This study provides empirical evidence on the effects of production risk on farm technology
adoption among small holder farmers using plot-level data collected from two semi-arid districts in Kenya, Machakos, and Taita Taveta. We employed a two-stage approach to estimate a production function, and computed the mean and the production risk factors (both variance and skewness) from a production function using Antle’s (1983, 1987) moment-based approach. We then used these moment estimates, together with other household and plot-level characteristics in a pseudo-fixed effect probit model to determine the effects of production risk and farm and household-level variables on households’ decisions to adopt different kinds of farm technologies. In our estimations, by means of Mundlak’s approach (1978), we controlled for unobserved heterogeneities that could potentially be correlated to some of the observed explanatory variables and otherwise bias our estimates. We also addressed the potential endogeneity issues in our estimation using a two-stage IV estimation procedure.
Our results showed that, among others, yield variability and the risk of crop failures indeed affect technology adoption decisions in low-income, rain-fed agriculture. But, the direction and magnitude of effects depend on the farm technology under consideration. The results explain why poor farm households in rain-fed and risky production environments are reluctant to adopt new farm technologies with potential production gain because, at the same time, they involve enormous down-side risks. This result underscores the fact that productivity gains are necessary, but not sufficient, conditions to attract farmers to adopt new technologies and agricultural innovations. Risk implications matter. Technology- and location-specific production-risk coping strategies need to be designed to successfully upscale profitable farm technologies across poor farm households in low income countries.
Key Words: farm productivity, Kenya, production risk, farm technology adoption
JEL Classification: D81, Q12, Q18
Contents
Introduction ............................................................................................................................. 1
1. Literature on Poverty, Risk Exposure and Farm Technology Adoption ...................... 3
2. Conceptual Framework ...................................................................................................... 4
3. Empirical Methodology ...................................................................................................... 6
4. The Data ............................................................................................................................... 8
5. Results and Discussion ........................................................................................................ 9
5.1 The Production Model Results.................................................................................... 10
5.2 The Adoption Model Results ...................................................................................... 11
6. Summary and Policy Recommendations ........................................................................ 16
References .............................................................................................................................. 18
Environment for Development Juma, Nyangena, and Yesuf
1
Production Risk and Farm Technology Adoption in Rain-Fed, Semi-Arid Lands of Kenya
Maurice Juma, Wilfred Nyangena, and Mahmud Yesuf∗
Introduction
In sub-Saharan Africa, more than 70 percent of the poor live in rural areas. The rural poor are very dependent on their natural resource base, particularly soil and its productive capacity. The main physical asset of poor farmers is land. Its contribution to farmer’s income is far more important than physical capital. Yet, land degradation in the form of soil erosion and nutrient depletion pose a threat to food security and sustainability of agricultural production, particularly in less favored dry-land areas. In Kenya, the magnitude of soil erosion losses to the economy has been estimated as equivalent to US$ 390 million annually or 3.8 percent of gross domestic product (Cohen et al. 2006). In response government and development partners have devoted substantial resources to improve environmental conditions and increase agricultural productivity. In particular, the use of modern farm technology—such as soil and water conservation technologies (SWC) and fertilizer—that would enable farmers to increase their productivity while conserving the soil capital has been emphasized as a possible solution (World Bank 2008; SRA 2004). However, adoption of modern technology has been limited in most of sub-Saharan Africa. This is particularly the case in Kenya, where small-scale agriculture remains characterized by little use of external inputs, soil erosion, and high nutrient depletion. The government has initiated extension worker programs to promote the adoption of improved technology. Despite these concerted efforts by government and development partners, the adoption rate of improved farm technology remains disappointingly low.
Many questions about the determinants of farm technology adoption remain unclear. Previous research has been devoted on individual and plot characteristics. (See Feder, Just, and Zilberman [1985] for a detailed survey.) Other recent studies have
∗ All authors: Maurice Juma, EfD-Kenya, Kenya Institute for Public Policy Research and Analysis (KIPPRA), Bishops Garden Towers, Bishops Road, Box 56445-00200, Nairobi, Kenya (tel) +254 20 2719933/4, (fax) +254 202719951, (email) [email protected]; Wilfred Nyangena, EfD-Kenya, Kenya Institute for Public Policy Research and Analysis (KIPPRA), Bishops Garden Towers, Bishops Road, Box 56445-00200, Nairobi, Kenya (tel) +254 20 2719933/4, (fax) +254 202719951, (email) [email protected]; Mahmud Yesuf, EfD-Kenya, Kenya Institute for Public Policy Research and Analysis (KIPPRA), Bishops Garden Towers, Bishops Road, Box 56445-00200, Nairobi, Kenya (tel) +254 20 2719933/4, (fax) +254 202719951, (email) [email protected].

Environment for Development Juma, Nyangena, and Yesuf
2
explored the role of social factors on technology adoption (Foster and Rosenzweig 1995; Nyangena 2008). A key element missing from the research is lack of empirical analysis on the role of risk in investing in technology and production effects among low-income farmers. Production risk is an important element in agricultural production decisions, particularly in the uptake of farm technology. If poor people are risk averse, they will be reluctant to invest in modern technology because that involves taking risks; thus, they will remain poor in absence of mechanisms to minimize the downside effects (Antle 1983; Dercon 2004). For risk-averse individuals, an increase in variance with enormous downside risk may make the individual worse off. Only economically secure farmers who are in possession of sufficient defense against downside risk will undertake profitable capital investments and innovations, while the majority of the poor remains caught in a risk-induced poverty trap (Eswaran and Kotwal 1990; Rosenzweig and Binswanger 1993; Mosley and Verschoor 2005; Dercon and Christiansen, 2007; Yesuf and Bluffstone, 2009).
Despite the significant role that risk exposure plays in production decisions, empirical literature looking into the role of production on farm investment decisions in low income rain-fed agriculture is scanty. Notable exceptions are the works of Koundouri et al. (2006), Groom et al. (2008), and Kassie et al. (2008). With the exception of Kassie et al. (2008), others used cross-sectional data and econometric approaches that left the unobserved heterogeneities uncontrolled for. If correlated to some of the observed factors that could potentially create inconsistency and bias in the parameter estimates, it could lead to the wrong policy conclusions. In this study, we used plot-level data that mimics the major features of panel data and also employed a pseudo-fixed effect econometric approach to control for unobserved heterogeneities. Unlike the above three studies, we also employed a two-stage instrumental variable estimation approach to address the potential endogeneity problems involved in our estimation. Our study extends the literature on farm technology adoption in low-income countries by bringing out the issue of risk exposure through more robust and alternative estimation procedures.
The data used in this study was collected by the International Food Policy Research Institute (IFPRI) in 2003 from 321 maize-growing households in two districts, Taita Taveta and Machakos, found in an arid region of Kenya. The data was collected at plot level and is rich with details of households and plots. Manure, chemical fertilizer, and terracing are the major farm technologies adopted in our study sites and, hence, are the only ones considered in our study.
Our choice of maize is premised on the fact that maize is a key food crop in Kenya, constituting 3 percent of Kenya’s overall GDP, 12 percent of agricultural GDP, and 21
Environment for Development Juma, Nyangena, and Yesuf
3
percent of the total value of primary agricultural commodities (Government of Kenya, 1998). Maize cultivation occupies about 1.4 million hectares of land in the country, with 25 percent of large-scale farmers and 75 percent of small-scale farmers engaged in its production. Productivity of maize has been on a downward trend since the 1970s, a period that was preceded by a fairly successful maize green revolution. Pingali (2001) estimates per capita maize production at 79 kg and consumption at 103 kg, implying that the country is increasingly importing more maize.
The rest of the paper is organized as follows. We present a brief overview of literature in section 1. In section 2, we discuss the conceptual framework used to analyze the farmers’ adoption decisions in the presence of production risk; section 3 includes the econometric specification. The descriptive statistics of the data are discussed in section 4. Empirical results and discussion are presented in section 5. A summary of the findings and policy conclusions are in section 6.
1. Literature on Poverty, Risk Exposure and Farm Technology Adoption
For enhancing agricultural productivity, modern inputs, such as fertilizer and SWC adoption, are important. Manure application could also be a crucial supplement or even a substitute to fertilizer especially among the resource poor small holders. In sub-Saharan Africa, adoption levels remain low. Feder, Just, and Zilberman (1985) conducted a comprehensive survey to summarize factors in adopting farm technologies and agricultural innovations. Among other factors, whether to adopt a technology or not depends on the profitability of the technology, farmer education/learning, and other observed and unobserved differences among farmers and across farming systems (Suri 2005).
In Kenya, studies by International Maize and Wheat Improvement Center and other similar research institutions examined the factors that condition productivity of maize and factors that condition adoption of farm technologies among maize growers. These studies showed that farmer characteristics such as age, gender, levels of education and wealth, and institutional factors (such as access to capital and labor markets, land tenure security, social capital) are important factors in farm technology adoption decisions (see Mwangi et al. 1998; Doss 2003; Foster and Rosenzweig 1995; Jackson and Watts 2002; Nyangena 2008). Missing from the literature, in the Kenyan and other cases in sub-Saharan Africa, is the link between risk exposure and technology adoption decisions. When farmers are poor, they depend solely on natural rain for their farming and cannot create a safety net to fall back during the times of bad outcome. As a result, they are hesitant to engage in any investment activity that involves some probability of downside risk, even if such activities promise higher returns (Just and Pope 1979; Rosenzweig and

Environment for Development Juma, Nyangena, and Yesuf
4
Binswanger 1993). Under such circumstances, farmer households opt to stick to low-risk technologies, despite low returns with them—a decision that perpetuates the vicious circle of poverty (Dercon and Christiaensen 2007; Yesuf and Bluffstone 2009).
Using a dynamic model and observed data from the Philippines, Shively (1997; 2001) showed how investments in soil conservation affect consumption risk and how these risks influence incentives for soil conservation of small farmers in low-income countries. His results showed that on small farms the risk of consumption shortfall generates inefficient patterns of soil conservation adoption. Observed adoption patterns reflect risk characteristics with the soil conservation method, and differences in farm size and risk exposure among farmers. Similarly, using panel data and historical rainfall patterns as proxy for counterfactual consumption risk, Dercon and Christensen (2007) showed how low-consumption outcomes during harvest failure discourage the application of fertilizer by small farmers in Ethiopia.
Despite a growing trend of literature on the impact of consumption risk on farm technology adoption, the role of production risk is less-well documented. Understanding the link between production risk exposure and technology adoption decisions is vital to scale up existing successful farm technologies across poor farm households and reduce food insecurity and rural poverty in many of these countries. This study is one effort to understand this linkage using detailed plot level information and proper econometric tools in arid areas of Kenya.
2. Conceptual Framework
This section describes the conceptual framework used to explain farm households’ input use and production investment. This study applies a more flexible moment-based approach, as first suggested by Antle (1983; 1987).
Following presentations by Koundouri et al. (2006), we assume that farmers are risk averse and utilize a vector of conventional inputs, X , and other soil conserving and conditioning inputs, such as soil and water conservation, fertilizers, and manure, represented by vector S to produce a single output q . The household incurs production risk
because crop yield is affected by uncertain climatic conditions. This risk is captured by a random variable, ε , whose distribution (.)G is exogenous to the household’s actions. Let ( )p and ( )r be the corresponding vectors of output and input prices, respectively; farmers
are assumed to be price takers in both markets. The prices are assumed to be nonrandom and hence only climatic variables are the only source of uncertainty. The production function is given by:
Environment for Development Juma, Nyangena, and Yesuf
5
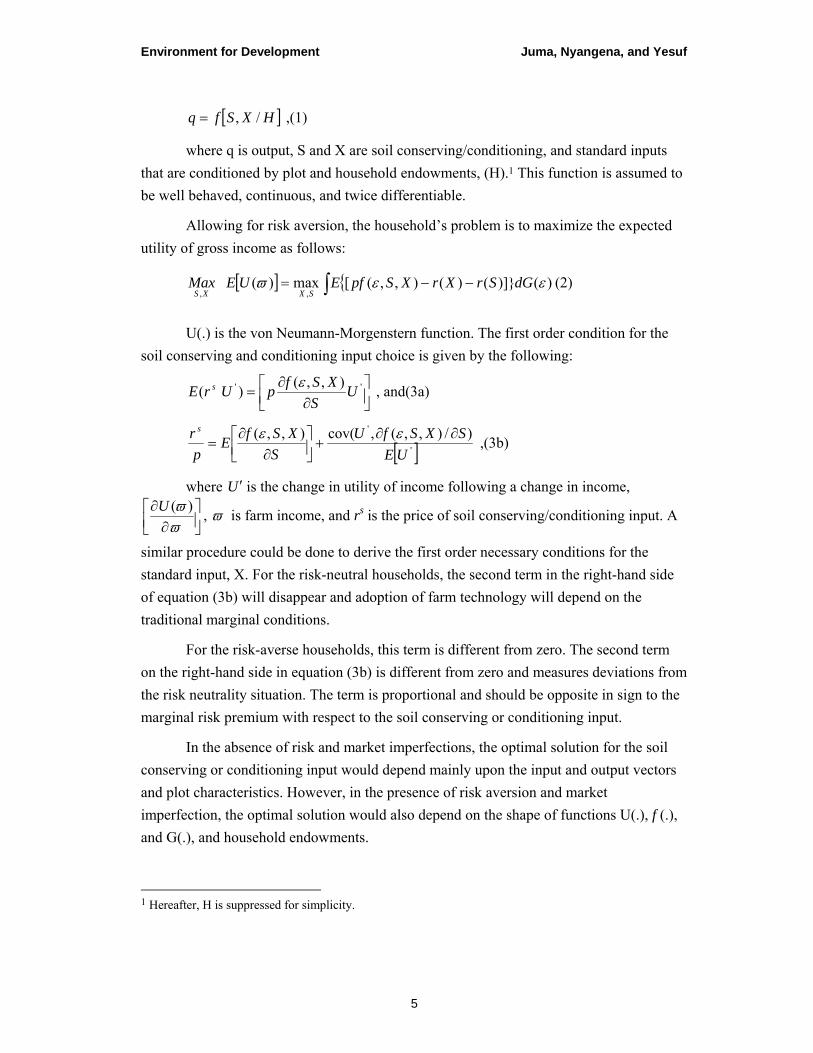
[ ]HXSfq /,= ,(1)
where q is output, S and X are soil conserving/conditioning, and standard inputs that are conditioned by plot and household endowments, (H).1 This function is assumed to be well behaved, continuous, and twice differentiable.
Allowing for risk aversion, the household’s problem is to maximize the expected utility of gross income as follows:
[ ] { )(]})()(),,([max)(,,
εεϖ dGSrXrXSpfEUEMaxSXXS ∫ −−= (2)
U(.) is the von Neumann-Morgenstern function. The first order condition for the soil conserving and conditioning input choice is given by the following:
⎥⎦⎤
⎢⎣⎡
∂∂
= '' ),,()( US
XSfpUrE s ε , and(3a)
[ ]'' )/),,(,cov(),,(
UESXSfU
SXSfE
pr s ∂∂
+⎥⎦⎤
⎢⎣⎡
∂∂
=εε ,(3b)
where U ′ is the change in utility of income following a change in income, ( )U ϖϖ
∂⎡ ⎤⎢ ⎥∂⎣ ⎦
, ϖ is farm income, and rs is the price of soil conserving/conditioning input. A
similar procedure could be done to derive the first order necessary conditions for the standard input, X. For the risk-neutral households, the second term in the right-hand side of equation (3b) will disappear and adoption of farm technology will depend on the traditional marginal conditions.
For the risk-averse households, this term is different from zero. The second term on the right-hand side in equation (3b) is different from zero and measures deviations from the risk neutrality situation. The term is proportional and should be opposite in sign to the marginal risk premium with respect to the soil conserving or conditioning input.
In the absence of risk and market imperfections, the optimal solution for the soil conserving or conditioning input would depend mainly upon the input and output vectors and plot characteristics. However, in the presence of risk aversion and market imperfection, the optimal solution would also depend on the shape of functions U(.), f (.), and G(.), and household endowments.
1 Hereafter, H is suppressed for simplicity.

Environment for Development Juma, Nyangena, and Yesuf
6
Solving equations (3a) and (3b) is empirically difficult. In addition to the choice of technology specification, the distribution of ε needs to be known and the agent’s preferences need to be specified. For this reason, Antle (1983; 1987) proposed a flexible estimation approach that has the advantage of requiring only cross-sectional information on prices and input quantities, plus other observables, such as plot and household characteristics and endowments. According to this approach and without loss of generality, maximizing the expected utility of farm income with respect to any input is equivalent to maximizing a function of moments of the distribution of ε, those moments having themselves X and S as arguments (see Antle 1983; 1987). In our study, we computed the first three moments of our stochastic production function and included them as our covariates in analyzing the adoption decisions for each soil conserving and conditioning input. Our empirical approach is discussed in the next section.
3. Empirical Methodology
This section presents the empirical methodology used in this study to compute moments of production function and analyze the major determinants of farm technology adoption in Kenya. The econometric estimation of production risk impact on soil conserving or conditioning technology adoption is conducted in two steps. First, we compute the first three sample moments (namely, mean, variance, and skewness) of each household from the production function, then the estimated moments are included alongside other explanatory variables in a pseudo-fixed effect probit model to determine if production risk has any impact on farm technology adoption.
Using plot level data from Kenya, maize production per unit area was regressed on farm inputs, including soil conditioning and conserving inputs, observed plot, and household and institutional characteristics to get the estimates of the mean effect. The model takes the following form:
εβ += )/,,( HXSfY ,(4)
where Y is the maize production per unit of land obtained by the household; S and X are production inputs/technologies as described before, ε is the random variable capturing unobserved natural shocks (mainly climate-related) and other unobservables, β
is a vector of parameters to be estimated, and H and plot are household endowments.
The thj central moment of value of maize production about its mean is given as:
{[ (.) ] }jj e Yε μ= − for j=2….m(5)
Environment for Development Juma, Nyangena, and Yesuf
7
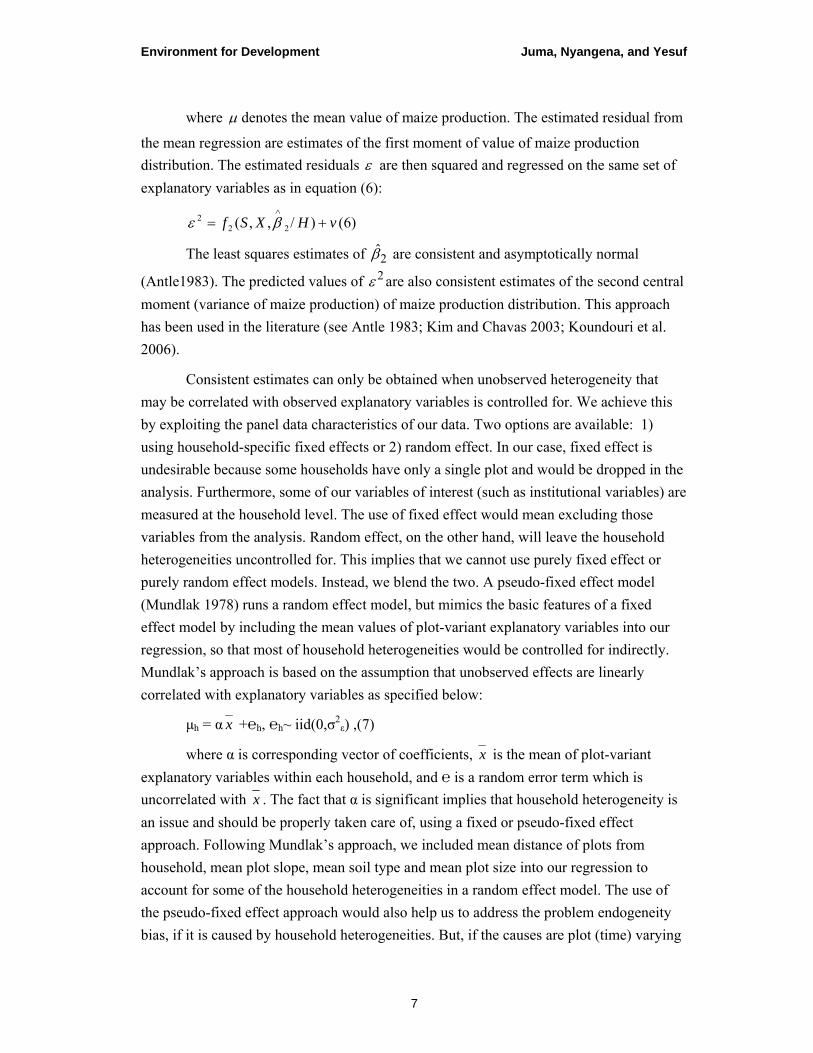
where μ denotes the mean value of maize production. The estimated residual from
the mean regression are estimates of the first moment of value of maize production distribution. The estimated residuals ε are then squared and regressed on the same set of explanatory variables as in equation (6):
vHXSf +=∧
)/,,( 222 βε (6)
The least squares estimates of 2β̂ are consistent and asymptotically normal
(Antle1983). The predicted values of 2ε are also consistent estimates of the second central moment (variance of maize production) of maize production distribution. This approach has been used in the literature (see Antle 1983; Kim and Chavas 2003; Koundouri et al. 2006).
Consistent estimates can only be obtained when unobserved heterogeneity that may be correlated with observed explanatory variables is controlled for. We achieve this by exploiting the panel data characteristics of our data. Two options are available: 1) using household-specific fixed effects or 2) random effect. In our case, fixed effect is undesirable because some households have only a single plot and would be dropped in the analysis. Furthermore, some of our variables of interest (such as institutional variables) are measured at the household level. The use of fixed effect would mean excluding those variables from the analysis. Random effect, on the other hand, will leave the household heterogeneities uncontrolled for. This implies that we cannot use purely fixed effect or purely random effect models. Instead, we blend the two. A pseudo-fixed effect model (Mundlak 1978) runs a random effect model, but mimics the basic features of a fixed effect model by including the mean values of plot-variant explanatory variables into our regression, so that most of household heterogeneities would be controlled for indirectly. Mundlak’s approach is based on the assumption that unobserved effects are linearly correlated with explanatory variables as specified below:
μh = α x +℮h, ℮h~ iid(0,σ2ε) ,(7)
where α is corresponding vector of coefficients, x is the mean of plot-variant explanatory variables within each household, and ℮ is a random error term which is uncorrelated with x . The fact that α is significant implies that household heterogeneity is an issue and should be properly taken care of, using a fixed or pseudo-fixed effect approach. Following Mundlak’s approach, we included mean distance of plots from household, mean plot slope, mean soil type and mean plot size into our regression to account for some of the household heterogeneities in a random effect model. The use of the pseudo-fixed effect approach would also help us to address the problem endogeneity bias, if it is caused by household heterogeneities. But, if the causes are plot (time) varying
Environment for Development Juma, Nyangena, and Yesuf
8
factors, we still need to address the problem of endogeneities with other alternative approaches. In our estimation, we tested and found that fertilizer use is an endogenous variable in our production model. We thus used a two-stage IV and a control function approaches to address the problem of endogeneity in our estimation. These are discussed in great detail in our results section.
4. The Data
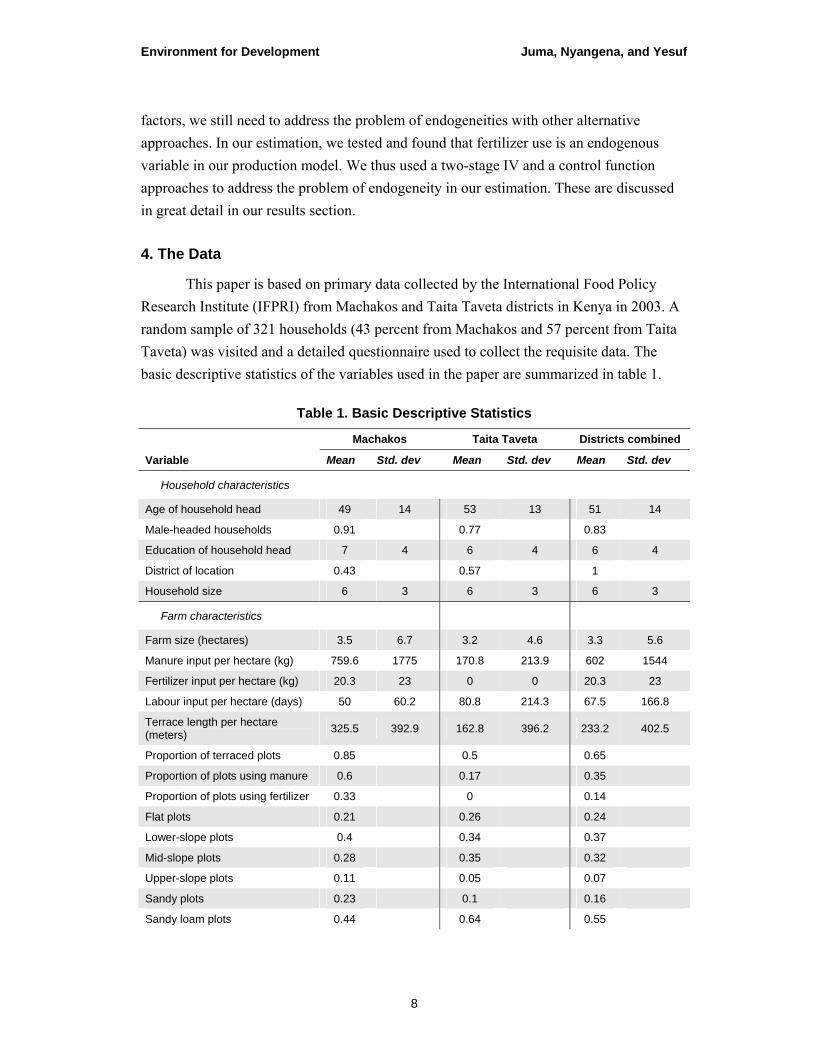
This paper is based on primary data collected by the International Food Policy Research Institute (IFPRI) from Machakos and Taita Taveta districts in Kenya in 2003. A random sample of 321 households (43 percent from Machakos and 57 percent from Taita Taveta) was visited and a detailed questionnaire used to collect the requisite data. The basic descriptive statistics of the variables used in the paper are summarized in table 1.
Table 1. Basic Descriptive Statistics
Machakos Taita Taveta Districts combined
Variable Mean Std. dev Mean Std. dev Mean Std. dev
Household characteristics
Age of household head 49 14 53 13 51 14
Male-headed households 0.91 0.77 0.83
Education of household head 7 4 6 4 6 4
District of location 0.43 0.57 1
Household size 6 3 6 3 6 3
Farm characteristics
Farm size (hectares) 3.5 6.7 3.2 4.6 3.3 5.6
Manure input per hectare (kg) 759.6 1775 170.8 213.9 602 1544
Fertilizer input per hectare (kg) 20.3 23 0 0 20.3 23
Labour input per hectare (days) 50 60.2 80.8 214.3 67.5 166.8
Terrace length per hectare (meters) 325.5 392.9 162.8 396.2 233.2 402.5
Proportion of terraced plots 0.85 0.5 0.65
Proportion of plots using manure 0.6 0.17 0.35
Proportion of plots using fertilizer 0.33 0 0.14
Flat plots 0.21 0.26 0.24
Lower-slope plots 0.4 0.34 0.37
Mid-slope plots 0.28 0.35 0.32
Upper-slope plots 0.11 0.05 0.07
Sandy plots 0.23 0.1 0.16
Sandy loam plots 0.44 0.64 0.55
Environment for Development Juma, Nyangena, and Yesuf
9
Loamy silt plots 0.25 0.16 0.2
Clay soil plots 0.08 0.1 0.09
Distance from household (in meter) 262.6 609 1137.3 1942.2 758.9 1576.5
Institutional factors
Access to extension services 0.24 0.44 0.33
Cost to nearest market (minutes walking) 108 19 89 39 97 33
Membership in organizations 0.81 0.48 0.62
Tenure security 0.23 0.13 0.17
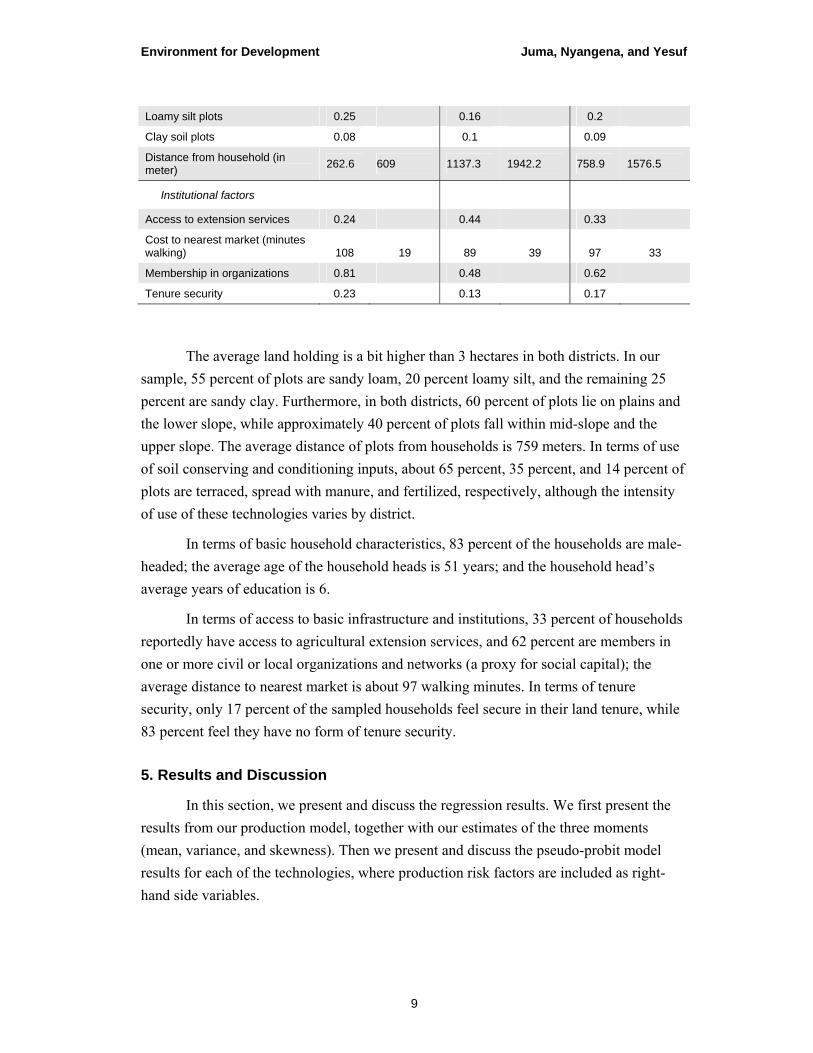
The average land holding is a bit higher than 3 hectares in both districts. In our sample, 55 percent of plots are sandy loam, 20 percent loamy silt, and the remaining 25 percent are sandy clay. Furthermore, in both districts, 60 percent of plots lie on plains and the lower slope, while approximately 40 percent of plots fall within mid-slope and the upper slope. The average distance of plots from households is 759 meters. In terms of use of soil conserving and conditioning inputs, about 65 percent, 35 percent, and 14 percent of plots are terraced, spread with manure, and fertilized, respectively, although the intensity of use of these technologies varies by district.
In terms of basic household characteristics, 83 percent of the households are male-headed; the average age of the household heads is 51 years; and the household head’s average years of education is 6.
In terms of access to basic infrastructure and institutions, 33 percent of households reportedly have access to agricultural extension services, and 62 percent are members in one or more civil or local organizations and networks (a proxy for social capital); the average distance to nearest market is about 97 walking minutes. In terms of tenure security, only 17 percent of the sampled households feel secure in their land tenure, while 83 percent feel they have no form of tenure security.
5. Results and Discussion
In this section, we present and discuss the regression results. We first present the results from our production model, together with our estimates of the three moments (mean, variance, and skewness). Then we present and discuss the pseudo-probit model results for each of the technologies, where production risk factors are included as right-hand side variables.
Environment for Development Juma, Nyangena, and Yesuf
10
5.1 The Production Model Results
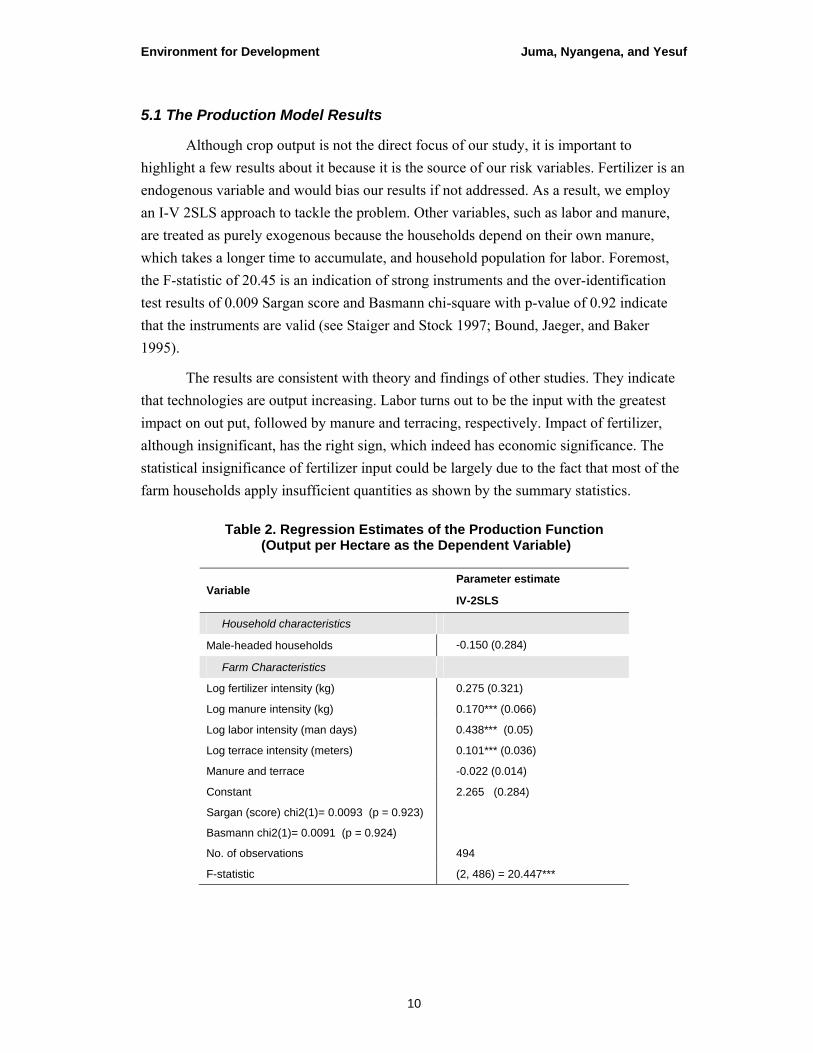
Although crop output is not the direct focus of our study, it is important to highlight a few results about it because it is the source of our risk variables. Fertilizer is an endogenous variable and would bias our results if not addressed. As a result, we employ an I-V 2SLS approach to tackle the problem. Other variables, such as labor and manure, are treated as purely exogenous because the households depend on their own manure, which takes a longer time to accumulate, and household population for labor. Foremost, the F-statistic of 20.45 is an indication of strong instruments and the over-identification test results of 0.009 Sargan score and Basmann chi-square with p-value of 0.92 indicate that the instruments are valid (see Staiger and Stock 1997; Bound, Jaeger, and Baker 1995).
The results are consistent with theory and findings of other studies. They indicate that technologies are output increasing. Labor turns out to be the input with the greatest impact on out put, followed by manure and terracing, respectively. Impact of fertilizer, although insignificant, has the right sign, which indeed has economic significance. The statistical insignificance of fertilizer input could be largely due to the fact that most of the farm households apply insufficient quantities as shown by the summary statistics.
Table 2. Regression Estimates of the Production Function (Output per Hectare as the Dependent Variable)
Variable Parameter estimate
IV-2SLS
Household characteristics
Male-headed households -0.150 (0.284)
Farm Characteristics
Log fertilizer intensity (kg) 0.275 (0.321)
Log manure intensity (kg) 0.170*** (0.066)
Log labor intensity (man days) 0.438*** (0.05)
Log terrace intensity (meters) 0.101*** (0.036)
Manure and terrace -0.022 (0.014)
Constant 2.265 (0.284)
Sargan (score) chi2(1)= 0.0093 (p = 0.923)
Basmann chi2(1)= 0.0091 (p = 0.924)
No. of observations 494
F-statistic (2, 486) = 20.447***
Environment for Development Juma, Nyangena, and Yesuf
11
5.2 The Adoption Model Results
In this section, we generate the first three moments of the production function in the previous section and use them as additional covariates to examine their impacts on farm technology adoption decision. We employed a pseudo-fixed effect probit model to examine these relationships. As discussed in the earlier section, the pseudo-fixed effect model helps us to control for unobserved heterogeneities, and address the problem of selection and endogeneity. The fact that mean values of plot varying explanatory variables are significant, indicating the superiority of our pseudo fixed effect estimates over a simple random effect probit model which leaves the unobserved heterogeneities uncontrolled for. Table 3 presents the results of our pseudo-fixed effect adoption model.

Environment for Development Juma, Nyangena, and Yesuf
12
Table 3. Determinant of Terrace, Manure and Fertilizer Adoption
Explanatory variable Terrace adoption
Manure Fertilizer
Adoption Intensity Adoption Intensity
Risk measures
Predicted mean yield of maize 0.037 (0.039) 0.102** (0.36) -0.273(0.59) 0.173***(0.02) 0.615***(0.037)
Predicted variance of yield -0.038 (0.039) -0.165***(0.036) -2.18***(0.577) -0.015(0.02) -0.065*(0.038)
Predicted skewness of yield 0.005*** (0.002) -0.0001 (0.002) 0.045**(0.022) -0.01***(0.0009) -0.033***(0.002)
Household characteristics
Household size 0.034*** (0.007) -0.002 (0.006) -0.004(0.034) -0.001(0.004) 0.021***(0.007)
Age of household head (years) 0.001 (0.002) -0.001 (0.001) -0.007(0.008) -0.00003(0.0008) 0.002(0.002)
Education of household head (years)
0.010* (0.005) 0.002(0.005) 0.025(0.025) 0.004 (0.003) 0.008(0.005)
Sex of household head (male) -0.163**(0.058) 0.116** (0.053) 0.785***(0.287) 0.14*** (0.03) 0.518***(0.056)
Social capital 0.045**(0.022) 0.022 (0.96) 0.124(0.108) 0.008(0.012) 0.011(0.022)
Farm characteristics
Plot size 0.001 (0.009) 0.013(1.31) 0.038(0.043) 0.002(0.005) -0.006(0.009)
Distance of plot from household
-0.00003 (0.00002) -0.00005** (0.00002)
-0.0003**(0.0001) 0.000(0.000) 0.00003*(0.00002)
Low slope 0.007 (0.069) 0.025 (0.063) 0.065(0.328) 0.002 (0.035) -0.056(0.066)

Environment for Development Juma, Nyangena, and Yesuf
13
Medium slope -0.024(0.11) 0.091(0.101) 0.494(0.529) -0.01 (0.057) -0.117(0.107)
High slope -0.178 (0.171) 0.011 (0.57) 0.205(0.817) -0.005(0.088)
Location, Taita Taveta -0.350***(0.05) -0.198***(0.046) -1.322***(0.241) -0.109***(0.026) 0.034(0.049)
Loamy soil -0.146 *(0.085) 0.080 (0.078) 0.234(0.409) -0.019 (0.044) -0.006(0.082)
Clay soil -0.09 (0.128) 0.157 (0.117) 0.42(0.616) -0.045 (0.066) -0.138(0.123)
Average plot size 0.006 (0.01) 0.002 (0.009) -0.017(0.047) 0.002 (0.005) -0.004(0.009)
Average plot distance from household 0.0001**(0.00003) 0.00004* (0.00002) 0.0002(0.0001) 0.000 (0.000) 0.000(0.000)
Average plot slope 0.118** (0.059) 0.023 (0.054) 0.096(0.283) 0.025 (0.031) 0.054(0.057)
Average soil type 0.137*(0.074) -0.127* (0.068) -0.247(0.358) 0.035 (0.038) 0.089(0.072)
Institutional factors
Distance to nearest market (minutes walking)
0.0002 (0.0006) 0.0002 (0.0006) -0.001(0.003) 0.008(012) -0.00001(0.0006)
Secure land tenure 0.125**(0.053) -0.074(0.049) -0.237(0.256) -0.025(0.028) 0.028(0.052)
Number of extension visits -0.016 (0.017) -0.046**(0.016) -0.274***(0.082) 0.016 *(0.009) 0.045***(0.017)
No. of observations 483 483 480 483 483
Wald Chi2 (23)=211.38*** (23)=356.14*** (23)=455.48*** (23)=949.86*** (23)=2523.28***
***, **, *, Significant at 1%, 5% and 10%, respectively.

Environment for Development Juma, Nyangena, and Yesuf
14
The first moment has a highly significant positive effect on fertilizer adoption and manure application. This implies that farm households are driven by profit/output maximization and would be motivated to apply yield increasing methodologies whenever they are guaranteed of higher returns. The same positive effect is also reflected in the intensity of fertilizer application.
Yield variability, as reflected by the second moment, has a negative impact on manure application, intensity of manure, and fertilizer application. This indicates that farmers are discouraged from applying manure and applying manure plus fertilizer in sufficient quantities when yields are less certain. They would rather accept low-output than invest heavily in pursuit of higher, but uncertain, output. As much as farmers are driven by profit/output maximization, they are also risk averse and would minimize investing in risky venture.
A higher probability of crop failure (downside risk), as measured by skewness of yield, increases the farmers’ chance of adopting terracing and reduces the possibility of fertilizer adoption. At the same time, it increases intensity of manure use and reduces intensity of fertilizer application. Farm households possibly view terrace adoption and more intensive application of manure as measures for rehabilitating plots that are heavily degraded and no longer promise any yields. Fertilizer, a yield enhancing input, is only attractive to the farmer when possibility of crop failure is low—the farmers are motivated to adopt fertilizer technology and apply fertilizer in sufficient quantities when yields are more guaranteed. Alternatively, the farm households could view manure and terracing as risk-reducing and fertilizer as risk-increasing.
Besides production risk variables, plot-level variables (such as distance of plot from household and district of plot location), household characteristics (such as household size, education, sex of household head, and household social networks), and institutional factors (such as security of land tenure and number of visits by government extension officers) have statistically significant effects on farmers’ decision to adopt or not to adopt a given technology.
Household size is positively correlated with terracing. That is, a marginal increase in household membership increases the probability that the household will adopt terracing as a means of soil conserving and conditioning effort. This is not surprising because terracing is labor-intensive and would favor larger households. Therefore, when households rely on family labor, as in the districts we studied, a large household becomes an obvious positive predictor of terracing. Intensity of fertilizer application is also
Environment for Development Juma, Nyangena, and Yesuf
15
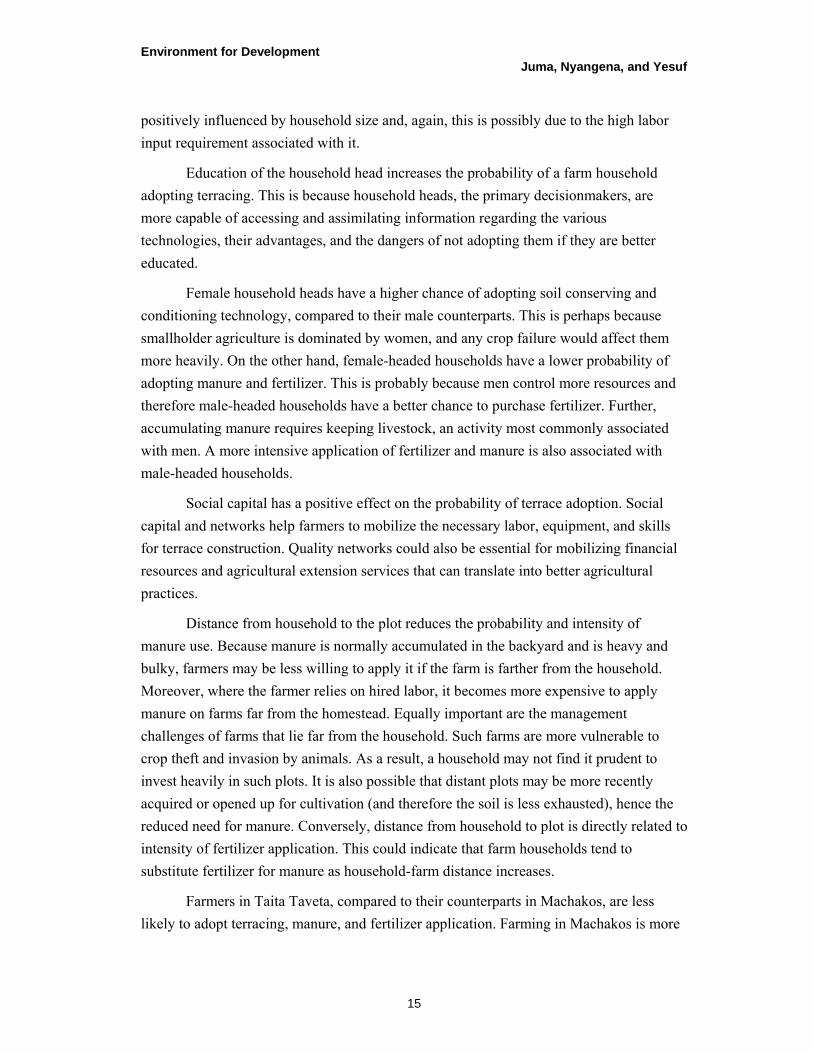
positively influenced by household size and, again, this is possibly due to the high labor input requirement associated with it.
Education of the household head increases the probability of a farm household adopting terracing. This is because household heads, the primary decisionmakers, are more capable of accessing and assimilating information regarding the various technologies, their advantages, and the dangers of not adopting them if they are better educated.
Female household heads have a higher chance of adopting soil conserving and conditioning technology, compared to their male counterparts. This is perhaps because smallholder agriculture is dominated by women, and any crop failure would affect them more heavily. On the other hand, female-headed households have a lower probability of adopting manure and fertilizer. This is probably because men control more resources and therefore male-headed households have a better chance to purchase fertilizer. Further, accumulating manure requires keeping livestock, an activity most commonly associated with men. A more intensive application of fertilizer and manure is also associated with male-headed households.
Social capital has a positive effect on the probability of terrace adoption. Social capital and networks help farmers to mobilize the necessary labor, equipment, and skills for terrace construction. Quality networks could also be essential for mobilizing financial resources and agricultural extension services that can translate into better agricultural practices.
Distance from household to the plot reduces the probability and intensity of manure use. Because manure is normally accumulated in the backyard and is heavy and bulky, farmers may be less willing to apply it if the farm is farther from the household. Moreover, where the farmer relies on hired labor, it becomes more expensive to apply manure on farms far from the homestead. Equally important are the management challenges of farms that lie far from the household. Such farms are more vulnerable to crop theft and invasion by animals. As a result, a household may not find it prudent to invest heavily in such plots. It is also possible that distant plots may be more recently acquired or opened up for cultivation (and therefore the soil is less exhausted), hence the reduced need for manure. Conversely, distance from household to plot is directly related to intensity of fertilizer application. This could indicate that farm households tend to substitute fertilizer for manure as household-farm distance increases.
Farmers in Taita Taveta, compared to their counterparts in Machakos, are less likely to adopt terracing, manure, and fertilizer application. Farming in Machakos is more
Environment for Development Juma, Nyangena, and Yesuf
16
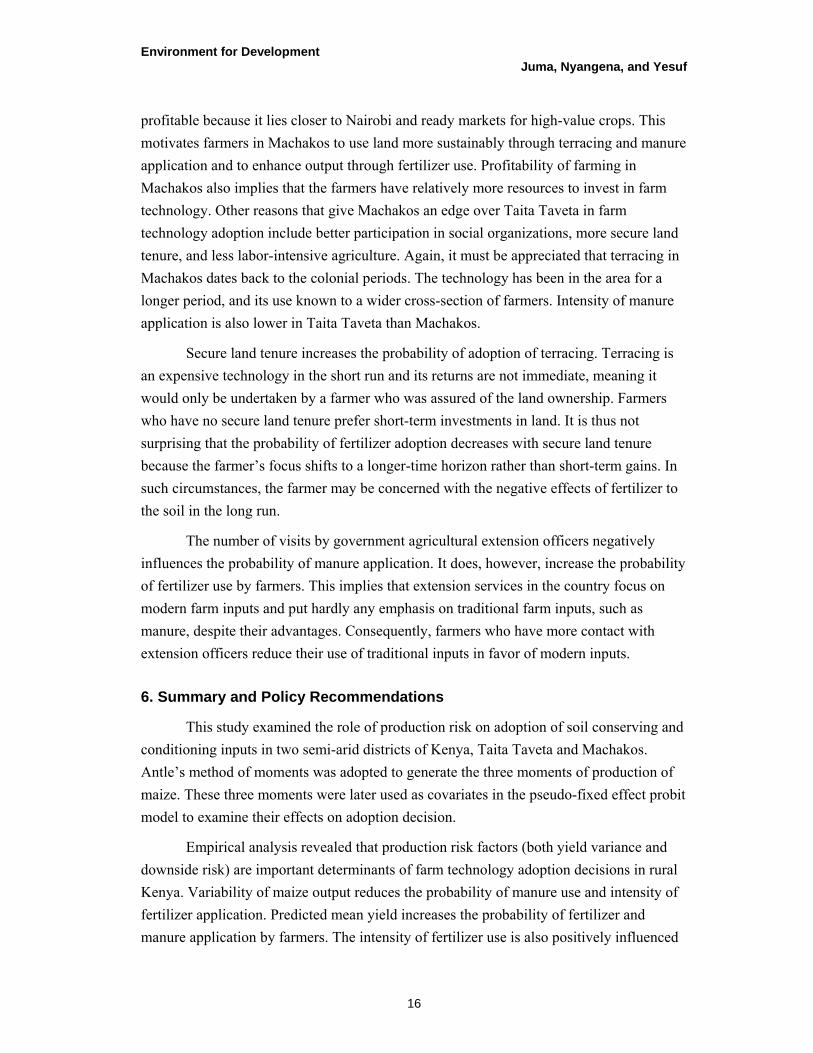
profitable because it lies closer to Nairobi and ready markets for high-value crops. This motivates farmers in Machakos to use land more sustainably through terracing and manure application and to enhance output through fertilizer use. Profitability of farming in Machakos also implies that the farmers have relatively more resources to invest in farm technology. Other reasons that give Machakos an edge over Taita Taveta in farm technology adoption include better participation in social organizations, more secure land tenure, and less labor-intensive agriculture. Again, it must be appreciated that terracing in Machakos dates back to the colonial periods. The technology has been in the area for a longer period, and its use known to a wider cross-section of farmers. Intensity of manure application is also lower in Taita Taveta than Machakos.
Secure land tenure increases the probability of adoption of terracing. Terracing is an expensive technology in the short run and its returns are not immediate, meaning it would only be undertaken by a farmer who was assured of the land ownership. Farmers who have no secure land tenure prefer short-term investments in land. It is thus not surprising that the probability of fertilizer adoption decreases with secure land tenure because the farmer’s focus shifts to a longer-time horizon rather than short-term gains. In such circumstances, the farmer may be concerned with the negative effects of fertilizer to the soil in the long run.
The number of visits by government agricultural extension officers negatively influences the probability of manure application. It does, however, increase the probability of fertilizer use by farmers. This implies that extension services in the country focus on modern farm inputs and put hardly any emphasis on traditional farm inputs, such as manure, despite their advantages. Consequently, farmers who have more contact with extension officers reduce their use of traditional inputs in favor of modern inputs.
6. Summary and Policy Recommendations
This study examined the role of production risk on adoption of soil conserving and conditioning inputs in two semi-arid districts of Kenya, Taita Taveta and Machakos. Antle’s method of moments was adopted to generate the three moments of production of maize. These three moments were later used as covariates in the pseudo-fixed effect probit model to examine their effects on adoption decision.
Empirical analysis revealed that production risk factors (both yield variance and downside risk) are important determinants of farm technology adoption decisions in rural Kenya. Variability of maize output reduces the probability of manure use and intensity of fertilizer application. Predicted mean yield increases the probability of fertilizer and manure application by farmers. The intensity of fertilizer use is also positively influenced
Environment for Development Juma, Nyangena, and Yesuf
17
by the predicted mean yield. Higher probability of crop failure (downside risk) encourages farmers to undertake terracing and apply manure more intensively, but lowers possibility and intensity of fertilizer use. This indicates that use of fertilizer is meant to enhance output, while manure input and terracing are used to maintain the level of yield or to restore severely degraded soils that no longer promise good yields. Thus, farmers view manure application and terracing as mechanisms for reducing downside risk.
Other factors that are important in technology adoption include farm location, distance of plot from household, education of household head, number of visits by agricultural extension officers, and tenure security as perceived by farmers. Social capital, gender of the household head and household size are also important.
These findings have various policy implications. When making agricultural/land management policies, it is important to consider the role of risks. Generally, all technologies have a degree of risks associated with them. When farmers are risk averse, economic instruments to hedge against exposure to risks are necessary to motivate farmers to easily and quickly adopt the desired technologies. For instance, when considering promoting the use of fertilizer and manure by farmers, policies must be put in place to hedge against the potential production risk associated with the introduction of the technology. Given the missing insurance market, this is perhaps possible through the introduction of safety nets to cover against such downside risk.
The impact of production risk on technology adoption varies by technology type. Policies, therefore, should be customized to different technologies in different environments. A toolbox, one-size-fits-all, approach to policy should be discouraged. Regional, farm-level, and household-level factors should all be fused into the policies, if such policies are to succeed.
Security of tenure is essential if policies are to succeed in promoting greater adoption of terracing as a sustainable soil and water management technology. This makes it necessary for the government to not only issue lands titles, but also to convince citizens about the sanctity of such titles. This will stimulate long-term investment in land and help farmers break the poverty trap. Social capital and networks need also be encouraged to scale up successful adoption of SWC technologies in areas where access to information and labor scarcity are key constraints.
Environment for Development Juma, Nyangena, and Yesuf
18
References
Antle, J.M. 1983. Testing for Stochastic Structure of Production: A Flexible Moment-Based Approach. Journal of Business and Economic Statistics 1(3): 192–201.
Bound, J., D. Jaeger, and R. Baker. 1995. Problems with Instrumental Variables Estimation When the Correction between the Instruments and the Endogenous Explanatory Variable Is Weak. Journal of the American Statistical Association 90: 443–50.
Cohen, M., M.T. Brown, and K.D. Shepherd. 2006. Estimating the Environmental Costs of Soil Erosion at Multiple Scales in Kenya using EMERGY Synthesis. Agriculture, Ecosystems and Environment 114: 249–69.
Dercon, S., and L. Christiaensen. 2007. Consumption Risk, Technology Adoption, and Poverty Traps: Evidence from Ethiopia. Policy Research Working Paper, no. 4257. Washington, DC: World Bank.
Dercon, S. 2004. Growth and Shocks: Evidence from Rural Ethiopia. Journal of Development Economics 74(2): 309–329.
Doss, C. 2003. Understanding Farm-Level Technology Adoption: Lessons Learnt from CIMMYT’s Micro Surveys in East Africa. CIMMYT Economics Working Paper, no. 03-07. Mexico City, DF: CIMMYT (International Maize and Wheat Improvement Center).
Eswaran, M., and A. Kotwal. 1990. Implications of Credit Constraints for Risk Behavior in Less Developed Economies. Oxford Economic Papers 42: 473–82.
Foster, A., and M. Rosenzweig. 1995. Learning by Doing and Learning from Others: Human Capital and Technical Change in Agriculture. Journal of Political Economy 103(6): 1176–1209.
Feder, G., R.E. Just, and D. Zilberman. 1985. Adoption of Agricultural Innovations in Developing Countries: A Survey. Economic Development and Cultural Change 33: 255–98.
Government of Kenya. 1998. Economic Survey. Nairobi: Government Printers.
Groom, B., P. Koundouri, C. Nauges, and A. Thomas. 2008. The Story of the Moment: Risk-Averse Cypriot Farmers Respond to Drought Management. Applied Economics 40(3): 315–26.
Environment for Development Juma, Nyangena, and Yesuf
19
Jackson, M., and A. Watts. 2002. The Evolution of social and Economic Networks. Journal of Economic Theory 106(2): 265–95.
Just, R. and R. Pope. 1979. Production Function Estimation and Related Risk Considerations. American Journal of Agricultural Economics 61(2): 276–84.
Kim, K., and J.P. Chavas. 2003. Technological Change and Risk Management: An Application to the Economics of Corn Production. Agricultural Economics 29: 125–42.
Koundouri, P., C. Nauges, and V. Tzouvelekas. 2006. Technology Adoption under Production Uncertainty: Theory and Application to Irrigation Technology. American Journal of Agricultural Economics 8(3): 657–70.
Kassie, M., M. Yesuf, and G. Köhlin. 2008. The Role of Production Risk in Sustainable Land–Management Technology Adoption in the Ethiopian Highlands. RFF Discussion Paper EfD 09-13. Washington, DC: Resources for the Future.
Ministry of Agriculture. 2004. Strategy for Revitalizing Agriculture, 2004–2014. Nairobi: Government Press.
Mosley, P., and A. Verschoor. 2005. Risk Attitudes and the Vicious Circle of Poverty. European Journal of Development Research 17(1): 55–88.
Mundlak, Y. 1978. On the Pooling of Time Series and Cross-Section Data. Econometrica 64(1): 69–85.
Mwangi, W., J. Lynam, and R.M. Hassan. 1998. Current Challenges and Strategic Future Choices for Maize Research and Policy in Kenya: A Synthesis of the Maize Data-Base Project Methods and Results. In Maize Technology Development and Transfer: A GIS Application for Research Planning in Kenya, edited by R.M. Hassan. Nairobi and Mexico City, DF: CABI Oxon, KARI, and CIMMYT (International Maize and Wheat Improvement Center).
Nyangena, W. 2008. Social Determinants of Soil and Water Conservation in Rural Kenya. Environment, Development and Sustainability 10(6): 745–67.
Pingali, P.L. 2001. CIMMYT (International Maize and Wheat Improvement Center) 1999–2000 World Maize Facts and Trends: Meeting World Maize Needs—Technological Opportunities and Priorities for the Public Sector. Mexico City, DF: CIMMYT.
Rosenzweig, M., and H. Binswanger. 1993. Wealth, Weather Risk, and Composition and Profitability of Agricultural Investments. Economic Journal 103(416): 56–78.
Environment for Development Juma, Nyangena, and Yesuf
20
Shively, G.E. 2001. Poverty, Consumption Risk, and Soil Conservation. Journal of Development Economics 65(2): 267–90.
Shively, G.E. 1997. Consumption Risk, Farm Characteristics, and Soil Conservation Adoption among Low-Income Farmers in the Philippines. Agricultural Economics 17(2): 165–77.
Staiger, D., and J. Stock. 1997. Instrumental Variables Regression with Weak Instruments. Econometrica 65(3): 557–86.
Suri, T. 2005. Selection and Comparative Advantage in Technology Adoption. Photocopy. Department of Economics, Yale University.
World Bank. 2008. World Development Report: Agriculture for Development. Washington, DC: World Bank.
Yesuf, M., and R.A. Bluffstone. 2009, forthcoming. Poverty, Risk Aversion, and Path Dependence in Low-Income Countries: Experimental Evidence from Ethiopia. American Journal of Agricultural Economics.