Embed Size (px)
Citation preview
Production Efficiency and Technology Gap in Irrigated and Rain-fed Rice
Farming Systems in Sri Lanka: Non Parametric Approach
Manoj Thibbotuwawa, Amin Mugera, and Ben White+
+ School of Agricultural and Resource Economics, Faculty of Natural and Agricultural
Sciences, the University of Western Australia M089, 35 Stirling Highway, Crawley WA
6009 Australia, Tel: +61-08-6488-4633, Fax: +61-08-6488-1098
Email: [email protected]
Contributed paper prepared for presentation at the 57th
AARES annual conference,
Sydney, NSW, February 5-8, 2013
Copyright 2012 by Manoj Thibbotuwawa, Amin Mugera, Ben White. All rights reserved.
Readers may make verbatim copies of this document for non-commercial purposes by any
means, provided that this copyright notice appears on all such copies.
1
A Comparative Analysis of Productive Efficiency and Technology Gap in Irrigated and
Rain-fed Rice Farming Systems in Sri Lanka: Non Parametric Approach
Abstract
The paper analyses the differences of technical, allocative, cost and scale efficiencies of
irrigated and rain-fed rice farmers in Sri Lanka in two different perspectives; first, relative to
a common metafrontier, defined as the boundary of an unrestricted technology set and second
relative to group frontiers defined to be the boundaries of restricted technology sets in each
group. Data envelopment analysis (DEA) metafrontier and group frontier approaches are used
for cross section survey data of 90 farms. Rain-fed farms perform comparably with the
irrigated farms based on the group frontier results. Rain-fed farmers may be operating as
technically efficient as they could, given the existing production technology. However rain-
fed farms move significantly towards inefficiency compared to the irrigated farms under the
metafrontier technology. Results indicate that the irrigation shifts the rice sector production
frontier to a higher level. In addition, a second stage bootstrapped truncated regression shows
that efficiency differences between two regions are explained by the timely availability of the
water to a significant extent. We suggest that future sectoral policies should be designed to
address the efficiency enhancing factors such as irrigation, quality seed, land ownership and
scale and female labour participation.
Key words: technical efficiency, cost efficiency, metafrontier, group-frontier, rice farming,
irrigated, rain-fed, Sri Lanka
JEL Classifications: Q12, D24
1. Introduction
As in other parts of Asia, rice is the staple food and principal crop in Sri Lanka. It account for
approximately 900,000 ha and 34% of total agricultural land area in Sri Lanka occupying the
largest extent of land under any single crop. The sector accounts for nearly 15% of the
agricultural GDP and about half of the agricultural labour force is employed in the sector
(CBSL, 2010). Despite the significance of the rice sector in the Sri Lankan economy, the
country has been facing widespread stagnation in paddy yields and declining profitability in
recent years (IPS, 2011, Kikuchi, et al., 2000, Rafeek and Samarathunga, 2000, Weerahewa,
et al., 2003). However, the demand for rice is rising due to the annual growth of population
by 1.1% and per capita income by 15%1. It is projected that rice production should grow at
the rate of 2.9% per year in order to meet the rising demand (DOA, 2011). Due to the scarcity
of new arable land, area expansion is not a viable solution anymore; therefore, increase in
rice production could come through per acre yield improvement by efficient use of inputs.
1 The average percentage change in per capita GDP between 2000 and 2010 is 15%, with the years 2007 and 2008 achieving
more than 21% change.
2
Rice is grown under a wide range of physical environments such as different elevations, soils
and hydrological regimes. The rice lands in Sri Lanka are classified as irrigated (major and
minor) and rain-fed based on the hydrological conditions, i.e., the surface water source,
supply and use. The major cultivation season (Maha) is from October to March and the minor
season (Yala) is from April to September. Those seasons are defined based on the two
monsoon rains; North East monsoon and South West monsoon respectively (Dhanapala,
2000). Major irrigation schemes are those having a command area of more than 80 ha, where
the water supply may be from a major tank, a river or a major stream diversion system. About
half of the cultivated areas are under major irrigation schemes. Minor irrigation schemes are
considered the schemes under village tanks that are natural or man-made water reservoirs,
which consist of a command area of less than 80 ha. From the total extent of cultivations,
about 20% comes under this category. There are about 18,000 village tanks in the country.
The most critical problem in village tank systems in the dry and intermediate zones is the
severe water scarcity during Yala season and insufficient rainfalls in the Maha season in
certain times (Adhikarinayake, 2005).
From the total area of paddy lands, about 30% are cultivated under the rain fed cultivations.
Rain-fed rice cultivations are often subject to water stress due to excess water (floods) and
insufficient water (droughts). Light rainfalls as well as heavy rainfalls are detrimental for the
cultivations (Adhikarinayake, 2005). Irrigation has been viewed as an essential and most
critical factor determining the rice productivity (Kikuchi, et al., 2000, Mariano, et al., 2011).
Timely availability of sufficient water is very important for the cultivation as rice is a high
water intensive crop. There is a greater variability in rice yield and production efficiency
among different water regimes (Dhanapala, 2000, Gunaratne and Thiruchelvam, 2002,
Thiruchelvam, 2005a). These differences may be basically due to the choices of different sets
of input-output combinations or technology sets. These choices of technology sets differ
because of a combinations of reasons such as differences in physical, human and financial
capital, economic infrastructure and resource endowments in which access to water plays a
major role.
It is a common practise to measure the relative performance of farms within the irrigation
groups. However, it is important to measure the performance of farms across groups and the
existing technological gap between different groups. The main objective of this study is to
examine the differences in production efficiency between irrigated and rain-fed rice farms in
3
Sri Lanka and to investigate the factors that influence production efficiency differences in
irrigated and rain-fed rice farms while controlling for farm size, resource utilization and
resource ownership.
This study contributes to the rice production efficiency and irrigation literature in several
ways. First, this study investigates the technical efficiency (TE), allocative efficiency (AE),
cost efficiency (CE) and scale efficiency (SE) in irrigated and rain-fed rice farming systems
separately. We do this by defining group frontiers to be the boundaries of restricted
technology sets in each group. Second, we make comparisons of production efficiencies
across groups. We do this by measuring efficiency scores relative to a common metafrontier,
defined as the boundary of an unrestricted technology set and calculate the technological gap
ratio (TGR), allocative gap ratio (AGR), cost gap ratio (CGR) and scale gap ratio (SGR) in
each group. We use non parametric DEA method in both the group frontier and metafrontier
estimation. Third, we examine the impact of farm level characteristics on efficiency measures
using bootstrapped truncated regression.
Results of this study have policy implications pertaining to better allocation and utilization of
resources for rural development and food security in Sri Lanka where agricultural sector is
characterized by different irrigation regimes. The results are expected to be of interest to
policy makers in other Asian countries having similar background and issues. The paper is
organized as follows. The next section briefly discusses the literature on rice production
efficiency highlighting the comparative studies on efficiency differences in different water
regimes. Section three outlines the theoretical framework for the methodology. Section four
describes the methods and data. Section five discusses the results followed by the concluding
comments in the final section.
2. Production Efficiency Differences in Different Water Regimes
Production efficiency is one of the popular methods of benchmarking the performance of
economic entities in a similar industry. Technical efficiency measures the extent to which
inputs are converted in to outputs relative to the best practice given the available technology.
Allocative efficiency is related to selecting the mix of inputs that produces a given level of
output at minimum cost given the available input prices. Economic efficiency is a product of
TE and AE. Relaxing the assumption that all firms are fully efficient is used to estimate
4
frontier production functions and to measure the technical efficiencies of firms relative to the
best practice frontier using either parametric or non-parametric methods, or both (Coelli, et
al., 2005).
There is a large body of literature measuring the rice production efficiency. Stochastic
frontier analysis (SFA) and Data Envelopment Analysis (DEA) methods are the most
frequently used methods in analyzing productive efficiency. Most of the studies have been
done using SFA (Bäckman, et al., 2011, Balcombe, et al., 2007, Ekanayake and Jayasuriya,
1987, Gedara, et al., 2012, Karunarathne and H.M.G.Herath, 1989, Khan, et al., 2010,
Mariano, et al., 2011, Rahman, 2010, Rahman and Rahman, 2009, Rahman, et al., 2009, Tan,
et al., 2010, Thiruchelvam, 2005b, Udayanganie, et al., 2006, Villano and Fleming, 2006,
Yao and Shively, 2007) while some others have used DEA (Balcombe, et al., 2008, Brazdik,
2006, Chemak, et al., 2010, Coelli, et al., 2002, Dhungana, et al., 2004, Latruffe, et al., 2008,
Oude Lansink and Silva, 2004, Thibbotuwawa, et al., 2012). There are a few comparative
studies of the productive efficiency based on SFA and DEA (Christopher, et al., 2008,
Wadud, 2003, Wadud and White, 2000).
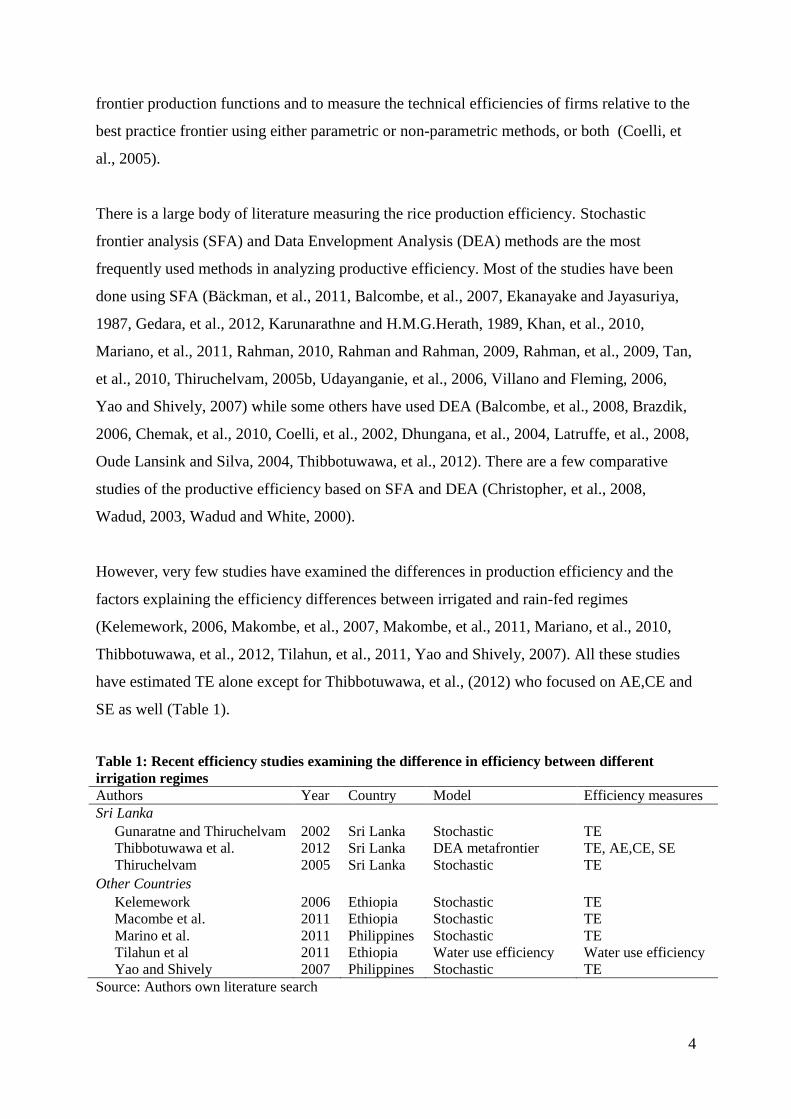
However, very few studies have examined the differences in production efficiency and the
factors explaining the efficiency differences between irrigated and rain-fed regimes
(Kelemework, 2006, Makombe, et al., 2007, Makombe, et al., 2011, Mariano, et al., 2010,
Thibbotuwawa, et al., 2012, Tilahun, et al., 2011, Yao and Shively, 2007). All these studies
have estimated TE alone except for Thibbotuwawa, et al., (2012) who focused on AE,CE and
SE as well (Table 1).
Table 1: Recent efficiency studies examining the difference in efficiency between different
irrigation regimes
Authors Year Country Model Efficiency measures Sri Lanka
Gunaratne and Thiruchelvam 2002 Sri Lanka Stochastic TE Thibbotuwawa et al. 2012 Sri Lanka DEA metafrontier TE, AE,CE, SE Thiruchelvam 2005 Sri Lanka Stochastic TE
Other Countries Kelemework 2006 Ethiopia Stochastic TE Macombe et al. 2011 Ethiopia Stochastic TE Marino et al. 2011 Philippines Stochastic TE Tilahun et al 2011 Ethiopia Water use efficiency Water use efficiency Yao and Shively 2007 Philippines Stochastic TE
Source: Authors own literature search
5
Both Makombe, et al. (2011) and Makombe, et al.(2007) showed that irrigation shifts the
agricultural production frontier to a higher level in Ethiopia. They suggested focusing on
strategies like changes in production technology and optimizing input use for the agricultural
development in the rain-fed sector. Kelemework (2006) showed that the rain-fed farmers in
Ethiopia are more efficient than irrigated farmers with respect to their own frontiers. Tilahun,
et al. (2011) emphasized the importance of gradual transformation of rain-fed farms to
irrigation for the efficient use of resources. Marino et al. (2010) suggested that the rain-fed
farms were able to achieve almost the same level of productivity compared to the irrigated
farms. In general, all these highlighted the importance of directing more resources towards
the irrigation schemes due to higher marginal productivity of inputs in these areas.
There are a few studies that have evaluated the production efficiency differences in different
agricultural water management systems in Sri Lanka. Gunaratne and Thiruchelvam (2002)
and Thiruchelvam (2005a) have undertaken a comparative analyses between major and minor
schemes concluding that the major irrigated farms are in a relatively advantageous position
than the minor irrigated farms. However, no focus has been given to explain efficiency
differences between irrigated and rain-fed scenarios except the recent study by
Thibbotuwawa, et al., (2012). They compared the efficiency differences and concluded that
major irrigated farms are the most efficient and rain-fed farms are the least efficient on
average. However, their comparison of productive efficiency is purely based on metafrontier
DEA method disregarding the technological gaps in different systems.
3. Conceptual Framework
Production efficiency is one of the popular methods of benchmarking and comparing the
performance of economic entities in a similar industry. This discussion of efficiency of a firm
began with the Farrell (1957) who proposed that the efficiency of a firm consists of two
components; TE and AE. TE measures the extent to which inputs are converted in to outputs
relative to the best practice given the available technology. AE is related to selecting the mix
of inputs that produces a given level of output at minimum cost given the available input
prices. Economic efficiency is a product of TE and AE. Frontier production functions are
commonly used to measure the production efficiencies of firms relative to the best practice
frontier using either parametric or non-parametric methods, or both (Coelli, et al., 2005).
6
Estimating a single frontier for all farms regardless of whether these are irrigated or not
would be one option. This meta-frontier would assume that all farmers have access to the
same technology and the differences in production performance would purely be attributed to
differences in efficiency. The other option assumes irrigated and rain-fed farmers are
operated under different production technologies. We use both the meta-frontier and the
group frontier models in efficiency estimation and the technological gap ratios are
subsequently calculated.
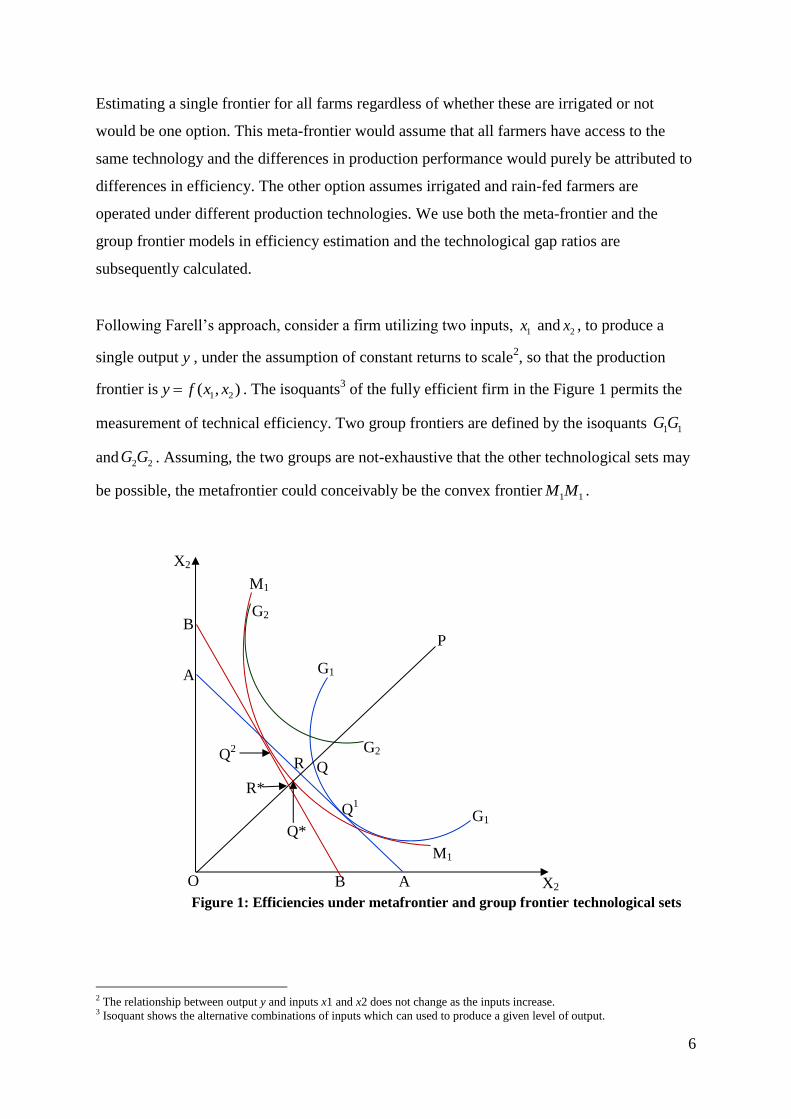
Following Farell’s approach, consider a firm utilizing two inputs, 1x and 2x , to produce a
single output y , under the assumption of constant returns to scale2, so that the production
frontier is 1 2( , )y f x x . The isoquants3 of the fully efficient firm in the Figure 1 permits the
measurement of technical efficiency. Two group frontiers are defined by the isoquants 1 1G G
and 2 2G G . Assuming, the two groups are not-exhaustive that the other technological sets may
be possible, the metafrontier could conceivably be the convex frontier 1 1M M .
Figure 1: Efficiencies under metafrontier and group frontier technological sets
2 The relationship between output y and inputs x1 and x2 does not change as the inputs increase. 3 Isoquant shows the alternative combinations of inputs which can used to produce a given level of output.
Q1
A
A
B
B X2
X2
R*
Q*
R Q
O
P
M1
M1
G2
G2
G1
G1
Q2
7
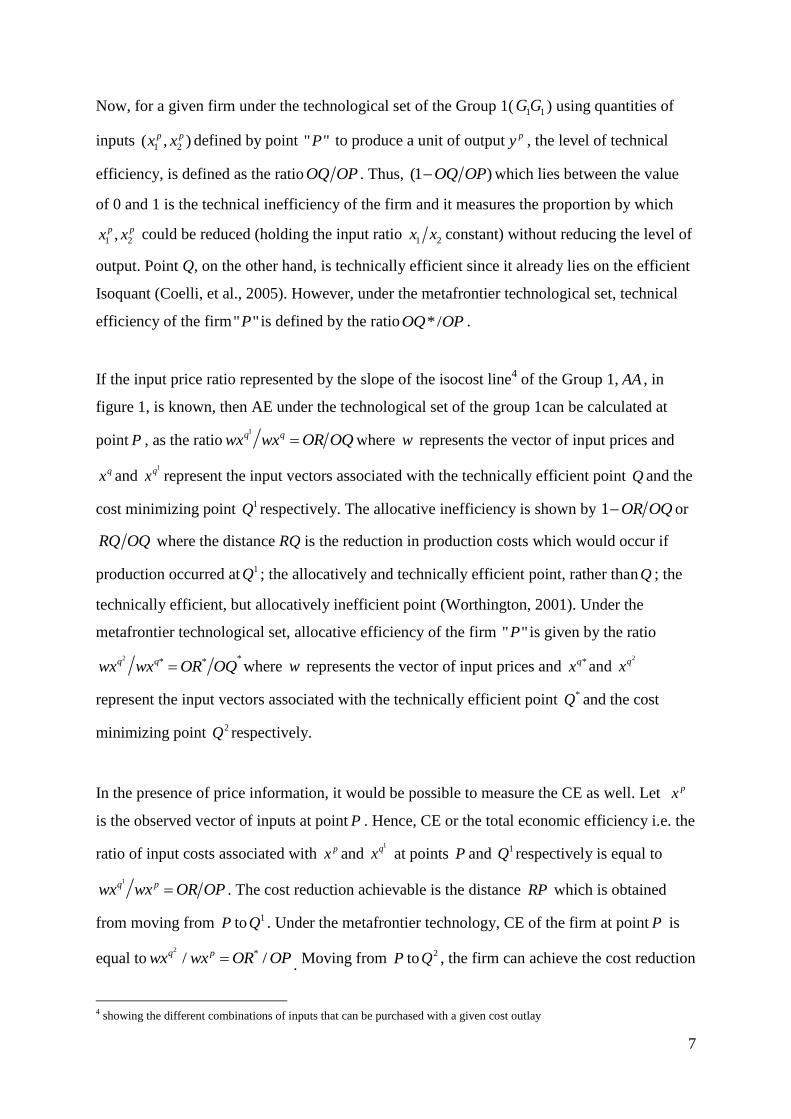
Now, for a given firm under the technological set of the Group 1( 1 1G G ) using quantities of
inputs 1 2( , )p px x defined by point " "P
to produce a unit of output py , the level of technical
efficiency, is defined as the ratio OQ OP . Thus, (1 )OQ OP which lies between the value
of 0 and 1 is the technical inefficiency of the firm and it measures the proportion by which
1 2,p px x could be reduced (holding the input ratio 1 2x x constant) without reducing the level of
output. Point Q, on the other hand, is technically efficient since it already lies on the efficient
Isoquant (Coelli, et al., 2005). However, under the metafrontier technological set, technical
efficiency of the firm" "P is defined by the ratio */OQ OP .
If the input price ratio represented by the slope of the isocost line4 of the Group 1, AA , in
figure 1, is known, then AE under the technological set of the group 1can be calculated at
point P , as the ratio1q qwx wx OR OQ where w represents the vector of input prices and
qx and 1qx represent the input vectors associated with the technically efficient point Q and the
cost minimizing point 1Q respectively. The allocative inefficiency is shown by 1 OR OQ or
RQ OQ where the distance RQ is the reduction in production costs which would occur if
production occurred at 1Q ; the allocatively and technically efficient point, rather than Q ; the
technically efficient, but allocatively inefficient point (Worthington, 2001). Under the
metafrontier technological set, allocative efficiency of the firm " "P is given by the ratio
2 ** *q qwx wx OR OQ where w represents the vector of input prices and *qx and 2qx
represent the input vectors associated with the technically efficient point *Q and the cost
minimizing point 2Q respectively.
In the presence of price information, it would be possible to measure the CE as well. Let px
is the observed vector of inputs at point P . Hence, CE or the total economic efficiency i.e. the
ratio of input costs associated with px and 1qx at points P and 1Q respectively is equal to
1q pwx wx OR OP . The cost reduction achievable is the distance RP which is obtained
from moving from P to 1Q . Under the metafrontier technology, CE of the firm at point P is
equal to2 */ /q pwx wx OR OP . Moving from P to 2Q , the firm can achieve the cost reduction
4 showing the different combinations of inputs that can be purchased with a given cost outlay
8
equivalent to the distance *R P . Technical, allocative, cost and scale gap ratios can be
calculated by the respective efficiency ratios of metafrontier group frontier. These ratios are
always greater than or equal to zero and less than or equal to one; and equality at one holds
when the group frontier coincides with the metafrontier for the input and output vectors, x
and y.
Parametric SFA and/or non parametric (DEA) methods are used to estimate the efficient
Isoquant and the Isocost line using sample data in order to estimate the efficiency associated
with the rest of the firms in the sample relative to the efficient frontier. In general, despite the
advantages of DEA over Stochastic Frontier Analysis (SFA)5, most empirical studies have
used SFA method. In this study, we use the data envelopment analysis (DEA) approach to
compute the production efficiencies under the metafrontier and group frontier technologies.
4. Methods
First, technical, scale, allocative and cost efficiencies are estimated for the irrigated and rain-
fed samples separately to examine the production efficiencies in the two group frontiers. The
estimation of the metafrontier then follows, by applying the DEA methodology on the data
set obtained by pooling all observations for farms from both the groups. Average efficiency
estimates are calculated for each regime under the metafrontier and the gap ratios are
calculated. Further, t-tests are employed to see the efficiency differences in two groups. We
use the input orientation6 in this study since farmers have more control over inputs than
outputs. Finally, the estimated efficiencies by the full sample are used to identify what factors
explaining efficiency differences between irrigated and rain-fed regions using truncated
regression analysis.
4.1 Technical Efficiency
The efficiency measurement method used in this paper is derived from those presented in
Coelli et al. (2002). Three scale assumptions are generally employed in estimating production
frontier: constant returns to scale (CRS), variable returns to scale (VRS)7 and non increasing
5 See Coelli et al. (2005) for a more detailed explanation 6 With input-oriented DEA, the linear programming model is configured to determine how much the input use of a farm
could contract if used efficiently in order to achieve the same output level. 7 CRS reflects that output will change by the same proportion as inputs are changed while VRS reflects that production
technology may exhibit increasing, constant and decreasing returns to scale.
9
return to scale (NIRS). Even though we focus on VRS in our study as it is more common to
assume that agriculture would be subject to VRS, TE scores based on the CRS and NIRS are
also calculated in order to estimate SE.
Following Coelli et al. (2002), assume that there are n farms which produce m outputs using
k different inputs (n=90, m=1 i.e. rice and k=5 representing seed, fertilizer, chemicals,
labour and machinery in our case). For the thi farm, input and output data are represented by
the column vectors ix and iy . The data for all n farms are represented by k n input matrix,
X and m n output matrix, Y . The Constant Return to Scale (CRS) input oriented DEA
model for the thi farm can be expressed as,
Minimizeλ i (1)
Subject to:
0
0
0i i
i
x X
Y y
where is a scalar and is a 1n vector of input and output weights. For Variable Return to
Scale (VRS), convexity constraint, '1 1n is added, where 1n is a 1n vector of one. The
input technical efficiency score ( ) gets a value 0 1 . If the value is equal to one, the
farm is on the frontier and hence technically efficient. This paper applies smoothed
homogeneous bootstrap procedure8 following Simar and Wilson (2000) to get bias corrected
efficiency scores and their confidence intervals.
4.2 Scale Efficiency and Return to Scale
Scale efficiency is calculated by the ratio /CRS VRSSE TE TE . Scale efficiency of 1 implies
scale efficiency or CRS while SE < 1 indicates scale inefficiency that can be due to the
existence of either increasing or decreasing returns to scale. To find out whether the firm is
operating under increasing or decreasing return to scale, an additional DEA equation with
NIRS is imposed with the restriction '1 1n for the CRS specification in equation (1).
Therefore, , NIRS VRS NIRS VRS VRS CRSTE TE TE TE andTE TE relationships indicate the
existence of DRS, IRS and CRS respectively (Coelli, et al., 2005).
8 Bootstrap procedure repeatedly simulates the data generating process by re-sampling the sample data and applying the
original estimator to each simulated sample.
10
4.3 Allocative and Cost Efficiency
Cost Efficiency is related to the use of inputs that produces a given level of output at
minimum cost given the available input prices. The VRS input oriented DEA model with cost
minimization objective for the thi farm can be expressed as,
Minimize *ix
, i iw x (2)
Subject to
0,
0,
1 1,
0,
i
i
Y y
x X
n
where iw is a 1n vector of input prices for the thi farm and
*
ix is the cost minimizing vector
of input quantities for the thi farm, given the input prices iw . The total cost efficiency of the
thi firm can be calculated as,
/i i i iCE w x w x (3)
Allocative Efficiency (AE) is calculated residually as AE=CE/TE.
4.4 Truncated regression explaining the efficiency shifters
Use of regression model to determine the farm specific attributes in explaining inefficiency is
a common practise in the literature with varying explanatory variables in different studies.
Most of the early studies have used Tobit regression (Coelli, et al., 2002, Dhungana, et al.,
2004, Wadud, 2003, Wadud and White, 2000). Those who have used Tobit specification in
the second stage have justified their approach by the fact that the dependant variable, i.e.
production efficiency estimates has a censored distribution lying between 0 and 1 and
generally several efficiency estimates equal unity in a given application.
Some have proposed that OLS regression in the second stage yields consistent results than the
Tobit regression (Banker and Natarajan, 2008, McDonald, 2009). Their main argument was
that the efficiency scores are not generated by a censoring data generating process but are
fractional data generating process and the Tobit estimation in this situation is inappropriate.
However according to Simar and Wilson (2011), OLS estimation is consistent only under
very peculiar and unusual assumptions on the data generating process and the truncated
regression estimates the correct model with more consistent results. Simar and Wilson (2007)
11
argued that single and double bootstrap truncated regressions performs better in terms of
estimated confidence intervals.
The literature indicates that a range of farm characteristics determines the efficiency of farms
including land size, tenancy, labour characteristics, farm experience, extension,
infrastructure, household characteristics such as family size, age, education, etc. This study
incorporates the water availability (which is the core in this research) through a dummy
variable for water source with some other relevant farm characteristics such as seed quality,
land extent and ownership, labour participation and machinery use. Timely availability of
sufficient water is a prerequisite in rice cultivation, but it differs in different water regimes in
Sri Lanka. It is expected that the farms in irrigation schemes are likely to have higher
efficiency than those in rain-fed areas. Land fragmentation and consequent small holding
cultivation9, which is likely to have negative effects upon efficiency have become a serious
issue of concern over the years.
A priori, land owners will have higher efficiency than the tenants (Coelli, et al., 2002,
Mariano, et al., 2011, Rahman and Rahman, 2009, Yao and Shively, 2007), but the owners
who cultivate lease lands are likely to have the highest efficiency assuming their
entrepreneurial characteristics and risk loving behaviour. Based on the literature, it is
expected that the family labour (Dhungana, et al., 2004, Rahman and Rahman, 2009) and
female labour (Dhungana, et al., 2004, Rahman, 2010)will increase efficiency. Based on the
intuitive understanding on machinery use, it is likely to increase efficiency.
Three separate bootstrapped truncated regressions are defined for the dependant variables;
conventional TE, CE and AE as follows.
* 0;i ii iy z for 1, ,i n and ),0( 2 Ni (6)
where i
y is either TE, CE or AE and i
z represents a vector of explanatory variables
(1,2....8),i 1z =farm size, 2z =irrigation dummy ( Value is 1 if the farmer cultivates using
9Fragmentation of holdings is increasing. Farm size is decreasing. The average size of holdings less than 8 ha was 1.3 ha in
1946, 1.1 ha in 1962, and 0.8 ha in 1982 (Dent, D.L., and L.K.P.A. Goonewardene (1993) Resource Assessment and Land
Use Planning in Sri Lanka: A Case Study, vol. 4. London, The Environmental Planning Group, The International Institute
for Environment and Development.). This figure was 0.48 ha in 2002 based on the Agricultural Census 2002 by the
Department of Census and Statistics of Sri Lanka.
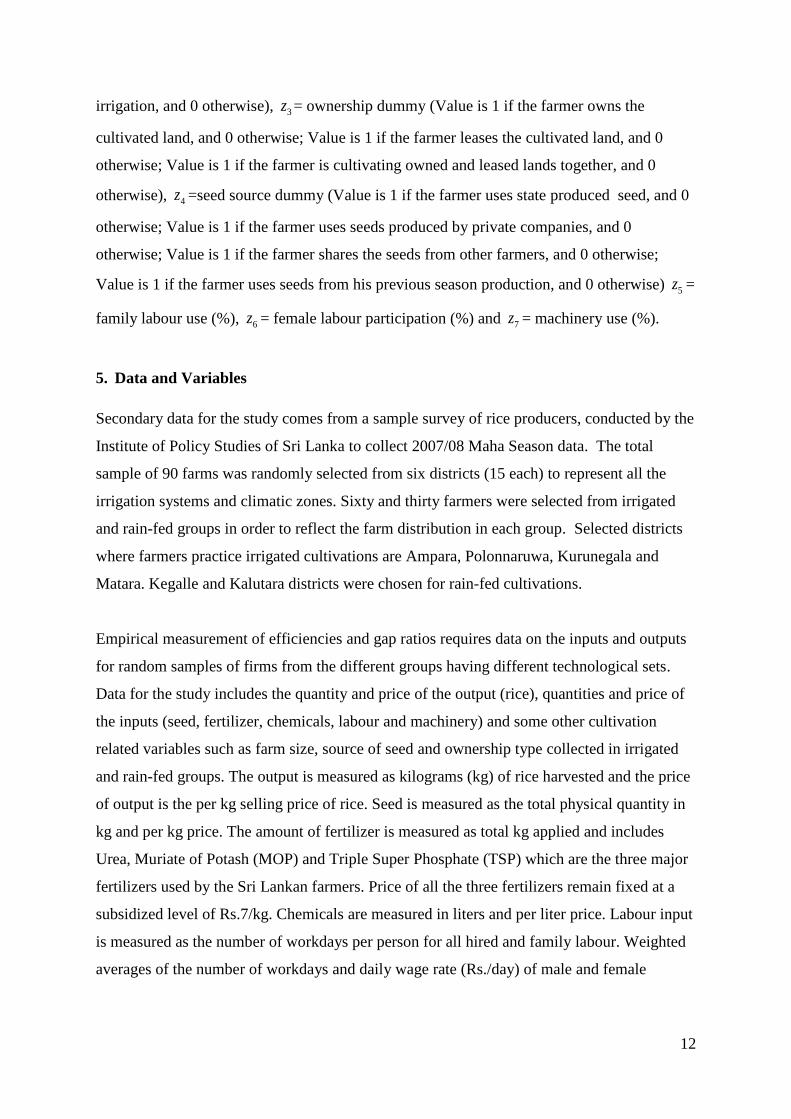
12
irrigation, and 0 otherwise), 3z = ownership dummy (Value is 1 if the farmer owns the
cultivated land, and 0 otherwise; Value is 1 if the farmer leases the cultivated land, and 0
otherwise; Value is 1 if the farmer is cultivating owned and leased lands together, and 0
otherwise), 4z =seed source dummy (Value is 1 if the farmer uses state produced seed, and 0
otherwise; Value is 1 if the farmer uses seeds produced by private companies, and 0
otherwise; Value is 1 if the farmer shares the seeds from other farmers, and 0 otherwise;
Value is 1 if the farmer uses seeds from his previous season production, and 0 otherwise) 5z =
family labour use (%), 6z = female labour participation (%) and 7z = machinery use (%).
5. Data and Variables
Secondary data for the study comes from a sample survey of rice producers, conducted by the
Institute of Policy Studies of Sri Lanka to collect 2007/08 Maha Season data. The total
sample of 90 farms was randomly selected from six districts (15 each) to represent all the
irrigation systems and climatic zones. Sixty and thirty farmers were selected from irrigated
and rain-fed groups in order to reflect the farm distribution in each group. Selected districts
where farmers practice irrigated cultivations are Ampara, Polonnaruwa, Kurunegala and
Matara. Kegalle and Kalutara districts were chosen for rain-fed cultivations.
Empirical measurement of efficiencies and gap ratios requires data on the inputs and outputs
for random samples of firms from the different groups having different technological sets.
Data for the study includes the quantity and price of the output (rice), quantities and price of
the inputs (seed, fertilizer, chemicals, labour and machinery) and some other cultivation
related variables such as farm size, source of seed and ownership type collected in irrigated
and rain-fed groups. The output is measured as kilograms (kg) of rice harvested and the price
of output is the per kg selling price of rice. Seed is measured as the total physical quantity in
kg and per kg price. The amount of fertilizer is measured as total kg applied and includes
Urea, Muriate of Potash (MOP) and Triple Super Phosphate (TSP) which are the three major
fertilizers used by the Sri Lankan farmers. Price of all the three fertilizers remain fixed at a
subsidized level of Rs.7/kg. Chemicals are measured in liters and per liter price. Labour input
is measured as the number of workdays per person for all hired and family labour. Weighted
averages of the number of workdays and daily wage rate (Rs./day) of male and female
13
workers are calculated. Total machinery quantity is measured in cost of machinery usage in
rupees, excluding the labour cost.
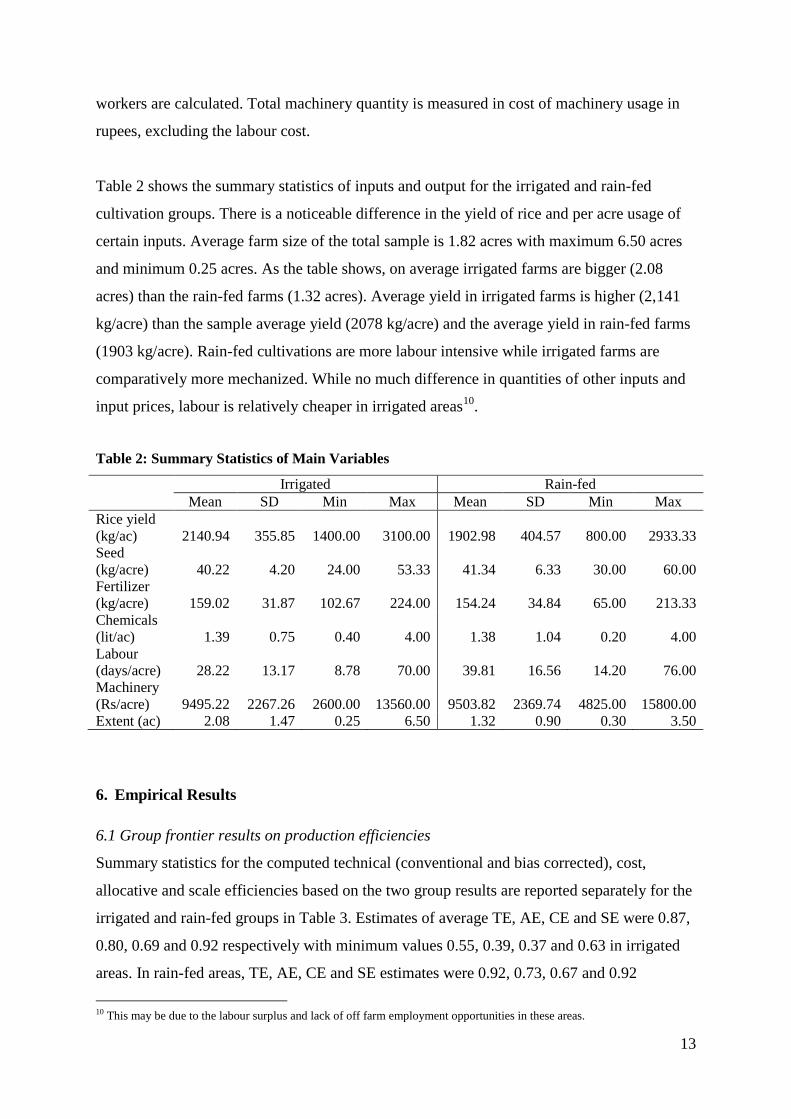
Table 2 shows the summary statistics of inputs and output for the irrigated and rain-fed
cultivation groups. There is a noticeable difference in the yield of rice and per acre usage of
certain inputs. Average farm size of the total sample is 1.82 acres with maximum 6.50 acres
and minimum 0.25 acres. As the table shows, on average irrigated farms are bigger (2.08
acres) than the rain-fed farms (1.32 acres). Average yield in irrigated farms is higher (2,141
kg/acre) than the sample average yield (2078 kg/acre) and the average yield in rain-fed farms
(1903 kg/acre). Rain-fed cultivations are more labour intensive while irrigated farms are
comparatively more mechanized. While no much difference in quantities of other inputs and
input prices, labour is relatively cheaper in irrigated areas10
.
Table 2: Summary Statistics of Main Variables
Irrigated Rain-fed
Mean SD Min Max Mean SD Min Max
Rice yield
(kg/ac) 2140.94 355.85 1400.00 3100.00 1902.98 404.57 800.00 2933.33
Seed
(kg/acre) 40.22 4.20 24.00 53.33 41.34 6.33 30.00 60.00
Fertilizer
(kg/acre) 159.02 31.87 102.67 224.00 154.24 34.84 65.00 213.33
Chemicals
(lit/ac) 1.39 0.75 0.40 4.00 1.38 1.04 0.20 4.00
Labour
(days/acre) 28.22 13.17 8.78 70.00 39.81 16.56 14.20 76.00
Machinery
(Rs/acre) 9495.22 2267.26 2600.00 13560.00 9503.82 2369.74 4825.00 15800.00
Extent (ac) 2.08 1.47 0.25 6.50 1.32 0.90 0.30 3.50
6. Empirical Results
6.1 Group frontier results on production efficiencies
Summary statistics for the computed technical (conventional and bias corrected), cost,
allocative and scale efficiencies based on the two group results are reported separately for the
irrigated and rain-fed groups in Table 3. Estimates of average TE, AE, CE and SE were 0.87,
0.80, 0.69 and 0.92 respectively with minimum values 0.55, 0.39, 0.37 and 0.63 in irrigated
areas. In rain-fed areas, TE, AE, CE and SE estimates were 0.92, 0.73, 0.67 and 0.92
10 This may be due to the labour surplus and lack of off farm employment opportunities in these areas.
14
respectively on average. Minimum efficiency estimates in rain-fed areas were 0.62, 0.52, 0.48
and 0.63 for TE, AE, CE and SE. These results negate the popular notion that rain-fed farms
are more inefficient compared to irrigated farms. There was no significant difference between
irrigated and rain-fed farms in all efficiency measures based on the t-test results.
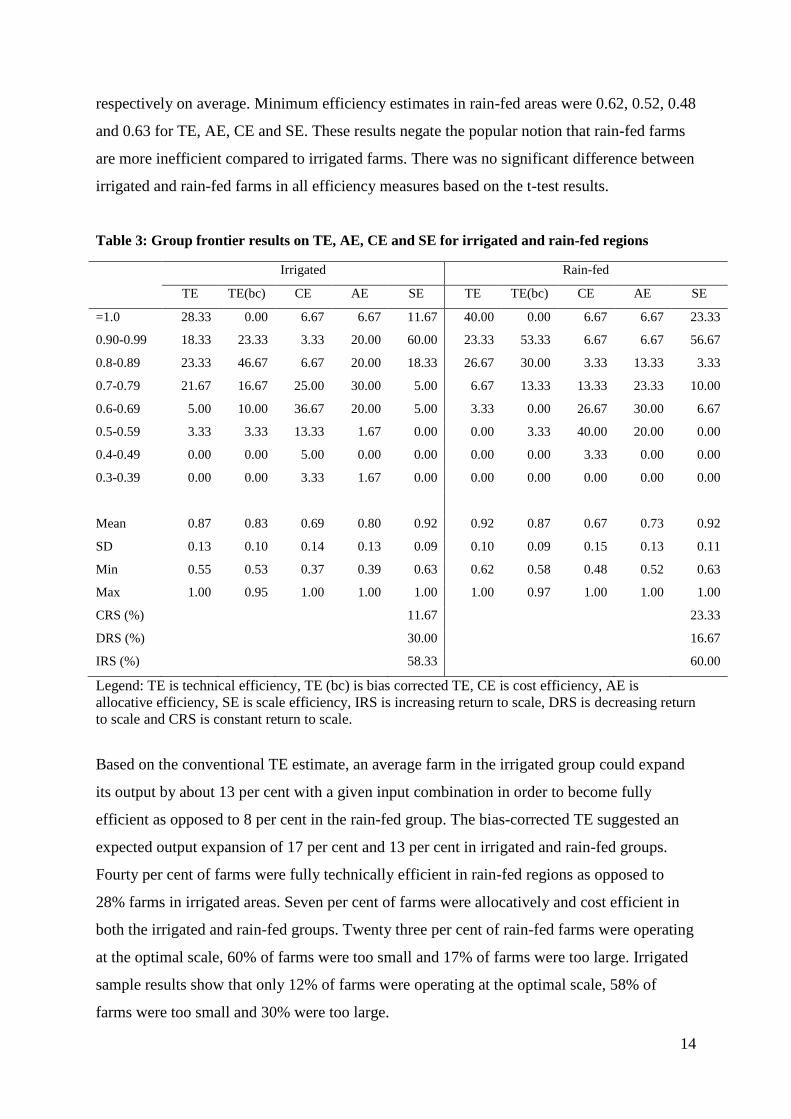
Table 3: Group frontier results on TE, AE, CE and SE for irrigated and rain-fed regions
Legend: TE is technical efficiency, TE (bc) is bias corrected TE, CE is cost efficiency, AE is
allocative efficiency, SE is scale efficiency, IRS is increasing return to scale, DRS is decreasing return
to scale and CRS is constant return to scale.
Based on the conventional TE estimate, an average farm in the irrigated group could expand
its output by about 13 per cent with a given input combination in order to become fully
efficient as opposed to 8 per cent in the rain-fed group. The bias-corrected TE suggested an
expected output expansion of 17 per cent and 13 per cent in irrigated and rain-fed groups.
Fourty per cent of farms were fully technically efficient in rain-fed regions as opposed to
28% farms in irrigated areas. Seven per cent of farms were allocatively and cost efficient in
both the irrigated and rain-fed groups. Twenty three per cent of rain-fed farms were operating
at the optimal scale, 60% of farms were too small and 17% of farms were too large. Irrigated
sample results show that only 12% of farms were operating at the optimal scale, 58% of
farms were too small and 30% were too large.
Irrigated Rain-fed
TE TE(bc) CE AE SE TE TE(bc) CE AE SE
=1.0 28.33 0.00 6.67 6.67 11.67 40.00 0.00 6.67 6.67 23.33
0.90-0.99 18.33 23.33 3.33 20.00 60.00 23.33 53.33 6.67 6.67 56.67
0.8-0.89 23.33 46.67 6.67 20.00 18.33 26.67 30.00 3.33 13.33 3.33
0.7-0.79 21.67 16.67 25.00 30.00 5.00 6.67 13.33 13.33 23.33 10.00
0.6-0.69 5.00 10.00 36.67 20.00 5.00 3.33 0.00 26.67 30.00 6.67
0.5-0.59 3.33 3.33 13.33 1.67 0.00 0.00 3.33 40.00 20.00 0.00
0.4-0.49 0.00 0.00 5.00 0.00 0.00 0.00 0.00 3.33 0.00 0.00
0.3-0.39 0.00 0.00 3.33 1.67 0.00 0.00 0.00 0.00 0.00 0.00
Mean 0.87 0.83 0.69 0.80 0.92 0.92 0.87 0.67 0.73 0.92
SD 0.13 0.10 0.14 0.13 0.09 0.10 0.09 0.15 0.13 0.11
Min 0.55 0.53 0.37 0.39 0.63 0.62 0.58 0.48 0.52 0.63
Max 1.00 0.95 1.00 1.00 1.00 1.00 0.97 1.00 1.00 1.00
CRS (%) 11.67 23.33
DRS (%) 30.00 16.67
IRS (%) 58.33 60.00
15
Results show that the farms in each group equally perform relative to the available
technological set up in their own group. However, the results suggest that farms could have
produced the same output with using fewer inputs, better mix of inputs, less costs and
changing the scale of operation in both irrigated and rain-fed areas. Especially, there is a
significant level of cost and allocative inefficiency in the farms in both the groups. However,
these results do not show the possible technical, allocative, cost and scale gaps between the
two groups unlike metafrontier results.
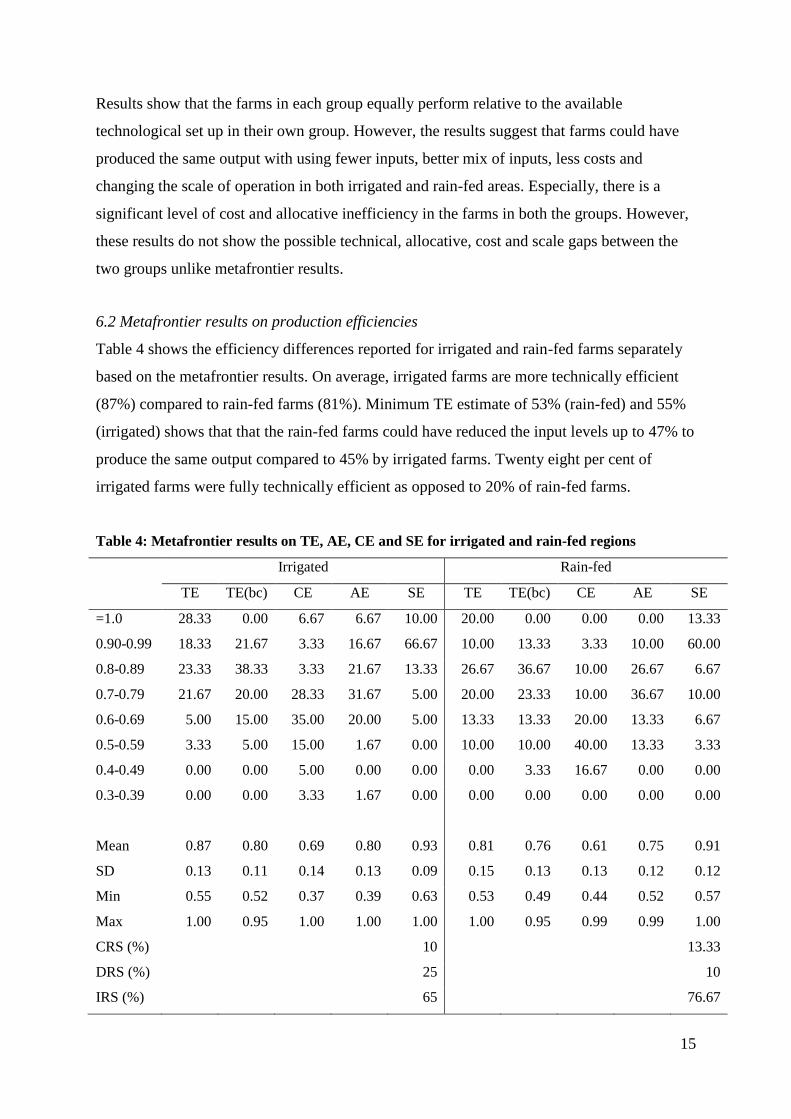
6.2 Metafrontier results on production efficiencies
Table 4 shows the efficiency differences reported for irrigated and rain-fed farms separately
based on the metafrontier results. On average, irrigated farms are more technically efficient
(87%) compared to rain-fed farms (81%). Minimum TE estimate of 53% (rain-fed) and 55%
(irrigated) shows that that the rain-fed farms could have reduced the input levels up to 47% to
produce the same output compared to 45% by irrigated farms. Twenty eight per cent of
irrigated farms were fully technically efficient as opposed to 20% of rain-fed farms.
Table 4: Metafrontier results on TE, AE, CE and SE for irrigated and rain-fed regions
Irrigated Rain-fed
TE TE(bc) CE AE SE TE TE(bc) CE AE SE
=1.0 28.33 0.00 6.67 6.67 10.00 20.00 0.00 0.00 0.00 13.33
0.90-0.99 18.33 21.67 3.33 16.67 66.67 10.00 13.33 3.33 10.00 60.00
0.8-0.89 23.33 38.33 3.33 21.67 13.33 26.67 36.67 10.00 26.67 6.67
0.7-0.79 21.67 20.00 28.33 31.67 5.00 20.00 23.33 10.00 36.67 10.00
0.6-0.69 5.00 15.00 35.00 20.00 5.00 13.33 13.33 20.00 13.33 6.67
0.5-0.59 3.33 5.00 15.00 1.67 0.00 10.00 10.00 40.00 13.33 3.33
0.4-0.49 0.00 0.00 5.00 0.00 0.00 0.00 3.33 16.67 0.00 0.00
0.3-0.39 0.00 0.00 3.33 1.67 0.00 0.00 0.00 0.00 0.00 0.00
Mean 0.87 0.80 0.69 0.80 0.93 0.81 0.76 0.61 0.75 0.91
SD 0.13 0.11 0.14 0.13 0.09 0.15 0.13 0.13 0.12 0.12
Min 0.55 0.52 0.37 0.39 0.63 0.53 0.49 0.44 0.52 0.57
Max 1.00 0.95 1.00 1.00 1.00 1.00 0.95 0.99 0.99 1.00
CRS (%) 10 13.33
DRS (%) 25 10
IRS (%) 65 76.67
16
The mean allocative efficiency score is 0.80 in irrigation schemes compared to 0.75 in rain-
fed systems. A majority of the farms in this study are not allocative efficient, i.e. these farms
did not make the correct allocation of inputs to produce the output at minimum costs. From
the irrigated group 7 per cent farms are defining the frontier, but no farm is defining the
frontier from the rain-fed group. These scores indicate that there is a lot of space to reduce
production cost by being more rational in allocating inputs especially in rain-fed systems.
Cost efficiency in rain-fed farms is significantly lower at 0.61, compared to 0.69 in irrigated
farms with minimum 0.44and 0.37. This suggests that irrigated farms can reduce their input
cost, on average, by 31% without reducing their existing output and this reduction can go up
to a maximum of 63%. Rain-fed farms can reduce their input cost, on average, by 39% to
produce the same level of output and this reduction can go up to 56%. Seven per cent of
irrigated farms are defining the frontier as opposed to no farms from the rain-fed group.
Average scale efficiency estimates are 0.93 (irrigated) and 0.91 (rain-fed) with only 10%
(irrigated) and 13% (rain-fed) farms operating at the optimal scale. Of irrigated farms, only
25 % of farms were too large having DRS compared with 65% being too small having IRS.
Ten percent of rain-fed farms were too small and 77% were too large. However, many farms
are operated closer to the frontier in both categories. There was significant difference
between irrigated and rain-fed farms in technical and cost efficiency measures based on the t-
test results. Results suggests that rain-fed farms could have become more efficient by using
fewer inputs, better allocation of inputs, reducing costs and achieving the proper scale than
irrigated farms.
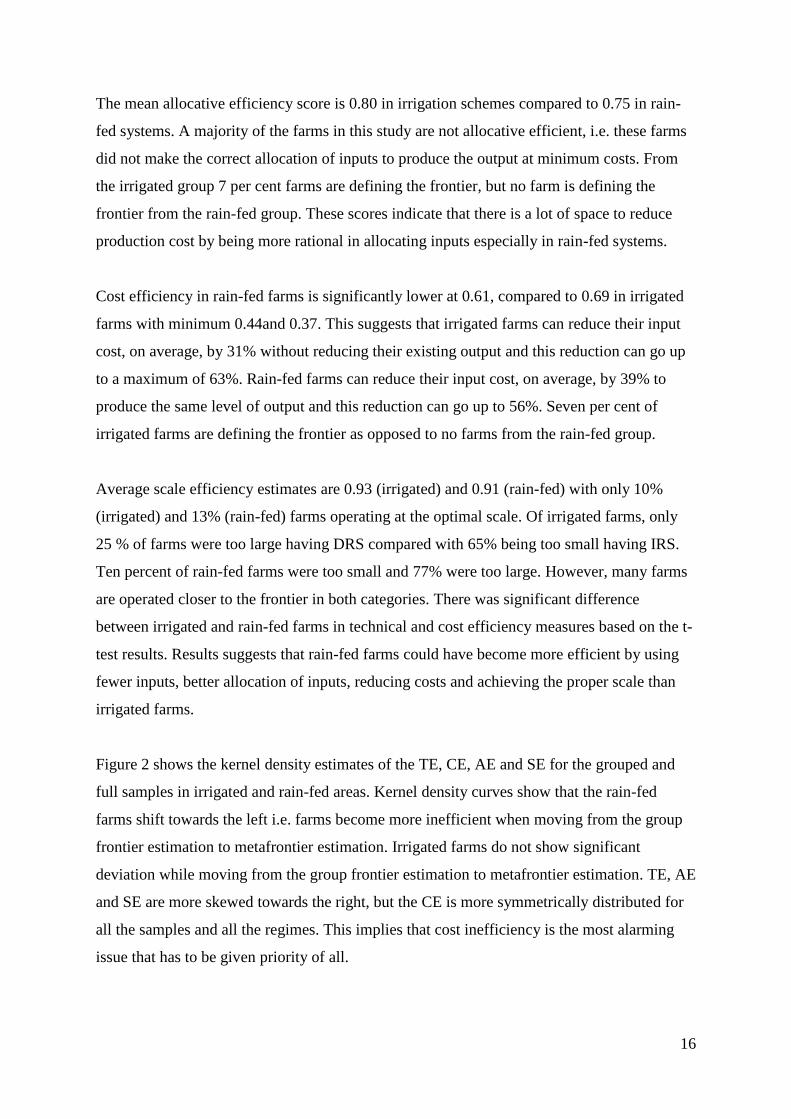
Figure 2 shows the kernel density estimates of the TE, CE, AE and SE for the grouped and
full samples in irrigated and rain-fed areas. Kernel density curves show that the rain-fed
farms shift towards the left i.e. farms become more inefficient when moving from the group
frontier estimation to metafrontier estimation. Irrigated farms do not show significant
deviation while moving from the group frontier estimation to metafrontier estimation. TE, AE
and SE are more skewed towards the right, but the CE is more symmetrically distributed for
all the samples and all the regimes. This implies that cost inefficiency is the most alarming
issue that has to be given priority of all.
17
Figure 2: Kernel distribution of efficiency scores in irrigated and rain-fed farms
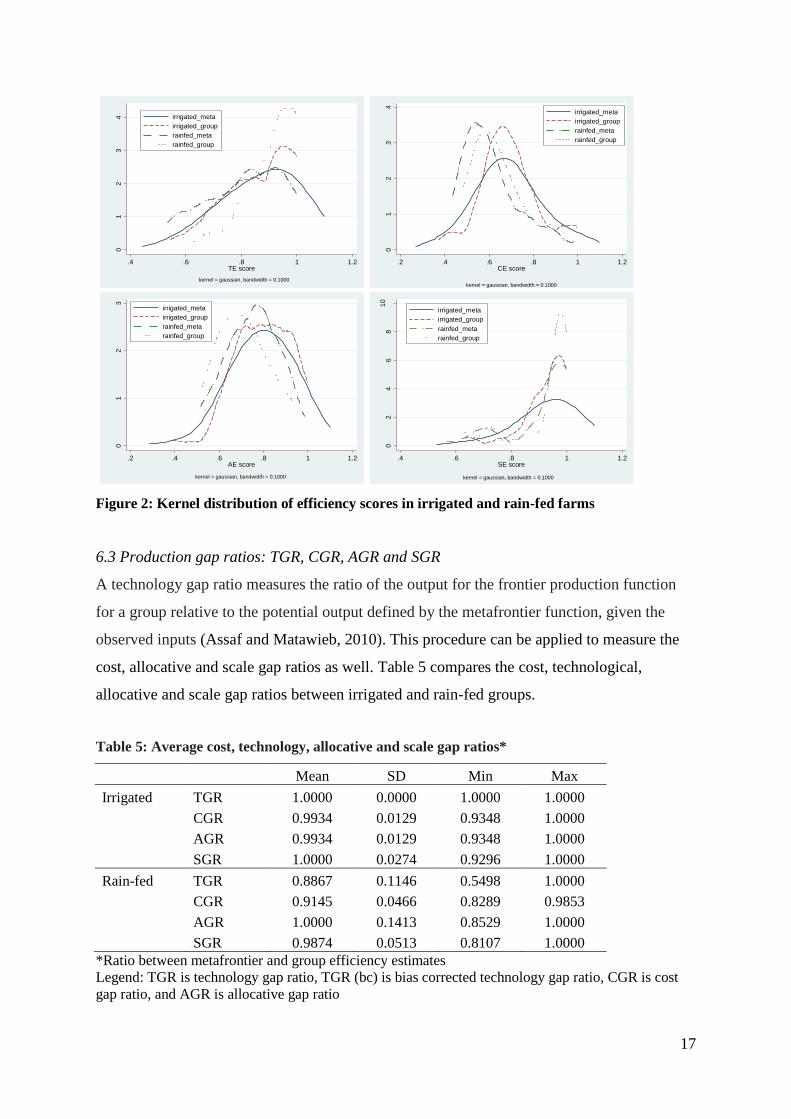
6.3 Production gap ratios: TGR, CGR, AGR and SGR
A technology gap ratio measures the ratio of the output for the frontier production function
for a group relative to the potential output defined by the metafrontier function, given the
observed inputs (Assaf and Matawieb, 2010). This procedure can be applied to measure the
cost, allocative and scale gap ratios as well. Table 5 compares the cost, technological,
allocative and scale gap ratios between irrigated and rain-fed groups.
Table 5: Average cost, technology, allocative and scale gap ratios*
Mean SD Min Max
Irrigated TGR 1.0000 0.0000 1.0000 1.0000
CGR 0.9934 0.0129 0.9348 1.0000
AGR 0.9934 0.0129 0.9348 1.0000
SGR 1.0000 0.0274 0.9296 1.0000
Rain-fed TGR 0.8867 0.1146 0.5498 1.0000
CGR 0.9145 0.0466 0.8289 0.9853
AGR 1.0000 0.1413 0.8529 1.0000
SGR 0.9874 0.0513 0.8107 1.0000
*Ratio between metafrontier and group efficiency estimates
Legend: TGR is technology gap ratio, TGR (bc) is bias corrected technology gap ratio, CGR is cost
gap ratio, and AGR is allocative gap ratio
01
23
4
Den
sity
.4 .6 .8 1 1.2TE score
irrigated_meta
irrigated_group
rainfed_meta
rainfed_group
kernel = gaussian, bandwidth = 0.1000
01
23
4
Den
sity
.2 .4 .6 .8 1 1.2CE score
irrigated_meta
irrigated_group
rainfed_meta
rainfed_group
kernel = gaussian, bandwidth = 0.1000
01
23
Den
sity
.2 .4 .6 .8 1 1.2AE score
irrigated_meta
irrigated_group
rainfed_meta
rainfed_group
kernel = gaussian, bandwidth = 0.1000
02
46
81
0
Den
sity
.4 .6 .8 1 1.2SE score
irrigated_meta
irrigated_group
rainfed_meta
rainfed_group
kernel = gaussian, bandwidth = 0.1000
18
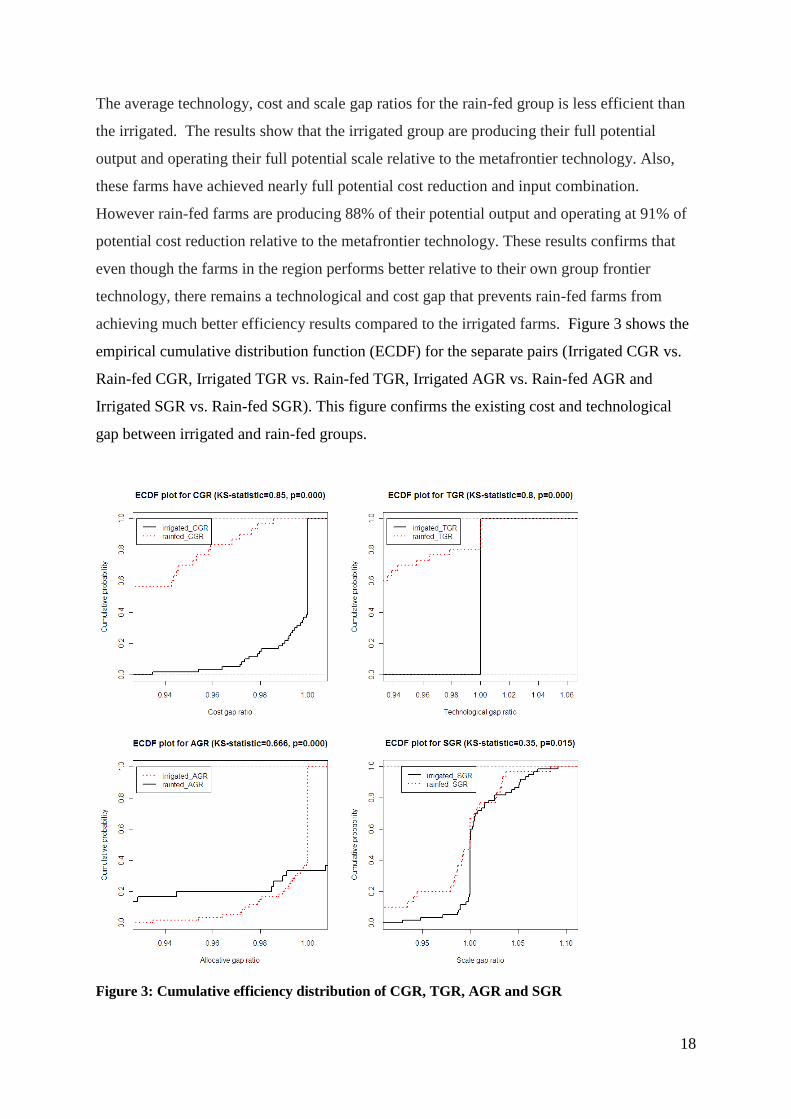
The average technology, cost and scale gap ratios for the rain-fed group is less efficient than
the irrigated. The results show that the irrigated group are producing their full potential
output and operating their full potential scale relative to the metafrontier technology. Also,
these farms have achieved nearly full potential cost reduction and input combination.
However rain-fed farms are producing 88% of their potential output and operating at 91% of
potential cost reduction relative to the metafrontier technology. These results confirms that
even though the farms in the region performs better relative to their own group frontier
technology, there remains a technological and cost gap that prevents rain-fed farms from
achieving much better efficiency results compared to the irrigated farms. Figure 3 shows the
empirical cumulative distribution function (ECDF) for the separate pairs (Irrigated CGR vs.
Rain-fed CGR, Irrigated TGR vs. Rain-fed TGR, Irrigated AGR vs. Rain-fed AGR and
Irrigated SGR vs. Rain-fed SGR). This figure confirms the existing cost and technological
gap between irrigated and rain-fed groups.
Figure 3: Cumulative efficiency distribution of CGR, TGR, AGR and SGR
19
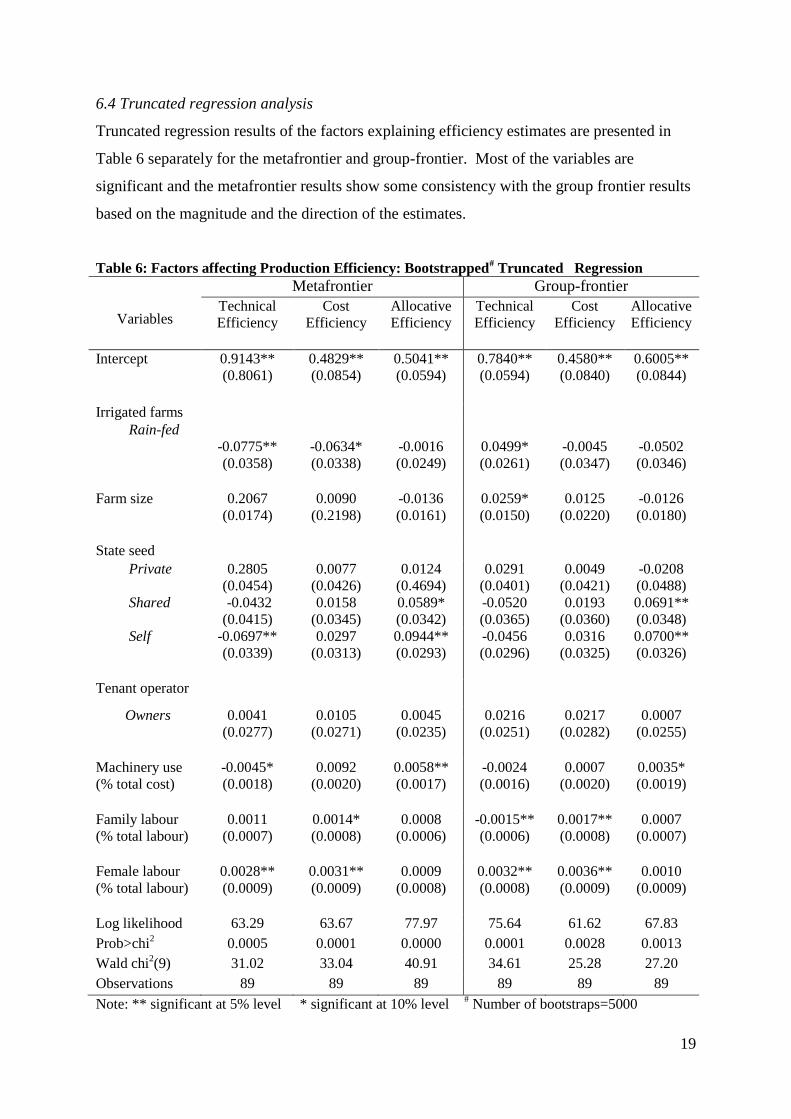
6.4 Truncated regression analysis
Truncated regression results of the factors explaining efficiency estimates are presented in
Table 6 separately for the metafrontier and group-frontier. Most of the variables are
significant and the metafrontier results show some consistency with the group frontier results
based on the magnitude and the direction of the estimates.
Table 6: Factors affecting Production Efficiency: Bootstrapped# Truncated Regression
Variables
Metafrontier Group-frontier
Technical
Efficiency
Cost
Efficiency
Allocative Efficiency
Technical
Efficiency
Cost
Efficiency
Allocative Efficiency
Intercept
0.9143** (0.8061)
0.4829** (0.0854)
0.5041** (0.0594)
0.7840** (0.0594)
0.4580** (0.0840)
0.6005** (0.0844)
Irrigated farms
Rain-fed
-0.0775** (0.0358)
-0.0634* (0.0338)
-0.0016 (0.0249)
0.0499* (0.0261)
-0.0045 (0.0347)
-0.0502 (0.0346)
Farm size 0.2067
(0.0174) 0.0090
(0.2198) -0.0136 (0.0161)
0.0259* (0.0150)
0.0125 (0.0220)
-0.0126 (0.0180)
State seed Private 0.2805
(0.0454) 0.0077
(0.0426) 0.0124
(0.4694) 0.0291
(0.0401) 0.0049
(0.0421) -0.0208 (0.0488)
Shared -0.0432 (0.0415)
0.0158 (0.0345)
0.0589* (0.0342)
-0.0520 (0.0365)
0.0193 (0.0360)
0.0691** (0.0348)
Self -0.0697** (0.0339)
0.0297 (0.0313)
0.0944** (0.0293)
-0.0456 (0.0296)
0.0316 (0.0325)
0.0700** (0.0326)
Tenant operator
Owners 0.0041 (0.0277)
0.0105 (0.0271)
0.0045 (0.0235)
0.0216 (0.0251)
0.0217 (0.0282)
0.0007 (0.0255)
Machinery use (% total cost)
-0.0045* (0.0018)
0.0092 (0.0020)
0.0058** (0.0017)
-0.0024 (0.0016)
0.0007
(0.0020)
0.0035* (0.0019)
Family labour (% total labour)
0.0011 (0.0007)
0.0014* (0.0008)
0.0008 (0.0006)
-0.0015** (0.0006)
0.0017** (0.0008)
0.0007 (0.0007)
Female labour (% total labour)
0.0028** (0.0009)
0.0031** (0.0009)
0.0009 (0.0008)
0.0032** (0.0008)
0.0036** (0.0009)
0.0010 (0.0009)
Log likelihood 63.29 63.67 77.97 75.64 61.62 67.83
Prob>chi2 0.0005 0.0001 0.0000 0.0001 0.0028 0.0013
Wald chi2(9) 31.02 33.04 40.91 34.61 25.28 27.20
Observations 89 89 89 89 89 89
Note: ** significant at 5% level * significant at 10% level # Number of bootstraps=5000
20
Compared to the irrigated farms, the rain-fed farms are less efficient in all three efficiency
measures under the metafrontier technology and in CE and AE in group frontier technology.
The major reason may be that rain-fed cultivations are often more prone to water stress due to
the uncertainty and variability of the rainfall and timely unavailability of water than irrigated
cultivations. This may suggest that availability of water is a key factor determining
efficiency. These results conform to the popular belief that irrigation shifts the production
frontier to a higher level (Gunaratne and Thiruchelvam, 2002, Makombe, et al., 2007,
Makombe, et al., 2011, Thiruchelvam, 2005a, Tilahun, et al., 2011).
The positive coefficient for farm size variable with the TE and CE under the both
technological settings indicates larger farms are able to produce more output per input use
and at a lower cost relative to smaller farms. Lower AE of large farms relative to small farms
may be due to poor selection of input mix due to increased access to various inputs. Use of
seed from private traders significantly improves efficiency but the use of own and shared
seed seems to significantly reduce TE than using state produced seed. The reason could
primarily be the higher quality of seed produced by private seed producers, which is often
lacking if self produced.
Land ownership results indicate that the owner operators are more efficient than the tenants.
These findings are similar to the findings of the studies done by Coelli, et al. (2002), Marino,
et al. (2011), Rahman and Rahman (2009) and Yao and Shively (2007). These results may be
attributed to the over-use of inputs such as labour by the tenants and timely availability and
accessibility to the major input resources by the land owners. Due to the lack of off-farm
economic activities, tenants and their families tend to spent most of their time cultivating
their small rented land.
Increased machinery use improves the allocative and cost efficiencies. On the other hand,
excessive machinery use in small plots might have the potential of diminishing the technical
efficiency. The share of family labour and female labour endowments to total labour has a
statistically significant positive impact on all the efficiency measures. The former may be due
to that family labour put more effort on taking care of the plants and this increases the
efficiency of some other inputs. Studies by Dhungana, et al. (2004) and Rahman and Rahman
(2009) find similar results. A possible explanation for the latter could be Females are used
21
only for certain activities so that labour specialization stimulates more production efficiency.
These comply with the results obtained by Dhungana, et al. (2004) and Rahman (2010).
7. Conclusion
The study analysed the differences of technical, allocative, cost and scale efficiencies of
irrigated and rain-fed rice farmers in Sri Lanka in two different perspectives; first, relative to
a common metafrontier, defined as the boundary of an unrestricted technology set and second
relative to group frontiers defined to be the boundaries of restricted technology sets in each
group. We find, first, there are inefficiencies associated with input use, input cost, input
allocation and the scale of cultivation in both the irrigated and rain-fed groups. On average,
farms tend to be more technically and scale efficient, than allocative efficient or cost
efficient. Cost efficiency is the most alarming issue of all.
Second, we find rain-fed group performance is comparable with that of irrigated group i.e.
farms in the two groups are equally efficient relative to the farms in the same region. Third
and most importantly, we find that rain-fed farms move significantly towards inefficiency
compared to the irrigated farms under the metafrontier technology. Thus, there is a
considerable degree of inefficiency in rain-fed rice farms compared to the irrigated rice farms
in all efficiency measures. Results indicate that the irrigation shifts the rice sector production
frontier to a higher level and the rain-fed farmers may be operating as technically efficient as
they could, given the existing production technology.
This suggests that the agricultural development in the rain-fed sector should focus on the
strategies that shift the production frontier to higher levels. As the expansion of the irrigated
systems in rain-fed areas is not possible in the short run due to technical and financial
constraints, productive efficiency of the rain-fed system needs to be improved by managing
the efficiency enhancing factors such as farm size, seed quality and ownership issue. Further
suitable management and agronomic practices such as integrating rain-fed and irrigated
farming and synchronizing cropping calendars to suit the water availability is recommended.
Promoting cultivation systems approach which organizes small scale cultivations in to
comparatively larger collective systems with the collaboration of the government, farmer
22
organizations and the private sector, would be a possible solution to inefficiencies attached
with the small lands. Private sector produced seed use is efficiency enhancing primarily due
to the high quality resulting from improved resources and expertise. Expanding state seed
production and encouraging private sector participation in seed paddy production are required
in order to replace low quality informal sector seed use with the high quality formal sector
seed use. Considering the cost of production aspects associated with private sector produced
seeds, self seed production should have to be incorporated with sufficient extension services
and training on quality seed rice production. Use of more family labour and female labour
was found to be efficiency enhancing and should be encouraged especially in small scale
farms in rain-fed regions.
Using time series data coming from the same sample of farmers over the both agricultural
seasons and incorporating other important variables such as land quality, agricultural
extension, credit, weather conditions and other household characteristics (age, experience,
education, etc.) in the second stage regression can be done to increase the robustness of the
results.
References
Adhikarinayake, T.B. 2005. "Methodical Design Process to Improve Income of Paddy Farmers in Sri
Lanka." PhD Thesis, Wageningen University, The Netherlands.
Assaf, A., and K.M. Matawieb. 2010. "A bootstrapped metafrontier model." Applied Economics
Letters 17:613-617.
Bäckman, S., K. Islam, and J. Sumelius. 2011. "Determinants of Technical Efficiency of Rice Farms
in North-Central and North-Western Regions in Bangladesh." The Journal of Developing
Areas 45(1):73.
Balcombe, K., I. Fraser, L. Latruffe, M. Rahman, and L. Smith. 2008. "An application of the DEA
double bootstrap to examine sources of efficiency in Bangladesh rice farming." Applied
Economics 40:1919-1925.
Balcombe, K., F. Lain, R. Mizanur, and S. Laurence. 2007. "Examining the technical efficiency of
rice producers in Bangladesh." Journal of International Development 19(1):1-16.
Banker, R.D., and R. Natarajan. 2008. "Evaluating Contextual Variables Affecting Productivity Using
Data Envelopment Analysis." Operations Research 56(1):48-58.
Battese, G.E., D.S.P. Rao, and C.J. O'Donnell. 2004. "A Metafrontier Production Function for
Estimation of Technical Efficiencies and Technology Gaps for Firms Operating Under
Different Technologies." Journal of Productivity Analysis 21(1):91-103.
23
Brazdik, F. "Non parametric analysis of Technical Efficiency: Factors affecting Efficiency of West
Java Rice Farms." CERGE- Economics Institute, Charles University, Prague.
CBSL. 2010. Annual Report-2010. Colombo: Central Bank of Sri Lanka.
Chemak, F., J.-P. Boussemart, and F. Jacquet. 2010. "Farming system performance and water use
efficiency in the Tunisian semi-arid region: data envelopment analysis approach."
International Transactions in Operational Research 17(3):381-396.
Christopher, O.D., P. Rao, and G.E. Battese. 2008. "Metafrontier frameworks for the study of firm
level efficiencies and technology ratios." Empirical Economics 34:231-255.
Coelli, T., S. Rahman, and C. Thirtle. 2002. "Technical, Allocative, Cost and Scale Efficiencies in
Bangladesh Rice Cultivation: A Non-parametric Approach." Journal of Agricultural
Economics 53(3):607-626.
Coelli, T.J., P. Rao, C.J. O'Donnell, and G.E. Battese. 2005. An introduction to efficiency and
productivity analysis. New York: Springer.
Dent, D.L., and L.K.P.A. Goonewardene (1993) Resource Assessment and Land Use Planning in Sri
Lanka: A Case Study, vol. 4. London, The Environmental Planning Group, The International
Institute for Environment and Development.
Dhanapala, M.P. (2000) Bridging the Rice Yield Gap in Sri Lanka, ed. M. Papademetrious, Dent F.J.
and Herath, E. M. Bangkok, Thailand., Food and Agricultural Organization of the United
Nations.
Dhungana, B.R., P.L. Nuthall, and G.V. Nartea. 2004. "Measuring the economic inefficiency of
Nepalese rice farms using data envelopment analysis." Australian Journal of Agricultural and
Resource Economics 48(2):347-369.
DOA (2011) Rice. Retrieved from http://www.agridept.gov.lk/index.php/en/crop-
recommendations/808, vol. 2011, Department of Agriculture, Sri Lanka.
Ekanayake, S.A.B., and S.K. Jayasuriya. 1987. "Measurement of Firm-Specific Technical Efficiency:
A Comparison of Methods." Journal of Agricultural Economics 38(1):115-122.
Gedara, K.M., C. Wilson, S. Pascoe, and T. Robinson. 2012. "Factors Affecting Technical Efficiency
of Rice Farmers in Village Reservoir Irrigation Systems of Sri Lanka." Journal of
Agricultural Economics:no-no.
Gunaratne, S., and S. Thiruchelvam. 2002. "Comparative Study on Technical Efficiency of Paddy
Production under Major and Minor Irrigation Schemes in Anuradhapura District." Tropical
Agricultural Research Vol. 14.
IPS. "State of the Economy (SOE) report." Institute of Policy Studies of Sri Lanka.
Karunarathne, S.S., and H.M.G.Herath. 1989. "Efficiency of Rice Production under Major Irrigation
Conditions: A Frontier Production Function Approach." Tropical Agricultural Research
Vol.1.
24
Kelemework, D. (2006) A Comparative Analysis of the Technical Efficiency of Irrigated and Rainfed
Agriculture: A Case of Awash and Rift Valleys of Ethiopia. Haramaya, Nigeria, Department
of Economics, Haramaya University.
Khan, A., F.A. Huda, and A. Alam. 2010. "Farm Household Technical Efficiency: A Study on Rice
Producers in Selected Areas of Jamalpur District in Bangladesh." European Journal of Social
Sciences 14(2):262-271.
Kikuchi, M., R. Barker, M. Samad, and P. Weligamage. 2000. "Comparative Advantage of Rice
Production in an Ex-rice Importing Country: The Case of Sri Lanka." Paper presented at 3rd
Conference of Asian Society of Agricultural Economists Jaipur, India.
Latruffe, L., S. Davidova, and K. Balcombe. 2008. "Application of a double bootstrap to investigation
of determinants of technical efficiency of farms in Central Europe." Journal of Productivity
Analysis 29(2):183-191.
Makombe, G., D. Kelemework, and D. Aredo. 2007. "A comparative analysis of rainfed and irrigated
agricultural production in Ethiopia." Irrigation and Drainage Systems 21(1):35-44.
Makombe, G., R. Namara, F. Hagos, S.B. Awulachew, M. Ayana, and D. Bossio (2011) A
comparative analysis of the technical efficiency of rain-fed and smallholder irrigation in
Ethiopia, vol. IWMI Working paper 143. Colombo, Sri Lanka, International Water
Management Institute.
Mariano, M.J., R. Villano, and E. Fleming. 2010. "Are irrigated farming ecosystems more productive
than rainfed farming systems in rice production in the Philippines?" Agriculture, Ecosystems
& Environment 139(4):603-610.
---. 2011. "Technical Efficiency of Rice Farms in Different Agroclimatic Zones in the Philippines: An
Application of a Stochastic Metafrontier Model." Asian Economic Journal 25(3):245-269.
---. 2011. "Technical Efficiency of Rice Farms in Different Agroclimatic Zones in the Philippines: An
Application of a Stochastic Metafrontier Model*." Asian Economic Journal 25(3):245-269.
McDonald, J. 2009. "Using least squares and tobit in second stage DEA efficiency analyses."
European Journal of Operational Research 197(2):792-798.
Mugera, A.W., and M. Langemeier. 2011. "Does Farm Size and Specialization Matter for Productive
Efficiency? Results from Kansas." Journal of Agricultural and Applied Economics 43(4):515-
528.
Oude Lansink, A., and E. Silva. 2004. "Non-parametric Production Analysis of Pesticides Use in the
Netherlands." Journal of Productivity Analysis 21(1):49-65.
Rafeek, M.I.M., and P.A. Samarathunga. "An Analysis of Competitiveness of the Rice Sector in Sri
Lanka." Socio Economic and Planning Centre, Department of Agriculture. Peradeniya. Sri
Lanka.
Rahman, S. 2010. "Women’s Labour Contribution to Productivity and Efficiency in Agriculture:
Empirical Evidence From Bangladesh." Journal of Agricultural Economics 61(2):318-342.
25
Rahman, S., and M. Rahman. 2009. "Impact of land fragmentation and resource ownership on
productivity and efficiency: The case of rice producers in Bangladesh." Land Use Policy
26(1):95-103.
Rahman, S., A. Wiboonpongse, S. Sriboonchitta, and Y. Chaovanapoonphol. 2009. "Production
Efficiency of Jasmine Rice Producers in Northern and North-eastern Thailand." Journal of
Agricultural Economics 60(2):419-435.
Simar, L., and P. Wilson. 2011. "Two-stage DEA:caveat emptor." Journal of Productivity Analysis
36(2):205-218.
Simar, L., and P.W. Wilson. 2007. "Estimation and inference in two-stage, semi-parametric models of
production processes." Journal of Econometrics 136(1):31-64.
---. 2000. "A General Methodology for Bootstrapping in Non-Parametric Frontier Models." Journal of
Applied Statistics 27(6):779-802.
---. 1998. "Sensitivity Analysis of Efficiency Scores: How to Bootstrap in Nonparametric Frontier
Models." Management Science 44(1):49-61.
Tan, S., N. Heerink, A. Kuyvenhoven, and F. Qu. 2010. "Impact of land fragmentation on rice
producers’ technical efficiency in South-East China." NJAS - Wageningen Journal of Life
Sciences 57(2):117-123.
Thibbotuwawa, M., A. Mugera, and B. White. 2012. "A Non-Parametric Analysis of Rice Production
Efficiency in Sri Lanka." Paper presented at 56th AARES annual conference. Fremantle,
Western Australia, February7-10, 2012.
Thiruchelvam, S. 2005b. "Agricultural Production Efficiency of Bethma Cultivation in Mahaweli
System H." Sri Lankan Journal of Agricultural Economics 7(1):1-20.
---. 2005a. "Efficiency of Rice Production and Issues Relating to Cost of Production in the Districts of
Anuradhapura and Polonnaruwa Districts." Journal of National Science Foundation Sri
Lanka 33(4):247-256.
Tilahun, H., E. Teklu, M. Michael, H. Fitsum, and S.B. Awulachew. 2011. "Comparative
Performance of Irrigated and Rainfed Agriculture in Ethiopia." World Applied Sciences
Journal 14(2):235-244.
Udayanganie, D., P. Prasada, S. Kodithuwakku, J. Weerahewa, and C. Little. 2006. "Efficiency of the
Agrochemical Input Usage in the Paddy Farming Systems in the Dry Zone of Sri Lanka."
Paper presented at Canadian Agricultural Economic Society Annual Meeting, May 25-28,
2006, . Montreal, Quebec, May 25-28, 2006,.
Villano, R., and E. Fleming. 2006. "Technical Inefficiency and Production Risk in Rice Farming:
Evidence from Central Luzon Philippines." Asian Economic Journal 20(1):29-46.
Wadud, A. 2003. "Technical, Allocative, and Economic Efficiency of Farms in Bangladesh: A
Stochastic Frontier and DEA Approach." The Journal of Developing Areas 37(1 ):109-126.

26
Wadud, A., and B. White. 2000. "Farm household efficiency in Bangladesh: a comparison of
stochastic frontier and DEA methods." Applied Economics 32(13):1665-1673.
Weerahewa, J., H.M. Gunatilake, and H. Pitigala. 2003. "Future of Paddy Farming in Sri Lanka:
Scale, Comparative Advantage and Rural Poverty." Sri Lanka Economic Journal 3(2):104-
144.
Worthington, A. 2001. "An Empirical Survey of Frontier Efficiency Measurement Techniques in
Education." Education Economics 9(3):245-268.
Yao, R.T., and G.E. Shively. 2007. "Technical Change and Productive Efficiency: Irrigated Rice in
the Philippines." Asian Economic Journal 21(2):155-168.