Embed Size (px)
Citation preview

THE CURRENT RAIN-FED AND IRRIGATED PRODUCTION OF FOOD CROPS AND ITS POTENTIAL TO MEET THE
YEAR-ROUND NUTRITIONAL REQUIREMENTS OF RURAL POOR PEOPLE IN NORTH WEST, LIMPOPO,
KWAZULU-NATAL AND THE EASTERN CAPE
Report to the
WATER RESEARCH COMMISSION
and
DEPARTMENT OF AGRICULTURE, FORESTRY & FISHERIES
by
SL Hendriks, A Viljoen, D Marais, F Wenhold, AM McIntyre, MS Ngidi, C van der Merwe, J Annandale and M Kalaba
Institute for Food, Nutrition and Well-being University of Pretoria
with
D Stewart Lima Rural Development Foundation
WRC Report No. 2172/1/16 ISBN 978-1-4312-0836-4
September 2016

ii
Obtainable from Water Research Commission Private Bag X03 Gezina, 0031 [email protected] or download from www.wrc.org.za
DISCLAIMER This report has been reviewed by the Water Research Commission (WRC) and
approved it for publication. Approval does not signify that the contents necessarily reflect the views and policies of the WRC or the University of Pretoria (UP), nor does mention of trade
names or commercial products constitute endorsement or recommendation for use.
© Water Research Commission & University of Pretoria

iii
EXECUTIVE SUMMARY
While there is not much evidence of widespread starvation and extreme undernutrition in South Africa, national surveys provide evidence of multiple forms of deprivation related to the experience of hunger, widespread manifestation of hidden hunger or micronutrient deficiencies and increasing rates of overweight and obesity. Moreover, the co-existence of adult (especially female) overweight and obesity with hidden hunger and child malnutrition raises serious concerns over household food security. Despite a multitude of state, private sector and non-governmental agency (NGO)-funded food security programmes, South Africa is one of only 12 countries in the world where stunting has increased over the Millennium Development Goal (MDG) period. It is also the only country in the Southern African Development Community (SADC) region where child stunting has not decreased. The increasing incidence of overweight among women and children raises alarm. This indicates severe inadequacies related to the diets of South Africans and highlights the importance of understanding the constraints faced by households in achieving food security to ensure health, productivity and development. A baseline and scoping study commissioned by the Water Research Commission (WRC Report No. TT 537/12) has revealed numerous knowledge gaps with regard to smallholder production and food security in South Africa. The study highlighted that there is limited current and generalisable food security and nutrition research in South Africa. Very few studies have investigated the year-round source(s) of food for the rural poor. In particular, agricultural interventions to improve human nutrition and the (indirect) eventual outcomes of health, education and economics are practically non-existent. The study identified two specific knowledge gaps. Firstly, it identified that the contribution of home- or smallholder-grown foods to total dietary intake and nutritional requirements (in the context of an in-depth description of the food environment and its links to water) is not known. Secondly, the effect of seasonality on home or smallholder production is not documented. This project set out to address this significant and longstanding gap in knowledge and to propose a set of options for strengthening rain-fed and irrigated crop production in the rural areas investigated to identify the research focus areas related to efficient water use that could directly overcome dietary inadequacies and lead to better nutrition of rural household members. This unique study drew on a transdisciplinary research approach to investigate the consumption and production patterns of rural households in communities in four selected sites in the poorest local municipalities in South Africa. This report presents the findings of this study. A desk study identified the poorest districts in the four provinces identified by the WRC for this study: Eastern Cape, KwaZulu-Natal, Limpopo and North West. The most deprived local municipalities in each district were identified from existing data on poverty and child undernutrition. Two enumeration area units from each local municipality were randomly

iv
selected from areas classified as ‘traditional rural’ for the Ingquza Hill, Maruleng and Ratlou municipalities. In this way, one area was selected for Jozini. The population of available and accessible farm households from a list of Mjindi irrigation scheme members residing in Jozini comprised the second sample in this area. Between 2013 and 2015, data was collected qualitatively and quantitatively through focus group discussions (FGDs), key informant interviews and a two-round panel survey to cover both the summer and winter seasons at each site. The food security situation of the households was assessed using the anthropometry of children between 24 and 59 months and their female caregivers, food consumption frequencies and the diversity of their diets. Qualitative and quantitative data related to production and consumption was used to identify what crops could improve the dietary diversity and nutrition of these households and to compare the nutritional status, dietary diversity and food consumption patterns of households engaged in rain-fed and irrigated crop production with households not engaged in crop production. The agronomic conditions in the four sites were examined and crops that could grow in these areas were identified. The food consumption gaps and potential crops were prioritised in terms of which crops could be grown to improve the diets in each site. The prioritised list of crops was presented to the communities for validation. It is clear from the findings of this study that most households are food insecure, with inadequate food available to meet the requirements for a diversified diet. Roughly one in four households reported experiencing hunger for most months of the year, but the majority of households (more than one in three) reported experiencing hunger in January. In terms of food availability, it seemed that most households were able to purchase enough of the staple maize meal, which is consumed by all the households every day. Relatively few young children and their female caregivers were underweight, but there was substantial evidence of extensive hidden hunger. The largely starch-based diet is likely to be the underlying reason for both growth faltering in children and overweight in women. A high proportion of female caregivers were overweight and obese, suggesting that for most households, sufficient dietary energy in the form of the staple food – refined, purchased white maize – is available. The high levels of stunting indicate that the children included in the survey experienced growth faltering early in life. What is of concern, however, is how many of these stunted children were also overweight. Hidden hunger is characterised by inadequate dietary diversity and micronutrient deficiencies. Although no clinical tests were conducted to confirm this, the lack of dietary diversity and the daily consumption of foods from multiple food groups are indicative of an inadequate diet. The daily consumption of a variety of fruit and vegetables is essential for good nutrition, human productivity and child development. However, the availability of fruit and vegetables that are essential for good nutrition is of concern. Very few households consumed an adequate diversity of fruit and vegetables on a daily basis. Seasonality affected

v
the availability of fresh fruit and vegetables, which reduced the availability of these foods in winter. A lack of water constrained the production of many nutritious crops. Participants in FGDs reported that drought and climate change have reduced opportunities for diversifying production and the availability of wild foods. Access to a diversified diet was problematic for households in these communities. Households reported that a diverse diet was unaffordable. Jozini was an exception, as dietary diversity was higher and households consumed foods from an average of four food groups each day. The typical diet of most households consisted of maize meal with sugar. Where income permitted and production provided ingredients, a relish of onion and tomato or cabbage was added to one meal a day. The dietary assessment indicated that there is a dire need to strengthen the existing good consumption patterns that relate to the consumption of diverse diets in these communities and to promote and encourage the consumption of more diverse diets daily. It is particularly important that these communities should regularly consume foods in the following food groups:
• Dark green leafy vegetables such as Swiss chard, broccoli, the leaves of beetroot, cowpeas, beans, pumpkin and sweet potatoes, as well as African leafy vegetables such as blackjack, cat’s whiskers, amaranth, lambquarters, nettle, nightshade and sow thistle;
• Other vegetables such as cabbage, cauliflower, cucumber, eggplant (brinjal), gem squash, ‘calabash’ or other squash, green beans, green peppers, lettuce, peas, onions and zucchini (baby marrow);
• Orange- and red-fleshed vegetables such as beetroot, carrots, dark orange pumpkin, butternut or squash, orange-fleshed sweet potatoes and tomatoes;
• Legumes such as Bambara groundnut, cowpeas, dhal, dry beans and peanuts;
• Roots and tubers such as amadumbe (taro), potatoes and sweet potatoes;
• Orange- and red-coloured fruit such as citrus fruit, makataan, mango, papaya, pineapple, cantaloupe and watermelon;
• Other fruit, including avocados, bananas, figs, loquats and marulas.
An encouraging number of households are engaged in agriculture in Ingquza Hill, Jozini and Maruleng. It was also encouraging to note how many households were keen to engage in agriculture and produce a wider range of crops. A very small number of households were engaged in agriculture in Ratlou due to the aridity of the area. The study found an encouraging link between engagement in agriculture and improved dietary quality. Engagement in agriculture increased the availability of vegetables and, in some cases, fruit when in season. This improved household dietary diversity and children’s anthropometry scores. Income from farmland production and irrigated agriculture led to the

vi
increased intake of fruit and vegetables in general, but also meat, eggs, fish, milk, roots and tubers. A number of fruit and vegetable crops can be produced in these communities. However, the number of crops that will produce edible food in winter is severely constrained. In the areas with higher rainfall (Ingquza Hill, Jozini and Maruleng), a number of these crops can be produced under rain-fed conditions when normal climatic conditions prevail. However, communities reported that this is not possible under the current conditions of drought. Access to irrigation is necessary to overcome these constraints, reduce the risk of crop failure, improve yields, as well as extend the range of possible crops and the growing season. The nutrient water productivity of the prioritised crops shows that a number of nutrient-dense crops can be grown in the four communities, but it also demonstrates the need to combine a variety of fruit and vegetables regularly in the diet to ensure that household members consume the essential nutrients. Again, the number of crops with high nutrient water productivity that produce edible portions of food in winter is very low. Most crops that produce nutritious fresh vegetables in winter require irrigation. Irrigating crops had a clear benefit in terms of providing a more diverse diet – not only in terms of available fresh produce, but possibly also through the sale of produce. Irrigation offers the potential of increasing the amount and variety of crops, as well as extending the period of availability of fresh produce. The findings of the study can be generalised to poor rural communities in South Africa. Its findings show that the diets of poor rural households in South Africa lack diversity and do not include the frequent consumption of a diversity of fruit and vegetables necessary for ensuring good nutrition, human productivity and child development. The crops listed above should be prioritised to strengthen existing positive consumption patterns and promote greater dietary diversity. In theory, many of these crops can be grown in Ingquza Hill, Jozini and Maruleng under rain-fed conditions. Yet, community consultations reveal that many of these crops will not grow under prevailing conditions of drought, weather uncertainty and climate change. Very few of these crops produce edible portions of food in winter. Many require supplemental irrigation. Therefore, research is needed to investigate the impact of climate change on growing patterns to advise on adaptations to production techniques, irrigation practices, production timing and the potential for the development of early- and late-maturing crops to extend the growing season and make food available for longer periods. The biofortification of crops could increase the nutrient density of multiple micronutrients. Usually, biofortification focuses on increasing the availability of a single nutrient per crop. Research should investigate the amplification of multiple nutrients in foods that could be considered dual crops, such as beetroot, or where the nutrient water productivity of more than one nutrient could be enhanced (such as vitamin A, iron and zinc in carrots). Dual crops are crops where more than one part of the plant is nutrient dense, such as the leaves, roots, fruit or seeds.

vii
It is clear from the research that many households engage in home production. Therefore, technologies and practices appropriate to these conditions (including pest and disease management) should be prioritised in research and extension. Water harvesting practices and systems for the delivery of water to gardens to reduce drudgery for women are essential to enable food production in more homes. The provision of boreholes and piped water is essential in drier areas such as Ratlou, although production in such areas always requires extensive amounts of supplemental irrigation. This study highlights a number of priority research areas that the WRC could pursue. The first of these includes research related to the production of nutrient-dense crops that can strengthen and support households’ diet year-round under rain-fed and irrigated conditions, as set out above. The anthropometric and dietary diversity data, particularly the seasonal aspects of the latter, strongly suggests that the addition of more nutritious foods to regular household consumption, year-round, could enhance the accessibility, availability and stability of household food security. The inclusion of more ‘traditional’ crops – African leafy vegetables and indigenous melons, for example – might restore some of the social-embeddedness of food, that is, the knowledge of production and preparation that is in danger of being lost, and which the communities all associate with better health and nutrition. The second priority area for research relates to water harvesting and irrigation technologies to enable and encourage the production of crops with high nutrient water productivity and that can reduce labour drudgery for women in particular. In all the communities, there is the potential to enhance household and smallholder irrigation. In some cases, this poses technical obstacles, for example, at the arid Ratlou site. At other sites, it could be purely financial, for example, in Maruleng, where a partly functioning irrigation system is in need of repair and maintenance in order to serve a wider community. More problematic is the scenario of Jozini, where the vast potential of the beleaguered Mgindi irrigation scheme seems embroiled in conflicting commercial interests, managerial incompetence and stakeholder inequality. Ingquza Hill poses other challenges. Farming has undergone a drastic transformation from what was once the highly productive, rain-fed, terrace farming of staples and livestock to small, fenced, home gardens that rely on rainfall or arduous manual irrigation. Significant investments in infrastructure might be necessary to make use of the relatively abundant river water in such hilly and rugged topography. The third priority relates to the biofortification of crops to improve the nutrient water productivity of more than one nutrient per crop. There was widespread sentiment among small producers and home gardeners that agricultural inputs and extension services are inaccessible or simply inappropriate. In several communities, farmers spoke about the inappropriateness of trying to adapt the commercial crop inputs available through commercial channels to local conditions. Reports of indebtedness and crop failure were common. Smallholder producers in the study sites demonstrated the will and energy to adapt their methods to changing conditions, for example, through the conservation of local and more drought-resistant crops. There is significant interest among farmers in knowledge sharing and

viii
farmer-to-farmer exchanges to this effect, and it would be sensible to take an inventory of these practices and explore the potential for their dissemination. Documentation of this knowledge and systems for sharing it are urgently needed to support production in these areas.

ix
ACKNOWLEDGEMENTS
This study was initiated and funded under the South African Water Research Commission (WRC)-directed calls with co-funding from the national Department of Agriculture, Forestry and Fisheries (DAFF). The report is based on Project K5/2172/4. The funding was supplemented by grants and bursaries funded by the National Research Foundation (NRF) (grant numbers CPR20110706000020, 77053 and 80529), the University of Pretoria’s Institutional Research Theme on Food, Nutrition and Well-being and the University of Pretoria’s Postdoctoral Fellowship Programme. The valuable insight and guidance of Dr Sylvester Mpandeli (WRC Research Manager and Chair of the Reference Group between 2013 and 2014), Dr Andrew Sanewe (WRC Research Manager and Chair of the Reference Group between 2011 and 2012) and Dr Gerhard Backeberg (WRC) is most appreciated. The research team sincerely thanks Reference Group members for their valued input, contributions and critiques. The members were: Prof A Bogale formerly of the University of KwaZulu-Natal Ms MJ Gabriel DAFF Mr WS Jansen van Rensburg Agricultural Research Council Prof PJ Masika formerly of Fort Cox College of Agriculture and Forestry Prof AT Modi University of KwaZulu-Natal Mr S Mohlabi DAFF Dr PJ van Jaarsveld South African Medical Research Council The input of Ms PJ Mofokeng and Ms GT Munthali of DAFF is also appreciated. We are grateful to Marguerite Hartenberg of Active Space Designs for the graphic design of the brochures and graphics for the digital application and Janine Smit Editorial Services for proof reading this report. We thank the households from the communities of KwaThahle, Dubana, KwaJobe, Bochabelo, Sedawa, Madibogo and Phitshane, as well as the members of the Makhathini Block 6B Irrigation Scheme, for participating in the study. Sincere appreciation is also expressed for the kind assistance of David Cooper and the following Lima Rural Development Foundation provincial coordinators: Ms Fundiswa Molefe KwaZulu-Natal and Eastern Cape Ms Makhosazana Dlamini KwaZulu-Natal and Eastern Cape Ms Linneth Mboweni Limpopo and North West Mr Mompati Baiphethi Limpopo and North West

x
as well as the following Lima staff members: Mr Diks Madikizela Eastern Cape Mr Mfanafuthi Gumbi KwaZulu-Natal Mr Mjabuleleni Shandu KwaZulu-Natal Mr Silas Seokoma Limpopo Mr Mncedisi Nkosi KwaZulu-Natal Mr Thandolwethu Godo Eastern Cape In addition to the research team, the active participation and valuable contribution of the following persons is acknowledged and appreciated for assistance with data collection, capture, cleaning and processing: Ms Carmen Gossow (data capture) Mr Kevin Hendriks (data capture) Ms Carlibet Makamo* (masters degree student) Mr Christopher Manyamba (PhD candidate) Ms Queeneth Molefe* (masters degree student) Ms Maria Molokomme* (masters degree student) Ms Grace Timanyechi Munthali (masters degree student) Ms Tracy Muwanga (data capture) * UP students who are using the data from this study for their dissertations The research team also thanks the team of enumerators from the communities for their role in collecting the data, conducting the focus group discussions and translating the discussions. The Ingquza Hill team includes: Zizipho Mdutshane Miranda Maqephula Ntombozuko Tokwana Thabisa Ndzindzwa Nokubonga Dinwayo Busiswa Ndukuda Sinothando Magaqa Thandolwethu Godo The Jozini team includes: Thandeka Mathabela Thobile Mathenjwa Bekezela Zikhali Khululiwe Mlambo Nomvula Buthelezi Nozipho Myeni Silindile Mabaso Nompilo Mabaso Bongiwe Gumbi Nelisiwe Mkhize The Maruleng team includes: Mokgadi Maladjie Thabiso Lewele Lucia Sebatane Selahle Mokwena Moses Leshike Tebogo Machubeng Johannes Malepe Paulina Shayi Mpho Mauwena The Ratlou team includes: Bontle Motseoakhumo Keitumetse Mmopele Mosetsanagape Mokgothu Masego Serame Tuelo Phoi Kentsheng Kgosikoma Refilwe Mogokonyane Tsegofatso Lesereetse
xi
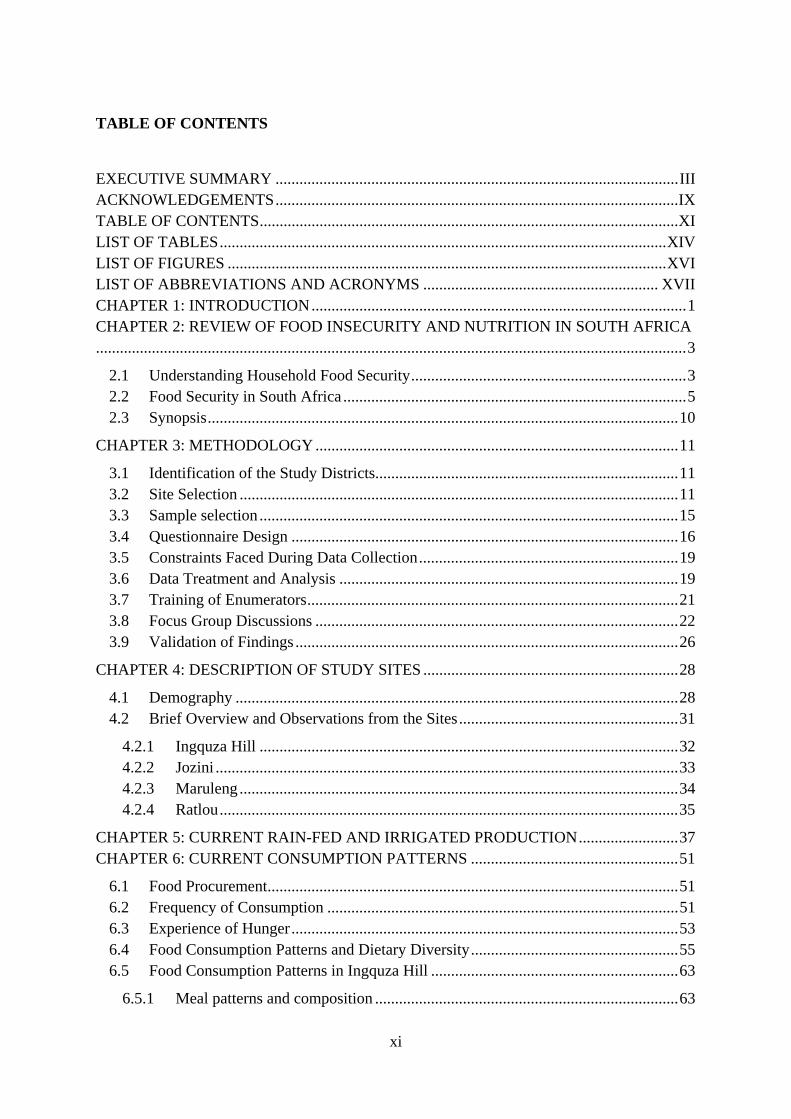
TABLE OF CONTENTS
EXECUTIVE SUMMARY ..................................................................................................... III ACKNOWLEDGEMENTS ..................................................................................................... IX TABLE OF CONTENTS ......................................................................................................... XI LIST OF TABLES ................................................................................................................ XIV LIST OF FIGURES .............................................................................................................. XVI LIST OF ABBREVIATIONS AND ACRONYMS ........................................................... XVII CHAPTER 1: INTRODUCTION .............................................................................................. 1 CHAPTER 2: REVIEW OF FOOD INSECURITY AND NUTRITION IN SOUTH AFRICA.................................................................................................................................................... 3
2.1 Understanding Household Food Security ..................................................................... 3 2.2 Food Security in South Africa ...................................................................................... 5 2.3 Synopsis ...................................................................................................................... 10
CHAPTER 3: METHODOLOGY ........................................................................................... 11
3.1 Identification of the Study Districts............................................................................ 11 3.2 Site Selection .............................................................................................................. 11 3.3 Sample selection ......................................................................................................... 15 3.4 Questionnaire Design ................................................................................................. 16 3.5 Constraints Faced During Data Collection ................................................................. 19 3.6 Data Treatment and Analysis ..................................................................................... 19 3.7 Training of Enumerators ............................................................................................. 21 3.8 Focus Group Discussions ........................................................................................... 22 3.9 Validation of Findings ................................................................................................ 26
CHAPTER 4: DESCRIPTION OF STUDY SITES ................................................................ 28
4.1 Demography ............................................................................................................... 28 4.2 Brief Overview and Observations from the Sites ....................................................... 31
4.2.1 Ingquza Hill ......................................................................................................... 32 4.2.2 Jozini .................................................................................................................... 33 4.2.3 Maruleng .............................................................................................................. 34 4.2.4 Ratlou ................................................................................................................... 35
CHAPTER 5: CURRENT RAIN-FED AND IRRIGATED PRODUCTION ......................... 37 CHAPTER 6: CURRENT CONSUMPTION PATTERNS .................................................... 51
6.1 Food Procurement....................................................................................................... 51 6.2 Frequency of Consumption ........................................................................................ 51 6.3 Experience of Hunger ................................................................................................. 53 6.4 Food Consumption Patterns and Dietary Diversity .................................................... 55 6.5 Food Consumption Patterns in Ingquza Hill .............................................................. 63
6.5.1 Meal patterns and composition ............................................................................ 63

xii
6.5.2 Food for children in the household ...................................................................... 64 6.5.3 Food supply .......................................................................................................... 65 6.5.4 Changes in food eaten and the preservation of traditions .................................... 66 6.5.5 Special occasions ................................................................................................. 67 6.5.6 Food shortages ..................................................................................................... 67
6.6 Food Consumption Patterns in Jozini ......................................................................... 68
6.6.1 Meal patterns and composition ............................................................................ 68 6.6.2 Food for children in the household ...................................................................... 69 6.6.3 Food supply .......................................................................................................... 70 6.6.4 Changes in food eaten and the preservation of traditions .................................... 71 6.6.5 Special occasions ................................................................................................. 72 6.6.6 Food shortages ..................................................................................................... 72
6.7 Food Consumption Patterns in Maruleng ................................................................... 72
6.7.1 Meal patterns and composition ............................................................................ 72 6.7.2 Food for children in the household ...................................................................... 73 6.7.3 Food supply .......................................................................................................... 74 6.7.4 Changes in food eaten and the preservation of traditions .................................... 75 6.7.5 Special occasions ................................................................................................. 75 6.7.6 Food shortages ..................................................................................................... 75
6.8 Food Consumption Patterns in Ratlou ........................................................................ 76
6.8.1 Meal patterns and composition ............................................................................ 76 6.8.2 Food for children in the household ...................................................................... 77 6.8.3 Food supply .......................................................................................................... 77 6.8.4 Changes in food eaten and the preservation of traditions .................................... 78 6.8.5 Special occasions ................................................................................................. 78 6.8.6 Food shortages ..................................................................................................... 79
6.9 Discussion Regarding Consumption Patterns ............................................................. 79 6.10 Precautionary Behaviour Related do Consumption During Food Shortages .......... 80 6.11 Nutrition and Social Change ................................................................................... 83
CHAPTER 7: NUTRITIONAL STATUS OF CAREGIVERS AND CHILDREN ................ 86 CHAPTER 8: NUTRITIONAL CONSIDERATIONS FOR CROP-BASED RECOMMENDATIONS ......................................................................................................... 93
8.1 Food Group-based Considerations ............................................................................. 93 8.2 Dietary Recommendations ......................................................................................... 93
CHAPTER 9: THE CONTRIBUTION OF PRODUCTION TO HOUSEHOLD CONSUMPTION ..................................................................................................................... 96
9.1 The Influence of Cropping and Scale of Cropping on Food Consumption ................ 96 9.2 What Can be Grown? ............................................................................................... 100 9.3 Nutrient Composition of the Recommended Crops ................................................. 105 9.4 Water-Efficient Options to Improve Diet Quality .................................................... 109

xiii
CHAPTER 10: PRIORITISED CROPS TO IMPROVE THE DIETS OF POOR RURAL COMMUNITIES ................................................................................................................... 116
10.1 Priority Crops Identified ........................................................................................ 116 10.2 Validation of the Findings ..................................................................................... 121
CHAPTER 11: CONCLUSIONS AND RECOMMENDATIONS ....................................... 123
11.1 Study Conclusions ................................................................................................. 123 11.2 Recommendations for Priority Crops to Improve the Diet of Poor Rural Communities throughout the Year ..................................................................................... 125 11.3 Recommendations for Research ............................................................................ 126 11.4 Dissemination of the Findings ............................................................................... 127
REFERENCES ...................................................................................................................... 129 APPENDIX A: GLOSSARY OF FOOD ITEMS IN LOCAL LANGUAGES ..................... 138 APPENDIX B: GENERAL NOTES ON THE PRODUCTION OF THE DIFFERENT CROPS ................................................................................................................................... 142 APPENDIX C: PUBLICATIONS AND PRODUCT OUTPUTS ......................................... 149
Published journal articles.................................................................................................... 149 Papers submitted to journals for consideration................................................................... 149 Papers in preparation .......................................................................................................... 149 Research briefs ................................................................................................................... 149 Invited presentations in which the results have been presented ......................................... 150 Papers presented at conferences ......................................................................................... 150 Popular media ..................................................................................................................... 151 Software .............................................................................................................................. 151
APPENDIX D: CAPACITY BUILDING ............................................................................. 153
xiv
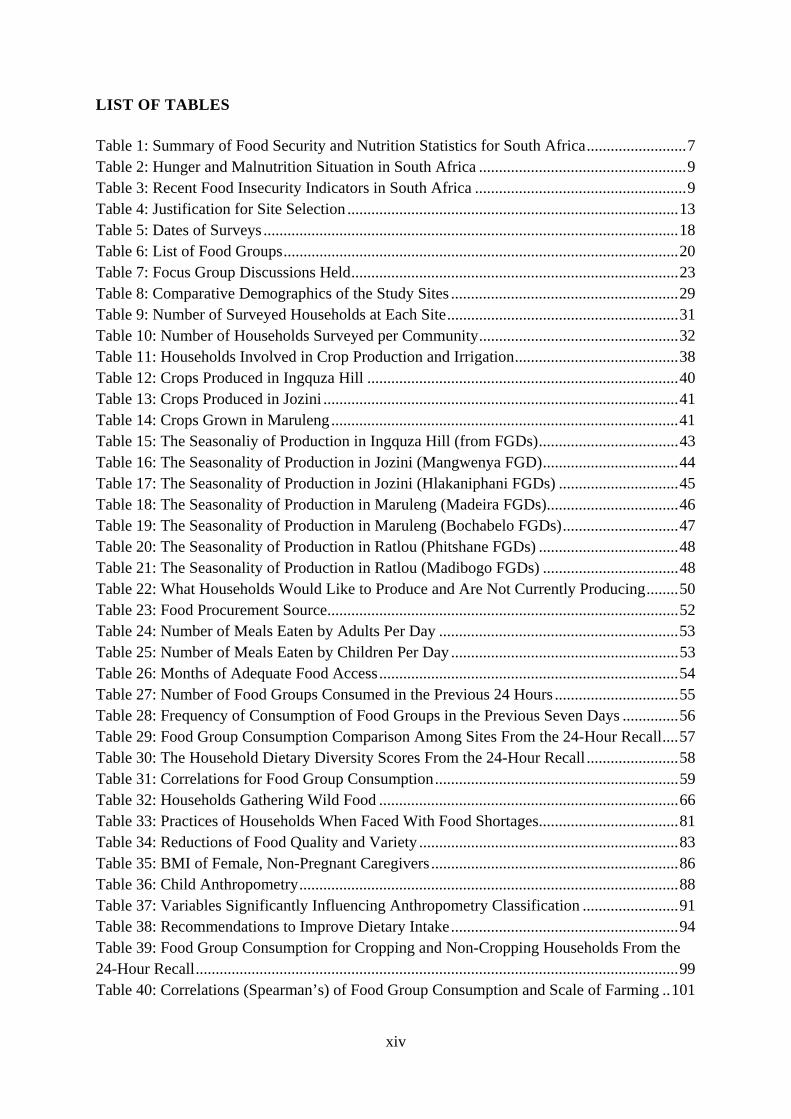
LIST OF TABLES
Table 1: Summary of Food Security and Nutrition Statistics for South Africa ......................... 7 Table 2: Hunger and Malnutrition Situation in South Africa .................................................... 9 Table 3: Recent Food Insecurity Indicators in South Africa ..................................................... 9 Table 4: Justification for Site Selection ................................................................................... 13 Table 5: Dates of Surveys ........................................................................................................ 18 Table 6: List of Food Groups ................................................................................................... 20 Table 7: Focus Group Discussions Held .................................................................................. 23 Table 8: Comparative Demographics of the Study Sites ......................................................... 29 Table 9: Number of Surveyed Households at Each Site .......................................................... 31 Table 10: Number of Households Surveyed per Community .................................................. 32 Table 11: Households Involved in Crop Production and Irrigation ......................................... 38 Table 12: Crops Produced in Ingquza Hill .............................................................................. 40 Table 13: Crops Produced in Jozini ......................................................................................... 41 Table 14: Crops Grown in Maruleng ....................................................................................... 41 Table 15: The Seasonaliy of Production in Ingquza Hill (from FGDs) ................................... 43 Table 16: The Seasonality of Production in Jozini (Mangwenya FGD) .................................. 44 Table 17: The Seasonality of Production in Jozini (Hlakaniphani FGDs) .............................. 45 Table 18: The Seasonality of Production in Maruleng (Madeira FGDs) ................................. 46 Table 19: The Seasonality of Production in Maruleng (Bochabelo FGDs) ............................. 47 Table 20: The Seasonality of Production in Ratlou (Phitshane FGDs) ................................... 48 Table 21: The Seasonality of Production in Ratlou (Madibogo FGDs) .................................. 48 Table 22: What Households Would Like to Produce and Are Not Currently Producing ........ 50 Table 23: Food Procurement Source ........................................................................................ 52 Table 24: Number of Meals Eaten by Adults Per Day ............................................................ 53 Table 25: Number of Meals Eaten by Children Per Day ......................................................... 53 Table 26: Months of Adequate Food Access ........................................................................... 54 Table 27: Number of Food Groups Consumed in the Previous 24 Hours ............................... 55 Table 28: Frequency of Consumption of Food Groups in the Previous Seven Days .............. 56 Table 29: Food Group Consumption Comparison Among Sites From the 24-Hour Recall .... 57 Table 30: The Household Dietary Diversity Scores From the 24-Hour Recall ....................... 58 Table 31: Correlations for Food Group Consumption ............................................................. 59 Table 32: Households Gathering Wild Food ........................................................................... 66 Table 33: Practices of Households When Faced With Food Shortages ................................... 81 Table 34: Reductions of Food Quality and Variety ................................................................. 83 Table 35: BMI of Female, Non-Pregnant Caregivers .............................................................. 86 Table 36: Child Anthropometry ............................................................................................... 88 Table 37: Variables Significantly Influencing Anthropometry Classification ........................ 91 Table 38: Recommendations to Improve Dietary Intake ......................................................... 94 Table 39: Food Group Consumption for Cropping and Non-Cropping Households From the 24-Hour Recall ......................................................................................................................... 99 Table 40: Correlations (Spearman’s) of Food Group Consumption and Scale of Farming .. 101

xv
Table 41: Recommended Vegetable Crops Based on the Potential for Production and the Current Production Patterns in the Four Sites........................................................................ 103 Table 42: Table of Recommended Fruit Crops Based on Their Potential for Production ..... 104 Table 43: Selected Nutrient Values for the Recommended Vegetable Crops ....................... 106 Table 44: Selected Nutrient Values for the Recommended Fruit Crops ............................... 108 Table 45: The Water Nutrient Productivity of the Recommended Crops ............................. 110 Table 46: Water Nutrient Productivity of the Recommended Fruit ...................................... 113 Table 47: Dietary Reference Intakes for Children ................................................................. 114

xvi
LIST OF FIGURES
figure 1: The Food Security Continuum .................................................................................... 4 Figure 2: Experience of Hunger in South Africa ....................................................................... 8 Figure 3: Map of the Study Sites ............................................................................................. 14 Figure 4: Proportion of Households Experiencing Hunger ..................................................... 54 Figure 5a: Children’s Weight for Height ................................................................................. 89 Figure 5b: Children’s Weight for Age ..................................................................................... 89 Figure 5c: Children’s Length or Height for Age ..................................................................... 89 Figure 5d: Children’s BMI for Age ........................................................................................ 89 Figure 5e: Children’s MUAC for Age ..................................................................................... 90 Figure 5f: Children’s Weight for Age by Sex .......................................................................... 90 Figure 5g: Children’s Length for Age by Sex ......................................................................... 90 Figure 6: Dietary Diversity Score – Summer .......................................................................... 97 Figure 7: Dietary Diversity – Winter ....................................................................................... 98 Figure 8: Illustration of the Nutritional Water Quality Per 100 G of Edible Produce ........... 115 Figure 9: Priority Crops for Ingquza Hill .............................................................................. 117 Figure 10: Priority Crops for Jozini ....................................................................................... 118 Figure 11: Priority Crops for Maruleng ................................................................................. 119 Figure 12: Priority Crops for Ratlou ...................................................................................... 120

xvii
LIST OF ABBREVIATIONS AND ACRONYMS
ANC African National Congress BAZ BMI for age Z-score B-BBEE Broad-based Black Equity Empowerment BMI Body Mass Index CCHIP Community Childhood Hunger Identification Project CRDP Community Rural Development Programme DAFF Department for Agriculture, Forestry and Fisheries DI Deprivation Index DoH Department of Health DPME Department of Planning, Monitoring and Evaluation DSD Department of Social Development EAU Enumeration area unit ECD Early Childhood Development FANTA Food and Nutrition Technical Agency FGD Focus group discussion FIVIMS Food Insecurity Vulnerability Information Monitoring System FIVIMS-ZA Food Insecurity Vulnerability Information Monitoring System in South Africa GHS General Household Survey HAZ Height-for-age Z-score HDDS Household Dietary Diversity Score HFIAS Household Food Insecurity Acess Scale HSRC Human Sciences Research Council IDP Integrated Development Plan ISRDP Integrated Sustainable Rural Development Programme KZNDAE KwaZulu-Natal Department of Agriculture and Environmental Affairs LRAD Land Redistribution for Agricultural Development (LRAD) programme MAHFP Months of adequate household food provisioning MDG Millennium Development Goal MNCWH Maternal, Newborn, Child, and Women’s Health MUAC Mid-upper arm circumference MUACZ Mid-upper arm circumference Z-score NCD Non-communicable diseases NDP National Development Plan NFCS National Food Consumption Survey NGO Non-governmental Organisation NPFNS National Policy on Food and Nutrition Security PCA Principal Component Analysis SANHANES South African National Health and Nutrition Evaluation Survey SASAS South African Social Assessment Survey SADC Southern African Development Community SD Standard deviations

xviii
SGS Société Générale de Surveillance South Africa (Pty) Ltd SPSS Statistics Package for Social Sciences Stats SA Statistics South Africa UNICEF United Nations International Children’s Emergency Fund UP University of Pretoria USAID United States of America International Aid WAZ Weight-for-age Z-score WFP World Food Programme WHO World Health Organisation WHZ Weight-for-height Z-score WRC Water Research Commission

1
CHAPTER 1: INTRODUCTION
A baseline and scoping study commissioned by the Water Research Commission (WRC Report No. TT 537/12) has revealed numerous knowledge gaps with regard to smallholder production and food security in South Africa. The study highlighted that there is limited current and generalisable food security and nutrition research in South Africa. Very few studies have investigated the year-round source(s) of food for the rural poor. In particular, agricultural interventions to improve human nutrition and the (indirect) eventual outcomes of health, education and economics, are practically non-existent. The study identified two specific knowledge gaps. Firstly, it identified that the contribution of home- or smallholder-grown foods to total dietary intake and nutritional requirements (in the context of an in-depth description of the food environment and its links to water) is not known. Secondly, the effect of seasonality on home or smallholder production is not documented (Wenhold et al. 2012). This project set out to address these significant and longstanding gaps in knowledge and to propose a set of options for strengthening rain-fed and irrigated crop production in the rural areas investigated to identify research focus areas related to efficient water use that could directly overcome dietary inadequacies and lead to better nutrition of rural household members. This unique study drew on a transdisciplinary research approach to investigate the consumption and production patterns of rural households in communities in four selected sites in the poorest local municipalities in South Africa. Transdisciplinarity is an emerging science that offers innovative methodologies for high-impact science through understanding and taking action on complex societal problems that can no longer be approached and solved by monodisciplinary approaches only (Regeer and Bunders 2008; Lang et al. 2012). It adopts the integration of theoretical and methodological perspectives of multiple disciplines to generate novel conceptual and empirical analysis that transcends discipline perspectives, and moves between, across and beyond traditional disciplines (Holistic Education Network of Tasmania 2011). Transdisciplinarity produces new knowledge with, rather than for society. The general objective of the study was to assess the current rain-fed and irrigated production of food crops and its potential in relation to the food and nutrition requirements of poor rural people to determine crop water use in a future project. The specific objectives of the study were as follows:
• Specific Objective 1: To describe the total population (rural poor) in the provinces with reference, among other things, to demographics, education and training, sources of income and livelihood, socioeconomic and cultural dynamics (including food culture), natural resources, institutional arrangements related to land, farming or gardening systems (including the apportionment of produce) and the use of this information to identify, select and justify the sample sites
• Specific Objective 2: To determine poor rural people’s food intake (type of food consumed), frequency of consumption and contribution towards nutritional

2
requirements) and the sources of these foods all year round (natural and social seasons)
• Specific Objective 3: To determine the total current food production patterns of poor rural people
• Specific Objective 4: To determine the direct and indirect food crop production opportunities for poor rural people to comply with their nutritional requirements
• Specific Objective 5: To prioritise relevant food crops in the diets of poor rural people for future research on water use, yield and good management practices.
This report presents the findings of this study in sections that report on the following sequential steps of the research process:
• Investigate the crop production patterns, food consumption patterns and anthropometry of children between 24 and 59 months.
• Compare the nutritional status, dietary diversity and food consumption patterns of households engaged in rain-fed and irrigated crop production with households not engaged in crop production.
• Identify the food consumption gaps.
• Examine the agronomic conditions in the four sites and identify what crops could grow in these areas.
• Identify and prioritise the potential crop that could be grown to improve diets in each site.
• Validate the prioritised list of crops with the communities.
• Develop information resources and tools to disseminate the information.
The final chapter of the report presents the conclusions, prioritised list of crops to improve the diets of poor rural communities, and recommendations for the WRC’s future research activities.

3
CHAPTER 2: REVIEW OF FOOD INSECURITY AND NUTRITION IN SOUTH AFRICA
A high proportion of South Africa’s rural households face the risk of experiencing food shortages that negatively affect their long-term food security and undermine their human potential (Hendriks 2014). Food security exists “when all people, at all times, have physical and economic access to sufficient, safe and nutritious food to meet their dietary needs and food preferences” (FAO 1996). While food insecurity is experienced at national, community and household level, malnutrition is experienced at individual level. Overall, the definition of food security implies that families and individuals do not need to worry about where their next meal will come from. Being food secure relies on having access to stable sources of food supply or income to purchase food for consumption.
2.1 Understanding Household Food Security
Food security is achieved when all members of a household consume adequate food to meet their individual dietary needs on a continual basis (FAO 1996). Sound nutrition is essential for human productivity, health, and child development. Food security rests on four elements: food availability, access, adequate nutrition and the stability of the supply of income and food (resilience). While food security is one foundational requirement for nutrition, two other elements are essential for sound nutrition. These are adequate care and healthy environments with adequate housing, sanitation, waste management, and good quality air and water (Hendriks 2015). Food insecurity and malnutrition are forms of deprivation. Each manifests in a variety of symptoms of varying severity (Hendriks 2015). Hunger and wasting (extreme underweight-for-age) are extreme experiences of food insecurity, but food insecurity can also manifest as hidden hunger or less obviously observable forms of malnutrition. Malnutrition includes undernutrition, micronutrient deficiencies or overweight and obesity. The latter is a result of unbalanced intakes and, in particular, the consumption of too many calories without adequate intake of protein and micronutrients (Hendriks 2015). Hidden hunger includes various forms of less severe malnutrition, including micronutrient deficiencies. The levels of severity of food insecurity can be visualised as a continuum, as depicted in the figure below.

4
Figure 1: The food security continuum Source: Hendriks (2015)
The causes of food insecurity and malnutrition are rooted in interconnected economic, social, environmental and political system failures. They are both causes and consequences of poverty, inequality and unemployment. Eliminating food insecurity and malnutrition demands ensuring that everyone has sufficient income to pay basic living costs and afford an adequate diet (Hendriks 2015).
Sta
ge
Sta
rvat
ion
Acu
te h
unge
r
Chr
onic
hun
ger
“Hidden” hunger
Ade
quat
e in
take
but
w
orry
abo
ut fu
ture
fo
od a
cces
s
Ade
quat
e in
take
with
su
stai
nabl
e fu
ture
su
pply
of f
ood
Inad
equa
te
inta
ke
Sem
i-ade
quat
e in
take
Obe
soge
nic
inta
ke
Food security
Cla
ssifi
catio
n
Food insecure
Vul
nera
ble
to
beco
min
g fo
od in
secu
re
Food
sec
ure
Cha
ract
eris
tic
Sev
ere
was
ting
(-3S
D),
Em
acia
tion,
oed
ema,
hig
h m
orta
lity
(esp
ecia
lly u
nder
5s
)* or l
ow a
dult
BMI
Sev
ere
(-2S
D) u
nder
wei
ght,
and
/or s
tunt
ing
or o
edem
a
or lo
w B
MI
Was
ting,
und
erw
eigh
t or
Stu
ntin
g (<
1SD
) or l
ow B
MI
Sub
-ade
quat
e in
take
and
un
derw
eigh
t (b
etw
een
-1S
D
and
norm
al )
Mic
ro-n
utrie
nt d
efic
ienc
ies,
se
ason
al s
horta
ges,
nor
mal
or
und
erw
eigh
t
Low
cos
t, hi
gh c
arbo
hydr
ate
and
fat i
ntak
e (B
MI o
ver
19/2
0)
Gen
eral
ly a
dequ
ate
ener
gy
inta
ke, n
orm
al w
eigh
t, en
joys
di
etar
y di
vers
ity
Ade
quat
e in
take
of a
ll nu
trien
ts, n
orm
al w
eigh
t, an
d go
od d
ieta
ry d
iver
sity
Stra
tegi
es e
mpl
oyed
Hou
seho
ld c
olla
pse
Sell
off p
rodu
ctiv
e as
sets
Sel
l off
non-
prod
uctiv
e as
sets
Con
sum
ptio
n re
duct
ion
and
ratio
naliz
atio
n
Lack
of d
ieta
ry
dive
rsity
Unb
alan
ced
diet
and
pe
rhap
s st
ress
eat
ing
Wor
ry a
bout
sho
rtage
s
N/A
Relience to food insecurity
Appr
opria
te
inte
rven
tions
Rel
ief
inte
rven
tions
: pr
ovis
ion
of fo
od
and
othe
r bas
ic
need
s
Miti
gatio
n in
terv
entio
ns a
nd
soci
al p
rote
ctio
n to
bo
ost i
ncom
e an
d co
nsum
ptio
n an
d pr
otec
t aga
inst
co
nsum
ptio
n re
duct
ion
Pro
mot
ion
of
sust
aina
ble
livel
ihoo
ds
Enc
oura
ging
the
build
ing
up o
f sa
ving
s, a
sset
s an
d in
sura
nces
to
draw
on
in ti
mes
of
sho
rtage
5
2.2 Food Security in South Africa
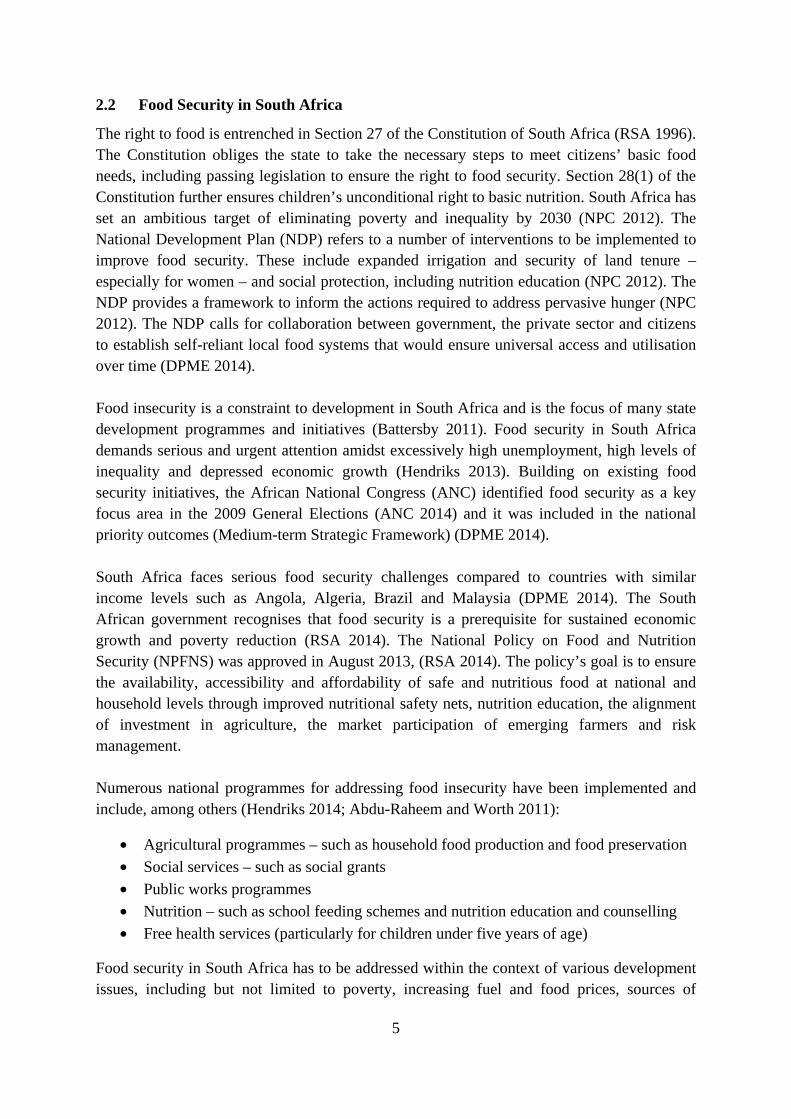
The right to food is entrenched in Section 27 of the Constitution of South Africa (RSA 1996). The Constitution obliges the state to take the necessary steps to meet citizens’ basic food needs, including passing legislation to ensure the right to food security. Section 28(1) of the Constitution further ensures children’s unconditional right to basic nutrition. South Africa has set an ambitious target of eliminating poverty and inequality by 2030 (NPC 2012). The National Development Plan (NDP) refers to a number of interventions to be implemented to improve food security. These include expanded irrigation and security of land tenure – especially for women – and social protection, including nutrition education (NPC 2012). The NDP provides a framework to inform the actions required to address pervasive hunger (NPC 2012). The NDP calls for collaboration between government, the private sector and citizens to establish self-reliant local food systems that would ensure universal access and utilisation over time (DPME 2014). Food insecurity is a constraint to development in South Africa and is the focus of many state development programmes and initiatives (Battersby 2011). Food security in South Africa demands serious and urgent attention amidst excessively high unemployment, high levels of inequality and depressed economic growth (Hendriks 2013). Building on existing food security initiatives, the African National Congress (ANC) identified food security as a key focus area in the 2009 General Elections (ANC 2014) and it was included in the national priority outcomes (Medium-term Strategic Framework) (DPME 2014). South Africa faces serious food security challenges compared to countries with similar income levels such as Angola, Algeria, Brazil and Malaysia (DPME 2014). The South African government recognises that food security is a prerequisite for sustained economic growth and poverty reduction (RSA 2014). The National Policy on Food and Nutrition Security (NPFNS) was approved in August 2013, (RSA 2014). The policy’s goal is to ensure the availability, accessibility and affordability of safe and nutritious food at national and household levels through improved nutritional safety nets, nutrition education, the alignment of investment in agriculture, the market participation of emerging farmers and risk management. Numerous national programmes for addressing food insecurity have been implemented and include, among others (Hendriks 2014; Abdu-Raheem and Worth 2011):
• Agricultural programmes – such as household food production and food preservation
• Social services – such as social grants
• Public works programmes
• Nutrition – such as school feeding schemes and nutrition education and counselling
• Free health services (particularly for children under five years of age)
Food security in South Africa has to be addressed within the context of various development issues, including but not limited to poverty, increasing fuel and food prices, sources of

6
income, social protection, rural and urban development, changing household structures, land, health, education, and water and sanitation (RSA 2014). Despite progressive constitutional rights for citizens and some progress towards clear development targets, the level of food insecurity in South Africa is considerably high (Hendriks 2013). Currently, there are no legislative measures in place to realise the right to food as enshrined in the Constitution and there is no comprehensive information system to monitor and report on levels of food insecurity in South Africa (Hendriks 2014). Table 1 presents a summary of nationally available representative food security and nutrition-related indicators for South Africa.
7
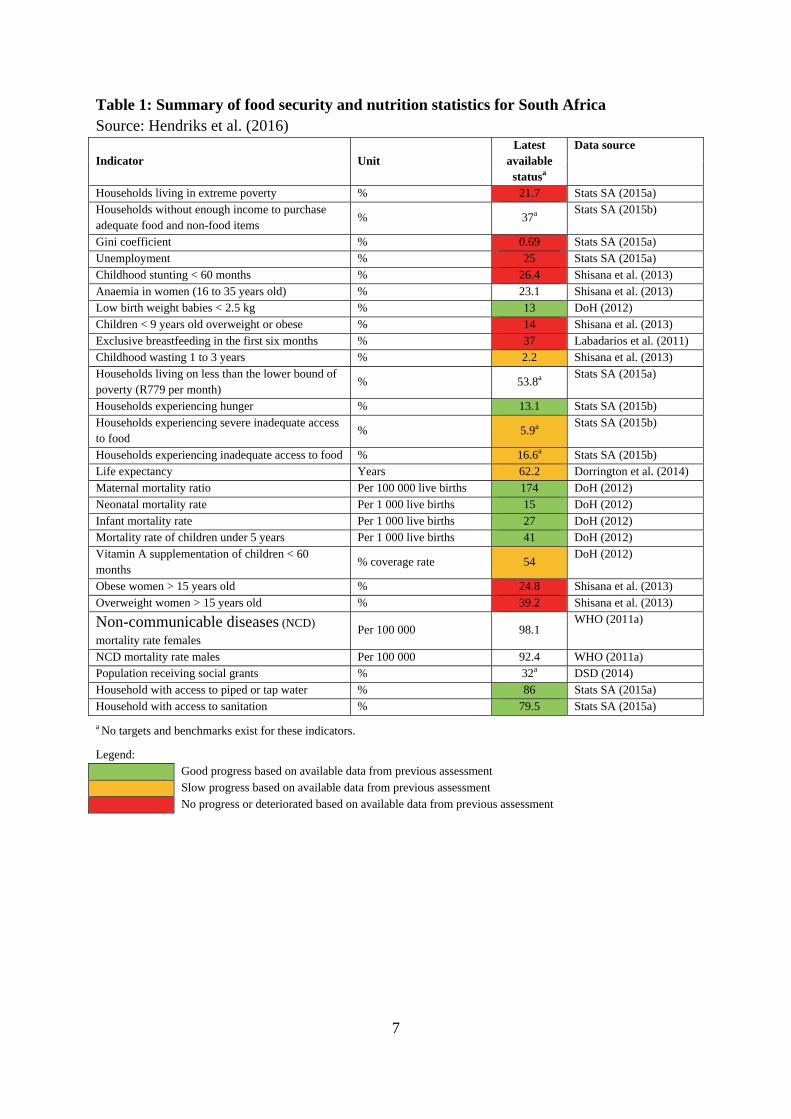
Table 1: Summary of food security and nutrition statistics for South Africa Source: Hendriks et al. (2016)
Indicator Unit Latest
available statusa
Data source
Households living in extreme poverty % 21.7 Stats SA (2015a) Households without enough income to purchase adequate food and non-food items
% 37a Stats SA (2015b)
Gini coefficient % 0.69 Stats SA (2015a) Unemployment % 25 Stats SA (2015a) Childhood stunting < 60 months % 26.4 Shisana et al. (2013) Anaemia in women (16 to 35 years old) % 23.1 Shisana et al. (2013) Low birth weight babies < 2.5 kg % 13 DoH (2012) Children < 9 years old overweight or obese % 14 Shisana et al. (2013) Exclusive breastfeeding in the first six months % 37 Labadarios et al. (2011) Childhood wasting 1 to 3 years % 2.2 Shisana et al. (2013) Households living on less than the lower bound of poverty (R779 per month)
% 53.8a Stats SA (2015a)
Households experiencing hunger % 13.1 Stats SA (2015b) Households experiencing severe inadequate access to food
% 5.9a Stats SA (2015b)
Households experiencing inadequate access to food % 16.6a Stats SA (2015b) Life expectancy Years 62.2 Dorrington et al. (2014) Maternal mortality ratio Per 100 000 live births 174 DoH (2012) Neonatal mortality rate Per 1 000 live births 15 DoH (2012) Infant mortality rate Per 1 000 live births 27 DoH (2012) Mortality rate of children under 5 years Per 1 000 live births 41 DoH (2012) Vitamin A supplementation of children < 60 months
% coverage rate 54 DoH (2012)
Obese women > 15 years old % 24.8 Shisana et al. (2013) Overweight women > 15 years old % 39.2 Shisana et al. (2013)
Non-communicable diseases (NCD)
mortality rate females Per 100 000 98.1
WHO (2011a)
NCD mortality rate males Per 100 000 92.4 WHO (2011a) Population receiving social grants % 32a DSD (2014) Household with access to piped or tap water % 86 Stats SA (2015a) Household with access to sanitation % 79.5 Stats SA (2015a)
a No targets and benchmarks exist for these indicators.
Legend:
Good progress based on available data from previous assessment
Slow progress based on available data from previous assessment
No progress or deteriorated based on available data from previous assessment

8
Figure 2 shows the prevalence of self-reported hunger in South Africa in 2012, as assessed using a Community Childhood Hunger Identification Project (CCHIP). More than 30% of households in the country’s rural and urban informal areas reported experiencing hunger in 2012 (Shisana et al. 2013). The General Household Survey (GHD) reported that 11% and 13% of households and individuals, respectively, in South Africa reported experiencing hunger in the four weeks prior to the GHS of 2013 (Table 2) (Stats SA 2014b).
Figure 2: Experience of hunger in South Africa Source: Shisana et al. (2013) With regard to food access, results from the GHS of 2013 – using questions from the Household Food Insecurity Access Scale (HFIAS) with a 30-day recall period – indicated that the percentage of households reporting limited access to food increased from 22% in 2012 to 23% in 2013 (Stats SA 2014b). However, the percentage of individuals with limited access to food remained virtually constant at around 26% (see Table 3). The increase in the number of households with limited access to food clearly indicates that the implementation of the existing food security interventions should be improved (Stats SA 2014b). Table 2 shows the provincial situation with regard to food access and hunger.
28.8
37.0
19.0
32.4
26.0
0.0
10.0
20.0
30.0
40.0
Rural formal Rural informal Urban formal Urban informal Total

9
Table 2: Hunger and malnutrition situation in South Africa Variable National Food
Consumption Survey 1999 (Labadarios
2000)
National Food Consumption Survey 2005 (Labadarios et
al. 2008)
South African Social
Assessment Survey
2008 (HSRC 2008)
South African National Health and Nutrition Evaluation
Survey, 2012 (Shisana et al. 2013)
n = 2 735 n = 2 413 n = 1 150 n = 6 306 % % % % Food secure 25 19.8 48 45.6 At risk of hunger 23 27.9 25 28.3 Experiencing hunger
52.3 52 25.9 26.0
Although self-reported experiences of hunger have dropped since 1999, much needs to be done to improve food security in the country (Table 3). The findings from four national surveys (using the CCHIP Index as proxy for food security) indicated that the proportion of food insecure households halved from 1999 to 2008, reducing from 52.3% to 25.9%, while the proportion of households at risk of food insecurity ranged from 23.0% to 27.9% between 1999 and 2005 (Labadarios et al. 2011; Labadarios et al. 2008). However, the data from the first South African National Health and Nutrition Evaluation Survey (SANHANES-1) in 2012 and the GHS in 2013 suggest no improvement since 2008. Nationally, 26% of boys and 25% of girls aged one to three years old were stunted in 2012, an increase in the 2005 National Food Consumption Survey (NFCS) data (Shisana et al. 2013). There is also a growing obesity problem in children aged two to five years, with 18.9% of girls being overweight and 4.9% being obese, and 17.5% of boys being overweight and 4.4% being obese (Shisana et al. 2013). This is indicative of poor diet quality.

10
Table 3: Recent food insecurity indicators in South Africa Data source Province of South Africaa RSA GHS 2013 data (Stats SA 2014b)
EC FS GP KZN LP MP NC NW WC RSA
Food access severely inadequate
7.0 5.4 4.7 4.0 1.7 8.8 9.6 14.7 8.3 6.1
Food access inadequate 22.4 21.1
13.0
20.9 7.0 20.7 21.0
22.6 15.0 17.0
Food access adequate 70.6 73.5
82.3
75.2 91.3
70.6 69.3
62.7 76.8 76.9
SANHANES-1 2012 data (Shisana et al. 2013)
EC FS GP KZN LP MP NC NW WC RSA
Prevalence of the experience of hunger
36.2 28.8
19.2
28.3 30.8
29.5 20.7
29.5 16.4 26.0
Household experience of hunger
32.4 31.9
24.8
34.4 27.3
15.5 22.8
30.0 25.6 28.3
Food secure 31.4 39.3
56.0
37.3 41.9
55.0 56.5
40.4 57.9 45.6
a EC = Eastern Cape, FS = Free State, GP = Gauteng, KZN = KwaZulu-Natal, LP = Limpopo, MP = Mpumalanga, NC = Northern Cape, NW = North West, WC = Western Cape, RSA = Republic of South Africa
2.3 Synopsis
It is clear from the abovementioned data that food security in South Africa is complex. While there is not much evidence of widespread starvation and extreme undernutrition in the country, there is clear evidence of multiple forms of deprivation related to the experience of hunger, widespread manifestation of hidden hunger or micronutrient deficiencies and the co-existence of overweight and obesity with hidden hunger and child malnutrition. Despite a multitude of state, private sector and NGO-funded food security programmes, stunting levels in South Africa increased over the Millennium Development Goal (MDG) period. South Africa is the only country in the South African Development Community (SADC) region where child stunting has not decreased during the MDG period (Hendriks et al. 2016). The increasing incidence of overweight among women and children raises alarm. This indicates severe inadequacies related to the diets of South Africans. Yet, very little research has been carried out in South Africa regarding food consumption patterns at the household level and linking this to what can be grown to improve the diets of poor rural people.

11
CHAPTER 3: METHODOLOGY
3.1 Identification of the Study Districts
This study began with a desk review of available literature, reports and other official and non-governmental organisation (NGO)-authored documents to profile the four provinces selected by the WRC for this study. Comparative data was collected on the following aspects:
• Demographics
• Education and training
• Sources of income and livelihoods
• Sociocultural dynamics (including food culture)
• Natural resources, institutional arrangements related to land
• Farming/gardening systems (including apportionment of produce)
The desk review identified the Integrated Sustainable Rural Development Programme (ISRDP) priority districts as the primary point for the selection of the study districts in the Eastern Cape, KwaZulu-Natal and Limpopo for this study. These districts represent the 18 rural nodes across South Africa in which South Africa’s poorest citizens live (Harmse 2010; Stats SA 2016). No priority rural nodes exist in North West (Stats SA 2016).
3.2 Site Selection
Using these priority districts in the Eastern Cape, KwaZulu-Natal, Limpopo and the North West, data from the Heath Systems Trust (Day et al. 2012) Deprivation Index (DI) was used to identify the most deprived district in North West and then the most deprived municipalities in the district from each province. The DI provides a useful tool for identifying the poorest regions in the country. The DI is a measure of relative deprivation. The 2011 index was derived from a set of demographic and socio-economic variables from the 2007 Community Survey and the 2005 and 2006 General Household Surveys. Day et al. (2012) estimated the DI using Principal Component Analysis (PCA) from a set of key binomial variables for the following:
• Children who are below the age of five years
• Black Africans
• Female household heads
• Household heads with no formal education
• Working-age people who are unemployed (not working, whether looking for work or not – the official definition of unemployment in South Africa)
• People who live in a traditional dwelling, informal shack or tent
• People who have no piped water in their house or on site
• People who have a pit or bucket toilet or no form of toilet
• People who do not have access to electricity, gas or solar power for lighting, heating or cooking
- (Day et al. 2012).

12
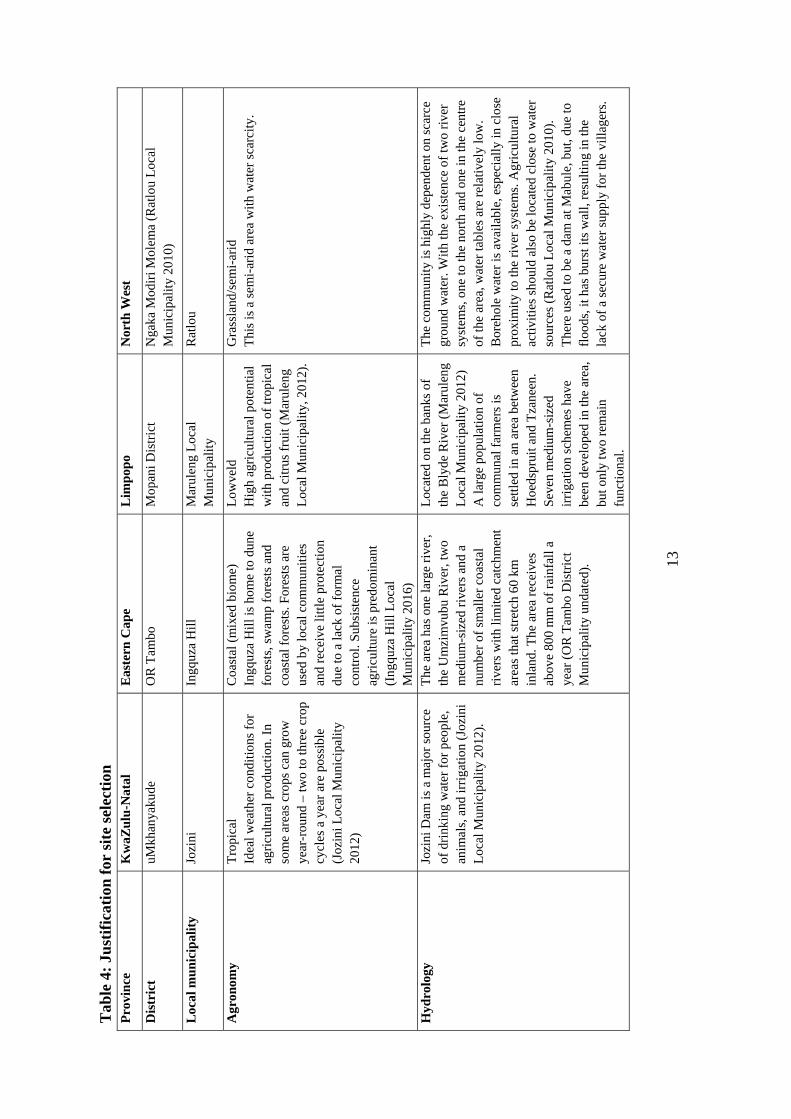
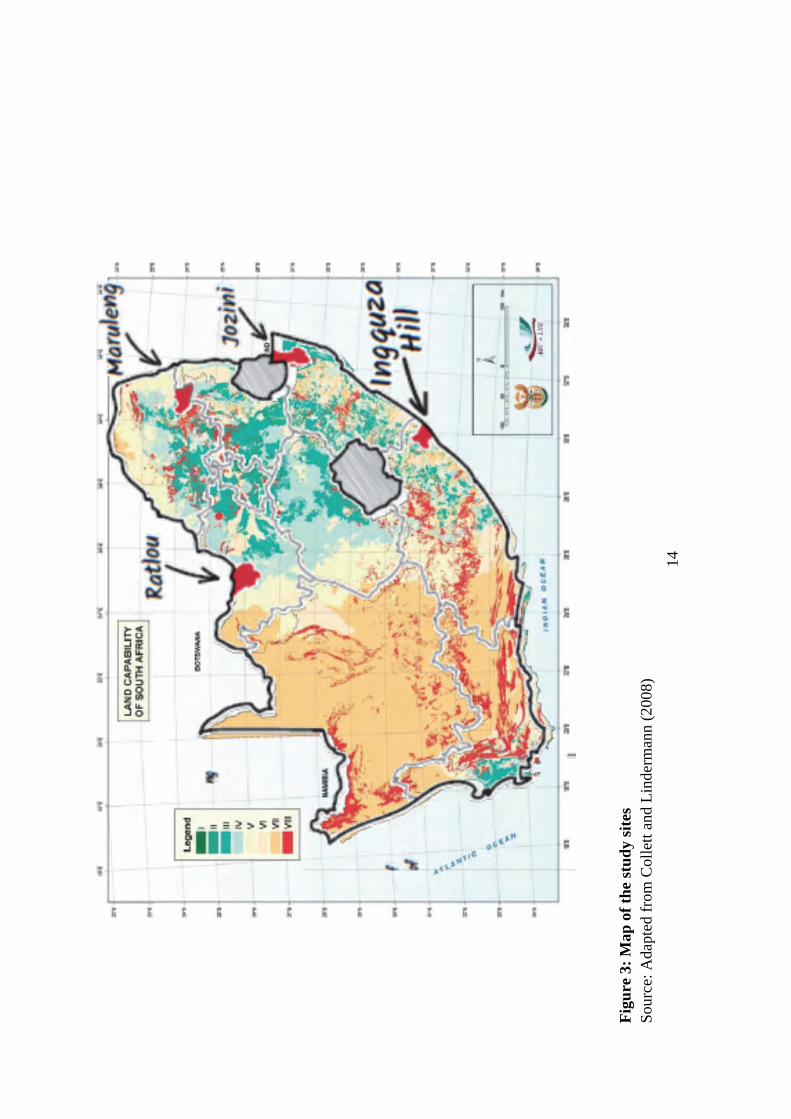
Although not direct food security indicators, many of these variables are also indicators of food insecurity and poverty. From this data, one district municipality per province was selected as the location for the study. The reports for the identified districts of the Community Rural Development Programme (CRDP) of the Department for Rural Development and Land Reform were also consulted to verify the selection of the most deprived areas. For KwaZulu-Natal, the district identified as having the highest level of child undernutrition (uMkhanyakude) did not have CRDP reports available at the time. The only available equivalent data for this district at the time were drawn from the Food Insecurity Vulnerability Information Monitoring System (FIVIMS) (NDA 2007) information sheets, using 2005 data. These information sheets confirmed that the level of deprivation in uMkhanyakude was the highest in the province. The NFCS (Labadarios and Nel 2000; Labadarios 2000) reported that Hlabisa had the highest proportion of the population experiencing hunger in the 1999 and 2005 survey data for KwaZulu-Natal. However, the proportion of households receiving migrant income in Hlabisa was high relative to Jozini. Working in Hlabisa had budgetary implications for the study. Lima had a long-term working relationship with the Jozini community (as well as the sites in the Eastern Cape and Limpopo where the site selection coincidently identified communities where Lima has long-term relationships). This facilitated community access and allowed the research team the opportunity to build on a long-term development programme in the area rather than an interventionist, extractive research approach. For these reasons, Jozini was selected as the preferred study area in KwaZulu-Natal. Jozini, Ingquza Hill, Maruleng and Ratlou had the highest rates of child stunting per province. The four sites were distinctive with different land capabilities (see Table 4 and Figure 3). Except for Mopani, they also represented the most deprived districts according to the Health Systems Trust Barometer (Day et al. 2012). The Greater Sekhukhune District had a lower level of deprivation than Mopani and fell in the bottom percentile in the province. However, Mopani had a higher level of stunting – which is an important indicator of poverty and food insecurity. Therefore, Mopani was recommended as the study site for Limpopo over Greater Sekhukhune. Initially, Port St Johns Local Municipality in the OR Tambo District was selected as the area for the Eastern Cape sample, but the undulating topography and the lack of farming settlements in this district required reconsideration of this site. In consultation with the WRC managers, Ingquza Hill was selected as having the next highest poverty rate and a suitable agricultural context.
13
Tab
le 4
: Ju
stif
icat
ion
for
sit
e se
lect
ion
Pro
vin
ce
Kw
aZu
lu-N
atal
E
aste
rn C
ape
Lim
pop
o N
orth
Wes
t
Dis
tric
t uM
khan
yaku
de
OR
Tam
bo
Mop
ani D
istr
ict
Nga
ka M
odir
i Mol
ema
(Rat
lou
Loc
al
Mun
icip
ality
201
0)
Loc
al m
un
icip
alit
y Jo
zini
In
gquz
a H
ill
Mar
ulen
g L
ocal
M
unic
ipal
ity
Rat
lou
Agr
onom
y
Tro
pica
l Id
eal w
eath
er c
ondi
tion
s fo
r ag
ricu
ltura
l pro
duct
ion.
In
som
e ar
eas
crop
s ca
n gr
ow
year
-rou
nd –
two
to th
ree
crop
cy
cles
a y
ear
are
poss
ible
(J
ozin
i Loc
al M
unic
ipal
ity
2012
)
Coa
stal
(m
ixed
bio
me)
In
gquz
a H
ill is
hom
e to
dun
e fo
rest
s, s
wam
p fo
rest
s an
d co
asta
l for
ests
. For
ests
are
us
ed b
y lo
cal c
omm
uniti
es
and
rece
ive
litt
le p
rote
ctio
n du
e to
a la
ck o
f fo
rmal
co
ntro
l. Su
bsis
tenc
e ag
ricu
lture
is p
redo
min
ant
(Ing
quza
Hill
Loc
al
Mun
icip
ality
201
6)
Low
veld
H
igh
agri
cultu
ral p
oten
tial
with
pro
duct
ion
of tr
opic
al
and
citr
us f
ruit
(M
arul
eng
Loc
al M
unic
ipal
ity, 2
012)
.
Gra
ssla
nd/s
emi-
arid
T
his
is a
sem
i-ar
id a
rea
wit
h w
ater
sca
rcit
y.
Hyd
rolo
gy
Jozi
ni D
am is
a m
ajor
sou
rce
of d
rink
ing
wat
er f
or p
eopl
e,
anim
als,
and
irri
gatio
n (J
ozin
i L
ocal
Mun
icip
alit
y 20
12).
The
are
a ha
s on
e la
rge
rive
r,
the
Um
zim
vubu
Riv
er, t
wo
med
ium
-siz
ed r
iver
s an
d a
num
ber
of s
mal
ler
coas
tal
rive
rs w
ith li
mite
d ca
tchm
ent
area
s th
at s
tret
ch 6
0 km
in
land
. The
are
a re
ceiv
es
abov
e 80
0 m
m o
f ra
infa
ll a
year
(O
R T
ambo
Dis
tric
t M
unic
ipal
ity u
ndat
ed).
Loc
ated
on
the
bank
s of
th
e B
lyde
Riv
er (
Mar
ulen
g L
ocal
Mun
icip
ality
201
2)
A la
rge
popu
latio
n of
co
mm
unal
far
mer
s is
se
ttled
in a
n ar
ea b
etw
een
Hoe
dspr
uit a
nd T
zane
en.
Sev
en m
ediu
m-s
ized
ir
riga
tion
sche
mes
hav
e be
en d
evel
oped
in th
e ar
ea,
but o
nly
two
rem
ain
func
tiona
l.
The
com
mun
ity
is h
ighl
y de
pend
ent o
n sc
arce
gr
ound
wat
er. W
ith th
e ex
iste
nce
of tw
o ri
ver
syst
ems,
one
to th
e no
rth
and
one
in th
e ce
ntre
of
the
area
, wat
er ta
bles
are
rel
ativ
ely
low
. B
oreh
ole
wat
er is
ava
ilab
le, e
spec
iall
y in
clo
se
prox
imity
to th
e ri
ver
syst
ems.
Agr
icul
tura
l ac
tivi
ties
sho
uld
also
be
loca
ted
clos
e to
wat
er
sour
ces
(Rat
lou
Loc
al M
unic
ipal
ity 2
010)
. T
here
use
d to
be
a da
m a
t Mab
ule,
but
, due
to
floo
ds, i
t has
bur
st it
s w
all,
resu
ltin
g in
the
lack
of
a se
cure
wat
er s
uppl
y fo
r th
e vi
llage
rs.
14
Fig
ure
3:
Map
of
the
stu
dy
site
s S
ourc
e: A
dapt
ed f
rom
Col
lett
and
Lin
derm
ann
(200
8)

15
3.3 Sample selection
Once the local municipalities were selected, a multistage stratified random sampling technique was applied to identify the communities and sample households for the quantitative survey and qualitative assessments. Enumeration area unit (EAU) orthophoto maps from the national statistics framework (Stats SA 2003) were obtained from Statistics South Africa (Stats SA). For the selected local municipalities, all EAUs classified as ‘traditional residential’ were listed. Random computer-generated numbers were used to select two EAUs per local municipality. The number of households per EAU was counted from the orthophoto maps provided by Stats SA. The sampled households were drawn using random computer-generated numbers from the total number of homesteads in each EAU (obtained from Stats SA). Initially, the research team had planned to sample 25 crop-producing and irrigating households per site. However, this was not possible. Where the EAUs were the sampling frame base (for the sites in Ingquza Hill, Maruleng and Ratlou and one site in Jozini), a list of at least 100 random household numbers were generated and the households were identified and approached in the order of the random sampling list. Where a household was unavailable or did not meet the criteria for inclusion (see below), the next household on the list was approached until at least 50 households per site were interviewed for the first round of data collection. Contacting the households for the second round of data collection proved tricky, so there was natural attrition in the sample size. In the case of KwaZulu-Natal, two different approaches were adopted to identify farmers from an irrigation scheme (called Makhatini Block 6B or Mjindi) and a second sample representing households not associated with an irrigation scheme. In the case of the irrigation scheme, a list of all farmers belonging to the scheme was obtained (407 members) and the households residing in Jozini (89 members) were identified. Random computer-generated numbers were used to identify a sample of 50 households. A replacement number list was drawn in the same manner and was used to substitute where farmers could not be located, were unavailable for interviews or unwilling to participate in the survey. Due to the process of substitution of additional randomly selected members, all 69 available qualifying households were interviewed from the members of the irrigation scheme. For the second group of farmers in KwaZulu-Natal who did not belong to the irrigation scheme, the same procedure was followed as for the other three provinces. The Ingquza Hill area in the Eastern Cape is quite undulating with multiple tributaries and rivulets. From an examination of the orthophoto map of the area, most households seemed to live within at least 2 km of a water source. For this reason, in this site, irrigating and non-irrigating areas were not identifiable. Similarly, at the Limpopo sites, households lived in formal housing settlements and farmed in areas beyond the township. In North West, no farming was visible at all from the orthophoto maps. This was confirmed by a site visit. It was therefore impossible to identify irrigating and non-irrigating households ahead of time, so a random sample was drawn from the total population of EAUs at two sites per municipality for these three provinces and one EAU in Jozini.

16
To be included in the survey, a household had to have at least one child aged between 24 and 59 months with a caregiver present in the homestead and willing to participate in the study. Finding qualifying households in Ratlou was difficult, due to the absence of children.
3.4 Questionnaire Design
Surveys were studied to select appropriate questions for the quantitative survey. These surveys included the following:
• Stats SA General Household Survey
• South African Quality of Life Surveys
• Household Profiling Tool of the Department of Social Development (DSD)
• South African Community Surveys
• Living Standards Measurement
• Food Insecurity Vulnerability Information Monitoring System in South Africa (FIVIMS ZA)
• SA Census 2012 and 2013 questionnaires
• Stats SA Census of Commercial Agriculture questionnaire, 2012
• Surveys from other countries (demographic household surveys) including Malawi, Zambia and Uganda
Current food security tools were also reviewed. This included the Household Hunger Scale (Ballard et al. 2011) and the Food Sovereignty Assessment Tool (Bell-Sheeter 2004). The survey tool was drafted in consultation with Stats SA, where staff members were kind enough to allow the use of the 2013 GHS as a basis for the current survey prior to the commencement of the 2013 GHS. The 2012 Stats SA census of commercial agriculture was drawn on for the agricultural production questions. The survey tool was drafted and digitised by a team member, loaded onto Samsung tablets and the data captured directly on the tablet. This allowed for instant data capturing into an Excel spread sheet for analysis. The University of Pretoria (UP) Ethics Committee granted ethical approval for the study (approval number EC130628-066). Two panel surveys were conducted at each site – one in the drier and less agriculturally productive winter months and one in the summer months (see Table 5). The survey captured information about household crop production, food consumption, a range of food security indicators, and anthropometric measurements of children aged between 24 and 59 months and their female caregivers. Quantitative data was collected through household surveys. Table 5 sets out the dates on which the surveys were conducted. Caregivers signed a standard informed consent agreement. Enumerators from the communities with at least 12 years of completed education were identified, recruited and trained for the fieldwork. The questions and terminology

17
required for the survey were translated into the local language of the area. Glossaries of terms (see Appendix A) were prepared as a guide for the enumerators and field support staff, and were used in training. The project’s principal investigator checked each survey submission as it was submitted. Each submission was checked for errors and the survey coordinator was alerted of any errors, missing data or anomalies so that these could be corrected while the survey team was on site. The survey design’s information technology expert was on call to manage technical glitches.

18
Tab
le 5
: D
ates
of
surv
eys
Pro
vin
ce
Dis
tric
t L
ocal
m
un
icip
alit
y R
oun
d
Sea
son
D
ate
Loc
atio
n
Eas
tern
Cap
e O
R T
ambo
In
gquz
a H
ill
Rou
nd 1
S
umm
er
Oct
ober
201
3 K
waT
hahl
e D
uban
a
Rou
nd 2
W
inte
r Ju
ly 2
014
25 D
uban
a 34
Kw
aTha
hle
Kw
aZu
lu-
Nat
al
uMkh
anya
kude
Jo
zini
R
ound
1 M
akat
ini
Blo
ck 6
B
(irr
igat
ion
sche
me
mem
bers
)
Win
ter
July
201
3 M
akat
ini B
lock
6B
Irr
igat
ion
Sch
eme
Rou
nd 2
for
ir
riga
tion
and
R
ound
1 f
or n
on-
irri
gati
ng
Sum
mer
O
ctob
er/N
ovem
ber
2014
M
akat
ini B
lock
6B
Irr
igat
ion
Sch
eme
Kw
aJob
e
Rou
nd 2
(n
on-m
embe
rs)
Win
ter
May
201
5 K
waJ
obe
Lim
pop
o M
arul
eng
Mop
ani
Rou
nd 1
S
umm
er
Nov
embe
r 20
14
Boc
habe
lo
Sed
awa
Rou
nd 2
W
inte
r M
ay 2
015
Boc
habe
lo
Sed
awa
Nor
th W
est
Nga
ka M
odir
i M
olem
a R
atlo
u R
ound
1
Sum
mer
N
ovem
ber
2014
M
adib
ogo
Phi
tsha
ne
Rou
nd 2
W
inte
r Ju
ne 2
015
Mad
ibog
o P
hits
hane

19
3.5 Constraints Faced During Data Collection
Tracing the households in the second round of data collection proved to be extremely difficult. Due to electioneering and disruptions of the national elections in April 2014, fieldwork had to be suspended between December 2013 and April 2014. This meant that the team was unable to survey consecutive summer and winter seasons at some of the sites. The delay also meant that some of the children who were under 59 months in the first round of data collection were older than 59 months on the second visit and could not be used in the survey for Round 2. Where possible, children who had become older than 24 months were included in Round 2. Some households were not traceable in the second round as they had relocated or the participants were not found for Round 2 of the survey. Obtaining the child anthropometry data was no simple task. The researchers did not expect the number of children attending the Early Childhood Development (ECD) centres of the DSD (especially in Jozini) to be so high. The field staff struggled to gain access to these small children in order to take their anthropometric measurements, as they were not at home during the day.
3.6 Data Treatment and Analysis
The data from the survey was cleaned, checked and analysed for frequencies. Comparisons of the various elements under investigation were conducted using Microsoft Excel and SPSS Version 23 (IBM Corporation 2014). Crop-producing households were considered to be those engaged in some form of crop production, such as vegetables, fruit or industrial crops. The scale of production was not taken into consideration, except where the data was disaggregated into large-scale farming, community gardens (smaller plots on a shared commonage), school gardens where groups farm smaller plots on a larger commonage, and home gardens. Livestock production was not considered. Non-cropping households did not engage in cropping of any kind, but may have been involved in livestock production. Irrigating households were those engaged in cropping who used some form of irrigation (from buckets to irrigation scheme canals). Numerous food security access indicators were evaluated and compared across the two seasons and compared to anthropometric measurements for children aged between 24 and 59 months and their female caregivers. Each indicator was estimated according to the following standard procedures set out in the literature. The Household Dietary Diversity Score (HDDS) (Kennedy et al. 2011) is a measure of dietary quality. It uses a 24-hour recall period of 16 food groups, without asking about frequency of consumption. The HDDS is the sum of the first 14 scores classified as ‘1’ for yes and ‘0’ for no. As this is a continuous variable without international cut-offs, it was not

20
classified into categories for this study. The description of the food groups is presented in Table 6. In this study, a non-quantitative 24-hour recall was used.
Table 6: List of food groups Cereals: maize, millet, sorghum, wheat and any other foods made from cereals such as porridges and bread White roots and tubers: potatoes, sweet potatoes (excluding orange-fleshed sweet potatoes)
Orange-fleshed vegetables: butternut, carrots, orange-fleshed sweet potatoes and pumpkin Dark green leafy vegetables: including imifino (green leafy vegetables), morogo (wild/indigenous green leafy vegetables) Other vegetables: eggplant, gem squash, green beans, onions and tomatoes
Orange-coloured fruit: apricot, dried peach, ripe mango, papaya and 100% fruit juice made from these fruit Other fruit: banana, apple, orange and pear
Organ meat: heart, kidney, liver and other organ meats
Meat: beef, goat, poultry, pork and sheep
Eggs
Fish and seafood: fresh, tinned or dried fish and shellfish
Dried beans and pulses: lentils, nuts, peas, seeds or foods made from these (e.g. peanut butter) Milk and milk products: cheese, milk, amasi and yoghurt
Oils and fats: butter, lard, margarine and sunflower oil
Sweets: honey, sugar, sweetened squashes and juices, carbonated sweetened drinks and sugary foods such as chocolates, cookies and cakes Beverages and spices: condiments (e.g. tomato sauce), pepper and salt, non-alcoholic beverages (coffee and tea) and alcoholic beverages Self-reported experience of hunger questions was used to estimate the incidence of experiences of hunger among adults and children in households during the preceding 12 months. The experience of hunger was based on questions typically included in the South African GHS (Stats SA 2014b). These questions ask whether any adult or child went hungry in the past 12 months because there was not enough food in the household during that time. Months of inadequate household food provision is a simple sum of the number of months a household reports experiencing hunger in the previous 12 months (Bilinsky and Swindale 2010).

21
Anthropometry was used to assess children between 24 and 59 months and their female caregivers. Z-scores for child anthropometry were determined using Anthro for Personal Computers (version 3.2.2) (WHO 2011b) and international reference guidelines. Adult body mass index (BMI) was calculated as the weight of a caregiver divided by her height in centimetres squared.
3.7 Training of Enumerators
Lima recruited enumerators from the communities in which the surveys were conducted. Eight enumerators from each community were selected and trained in survey data collection. The enumerator training was carried out in stages. Initial training on the use of the mobile device was carried out. The enumerators were taken through the paper-based survey questions. They were then trained on entering the data into the tablet. Experts from UP trained the enumerators in taking the anthropometric measurements. Role play was used to allow enumerators to practice engaging with households, introduce the survey, complete the informed consent form, ask questions, take anthropometric measurements and accurately record these, as well as entering and checking the data. Anthropometry training sought to accomplish the following:
• Familiarise the enumerators with the anthropometric equipment
• Demonstrate techniques
• Give enumerators the opportunity to practice techniques under supervision
• Standardise height measurement
The training focused on three anthropometric measures:
• Weight (adult caregivers and two- to five-year-old children)
• Standing height (adult caregivers and two- to five-year-old children)
• Mid-upper arm circumference (MUAC) (two- to five-year-old children)
The training procedure included the following:
• Familiarisation with the equipment in terms of proper assembly, disassembly, operation, maintenance and storage; the equipment included the following: - Leicester portable stadiometers (INVICTA PLASTICS Ltd, England) for height - CAMRY digital scales (ISO 9001 (2008 certified by SGS) models EB9323 and
EF906 and 118) for weight - United Nations International Children's Emergency Fund (UNICEF) colour-
coded insertion tapes for MUAC
• Step-by-step demonstration of the proper technique by the trainer
• Practice of the technique by the enumerators in a relaxed atmosphere, yet under supervision, to ensure that they were at ease, to explain how to deal with unusual/practical problems (e.g. the positioning of obese participants or correction for a non-compressible hairdo) and to address measurement errors

22
• Standardisation, whereby each enumerator performed duplicate measurements on eight other people in a blinded, private fashion. This was documented on pre-prepared forms to provide evidence of quality control and a degree of inter-rater reliability
For ethical reasons, the field staff and enumerators were told that should a child’s MUAC be below 11 cm (i.e. in the red zone of the insertion tape), they should encourage caregivers to visit their primary health care clinic with their growth monitoring (Road to Health) booklet for a full assessment. Enumerators were reminded about the principles of the research, professional conduct and their role as data collectors (i.e. they should not counsel or interpret and judge the data during collection). The care and safety of equipment was emphasised. Training in dietary assessment sought to achieve the following:
• Supplement previous training on the tablet
• Clarify food groupings though the provision and use of graphic images
• Practise the collection of non-quantitative 24-hour diet recalls
Eight A5-sized, laminated show cards with simple drawings of examples of foods in the eight food groups in the HDDS (as contained on the digital tablet) were discussed and explained to enumerators to highlight the distinguishing features of each group. An A3-sized composite of all eight groups was available for the learning facilitator. It was suggested that these be used during the interviews. The principles of a non-quantitative 24-hour recall according to the HDDS (Kennedy et al. 2011) were explained. Appendix A presents the glossary of terms in the local languages used for standardisation of terminology and food types.
3.8 Focus Group Discussions
Focus group discussions (FGDs) were held in each community to discuss food consumption and production practices and to explore precautionary behaviour adopted when faced with food shortages. The Lima officers at each site recruited participants for the FGDs. The FGDs were arranged by the Lima office staff in each community. Participation in the FGDs was determined by community member availability. The majority of participants were women. Table 7 presents the FGDs and the number of participants in each focus group. The aim of the FGDs on food consumption and production was to explore food consumption patterns at each site and to get a broad overview of the food production and consumption patterns of the households in each study area. The current food consumption practices and food insecurity of the households were investigated by determining the availability and accessibility (including affordability) of food. Changes in food production were also explored, together with how these changes influenced food practices. The FGDs also included simple questions around access to farming resources, including land and water, to gain a general understanding of their experiences as subsistence farmers.

23
Tab
le 7
: F
ocu
s gr
oup
dis
cuss
ion
s he
ld
Loc
al
mu
nic
ipa-
lity
Su
rvey
sit
e F
GD
s fo
r d
iscu
ssin
g co
nsu
mp
tion
an
d
pro
du
ctio
n p
atte
rns
FG
Ds
for
dis
cuss
ing
seas
onal
ity
and
foo
d s
ecu
rity
Gro
up
C
omp
osit
ion
N
um
ber
of
par
tici
-p
ants
Gro
up
C
omp
osit
ion
N
um
ber
of
par
tici
pan
ts
Ingq
uza
Hil
l
Kw
aTha
hle
(Fla
gsta
ff)
Hla
bath
i N
ine
wom
en
9 K
waT
hahl
e N
ine
wom
en
and
two
men
11
Mto
ntsa
na
- -
- S
ophu
mel
ele
Eig
ht w
omen
8
Mze
nge
- -
- M
zeng
e C
omm
unit
y P
roje
ct
Six
wom
en
6
Dub
ana
L
amba
se
(fir
st r
ound
) 13
wom
en
13
Lam
base
13
wom
en
13
Mpo
za a
nd
Lud
idi
Maz
ikhu
le
Com
mun
ity
Pro
ject
13 w
omen
and
th
ree
men
16
Mas
ikhu
le
Com
mun
ity
Pro
ject
12
wom
en a
nd
two
men
14
Fol
low
-up
10
wom
en a
nd
two
men
12
-
- -
Mda
kani
-
- -
Mda
kani
Chi
cken
P
roje
ct
Eig
ht w
omen
an
d th
ree
men
11
Jozi
ni
Sib
ongi
le
(Mak
hath
ini
area
)
Fir
st r
ound
10
wom
en a
nd
four
men
14
M
akha
thin
i Blo
ck
B I
rrig
atio
n S
chem
e
13 w
omen
and
tw
o m
en
15
(Sec
ond
roun
d) F
ollo
w-
12 w
omen
12
M
apha
ya
Com
mun
ity
Eig
ht w
omen
an
d tw
o m
en
10

24
Loc
al
mu
nic
ipa-
lity
Su
rvey
sit
e F
GD
s fo
r d
iscu
ssin
g co
nsu
mp
tion
an
d
pro
du
ctio
n p
atte
rns
FG
Ds
for
dis
cuss
ing
seas
onal
ity
and
foo
d s
ecu
rity
Gro
up
C
omp
osit
ion
N
um
ber
of
par
tici
-p
ants
Gro
up
C
omp
osit
ion
N
um
ber
of
par
tici
pan
ts
up
Gar
den
Kw
aJob
e
Com
mun
ity
gard
en
13 w
omen
and
th
ree
men
16
G
G F
ocus
Gro
up
Nin
e w
omen
an
d on
e m
an
10
Com
mun
ity
gard
en
13 w
omen
13
C
ezw
ana
(Zam
ini
Gar
den)
N
ine
wom
en
9
Com
mun
ity
gard
en
Fol
low
-up
Fiv
e w
omen
5
Bon
elan
i E
ight
wom
en
8 M
angw
enya
S
even
wom
en
7
Mzi
nyen
i -
- -
Siy
apha
mbi
li
Com
mun
ity
Gar
den
12 w
omen
and
fi
ve m
en
17
Ohl
alw
ini
- -
- O
hlal
win
i Gar
den
11
wom
en
11
Mar
ulen
g
Mad
eira
L
efat
a P
roje
ct
Gro
up
15 w
omen
15
L
efat
a P
roje
ct
Gro
up
16 w
omen
16
Sed
awa
Com
mun
ity
Hal
l
16 w
omen
and
si
x m
en
22
(inc
reas
ed
to 3
3 du
ring
m
eeti
ng)
Ena
ble
Pig
gery
G
roup
13
wom
en a
nd
one
man
14
Com
mun
ity
14 w
omen
and
16
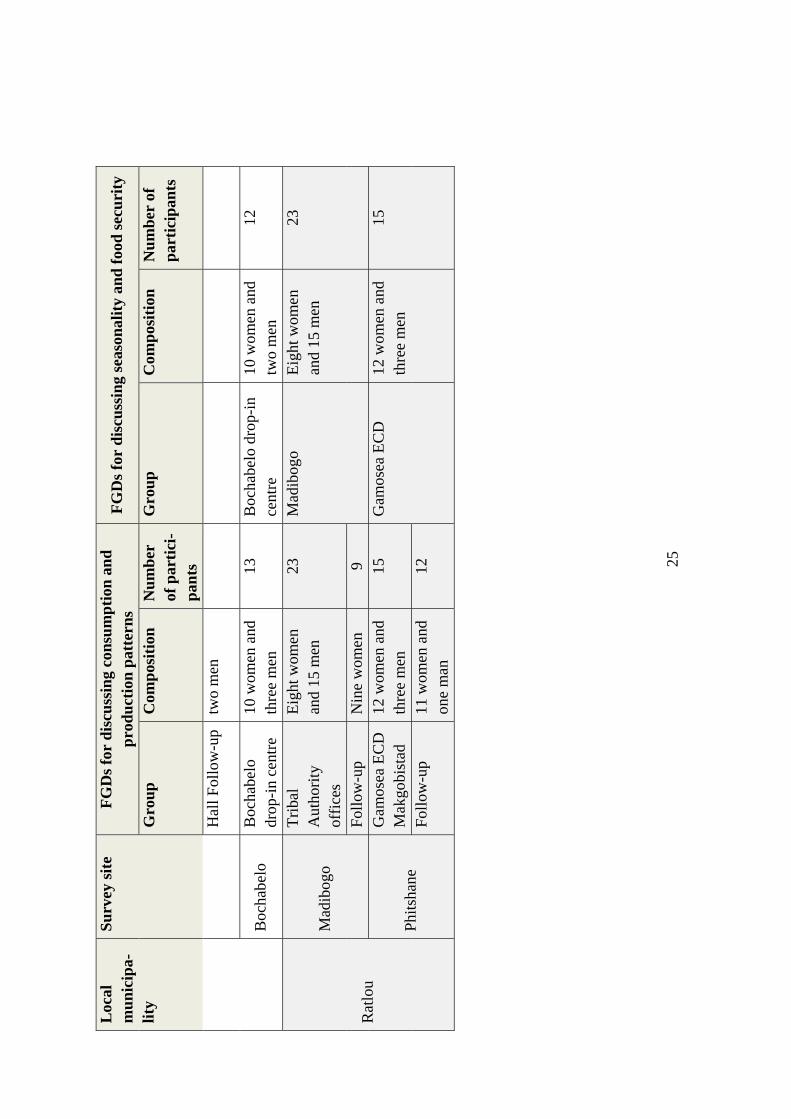
25
Loc
al
mu
nic
ipa-
lity
Su
rvey
sit
e F
GD
s fo
r d
iscu
ssin
g co
nsu
mp
tion
an
d
pro
du
ctio
n p
atte
rns
FG
Ds
for
dis
cuss
ing
seas
onal
ity
and
foo
d s
ecu
rity
Gro
up
C
omp
osit
ion
N
um
ber
of
par
tici
-p
ants
Gro
up
C
omp
osit
ion
N
um
ber
of
par
tici
pan
ts
Hal
l Fol
low
-up
two
men
Boc
habe
lo
Boc
habe
lo
drop
-in
cent
re
10 w
omen
and
th
ree
men
13
B
ocha
belo
dro
p-in
ce
ntre
10
wom
en a
nd
two
men
12
Rat
lou
Mad
ibog
o
Tri
bal
Aut
hori
ty
offi
ces
Eig
ht w
omen
an
d 15
men
23
M
adib
ogo
E
ight
wom
en
and
15 m
en
23
Fol
low
-up
Nin
e w
omen
9
Phi
tsha
ne
Gam
osea
EC
D
Mak
gobi
stad
12
wom
en a
nd
thre
e m
en
15
Gam
osea
EC
D
12 w
omen
and
th
ree
men
15
Fol
low
-up
11
wom
en a
nd
one
man
12

26
A list of topics to explore the food practices was prepared with specific questions and probes to explore each of them. These included aspects relating to the following:
• Food consumption patterns
• Food supply (food sources – cultivated, collected, hunted, bought)
• Food for small children
• Food preparation facilities
• Changes in food consumption patterns
• Special occasions
• Food shortages
The questions about access to resources probed participants’ understanding of decision-making and resource allocation by local authorities. The researchers also asked the women to describe changes over time in the way food was produced and consumed, using the surrounding features, for example the dam or terraced land, as reference points. The participants were asked questions about how and why farming had changed over the years and how this had influenced the availability of and preferences for different foods. Key informant interviews were also conducted.
3.9 Validation of Findings
Four validation workshops were held between 8 and 18 February 2016. Each workshop was attended by 30 to 40 participants. The participants included the community members and farmers who participated in the earlier surveys and FGDs, community garden organisers (schools and clinics), district agricultural extension workers and rural development workers. The aim of the workshops was to present the research results to the communities for validation and feedback. Varying levels of literacy among the participants necessitated the presentation of numerical, quantitative data in an accessible way. A graphic designer was engaged to prepare a series of posters and brochures, the latter which could remain with the participants. The four-page brochures contained a simple introduction to the research project and a map indicating the four districts included in the study. A brochure was prepared for each site. The brochures also contained tables presenting data on household dietary diversity, including the frequency of food consumption over the previous seven days and the seasonal consumption of different food groups, the anthropometry of adult female caregivers and children, key nutrition messages and recommended irrigated and non-irrigated crops for optimal dietary diversity in summer and winter. The data was presented orally in the local languages through interpreters. Each participant was given a brochure. After the presentation, the participants were divided into thematic groups to discuss the findings among themselves. The groups were divided into farmers or

27
growers, garden project workers and extension or rural development workers, or by communities, to capture different perspectives on the research findings. The discussion groups then presented their conclusions to the larger group. The following discussion questions were given to the groups:
• Is the information supplied in this brochure an accurate depiction of the situation or context in the community?
• Are there foods in the recommended list for growing and eating that the community would not grow for reasons of preference, taste and/or culture?
• Are there foods in the recommended list for growing and eating that the community would not grow for reasons related to agronomic factors? What are these factors?
• If they could tell the WRC what to prioritise for research, what would it be? (varieties, crops, practices, water-related applications)
• Have we missed anything?
The next chapters present the findings of the quantitative and qualitative research.

28
CHAPTER 4: DESCRIPTION OF STUDY SITES
4.1 Demography
The OR Tambo District is located in the east of the Eastern Cape on the Indian Ocean coast. Some 80% of the territory was formerly part of the Transkei homeland. The district’s population is 1 358 917 and consisted of 298 229 households in 2011 (Stats SA undateda). Only 9% of these have piped water inside, while 70% use electricity for lighting and 11% have weekly refuse removal. Ingquza Hill Local Municipality has 278 481 people who live in rural areas under the jurisdiction of traditional authorities and in traditional dwellings (Stats SA undated a). The uMkhanyakude District is in the north of KwaZulu-Natal and borders Swaziland and Mozambique. The population of uMkhanyakude is 638 011 people living in 128 195 households, of which only 13% have piped water inside dwellings, 38% use electricity for lighting and only 9% have a weekly refuse removal service. Among people over 20 years of age, 25% have matric and 4.9% have a higher education. Almost 90% of the population lives in rural areas under the jurisdiction of traditional authorities. Between 2001 and 2011, the population of Jozini grew from 184 206 to 186 502 and comprised 38 849 households (Stats SA undated b). The Mopani District in the northeast of Limpopo covers a land area of 20 011 km2 with 1 109 822 people living in 125 270 households. Between 2001 and 2011, the population of Maruleng grew from 94 384 to 94 857 and comprised 24 470 households with an average household size of 3.7, of which 96% live in formal dwellings. These are most often located in traditional or tribal settlements, which comprises 89% settlement types (Stats SA undated c). Ngaka Modiri Molema District has a population of 852 614 with a population density of 30 persons per km2 and 227 001 households. Only 25% of the households have piped water inside dwellings, 80% use electricity for lighting and 35% have a weekly refuse removal service. In Ratlou Local Municipality, 95% of the population lives under the jurisdiction of traditional authorities (Stats SA undated d). Unemployment in the OR Tambo District is 44%, and in uMkhanyakude it is 43%. Ingquza Hill and Jozini fall into the socio-economic Quintile 1 and are some of the poorest districts in South Africa. Mopani and the Ngaka Modiri Molema districts fall into the socio-economic Quintile 2. Table 8 presents a summary of comparative demographics for the four sites (Stats SA undated a, b, c and d).
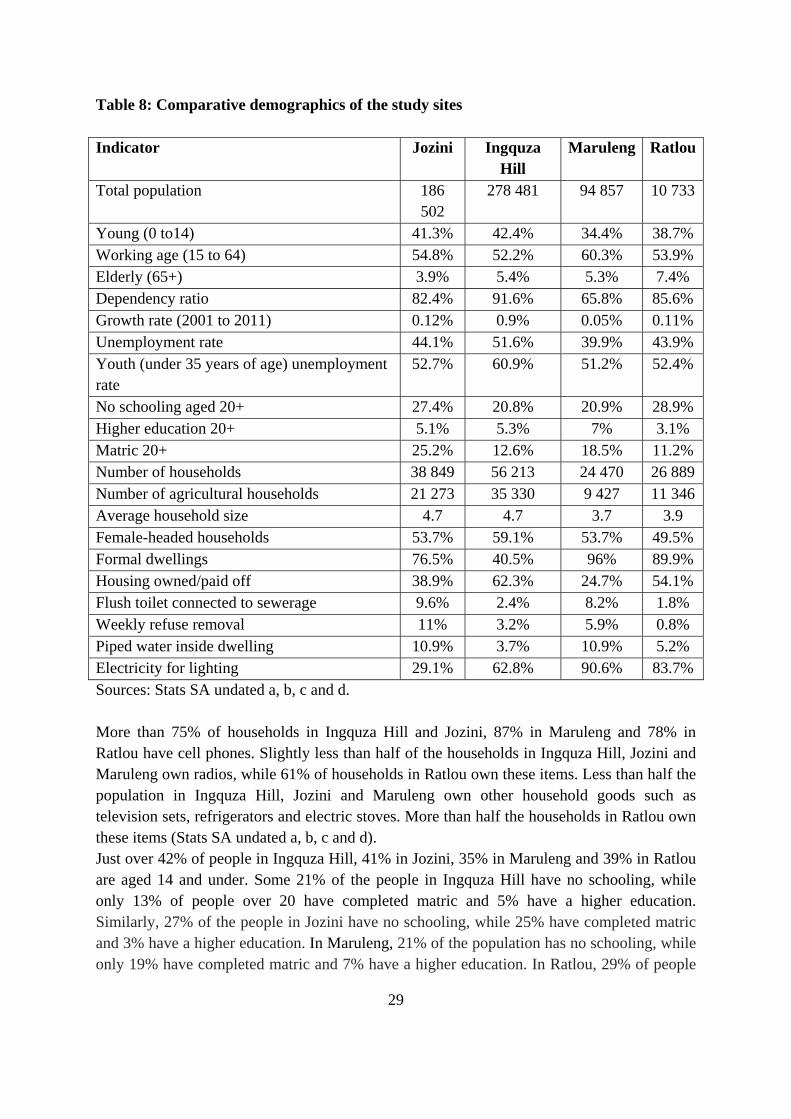
29
Table 8: Comparative demographics of the study sites Indicator Jozini Ingquza
Hill Maruleng Ratlou
Total population 186 502
278 481 94 857 10 733
Young (0 to14) 41.3% 42.4% 34.4% 38.7% Working age (15 to 64) 54.8% 52.2% 60.3% 53.9% Elderly (65+) 3.9% 5.4% 5.3% 7.4% Dependency ratio 82.4% 91.6% 65.8% 85.6% Growth rate (2001 to 2011) 0.12% 0.9% 0.05% 0.11% Unemployment rate 44.1% 51.6% 39.9% 43.9% Youth (under 35 years of age) unemployment rate
52.7% 60.9% 51.2% 52.4%
No schooling aged 20+ 27.4% 20.8% 20.9% 28.9% Higher education 20+ 5.1% 5.3% 7% 3.1% Matric 20+ 25.2% 12.6% 18.5% 11.2% Number of households 38 849 56 213 24 470 26 889 Number of agricultural households 21 273 35 330 9 427 11 346 Average household size 4.7 4.7 3.7 3.9 Female-headed households 53.7% 59.1% 53.7% 49.5% Formal dwellings 76.5% 40.5% 96% 89.9% Housing owned/paid off 38.9% 62.3% 24.7% 54.1% Flush toilet connected to sewerage 9.6% 2.4% 8.2% 1.8% Weekly refuse removal 11% 3.2% 5.9% 0.8% Piped water inside dwelling 10.9% 3.7% 10.9% 5.2% Electricity for lighting 29.1% 62.8% 90.6% 83.7% Sources: Stats SA undated a, b, c and d. More than 75% of households in Ingquza Hill and Jozini, 87% in Maruleng and 78% in Ratlou have cell phones. Slightly less than half of the households in Ingquza Hill, Jozini and Maruleng own radios, while 61% of households in Ratlou own these items. Less than half the population in Ingquza Hill, Jozini and Maruleng own other household goods such as television sets, refrigerators and electric stoves. More than half the households in Ratlou own these items (Stats SA undated a, b, c and d). Just over 42% of people in Ingquza Hill, 41% in Jozini, 35% in Maruleng and 39% in Ratlou are aged 14 and under. Some 21% of the people in Ingquza Hill have no schooling, while only 13% of people over 20 have completed matric and 5% have a higher education. Similarly, 27% of the people in Jozini have no schooling, while 25% have completed matric and 3% have a higher education. In Maruleng, 21% of the population has no schooling, while only 19% have completed matric and 7% have a higher education. In Ratlou, 29% of people

30
over 20 have no schooling, while only 11% have completed matric and 3% have a higher education. It is suggested that those who acquire tertiary education are likely to seek work opportunities elsewhere (Stats SA 2015). There is a notable outmigration trend among young men in Ingquza Hill, which skews the population towards more women than men, and women head 59% of the households. Overall unemployment in Ingquza Hill in 2011 was 52%, while it was 44% in Jozini, 40% in Maruleng and 44% in Ratlou. Youth (younger than 35 years) unemployment in all four sites is just above 50% in Jozini, Maruleng and Ratlou and over 60% in Ingquza Hill (Stats SA undated a, b, c and d). Slightly less than half (44%) of the households in Ingquza Hill, 59% of the households in Jozini, 65% of the households in Maruleng and 87% of the households in Ratlou are classified as agricultural, but keep animals only. In Ingquza Hill, Jozini and Maruleng, this is mainly poultry, but in Ratlou, these households may keep poultry and livestock. Mixed farming is practiced by 39% of agricultural households in Ingquza Hill, 27% in Jozini, 17% in Maruleng and 3% in Ratlou. Only 17% of households in Ingquza Hill, 12% in Jozini, 15% in Maruleng and 1% in Ratlou grow crops only. A high proportion of agricultural households (43% in Ingquza Hill, 44% in Jozini, 42% in Maruleng and 38% in Ratlou) fall in the category of having no income, while 45% of households in Ingquza Hill, 38% of households in Jozini, 46% of households in Maruleng and 53% of households in Ratlou have an income of between R4 801 and R38 400 per month (Stats SA undated a, b, c and d). The Ingquza Hill Local Municipality (2014 considers its key challenges to be infrastructure backlogs, land ownership and land rights, high poverty and unemployment, high grant dependency and poor access to social development services.
The Jozini Local Municipality (2013) considers fish farming, cropping and agro-processing to be among its key opportunities for economic growth, with rehabilitation of the Makhathini (Mjindi – a site for one of the samples) irrigation scheme as a focal point for cropping. Some 314 individual farmers (of which 84 are women) on the scheme currently produce cotton, sugar cane and vegetables. In addition, there are eight cooperatives on the scheme, totalling 603 members (of which 572 or 95% are women). The R1.8 billion broad-based black economic empowerment (B-BBEE) Makhathini sugar cane (biofuels) project was initiated in 2012 on land held by the traditional authority. It includes the Industrial Development Corporation, Tongaat Hewlett, the Development Bank of South Africa, the Central Energy Fund and Makhathini Agricultural Development Cooperative as partners. The Maruleng Integrated Development Plan (IDP) (Maruleng Local Municipality undated) identifies its dominant economic activity as commercial agriculture, with 41% of formal employment provided by the commercial agriculture sector. The IDP considers claims and access to markets to be the most significant challenges to agricultural development. Regarding emerging, small-scale or subsistence farming, the IDP mentions very little, other than acknowledging that commercial mango and citrus production (currently the largest of

31
the sector) is not accessible to these people and that organising smaller farmers into cooperatives and promoting new commercial crops such as sugar cane should be considered. The Ratlou Local Municipality considers agriculture to be a main priority for economic development and a catalyst for fighting poverty (Ratlou Local Municipality 2010). The agricultural support plan aims to promote the production of high-value cash crops through small-scale farming and to make better use of land reform and communal land to promote commercial farming. In 2011, however, only 1 371 people were formally employed in agriculture, a number that dropped from 1 565 in 2001. Although the local economic development plan cites the national CRDP, it does not clearly translate the objectives to the municipal level and no explicit connections are made between agriculture and food security.
4.2 Brief Overview and Observations from the Sites
The fieldwork included both qualitative and quantitative assessment and provided rich insight into the daily lives of the communities included in the study. Tables 9 and 10 present the number of households surveyed through the quantitative questionnaire per site and per community.
Table 9: Number of surveyed households at each site
Site
Summer Winter
Number Proportion of sample (%) Number
Proportion of sample (%)
Ingquza Hill 55 19.8 70 25.0 Jozini 118 42.4 84 30.0 Maruleng 36 12.9 60 21.4 Ratlou 69 24.8 66 23.6 Total 278 100.0 280 100.0

32
Table 10: number of households surveyed per community Site Location Summer Winter
Number Proportion of sample (%)
Number Proportion of sample (%)
Ingquza Hill Dubana 21 7.6 29 10.4 KwaThahle 34 12.2 41 14.6
Jozini Irrigation Scheme
72 25.9 40 14.3
KwaJobe 46 16.5 44 15.7 Maruleng Bochabelo 11 4.0 30 10.7
Sadawa 25 9.0 30 10.7 Ratlou Madibogo 47 16.9 49 17.5
Phitshane 22 7.9 17 6.1 Total 278 100.0 280 100.0
The sections below provide an overview of observations from each site from the qualitative component of the study.
4.2.1 Ingquza Hill
One of the striking features of the landscape of the Ingquza Hill sites were the vast tracts of rain-fed, terraced farmland that were formerly planted with maize and other staples, but are now in disuse. Currently, subsistence farmers work on small, fenced home gardens, producing vegetables and keeping a few items of small livestock. A few households still use traditional ox-drawn ploughs and sledges, but these are rare and are only used by a few enthusiastic and dedicated older people who work without much support. For the most part, the terraced land lies fallow and has been this way for several decades. The researchers asked participants in the focus groups and key informant interviews to explain why the terraces were no longer being used. They replied that terrace farming was initially practised because of the steep slopes in the area, but began to disappear 30 years ago, along with the implements and particular type of oxen used to plough. These are some of the explanations offered:
• The soil is not very fertile and the land needs to lie fallow too often.
• There is no longer enough rain.
• There are no longer fences (these apparently used to be provided by the traditional leaders) and the livestock eats the crops.
• Children have to attend school so there is no one to tend the cattle.
• When more men worked in the mines, there was money to buy fencing, oxen and other inputs.
• People are leaving to work in the cities and do not want to farm anymore.

33
• People are lazy and do not want to farm; they would rather stay at home and collect social grants (especially the young people).
The system of communal land tenure has not changed in this period and land shortages were not mentioned as a constraint to farming. What seems to have changed, however, is the availability of food. The focus group participants claimed that food was much more abundant a generation ago, including a wide variety of traditional foods (described in detail in the food consumption findings). One participant explained: “There was so much milk, we used to feed amasi (sour milk) to the dogs.”
4.2.2 Jozini
Most of the surveyed households that were engaged in larger-scale crop production were in Jozini. No households from Ingquza Hill and Ratlou were engaged in larger-scale farming (more than half a hectare). The focus group participants indicated that large-scale and extensive grazing was prevalent in the past (before 1990). Grazing had declined, as had the general wealth of the community. Although the focus group participants took care to explain that this wealth was not necessarily in terms of money, rather people had their own cattle and fields to farm and produced things that now need to be purchased, such as milk. FGDs revealed that the context of food production and food security in the district of uMkhanyakude has changed over time. There is hunger in the community, “...the conditions are not like in the old days when there was a good harvest. These days, there is no rain and [people] don’t produce much.” The period between 1984 and 1990 was referred to as a productive agricultural time. There used to be sufficient rain, but not anymore. The drought, according to the women, brought other changes besides diminished grazing to the landscape. There used to be more forested areas and a wider variety of trees in the past. When there was enough rain, the women reported using hand hoes to plant, but now they rely on tractors, because the land is ‘hard’. Previously, rainfall fell earlier in the year and they used to plant in July and it would rain in August, but now, by the time the rain comes, the seeds have died. While the drought seems to have put an end to rain-fed home gardening, irrigation now enables year-round production in cooperative gardens for those who can participate. Those who do not have access to irrigation, according to the FGDs, are the ones in the community who go hungry. Besides, the establishment of gardening cooperatives and irrigation has brought other changes to the community. One group referred to a particular irrigated farming project, which was a source of employment at one point, but had apparently failed and many people lost their jobs. Across three FGDs, there was ambiguity relating to knowledge about access to water for farming and how irrigation scheme decisions were made. The participants reported that

34
anyone with irrigation equipment could draw water from the river. Mjindi Farming makes the decisions about water scheme management, as it manages the scheme in Makatini. Water is available to the community members, “but you have to get it from the river to your land.” Water decision-making is clearly a critical issue in the community. The Water Users Association is a participatory platform and includes a wide range of stakeholders that, in principle, should include subsistence, small-scale and commercial farmers, household users, tourism and recreational users, industry, the municipality and tribal authorities. According to one key informant in Jozini, the power dynamics are problematic. Access to land, according to the focus groups, is not perceived as a pressing issue in the community, although land with access to water is. Being close to the river has obvious advantages. Sugar cane and maize farmers tend to occupy the prime land along the river. FGD participants and informants repeatedly emphasised access to water as the real obstacle to production. This is what enables the cooperatives to produce food for their own consumption and for the local market to earn an income from farming.
Although land was not raised as a point of conflict or tension among the focus groups, there was ambiguity about the processes by which land changes hands within communal ownership, and what the criteria are for land that is considered ‘in use’. One must be a member of the community to be granted permission by the induna (tribal councillor) to use it for a specific purpose.
4.2.3 Maruleng
Maruleng is a district where agriculture appears to play a very central role in livelihoods, perhaps more so than in the other study sites, and there seems to be more diverse and vibrant involvement in household, subsistence and smallholder production, as well as a greater variety of crops and more involved local management and innovation.
Overall, Maruleng producers seem to farm on larger plots and produce more staples than the Eastern Cape and KwaZulu-Natal groups. Some households were farming maize on plots of up to six hectares. They reportedly produced enough maize to feed their families for the entire year without the need to purchase maize. Their main constraints seem to be fertilizer and mechanised tillage (the use of tractors), which are both considered too expensive. Water is also considered an important issue, with inadequate local infrastructure as the main constraint.
The Mopani District has a number of small, community-managed irrigation schemes fed by mountain springs. One of these is in Maruleng near the Madeira community. Built in the late 1960s, it is maintained entirely with community labour and resources with reportedly no government support. Its further reaches are in disrepair, but the main network of canals, sluices and dams seems to be functioning. Small plots of less than one hectare of fruit and vegetables are grown on this scheme. The scheme manager is tasked with opening and

35
closing the sluices in accordance with decisions taken by a local committee. The water source in the mountains is a sacred site that is occasionally used by church groups and during initiations. It was said to be inhabited by water spirits – a belief that is commonly held in traditional rural communities in this area.
There are other organised groups of farmers interested in and practicing agro-ecology and sustainable farming methods, for example, the Mopani Farmers’ Union, members of which have been involved with sustainable farming activists, including the global peasant organisation La Via Campesina. One example was a female farmer who used agro-ecological methods to produce food (traditional maize, pumpkins, sweet potatoes and other vegetables, along with medicinal crops such as moringa and wild ginger). She raises small livestock (free-range local chickens) and keeps a few head of cattle. Using composting, manure from chickens and cattle, and mulching, this farmer produces sufficient food for herself and her neighbours, with additional produce to sell, as well as medicinal crops that can be sold to buyers from outside the province, meeting a growing demand for moringa powder as a natural nutritional supplement. She saves and trades seeds with other farmers and networks with local and international small farmers and food activists. She experiments with seeds, composting and mulching, and is a rich source of knowledge of traditional farming methods and indigenous plants. She works without irrigation and credits her productivity to good soil management, which she contrasts with the input-reliant practices of her seed- and fertilizer-purchasing neighbours. She points out that they are all in debt because inputs just get more expensive each year.
One small-scale farmer complained about the high water demand and low yields over time from a conventional maize crop grown on a one-hectare plot from seed purchased at the co-op, using chemical fertilizers, pesticides and herbicides. He complained of being in debt to the co-ops for much of the year. This suggests perhaps unsuccessful attempts at ‘scaled-down’ commercial farming on plots too small and with inadequate irrigation to grow maize as it is grown commercially.
4.2.4 Ratlou
The Phitshane and Madibogo communities in the Ratlou District Municipality, although 80 km apart, share the same typical arid bushveld-savannah type landscape. With the exception of a few large farms, limited crop production was observed. In the FGDs, participants confirmed that, nowadays, only a few people engage in limited crop production activities. This is also shown in Table 11, with only 6% of the households doing home gardening. Previously, many households followed the Tswana tradition of cultivating crops for household use at the masimo (traditional cultivation fields usually outside a Tswana village). Some of the older focus group participants in Madibogo remembered that maize was grown on large maize farms in the area during the time when Madibogo was part of the Bophuthatswana homeland. In recent years, the scale of maize production in this area has decreased on many of these farms to such an extent that the grain silos near the railway

36
station in Madibogo are no longer in use. The low maize and other crop production activities were attributed to the low rainfall in recent years and the scarcity of water as nearby rivers had dried up and only a few households had access to boreholes. They also emphasised that because of limited access to other resources for crop production such as pesticides, fertilizers and equipment, they were not in a position to produce enough food, if any, for household consumption. Many households in Phitshane did not have access to piped water in their homes and the communal taps in large sections of the village were often without water. Water for household consumption is then transported in 25-litre containers by donkey carts, wheelbarrows or tractors, or is carried by hand from other communal taps or tanks to the households in the sections without water. Although many households in Madibogo have access to piped water, the water supply was usually insufficient to supply home gardens. In both communities, indigenous plants are collected from the wild in summer after the first rains. Although the participants in the focus groups revealed that many indigenous plant species are becoming scarce or even unavailable, this was attributed to climate change, low rainfall and the use of fertilizers. The majority of households in Ratlou have thus become very dependent on the retail sector for the food supplies they purchase from big supermarkets in Mafikeng, Delareyville or Vryburg on a monthly basis. This is supplemented by perishable foods purchased from the local stores and spaza shops when required and if they have money available.

37
CHAPTER 5: CURRENT RAIN-FED AND IRRIGATED PRODUCTION
The number of households engaged in crop production is presented in Table 11. Close to nine in ten surveyed households in Ingquza Hill and Jozini were engaged in crop production (90%). More than eight out of ten (82%) of the surveyed households in Maruleng were engaged in cropping. Very few households (four) surveyed in Ratlou were engaged in home gardening. All community gardens were irrigated, while 78% of farmland and 75% of school gardens were irrigated. Just less than half (47%) of home gardens were irrigated. Irrigation was taken to mean any application of supplemental irrigation – from overhead sprinklers using pumps, flood irrigation on irrigation schemes, and municipal water from taps or rain tanks (seen at many Ingquza Hill homesteads), to using a hose pipe or watering can with water drawn from rivers, tributaries, springs, wells, boreholes and tanks (Table 11). The highest proportion of household gardens was found at Ingquza Hill (92% of the sample in this area). In Maruleng, 78% of gardens were home gardens. Very few households were engaged in the production of school gardens – only two in Ingquza Hill and two in Jozini (see Table 11). One household in Ingquza Hill was involved in a community garden. Half of the home gardens in Ingquza Hill were irrigated. Some 19 households in Jozini were involved in community gardens, which drew water for irrigation from the Mjindi Irrigation Scheme at Makhathini. Larger plots (typically over a hectare) were farmed in Jozini (on the irrigation scheme) and mostly under rain-fed conditions in Maruleng. Participants in the focus groups indicated that large-scale and extensive grazing were prevalent in the past (before 1990). Grazing had declined, as had the general wealth of the community. The focus group participants took care to explain that this wealth was not necessarily in terms of money, but people had their own cattle and fields to farm. Participants explained that, in the past, livestock provided milk to make amasi that was fed to children, in particular, but now they buy their amasi.

38
Tab
le 1
1: H
ouse
hol
ds
invo
lved
in c
rop
pro
du
ctio
n a
nd
irri
gati
on
Sca
le o
f pr
oduc
tion
Who
le s
ampl
e In
gquz
a H
ill
Jozi
ni
Mar
ulen
g R
atlo
u
Invo
lved
in
cr
oppi
ng
If
crop
ping
, ir
riga
ting
cr
ops
Invo
lved
in
cr
oppi
ng
If
crop
ping
, ir
riga
ting
cr
ops
Invo
lved
in
cr
oppi
ng
If
crop
ping
, ir
riga
ting
cr
ops
Invo
lved
in
cr
oppi
ng
If
crop
ping
, ir
riga
ting
cr
ops
Invo
lved
in
cr
oppi
ng
If
crop
ping
, ir
riga
ting
cr
ops
Eng
aged
in
crop
pr
oduc
tion
Sam
ple
size
34
9 22
8 68
53
14
1 12
2 67
49
65
4
Yes
24
2 15
0 61
26
12
6 11
3 51
9
4 2
Pro
port
ion
(%)
71.2
65
.8
89.7
49
.1
89.4
92
.6
82.1
18
.4
6.2
50.0
Far
mla
nd
Sam
ple
size
24
2 73
-
- 12
6 62
50
11
-
- Y
es
75
57
- -
64
54
10
3 -
- P
ropo
rtio
n (%
) 31
.1
78.1
-
- 50
.8
87.1
20
.0
27.3
-
-
Hom
e ga
rden
s
Sam
ple
size
24
2 11
2 61
50
12
6 19
51
39
4
4 Y
es
120
53
56
25
20
18
40
8 4
2 P
ropo
rtio
n (%
) 49
.6
47.3
91
.8
50.0
15
.9
94.7
78
.4
20.5
10
0 50
.0
Sch
ool
gard
ens
Sam
ple
size
24
2 4
61
2 12
6 2
- -
- -
Yes
4
3 2
1 2
2 -
- -
- P
ropo
rtio
n (%
) 1.
7 75
3.
3 50
.0
1.6
100
- -
- -
Com
mun
al
gard
ens
Sam
ple
size
24
2 18
61
-
126
18
- -
- -
Yes
20
18
1
- 19
-
- -
- -
Pro
port
ion
(%)
8.3
100
1.6
- 15
.1
100
- -
- -
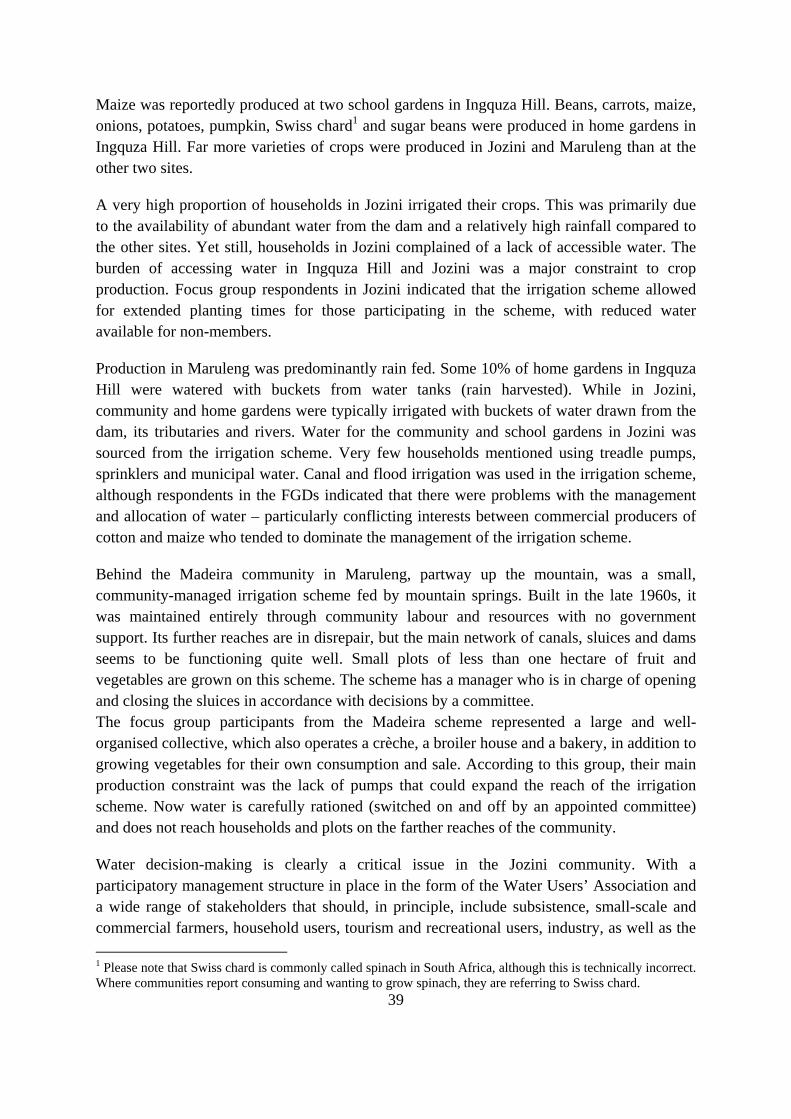
39
Maize was reportedly produced at two school gardens in Ingquza Hill. Beans, carrots, maize, onions, potatoes, pumpkin, Swiss chard1 and sugar beans were produced in home gardens in Ingquza Hill. Far more varieties of crops were produced in Jozini and Maruleng than at the other two sites.
A very high proportion of households in Jozini irrigated their crops. This was primarily due to the availability of abundant water from the dam and a relatively high rainfall compared to the other sites. Yet still, households in Jozini complained of a lack of accessible water. The burden of accessing water in Ingquza Hill and Jozini was a major constraint to crop production. Focus group respondents in Jozini indicated that the irrigation scheme allowed for extended planting times for those participating in the scheme, with reduced water available for non-members.
Production in Maruleng was predominantly rain fed. Some 10% of home gardens in Ingquza Hill were watered with buckets from water tanks (rain harvested). While in Jozini, community and home gardens were typically irrigated with buckets of water drawn from the dam, its tributaries and rivers. Water for the community and school gardens in Jozini was sourced from the irrigation scheme. Very few households mentioned using treadle pumps, sprinklers and municipal water. Canal and flood irrigation was used in the irrigation scheme, although respondents in the FGDs indicated that there were problems with the management and allocation of water – particularly conflicting interests between commercial producers of cotton and maize who tended to dominate the management of the irrigation scheme.
Behind the Madeira community in Maruleng, partway up the mountain, was a small, community-managed irrigation scheme fed by mountain springs. Built in the late 1960s, it was maintained entirely through community labour and resources with no government support. Its further reaches are in disrepair, but the main network of canals, sluices and dams seems to be functioning quite well. Small plots of less than one hectare of fruit and vegetables are grown on this scheme. The scheme has a manager who is in charge of opening and closing the sluices in accordance with decisions by a committee. The focus group participants from the Madeira scheme represented a large and well-organised collective, which also operates a crèche, a broiler house and a bakery, in addition to growing vegetables for their own consumption and sale. According to this group, their main production constraint was the lack of pumps that could expand the reach of the irrigation scheme. Now water is carefully rationed (switched on and off by an appointed committee) and does not reach households and plots on the farther reaches of the community.
Water decision-making is clearly a critical issue in the Jozini community. With a participatory management structure in place in the form of the Water Users’ Association and a wide range of stakeholders that should, in principle, include subsistence, small-scale and commercial farmers, household users, tourism and recreational users, industry, as well as the
1 Please note that Swiss chard is commonly called spinach in South Africa, although this is technically incorrect. Where communities report consuming and wanting to grow spinach, they are referring to Swiss chard.

40
municipality and tribal authorities, the dynamics are likely to be complex. Current decision-making around water does not prioritise nutrition and food security over commercial needs.
There also seem to be differences between communities in the Mopani District with regard to the extent to which they collaborate, for example, working collectively in growing food and sharing and exchanging food. The ‘informally’ irrigated group (further away than the others from the ‘urban’ centre) exhibited a greater knowledge of wild indigenous plants and other wild food sources, extensive knowledge of traditional foods not bought in shops, and a tendency towards more collective work, such as community gardening and a grocery ‘stokvel.’ In this community, it was also suggested that more young people are in fact interested in farming, depending on what their families exposed them to.
The four households with home gardens in Ratlou grew beans, cabbage, green maize and tomatoes. The crops produced in the community, school and home gardens, and on larger plots of farmland, are presented by site in tables 12, 13 and 14.
It should be noted that the maize typically grown by the households surveyed was either consumed as a green vegetable (referred to here as green mealies) or left to dry on the cob for use in traditional dishes for feasts, festivals and traditional ceremonies. The latter is usually ground on a millstone or at communal granaries. Where the term maize is used in this report, it is used to refer to either green mealies or dried maize. The survey did not record production of these two crops separately, but the FGDs indicated that most maize produced in school, home and community gardens is consumed as green mealies. Dried beans refer to red speckled beans that are left in the field to dry on the plant and then harvested.
Table 12: Crops produced in Ingquza Hill School gardens Home gardens Maize Beans
Carrots Maize Onions Potatoes Pumpkin Swiss chard Sugar beans
Focus group participants in all communities reported climate change, which is explained as rainfall arriving earlier or later in the season and general difficulty with predicting weather conditions. They reported that the rain had come so late in some years that the seeds did not germinate. The lack of predictable weather patterns and the late onset of rain is a deterrent to home gardening, but irrigation enables year-round production in cooperative gardens for those who can participate. According to the FGDs, those who do not have access to irrigation are the ones in the community who go hungry.

41
Table 13: Crops produced in Jozini Community
gardens School gardens Home gardens Farmland
Beetroot Amadumbe Bananas Cabbage Carrots Green peppers Maize Onions Potatoes Swiss chard Sugarcane Tomatoes
Beans Cabbage
Bananas Beans Beetroot Cabbage Calabash Dried beans Garlic Green peppers Imifino Lettuce Maize Onions Potatoes Swiss chard Sweet potatoes Tomatoes
Amadumbe Bananas Beans Beetroot Butternut Cabbage Calabash Carrots Cassava Green peppers Imifino Lemons Lettuce Maize
Mango Mealies Naartjies Onions Oranges Potatoes Swiss chard Sugar beans Sugarcane Sweet chillies Sweet potatoes Tomatoes
Table 14: Crops grown in Maruleng
Home gardens Farmland Bambara/njugo bean (ditloo marapo) Bananas Beans Cabbage Cowpeas (dinawa) and leaves (mokopu) Dry beans Green beans Maize Mango Morôtsê (makataan or citrullus lanatus) Millet
Mealies (green maize) Morogo Morula tree Papaya/pawpaw Pumpkin Sorghum Swiss chard Sugar beans Tomatoes Watermelon
Beans Dry beans Leotša Maize Monula Morogo Swiss chard
Tables 15 to 21 illustrate the seasonality of production at each of the seven EAUs and the irrigation scheme in Jozini, as agreed in the FGDs through an exercise using seasonal mapping. Quite distinct patterns of production and availability of production are evident from these tables. The diversity (or lack of it) of produce is also evident. The stark contrast between the scarcity of available produce from production in a drier area in Jozini (Hlakaniphani) and Ratlou demonstrates the necessity of water availability to improve the year-round production of vegetables. Reliance on rain-fed production constrains which crops can be planted (those that do not require lots of water and regular watering) and is a serious constraint to production in the drier months. An important consideration that surfaced in the

42
FGDs was the physical drudgery of collecting water from water sources (if available). Households interviewed in the Jozini and Ingquza Hill sites raised this as an important constraint to production. In Ingquza Hill, some households paid community entrepreneurs to fetch water for their household and production uses with pick-up trucks.

43
Tab
le 1
5: T
he
seas
onal
ity
of p
rod
uct
ion
in I
ngq
uza
Hil
l (fr
om F
GD
s)
Mon
ths
of t
he
year
C
rop
s Ja
nu
ary
Feb
ruar
yM
arch
Ap
ril
May
Ju
ne
July
A
ugu
stS
epte
mb
erO
ctob
erN
ovem
ber
Dec
emb
er
Am
adum
be
Bee
troo
t
Cab
bage
Car
rots
Gre
en
pepp
ers
Let
tuce
Mai
ze
Pot
atoe
s
Sw
eet
pota
toes
Sw
iss
char
d
Tom
atoe
s
P
lant
ing
H
arve
stin
g

44
Tab
le 1
6: T
he
seas
onal
ity
of p
rod
uct
ion
in J
ozin
i (M
angw
enya
FG
Ds)
Mon
ths
of t
he
year
Cro
ps
Jan
uar
y F
ebru
ary
Mar
ch
Ap
ril
May
Jun
e Ju
ly
Au
gust
S
epte
mb
er
Oct
ober
N
ovem
ber
D
ecem
ber
Bee
troo
t
But
tern
ut
Cab
bage
Car
rots
Dry
bea
ns
Gre
en p
eppe
rs
Let
tuce
Mai
ze
Oni
ons
Pot
atoe
s
Sw
iss
char
d
Tom
atoe
s
P
lant
ing
H
arve
stin
g
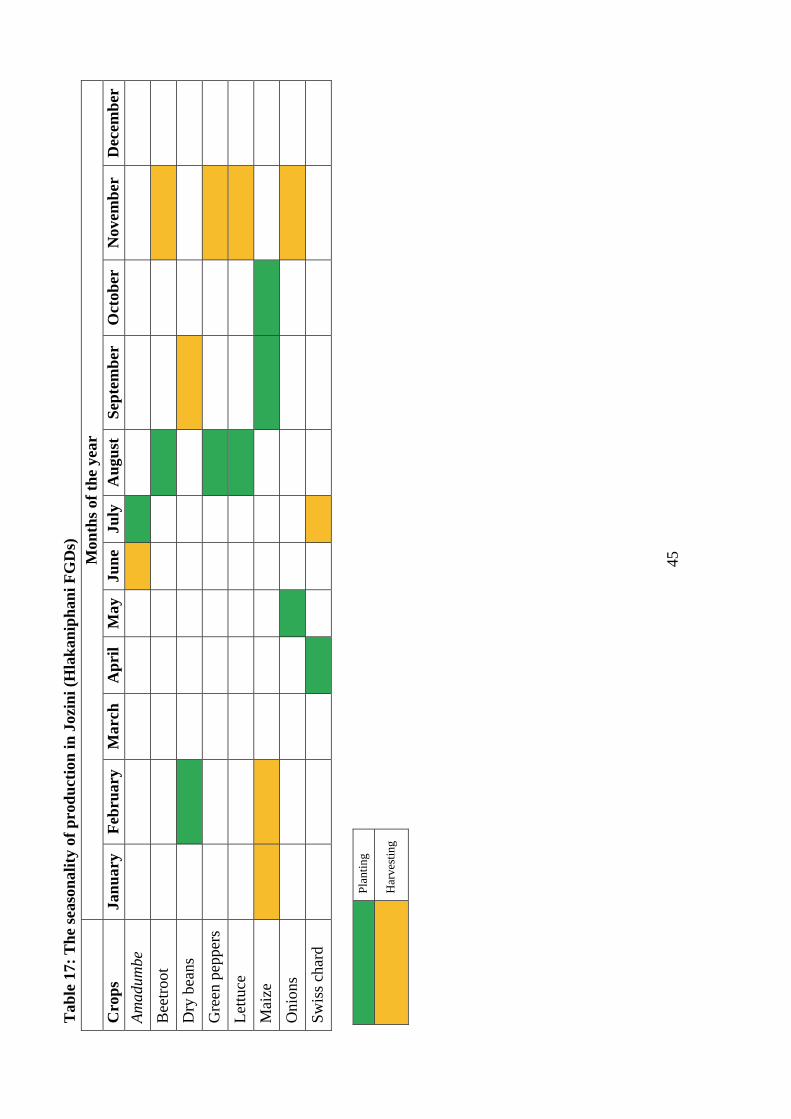
45
Tab
le 1
7: T
he
seas
onal
ity
of p
rod
uct
ion
in J
ozin
i (H
lak
anip
han
i FG
Ds)
M
onth
s of
th
e ye
ar
Cro
ps
Jan
uar
y F
ebru
ary
Mar
ch
Ap
ril
May
Jun
eJu
ly
Au
gust
S
epte
mb
er
Oct
ober
N
ovem
ber
D
ecem
ber
Am
adum
be
Bee
troo
t
Dry
bea
ns
Gre
en p
eppe
rs
Let
tuce
Mai
ze
Oni
ons
Sw
iss
char
d
P
lant
ing
H
arve
stin
g
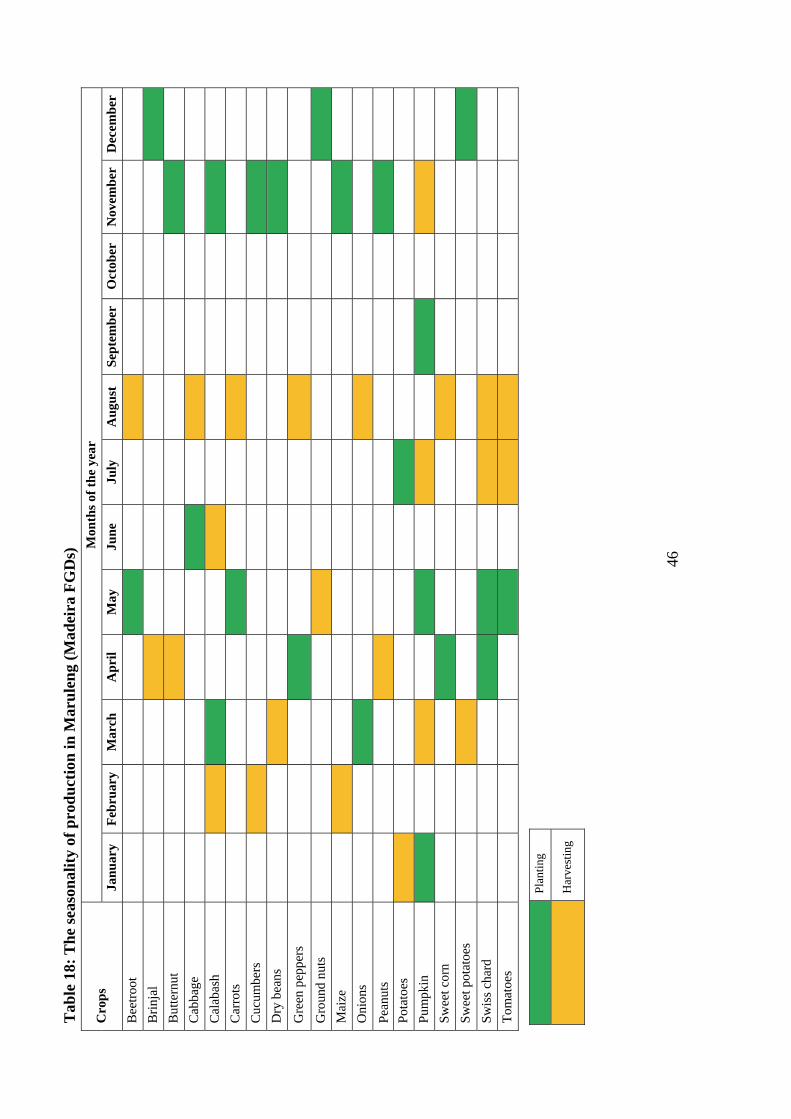
46
Tab
le 1
8: T
he
seas
onal
ity
of p
rod
uct
ion
in M
aru
len
g (M
adei
ra F
GD
s)
Cro
ps
Mon
ths
of t
he
year
Jan
uar
y F
ebru
ary
Mar
ch
Ap
ril
May
Ju
ne
July
A
ugu
st
Sep
tem
ber
O
ctob
er
Nov
emb
er
Dec
emb
er
Bee
troo
t
Bri
njal
But
tern
ut
Cab
bage
Cal
abas
h
Car
rots
Cuc
umbe
rs
Dry
bea
ns
Gre
en p
eppe
rs
Gro
und
nuts
Mai
ze
Oni
ons
Pea
nuts
Pot
atoe
s
Pum
pkin
Sw
eet c
orn
Sw
eet p
otat
oes
Sw
iss
char
d
Tom
atoe
s
P
lant
ing
H
arve
stin
g

47
Tab
le 1
9: T
he
seas
onal
ity
of p
rod
uct
ion
in M
aru
len
g (B
och
abel
o F
GD
s)
Mon
ths
of t
he
year
Cro
ps
Jan
uar
y F
ebru
ary
Mar
ch
Ap
ril
May
Ju
ne
July
A
ugu
st
Sep
tem
ber
O
ctob
er
Nov
emb
er
Dec
emb
er
Bee
troo
t
Bri
njal
Cab
bage
Car
rots
Dry
bea
ns
Gre
en p
eppe
rs
Mai
ze
Oni
ons
Pea
nuts
Pum
pkin
Sw
eet p
otat
oes
Sw
iss
char
d
Tom
atoe
s
Wat
er m
elon
P
lant
ing
H
arve
stin
g

48
Tab
le 2
0: T
he
seas
onal
ity
of p
rod
uct
ion
in R
atlo
u (
Ph
itsh
ane
FG
Ds)
M
onth
s of
th
e ye
ar
Cro
ps
Jan
uar
yF
ebru
ary
Mar
chA
pri
l M
ay
Jun
e Ju
ly
Au
gust
S
epte
mb
erO
ctob
erN
ovem
ber
Dec
emb
er
Dry
be
ans
Mai
ze
Pea
nuts
P
umpk
in
Sor
ghum
W
ater
m
elon
T
able
21:
Th
e se
ason
alit
y of
pro
du
ctio
n in
Rat
lou
(M
adib
ogo
FG
Ds)
M
onth
s of
th
e ye
ar
Cro
ps
Jan
uar
y F
ebru
ary
Mar
chA
pri
l M
ay
Jun
e Ju
ly
Au
gust
Sep
tem
ber
Oct
ober
Nov
emb
erD
ecem
ber
S
wis
s ch
ard
Mai
ze
Pum
pkin
Dry
bea
ns
Oni
ons
P
lant
ing
H
arve
stin
g

49
Some 60% of households that engaged in farmland crop production in Ingquza Hill and Jozini had sold produce in the year prior to the survey. Just over half (54%) of the households that engaged in larger-scale crop production in Maruleng had sold produce in the same period. Almost half of the households that engaged in community garden production in Jozini had sold produce. Four to five times as many households engaged in home crop production in Jozini (45%) had sold produce in the previous year. Households were asked what they would like to produce and what they do not currently produce. Table 22 presents a list of the responses. The list shows considerable interest in producing a wider variety of crops. Respondents were asked whether they had experienced crop failure and why. The reasons given varied, but could mostly be divided into three general categories:
• Inadequate water, rainfall or availability of water for irrigation
• Pests, diseases and crop damage
• Soil conditions or a lack of fertilizer
Where water access was the main constraint to production, the respondents cited drought, low rainfall and scarcity of water for irrigation, irrigation in disrepair or simply no water as reasons. Domestic livestock, such as goats, pigs, cattle, donkeys and chickens, caused crop damage by eating the seeds and plants because gardens and fields were not fenced. More often, respondents mentioned ants and other insects, plant diseases or rats and monkeys eating the crops as reasons for failure. Where the soil condition was the reason for failure, the respondents explained that there was a shortage of manure or fertilizer, or the soil “had no nutrients”. Three respondents claimed that ‘certified seeds’ were the reason for crop failure. Others claimed that there was too much water and poor drainage, while several others could not explain why their crops had failed.

50
Table 22: What households would like to produce and are not currently producing Jozini Ingquza Hill Mopani Ratlou Garden type
Hom
e
Com
mu
nit
y
Sch
ool
Far
mla
nd
Hom
e
Com
mu
nit
y
Sch
ool
Far
mla
nd
Hom
e
Com
mu
nit
y
Sch
ool
Far
mla
nd
Hom
e
Com
mu
nit
y
Sch
ool
Far
mla
nd
Amadumbe X Apples X x Avocados X x x x Bananas x x x Beans X x x x x Beetroot X x x x x x Brinjal X Butternut x x x x Cabbage X x x x x Calabash X Carrots X x x x x x Dried beans x Green peppers
X x x
Guava x Imifino/ Morogo
X
Lettuce X x x Maize X x x x Mangoes X x Naartjie x Onions X x x x Oranges X x x Papaya x Peaches x Peas x Potatoes X x x x Pumpkin x Rice Spinach X x x x x Sugarcane X x x Sunflower x Tomatoes X x x x x
51
CHAPTER 6: CURRENT CONSUMPTION PATTERNS
6.1 Food Procurement
Most food was purchased. However, white roots and tubers, orange-fleshed vegetables, dark green leafy vegetables, orange-coloured and other fruit were sourced from gardens by 20%, 29%, 45%, 25.6%, 34% and 24% of respondents respectively in summer. A lower proportion of food was sourced from gardens in winter (see Table 23). Except for green leafy vegetables, almost half of the households sourced white roots and tubers, orange-fleshed vegetables, dark green leafy vegetables and orange-coloured fruit from their gardens in winter as opposed to summer. Dark green leafy vegetables were the exception, with 33% of households sourcing these foods from their gardens in winter (a 26% reduction). Receiving food from in-kind payments, donations, food banks, school feeding programmes, social events such as funerals and as gifts from others (such as neighbours) was common, but not dominant at the investigated sites. Households reported that they called upon their neighbours in times of stress. They reported that school feeding programmes and ECD centres were important sources of meals for children.
6.2 Frequency of Consumption
The number of meals consumed per day by adults and children is presented in tables 24 and 25 respectively. The survey data showed that adults generally ate three meals a day (see Table 24). On average, children ate four meals a day. The average number of meals per day seemed higher for children in crop-producing households than for children in non-crop-producing households (see Table 25). Detailed information was obtained on the meal patterns and composition during the FGDs at each site. The details of these discussions are presented in the next chapter, complementing the quantitative analysis.

52
Tab
le 2
3: F
ood
pro
cure
men
t so
urc
e
Sou
rce
of f
ood
Sea
son
Cer
eals
W
hite
roo
ts
and
tube
rs
Ora
nge-
fles
hed
vege
tabl
es
Dar
k gr
een
leaf
y ve
geta
bles
Oth
er
vege
tabl
es
Ora
nge-
colo
ured
fru
it
Oth
er f
ruit
Number
Proportion (%)
Number
Proportion (%)
Number
Proportion (%)
Number
Proportion (%)
Number
Proportion (%)
Number
Proportion (%)
Number
Proportion (%)
Sam
ple
size
S
umm
er
119
11
2
110
11
5
116
12
1
113
Win
ter
220
22
1
206
22
2
223
20
6
213
Bou
ght
Sum
mer
11
2 94
.1
89
79.5
75
68
.2
56
28.7
82
70
.7
81
72.7
82
72
.6
Win
ter
218
99.1
19
2 86
.9
163
79.1
13
0 58
.6
189
84.8
16
1 78
.2
189
88.7
In k
ind/
do
nate
d*
Sum
mer
-
- 1
0.8
4 1.
8 5
4.1
3 2.
5 3
2.7
4 3.
5
Win
ter
1 0.
4 4
1.8
7 3.
4 18
8.
1 5
2.2
3 1.
5 6
2.5
Pro
duce
d (e
.g.
from
ow
n ga
rden
)
Sum
mer
7
5.9
22
19.6
32
29
.1
54
44.6
31
25
.6
25
22.7
27
23
.9
Win
ter
1 0.
4 19
8.
6 32
15
.5
73
32.9
29
13
.0
21
10.2
19
8.
9
Not
app
lica
ble
(foo
d no
t eat
en)
Sum
mer
-
- -
- 1
0.8
- -
- -
1 0.
8 -
-
Win
ter
- -
6 2.
7 4
1.9
1 0.
4 -
- 21
10
.2
- -
* F
ood
rece
ived
fro
m i
n-ki
nd p
aym
ents
, do
nati
ons,
foo
d ba
nks,
sch
ool
feed
ing
prog
ram
mes
, so
cial
eve
nts
such
as
fune
rals
and
as
gift
s fr
om o
ther
s (s
uch
as
neig
hbou
rs)

53
Table 24: Number of meals eaten by adults per day
Sample Sample
size Minimum Maximum Mean Standard deviation Total sample 342 1 6 2.65 0.662Ingquza Hill 68 1 4 2.68 0.531Jozini 143 1 5 2.54 0.690Maruleng 67 2 4 2.72 0.517Ratlou 64 1 6 2.81 0.814Crop-producing households
241 1 5 2.65 0.608
Non-crop-producing households
95 1 6 2.66 0.794
Irrigating households
150 1 5 2.63 0.628
Table 25: Number of meals eaten by children per day
Sample Sample
size Minimum Maximum Mean Standard deviation
Total sample 340 1 7 3.78 1.047Ingquza Hill 68 2 6 3.97 0.992Jozini 141 1 6 3.60 1.014Maruleng 67 2 5 3.54 0.098Ratlou 64 1 7 4.27 1.212Crop-producing households
240 1 6 3.74 0.982
Non-crop-producing households
94 1 7 3.91 1.197
Irrigating households 148 1 6 3.72 1.022
6.3 Experience of Hunger
Although self-reported experiences of hunger have their limitations, the responses to questions of whether household members had experienced hunger during the year prior to the survey revealed that close to half of all the households had experienced hunger in the last year, having to compromise food consumption and diet quality to make ends meet (see Table 26). The highest proportion of reported hunger (65%) was for January when children returned to school, when school fees had to be paid and uniforms had to be bought (see Figure 4). This period also follows the ‘festive season’.

54
Table 26: Months of adequate food access Months Number (n = 328) Proportion of households (%) January 114 34.8 February 162 49.4 March 177 54.0 April 184 56.1 May 187 57.0 June 177 54.0 July 182 55.5 August 190 57.9 September 185 56.4 October 174 53.0 November 186 56.7 December 187 57.0
Figure 4: Proportion of households experiencing hunger
65.2
50.6
46
43.9
43
46
44.5
42.1
43.6
47
43.3
43
0 10 20 30 40 50 60 70
January
February
March
April
May
June
July
August
September
October
November
December
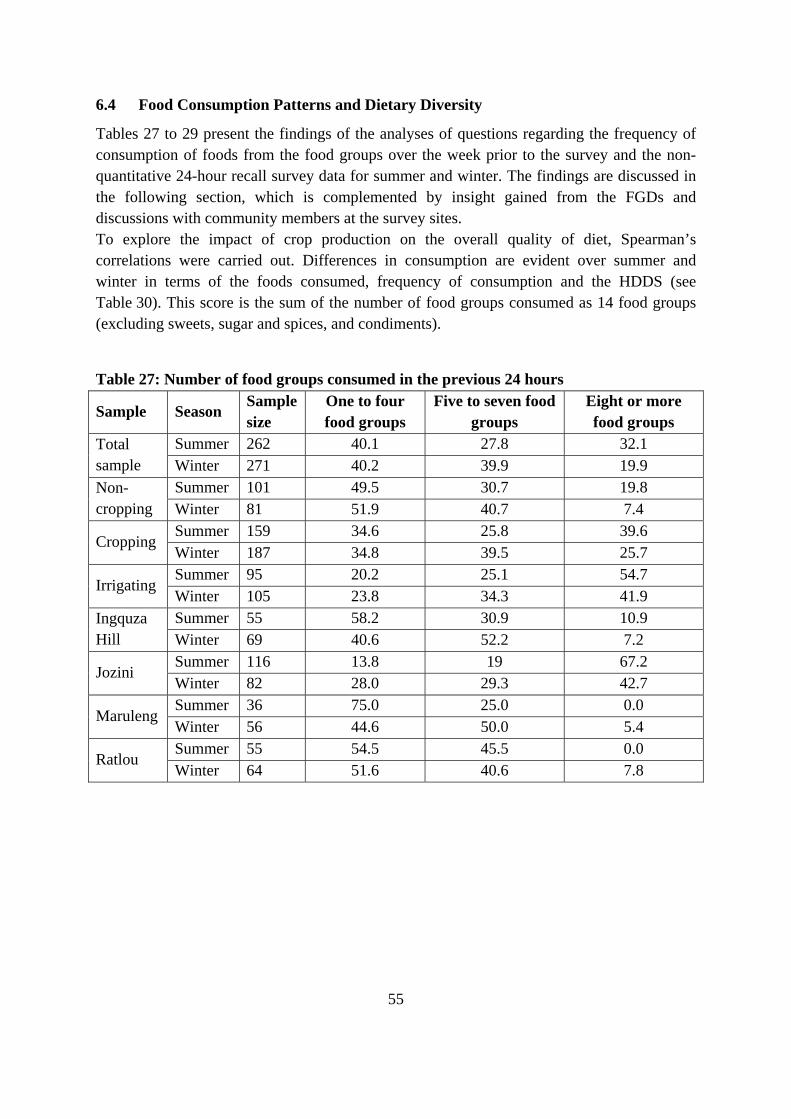
55
6.4 Food Consumption Patterns and Dietary Diversity
Tables 27 to 29 present the findings of the analyses of questions regarding the frequency of consumption of foods from the food groups over the week prior to the survey and the non-quantitative 24-hour recall survey data for summer and winter. The findings are discussed in the following section, which is complemented by insight gained from the FGDs and discussions with community members at the survey sites. To explore the impact of crop production on the overall quality of diet, Spearman’s correlations were carried out. Differences in consumption are evident over summer and winter in terms of the foods consumed, frequency of consumption and the HDDS (see Table 30). This score is the sum of the number of food groups consumed as 14 food groups (excluding sweets, sugar and spices, and condiments).
Table 27: Number of food groups consumed in the previous 24 hours
Sample Season Sample size
One to four food groups
Five to seven food groups
Eight or more food groups
Total sample
Summer 262 40.1 27.8 32.1 Winter 271 40.2 39.9 19.9
Non-cropping
Summer 101 49.5 30.7 19.8 Winter 81 51.9 40.7 7.4
Cropping Summer 159 34.6 25.8 39.6 Winter 187 34.8 39.5 25.7
Irrigating Summer 95 20.2 25.1 54.7 Winter 105 23.8 34.3 41.9
Ingquza Hill
Summer 55 58.2 30.9 10.9 Winter 69 40.6 52.2 7.2
Jozini Summer 116 13.8 19 67.2 Winter 82 28.0 29.3 42.7
Maruleng Summer 36 75.0 25.0 0.0 Winter 56 44.6 50.0 5.4
Ratlou Summer 55 54.5 45.5 0.0 Winter 64 51.6 40.6 7.8

56
Table 28: Frequency of consumption of food groups in the previous seven days
Food group Season Sample
size Minimum Maximum Mean
Standard error
Standard deviation
Cereals Summer 257 0 7 5.37 0.13 2.027Winter 266 1 7 6.32 0.08 1.294
White roots and tubers
Summer 204 0 7 2.14 0.13 1.833Winter 261 0 7 2.32 0.11 1.757
Orange-fleshed vegetables
Summer 151 0 7 1.34 0.15 1.785Winter 249 0 7 1.62 0.10 1.615
Dark green leafy vegetables
Summer 184 0 7 2.39 0.14 1.864
Winter 266 0 7 2.05 0.09 1.542
Other vegetables
Summer 218 0 7 4.61 0.15 2.183Winter 272 0 7 4.67 0.13 2.167
Orange-coloured vegetables
Summer 151 0 6 1.03 0.13 1.579
Winter 234 0 7 1.01 0.10 1.479
Other fruit Summer 172 0 7 1.96 0.16 2.056Winter 250 0 7 2.08 0.13 1.977
Organ meat Summer 148 0 7 1.12 0.12 1.493Winter 242 0 7 1.26 0.10 1.486
Meat Summer 190 0 7 2.27 0.14 1.905Winter 271 0 7 2.44 0.11 1.828
Eggs Summer 159 0 7 1.59 0.16 2.032Winter 248 0 7 1.76 0.12 1.901
Fish and sea food
Summer 163 0 7 1.63 0.12 1.540Winter 256 0 7 1.60 0.08 1.319
Dried foods Summer 161 0 7 1.92 0.16 2.009Winter 260 0 7 1.62 0.09 1.405
Milk Summer 190 0 7 2.79 0.18 2.444Winter 257 0 7 3.73 0.16 2.536
Sweets and sugars
Summer 184 0 7 4.22 0.19 2.563Winter 256 0 7 5.68 0.12 1.895
Oils and fats Summer 255 0 7 5.53 0.12 1.869Winter 275 0 7 5.95 0.09 1.504

57
Tab
le 2
9: F
ood
gro
up
con
sum
pti
on c
omp
aris
on a
mon
g si
tes
from
th
e 24
-hou
r re
call
Foo
d g
rou
p
Sea
son
T
otal
sam
ple
In
gqu
za H
ill
Jozi
ni
Mar
ule
ng
Rat
lou
N
um
ber
P
rop
orti
on
Nu
mb
er
Pro
por
tion
N
um
ber
P
rop
orti
on
Nu
mb
er
Pro
por
tion
N
um
ber
P
rop
orti
on
Sam
ple
size
S
umm
er
264
55
116
36
69
W
inte
r 27
9
69
84
60
66
Cer
eals
S
umm
er
255
96.2
55
10
0 11
0 94
.8
36
100
54 (
of 5
8)
93.1
W
inte
r 27
3 97
.5
69
98.6
78
92
.9
60
100
66
100
Whi
te r
oots
and
tu
bers
S
umm
er
125
(of
265)
47
.2
24
43.6
79
68
.1
2 5.
6 20
(of
58)
34
.5
Win
ter
113
40.4
30
42
.9
45
53.6
8
13.3
30
45
.5
Ora
nge-
fles
hed
vege
tabl
es
Sum
mer
83
31
.6
12
21.8
67
56
.8
1 2.
8 3
(of
56)
5.4
Win
ter
57
20.4
17
24
.3
23
27.4
2
3.3
15
22.7
D
ark
gree
n le
afy
vege
tabl
es
Sum
mer
13
2 50
.2
16
29.1
92
79
.3
11
30.6
13
(of
56)
23
.2
Win
ter
93
33.2
10
14
.5
50
59.5
18
30
.0
15
22.7
O
ther
veg
etab
les
Sum
mer
19
6 74
.2
31
56.4
11
0 94
.8
32
88.9
23
(of
57)
40
.4
Win
ter
180
of 2
74)
65.7
42
60
.9
73 (
of 8
3)
88.0
43
(of
56)
76
.8
22
33.3
O
rang
e-co
lour
ed
frui
t S
umm
er
72
27.3
3
5.5
63
54.3
1
2.8
5 (o
f 57
) 8.
8 W
inte
r 35
(of
277
) 12
.6
4 5.
7 20
(of
83)
24
.1
8 (o
f 59
) 13
.6
3 4.
5 O
ther
fru
it
Sum
mer
10
0 37
.9
11
20.0
85
73
.3
1 2.
8 3
(of
57)
5.3
Win
ter
69
24.7
17
24
.3
32
38.1
13
21
.7
7 10
.6
Org
an m
eat
Sum
mer
79
(of
263
) 30
.0
0 0.
0 70
60
.3
3 8.
3 6
(of
56)
10.7
W
inte
r 32
(of
278
) 11
.5
17
24.3
12
14
.3
5 8.
3 11
16
.9
Mea
t S
umm
er
140
53.0
16
29
.1
90
77.6
11
30
.6
23 (
of 5
7)
40.4
W
inte
r 14
4 51
.6
4 5.
7 48
57
.1
31
51.7
40
60
.6
Egg
s S
umm
er
76
28.8
4
7.3
66
56.9
3
8.3
3 (o
f 57
) 5.
3 W
inte
r 39
13
.9
6 8.
6 25
29
.8
5 8.
3 3
4.5
Fis
h an
d se
afoo
d S
umm
er
98 (
of 2
63)
37.3
4
7.3
73
62.9
14
38
.9
7 (o
f 56
) 12
.5
Win
ter
65
23.4
10
14
.3
44
52.4
5
8.3
6 9.
2 D
ried
bea
ns a
nd
legu
mes
S
umm
er
96
36.4
9
16.4
83
71
.6
2 5.
6 2
(of
57)
3.5
Win
ter
79
28.2
22
31
.9
47
56.0
9
15.0
1
1.5
Mil
k an
d m
ilk
prod
ucts
S
umm
er
136
51.1
16
29
.1
81
69.8
5
13.9
34
59
.6
Win
ter
124
44.4
32
46
.4
33
39.3
29
48
.3
30
45.5
O
ils
and
fats
S
umm
er
238
(of
265)
89
.9
54
98.2
10
9 94
.0
24
66.7
51
87
.9
Win
ter
243
87.1
61
98
.6
76
90.5
46
76
.7
60
90.9

58
Table 30: The Household Dietary Diversity Scores from the 24-hour recall
Site Season Sample
size Minimum Maximum Mean
Standard error
Standard deviation
Total sample
Summer 159 2 14 7.4 0.327 4.122 Winter 187 1 14 6.0 0.221 3.021
Ingquza Hill
Summer 55 2 12 4.6 0.289 2.146 Winter 69 2 10 5.0 0.245 2.036
Jozini Summer 116 2 14 10.2 0.378 4.070 Winter 82 2 14 7.3 0.401 3.629
Maruleng Summer 36 3 7 4.1 0.164 0.984 Winter 56 2 8 4.8 0.208 1.558
Ratlou Summer 55 1 7 4.2 0.174 1.290 Winter 64 1 9 4.7 0.215 1.719
Non-cropping
Summer 101 1 14 6.0 0.399 4.014 Winter 81 2 9 4.7 0.178 1.603
Cropping Summer 159 2 14 7.4 0.327 4.122 Winter 187 1 14 6.0 0.221 3.021
Irrigating Summer 95 2 14 8.9 0.421 4.099 Winter 105 2 14 7.2 0.325 3.331
The results show that the majority of households consumed foods from only four to eight food groups. Of concern is that only 32% of the households surveyed had consumed food from eight or more food groups in the previous day in summer, while 20% of the households had consumed food from these food groups in the previous day in winter (Table 27).

59
Tab
le 3
1: C
orre
lati
ons
for
food
gro
up
con
sum
pti
on
Foo
d g
rou
p
Wh
ite
root
s an
d
tub
ers
O
ran
ge-f
lesh
ed
vege
tab
les
Dar
k g
reen
leaf
y ve
geta
ble
s O
ther
ve
geta
ble
s O
ran
ge-c
olou
red
fr
uit
O
ther
fru
it
Su
mm
er
Win
ter
Su
mm
erW
inte
r S
um
mer
Win
ter
S
um
mer
Win
ter
Su
mm
erW
inte
r S
um
mer
Win
ter
C
erea
ls
Cor
rela
tion
co
effi
cien
t 0.
147*
-.10
1.0
92.0
24.0
01-.
178**
.0
19-.
068
.077
.061
.032
-.12
1*
Sig
nifi
canc
e (t
wo-
tail
ed)
0.
016
.090
.136
.684
.990
.003
.7
56.2
60.2
13.3
10.6
02.0
44
Sam
ple
size
26
5 28
026
327
926
327
9 26
427
426
427
726
427
9 W
hite
ro
ots
and
tube
rs
Cor
rela
tion
co
effi
cien
t 1.
000
1.00
0.5
22**
.329
**.2
71**
.196
**
.190
**.1
32*
.429
**.1
29*
.407
**.2
59**
Sig
nifi
canc
e (t
wo-
tail
ed)
. .
.000
.000
.000
.001
.0
02.0
29.0
00.0
31.0
00.0
00
Sam
ple
size
26
5 28
026
327
926
327
9 26
427
426
427
726
427
9 O
rang
e-fl
eshe
d ve
geta
bles
Cor
rela
tion
co
effi
cien
t 0.
522**
.3
29**
1.00
01.
000
.464
**.1
13
.266
**.0
86.7
21**
.317
**.6
48**
.328
**
Sig
nifi
canc
e (t
wo-
tail
ed)
0.00
0 .0
00.
..0
00.0
59
.000
.154
.000
.000
.000
.000
Sam
ple
size
26
3 27
926
327
926
327
9 26
327
426
327
726
327
9
Dar
k gr
een
leaf
y ve
geta
bles
Cor
rela
tion
co
effi
cien
t 0.
271**
.1
96**
.464
**.1
131.
000
1.00
0 .2
20**
.080
.475
**.2
39**
.514
**.1
94**
Sig
nifi
canc
e (t
wo-
tail
ed)
0.00
0 .0
01.0
00.0
59.
. .0
00.1
88.0
00.0
00.0
00.0
01
Sam
ple
size
26
3 27
926
327
926
327
9 26
327
426
327
726
327
9 O
ther
ve
geta
bles
C
orre
lati
on
coef
fici
ent
0.19
0**
.132
*.2
66**
.086
.220
**.0
80
1.00
01.
000
.205
**.1
10.3
17**
.278
**

60
Foo
d g
rou
p
Wh
ite
root
s an
d
tub
ers
O
ran
ge-f
lesh
ed
vege
tab
les
Dar
k g
reen
leaf
y ve
geta
ble
s O
ther
ve
geta
ble
s O
ran
ge-c
olou
red
fr
uit
O
ther
fru
it
Su
mm
er
Win
ter
Su
mm
erW
inte
r S
um
mer
Win
ter
S
um
mer
Win
ter
Su
mm
erW
inte
r S
um
mer
Win
ter
S
igni
fica
nce
(tw
o-ta
iled
) 0.
002
.029
.000
.154
.000
.188
.
..0
01.0
70.0
00.0
00
Sam
ple
size
26
4 27
426
327
426
327
4 26
427
426
427
326
427
4
Ora
nge-
colo
ured
fr
uit
Cor
rela
tion
co
effi
cien
t 0.
429**
.1
29*
.721
**.3
17**
.475
**.2
39**
.2
05**
.110
1.00
01.
000
.661
**.3
59**
Sig
nifi
canc
e (t
wo-
tail
ed)
0.00
0 .0
31
0.00
0 0.
000
0.00
0 0.
000
0.00
1 0.
070
. .
0.00
0 0.
000
Sam
ple
size
26
4 27
7 26
3 27
7 26
3 27
7 26
4 27
3 26
4 27
7 26
4 27
7
Oth
er f
ruit
Cor
rela
tion
co
effi
cien
t 0.
407**
0.
259**
0.64
8**
0.32
8**
0.51
4**
0.19
4**
0.31
7**
0.27
8**0.
661**
0.
359**
1.
000
1.00
0
Sig
nifi
canc
e (t
wo-
tail
ed)
0.00
0 0.
000
0.00
0 0.
000
0.00
0 0.
000
0.00
0 0.
000
0.00
0 0.
000
. .
Sam
ple
size
26
4 27
9 26
3 27
9 26
3 27
9 26
4 27
4 26
4 27
7 26
4 27
9 O
rgan
m
eats
C
orre
lati
on
coef
fici
ent
0.41
1**
0.11
7 0.
661**
0.
068
0.52
4**
0.07
9 0.
311**
-0
.011
0.71
4**
0.03
2 0.
580**
0.
054
Sig
nifi
canc
e (t
wo-
tail
ed)
0.00
0 0.
051
0.00
0 0.
258
0.00
0 0.
191
0.00
0 0.
860
0.00
0 0.
596
0.00
0 0.
373
Sam
ple
size
26
3 27
8 26
2 27
8 26
2 27
8 26
3 27
3 26
3 27
6 26
3 27
8 M
eat
Cor
rela
tion
co
effi
cien
t 0.
323**
0.
222**
0.51
0**
0.27
7**
0.30
8**
0.10
7 0.
192**
0.
176**
0.47
4**
0.27
8**
0.50
0**
0.37
2**
Sig
nifi
canc
e (t
wo-
tail
ed)
0.00
0 .0
00
.000
.0
00
.000
0.
076
0.00
2 0.
004
0.00
0 0.
000
0.00
0 0.
000
Sam
ple
size
26
4 27
9 26
3 27
9 26
3 27
9 26
4 27
4 26
4 27
7 26
4 27
9

61
Foo
d g
rou
p
Wh
ite
root
s an
d
tub
ers
O
ran
ge-f
lesh
ed
vege
tab
les
Dar
k g
reen
leaf
y ve
geta
ble
s O
ther
ve
geta
ble
s O
ran
ge-c
olou
red
fr
uit
O
ther
fru
it
Su
mm
er
Win
ter
Su
mm
erW
inte
r S
um
mer
Win
ter
S
um
mer
Win
ter
Su
mm
erW
inte
r S
um
mer
Win
ter
E
ggs
Cor
rela
tion
co
effi
cien
t 0.
407**
0.
345**
0.66
8**
0.38
5**
0.46
7**
0.26
3**
0.27
9**
0.20
6**0.
681**
0.
440**
0.
607**
0.
512**
Sig
nifi
canc
e (t
wo-
tail
ed)
0.00
0 0.
000
0.00
0 0.
000
0.00
0 0.
000
0.00
0 0.
000
0.00
0 0.
000
0.00
0 0.
000
Sam
ple
size
26
4 27
9 26
3 27
9 26
3 27
9 26
4 27
4 26
4 27
7 26
4 27
9 F
ish
and
seaf
ood
Cor
rela
tion
co
effi
cien
t 0.
312**
0.
222**
0.50
8**
0.22
5**
0.34
7**
0.29
3**
0.34
7**
0.28
8**0.
532**
0.
290**
0.
514**
0.
259**
Sig
nifi
canc
e (T
wo-
tail
ed)
0.00
0 0.
000
0.00
0 0.
000
0.00
0 0.
000
0.00
0 0.
000
0.00
0 0.
000
0.00
0 0.
000
Sam
ple
size
26
3 27
8 26
2 27
8 26
2 27
8 26
3 27
3 26
3 27
6 26
3 27
8 D
ry f
oods
C
orre
lati
on
coef
fici
ent
0.40
9**
0.11
8* 0.
624**
0.
175**
0.
566**
0.
231**
0.
283**
0.
132*
0.63
3**
0.26
9**
0.61
1**
0.21
1**
Sig
nifi
canc
e (T
wo-
tail
ed)
0.00
0 0.
048
0.00
0 .0
03
0.00
0 0.
000
0.00
0 0.
029
0.00
0 0.
000
0.00
0 0.
000
Sam
ple
size
26
4 27
9 26
3 27
9 26
3 27
9 26
4 27
4 26
4 27
7 26
4 27
9 M
ilk
and
mil
k pr
oduc
ts
Cor
rela
tion
co
effi
cien
t 0.
260**
0.
136*
0.48
1**
0.24
4**
0.21
7**
0.10
2 0.
105
0.12
1*0.
475**
0.
226**
0.
367**
0.
290**
Sig
nifi
canc
e (T
wo-
tail
ed)
0.00
0 0.
023
0.00
0 0.
000
0.00
0 0.
089
0.09
0 0.
045
0.00
0 0.
000
0.00
0 0.
000
Sam
ple
size
26
4 27
926
327
926
327
9 26
427
426
427
726
427
9 O
ils
and
fats
C
orre
lati
on
coef
fici
ent
0.24
3**
0.22
8**0.
230**
0.03
60.
089
0.00
0 0.
087
0.32
2**0.
207**
-0.0
150.
212**
0.04
7

62
Foo
d g
rou
p
Wh
ite
root
s an
d
tub
ers
O
ran
ge-f
lesh
ed
vege
tab
les
Dar
k g
reen
leaf
y ve
geta
ble
s O
ther
ve
geta
ble
s O
ran
ge-c
olou
red
fr
uit
O
ther
fru
it
Su
mm
er
Win
ter
Su
mm
erW
inte
r S
um
mer
Win
ter
S
um
mer
Win
ter
Su
mm
erW
inte
r S
um
mer
Win
ter
S
igni
fica
nce
(Tw
o-ta
iled
) 0.
000
0.00
00.
000
0.55
00.
150
1.00
0 0.
158
0.00
00.
001
0.80
90.
001
0.43
3
Sam
ple
size
26
5 27
926
327
926
327
9 26
427
426
427
726
427
9 H
DD
S
Cor
rela
tion
co
effi
cien
t 0.
577**
0.
537**
0.76
1**0.
465**
0.56
7**0.
403**
0.
478**
0.53
0**0.
716**
0.40
3**0.
755**
0.59
2**
Sig
nifi
canc
e (T
wo-
tail
ed)
0.00
0 0.
000
0.00
00.
000
0.00
00.
000
0.00
00.
000
0.00
00.
000
0.00
00.
000
Sam
ple
size
26
2 27
126
227
126
227
1 26
227
126
227
126
227
1 *
Cor
rela
tion
is s
igni
fica
nt a
t the
0.0
5 le
vel (
two-
tail
ed).
**
Cor
rela
tion
is s
igni
fica
nt a
t the
0.0
1 le
vel (
two-
tail
ed).

63
6.5 Food Consumption Patterns in Ingquza Hill
6.5.1 Meal patterns and composition
From the FGDs during the first round of data collection in October 2013, it was understood that adults generally consumed two meals on weekdays. Adults reported that they had their first meal of the day at home before they went out to attend to their fields or work at the community garden. For the majority of households, this meal consisted of black tea and bread (either homemade steamed bread or commercial brown bread). Some indicated that they ate either soft cooked porridge (isidudu) or leftover stiff maize meal porridge (phaleshi) and relish from the previous day’s evening meal. During the day, when working in the fields, they drank amahewu (fermented maize meal beverage), although juice or tea was also taken by some. The participants from the Masikhule community focus group prepared steamed bread at a community garden site, which they ate when they were hungry during the day. The evening meal was regarded as the main meal of the day. This consisted of either stiff papa or phaleshi (maize meal porridge), rice or samp served with either a cabbage or ‘spinach’ (actually Swiss chard) relish. This meal usually consists of only two dishes. Meat is scarce and, according to the participants in the focus groups, is only eaten once a month when money from social grants becomes available. This also applies to fruit (apples, oranges or bananas), which is only purchased when the household has money. The participants from the Mdakani Project, with whom a FGD was held during the second round of data collection in August 2014, revealed that they ate three meals a day. Similarly, breakfast consisted of bread and tea. The second meal of the day (lunch) consisted of rice, phutu (a grainy type of maize porridge) or papa, eaten with soup and potatoes. Supper consisted of papa and meat. When available, fruit was eaten in the mid-morning. The survey results also indicated that most adults consumed either two or three meals a day in summer. In winter, the majority of adults had three meals a day. On Saturday and Sunday, the pattern seemed to be three meals a day, when a midday meal with a similar composition as the evening meal was included. On weekdays, schoolchildren were served a meal prepared at both primary and high schools during the mid-morning break. In the FGDs at Lambase, it was reported that schoolchildren take lunchboxes to school (mostly leftover food from the previous day’s evening meal), but in the Masikhule area, children receive 50 cents or R1a day to spend on snacks sold by vendors at the school gate. Schoolchildren in this area ate three meals at home during the day and one meal at school. Food preparation in the household is the responsibility of the women during weekdays. Over weekends, this task also involves the children. It was reported in the FGDs that, in most households, both boys and girls learn to cook. Although electricity is available, it is seldom used for food preparation as it is too expensive, especially for dishes that take a long time to cook, for example, samp and steamed bread. Therefore, firewood is collected and a fire is made on the floor of the cooking hut, where the household’s food will be cooked and eaten.

64
The meals were largely starch-based. Just over half of the respondents had eaten rice for at least one meal in the previous 24 hours. Traditional food items form a substantial part of the food consumption pattern in this area. The following food items and dishes were mentioned in the FGDs and listed in the non-quantitative 24-hour recall data: phutu, isidudu, paleshi, amahewu, samp, steamed bread, iscamba (also known as ‘green porridge’ made from green leafy vegetables cooked and mixed with maize meal to form porridge), nghushu (samp and beans ), and amasi. All households consumed food from the cereal group in summer, with 99% reporting doing so in winter (see Table 29). The majority of households consumed foods from the oils and fats group during both summer (98%) and winter (99%). In summer, 56% of households included other vegetables (mostly tomatoes, onions, green peppers and wild/indigenous vegetables) in their meals, while 61% did so in winter (see Table 29). Households also consumed white roots and tubers (44% in summer and 43% in winter), dark green leafy vegetables (29% in summer and 15% in winter) and orange-fleshed vegetables (22% in summer and 24% in winter). However, these were not consumed every day or in large quantities. From the FGDs, it was established that these vegetables were mainly used in the preparation of the vegetable relishes that were served with the cereal-based dishes (stiff maize meal porridge, samp and rice). According to the focus group participants, meat is not consumed daily. Meat was consumed by 29% in summer and 6% in winter, and the milk food group was consumed by 29% in summer and 46% in winter. The same applies to the fruit group, with slightly more being consumed in winter than in summer. Foods from the dried bean group were included in meals by 16% of households in summer and 32% in winter. The results show that only three foods groups (cereals, other vegetables, oils and fats) were consumed by more than half of the households in summer, followed by roughly one in three households that included foods from the white roots and tubers, dark green vegetables, and meat and milk products groups in summer. In winter, the consumption of cereals, and oils and fats remained consistent, but the consumption of dark green leafy vegetables and meat dropped considerably. The consumption of dried legumes and milk increased in winter. The average HDDS for summer was 4.6 (standard deviation 2.14) and 5.0 (standard deviation 2.03) in winter (see Table 30).
6.5.2 Food for children in the household
From the FGDs, it was established that children under five years stay at home during the day in this area. It was explained that in households with smaller children, enough food is prepared at meal times to have food available for the children to eat when they are hungry between meals. The survey results showed that 31.5% of the smaller children in households received four or more meals a day in summer and 34.8% of these children received four or more meals a day in winter. From the age of five years, children attend crèche on weekdays

65
until 13:00. At the crèche, they received something to eat. This could be rice, stiff maize meal porridge with vegetables, soup or amasi.
6.5.3 Food supply
At the two homesteads visited at Lambase, it was observed that maize used for household consumption was stored in corrugated iron tanks. However, in the FGDs in both communities, it was reported that although some people cultivated maize, production was insufficient to provide for the needs of their households. They explained that production was hampered by a lack of fencing around fields and a lack of resources such as tractors, seeds and fertilizers for the production of enough maize. Young boys had to go to school and were therefore no longer available to tend to cattle and prevent them from destroying the crops in unfenced fields. Vegetables such as cabbage, potatoes, sweet potatoes (white and orange-fleshed), spinach, onions, green peppers, butternut, pumpkin (itanga), beetroot, beans (sugar beans) and amadumbe were cultivated in both communities. Indigenous green leafy vegetables were allowed to grow in gardens, while some wild vegetables were cultivated. Participants at Lambase indicated that only some households cultivated vegetables in their homestead gardens. Although some crops were cultivated, most food was purchased. Households were forced to cultivate some crops, as their grant money was inadequate to buy fresh produce. However, they were not in a position to produce enough food due to the scarcity of water, and so they experienced food shortages specifically during the winter months. However, the participants indicated that they produced enough vegetables to supply their households with vegetables year-round. They were in a position to purchase vegetables from an irrigation project at a discounted price for their own households. They participated in the irrigation project to earn an income through selling their produce to others in the community and to retail outlets such as Spar and Boxer in Lusikisiki and Flagstaff. Indigenous green leafy vegetables were observed in homestead gardens and at the irrigation project. It was explained in the FGDs that some were planted and allowed to grow there in order to have these vegetables available as a food source. It was much more convenient for them to collect these leafy vegetables from their own gardens than to go out into the wild or fields to do so. Very few households in the study (in all sites) collected wild foods (see Table 32). Livestock such as cattle, sheep, goats, donkeys, chicken and geese were kept. The group in Mdakani also mentioned keeping horses and pigs. Only chickens and geese were occasionally used as a source of food in most households, although cattle, sheep and goats would be slaughtered when there was a special celebration by those who have livestock available. The majority of the participants in the FGDs indicated that they purchased chicken on credit from those who sell chickens.

66
Table 32: Households gathering wild food Frequency Summer Winter
Number (n = 264)
Proportion (%)
Number (n = 264)
Proportion (%)
Every day (seven days per week)
2 0.76 0 0.00
Pretty often (two to six days per week)
9 3.41 8 3.03
Once in a while (one to two days per week)
21 7.95 22 8.33
Hardly at all (one day per week) 4 1.52 7 2.65
Never 228 86.36 227 85.98
The following foods were purchased on a monthly basis from stores in Lusikisiki and Flagstaff:
• Maize meal
• Samp
• Rice
• Cake flour (unfortified at the time of the survey)
• Cooking oil
• Tea
• Sugar
• Salt
• Sugar beans
• Soup
• Amasi
• Spices
• Imana
• Knorrox
6.5.4 Changes in food eaten and the preservation of traditions
Participants in the FGDs explained that the older people in this area continue to eat what their parents ate, but the younger generation do not, as they (the young people) observe what others are eating and “… they copy what others are eating”. Another reason was attributed to changing food preferences. The example of imifino was given to explain the change in sensory preference. The elderly people still eat imifino, but the younger people do not like the bitter taste of imifino. They prefer spinach and soup (vegetable relishes prepared with processed soup mixes, flavourings and spices).

67
The participants in the irrigated area were also of the opinion that indigenous foods had been more readily available in the past. They now have to rely more on purchased food items that are processed. According to them, these changes were attributed to drought and lack of money. The example of the decline in their cattle herds was given. As herds were larger in the past, they were able to produce milk for their own households. Currently, this is not possible and they have to buy amasi. Another concern that was raised was that the younger generation was not interested in agriculture and producing crops for their own consumption. This change in attitude was attributed to young people who wanted to socialise more, due to influences from watching television and other influences from urban areas.
6.5.5 Special occasions
Weddings, initiation celebrations, funerals, tombstone unveilings, ancestral venerations, Christmas and birthdays were named as special occasions. Livestock was slaughtered to provide meat for these occasions. Households who did not have livestock such as cattle or sheep would purchase an animal to slaughter. Goats were mainly slaughtered for ancestral venerations. Large quantities of food such as rice, samp, vegetable salads (potatoes, carrots, beetroot and cabbage) and baked beans are prepared. Traditional beer is brewed from purchased sorghum. Some participants also mentioned the use of alcoholic beverages such as beer, brandy and vodka. It was explained in the FGDs that households would plan and budget for celebrations such as weddings, initiations, birthdays and unveilings. Food and money would be set aside months in advance of the planned celebration. Some participants belonged to a ‘stokvel’ or similar saving scheme, and money or food could be obtained from these for special occasions. In the case of funerals, community members assist and support one another to provide food. This is especially true for households that do not have a funeral plan or in cases when a funeral plan does not cover all expenses. Birthdays are celebrated in some families and schoolchildren take cake to school to celebrate their birthdays with their classmates. This, however, depends on the money available to purchase cakes. It was explained that 21st birthdays are usually celebrated with a big event. The food prepared for this was similar to other special occasions.
6.5.6 Food shortages
The FGDs revealed that many households experience food shortages during the last 10 days of a month. Many households rely on the money from state pensions and social grants to purchase food items. Grant money is received at the beginning of the month, usually on the first day of the month. From the 20th day of a month, food shortages are experienced. When a household runs out of food, they usually turn to their neighbours for help, as shop owners are reluctant to sell food on credit. During January, some households experience more intense food shortages, as they have additional expenses such as school uniforms and other items for children attending school.

68
Participants were asked to explain why food shortages occur. They attributed this to poor planning and the purchase of more expensive food items instead of the staple food maize meal.
6.6 Food Consumption Patterns in Jozini
6.6.1 Meal patterns and composition
FGDs indicated that people generally consumed three meals on weekdays, and that a similar pattern was followed over weekends. The survey results showed the same pattern of three meals a day for summer and winter, although 30.4% and 34.2% of the adults eat two meals a day in summer and winter respectively. The following food items could typically be consumed at these meals:
• Early morning before 09:00 (breakfast): Common breakfast foods include tea with sugar, brown bread, as well as phutu and soft porridge (eaten with sugar). Leftover food from the previous day’s meals is also included. Some participants revealed that this meal was not regarded as a proper meal.
• In all the focus groups, it was indicated that similar types of food were consumed for the other two meals of the day, which are eaten at 12:00 or 13:00 (lunch) and 19:00 (supper). These included isijingi (a pumpkin and mealie-meal dish), papa, cabbage, beans, phutu, tomatoes, spinach, potatoes, imifino, rice and mealie rice.
• Between meals, some people would drink either mageu (a drink made from fermented mealie papa), juice (when available), or water and tea. In the evening some would have amasi. Some mentioned that fruit was eaten between meals when money is available to buy this.
Some participants mentioned that meat could be included in supper dishes. The inclusion of meat, however, depends on the time of the month. Meat is eaten more often during the first few days (three to four days) of the month. Some participants indicated that when they have limited money, they try to include meat (either beef or chicken) in the Sunday midday meal. Some revealed that rice was eaten often. Some participants claimed that this was eaten every day because it was easy to prepare. For the majority of households, the lunch and supper meals simply comprised phutu (crumbly maize-meal porridge) and a vegetable and/or bean relish (stew). Eggs were reportedly expensive and not eaten regularly. Food is prepared by the women and children. Collected wood is used to make a fire inside the house and food is cooked on the open fire. Traditional methods of food preparation are followed, which includes mostly boiling, although frying is used in some vegetable dishes that are served as relishes or stews. Vegetables are fried in oil after boiling, and other ingredients and spices are added. Traditional food items still form a substantial part of the food consumption pattern. The following food items and dishes were mentioned: inkhobe (boiled dry mealies, phutu (crumbly maize-meal porridge), isijingi (combined dish prepared from pumpkin and maize-meal porridge), mageu ( fermented maize-meal

69
beverage), amasi (sour milk), sinkwa (steamed mealie bread), samp, amatabhane, sijabane (imbuya (pigweed) and mealie-meal), beans (sugar beans – purchased), indlubu (njugo beans) (depending on rainfall) and amadumbe (taro potato). Sorghum is only used for the preparation of traditional beer on special occasions. Salads prepared with mayonnaise are also served on special occasions. Results from the non-quantitative 24-hour recall reported in Table 27 showed that 67% of households consumed foods from eight or more food groups in summer and 43% of these households consumed foods from eight or more food groups in winter. The mean HDDS for summer was 10 (standard deviation 4.07) for the summer months and 7 (standard deviation 3.63) for winter (Table 30). Almost all (95%) households included foods from the cereal group in summer, with 93% reporting this tendency in winter (see Table 29). The majority consumed foods from the oils and fat group during both summer (94.0%) and winter (91%). In summer, 95% included other vegetables (mostly tomatoes, onions, green peppers and wild/indigenous vegetables) in their diets. Only 88% did so in winter. White roots and tubers (68% in summer and 54% in winter), dark green leafy vegetables (79% in summer and 60% in winter) and orange-fleshed vegetables (57% in summer and 27% in winter) were also consumed, but not in large quantities. From the FGDs, it was gathered that these vegetables were mainly used in the preparation of the vegetable relishes that were served with cereal-based dishes (phutu, stiff maize meal porridge, samp and rice). The inclusion of items from the meat (78% in summer and 57% in winter) and milk (70% in summer and 39% in winter) food groups was confirmed by the findings of the FGDs. These items are not generally regarded as part of the daily food intake. The same applies to the fruit group. In summer, 72% of households included foods from the dried bean group in meals and 56% did so in winter.
6.6.2 Food for children in the household
Participants in the focus groups were probed about the number of meals given to children between two and five years of age. It was explained that enough food was prepared at meal times to have it available to give to smaller children on demand. It was indicated that small children attended crèche in the mornings. The number of meals provided by crèches varied. Some provided one and others two meals, while some did not provide any meals. Those who have meals get soft porridge, rice, meat, sinkwa, samp, bread, banana, tea, peanut butter, oranges and apples. Soft porridge is eaten for breakfast, and fruit such as apples, bananas and oranges is eaten as snacks between meals. At some of the crèches where meals are not provided, lunchboxes are packed for the children. The content consists of similar food as eaten by the rest of the household. When children return home in the afternoons, they are given something to drink. They eat supper with the rest of the household.

70
The survey data found that only 23% of children younger than five years of age ate four or more meals a day in summer and 20% of these children ate four or more meals a day in winter.
6.6.3 Food supply
According to the FGDs, cultivated foods in this area included cabbage, spinach, beans, maize, sweet potatoes, pumpkin, amadumbe, beetroot, carrots, onions, green peppers, tomatoes, bananas, mangoes and avocados. All the focus groups confirmed that households do not produce enough maize for their households throughout the year. Some participants indicated that a few households ground their own maize meal. The majority purchased maize meal for household consumption. The cultivated maize is used as fresh maize and only a small quantity is dried. The dried maize is used to prepare authentic traditional dishes such as samp, inkhobe and sinkwa. Some participants who were engaged in gardening indicated that they sell some of their produce to earn an income to enable them to buy other food items. When asked whether they can produce enough food for their households, they confirmed that they were able to produce vegetables for their households throughout the year. The following items were purchased: beans, cake flour, curry powder, Knorrox, maize meal, oil, peanut butter, rice, salt, samp, sugar, spices, teabags, and ‘tinned stuff’ (which participants explained to be fish and beans). Fruit and meat were purchased when households had money. Fruit was mostly consumed between meals (mainly in the mornings). Households travelled by taxi to Jozini and had to pay extra money to transport their packages with purchased food. Such a trip could cost up to R100. Chicken, goats and cattle were kept and used as food. Some households would occasionally slaughter a cow for household consumption. This meat would last for up to a month. It was explained that drying or keeping it refrigerated preserved the surplus meat. Many participants owned either electric or gas refrigerators. Gas refrigerators seemed to be common in areas without electricity. It was reported that food from the wild was not as abundant as it had been in the past. Indigenous green leafy vegetables are no longer collected from the wild, except where households allowed imifino to grow in their gardens. This was attributed to climate change, as participants stated that there is “… no rainfall”. However, indigenous green leafy vegetables were obtainable and collected when rainfall was sufficient. The participants indicated that they were familiar with a number of indigenous green leafy vegetables, namely, igusha (wild vegetable jute), chuchuza (black jack), imbuya (pigweed, amaranthus), amahlala (aloe saponaria), amabunga, amakhiwane, umsobo (black night shade) (inkatha in siSwati) and indlubu (jugo beans, bambara groundnut). It was explained that households could grow these vegetables between the crops and pick them when required. Collecting imifino was the women’s responsibility. Men (only those

71
who owned dogs) hunted. Insects such as flying ants and amacimbi (caterpillars) were collected by children, usually after it rained.
6.6.4 Changes in food eaten and the preservation of traditions
In earlier days, households used to produce more maize for their own consumption, and ground maize themselves. The FGD participants explained how traditional maize dishes used to be prepared from maize they produced themselves. Amasi was consumed more frequently in the past, as they had herds that produced enough milk for their own consumption and to prepare amasi from the milk obtained from their own herds. They now have to purchase it and it is reportedly expensive. Therefore, it is now used mainly for children. Beans (legume dishes) also used to be consumed more often. Some traditional maize and mixed vegetable dishes such as isijingi were still prepared when pumpkins were available. Umqumboti (traditional beer) continued to be prepared on special occasions. However, the sorghum was now purchased, rather than grown at home. All the groups emphasised that they continue to prepare traditional dishes, although certain quick and easy modern dishes, such as rice, are frequently included in their meals. This was confirmed by statements such as “we will not stop preparing the traditional foods.” FGD participants also confirmed that they “like their traditional foods a lot.” Dombolo, another type of steamed bread, was still prepared often, although a modern version of the recipe was used. Dombolo seemed to be prepared over weekends. One group specifically mentioned the increased use of oil and fat in food preparation as an example of how diets and food preparation have changed. Participants in the focus groups made statements such as “…. back then we did not use a lot of oil/fat when preparing food”. They were of the opinion that today’s food is not as healthy compared to the food prepared in the past, and people are inclined to get sick, as they stated that “people are not healthy anymore”. According to some, the changes noted in their food consumption patterns could be attributed to the fact that they could no longer cultivate enough food. They blamed this change on the low rainfall and lack of access to water. Some FGD participants were of the opinion that the younger generation does not like the preparation methods of the past and does not want to learn about traditional ways. Participants explained that the younger generation wants to eat ready-prepared foods (meaning take-aways and fast foods). These participants also claimed that the younger generation “… liked a lot of spices and foods with a lot of fat”. Some indicated that they still taught their children the traditional ways and that children had even been taught to collect and identify indigenous green leafy vegetables (with the exception of those children who attend boarding school).

72
6.6.5 Special occasions
The participants indicated that a large quantity of food was prepared for special occasions. Special occasions included, birthdays, 21st birthday celebrations, funerals, weddings, family traditions and initiations. Food served at these occasions included traditional beer, meat, inkhobe, samp, rice, mageu, sinkwa, cabbage and salads with mayonnaise. Women formed groups (organisations) that typically functioned on stokvel principles. Being part of such a group enabled them to ‘save’ money to host special occasions. The members of the group (depending on its constitution or rules) support and assist one another when they have special occasions. Assistance could be in the form of ingredients or help with the food preparation for these occasions.
6.6.6 Food shortages
Food shortages were often experienced from the middle to the end of the month. When households have money (they receive grants on the first day of each month), they use all of it to purchase food. Other times when they specifically experienced food shortages were during January when the children return to school and after they have planted.
6.7 Food Consumption Patterns in Maruleng
6.7.1 Meal patterns and composition
In all the FGDs, the majority of participants indicated that they ate two meals a day, although there were some who ate three meals a day. The survey results indicated that only 46.0% of the adults ate two or less meals a day in summer, with 20.0% following this pattern in winter. Some 53.1% and 75.0% of the adults consumed three meals a day in winter and in summer respectively. It is, however, not clear if households regarded the bread and tea that some eat in the early morning as a meal. Some regarded it as breakfast and others did not, which could explain the differences that were reported in the meal pattern. The general pattern seemed to be eating bread with tea in the early morning. This was followed at 10:00 by pap or bogobe (stiff maize meal porridge) and morogo (relish prepared from green leaves). In the late afternoon between 18:00 and 20:00, pap and morogo is eaten. Meat is eaten with pap when available. It seems as if this pattern depends on the available money. Some indicated that they would generally eat meat once or twice a week. Chicken would typically be included once a week, and legumes twice or three times a week. Some participants included fish that was caught from the river when available. For many households, the weekend meal pattern and composition are similar to that followed during the week, although some indicated that they eat ‘high class’ over weekends (referring to the Sunday meal at midday when rice is served with other vegetables and salads). It was reported that rice is “easy to prepare.” However, pap was the staple and was still cooked

73
specifically for the men, who prefer it over rice. Cool drinks and juice are also consumed. Nothing was reportedly eaten between meals. The women prepared the food. Sometimes a young daughter in the household would be responsible for cooking. Most of the food preparation takes place on an open fire in an outside cooking area. Electricity is available, but it is not generally used for food preparation due to the cost. Electricity is mainly used for lighting and running the refrigerator. Electric stoves are only used to prepare food during the rainy season and for those foods with a relatively short cooking period, such as rice, eggs, fish and cabbage. Items such as tripe and legumes that require a longer cooking period are prepared over a fire. Firewood was often purchased, as wood was no longer readily available in their immediate environment. Participants claimed that it was cheaper to purchase firewood than to use electricity for food preparation. A very traditional way of food preparation was still followed. Results from the food group consumption of the non-quantitative 24-hour recall showed that 75% and 45% of the households consumed foods from four or fewer food groups in summer and winter respectively. All households (100%) consumed foods from the cereal group in summer, as well as in winter. The oils and fat group was consumed by the majority during summer (67%) and winter (77%). Although 89% of households included other vegetables (mostly tomatoes, onions, green peppers and wild/indigenous vegetables) in summer, 77% did so in winter. Dark green leafy vegetables were consumed by 31% of the surveyed households in summer and by 30% in winter. It can be assumed that these are not consumed in large quantities. Like in the other sites, FGDs indicated that these vegetables were mainly used in the preparation of the vegetable relishes that are served with cereal-based dishes (stiff maize meal porridge, samp and rice). The inclusion of white roots and tubers (6% in summer and 13% in winter) and orange-fleshed vegetables (3% in summer and winter) was exceptionally lower than for Ingquza Hill and Jozini. FGDs confirmed the inclusion of items from the meat (31% in summer and 52% in winter) and milk (14% in summer and 48% in winter) food groups. These foods are not generally regarded as part of the daily food intake. Meat was only consumed at the beginning of the month. The same applies to fruit. The inclusion of items from the dried bean food group was also low, as only 6% of households included it in summer and 15% included it in winter. The results showed that only three food groups (cereals, other vegetables, and oils and fats) were consumed by more than 60% of the households. The mean HDDS for summer was 4.1 (standard deviation 0.984) and 4.8 (standard deviation 1.558) in winter (see Table 30).
6.7.2 Food for children in the household
Smaller children between the ages of two and five years old ate the same food as the rest of the household, but they consumed meals more frequently. The participants indicated, “we

74
cook and then set food aside for the kids” to be eaten when the children are hungry. One group explained that they made sure that meat was available for the children to eat, as they like meat and do not want to eat morogo. Smaller children attended ECD centres where they received something to eat. Instant porridge was mentioned.
6.7.3 Food supply
Food was cultivated, collected, hunted and purchased for household consumption. The following was mentioned:
• Vegetables: beans, cabbage, spinach, sweet potatoes (both white- and orange-fleshed), pumpkin, beetroot, carrots, onions, green peppers, tomatoes, butternut, maraca , green beans and lerotse (tsamma melon, wild watermelon)
• Fruit: bananas, mangoes, oranges, paw paw, watermelon, avocado and sugarcane
• Legumes: dinawa (cow peas), ditloo (jugo beans, bambara groundnuts), marapo and sugar beans
• Grains: maize and sorghum (mabele).
Most participants said that they do not produce sufficient maize for the whole year, and during certain periods (some mentioned November and December), they have to purchase maize meal. All groups indicated that the cultivated maize was taken to the cooperative where it was ground for them. It seemed as if the majority of the households purchased maize meal for household consumption. Only two participants mentioned sorghum cultivation. Food is still commonly collected from the wild at this site. This includes fruit and vegetables, as well as insects that are collected by women (plant foods) and children (insects). Participants mentioned green leafy vegetables such as lebipo (could not find English name), thepe (pigweed, amaranthus), lerotho (pepperworth), tshetlho (devil's thorn), monyaku (wild cucumber) and kalaulau, as well as the small young leaves of the indigenous melon. The wild fruit ditshidi (sour plum) not ditsadi, as well as locusts, flying ants and masonja (mopanie worms) were collected. Small animals were hunted by the men and included impala, duiker, warthog, baboons, porcupine and rabbits. Birds such as guinea fowl, pheasant and doves were also hunted. Purchasing was always mentioned first when asked where households get their food. The following items were purchased: bread (mostly brown), bupi (maize meal), tinned fish, rice, sugar, tea, eggs, margarine, cooking oil, macaroni, salt, peanut butter, jam, chicken feet, mayonnaise, fresh milk, long-life milk and powdered milk. Purchased vegetables included potatoes, carrots and beetroot, as well as fruit such as apples, bananas and oranges. Most participants travel to Tzaneen once a month (when they receive their grant money) to purchase the bulk of their groceries. Many indicated that 80 kg of maize meal was usually purchased per month per household.

75
Some households kept cattle, pigs (indigenous), goats, chicken and donkeys. With the exception of donkeys, the livestock was occasionally used as food.
6.7.4 Changes in food eaten and the preservation of traditions
Some traditional dishes were no longer prepared and eaten. The reason given for this was related to the scarcity or unavailability of certain indigenous fruit and vegetables in the natural environment. It was also explained that previously people cultivated more maize for household consumption and ground the maize themselves. Millet and sorghum were also cultivated. The participants believed that these grains contributed to previous generations’ health and strength. Reasons for these crops not being cultivated anymore or not on the same scale as previously were poor rainfall, drought and lack of water. Previously, people also had knowledge of the muti (remedy) that was used to keep birds from destroying crops. The results of this are that people now have to buy food and that the younger generation has come to prefer the ‘new’ (purchased) food.
6.7.5 Special occasions
The only celebrations mentioned were weddings, where everyone in the community contributes according to their budgets for the food for such occasions. Some indicated that food such as pap, rice, meat and salads are served. This is mostly purchased. At funerals, some still follow the tradition of not adding salt to the food.
6.7.6 Food shortages
Food shortages were experienced in many households towards the end of the month and coping strategies included the reduction of meals. In January, many people have to pay school fees and buy new school uniforms for the children, and shortages are often more severe during this month. Crop production is usually sufficient from January to June, where after some do not have any cultivated produce to use in their households.

76
6.8 Food Consumption Patterns in Ratlou
6.8.1 Meal patterns and composition
In all the Ratlou FGDs, the majority of the participants indicated that they ate three meals a day. This was confirmed by the survey results, as 76% reported that they ate three meals a day in summer. In winter, 57% had three or more meals a day, and in summer 25% had three or more meals a day. The general pattern for breakfast seemed to be eating motogo (soft sorghum meal porridge). Other soft porridges prepared from maize meal and oats were mentioned. Some take bread with tea in the early mornings. The Madibogo group indicated that peanut butter, margarine, jam or avocados were served on the bread (typically brown). Tea could be served with or without milk and sugar, depending on its availability. Lunch consisted of papa, rice or samp eaten with cabbage, spinach or beans, fish, milk or amasi, achaar or meat. The evening meal was described as “almost the same food as lunch”. Meat was eaten with pap when available (only two to three times a month). A few participants indicated that they consumed meat daily, whereas most indicated that meat was only bought once a month. Some households include chicken twice a week. Chicken pieces are bought regularly from the local shops. The Phitshane group mentioned that fish (tinned, dried and fresh) is often eaten. Some participants indicated that nothing was eaten between meals, while others indicated that they drank water and/or tea. Some mentioned that fruit (apples, bananas and oranges), juice, masoku buns and gemere (ginger beer) were taken between meals. The meal pattern and composition on Saturdays was similar to that followed during the week. Dishes that require a longer cooking time such as samp, dumplings, dinawa or dombolo were prepared on Saturdays. Milk was consumed with the pap. Others mentioned that, on Sundays, rice and meat were served with other vegetables and salads (cabbage, pumpkin and beetroot). Cool drink (squash) could be enjoyed with the Sunday meal. The Phitshane group indicated that they had a good meal on Sundays, which meant “the seven-colour plate”. This included rice, meat and a number of vegetables and salads. Results from the food group consumption of the 24-hour recall showed that no households consumed foods from eight or more food groups in summer and only 8% did so in winter (see Table 27). Dietary diversity (see Table 30) seemed much lower in Ratlou than in Jozini. The mean HDDS for summer was 4.2 (standard deviation 1.290) and 4.7 (standard deviation 1.719) in winter. The majority (93%) of the households included foods from the cereal group in summer and all (100%) reported doing so in winter (see Table 29). The oils and fat group was consumed by 88% of the sample households in summer and by 91% of them in winter. Other vegetables (mostly tomatoes, onions, green peppers and wild/indigenous vegetables) were included in meals by 40% of the households in summer and 33% of the households in winter. White roots and tubers were consumed by 35% of the households in summer and by

77
46% of the households in winter; dark green leafy vegetables were consumed by 23% in both summer and winter, and orange-fleshed vegetables were consumed by 5% in summer and 23% in winter. It can be assumed that these are not consumed in large quantities, but are mainly used in the preparation of the vegetable relishes that are served with the cereal-based dishes (stiff maize meal porridge, samp and rice). The inclusion of items from the meat (40% in summer and 61% in winter) and milk (60% in summer and 46% in winter) food groups was confirmed by the FGDs findings. However, as for the other sites, these foods are not regarded as part of the daily food intake, despite being recorded as being consumed in the 24 hours prior to the survey. The same applied to fruit. The inclusion of items from the dried bean group was very low compared to the other sites, with 4% of households consuming these foods in summer and 2% consuming them in winter. The mean HDDS was 4.236 (standard deviation 1.290) in summer and 4.672 (standard deviation 1.719) in winter (see Table 30).
6.8.2 Food for children in the household
Smaller children between the ages of two and 5 years ate the same food as the rest of the household. However, children ate meals more frequently. Food prepared for the household is set aside to be available when the children are hungry. Food available for children included pap, meat, soft porridge, Weet-Bix, oats, Morvite (instant sorghum porridge), pumpkin, mashed potatoes and soup. Smaller children attended ECD centres where they received food.
6.8.3 Food supply
Food is cultivated, collected, hunted and purchased for household consumption. Cultivation is limited in Phitshane, mainly due to lack of rainfall and water in general. Watermelon, peanuts, cabbage, carrots, mabele (sorghum), sunflower and lerotse are grown, although households reported that pumpkins do not grow well in the area. Maize and sorghum (mabele) are grown. Sorghum is mainly used for brewing beer. The participants of the FGDs reported that they do not have home gardens because of water shortages. Those who cultivate crops do so at the masimo (a traditional cultivation field that is usually located outside a Tswana village). Similar information was offered by the Madibogo group, which stated that they used to grow beans, dinawa, maize, makatane (mellon), peanuts, sorghum, sunflower, sweet reeds (sugarcane), watermelon and white sweet potatoes in the past. Some community members have small home gardens where they grow crops such as beetroot, butternuts, cabbage, carrots, chillies, green beans, green peppers, onions, potatoes, pumpkin, spinach and tomatoes. Limited food is collected from the wild – usually after the rain in summer. In Phitshane, this includes thepe (pigweed, amaranthus), morogo wa dinawa (cow pea leaves), morokolane, dithatanyana, morogo wan aga, motlhankanyane, motoloko, morekwa, ditlhekwa, setwane, motsutsujwane, mmura, sekgalo, rekolwane, leropa, mola and motunasane. In Madibogo,

78
women collect the following wild vegetables: thepe (pigweed, amaranthus), mochane, lelopolane, moretwa, morotoko, sethwane, mokgalo and morogo wa dinoga. In Madibogo, the following wild fruit are gathered: moretwa, setwane, mochane and tsutsubele. Tsie (locusts) and lephoyi (doves) are eaten. It was reported that mopane worms were eaten, but these were purchased, as mopane trees are now scarce because they have been cleared for cropping. Men, women and children collect insects. Mmutu (hare), duiker, tshipe (springbok), phuduhudu, ngulube yanaka, thakadu, tholo and noko (porcupine), as well as guinea fowl and warthog, were hunted by men. Purchasing was spontaneously mentioned first when participants were asked where they get food for their households. Groceries that are generally bought include beans, beef, bread, cooking oil, cabbage, coffee, cornflakes, juices (Oros), eggs, fish (tinned), carbonated drinks (Sprite), flour, frozen mixed vegetables, milk, maize meal, mealie rice, mabele (sorghum), macaroni, oats, potatoes, rice, samp, amasi (sour milk), spaghetti, sugar and tea. Most participants travel to Mahikeng once a month (when they receive grant money) to purchase groceries. In Madibogo, some participants also reported purchasing from stores in Vryburg or Delareyville. Some households keep ducks, cattle, chicken, geese, goats, pigs, sheep and turkeys. Horses, mules and donkeys were also mentioned. It was reported that goats and sheep were slaughtered for home consumption once or twice a year, as were donkeys and pigs (mainly in winter). Some respondents ate pigs. Chickens were mainly slaughtered for home consumption over weekends. Cattle were mainly slaughtered once a year for weddings and funerals.
6.8.4 Changes in food eaten and the preservation of traditions
Some traditional crops were no longer available due to the scarcity or unavailability of certain indigenous fruit and vegetables in the natural environment. Some participants mentioned and even blamed climate change and the use of fertilizers for this change. Previously people were “eating sorghum meals only.” When they had pap, it was from their own cultivated maize, that they ground themselves to “make lekker pap”. Now, all maize meal is purchased. The meat of slaughtered animals is cooked and the remaining meat is dried and kept for a long time. Meat is not kept in fridges. One group emphasised that there was a greater variety of foods when they were younger, but pap has replaced traditional foods.
6.8.5 Special occasions
A number of special occasions, both modern and traditional, were mentioned, including weddings, birthday parties, graduation parties, the unveiling of tombstones, Badimo (ancestral veneration or thanksgiving) funerals and church gatherings. At traditional celebrations, traditional food would include beer, meat (chotho or seswaa), porridge and

79
samp. However, participants stated that seven-colour dishes are more common during the celebration of modern traditions. They explained that they have copied other cultures.
6.8.6 Food shortages
Food shortages were experienced in many households towards the end of the month, usually a week before the end of the month. Eating more soft porridge than other food types of food is a common coping strategy. FGD participants also reported buying on credit and borrowing money from the village bank. In January, people pay school fees and buy school uniforms for the children. Therefore, January is very difficult and shortages are often more severe, as households spend too much in December.
6.9 Discussion Regarding Consumption Patterns
Overall, the qualitative and quantitative data suggests several common consumption patterns. Firstly, the bulk of diets consist of purchased cereals. Food purchasing occurs around the time government grants are disbursed. In the ensuing weeks, food consumption and dietary diversity decline. Secondly, the preparation and consumption of traditional foods is still appreciated, but qualitative information indicated that these practices and preferences are not being passed onto the next generation, despite the involvement of children in food preparation. It was apparent that some foods and preparation practices have vanished entirely from the menu. This can, to some degree, be explained by environmental, social and economic changes that affect entitlements. The same can probably be said for household food production. Thirdly, seasonality and special occasions influence consumption. January is a month of shortages, when dietary diversity and food quantities are reduced. Celebrations and social events depend on familial and communal contributions and are events where food can be sourced, even in times of scarcity. In addition, the quantitative statistical analysis of consumption patterns shows that the consumption of roots and tubers, fruit and vegetables was positively and significantly related to each other and the consumption of other food groups (see Table 31). The consumption of fruit and dark green leafy vegetables was significantly and negatively related to the consumption of cereals in winter and positively related to the consumption of white roots and tubers in summer. This infers that households that consume primarily cereal-based diets were less likely to consume fruit and dark green leafy vegetables in winter, which confirms a largely maize-based diet, especially in winter. This is of concern, as fruit and dark green leafy vegetables are important sources of micronutrients that are essential for health, productivity and well-being. The consumption of white roots and tubers was significantly and positively related to all the other crop-based food groups, which indicates that there is a tendency to include foods from more than one group when foods from these food groups are included in the diet. Similar trends were seen across the non-crop food groups, as well as for overall

80
dietary diversity, which meant that an increase in the consumption of crop-based food group items was accompanied by overall improvements in dietary diversity.
6.10 Precautionary Behaviour Related do Consumption During Food Shortages
The study findings confirmed that food shortages led to reductions in the quality of diets, with households reporting both child and adult hunger (see Table 33).

81
Table 33: Practices of households when faced with food shortages Consumption reduction
strategy
How frequently did this happen? Number Proportion of households
(%) In the past 12 months, did an adult go hungry because of a lack of resources?
Never 160 53.2
Often (more than 10 times a month) 5 1.7
Sometimes (three to 10 times a month)
45 15
Rarely (once or twice a month) 91 30.2
Total 301 100.0
In the past 12 months, did a child go hungry because of a lack of resources?
Never 184 59.4
Often (more than 10 times a month) 3 1.0
Sometimes (three to 10 times a month)
41 13.2
Rarely (once or twice a month) 82 26.5
Total 310 100.0
In the past 12 months, did an adult eat less often than he or she should have because of a lack of resources?
Never 141 45.5
Often (more than 10 times a month) 7 2.3
Sometimes (three to 10 times a month)
53 17.1
Rarely (once or twice a month) 109 35.2
Total 310 100.0
In the past 12 months, did a child eat smaller meals than he or she should have because of a lack of resources?
Never 151 48.7
Often (more than 10 times a month) 8 2.6
Sometimes (three to 10 times a month)
48 15.5
Rarely (once or twice a month) 103 33.2
Total 310 100.0
In the past 12 months, did an adult go to bed at night without food because of a lack of resources?
Never 220 71.0
Often (more than 10 times a month) 3 1.0
Sometimes (three to 10 times a month)
33 10.6
Rarely (once or twice a month) 54 17.4
Total 310 100.0
In the past 12 months, did a child go to bed at night without food because of a lack of resources?
Never 248 80.0
Often (more than 10 times a month) 1 0.3
Sometimes (three to 10 times a month)
21 6.8
Rarely (once or twice a month) 40 12.9
Total
310
100.0

82
Consumption reduction strategy
How frequently did this happen? Number Proportion of households
(%) In the past 12 months, did an adult go a whole day and night without food because of a lack of resources?
Never 100 75.8
Often (more than 10 times a month) 1 0.8
Sometimes (three to 10 times a month)
4 3
Rarely (once or twice times a month)
27 20.5
Total 132 100.0
In the past 12 months, did a child go a whole day and night without food because of a lack of resources?
Never 242 77.8
Often (more than 10 times a month) 3 1.0
Sometimes (three to 10 times a month)
22 7.1
Rarely (once or twice times a month)
44 14.1
Total 311 100.0
However, the findings show that hunger was not chronic or enduring, but was only experienced ‘rarely’ (once or twice a month) and ‘sometimes’ (three to 10 times a month) (see Table 33). Very few households reported that hunger was experienced ‘often’ (more than 10 times a month). All households reported having to eat a less diverse diet than they would have liked due to a lack of resources (see Table 34). More than half of the households skipped meals, but only 31% reported doing this more than five days in the previous month. Just over half the households surveyed reported eating less variety more than five days in the last 30 days. Skipping meals and eating less diverse diets for more than five days in a month are indicators used by Stats SA as an indicator of inadequate access to food.

83
Table 34: Reduction of food quality and variety Coping strategies Sample
size Number Proportion
(%)
Has a household member skipped any meals during the past 12 months because there was not enough food in the house?
311 163 52.4
Has a household member skipped meals five or more days in the past 30 days?
310 95 30.6
Has a household member had to eat a smaller variety of foods during the past 12 months than he or she would have liked because there was not enough food in the house?
314 314 100
Has any household member eaten a smaller variety for five or more days in the past 30 days?
312 160 51.3
6.11 Nutrition and Social Change
Neves and Du Toit (2013:95) state that rural livelihoods in the study areas are diverse, show considerable complexity and diversity and incorporate both agrarian and non-agrarian informal sector activities, state grants and networks of social reciprocity. They characterise the persistence of rural poverty as “... less one of the exclusion or estrangement of the economically marginalised from the economic mainstream, than their ‘adverse incorporation’ into the broader political economy of South Africa. South Africa’s subalterns have long been incorporated into commodity relations as consumers, social grant recipients, low-waged workers, informal-sector survivalists or the dependents of these groups”. For poor rural households that spend a high proportion of their income on food, food insecurity is a significant part of this adversity, to which households respond with ever-shifting strategies, depending on the severity and temporal dimensions (Hendriks 2014). These span the formal and informal sectors that involve wage labour, migration, household production, changing consumption patterns and sometimes severe and irreversible measures to stave off hunger (Hendriks 2014). Increasingly, rural household food security is influenced by the availability, quality and costs of food purchased from large retail chains, whose expansion into poor communities is supported by the infusion of social grant money into rural economies (Bähre 2011; Igumbor et al. 2012). In this way, social protection may be having a profound influence on household food consumption patterns and nutrition outcomes, as well as the role of household production in livelihood strategies. An increased reliance on purchased food implies changes in both the social fabric and communities’ use of natural resources .

84
The collective changes in diet, physical activity, health and nutrition that take place in many developing countries are collectively known as the ‘nutrition transition’ (FAO undated). The growing consumption of more affordable packaged, processed and fast foods and soft drinks is undoubtedly driving the nutrition transition in South Africa (Armstrong et al. 2006; Igumbor et al. 2012). Temple et al. (2011) conclude that a healthy diet is unaffordable for most South Africans, and people with low incomes rely increasingly on cheap, energy-dense foods, which may begin to explain the co-existence of stunting and obesity within the same socio-economic strata and within the same households (Armstrong et al. 2006; Popkin et al. 2012). It is not known whether this tendency is exaggerated in poor rural areas, and even less is understood about how infusions of cash in the form of grants and the introduction of other social protection measures interact with subsistence farming to influence household food security strategies and nutrition outcomes. It is worthwhile, however, to consider the rural and historical context in order to better understand the livelihood adaptations that determine food security. The legacies of land dispossession and migrant labour, alongside more recent rural development challenges, are arguably historical contributors to chronic food insecurity in the former homelands (O’Laughlin 2013). However, the picture is a complex one of dynamic adaptations of livelihoods rather than straightforward agrarian decline. Rural people continue to use subsistence farming as an important component of household food security and it remains part of a diverse and fluid livelihood and coping strategies, which span the formal and informal sectors (Aliber and Hart 2009; Neves and Du Toit 2013). Qualitative data from the study sites suggests a number of possibilities with regard to the interplay of labour remittances, social grants, seasonality, household production and nutrition outcomes:
• With declining urban employment, remittances that were used to invest in household and small-scale production have shrunk and input costs are rising. Participants report that they can no longer afford many of the inputs, such as oxen for animal traction and fencing for terraced crop farming (Ingquza Hill).
• There are changes in settlement patterns, mainly as people move closer to urban centres for access to social grants and shops, as the opportunity costs of subsistence farming are outweighed by the benefits of grants and other social protection measures (Jozini and Maruleng).
• Because of social grants, households that comprise pensioners and grandchildren may be better off than others, because there is cash to capitalise household production. Pensioners, moreover, have experience and knowledge of subsistence production. Therefore, livelihood strategies are more diverse (all four sites).

85
• Subsistence farming is not being passed along to the current generation of working-age adults. This phenomenon is accompanied by changing food consumption patterns, new preferences and new designations of what are ‘traditional’ (home-grown) and ‘modern’ (store-bought) foods (all four sites).
• The emphasis on large-scale, commercial agricultural projects has meant that smallholders and subsistence producers have been overlooked, which has numerous consequences. This includes the shortfall in extension services and the failure to adapt to these ecologically such as the unsustainable ‘scaling down’ of commercial farming methods using inappropriate pesticides, herbicides, fertilizers and water consumption (Maruleng) and the loss of productive land and ecosystem services to commercial and cash cropping (Jozini).

86
CHAPTER 7: NUTRITIONAL STATUS OF CAREGIVERS AND CHILDREN
Anthropometry is regarded as one of the few measures relating to food security with scientifically validated international standards. Nutrition, which reflects the quality and quantity of food consumed, is only one outcome of food security. This study collected the anthropometric data of children between 24 and 59 months of age and their female caregivers. Table 35 presents the BMI2 of female carers of small children in the households surveyed. Just over one in five of the female caregivers (22%) was overweight and 37% were classified as obese (BMI over 30). Combined, the proportion of overweight and obese female carers was 59%. Proportionately fewer cases of underweight women were found. However, 19% of the carers in Maruleng were underweight.
Table 35: BMI of female, non-pregnant caregivers
Sample size
Total sample
Ingquza Hill
Jozini Maruleng Ratlou
175 37 54 21 63
BMI Percentage
Underweight (BMI ≤ 18.5) 8.6 0.0 9.3 19.0 9.5
Normal (BMI 18.5 to 24.9) 32.6 40.5 27.8 23.8 34.9
Overweight (BMI 25 to 29.9) 22.3 24.3 25.9 23.8 17.5
Obese (BMI ≥ 30) 36.6 35.1 37.0 33.3 38.1
Total 100 100 100 100 100
Overweight and obese (BMI ≥ 25) 58.9 59.4 62.9 57.1 55.6
The rates of stunting (24%) among children of 24 to 59 months generally confirmed the national statistics for this indicator of deprivation. Stunting was considerably lower in Maruleng than at the other sites (see Table 36). Reasons for this were not obvious, except that many more rain-fed crops grew in this district. The graphs in Figure 5 show that the children’s height-for-age is skewed downwards, but their weight-for-age and BMI scores for age are skewed upwards. Overall, 15% of the children were overweight. The boys were generally more undernourished than the girls. This raises concern over the food consumption patterns of children who are unable to consume large quantities of the largely maize-based diet. The classified (underweight, normal and overweight) BMI scores of the caregivers were negatively correlated to the classified BMI for age Z-score (BAZ) (Spearman’s rho = -0.215; p = 0.044; n = 88) and weight-for-age Z-score (WAZ) (Spearman’s rho = -0.231; p = 0.018; n = 105) of children. The classified weight-for-height Z-score (WHZ) was negatively
2 The BMI is calculated as:

87
correlated to the HAZ (rho = -0.150; p = 0,011; n = 284) and the BAZ (rho = 0.296; p = 0.000; n = 227). The WAZ was positively correlated with the BAZ (rho = 0.403; p = 0.000; n = 284). Due to missing data, not all the anthropometric measures were available for all the children. Irrigation was the only variable that had a statistically significant (negative) influence on the classified child anthropometry scores (see Table 37). Applying irrigation was negatively correlated to the classified BMI scores of female caregivers in Ingquza Hill. Dietary diversity had a positive correlation with the classified BMI scores of the females in Ingquza Hill, but it did not have a statistically significant relationship with dietary diversity in the other sites. This may infer that increasing dietary diversity is associated with higher incomes and greater reliance on purchased foods that lead to higher BMI scores, as indicated in the FGDs. This was supported by the negative significant correlation of the BMI scores of caregivers with irrigation. Participation in crop production had a significant negative correlation with the children’s mid-upper arm circumference Z-score (MUACZ. Participation in a school garden had a significant negative correlation with the children’s WHZ in Ingquza Hill. It is not clear how to interpret this finding, as reductions in a high MUACZ and WHZ could mean that children are underweight, but it could be positive if mitigating higher-end scores associated with overweight and obesity. There were generally more overweight children than underweight children. Participation in a school garden could be an indication of landlessness and marginalisation – especially of female community members who are forced to use the available communal land for crop production. In Maruleng, the only statistically significant (positive) influence of crop production on anthropometry was found between dietary diversity and child stunting (HAZ). In Ratlou, crop production and home gardening were negatively correlated with the WHZ, but practising irrigation was positively correlated with the same anthropometric measure. It is unclear how to interpret these findings, but one should be mindful that only four households in this sample practised irrigation, so there are not enough cases to see a trend.

88
Table 36: Child anthropometry
Sample Categories Z-scores
BAZ (%) HAZ (%) MUACZ (%) WAZ (%) WHZ (%)
Total
Sample size 285 314 357 326 286 Below the norm ≤ -2SD
5.3 23.9 2.8 8.6 4.5
Normal (-1.99 SD ≤ z ≤ +1.99 SD)
80.0 73.9 94.1 87.7 82.2
Above the norm ≥ +2SD)
14.7 2.2 3.1 3.7 13.3
Ingquza Hill
Sample size 60 70 79 67 61 Below the norm ≤ -2SD
10.0 24.3 2.5 10.4 8.2
Normal (-1.99 SD ≤ z ≤ +1.99 SD)
75.0 74.3 96.2 86.6 77.0
Above the norm ≥ +2SD)
15.0 1.4 1.3 3.0 14.8
Jozini
Sample size 96 104 116 110 96 Below the norm ≤ -2SD
5.2 26.0 2.6 11.8 5.2
Normal (-1.99 SD ≤ z ≤ +1.99 SD)
83.3 71.2 92.2 84.5 83.3
Above the norm ≥ +2SD)
11.5 2.9 5.2 3.6 11.5
Maruleng
Sample size 51 54 63 58 51 Below the norm ≤ -2SD
3.9 16.7 1.6 3.4 3.9
Normal (-1.99 SD ≤ z ≤ +1.99 SD)
76.5 79.6 96.8 91.4 76.5
Above the norm ≥ +2SD)
19.6 3.7 1.6 5.2 19.6
Ratlou
Sample size 74 82 95 87 75 Below the norm ≤ -2SD
1.4 25.6 4.2 6.9 1.3
Normal (-1.99 SD ≤ z ≤ +1.99 SD)
83.8 73.2 92.6 89.7 89.3
Above the norm ≥ +2SD)
14.9 1.2 3.2 3.4 9.3
Note: SD = Standard deviations above or below the norm; BAZ = BMI for age Z-score; HAZ = Height-for-age Z-score; MUACZ = Mid-upper arm circumference Z-score; WAZ = Weight-for-age Z-score; WHZ = Weight-for-height Z-score.
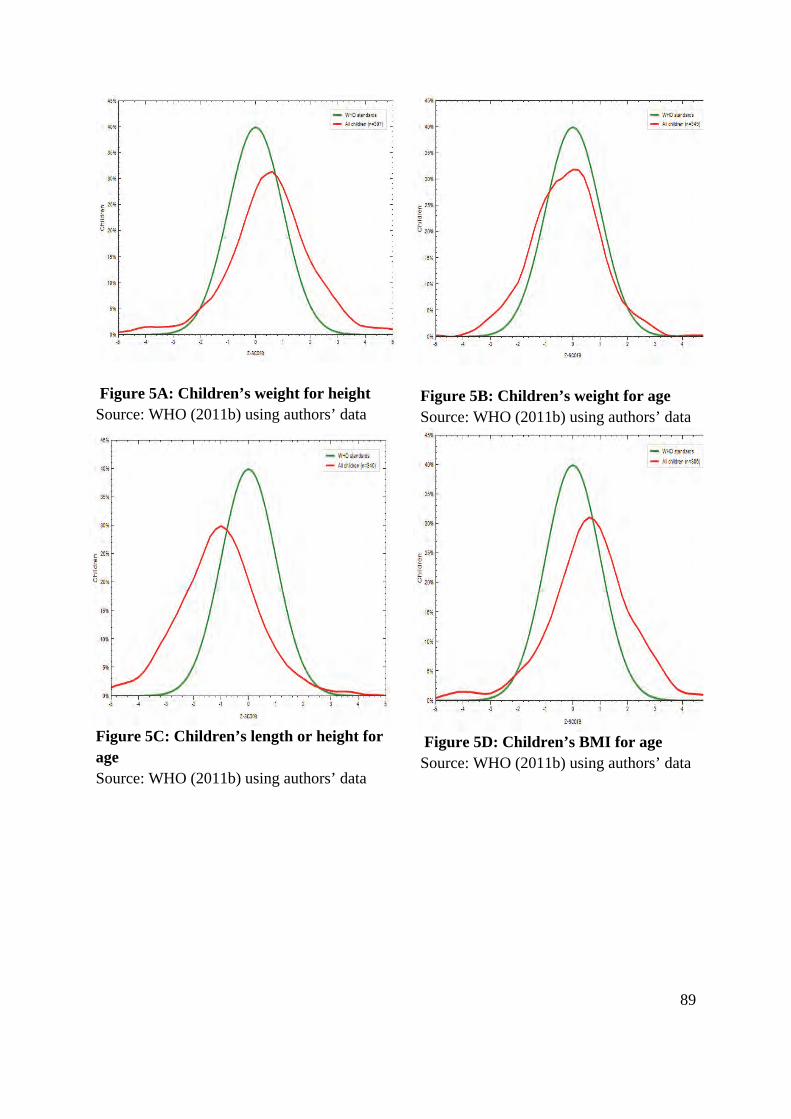
89
Figure 5A: Children’s weight for height Source: WHO (2011b) using authors’ data
Figure 5B: Children’s weight for age Source: WHO (2011b) using authors’ data
Figure 5C: Children’s length or height for age Source: WHO (2011b) using authors’ data
Figure 5D: Children’s BMI for age Source: WHO (2011b) using authors’ data

90
Figure 5E: Children’s MUAC for age Source: WHO (2011b) using authors’ data
Figure 5F: Children’s weight for age by sex Source: WHO (2011b) using authors’ data
Figure 5G: Children’s length for age by sex Source: WHO (2011b) using authors’ data

91
Tab
le 3
7: V
aria
ble
s si
gnif
ican
tly
infl
uen
cin
g an
thro
pom
etry
cla
ssif
icat
ion
Who
le s
ampl
e
WH
Z
clas
sifi
cati
on
HA
Z
clas
sifi
cati
on
WA
Z
clas
sifi
cati
on
MU
AC
Z
clas
sifi
cati
on
Adu
lt B
MI
clas
sifi
cati
on
Who
le s
ampl
e Ir
riga
ting
hou
seho
lds
Cor
rela
tion
coe
ffic
ient
0.
078
-0.1
25*
0.05
5-0
.039
-0.1
27
Sig
nifi
canc
e (t
wo-
tail
ed)
0.20
80.
035
0.34
20.
483
0.10
8 S
ampl
e si
ze
259
283
296
323
161
Ingq
uza
Hil
l H
DD
S
Cor
rela
tion
coe
ffic
ient
-0
.015
-0.1
210.
214
-0.0
520.
391*
Sig
nifi
canc
e (t
wo-
tail
ed)
0.90
80.
327
0.08
40.
655
0.01
7 S
ampl
e si
ze
5968
6677
37
Agr
icul
tura
l en
gage
men
t C
orre
lati
on c
oeff
icie
nt
0.15
70.
157
-0.0
88-0
.240
*0.
290
Sig
nifi
canc
e (t
wo-
tail
ed)
0.23
50.
200
0.48
50.
036
0.08
2 S
ampl
e si
ze
5968
6677
37
Irri
gati
ng h
ouse
hold
s C
orre
lati
on c
oeff
icie
nt
-0.0
49-0
.162
0.35
4*0.
116
-0.4
37*
Sig
nifi
canc
e (t
wo-
tail
ed)
0.74
60.
253
0.01
10.
378
0.02
0 S
ampl
e si
ze
4652
5160
28
Sch
ool g
arde
n C
orre
lati
on c
oeff
icie
nt
-0.2
88*
0.08
70.
038
0.00
00.
155
Sig
nifi
canc
e (t
wo-
tail
ed)
0.02
60.
477
0.75
81.
000
0.35
8 S
ampl
e si
ze
6069
6778
37
Jozi
ni
Irri
gati
ng h
ouse
hold
s C
orre
lati
on c
oeff
icie
nt
0.16
7-0
.156
-0.1
63-0
.075
-0.2
81*
Sig
nifi
canc
e (t
wo-
tail
ed)
0.11
60.
124
0.09
9.4
420.
048
Sam
ple
size
9098
103
108
50

92
Who
le s
ampl
e
WH
Z
clas
sifi
cati
on
HA
Z
clas
sifi
cati
on
WA
Z
clas
sifi
cati
on
MU
AC
Z
clas
sifi
cati
on
Adu
lt B
MI
clas
sifi
cati
on
Mar
ulen
g H
DD
S
Cor
rela
tion
coe
ffic
ient
-0
.053
0.31
3*0.
183
0.23
20.
274
Sig
nifi
canc
e (t
wo-
tail
ed)
0.71
30.
023
0.17
20.
069
0.24
2 S
ampl
e si
ze
5153
5762
20
Rat
lou
Agr
icul
tura
l en
gage
men
t C
orre
lati
on c
oeff
icie
nt
-0.2
36*
-0.1
28-0
.149
0.20
0-0
.117
S
igni
fica
nce
(tw
o-ta
iled
) 0.
042
0.25
40.
169
0.05
10.
362
Sam
ple
size
75
8287
9563
Ir
riga
ting
hou
seho
lds
Cor
rela
tion
coe
ffic
ient
0.
290*
-0.0
83-0
.012
-0.0
160.
117
Sig
nifi
canc
e (t
wo-
tail
ed)
0.01
30.
464
0.91
00.
880
0.36
2 S
ampl
e si
ze
7380
8594
63
Hom
e ga
rden
C
orre
lati
on c
oeff
icie
nt
-0.2
86*
0.08
70.
017
0.00
7-0
.117
S
igni
fica
nce
(tw
o-ta
iled
) 0.
013
0.43
80.
873
0.94
40.
362
Sam
ple
size
75
8287
9563
*
Cor
rela
tion
is s
igni
fica
nt a
t the
0.0
5 le
vel (
two-
tail
ed).
**
Cor
rela
tion
is s
igni
fica
nt a
t the
0.0
1 le
vel (
two-
tail
ed).

93
CHAPTER 8: NUTRITIONAL CONSIDERATIONS FOR CROP-BASED RECOMMENDATIONS
8.1 Food Group-based Considerations
The seven plant-based food groups used to calculate the HDDS provide the base for recommendations for improving the diets of the households in this study. These food groups are cereals, white roots and tubers, orange-fleshed vegetables, dark green leafy vegetables, other vegetables, orange fruit, and other fruit. Almost all households consumed cereals every day, therefore, the recommendations focus on food that can increase dietary diversity and overall nutrition.
8.2 Dietary Recommendations
The HDDS is based on a recall of non-quantitative consumption for the day prior to the survey and may have included weekends or non-typical days such as celebrations. No quantitative intake information (portion size) is available for these intakes, so the findings need to be carefully interpreted. The recommendations are based on what food consumption patterns can strengthen existing good consumption patterns and what changes can be promoted to improve food consumption. Promotion is understood to mean taking active steps to increase the current, relatively low intakes. Table 38 presents a list of potentially important crops for achieving improvements in food consumption among these community members. These recommendations are made based purely on a human nutrition perspective, and keeping dietary diversity and current eating and purchasing patterns in mind. The next section of the report will evaluate these recommendations in light of what can be produced in the communities.

94
Tab
le 3
8: R
ecom
men
dat
ion
s to
impr
ove
die
tary
inta
ke
Foo
d g
rou
p S
pec
ific
cro
ps
(alp
hab
etic
ally
)*
Ref
ers
to th
e co
nsum
ptio
n of
the
leav
es o
f th
e cr
ops
& P
resu
mab
ly s
mal
l qua
ntiti
es a
re e
aten
; thu
s no
nu
trie
nt in
take
sig
nifi
canc
e (f
lavo
ur a
nd d
iver
sity
co
nsid
erat
ions
) #
Acc
epta
bili
ty u
nkno
wn
Rec
omm
end
atio
ns
Ingq
uza
Hil
l Jo
zin
i M
aru
len
g R
atlo
u
Dar
k gr
een
leaf
y ve
geta
bles
B
eetr
oot*
L
egum
es*
Pum
pkin
s*
Spi
nach
S
wee
t pot
atoe
s*
Afr
ican
leaf
y ve
geta
bles
(‘w
ild’
or c
ultiv
ated
)
Pro
mot
e an
d st
reng
then
exi
stin
g go
od p
atte
rns
Str
engt
hen
exis
ting
good
pa
ttern
s
Pro
mot
e ex
istin
g go
od p
atte
rns
Pro
mot
e ex
istin
g go
od
patte
rns
Oth
er v
eget
able
s B
eetr
oot
Cab
bage
C
ucum
ber
Egg
plan
t (br
inja
l)#
Gre
en b
eans
G
em s
quas
h/’C
alab
ash’
/oth
er s
quas
h an
d pu
mpk
in
Gre
en p
eppe
rs&
L
ettu
ce
Oni
ons&
T
omat
oes
Zuc
chin
i (ba
by m
arro
w)#
Pro
mot
e an
d st
reng
then
exi
stin
g go
od p
atte
rns
Str
engt
hen
exis
ting
good
pa
ttern
s
Str
engt
hen
exis
ting
good
pa
ttern
s
Pro
mot
e ex
istin
g go
od
patte
rns

95
Foo
d g
rou
p S
pec
ific
cro
ps
(alp
hab
etic
ally
)*
Ref
ers
to th
e co
nsum
ptio
n of
the
leav
es o
f th
e cr
ops
& P
resu
mab
ly s
mal
l qua
ntiti
es a
re e
aten
; thu
s no
nu
trie
nt in
take
sig
nifi
canc
e (f
lavo
ur a
nd d
iver
sity
co
nsid
erat
ions
) #
Acc
epta
bili
ty u
nkno
wn
Rec
omm
end
atio
ns
Ingq
uza
Hil
l Jo
zin
i M
aru
len
g R
atlo
u
Oth
er f
ruit
A
pple
s A
voca
dos
Ban
anas
B
erri
es
Citr
us f
ruit
Fig
s G
uava
(th
is tr
ee h
as b
een
clas
sifi
ed a
s an
inva
der
spec
ies,
and
alth
ough
hig
h in
nut
ritio
n, s
houl
d no
t be
reco
mm
ende
d fo
r cu
ltiva
tion)
P
ears
P
inea
pple
s P
lum
s#
Wat
erm
elon
s
Pro
mot
e ex
istin
g go
od p
atte
rns
Pro
mot
e an
d st
reng
then
ex
istin
g go
od
patte
rns
Pro
mot
e an
d st
reng
then
ex
istin
g go
od
patte
rns
Pro
mot
e ex
istin
g go
od
patte
rns
Sho
rt-t
erm
: Ora
nge-
fles
hed
vege
tabl
es
Car
rots
D
ark
oran
ge p
umpk
in, b
utte
rnut
or
squa
sh
Ora
nge
swee
t pot
atoe
s
Pro
mot
e ex
istin
g go
od p
atte
rns
Str
engt
hen
exis
ting
good
pa
ttern
s
Pro
mot
e ex
istin
g go
od p
atte
rns
Pro
mot
e ex
istin
g go
od
patte
rns
Lon
ger
term
: Ora
nge-
colo
ured
fru
it A
pric
ots
Loq
uats
M
ango
s P
apay
a O
rang
e pe
ache
s S
pans
pek
(can
talo
upe)
#
Pro
mot
e ex
istin
g go
od p
atte
rns
Pro
mot
e ex
istin
g go
od p
atte
rns
Pro
mot
e ex
istin
g go
od p
atte
rns
Pro
mot
e ex
istin
g go
od
patte
rns
1 Thi
s re
fers
to p
oten
tial
ly im
port
ant c
rops
, pur
ely
from
a h
uman
nut
riti
on p
ersp
ecti
ve a
nd k
eepi
ng d
ieta
ry d
iver
sity
and
cur
rent
eat
ing
an
d pu
rcha
sing
pat
tern
s in
min
d.

96
CHAPTER 9: THE CONTRIBUTION OF PRODUCTION TO HOUSEHOLD CONSUMPTION
This study set out to address two major knowledge gaps:
• What is the contribution of home- or smallholder-grown foods to total dietary intake and nutritional requirements (in the context of an in-depth description of the food environment and its linkages to water)?
• What is the effect of seasonality on home or smallholder production and the resultant food intake?
To answer these two questions, the researchers considered the sources of food and contribution of production to the diets of the households.
9.1 The Influence of Cropping and Scale of Cropping on Food Consumption
Engagement in cropping did not seem to reduce the number of months of inadequate hunger reported by households. However, engagement in production influenced dietary diversity (see Table 27). Far more cropping households consumed foods from eight or more food groups in both summer and winter. Even though most foods were purchased, cropping increased the availability of foods for home consumption (see Table 23). However, Table 39 presents a comparison of the proportion of households consuming various food groups. The analysis does not indicate a strong influence of crop production on the consumption of food groups in summer. However, proportionally fewer cropping households consumed orange-fleshed vegetables in summer, but consumed more than non-cropping households consume in winter. The same pattern was seen for the consumption of dark green leafy vegetables, other vegetables, orange-coloured fruit, other fruit, as well as dried beans and legumes. This shows a more positive influence of cropping on food consumption in winter than in summer. This result was not expected, as the number of crops that can produce edible portions in winter is rather limited. Yet, the data presented in Table 27 shows that 40% of households involved in cropping consumed foods from eight or more food groups in summer and 26% did so in winter. This was remarkably different to the non-cropping households, where only 20% consumed foods from eight or more food groups in summer and 7% did so in winter. Over half (55%) of irrigating households consumed foods from eight or more food groups in summer and 42% consumed these foods in winter (see Table 27). Figures 6 and 7 present the HDDSs by engagement in crop-production during summer and winter.

97
Figure 6: Dietary diversity score – summer
45.6
22.5
38.2
59.8
23.5
23.5
27.7
46.1
24.5
34.7
24.5
50
90.4
37.3
18.1
24.1
44.6
4.8
9.6
15.9
55.4
4.8
14.6
9.6
42.2
88
26.7
13.3
21.3
62.5
6.8
21.3
6.7
37.3
5.3
12
21.3
38.7
78.7
0 50 100
White roots and tubers
Orange-fleshed vegetables
Dark green leafyvegetables
Other vegetables
Orange-coloured fruits
Other fruits
Organ meat
Meat
Eggs
Fish and seafood
Dried beans
Milk and milk products
Oils and fats
Proportion of households - summer
Food
gro
ups c
onsu
med Cropping
Non-cropping
Irrigating

98
Figure 7: Dietary diversity – winter
37.3
18.1
24.1
44.6
9.6
9.6
15.9
55.4
4.8
4.8
9.6
42.2
88
42
21.8
37.8
72.5
16.2
31.1
31.1
50.3
18.1
27.5
36.8
45.6
86.5
53.7
28.7
50.9
84
24.3
39.8
13
62
26.9
40.7
50
50.9
91.7
0 20 40 60 80 100
White roots and tubers
Orange-fleshed vegetables
Dark green leafy vegetables
Other vegetables
Orange-coloured fruits
Other fruits
Organ meat
Meat
Eggs
Fish and seafood
Dried beans
Milk and milk products
Oils and fats
Proportion of households - winterFo
od g
roup
s con
sum
ed
Cropping
Non-cropping
Irrigating

99
Tab
le 3
9: F
ood
gro
up
con
sum
pti
on f
or c
rop
pin
g an
d n
on-c
rop
pin
g h
ouse
hol
ds
from
th
e 24
-hou
r re
call
F
ood
grou
p Se
ason
T
otal
sam
ple
Non
-cro
ppin
g
Cro
ppin
g Ir
riga
ting
N
umbe
r P
ropo
rtio
n N
umbe
r P
ropo
rtio
n N
umbe
r P
ropo
rtio
n N
umbe
r P
ropo
rtio
n S
ampl
e si
ze
Sum
mer
26
4
103
83
75
W
inte
r 27
9
83
19
3
108
C
erea
ls
Sum
mer
25
5 96
.2
99
96.1
83
10
0 74
98
.7
Win
ter
273
97.5
83
10
0 18
6 96
.4
102
94.4
W
hite
roo
ts a
nd tu
bers
S
umm
er
125
(of
265)
47
.2
47
45.6
31
37
.3
20
26.7
W
inte
r 11
3 40
.4
31
37.3
81
42
.0
58
53.7
O
rang
e-fl
eshe
d ve
geta
bles
S
umm
er
83
31.6
23
(of
102
) 22
.5
15
18.1
10
13
.3
Win
ter
57
20.4
15
18
.1
42
21.8
31
28
.7
Dar
k gr
een
leaf
y ve
geta
bles
S
umm
er
132
50.2
39
(of
102
) 38
.2
20
24.1
16
21
.3
Win
ter
93
33.2
20
24
.1
73
37.8
55
50
.9
Oth
er v
eget
able
s S
umm
er
196
74.2
61
(of
102
) 59
.8
37
44.6
45
(of
72)
62
.5
Win
ter
180
of 2
74)
65.7
37
44
.6
140
72.5
89
(of
106
) 84
.0
Ora
nge-
colo
ured
fru
it
Sum
mer
72
27
.3
24 (
of 1
02)
23.5
4
4.8
5 (o
f 74
) 6.
8 W
inte
r 35
(of
277
) 12
.6
4 9.
6 31
(of
191
) 16
.2
26 (
of 1
07)
24.3
O
ther
fru
it
Sum
mer
10
0 37
.9
24 (
of 1
02)
23.5
8
9.6
16
21.3
W
inte
r 69
24
.7
8 9.
6 60
31
.1
43
39.8
O
rgan
mea
t S
umm
er
79 (
of 2
63)
30.0
28
(of
102
) 27
.7
13 (
of 8
2)
15.9
5
6.7
Win
ter
32 (
of 2
78)
11.5
13
(of
82)
15
.9
19
31.1
14
13
.0
Mea
t S
umm
er
140
53.0
47
(of
102
) 46
.1
46
55.4
28
37
.3
Win
ter
144
51.6
46
55
.4
97
50.3
67
62
.0
Egg
s S
umm
er
76
28.8
25
(of
102
) 24
.5
4 4.
8 4
5.3
Win
ter
39
13.9
4
4.8
35
18.1
29
26
.9
Fis
h an
d se
afoo
d S
umm
er
98 (
of 2
63)
37.3
35
(of
101
) 34
.7
12 (
of 8
2)
14.6
9
12.0
W
inte
r 65
23
.4
12 (
of 8
2)
4.8
53
27.5
44
40
.7
Dri
ed b
eans
and
legu
mes
S
umm
er
96
36.4
25
(of
102
) 24
.5
8 9.
6 16
21
.3
Win
ter
79
28.2
8
9.6
71
36.8
54
50
.0
Mil
k an
d m
ilk
prod
ucts
S
umm
er
136
51.1
51
(of
102
) 50
.0
35
42.2
29
38
.7
Win
ter
124
44.4
35
42
.2
88
45.6
55
50
.9
Oil
s an
d fa
ts
Sum
mer
23
8 (o
f 26
5)
89.9
91
90
.4
73
88.0
59
78
.7
Win
ter
243
87.1
73
88
.0
167
86.5
99
91
.7

100
The dietary diversity of non-crop-producing households was lower than that of crop-producing households in both winter and summer (see Table 30), and decreased by at least one food group in winter. Households engaged in cropping had higher average HDDSs. Irrigation increased the average HDDS of crop-producing households even further. The HDDS for irrigating households increased from an average of 7.1 food groups in summer to 8.9 in winter. Cropping was significantly and positively correlated with the consumption of orange-fleshed vegetables, dark green leafy vegetables, other vegetables, other fruit and dried beans and legumes (see Table 40). Irrigating and farmland (larger-scale) production were positively correlated to the consumption of other vegetables, other fruit, and dried beans and legumes. Farmland production also led to a significant increase in the consumption of orange-fleshed vegetables. Home gardening led to a significant positive increase in the consumption of white roots and tubers, dark green leafy vegetables, orange-coloured fruit and other fruit in the 24 hours prior to the survey (see Table 40). Participation in a community garden led to significant increases in the consumption of dark green leafy vegetables and other vegetables. School gardening did not demonstrate any statistical relationships with the consumption of foods from the crop-related food groups.
9.2 What Can be Grown?
The purpose of the study was to assess the current rain-fed and irrigated production of food crops and the potential for production in relation to the food and nutrition requirements of poor rural people to propose a prioritised list of opportunities for efficient water use that could directly overcome dietary inadequacies and lead to better nutrition of rural household members. Having established that engagement in food production has a positive influence on consumption, dietary diversity and dietary quality, and that the availability of produce in summer has a positive overall influence on consumption patterns, the researchers turned to understanding what can be produced in the areas under study to improve food supply and diets all year round.

101
Table 40: Correlations (Spearman’s) of food group consumption and scale of farming Food group
Cropping
Irrigating
Farm- land
Home garden
School garden
Community garden
White roots and tubers
Correlation coefficient
0.027 0.073 0.084 -0.138** 0.031 0.063
Significance (two-tailed)
0.531 0.103 0.051 0.001 0.470 0.140
Sample size 539 506 543 545 545 545
Orange-fleshed vegetables
Correlation coefficient
0.088* -0.027 0.083 -0.083 0.044 0.041
Significance (two-tailed)
0.040 0.542 0.054 0.054 0.301 0.335
Sample size 537 504 540 542 542 542
Dark green leafy vegetables
Correlation coefficient
0.142** -0.0590.153*
* -0.194** 0.003 0.156**
Significance (two-tailed)
0.001 0.187 0.000 0.000 0.942 0.000
Sample size 537 504 540 542 542 542
Other vegetables
Correlation coefficient
0.264** -0.234** 0.285*
* -0.075 -0.068 0.142**
Significance (two-tailed)
0.000 0.000 0.000 0.082 0.117 0.001
Sample size 533 500 536 538 538 538
Orange-coloured fruit
Correlation coefficient
0.085 -0.0340.138*
* -0.172** 0.025 0.082
Significance (two-tailed)
0.050 0.447 0.001 0.000 0.557 0.055
Sample size 536 503 539 541 541 541
Other fruit Correlation coefficient
0.212** -0.121** 0.167*
* -0.085* 0.029 0.081
Significance (two-tailed)
0.000 0.007 0.000 0.049 0.501 0.059
Sample size 538 505 541 543 543 543
Dry beans and legumes
Correlation coefficient
0.222** -0.150** 0.134*
* -0.075 -0.009 0.144**
Significance (two-tailed)
0.000 0.001 0.002 0.079 0.835 0.001
Sample size 538 505 541 543 543 543
** Correlation is significant at the 0.01 level (two-tailed). * Correlation is significant at the 0.05 level (two-tailed). Following an investigation of possible crops that can be grown in these communities, a list of potential crops that can be grown in each of the local municipalities under investigation was

102
prepared. The crops listed by the communities as ones they are not growing, but would like to grow were considered in this exercise. This list is presented below. Production considerations were considered in identifying these crops. This included the timing of planting, frost and pests, and disease problems.
People in the area currently grow most of the recommended crops for improved dietary intake, which were mentioned in Chapter 8. Community members also indicated that they would like to produce these crops in future. The households identified some crops they want to plant, but these crops would not contribute significantly to improving the key nutrients that would improve overall nutrition (vitamin A, iron and zinc), for example, maize and potatoes. The researchers recommend crops such as cucumber, brinjal and zucchini (baby marrow) as important crops to improve dietary quality, but the farmers have no interest in producing these crops. These might be unknown crops in the area and therefore not easily introduced into the diets of the households in these areas.
Some farmers in the surveyed communities produced sweet potatoes, but it is not known if these were the orange-fleshed varieties. Orange-fleshed sweet potato is relatively drought tolerant. The Dry Bean Producers’ Organization is working on dry bean cultivars that are more drought tolerant, which can be used by small-scale or rural households where supplementary irrigation is not possible. It should be remembered that the production potential of crops is determined by the site-specific environmental, soil and water availability conditions.
Most fruits are short-season crops. While they can improve dietary intake for periods, these periods often coincide with summer crop availability. Citrus fruit can provide fruit in winter months. However, for all fruit, unless processing and packaging technologies are available to extend the period of availability, these will only supplement diets for short periods of the year. More investigation is required regarding the palatability and acceptance of many fruits and their agronomic potential for the selected sites. Temperate fruits, such as apples and apricots, need a certain number of cold units to induce flowering. In the subtropical areas, such as Maruleng, the winters may not be cold enough to accumulate the required cold units, which leads to poor fruit, if any. The tropical or subtropic crops, such as bananas and avocados, should all be able to be produced in this area. For tree crops, supplementary irrigation may be necessary for sustainable yields. Crops such as strawberries need plenty of water for good production and may not do as well as watermelon and cantaloupe in rain-fed conditions.
Tables 41 and 42 present the list of recommended crops (fruit and vegetables respectively) for consumption at each site, their production considerations, whether they are produced or not, and if the community indicated whether they would like to grow them. For Jozini, the KwaZulu-Natal Department for Agriculture and Environmental Affairs (2013) was approached for bioresource information. The list of potential crops and the growing conditions in this area were taken into consideration. Appendix B contains a list of general
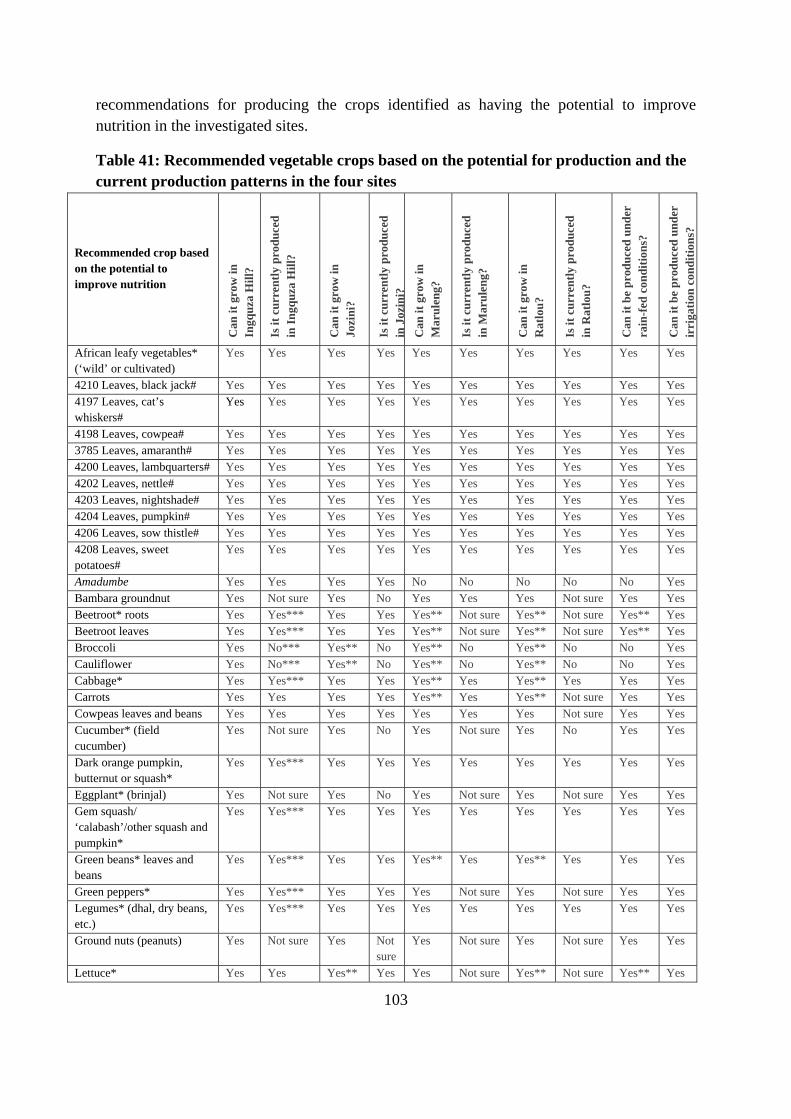
103
recommendations for producing the crops identified as having the potential to improve nutrition in the investigated sites.
Table 41: Recommended vegetable crops based on the potential for production and the current production patterns in the four sites
Recommended crop based on the potential to improve nutrition
Can
it g
row
in
Ingq
uza
Hill
?
Is it
cur
rent
ly p
rodu
ced
in
In
gqu
za H
ill?
Can
it g
row
in
Jozi
ni?
Is it
cur
rent
ly p
rodu
ced
in
Joz
ini?
Can
it g
row
in
Mar
ulen
g?
Is it
cur
rent
ly p
rodu
ced
in
Mar
ule
ng?
Can
it g
row
in
Rat
lou
?
Is it
cur
rent
ly p
rodu
ced
in
Rat
lou
?
Can
it b
e p
rod
uce
d u
nd
er
rain
-fed
con
dit
ion
s?
Can
it b
e p
rod
uce
d u
nd
er
irri
gati
on c
ond
itio
ns?
African leafy vegetables* (‘wild’ or cultivated)
Yes Yes Yes Yes Yes Yes Yes Yes Yes Yes
4210 Leaves, black jack# Yes Yes Yes Yes Yes Yes Yes Yes Yes Yes 4197 Leaves, cat’s whiskers#
Yes Yes Yes Yes Yes Yes Yes Yes Yes Yes
4198 Leaves, cowpea# Yes Yes Yes Yes Yes Yes Yes Yes Yes Yes 3785 Leaves, amaranth# Yes Yes Yes Yes Yes Yes Yes Yes Yes Yes 4200 Leaves, lambquarters# Yes Yes Yes Yes Yes Yes Yes Yes Yes Yes 4202 Leaves, nettle# Yes Yes Yes Yes Yes Yes Yes Yes Yes Yes 4203 Leaves, nightshade# Yes Yes Yes Yes Yes Yes Yes Yes Yes Yes 4204 Leaves, pumpkin# Yes Yes Yes Yes Yes Yes Yes Yes Yes Yes 4206 Leaves, sow thistle# Yes Yes Yes Yes Yes Yes Yes Yes Yes Yes 4208 Leaves, sweet potatoes#
Yes Yes Yes Yes Yes Yes Yes Yes Yes Yes
Amadumbe Yes Yes Yes Yes No No No No No Yes Bambara groundnut Yes Not sure Yes No Yes Yes Yes Not sure Yes Yes Beetroot* roots Yes Yes*** Yes Yes Yes** Not sure Yes** Not sure Yes** Yes Beetroot leaves Yes Yes*** Yes Yes Yes** Not sure Yes** Not sure Yes** Yes Broccoli Yes No*** Yes** No Yes** No Yes** No No Yes Cauliflower Yes No*** Yes** No Yes** No Yes** No No Yes Cabbage* Yes Yes*** Yes Yes Yes** Yes Yes** Yes Yes Yes Carrots Yes Yes Yes Yes Yes** Yes Yes** Not sure Yes Yes Cowpeas leaves and beans Yes Yes Yes Yes Yes Yes Yes Not sure Yes Yes Cucumber* (field cucumber)
Yes Not sure Yes No Yes Not sure Yes No Yes Yes
Dark orange pumpkin, butternut or squash*
Yes Yes*** Yes Yes Yes Yes Yes Yes Yes Yes
Eggplant* (brinjal) Yes Not sure Yes No Yes Not sure Yes Not sure Yes Yes Gem squash/ ‘calabash’/other squash and pumpkin*
Yes Yes*** Yes Yes Yes Yes Yes Yes Yes Yes
Green beans* leaves and beans
Yes Yes*** Yes Yes Yes** Yes Yes** Yes Yes Yes
Green peppers* Yes Yes*** Yes Yes Yes Not sure Yes Not sure Yes Yes Legumes* (dhal, dry beans, etc.)
Yes Yes*** Yes Yes Yes Yes Yes Yes Yes Yes
Ground nuts (peanuts) Yes Not sure Yes Not sure
Yes Not sure Yes Not sure Yes Yes
Lettuce* Yes Yes Yes** Yes Yes Not sure Yes** Not sure Yes** Yes

104
Recommended crop based on the potential to improve nutrition
Can
it g
row
in
Ingq
uza
Hill
?
Is it
cur
rent
ly p
rodu
ced
in
In
gqu
za H
ill?
Can
it g
row
in
Jozi
ni?
Is it
cur
rent
ly p
rodu
ced
in
Joz
ini?
Can
it g
row
in
Mar
ulen
g?
Is it
cur
rent
ly p
rodu
ced
in
Mar
ule
ng?
Can
it g
row
in
Rat
lou
?
Is it
cur
rent
ly p
rodu
ced
in
Rat
lou
?
Can
it b
e p
rod
uce
d u
nd
er
rain
-fed
con
dit
ion
s?
Can
it b
e p
rod
uce
d u
nd
er
irri
gati
on c
ond
itio
ns?
Onions* Yes Yes*** Yes Yes Yes Not sure Yes Yes Yes Yes Orange-fleshed sweet potatoes*
Yes Yes Yes Yes Yes Not sure Yes Not sure Yes Yes
Peas Yes Yes Yes Not sure
Yes** Not sure Yes** Not sure Yes** Yes
Potatoes Yes Yes*** Yes** Not sure
Yes** Not sure Yes** Not sure Yes** Yes
Pumpkins* Yes Yes Yes Yes Yes Yes Yes Yes Yes Yes Swiss chard* (wrongly indicated as spinach)
Yes Yes*** Yes Yes Yes Yes Yes Yes Yes Yes
Sweet potatoes* see orange sweet potatoes
Yes Yes Yes Yes Yes Yes Yes Not sure Yes Yes
Tomatoes* Yes Yes*** Yes Yes Yes Yes Yes Yes Yes Yes Zucchini* Yes Not sure Yes Not
sure Yes Not sure Yes Not sure Yes Yes
* The crop is prioritised for its nutritional content.
** The crop would do better with supplementary irrigation. *** Farmers are interested in cultivating the crop.
Table 42: Table of recommended fruit crops based on their potential for production Recommended crop based on the potential to improve nutrition
Can
it g
row
in
Ingq
uza
Hill
?
Is it
cur
rent
ly
pro
du
ced
in I
ngq
uza
H
ill?
Can
it g
row
in
Jozi
ni?
Is it
cur
rent
ly
pro
du
ced
in J
ozin
i?
Can
it g
row
in
Mop
ani?
Is it
cur
rent
ly
pro
du
ced
in
Mar
ulen
g?
Can
it g
row
in
Rat
lou
?
Is it
cur
rent
ly
pro
du
ced
in R
atlo
u?
Can
it b
e p
rod
uce
d un
der
rain
-fed
co
nd
itio
ns?
Can
it b
e p
rod
uce
d u
nd
er ir
riga
tion
co
nd
itio
ns?
Apples No No No No No No No No N/A N/A Apricots No No No No No No No No N/A N/A Avocados Yes Yes Yes Yes Yes Yes Yes Not sure Yes Yes Bananas Yes Not sure Yes Yes Yes Yes No No Yes Yes Berries No No No No No No No No N/A N/A Citrus fruit No No Yes Not sure Yes Yes Yes Not sure Yes Yes Figs Yes Not sure Yes Not sure Yes Not sure Yes Not sure Yes Yes Loquats Yes Not sure Yes No sure Yes Not sure Yes Not sure Yes Yes Mangoes Yes Not sure Yes Not sure Yes Yes Yes Not sure Yes Yes Marula No No Yes Not sure Yes Yes No No Yes Yes Peaches (orange) No No No No No No No No N/A N/A Papaya Yes Not sure Yes Not sure Yes Yes Yes Not sure Yes Yes Pears No No No No No No No No N/A N/A Pineapples Yes Not sure Yes Not sure Yes Not sure No No Yes Yes Plums No No No No No No No No N/A N/A

105
Recommended crop based on the potential to improve nutrition
Can
it g
row
in
Ingq
uza
Hill
?
Is it
cur
rent
ly
pro
du
ced
in I
ngq
uza
H
ill?
Can
it g
row
in
Jozi
ni?
Is it
cur
rent
ly
pro
du
ced
in J
ozin
i?
Can
it g
row
in
Mop
ani?
Is it
cur
rent
ly
pro
du
ced
in
Mar
ulen
g?
Can
it g
row
in
Rat
lou
?
Is it
cur
rent
ly
pro
du
ced
in R
atlo
u?
Can
it b
e p
rod
uce
d un
der
rain
-fed
co
nd
itio
ns?
Can
it b
e p
rod
uce
d u
nd
er ir
riga
tion
co
nd
itio
ns?
Spanspek (cantaloupe)
Yes Not sure Yes Not sure Yes Not sure Yes Not sure Yes Yes
Watermelon/makataan
Yes Not sure Yes Not sure Yes Not sure Yes Not sure Yes Yes
9.3 Nutrient Composition of the Recommended Crops
The recommended crops for improving the diets of the households surveyed were presented in Chapter 8. Tables 43 and 44 present the nutrient values per 100 g of raw, edible food3 of the recommended crops for key nutrients – vitamin A (largely found in orange-fleshed vegetables and orange- and red-coloured fruit), iron (found in higher concentrations in green leafy vegetables) and zinc (based largely on Wolmarans et al. 2010; Kruger et al. 1998). This data was used to rank the crops by nutrient composition and density. The equivalent values for raw, edible food were used, converted from ‘as purchased’ to ‘as ready to cook or serve raw’ by Wolmarans et al. (2010) and Kruger et al. (1998). The team considered other important macronutrients (such as protein), micronutrients (such as folate) and trace elements (such as zinc). Protein and zinc are not found in significant quantities in plant foods, except for the protein in legumes. Legumes are protein-rich foods, but they are already included in the list of recommended foods due to their iron content. Legumes are also good sources of zinc. Moreover, phytates, which are commonly found in plant foods, can reduce zinc absorption. The best sources of folate are green leafy vegetables, avocados, broccoli, fruit (especially citrus, papaya and berries), cauliflower, beetroot, carrots, legumes and squash. All these foods have already been included in the list of recommended crops. The South African food composition database (Wolmarans et al. 2010; Kruger et al. 1998) does not contain beta-carotene values. These were calculated by multiplying the retinol equivalent values by six to get the beta-carotene values (as per Wolmarans et al. 2010:5). Beta-carotene is only found in fruit and vegetables. As beta-carotene is the precursor for vitamin A, it was assumed that legumes do not contain vitamin A.
3 Conversion from ‘as purchased’ to ‘as ready to cook or serve raw’ (Shugart et al. 1986; Lynch 2012)

106
Table 43: Selected nutrient values for the recommended vegetable crops
Consumption recommendation
Database code1
Nutrient values per 100 g of edible food2
Beta-carotene
(µg)1
Vitamin A
(µg RE) Iron
(mg) Zinc (mg)
African leafy vegetables (‘wild’ or cultivated)
4210 Leaves, black jack# 5898 983 6 0.91 4197 Leaves, cat’s whiskers#
7182 1197 2.6 0.76
4198 Leaves, cowpea# 594 99 2.7 0.4
3785 Leaves, amaranth raw#
1956 326 4.8 1.51
4196 Leaves, amaranth dried#
16140 2690 21 4.99
4200 Leaves, lambquarters#
5490 915 6.1 1.36
4202 Leaves, nettle# 6072 1012 7.2 0.69
4203 Leaves, nightshade#
6378 1063 8.5 1.16
4204 Leaves, pumpkin# 1164 194 2.2 0.2
4206 Leaves, sow thistle#
5898 983 7.1 0.9
4208 Leaves, sweet potato#
618 103 1 0.29
Amadumbe 3787 Tuber, raw, (flesh only)
- - 0.6 0.23
Bambara groundnuts 03_001 Seeds, dried, raw 30 5 4.4 2.2
Beetroot roots 4096 Roots (flesh and skin)
18 3 0.8 0.29
Beetroot leaves 4097 Leaves 3660 610 3.3 0.38
Broccoli 3702 396 66 1.2 0.66
Cabbage 3704 Cabbage raw 42 7 0.3 0.14
4108 Chinese cabbage 50 9 0.4 0.14
Carrots 3709 (flesh and skin) 19500 3250 0.6 0.35
Cauliflower 3828 12 2 0.5 0.32
Cowpeas
03_004 Dried, raw 41 7 7.8 8
04_010 Leaves, raw 2900 483 4.5 0.6
4198 Leaves, raw 594 99 2.7 0.40
Cucumber (field cucumber)
4252 Wild, raw 42 7 0.5 0.25

107
Consumption recommendation
Database code1
Nutrient values per 100 g of edible food2
Beta-carotene
(µg)1
Vitamin A
(µg RE) Iron
(mg) Zinc (mg)
Dark orange pumpkin, butternut or squash 4174 Butternut 768 128 0.4 0.31
Eggplant (brinjal) 4098 (Flesh and skin) 72 12 0.6 0.32
Green beans 4120 Green beans raw 216 36 0.9 0.40
Ground nuts (peanuts) 4285 Peanut - 0 4.6 3.27
Green peppers 3733 Sweet green, raw 216 36 0.9 0.24
Legumes (dhal, dry beans, etc.)
3200 Broad beans, dried 30 5 6.7 3.14
3180 Beans haricot, dried
- 0 6.4 2.54
3206 Beans sugar, dried - 0 5.9 2.54
Lettuce 3723 90 15 0.5 0.28
Onions 3755 - 0 0.5 0.31
Orange-fleshed sweet potatoes
02_013 Yellow, raw 5256 876 2.0 0.3
Orange-fleshed sweet potatoes
3748 Orange-fleshed, baked
13092 2182 0.5 0.29
Peas 4144 156 26 1.7 0.87
Potatoes 4154 (Flesh only) - trace 0.7 0.29
4121 (Flesh and skin) - 0 1.2 0.29
Pumpkins 4163 Pumpkin 936 156 0.4 0.24
4163 Hubbard Squash 2376 396 0.2 0.16
Squash (gem squash, calabash or other squash and pumpkin)
4174 Butternut 768 128 0.4 0.31
3769 Baby marrow (zucchini)
132 22 0.8 0.55
4211 Calabash/gourd (white) raw
- - 0.5 0.70
4175 Gem (flesh only), raw
- trace 0.2 0.28
Swiss chard (often wrongly indicated as spinach)
4168 2808 468 4.4 0.73
Tomatoes 3750 234 39 0.2 0.16 1 Wolmarans et al. 2010; Stadlmayr et al. 2010; Kruger et al. 1998 – no values available # Estimated as µg retinol equivalents (µg RE) x 6 µg carotene following Wolmarans et al. (2010:5)
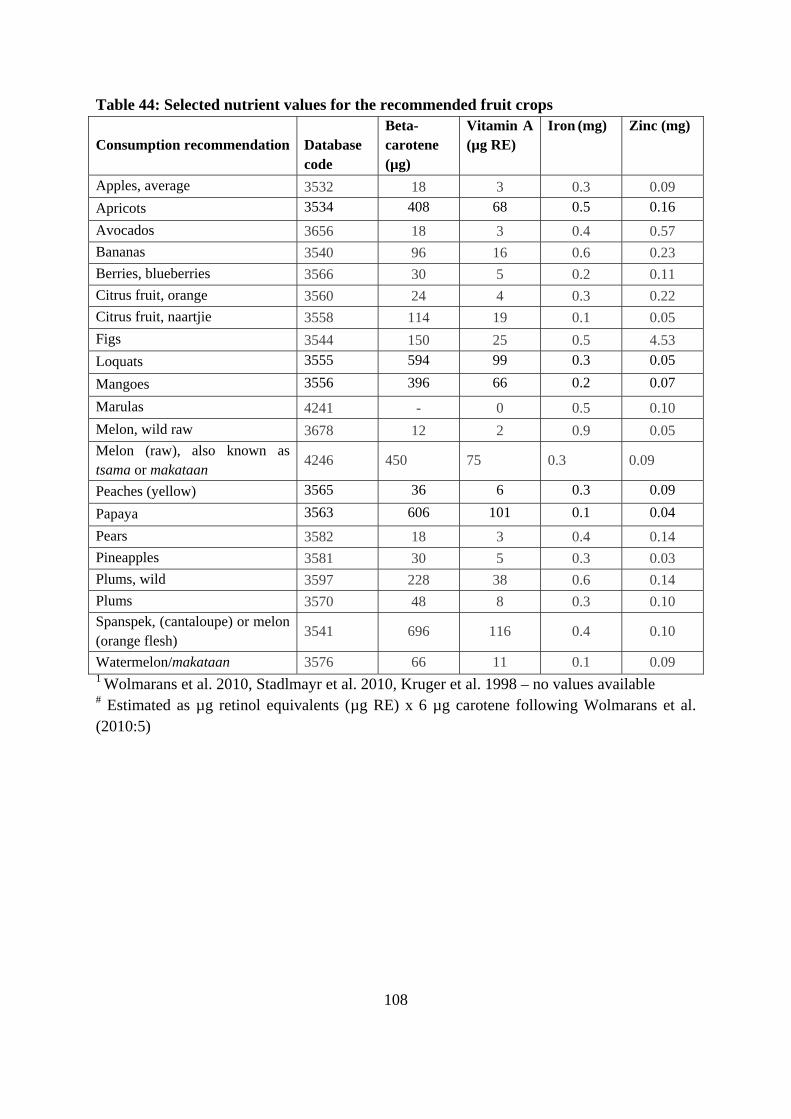
108
Table 44: Selected nutrient values for the recommended fruit crops
Consumption recommendation Database code
Beta-carotene
(µg)
Vitamin A(µg RE)
Iron (mg) Zinc (mg)
Apples, average 3532 18 3 0.3 0.09 Apricots 3534 408 68 0.5 0.16
Avocados 3656 18 3 0.4 0.57 Bananas 3540 96 16 0.6 0.23 Berries, blueberries 3566 30 5 0.2 0.11 Citrus fruit, orange 3560 24 4 0.3 0.22 Citrus fruit, naartjie 3558 114 19 0.1 0.05 Figs 3544 150 25 0.5 4.53 Loquats 3555 594 99 0.3 0.05
Mangoes 3556 396 66 0.2 0.07
Marulas 4241 - 0 0.5 0.10 Melon, wild raw 3678 12 2 0.9 0.05 Melon (raw), also known as tsama or makataan
4246 450 75 0.3 0.09
Peaches (yellow) 3565 36 6 0.3 0.09
Papaya 3563 606 101 0.1 0.04
Pears 3582 18 3 0.4 0.14 Pineapples 3581 30 5 0.3 0.03 Plums, wild 3597 228 38 0.6 0.14 Plums 3570 48 8 0.3 0.10 Spanspek, (cantaloupe) or melon (orange flesh)
3541 696 116 0.4 0.10
Watermelon/makataan 3576 66 11 0.1 0.09 1 Wolmarans et al. 2010, Stadlmayr et al. 2010, Kruger et al. 1998 – no values available # Estimated as µg retinol equivalents (µg RE) x 6 µg carotene following Wolmarans et al. (2010:5)

109
9.4 Water-Efficient Options to Improve Diet Quality
Having established which crops can grow in the four areas with the potential for improving the diets of poor rural households in the sites, the researchers turned to investigating the water requirements of the various recommended crops. Nutrient water productivity indicates the weight (kg) of produce that can be produced per cubic metre of water (Wenhold et al. 2012). The higher the water productivity value, the more can be produced per unit of water. Crops with higher water productivity are recommended for production in dry areas. Tables 45 and 46 present the water productivity for the crops recommended for improving nutrition in the study sites. As seen from the data, most of the recommended crops were selected for their provision of at least one specific nutrient, but also provide a range of nutrients that are required as part of the diversified diet that is necessary to improve nutrition. It is noted that some of the crops on the recommended list are ‘dual-purpose’ crops, and provide nutritious grains (as in the case of cowpea) or starch (as in the case of beetroot and pumpkins or squashes), as well as leaves that can be used fresh or dried. Some of these, for example cowpeas, also provide feed for animals. Leguminous plants also have benefits for soil quality and nitrogen, and support improved yields for other crops. Figure 8 provides insight into the water productivity of the recommended crops and indicates how efficiently they can produce nutritious food. The estimates make a number of assumptions that need to be considered when interpreting the graph. These assumptions relate to, among other things, water losses in the system, the conversion of harvested produce to edible portions, the bioavailability of nutrients for use by the human body, and losses in cooking and preparation. Nevertheless, the illustration offers insight into comparative nutrient yield per unit of raw produce produced per cubic metre of water applied to the plant. From this diagram, it is clear that different crops are beneficial for improving the intake of one nutrient, but these crops are not necessarily high in another nutrient per unit of edible food and produced with a unit of water. As dietary diversity is important for nutrition, it is important to produce a variety of crops to ensure a diverse plate of food.

110
Tab
le 4
5: T
he
wat
er n
utr
ien
t p
rodu
ctiv
ity
of t
he
reco
mm
end
ed c
rop
s C
onsu
mp
tion
rec
omm
end
atio
n D
atab
ase
cod
eaW
ater
pro
du
ctiv
ity
(kg/
m-3
)R
efer
ence
Afr
ican
leaf
y ve
geta
bles
(‘w
ild’
or
cul
tiva
ted)
4210
Lea
ves,
bla
ck
jack
# M
usta
rd 0
.89
to 2
.01
Jute
mal
low
0.2
6 to
0.5
6 S
pide
r pl
ant 0
.2 to
0.7
3 W
ater
mel
on 0
.14
to 0
.43
Wen
hold
et a
l. (2
012)
4197
Lea
ves,
cat
’s
whi
sker
s#
4198
Lea
ves,
co
wpe
a#
3785
Lea
ves,
am
aran
th#
3785
Lea
ves,
am
aran
th#
0.54
to 1
.11
4200
Lea
ves,
lam
bqua
rter
s#
4200
Lea
ves,
la
mbq
uart
ers#
-
4202
Lea
ves,
net
tle#
4202
Lea
ves,
ne
ttle
# -
4203
Lea
ves,
nig
htsh
ade#
42
03 L
eave
s,
nigh
tsha
de#
0.81
to 2
.88
4204
Lea
ves,
pum
pkin
# 42
04 L
eave
s,
pum
pkin
# 0.
13 to
0.9
2
4206
Lea
ves,
sow
this
tle#
42
06 L
eave
s, s
ow
this
tle#
-
4208
Lea
ves,
sw
eet p
otat
oes#
42
08 L
eave
s,
swee
t pot
ato#
0.
1 to
0.9
Am
adum
be
0.22
to 0
.24
Mab
haud
hi e
t al.
(201
3a)
Bam
bara
gro
undn
ut
0.
38 to
0.5
3 –
also
0.0
9 to
0.2
5 m
enti
oned
K
arun
arat
nea
et a
l. (2
015)
; Mab
haud
hi e
t al.
(201
3b)
Bee
troo
t roo
t R
oots
-
B
eetr
oot l
eave
s 40
97 L
eave
s-
B
rocc
oli
1.
89 to
14.
61 –
als
o 2.
08 to
3.3
7 E
rdem
et a
l. (2
010)
; Lop
ez-U
rrea
et a
l. (2
009)

111
Con
sum
pti
on r
ecom
men
dat
ion
Dat
abas
e co
dea
Wat
er p
rod
uct
ivit
y (k
g/m
-3)
Ref
eren
ceC
auli
flow
er
3.74
to 7
.49
– al
so 3
.28
to 3
1.91
B
ozku
rt e
t al.
(201
1); S
arka
r (2
009)
Cab
bage
4108
7.4
to 1
1.8
– al
so 3
.93
to 1
1.38
Im
tiya
z et
al.
(200
0); K
adya
mpa
keni
(20
13)
3704
Cab
bage
le
aves
, Chi
nese
ca
bbag
e A
s ab
ove
Car
rots
37
096.
4 to
12.
8 –
also
1.2
7 to
6.8
6 Im
tiya
z et
al.
(200
0); S
arka
r (2
009)
Cow
peas
leav
es a
s w
ell a
s be
ans
Gre
en b
eans
L
eave
s =
0.2
3 to
0.5
3
Cow
pea
41
98 C
owpe
a le
aves
Wen
hold
et a
l. (2
012)
Cuc
umbe
r (f
ield
cuc
umbe
r)
5.
1 to
8.5
8 –
also
19
to 3
3 1.
08 to
9.1
2 (f
urro
w v
s. d
rip)
A
bd E
l-M
agee
da a
nd S
emid
ab (
2015
a); I
qbal
et
al. (
2014
); R
ahil
and
Qan
adil
lo (
2015
) D
ark
oran
ge p
umpk
in, b
utte
rnut
or
squ
ash
4174
But
tern
ut9.
28 to
12.
22 –
als
o 13
.42
to 1
8.58
F
andi
ka e
t al.
(201
1)
Egg
plan
t* (
brin
jal)
6.
93 –
als
o 4.
36 to
11.
6 A
mir
i et a
l. (2
012)
; Man
juna
tha
et a
l. (2
004)
G
em s
quas
h/‘c
alab
ash’
/ oth
er
squa
sh a
nd p
umpk
in
2.
96 to
5.4
6 –
also
18.
87 to
25.
99
Abd
El-
Mag
eeda
and
Sem
idab
(20
15b)
; Fan
dika
et
al.
(201
1)
Gre
en b
eans
(le
aves
and
bea
ns)
1.
8 to
4.4
for
bea
nsK
öksa
l et a
l. (2
008)
Gre
en p
eppe
rs37
330.
68 to
4.5
2 (f
urro
w v
s. d
rip)
Iqba
l et a
l. (2
014)
Leg
umes
(dh
al, d
ry b
eans
, etc
.)
3200
Bea
ns, b
road
be
ans,
dri
ed
2.56
to 9
.89
– al
so 0
.74
to 1
.9
Bha
ttar
ai e
t al.
(200
6); E
feth
a et
al.
(201
1)
3180
Bea
ns,
hari
cot,
drie
d
3206
Bea
ns, s
ugar
, dr
ied
Gro
und
nuts
(pe
anut
s)42
850.
71 to
9.6
4K
uots
u et
al.
(201
4)L
ettu
ce
3.
5 –
also
6.8
to 8
.8
Agg
elid
es e
t al.
(199
9); G
onne
lla
et a
l. (2
003)

112
Con
sum
pti
on r
ecom
men
dat
ion
Dat
abas
e co
dea
Wat
er p
rod
uct
ivit
y (k
g/m
-3)
Ref
eren
ceO
nion
s
3.71
to 7
.33
Imti
yaz
et a
l. (2
000)
Ora
nge-
fles
hed
swee
t pot
atoe
s 37
480.
8 to
2.3
Gom
es a
nd C
arr
(200
3)P
eas
6.
44 to
11.
63W
ang
et a
l. (2
012)
Pot
atoe
s
2.14
to 4
.76
Ahm
adi e
t al.
(201
4)
Pum
pkin
s
4176
Hub
bard
sq
uash
9.
28 to
12.
22 –
als
o 13
.42
to 1
8.58
B
hatt
arai
et a
l. (2
006)
; Fan
dika
(20
11)
4163
Pum
pkin
S
wis
s ch
ard
(wro
ngly
indi
cate
d as
spi
nach
)
4168
1.16
to 3
.55
Imti
yaz
et a
l. (2
000)
Sw
eet p
otat
oes
– se
e or
ange
sw
eet p
otat
oes
0.
8 to
2.3
G
omes
and
Car
r (2
003)
Tom
atoe
s
2.72
to 6
.55
– al
so 1
.43
to 9
.09
(fur
row
vs.
dri
p)Im
tiya
z et
al.
(200
0); I
qbal
et a
l. (2
014)
Zuc
chin
i
22.6
to 2
7.9
– al
so 2
.73
to 4
.02
R
ouph
ael e
t al.
(200
6); R
ouph
ael a
nd C
olla
(2
005)
a
Ref
eren
ce in
Wol
mar
ans
et a
l. 20
10; K
ruge
r et
al.
1998
-
No
data
ava
ilab
le

113
Tab
le 4
6: W
ater
nu
trie
nt
pro
du
ctiv
ity
of t
he
reco
mm
end
ed f
ruit
C
onsu
mp
tion
rec
omm
end
atio
n
Dat
abas
e co
de
Wat
er p
rod
uct
ivit
y (k
g/m
-3)
Ref
eren
ce
App
les
1.
01 to
7.3
2 –
also
17.
44 to
49.
58
Liu
et a
l. (2
012)
; Zeg
be a
nd S
erna
-Pér
ez (
2012
) A
pric
ots
3534
6.
86 to
9.6
2 N
icol
as e
t al.
(200
5)
Avo
cado
s
1.57
to 2
.2
Car
r (2
013)
Ban
anas
4 to
8
Car
r (2
009)
Ber
ries
2.1
to 3
.1 (
blue
ber
ries
) 6.
5 to
25.
6 (s
traw
berr
ies)
G
rant
et a
l. (2
010)
; Kee
n an
d S
lavi
ch (
2012
)
Cit
rus
frui
t
4.0
to 8
.2 –
als
o 0.
93 to
1.2
4 C
onso
lia
et a
l. (2
014)
; Roc
cuzz
o et
al.
(201
4)
Fig
s
-
Loq
uats
35
55
2.24
to 5
.73
Cue
vasa
et a
l. (2
012)
M
ango
es
3556
5.
81 to
7.9
4 D
a S
ilva
et a
l. (2
009)
M
arul
as
-
P
each
es (
oran
ge)
4258
5.
3 to
9.5
– a
lso
1.1
to 2
.48
Gun
duz
et a
l. (2
011)
; Wan
g et
al.
(201
5)
Pap
aya
3563
1.
76 to
4.0
6 M
ella
do-V
azqu
ez e
t al.
(200
5)
Pea
rs
5.
3 to
21.
9 –
also
5.9
1 to
10.
88
Cui
et a
l. (2
009)
; Yin
et a
l. (2
012)
P
inea
pple
s
5 to
12
Car
r (2
012)
P
lum
s
4.2
to 7
.5
Intr
igli
olo
and
Cas
tel (
2010
) S
pans
pek
(can
talo
upe)
10.3
to 2
1.4
Son
g (2
004)
W
ater
mel
on/m
aket
aan
31
.0 to
50.
3 K
aya
et a
l. (2
003)
a
Ref
eren
ce in
Wol
mar
ans
et a
l. 20
10; K
ruge
r et
al.
1998
-
No
data
ava
ilab
le

114
Each member in a household will have nutrient requirements specific to their life stage and it will depend on their level of activity and health status. As pointed out by the Nutrition Information Centre (undated), the results of the National Food Consumption Survey of South African children aged one to nine years old in 1999 showed that a very significant proportion of the country’s population lives under adverse socio-economic conditions and that the dietary intake of micronutrients is poor. The same was found for the households included in these study sites. Therefore, “socio-economic upliftment is considered essential to the sustainable reduction of micronutrient deficiencies and under-nutrition in general. This emphasises the need to include and eat micronutrient-dense food” (Nutrition Information Centre undated).To illustrate the potential of the prioritised crops to provide an adequate portion of key nutrients (vitamin A, zinc and iron), the table below presents the dietary reference intakes for children four to six years old.
Table 47: Dietary reference intakes for children Age Vitamin A (µg RE) Iron (mg) Zinc (mg) Four to six years old 400 10 5 Source: Nutrition Information Centre (undated) It is clear from Figure 8 that only the orange-fleshed vegetables could provide nutrient-dense edible portions of produce. Please note that the nutrient water productivity of beetroot was not available, so no values for the nutrient water productivity for vitamin A in beetroot (roots or leaves) are available for comparison, but it would be expected to be high. It is concerning that very few of the identified crops are able to produce edible food in winter. It is also important to note from the production guidelines in Appendix B that many of these crops will require supplemental water, especially in winter. Another important consideration with regard to children is the acceptability of fruit and vegetables. Children are notoriously fussy eaters. They also eat small portions at a time and require more small meals per day than adults do.

115
Fig
ure
8:
Illu
stra
tion
of
the
nu
trit
ion
al w
ater
qu
alit
y p
er 1
00 g
of
edib
le p
rod
uce
0
0.51
1.52
2.53
3.54
4.5
Amadumbe (S)Paotato (S&W)
Sweet potato (S)Beetroot (S&W)
Tomato (S)Carrots (S&W)
Pumpkin/Butternut (S)Gem squash (S)
Orange-fleshed sweet potato (S)Hubbard squash (S)
Pumpkin (S)Broccoli (S&W)
African leafy vegetables (W&S)Swiss Chard (S&W)
Onion (S&W)Cauliflower (S&W)
Cabbage (S&W)Lettuce (S&W)Cucumber (S)
Eggplant (S)Green beans (S)
Green pepper (S)Peas (S&W)Zucchini (S)
Mango (S)Papaya (S)
Spanspek (S)Watermellon (S)
Avocado (S)Banana (S)
Figs (S)Loquat (S)
Pineapple (S)Bambara groundnut (S)
Cow peas (S)Broadbeans (S)
Harricot beans (S)Sugar Beans (S)
Groundnut (S)
Nut
ritio
nal w
ater
pro
duct
ivity
- Vi
t A (p
er 1
000
RE)
Nut
ritio
nal w
ater
pro
duct
ivity
Iron
(mg)
Nut
riito
nal w
ater
pro
duct
ivity
Zin
c (m
g)
Lege
nd:
S =
Crop
will
pro
duce
edi
ble
food
in su
mm
erW
= C
rop
will
pro
duce
edi
ble
food
in w
inte
r
116
CHAPTER 10: PRIORITISED CROPS TO IMPROVE THE DIETS OF POOR RURAL COMMUNITIES
The purpose of this study was to assess the current rain-fed and irrigated production of food crops and their potential in relation to the food and nutrition requirements of poor rural people to determine crop water use elements for further research. After investigating the production and consumption patterns of rural communities in Ingquza Hill, Jozini, Maruleng and Ratlou, the consumption patterns of the households were analysed and gaps identified. Possible crops that can be produced under rain-fed and irrigated conditions were listed for each site. The limitations of food production in each area were considered. The potential for the production of these crops to sustain annual per capita food consumption was investigated. The water use, yield and good management practices were taken into account in the final list of priority crops. Finally, the findings and priority lists were presented to the communities for validation.
10.1 Priority Crops Identified
The list of priority crops identified for each site is presented in figures 9 to 12. These crops are recommended for production by the communities at Ingquza Hill, Jozini, Maruleng and Ratlou to improve their year-round consumption of diversified diets. Guidelines for production are presented in Appendix B. It is important to note that the categorisation of these crops does not follow the typical food groups set out by Kennedy et al. (2011) and presented in Table 6. The crops have been classified in a way that the research team felt was more relevant for presenting the dietary recommendations to the members of the communities that participated in the survey.

117
Figure 9: Priority crops for Ingquza Hill

118
Figure 10: Priority crops for Jozini

119
Figure 11: Priority crops for Maruleng

120
Figure 12: Priority crops for Ratlou

121
10.2 Validation of the Findings
Four validation workshops (one at each site) were held between 8 and18 February 2016. Some 30 to 40 participants attended the workshop. Participants included community members and farmers who participated in the field research focus groups, community garden organisers (schools and clinics), district agricultural extension workers and rural development workers. The aim of the workshops was to present the research results to the communities for validation and feedback. Varying levels of literacy among the participants necessitated the presentation of numerical, quantitative data in accessible forms. A graphic designer was engaged to prepare a series of posters and brochures, the latter of which could remain with the participants. The four-page brochures contained a simple introduction to the research project, tables presenting data on household dietary diversity, the frequency of food consumption, the seasonal consumption of different food groups, the anthropometry of adult female caregivers and children, the key nutrition findings and the prioritised list of recommended rain-fed and irrigated crops for summer and winter. Brochures were handed to each participant and the findings and recommendations were orally presented to the participants through interpreters in the local language. After a brief presentation, the participants were divided into groups to discuss the findings among themselves for 15 minutes. The groups were divided into farmers/growers, garden project workers and extension/rural development workers to capture different perspectives on the research findings. Each group presented a summary of the discussion in a plenary. The discussion questions given to the groups were the following:
• Is the information supplied in this brochure an accurate depiction of the situation or context in the community?
• Are there foods on the recommended list for growing and eating that the community would not grow for reasons of preference, taste or culture?
• Are there foods on the recommended list for growing and eating that the community would not grow for reasons related to agronomic factors? What are these factors?
• If they could tell the WRC what to prioritise for research (for example, varieties, crops, practices, water-related applications), what would it be?
• Have we missed anything? All the participants were delighted that the research team had honoured their word to return to present the findings of the study. They expressed appreciation for the brochures and found them useful.

122
Overall, the respondents at each site concurred with the findings of the study. They stated that diverse diets were not affordable. There were no reasons presented for why preference, culture and taste would constrain the consumption of the recommended crops. There was wide acknowledgement that purchased ‘modern’ foods make people obese and unhealthier than they were in the past. However, the lack of water was highlighted in each discussion as the major limitation to producing the prioritised crops. Even where the agronomic literature consulted indicated that the crop could be produced under rain-fed conditions at that site, the communities did not agree that this was possible. Most participants indicated that many of these foods had been produced in the past, but the current climatic conditions and a lack of water were not conducive conditions for production. Given that the validation sessions were conducted during one of the worst droughts on record in the country, one could expect that the lack of water would be a crucial point of discussion. However, the topic of climate change also emerged repeatedly in the initial FGDs. Respondents suggested that the WRC’s future research should focus on access to water and adapting farming methods to climate change.

123
CHAPTER 11: CONCLUSIONS AND RECOMMENDATIONS
This unique study drew on a transdisciplinary research approach to investigate the consumption and production patterns of rural households in communities in four selected sites in the poorest local municipalities in South Africa. The food security of the households was assessed using the anthropometry of children between 24 and 59 months and their female caregivers, food consumption frequencies and the diversity of their diets. Qualitative and quantitative data related to production and consumption was used to identify which crops could improve the dietary diversity and nutrition of these households and compare the nutritional status, dietary diversity and food consumption patterns of households that are engaged in rain-fed and irrigated crop production with that of households that are not engaged in crop production. The agronomic conditions in the four sites were examined and crops that could grow in these areas were identified. The food consumption gaps and potential crops were prioritised in terms of which crops could be grown to improve the diets in each site. These were validated by presenting the findings and recommendations to the communities in Ingquza Hill, Jozini, Maruleng and Ratlou.
11.1 Study Conclusions
It is clear from the study that most households are food insecure, with inadequate food available to meet the requirements for a diversified diet. Roughly one in four households reported experiencing hunger for most months of the year, but the majority of households (more than one in three) reported experiencing hunger in January. In terms of food availability, it seemed that most households were able to purchase enough of the staple maize meal consumed daily by all households. Relatively few young children and their female caregivers were underweight, but there is substantial evidence of extensive hidden hunger. A high proportion of female caregivers were overweight and obese, which suggested that sufficient dietary energy in the form of the staple food – refined, purchased white maize – is available to most households. The high levels of stunting indicate that the children included in the survey have experienced growth faltering early in their lives. What is of concern, however, is how many of these stunted children were also overweight. The largely maize-based diet is likely to be the underlying reason for both growth faltering in children and overweight in women. The daily consumption of a variety of fruit and vegetables is essential for good nutrition, human productivity and child development. Hidden hunger is characterised by inadequate dietary diversity and micronutrient deficiencies. Although the researchers did not conduct a clinical test to confirm this, the lack of dietary diversity and daily consumption of foods from multiple food groups is indicative of an inadequate diet. The lack of availability of the fruit and vegetables that are essential for good nutrition is of concern. Very few households consume an adequate diversity of fruit and vegetables on a daily basis. Seasonality affects the availability of fresh fruit and vegetables, which reduces the availability of these foods in winter. A lack of water constrained the production of many nutritious crops, and participants

124
in FGDs reported that drought and climate change have reduced opportunities for diversifying production and the availability of wild foods. Access to a diversified diet is problematic for households in these communities. Households reported that a diverse diet was unaffordable. Jozini (where dietary diversity was higher) was an exception, because households consumed foods from an average of four food groups each day. The typical diet consisted of maize meal with sugar. Where incomes permitted and production provided ingredients, a relish of onion and tomato or cabbage was added to one meal per day. The dietary assessment indicated that there is a dire need to strengthen the existing good consumption patterns related to the consumption of diverse diets in these communities and to promote and encourage the consumption of more diverse diets daily. It is particularly important that these communities regularly consume foods from the following food groups:
• Dark green leafy vegetables such as beans, broccoli, the leaves of beetroot, cowpeas, pumpkin, sweet potatoes and Swiss chard, as well as African green leafy vegetables, such as blackjack, cat’s whiskers, amaranth, lamb quarters, nettle, nightshade and sow thistle
• Other vegetables such as cabbage, cauliflower, cucumber, eggplant (brinjal), gem squash, ‘calabash’ or other squash, green beans, green peppers, lettuce, peas, onions and zucchini (baby marrow)
• Orange- and red-fleshed vegetables such as beetroot, carrots, dark orange pumpkin, butternut or squash, as well as orange-fleshed sweet potatoes and tomatoes
• Legumes such as Bambara groundnuts, cowpeas, dhal, dry beans and ground nuts (peanuts)
• Roots and tubers such as amadumbe, potatoes and sweet potatoes
• Orange- and red-coloured fruit such as citrus fruit, mango, papaya, pineapple, cantaloupe and watermelon or makataan
• Other fruit including avocadoes, banana, figs, loquats and marulas
An encouraging number of households were engaged in agriculture in Ingquza Hill, Jozini and Maruleng. It was also encouraging to note how many households were keen to engage in agriculture and produce a wider range of crops. A very small number of households engaged in agriculture in Ratlou due to the aridity of the area. The study found an encouraging link between engaging in agriculture and diet. Engagement in crop production increased the availability of vegetables and, in some cases, fruit (when in season). This improved households’ dietary diversity and children’s anthropometry scores. Income from farmland production and irrigated agriculture led to increased intakes of fruit and vegetables in general, but also meat, eggs, fish, milk, roots and tubers. A number of fruit and vegetable crops can be produced in these communities. However, the number of crops

125
that will produce edible food in winter is severely constrained. In the areas with higher rainfall (Ingquza Hill, Jozini and Maruleng), a number of these crops can be produced under rain-fed conditions under normal climatic conditions. However, communities reported that this is not possible under the prevailing conditions of drought. Access to irrigation is necessary to overcome constraints, reduce the risk of crop failure and improve yields. The nutrient water productivity of the prioritised crops shows that a number of nutrient-dense crops can be grown in the four communities. However, it demonstrates the need to regularly combine a variety of fruit and vegetables in the diet to ensure that household members consume the essential nutrients. Again, the number of crops with high nutrient water productivity that will produce edible portions of food in winter is very low. Most crops that will produce nutritious fresh vegetables in winter require irrigation. Irrigating crops had a clear benefit in terms of providing a more diverse diet – not only in terms of available fresh produce, but possibly also through the sale of produce. Irrigation offers the potential of extending the availability of fresh produce.
11.2 Recommendations for Priority Crops to Improve the Diet of Poor Rural Communities throughout the Year
The following investigation of the consumption and production patterns of poor rural communities in four of the poorest communities in South Africa shows that diets lack diversity and do not include the essential fruit and vegetables that are necessary for ensuring good nutrition, productivity and child development. The following crops should be prioritised to strengthen existing positive consumption patterns and promote greater dietary diversity:
• Dark green leafy vegetables such as beans, broccoli, the leaves of beetroot, cowpeas, pumpkin, sweet potatoes and Swiss chard, as well as African leafy vegetables, such as blackjack, cat’s whiskers, amaranth, lambquarters, nettle, nightshade and sow thistle
• Other vegetables such as cabbage, cauliflower, cucumber, eggplant (brinjal), gem squash, ‘calabash’ or other squash, green beans, green peppers, lettuce, peas, onions and zucchini (baby marrow)
• Orange-fleshed vegetables such as beetroot, carrots, dark orange pumpkin, butternut or squash, orange-fleshed sweet potatoes and tomatoes
• Legumes such as Bambara groundnuts, cowpeas, dhal, dry beans and ground nuts (peanuts)
• Roots and tubers such as amadumbe, potatoes and sweet potatoes
• Orange-coloured fruit such as citrus fruit, mango, papaya, pineapple, cantaloupe and watermelon/makataan
• Other fruit, including avocados, banana, figs, loquats and marulas
In theory, many of these crops can be grown in Ingquza Hill, Jozini and Maruleng under rain-fed conditions. Yet, community consultations reveal that many of these crops will not grow under the prevailing climatic conditions of drought, weather uncertainty and climate change.

126
Very few of these crops will produce edible portions of food in winter. Many require supplemental irrigation. Therefore, research is needed to investigate the impact of climate change on growing patterns to advise on adaptations to production techniques, irrigation practices, production timing and the potential for the development of early- and late-maturing crops to extend the growing season and make food from own production available for longer periods. The biofortification of crops could increase the nutrient density of micronutrients. Usually, biofortification focuses on increasing the availability of a single nutrient per crop, but research should investigate the amplification of multiple nutrients in foods that could be considered dual crops, such as beetroot, or where the nutrient water productivity of more than one nutrient could be enhanced (such as vitamin A, iron and zinc in carrots). Dual crops are crops where more than one part of the plant is nutrient-dense, such as the leaves, roots, fruit or seeds. It is clear from the research that many households engage in home production. Therefore, technologies and practices that are appropriate to these conditions (including pest and disease management) should be prioritised. Water harvesting practices and systems for the delivery of water to gardens to reduce the drudgery for women are essential to enable food production in more homes. The provision of boreholes and piped water is essential in drier areas such as Ratlou, although production in such areas will always require extensive amounts of water.
11.3 Recommendations for Research
This study highlights a number of priority research areas that the WRC could pursue. The first of these is research related to the production of nutrient-dense crops that can strengthen and support households’ diet all year round under rain-fed and irrigated conditions, as set out above. The anthropometric and dietary diversity data, particularly the seasonal aspects of the latter, strongly suggests that the addition of more nutritious foods to regular household consumption, year-round, could enhance the accessibility, availability and stability of household food security. The inclusion of more ‘traditional’ crops, such as the African leafy vegetables and indigenous melons, might restore some of the social embeddedness of food, that is, the knowledge of production and preparation that is in danger of being lost, and which the communities all associate with better health and nutrition. The second priority area for research relates to water harvesting and irrigation technologies to enable and encourage the production of crops with high nutrient water productivity and that can reduce the labour drudgery for women in particular. In all the communities, there is the potential to enhance household and smallholder irrigation. In some cases, this poses technical obstacles, for example in the arid Ratlou site. In others, the obstacles could be purely financial, for example in Maruleng, where a partly functioning irrigation system is in need of repair and maintenance in order to serve a wider community. More problematic is the scenario of Jozini, where the vast potential of the beleaguered Mjindi irrigation scheme seems embroiled in conflicting commercial interests, managerial incompetence and stakeholder
127
inequality. Ingquza Hill poses greater challenges. Farming has undergone a drastic transformation from what was once the highly productive, rain-fed terrace farming of staples and livestock to small, fenced, home gardens that rely on rainfall or arduous manual irrigation. Significant investments in infrastructure might be necessary to make use of the relatively abundant river water in such a hilly, rugged topography. The third priority relates to the biofortification of crops to improve the nutrient water productivity of more than one nutrient per crop. There was widespread sentiment among small producers and home gardeners that agricultural inputs and extension services are inaccessible or simply inappropriate. In several communities, farmers spoke about the inappropriateness of trying to adapt the commercial crop inputs available through commercial channels to local conditions. Reports of indebtedness and crop failure were common. Smallholder producers in the study sites demonstrated the will and energy to adapt their methods to changing conditions, for example through the conservation of local and more drought-resistant crops. There is significant interest among farmers in knowledge sharing and farmer-to-farmer exchanges to this effect, and it would be timely to take an inventory of these practices and explore the potential for the dissemination of these practices.
11.4 Dissemination of the Findings
The findings of this study have been shared with the communities that participated in the surveys and FGDs. The brochures found in Appendix D were prepared for validation workshops in each community and were very well received by the communities. The brochures show the findings specific to each community and present the prioritised list of crops to improve diets. The research team has developed a digital application of this, which can be downloaded on a seven-inch tablet from https://www.dropbox.com/sh/ vivzn5r0d9jiqev/AABSXvIdpcmfkxFlhjFrX74Ca?dl=0. This digital tool provides community members with the opportunity to identify which crops can be produced in their area under rain-fed and irrigated conditions, and provides production guidelines for each crop. The project leader used the data from the study as part of a practical for a masters degree module at the University of Pretoria in 2014. The module, LEK834, trains students to measure and monitor food security. As part of the practical component, each of the students in the class calculated one food security indicator from the Eastern Cape dataset. They discussed their findings with a meeting of the South African Vulnerability Assessment Committee Technical Task Team in November 2014, providing input into the selection of indicators for the development of the South African National Food Security Information System. This was a great learning opportunity for the task team and the students. The paper (Hendriks et al. 2016) was published in March 2016. It received very positive feedback from the reviewers of the Journal of the Ecology of Food and Nutrition. The paper provides recommendations for the South African Vulnerability Assessment Committee Technical Task Team regarding the choice of indicators for the development of the South African National Food Security Information System.

128
Further dissemination activities include a public presentation of the results, the preparation and dissemination of the brochures and research briefs in the local languages of the four communities included in the study, the preparation of further research papers for journals, and the development of a web page on which to load the brochures and provide a link to the mobile application. Details of the capacity development component of this project are set out in Appendix E.

129
References
Abd El-Mageeda TA and Semidab WM (2015a). Organo mineral fertilizer can mitigate water stress for cucumber production (Cucumis sativis L.). Agricultural Water Management, 159, 1-10.
Abd El-Mageed TA and Semida WM (2015b). Effect of deficit irrigation and growing seasons on plant water status, fruit yield and water use efficiency of squash under saline soil. Scientia Horticulturae, 186, 89-100.
Abdu-Raheem KA and Worth SH (2011). Household food security in South Africa: evaluating extension’s paradigm relative to the current food security and development goals. South African. Journal of Agricultural Extension, 39(2), 91-103.
Aggelides S, Assimakopoulos I, Kerkides P and Skondras A (1999). Effects of soil water potential on the nitrate content and the yield of lettuce. Communications in Soil Science and Plant Analysis, 30, 235-243.
Ahmadi SH, Agharezaee M, Kamgar-Haghighi AA and Sepaskhah AR (2014). Effects of dynamic and static deficit and partial root zone drying irrigation strategies on yield, tuber sizes distribution, and water productivity of two field grown potato cultivars. Agricultural Water Management, 134, 126-136.
Aliber M and Hart TG, 2009, Should subsistence agriculture be supported as a strategy to address rural food insecurity? Agrekon, 48(4), 434-58.
Amiri E, Gohari AA and Esmailian Y (2012). Effect of irrigation and nitrogen on yield, yield components and water use efficiency of eggplant. African Journal of Biotechnology, 11, 3070-3079.
ANC (African National Congress) (2014). Key commitments to move South Africa forward. 2014 Election Manifesto. Marshalltown. http://www.anc.org.za/2014/wp-content/themes/anc/downloads/Manifesto_Booklet.pdf. Accessed 24 September 2014.
Armstrong MEG, Lambert MI, Sharwood K and Lambert EV (2006). Obesity and overweight in South African primary school children – the Health of the Nation Study. Journal of Endocrinology, Metabolism and Diabetes of South Africa, 11(2), 52-63.
Bähre E (2011). Liberation and redistribution: social grants, commercial insurance, and religious riches in South Africa. Comparative Studies in Society and History, 53(02), 371-92.
Ballard T, Coates J, Swindale A and Deitchler M (2011). Household hunger scale: indicator definition and measurement guide. Washington, DC: Food and Nutrition Technical Assistance II Project (FANTA).
Battersby J (2011). Urban food insecurity in Cape Town, South Africa: an alternative approach to food access. Development Southern Africa, 28(4), 545-561.
Bell-Sheeter A (2004). Food Sovereignty Assessment Tool. Fredericksburg, First Nations Development Institute.
Bilinsky P and Swindale A (2010). Months of adequate household food provisioning (MAHFP) for measurement of household food access: indicator guide. Version 4. Washington, DC: Food and Nutrition Technical Assistance II Project (FANTA).

130
Bhattarai SP, Midmore, DJ and Pendergast L (2006). Yield, water-use efficiency and root distribution of soybean, chickpea and pumpkin under different subsurface drip irrigation depths and oxygation treatments in vertisols. Irrigation Science, 26, 439-450.
Bozkurt S, Uygur V, Agca N and Yalcin M (2011). Yield responses of cauliflower (Brassica oleracea L. var. botrytis) to different water and nitrogen levels in a Mediterranean coastal area. Acta Agriculturae Scandinavica Section B Soil and Plant Science, 61, 183-194.
Carr MKV (2009). The water relations and irrigation requirements of banana (Musa spp.). Experimental Agriculture, 45, 333-371.
Carr MKV (2012). The water relations and irrigation requirements of pineapple (Ananas comosus var comosus): a review. Experimental Agriculture, 48, 488-501.
Carr MKV (2013). The water relations and irrigation requirements of avocado (Persea americana Mill.). Experimental Agriculture, 49, 256-278.
Collett A and Lindermann H (2008). GIS and agricultural natural resources. Ecological Circuits – Issue 1/2008. http://www.ee.co.za/article/ecological-circuits-issue-1.html. Accessed 14 February 2016.
Consolia S, Stagnoa F, Roccuzzob G, Cirellia GL and Intrigliolo F (2014). Sustainable management of limited water resources in a young orange orchard. Agriculture Water Management, 132, 60-68.
Cuevasa J, Pinillosa V, Cañetea ML, Parrab S, Gonzálezc M, Alonsoa F, Fernándezc MD and Huesoc JJ (2012). Optimal duration of irrigation withholding to promote early bloom and harvest in ‘Algerie’ loquat (Eriobotrya japonica Lindl.). Agriculture Water Management, 111, 79-86.
Cui N, Du T, Kang S, Li F, Hu X, Wang H and Li Z (2009). Relationship between stable carbon isotope discrimination and water use efficiency under regulated deficit irrigation of pear-jujube tree. Agriculture Water Management, 96, 1615-1622.
Da Silva VDuP, Da Cunha Campos JHB and De Azevedo PV (2009). Water-use efficiency and evapotranspiration of mango orchard grown in northeastern region of Brazil. Scientia Horticulturae, 120, 467-472.
Day C, Barron P, Massyn N, Padarath A and English R (2012). The District Health Barometer 2010/2011. Durban: Health Systems Trust.
http://www.hst.org.za/sites/default/files/DHB%202010-11lowres.pdf. Accessed 12 February 2016.
DoH (Department of Health) (2012). Strategic Plan for Maternal, Newborn, Child and Women’s Health (MNCWH) and Nutrition in South Africa 2010 -2016. Pretoria: Department of Health. https://extranet.who.int/nutrition/gina/sites/default/files/ ZAF%202012%20MNCWHstratplan.pdf. Accessed 26 November 2015.
Dorrington R, Bradshaw D, Laubscher R and Nannan N (2014). Rapid Mortality Surveillance Report 2013. Cape Town: Burden of Disease Research Unit Medical Research Council.

131
DPME (Department of Planning, Monitoring and Evaluation) (2014). The Medium-Term Strategic Framework (MTSF) 2014/2015. Pretoria: DPME, Office of the Presidency.
DSD (Department for Social Development) (2014). A statistical summary of social grants in South Africa Fact Sheet: Issue no 5 of 2014 – 31 May 2014. http://www.sassa.gov.za/ index.php/knowledge-centre/statistical-reports?download=233:statistical-report-5-of-2014. Accessed 12 February 2016.
Efetha A, Harms T and Bandar M (2011). Irrigation management practices for maximizing seed yield and water use efficiency of Othello dry bean (Phaseolus vulgaris L.) in southern Alberta, Canada. Irrigation Science, 29, 103-113.
Erdem T, Erdem Y, Okursoy K, Hüseyin GT and Levent A (2010). Yield and quality response of drip-irrigated broccoli (Brassica oleracea L. var. italica) under different irrigation regimes, nitrogen applications and cultivation periods. Agriculture Water Management, 97, 681-688.
Faber M, Witten C and Drimie S (2011). Community-based agricultural interventions in the context of food and nutrition security in South Africa. South African Journal of Clinical Nutrition, 24(1), 21-30.
Fandika IR, Kemp PD, Milner JP and Horne DJ (2011). Yield and water uses efficiency in buttercup squash (Cucurbita maxima Dushense) and heritage pumpkin (Cucurtiba pepo Linn). Australian Journal of Crop Science, 5, 742-747.
FAO (Food and Agriculture Organisation) (1996). Rome declaration on world food security. World Food Summit.13-17 November. Rome: FAO.
FAO (Food and Agriculture Organisation) (undated). Obesity and the nutrition transition. http://www.fao.org/focus/e/obesity/obes2.htm. Accessed 25 February 2016.
Gomes F and Carr MKV (2003). Effects of water availability and vine harvesting frequency on the productivity of sweet potato in Southern Mozambique: crop yield/water-use response functions. Experimental Agriculture, 39, 409-421.
Gonnella M, Serio F, Conversa G and Santamaria P (2003). Yield and quality of lettuce grown in floating system using different sowing density and plant spatial arrangements. Proceedings of the 6th International Society for Humor Studies (ISHS) on Protected Cultivation. Acta Horticulturea, 614, 687-692.
Grant OM, Johnson AW, Davies MJ, James CM and Simpson DW (2010). Physiological and morphological diversity of cultivated strawberry (Fragaria × ananassa) in response to water deficit. Environmental and Experimental Botany, 68, 264-272.
Gunduz M, Korkmaz N, Asik S, Unal HB and Avci M (2011). Effects of various irrigation regimes on soil water balance, yield and fruit quality of drip-irrigated peach trees. Journal of Irrigation and Drainage Engineering, 10.1061/(ASCE)IR.1943-4774.0000310, 426-434.
Harmse (2010) Node selection for the Integrated Sustainable Rural Development Programme in South Africa. Development Southern Africa, 27(3), 429-445.
Hendriks SL (2013). South Africa’s national development plan and new growth path: reflections on policy contradictions and implications for food security. Agrekon, 52(3), 1-17.

132
Hendriks SL (2014). Food security in South Africa: status quo and policy imperatives. Agrekon, 53(2), 1-24.
Hendriks SL (2015). The food security continuum: a novel tool for understanding food insecurity as a range of experiences. Food Security, 7(3): 609-619. http://www.springer.com/-/0/185029c009ab436c8717ac6b9bed22c7. Accessed 14 February 2016.
Hendriks SL, Olivier NJJ and Schönfeldt HC (2016). The State of Food Insecurity in South Africa. Unpublished report. Institute for Food, Nutrition and Well-being. Pretoria: University of Pretoria.
Holistic Education Network of Tasmania, Australia (2011). Transdisciplinary inquiry incorporating holistic principles. http://www.hent.org/transdisciplinary.htm. Accessed 6 June 2015.
HSRC (Human Sciences Research Council) (2008). South African Social Attitudes Survey (SASAS). Pretoria: HSRC.
IBM Corporation (2014). IBM SPSS statistics for Windows, Version 23.0. Armonk, NY: IBM Corporation.
Igumbor EU, Sanders D, Puoane TR, Tsolekile L, Schwarz C, Purdy C, Swart R, Durão S and Hawkes C (2012). Big food, the consumer food environment, health and the policy response in South Africa. PLoS Medicine, 9(7), 866.
Imtiyaz M, Mgadla NP, Chepete B and Manase SK (2000). Response of six vegetable crops to irrigation schedules. Agriculture Water Management, 45, 331-342.
Ingquza Hill Local Municipality (2016). Situational analysis. http://www.ihlm.gov.za/about-us/situational-analysis/environment/. Accessed 28 February 2016.
Ingquza Hill Local Municipality (2014). Integrated Development Plan: 2013/2014. http://www.ihlm.gov.za/documents/integrated-development-plan-idp/. Accessed 22 February 2016.
Intrigliolo DS and Castel JR (2010). Response of plum trees to deficit irrigation under two crop levels: tree growth, yield and fruit quality. Irrigation Science, 28, 525-534.
Iqbal M, Hassan Sahi F, Hussain T, Khan Aadal N, Azeem MT and Tariq M (2014). Evaluation of comparative water use efficiency of furrow and drip irrigation systems for off-season vegetables under a plastic tunnel. International Journal for Agricultural Crop Science, 7, 185-190.
Jozini Local Municipality (2012). Jozini Local Municipality. http://www.localgovernment.co.za/features/view/34. Accessed 14 February 2013.
Jozini Local Municipality (2013). Integrated Development Plan 2012/2013 to 2016/2017. Jozini: Jozini Local Municipality. http://www.jozini.org.za/index.php?option=com_content&view=featured&Itemid=101. Accessed 28 February 2016.
Kadyampakeni DM (2013). Comparative response of cabbage to irrigation in Southern Malawi. Journal of Agricultural Science, 5, 1-8.

133
Karunaratnea AS, Walker S and Azam-Alia SN (2015). Assessing the productivity and resource-use efficiency of underutilised crops: towards an integrative system. Agriculture Water Management, 147, 129-134.
Kaya C, Higgs D, Kirnak H and Tas I (2003). Mycorrhizal colonisation improves fruit yield and water use efficiency in watermelon (Citrullus lanatus Thunb.) grown under well-watered and water-stressed conditions. Plant and Soil, 253, 287-292.
Keen B and Slavich P (2012). Comparison of irrigation scheduling strategies for achieving water use efficiency in highbush blueberry. New Zealand Journal of Crop and Horticultural Science, 40, 3-20.
Kennedy G, Ballard T and Dop MC (2011). Guidelines for measuring household and individual dietary diversity (ver 4). Rome: FAO.
Köksal ES, Kara T, Apan M, Üstün H and lbeyi AI (2008). Estimation of green bean yield, water deficiency and productivity using spectral indexes during the growing season. Irrigation and Drainage Systems, 22, 209-222.
Kruger M, Sayed N, Langenhoven M and Holing F (1998). Composition of South African foods: vegetables and fruit. Cape Town: South African Medical Research Council.
Kuotsu K, Das A, Lal R, Munda GC, Ghosh PK and Ngacha SV (2014). Land forming and tillage effects on soil properties and productivity of rain-fed groundnut (Arachis hypogaea L.) – rapeseed (Brassica campestris L.) cropping system in northeastern India. Soil and Tillage Research, 142, 15-24.
KwaZulu-Natal Department for Agriculture and Environmental Affairs (2013). Bioresource information: Jozini. Pietermaritzburg: KwaZulu-Natal Department for Agriculture and Environmental Affairs.
Labadarios D (2000). The National Food Consumption Survey (NFCS): Children aged 1-9 years, South Africa, 1999. Stellenbosch Directorate. Stellenbosch: National Department of Health, National Food Consumption Survey Consortium.
Labadarios D, Mchiza ZJR, Steyn NP, Gericke G, Maunder EMW, Davids YD and Parker W (2011). Food security in South Africa: a review of national surveys. Bulletin of the World Health Organization, 89(12), 891-899.
Labadarios D and Nel HH (2000). Anthropometric status. In: Labadarios D (ed.). The National Food Consumption Survey (NFCS): Children aged 1-9 years, South Africa, 1999. Stellenbosch: The National Food Consumption Survey (NFCS).
Labadarios D, Swart R, Maunder EMW, Kruger HS, Gericke GJ, Kuzwayo PMN (2008). Executive summary of the National Food Consumption Survey Fortification Baseline (NFCS-FB-I) SA, 2005. South African Journal Clinical Nutrition, 21(2), 247-300.
Lang DJ, Wiek A, Bergmann M, Stauffacher M, Martens P, Moll P, Swilling M and Thomas CJ (2012). Transdisciplinary research in sustainability science: practice, principles, and challenges. Sustainable Science 7, 1, 25-43.
Liu B, Cheng L, Ma F, Zou Y and Liang D (2012). Growth, biomass allocation, and water use efficiency of 31 apple cultivars grown under two water regimes. Agroforestry Systems, 84, 117-129.

134
Lopez-Urrea R, Montoro A, Lopez-Fuster P and Fereres E (2009). Evapotranspiration and responses to irrigation of broccoli. Agriculture Water Management, 96, 1155-1161.
Mabhaudhi T, Modi AT and Beletse YG (2013a). Response of taro (Colocasia esculenta L. Schott) landraces to varying water regimes under a rainshelter. Agricultural Water Management, 102-112.
Mabhaudhi T, Modi AT and Beletse YG (2013b). Growth, phenological and yield responses of a bambara groundnut (Vigna subterranea L. Verdc) landrace to imposed water stress: II. Rain shelter conditions. Water SA, 39(2), 191-198.
Manjunatha MV, Rajkumar GR, Hebbara M and Ravishankar G (2004). Effect of drip and surface irrigation on yield and water-production efficiency of brinjal (Solanum melongena) in saline vertisols. Indian Journal of Agricultural Sciences, 74, 583-587.
Maruleng Local Municipality (2012). Maruleng Local Municipality Integrated Development Plan 2012-2017. http://www.hoedspruit.co.za/Maruleng%20DRAFT%20IDP% 202012-2017.pdf. Accessed 15 January 2013.
Maruleng Local Municipality (undated). Integrated Development Plan, 2013/2014. http://www.maruleng.gov.za/docs/IDP%202010-15.pdf. Accessed 22 February 2016.
Mellado-Vazquez A, Volke-Haller V, Tapia-Vargas M, Sanchez-Garcia P and Quevedo-Nolasco A (2005). Response of papaya to irrigation and N-P-K fertilization in a Vertisol. Terra: Organo Cientifico de la Sociedad Mexicana de la Ciencia del Suelo, 1, 137-144.
NDA (National Department of Agriculture) (2007). Food insecurity in uMkhanyakude. Food Insecurity Vulnerability Mapping System (FIVIMS): Pretoria: NDA.
Neves D and du Toit A (2013). Rural livelihoods in south Africa: complexity, vulnerability and differentiation, Journal of Agrarian Change, 13(1), pp. 93-115.
Nicolas E, Torrecillas A, Dell'Amico J and Alarcon JJ (2005). Sap flow, gas sechange, and hydraulic conductance of young apricot trees growing under a shading net and different water supplies. Journal of Plant Physiology, 162, 439-447.
NPC (National Planning Commission) (2012). National Development Plan. Pretoria: National Planning Commission, Office of the Presidency.
Nutrition Information Centre (undated). Feeding children 4-6 years. Nutrition Information Centre, University of Stellenbosch, Stellenbosch.
O'Laughlin B, Bernstein H, Cousins B and Peters PE (2013). Introduction: agrarian change, rural poverty and land reform in South Africa since 1994. Journal of Agrarian Change, 13(1), 1-15.
OR Tambo District Municipality (undated). IDP 2010/2011 Review. Lusikisiki: OR Tambo District Municipality. http://www.ecsecc.org/files/library/documents/ JOE_GQABI_DISTRICT_MUNICIPALITY_IDP_2010.pdf. Accessed 28 February 2016.
Popkin BM, Adair LS and Ng SW (2012). Global nutrition transition and the pandemic of obesity in developing countries. Nutrition reviews, 70(1), 3-21.
Quin PJ (1959). Foods and feeding habits of the Pedi. Johannesburg: Witwatersrand University Press.

135
Rahil MH and Qanadillo A (2015). Effects of different irrigation regimes on yield and water use efficiency of cucumber crop. Agriculture Water Management, 148, 10-15.
Ratlou Local Municipality (2010). Ratlou Local Economic Development Plan 2012-2017. http://www.ratlou.gov.za/plans. Accessed 15 February 2015.
Regeer B and Bunders J (2008). Knowledge co-creation: interaction between science and society. Den Haag: Advisory Council for Spatial Planning, Nature and the Environment. http://www.treccafrica.com/assets/Bunders%20and%20Regeer%20 (2009)%20Knowledge%20Co-Creation.pdf. Accessed 24 February 2016.
RSA (Republic of South Africa) (1996). The Bill of Rights of the Constitution of the Republic of South Africa, Government Gazette, (No. 17678). Pretoria: RSA.
RSA (Republic of South Africa) (2014). National Policy on Food and Nutrition Security, Government Gazette, 590(37915), 25-44. Pretoria: RSA.
Roccuzzo G, Villalobos FJ, Testi L and Fereres E (2014). Effects of water deficits on whole tree water use efficiency of orange. Agriculture Water Management, 140, 61-68.
Rouphael Y, Cardarelli M, Rea E, Battistelli A and Colla G (2006). Comparison of the subirrigation and drip-irrigation systems for greenhouse zucchini squash production using saline and non-saline nutrient solutions. Agriculture Water Management, 82, 99-117.
Rouphael Y and Colla G (2005). Radiation and water use efficiencies of greenhouse zucchini squash in relation to different climate parameters. European Journal of Agronomy, 23, 183-194.
Sarkar S, Nanda MK, Biswas M, Mukherjee A and Kundu M (2009). Different indices to characterise water use pattern of irrigated cauliflower (Brassica oleracea L. var. botrytis) in a hot subhumid climate of India. Agriculture Water Management, 96, 1475-1482.
Sharma SP, Brar JS, Sidhu BS and Sekhon KS (2008). Yield response of carrot to various moisture regimes in conjunction with N and K fertilization in South-Western Punjab. Environment and Ecology, 26, 2195-2198.
Shisana O, Labadarious D, Rehle T, Simbayi L, Zuma K, Dhansay A, Reddy P, Parker W, Hoosain E, Naidoo P, Hongoro C, Mchiza Z, Steyn NP, Dwane N, Makoae M, Maluleke T, Ramlagan S, Zungu N, Evans MG, Jacobs L, Faber M and SANHANES-1 Team (2013). South African National Health and Nutrition Examination Survey (SANHANES-1). Cape Town: HSRC Press. http://www.hsrc.ac.za/uploads/ pageContent/3893/SANHANES-launch%20edition%20(online%20version).pdf. Accessed 3 March 2015.
Song I (2004). Subsurface drip irrigation with wastewater and the effects of environmental factors on virus survival in soil. Dissertation, University of Arizona.
Stadlmayr B, Charrrondiere UR, Addy P, Samb B, Enujiugha VN, Bayili RG, Fagbohoun EG, Smith IF, Thiam I and Burlingame B (2010). Composition of selected foods from West Africa. Rome: FAO.
Stats SA (Statistics South Africa) (2003). Sampling methodology for economic statistics. Pretoria: Statistics South Africa.
136
Stats SA (Statistics South Africa) (2014a). Millennium Development Report 2014. Pretoria: Stats SA.
Stats SA (Statistics South Africa) (2014b). General Household Survey 2013. Statistical release P0318. Pretoria: Stats SA.
Stats SA (Statistics South Africa) (2015a). MDG Report 2015, South Africa. Pretoria: StatsSA. http://www.statssa.gov.za/MDG/MDG_Country%20 Report_Final30Sep2015.pdf. Accessed 26 November 2015.
Stats SA (Statistics South Africa) (2015b). General Household Survey 2014. Pretoria: Stats SA. http://www.statssa.gov.za/publications/P0318/P03182014.pdf. Accessed 22 February 2016.
Stats SA (Statistics South Africa) (2016). Quest for nodal development: evidence from Census 2001 and Census 2011/Statistics South Africa. Pretoria: Stats SA.
Stats SA (Statistics South Africa) (undated a). Ingquza Hill Local Municipality. http://www.statssa.gov.za/?page_id=993&id=ngquza-hill-municipality. Accessed 14 February 2016.
Stats SA (Statistics South Africa) (undated b). Jozini Local Municipality. http://beta2.statssa.gov.za/?page_id=993&id=jozini-municipality. Accessed 14 February 2016.
Stats SA (Statistics South Africa) (undated c). Maruleng Local Municipality. http://www.statssa.gov.za/?page_id=993&id=maruleng-municipality. Accessed 14 February 2016.
Stats SA (Statistics South Africa) (undated d). Ratlou Local Municipality. http://www.statssa.gov.za/?page_id=993&id=ratlou-municipality. Accessed 14 February 2016.
Temple NJ, Steyn NP, Fourie J and de Villiers A (2011). Price and availability of healthy food: a study in rural South Africa, Nutrition, 27(1), pp. 55-8.
UMkanyakude District Municipality (2014). Integrated Development Plan. 3rd generation: 2013/2014. KwaZulu-Natal: Mkhuze.
Wang H, Wang C, Zhaoa X and Wang F (2015). Mulching increases water-use efficiency of peach production on the rain-fed semiarid Loess Plateau of China. Agriculture Water Management, 154, 20-28.
Wang X, Gana Y, Hamela C, Lemkeb R and McDonald C (2012). Water use profiles across the rooting zones of various pulse crops. Field Crops Research, 134, 130-137.
Wenhold F, Annandale J, Faber M and Hart T (2012). Water use and nutrient content of crops and animal food products for improved household food security: a scoping study. WRC Report No. TT 537/12. Water Research Commission, Pretoria.
WHO (World Health Organisation) (2011a). Global Status Report on Non-communicable Diseases 2010. Rome: WHO.
WHO (World Health Organisation) (2011b). Anthro for personal computers: software for assessing growth and development of the world’s children. Version 3.2.2. Geneva: WHO.

137
WFP (World Food Programme) (2008). Food consumption analysis: calculation and use of the food consumption score in food security analysis. Rome: WFP.
Wolmarans P, Danster N, Dalton A, Rossouw K and Schönfeldt HC, eds. (2010). Condensed food composition tables for South Africa. Cape Town: South African Medical Research Council.
WRC (Water Research Commission) (2013). Knowledge Review. WRC. P 255. http://www.wrc.org.za/Lists/Knowledge%20Hub%20Items/Attachments/10473/WRC%20Knowledge%20Review%202012_13%20KSA4.pdf. Accessed 23 September 2013.
Yin X, Huang XL and Le Roux J (2012). Effects of integrated nitrogen fertilization and irrigation systems, rootstocks and cultivars on productivity, water and nitrogen consumption, and mineral nutrition of pears. Agricultural Sciences, 3, 257-267.
Zegbe JA and Serna-Pérez A (2012). Partial rootzone drying to save water while growing apples in a semi-arid region. Irrigation and Drainage, 61, 251-259.

138
Appendix A: Glossary of food items in local languages
English seTswana Sepedi4 IsiXhosa IsiZulu 01 – Cereal Group Amahewu/ metôgô Mahewu Mague/metôgô Amarhewu Amahewu/idokwe Bread Borotho Borotho Isonka Isinkwa Brown bread Isonke esimdaka Isinkwa esinsundu/Isinkwa
esim’nyama Cake flour Flouru jwa Dikuku Flour/folouro Flawa Ufulawa Crumbly maize meal porridge
- Phuthu/photho Umphokoqo Uphuthu
Dry mealies Mmidi Lekôkôrô/dikgobe
Umbona Umbila owomile
Boiled dry mealies Digkobe/Kabu Inkobe Izinkobe Fresh maize Mmidi Mealies/mmidi Mbona omsha Ifutho/umbila Macaroni/spaghetti Macaroni/spaghetti Macaroni/spaghetti Macaroni/spaghetti Maize Mmidi Lefela Mbona Umbila Maize meal (dry) Bupi Bupi Mbona omdala Impuphu Mealie rice Mmele rice Meali rice – not
familiar to people
Mili rice – not familiar to people
Umgqakazo
Millet - Leotša Imfe Morvite Morvite Oats Oats Jungle oats Oats Ukolweni/Oats Rice Rice Rice Rice Ilayisi Samp Setampa Stampa Umgyusho Isitambu Soft maize meal and other soft porridges
Motogo/metôgô Isidudu/motêpa/ ting/ legala
Isidudu Iphalishi/umdoko
Sorghum Mabele Mabele/ leatša Inkoduso/amazimba Amabele Steamed bread Ledombolo Dinkgwa/
dombolo Idombolo Ujeqe/idombolo
Dumplings Idombolo Stiff maize meal porridge/ pap
Papa Papa/Bogôbê Papa/phalishi Ipapa
Vetkoek Matshutshu/magwinya
Magwenya Amagwinya Amagwinya
White bread Brotho Brotho Isonka esimhlobhe Isinkwa esim’hlophe
02 – White roots and tubers
Potatoes Ditapole Mazambane/diputata
Zitapile/ amazambane Amazambane
Sweet potatoes Dipotata Morepa Ubhatata Ubhatata
03 – Dark yellow and orange-fleshed vegetables
Pumpkin Lephutshi maphutsi
Lerotse/mofodi Ithanga Ithanga
Butternut Lekgwana ? Ithanga Orange-fleshed sweet potatoes
Ubhatata obuvo Ubhatata
4 Source: Quin (1959)

139
English seTswana Sepedi4 IsiXhosa IsiZulu Carrots Digwete Iminqatha Izaqathi/ikheroti
04 – Dark green leafy vegetables
Spinach Morogo wa sepenashi
Spinach/spinash Spinach/spinash Isipinashi
Including wild/ indigenous green leaves
Morogo Imifino Imifino
Thêêpê/thepe Thepe Morôgô thepe Lerotho Morôgô lerotho Monyaku Morôgô
monyaku
Leaves of ditloo, dinawa, dithlodi prepared as morôgô
Morôgô ditloo, dinawa, dithlodi
Imbotyi
Morogo from pumpkin leaves
Morôgô diputsi Umfino weziintanga
05 – Other vegetables
Cabbage Cabbage Cabbage Khaphetdshu/khabishi Iklabishi Green beans Ibontje Ibontje Imbotyi Ubhontsisi Tomatoes Tamati Tamati Tumati Utamatisi Onions Aiye anyanise Intswele U-Anyanisi Egg plant Not familiar to
people Brinjal Ubhilinjolo
Beetroot Beetroot Beetroot Beetroot Beetroot Green peppers Pepere e tala Green peppers Green peppers Upelepele omkhulu
ongababi/Green paper Gourd Legodu Moraka/leraka Citron/melon Lekatane Morôtsê - - Watermelon Magapu Mogapu/legodu Vatala Ikhabe Wild cucumber Monyaku ikhukhamba
06 – Orange-coloured fruit
Mango (ripe mango)
Mango Mango Mango Umango
Peaches Perekise Periske Pesika Impentshisi Paw paw Phopho Paw paw Paw po Uphopho Apricots - Not familiar to
people Not familiar to people I-Apilikosi
07– Other fruit
Oranges Nemune Lamoene/ namune
Lamula Amawolintshi
Apples Apolo Apple/Apolo Apile Ihabhula Bananas Panana Banana Banana U-Bhanana Pears Piere Piere Not familiar to people Ipheya Red grapes Diterebe tse
dikhibidu Amagilebhisi abomvu
Including wild/ indigenous fruit
Sour plum Dishidi Wild plum/ stamvrugte
Mohlatswa

140
English seTswana Sepedi4 IsiXhosa IsiZulu Monkey apple/klapper
Morotlue
Marulas Morula Figs Fayiye/ motroko Feiye Umkhiwana
08 – Organ meat Liver Sebete Sebete Isibindi Isibindi Kidneys Diphio Intso Izintso/ izinso Heart Pelo Pelo Inhliziyo Inhliziyo Chicken livers and giblets
Dibetwana le dikilana
? Ibindi zenkukhu
Chicken intestines Chicken mala Chicken malana ? Amathumbu ezinkukhu/Izinywenywe
Tripe/offal Mogodu Mogodu ? Usu/ulusu
09 – Meat Beef Nama ya Kgomo Nyama kgomo Inyama yekomo Inyama yenkomo Goat Nama ya Pudi Pudi Inyame yebokwe Inyama yembuzi Sheep Nama ya Nku Nku Inyame yegusha Isiklabhu/inyama yemvu Pig Nama ya Kolobe Kolobe Inyama yehhaku Inyama yengulube Poultry (chicken) Nama ya koko Kgogo Inyama yenkuku Inyama yenkukhu Game Nama ya Mosha Inyama yenyamazane Chicken feet, heads, necks
Moatwana Maotwana Amanqina nenhloko Amanqondo
Chicken geese Ingingila Dried meat/biltong Biltong Umqwayito Umqwebu/umcweba Tarentaal, patrys kgaka impangele Impala Impala Impala Impala Inyama yempala Rabbit/hare moutla umvundla Unogwaja Duiker Insects – mopane worms, flying ants, termites/ grasshoppers/locust
Masonja/ditšhošwane/ ditšiê
izinambuzane Amacimbi izintethe
10 – Eggs
Eggs from any animal
Mae Mae/Mahe Amaqanda Amaqanda
11 – Fish
Fresh fish Tlhapi Hlapi Inhlanzi Inhlanzi edotshiwe Tinned fish (Lucky Star)
Inhlanzi esethinini
12 – Dried beans
Beans (sugar beans) Sugar beans Imbotyi Ubhontshisi
Including other beans such as
Peanuts Matokomane Tokgomani Amantongomani/amakinati Amantongomani/Amakinati Cowpeas Dinawa tse di
omileng Monawa Imbumba
Njugo/ bambara Ditloo marapo Mung bean Dihlodi Porridges prepared with dry legumes
Lehata (sorghum and dry beans) Nyola (dried maize and beans)
Sekgôthô Umqwa

141
English seTswana Sepedi4 IsiXhosa IsiZulu Mosotwane (coarse mabele and dried beans)
Nuts Bean gravies and bean stews
Setôpja and lewa
Seeds Dithôtse Imbewu
13 – Milk and
products
Milk Maswi Maswi Lubisi/intusi Ubisi Maas Madila Amasi Amasi Amasi
Oils and fats Oil Mahura/mafura Fish oil/cooking
oil/mafura Amafutha Uteli/amafutha/okupheka
Margarine Rama Rama Ibhotela Holsum Wholesum Amafutha anqumelayo
14 – Sugars and
sweets
Sugar Sukere Swekir/Swikiri Swekir Ushukela Honey Mamepa Mamep Ubus Uju Sweets Dimonamene Dimonamonane Ilekese Amaswidi Cakes Dikuku Dicake/dikuku Amakhekhe Amakhekhe Juice Juice Juice Ujusi Fizzy drinks (Fanta, Sprite. Coke)
Senwamaphodi Iziphuzo Unemenayithi
15 – Spices
Spice Metswako Spices Spices Isipayisi Salt Letswai Letswai Ityuwa/ityiwa Usawoti/Iswayi Coffee Kofi Kofi Kofi Ikhofi Tea Tee Teye Iti Itiye Knorrox cubes Knorrox Knorrox Amagaqa

142
Ap
pen
dix
B:
Gen
eral
not
es o
n t
he
pro
du
ctio
n o
f th
e d
iffe
ren
t cr
ops
Con
sum
pti
on
reco
mm
end
atio
n N
otes
reg
ard
ing
pro
du
ctio
n c
onsi
der
atio
ns
Afr
ican
leaf
y ve
geta
bles
(‘w
ild’
or
cult
ivat
ed)
Mos
t of
the
Afr
ican
leaf
y ve
geta
bles
can
be
foun
d in
are
as w
here
the
land
has
bee
n di
stur
bed.
The
kin
ds o
f A
fric
an
leaf
y ve
geta
bles
fou
nd d
epen
d on
the
clim
ate
and
soil
. T
hese
veg
etab
les
incl
ude
the
foll
owin
g:
• B
lack
jack
leav
es
• C
at’s
whi
sker
s
• C
owpe
a le
aves
• A
mar
anth
leav
es
• L
amb
quar
ters
leav
es
• N
ettl
e le
aves
• N
ight
shad
e le
aves
• P
umpk
in le
aves
• S
ow th
istl
e le
aves
The
se v
eget
able
s ar
e ra
in f
ed a
nd h
ighl
y nu
trit
ious
. The
y gr
ow q
uick
ly, a
s th
ey o
nly
take
fou
r to
six
wee
ks f
rom
pl
anti
ng to
har
vest
. The
y ca
n be
har
vest
ed s
ever
al ti
mes
. The
y ar
e us
uall
y su
mm
er-g
row
ing
crop
s th
at s
houl
d no
t be
plan
ted
in w
inte
r. W
hen
cult
ivat
ed, t
hey
can
give
yie
lds
of 4
0-60
t/ha
-1 a
nd 1
0 t/
ha-1
whe
n un
cult
ivat
ed. M
ore
info
rmat
ion
is a
vail
able
fro
m D
r W
ille
m J
anse
van
Ren
sbur
g of
the
Agr
icul
tura
l Res
earc
h C
ounc
il V
eget
able
and
O
rnam
enta
l Pla
nt I
nsti
tute
(A
RC
VO
PI)
at w
jvre
nsbu
rg@
arc.
agri
c.za
.

143
Con
sum
pti
on
reco
mm
end
atio
n N
otes
reg
ard
ing
pro
du
ctio
n c
onsi
der
atio
ns
Am
adum
be
(sta
rch)
A
mad
umbe
nee
ds a
long
gro
win
g se
ason
and
gro
ws
wel
l if
ther
e is
a d
roug
ht. I
t can
pro
duce
bet
wee
n 0.
5 an
d 1.
0 kg
of
cor
ms
per
plan
t. If
cor
ms
are
left
in th
e so
il to
o lo
ng, t
hey
star
t to
dry
out a
nd lo
se q
uali
ty. T
his
shou
ld n
ot b
e pl
ante
d in
win
ter
whe
n th
e m
axim
um te
mpe
ratu
re is
bel
ow 3
0 °C
in th
e da
y.
Bam
bara
gro
undn
ut
Thi
s is
indi
geno
us to
Afr
ica.
It c
an g
row
in p
oor
soil
wit
h li
ttle
rai
nfal
l. A
s a
sum
mer
-gro
win
g cr
op, i
t can
pro
duce
½
to 3
t-ha
-1.
Bee
troo
t B
eetr
oot c
an b
e pl
ante
d as
see
ds d
irec
tly
into
the
fiel
ds o
r fr
om s
eedl
ings
. It i
s a
cool
-sea
son
crop
, whi
ch is
bes
t pl
ante
d fr
om F
ebru
ary
to A
ugus
t. It
can
be
plan
ted
out o
f se
ason
, but
the
yiel
d an
d qu
alit
y m
ay b
e po
orer
and
it m
ay
be a
ttac
ked
by d
isea
ses
and
inse
cts.
It w
ill g
row
and
pro
duce
in r
ain-
fed
cond
itio
ns, b
ut w
ill d
o be
tter
(hi
gher
yie
lds)
if
ther
e is
no
drou
ght.
The
spr
ead
of th
e ra
infa
ll is
impo
rtan
t, as
the
beet
root
has
a s
hall
ow r
oot s
yste
m. A
san
dy to
sa
ndy-
loam
soi
l mak
es h
arve
stin
g ea
sier
, but
ther
e ar
e m
ore
prob
lem
s w
ith
nem
atod
es. C
rop
rota
tion
hel
ps to
co
ntro
l thi
s. B
eetr
oot c
an r
otat
e w
ith
legu
mes
, cer
eals
, tom
atoe
s or
cab
bage
. If
it is
gro
wn
in a
cla
y so
il, t
he c
rop
wil
l nee
d to
be
was
hed
befo
re s
elli
ng. C
lay
mak
es it
mor
e di
ffic
ult t
o li
ft th
e cr
op f
rom
the
soil
and
can
als
o ch
ange
th
e sh
ape
of th
e be
ets.
It c
an b
e ha
rves
ted
wit
hin
two
and
a ha
lf to
fou
r m
onth
s af
ter
plan
ting
. The
re is
onl
y on
e ha
rves
t, bu
t sta
gger
ed p
lant
ing
ensu
res
a ha
rves
tabl
e cr
op th
roug
hout
the
year
. An
irri
gate
d yi
eld
can
be 1
8 to
25
t/ha
-1 u
nder
irri
gati
on. T
oo m
uch
com
post
(or
gani
c m
ater
ial)
can
lead
to th
e de
velo
pmen
t of
too
man
y la
tera
l roo
ts.
Bro
ccol
i B
rocc
oli c
an b
e pl
ante
d fr
om s
eeds
or
seed
ling
s be
twee
n M
arch
and
Jul
y. A
s fo
r be
etro
ot, o
ut-o
f-se
ason
pla
ntin
g ca
n al
so c
ause
pro
blem
s. I
t may
be
atta
cked
by
inse
cts,
suc
h as
cat
erpi
llar
s, a
nd d
isea
se, s
uch
was
mil
dew
and
cl
ubfo
ot. S
peci
al c
are
shou
ld b
e ta
ken
to p
rote
ct th
e cr
op a
gain
st th
ese
thre
ats.
It i
s se
nsit
ive
to h
igh
tem
pera
ture
s an
d m
ay b
e at
tack
ed b
y in
sect
s an
d di
seas
es.
Cau
lifl
ower
C
auli
flow
er c
an b
e pl
ante
d fr
om s
eeds
or
seed
ling
s be
twee
n M
arch
and
Jul
y. A
s fo
r be
etro
ot, o
ut-o
f-se
ason
pla
ntin
g ca
n al
so c
ause
pro
blem
s. I
t may
be
atta
cked
by
inse
cts,
suc
h as
cat
erpi
llar
s, a
nd d
isea
se, s
uch
was
mil
dew
and
cl
ubfo
ot. S
peci
al c
are
shou
ld b
e ta
ken
to p
rote
ct th
e cr
op a
gain
st th
ese
thre
ats.
It i
s se
nsit
ive
to h
igh
tem
pera
ture
s an
d m
ay b
e at
tack
ed b
y in
sect
s an
d di
seas
es.

144
Con
sum
pti
on
reco
mm
end
atio
n N
otes
reg
ard
ing
pro
du
ctio
n c
onsi
der
atio
ns
Cab
bage
Cab
bage
can
be
plan
ted
from
see
ds o
r se
edli
ngs
betw
een
Mar
ch a
nd J
uly.
As
for
beet
root
, out
-of-
seas
on p
lant
ing
can
also
cau
se p
robl
ems.
It m
ay b
e at
tack
ed b
y in
sect
s, s
uch
as c
ater
pill
ars,
and
dis
ease
, suc
h w
as m
ilde
w a
nd
club
foot
. Spe
cial
car
e sh
ould
be
take
n to
pro
tect
the
crop
aga
inst
thes
e th
reat
s. R
oot k
not n
emat
odes
can
als
o be
a
prob
lem
. Cab
bage
can
be
harv
este
d w
ithi
n th
ree
to f
our
mon
ths
afte
r pl
anti
ng. I
t yie
lds
60 to
80
t/ha
-1 u
nder
ir
riga
tion
and
eac
h pl
ant c
an o
nly
be h
arve
sted
onc
e. S
tagg
ered
pla
ntin
g w
ill e
nsur
e pr
oduc
e th
roug
hout
the
year
. C
arro
ts
Car
rots
pre
fer
a sa
ndy
to s
andy
-loa
m s
oil t
o m
ake
harv
esti
ng e
asie
r. I
n cl
ay s
oil,
the
crop
wil
l nee
d to
be
was
hed
befo
re s
elli
ng. I
t is
also
mor
e di
ffic
ult t
o li
ft th
e cr
op f
rom
the
soil
. In
sand
y so
il, t
here
can
be
prob
lem
s w
ith
nem
atod
es, a
nd c
rop
rota
tion
wil
l be
esse
ntia
l to
prev
ent t
he b
uild
-up
of n
emat
odes
. A s
oil p
H o
f 6
to 6
.5 is
pr
efer
able
. Too
muc
h or
gani
c m
ater
ial i
n th
e so
il le
ads
to th
e sp
litt
ing
of r
oots
, and
they
may
bec
ome
mor
e ha
iry.
C
ompo
st a
nd k
raal
man
ure
are
not r
ecom
men
ded.
Car
rots
can
be
sow
n du
ring
May
and
Jun
e. I
t is
a co
ol-s
easo
n cr
op, b
ut is
als
o se
nsit
ive
to f
rost
. It c
an b
e ha
rves
ted
wit
hin
thre
e to
thre
e an
d a
half
mon
ths
afte
r so
win
g. I
rrig
ated
yi
elds
ran
ge f
rom
25
to 5
0 t/
ha-1
. C
owpe
as
(lea
ves
as
wel
l as
be
ans)
It is
a s
umm
er-g
row
ing
crop
, but
can
gro
w in
dry
con
diti
ons.
It h
as a
yie
ld p
oten
tial
of
½ to
3 t/
ha-1
of d
ry b
eans
. As
fres
h be
ans,
it s
houl
d be
sim
ilar
to d
ry b
eans
at 1
5 to
20
t/ha
-1.
C
ucum
ber
(fie
ld
cucu
mbe
r)
Pho
spho
rus
fert
iliz
atio
n fo
r cu
cum
bers
is im
port
ant t
o en
sure
goo
d-qu
alit
y fr
uit.
A p
H r
angi
ng f
rom
5.5
to 7
.5 is
id
eal.
Fiel
d cu
cum
bers
are
war
m-s
easo
n cr
ops
and
can
only
be
esta
blis
hed
afte
r th
e la
st f
rost
. Lik
ewis
e, th
e cr
op
shou
ld b
e ha
rves
ted
befo
re th
e fi
rst f
rost
. Cuc
umbe
rs, s
wee
t mel
ons
(can
talo
upe)
, wat
erm
elon
, pum
pkin
s, b
utte
rnut
, sq
uash
, gem
squ
ash
and
zucc
hini
are
all
cla
ssif
ied
as v
ine
crop
s du
e to
thei
r tr
aili
ng g
row
th f
orm
. Som
e cr
ops,
like
zu
cchi
ni, c
an a
lso
be m
ore
bush
y in
gro
wth
. Vin
e cr
ops
are
mor
e pr
one
to d
isea
ses
in w
et c
ondi
tion
s. T
he c
rops
then
al
so p
refe
r de
ep, w
ell-
drai
ned
soil
s of
90
cm o
r de
eper
. Vin
e cr
ops
are
plan
ted
wit
h se
ed, d
irec
tly
into
the
fiel
ds.
Irri
gate
d cr
ops
yiel
d 25
to 3
5 t/
ha-1
.

145
Con
sum
pti
on
reco
mm
end
atio
n N
otes
reg
ard
ing
pro
du
ctio
n c
onsi
der
atio
ns
Dar
k or
ange
pum
pkin
, bu
tter
nut o
r sq
uash
G
em
quas
h/‘c
alab
ash’
/oth
er
squa
sh a
nd p
umpk
in
Zuc
chin
i
The
se w
arm
-sea
son
crop
s ca
n on
ly b
e es
tabl
ishe
d af
ter
the
last
fro
st. T
he c
rop
shou
ld b
e ha
rves
ted
befo
re th
e fi
rst
fros
t. P
umpk
in a
nd h
ubba
rd s
quas
h yi
elds
of
20 to
30
t/ha
-1 c
an b
e ha
rves
ted
unde
r ir
riga
tion
. Som
e ca
n be
sto
red
for
long
per
iods
of
tim
e be
fore
losi
ng q
uali
ty. B
utte
rnut
und
er ir
riga
tion
yie
lds
betw
een
20 a
nd 2
5 t/
ha-1
. Yie
lds
unde
r ir
riga
tion
ran
ge f
rom
20
to 2
5 t/
ha-1
for
gem
squ
ash
and
othe
r C
ucur
bita
pep
o pu
mpk
ins,
incl
udin
g zu
cchi
ni.
The
se ty
pes
of p
umpk
ins/
squa
shes
sho
uld
be h
arve
sted
whe
n th
ey a
re s
till
imm
atur
e an
d th
eref
ore
do n
ot la
st lo
ng
afte
r ha
rves
ting
. The
Cuc
urbi
ta p
epo
grou
p is
the
only
veg
etab
le g
roup
that
can
be
grow
n in
dry
land
wit
h su
cces
s be
caus
e it
ori
gina
ted
in d
eser
t are
as. D
ark-
colo
ured
fru
it c
an e
asil
y ge
t sun
sca
ld. G
ood
dise
ase
and
inse
ct c
ontr
ol
wil
l ens
ure
that
the
frui
ts a
re c
over
ed b
y th
e le
aves
. Dis
ease
s an
d in
sect
s ca
use
the
leav
es to
die
and
exp
ose
the
frui
ts
to th
e su
n. B
ees
are
very
impo
rtan
t to
the
good
pro
duct
ion
of c
rops
that
req
uire
pol
lina
tion
for
fru
it d
evel
opm
ent.
Dri
p ir
riga
tion
is b
ette
r th
an o
verh
ead
irri
gati
on if
wat
er c
an c
olle
ct w
here
the
stem
is a
ttac
hed
to th
e fr
uit.
Too
m
uch
wat
er in
this
are
a ca
n le
ad to
sev
ere
dise
ase
infe
ctio
ns.
Egg
plan
t (br
inja
l)
T
hese
war
m-s
easo
n cr
ops
can
only
be
esta
blis
hed
afte
r th
e la
st f
rost
. The
cro
p sh
ould
be
harv
este
d be
fore
the
firs
t fr
ost.
Bri
njal
s ha
ve a
long
gro
win
g se
ason
and
sho
uld
be p
lant
ed in
are
as w
ith
long
, hot
sum
mer
s. D
eep,
wel
l-dr
aine
d so
il is
bes
t. B
rinj
als
grow
wel
l wit
h m
anur
e an
d co
mpo
st, b
ut w
itho
ut th
ese,
hea
vy f
erti
liza
tion
is n
eces
sary
. S
imil
ar p
rodu
ctio
n pr
acti
ces
shou
ld b
e im
plem
ente
d as
for
tom
atoe
s an
d gr
een
pepp
ers.
Und
er ir
riga
tion
, yie
lds
can
reac
h 25
to 3
5 t/
ha-1
. G
reen
bea
ns
Lea
ves
and
bean
s
The
se w
arm
-sea
son
crop
s ca
n on
ly b
e es
tabl
ishe
d af
ter
the
last
fro
st. T
he c
rop
shou
ld b
e ha
rves
ted
befo
re th
e fi
rst
fros
t. G
reen
bea
ns a
re a
lso
legu
mes
and
ther
efor
e th
e in
form
atio
n he
re is
als
o re
leva
nt f
or le
gum
es. B
eans
nee
d de
ep, w
ell-
drai
ned
soil
s an
d a
clay
con
tent
that
is n
ot to
o hi
gh o
r to
o lo
w. A
soi
l pH
of
6 to
6.5
is id
eal.
Zin
c,
man
gane
se a
nd b
oron
def
icie
ncie
s ca
n be
pro
blem
atic
. Bea
ns d
o no
t do
wel
l in
soil
s w
ith
a hi
gh s
alt c
onte
nt. B
ush
bean
s ca
n yi
eld
8 to
10
t/ha
-1 a
nd r
unne
r be
ans
15 to
20
t/ha
-1. I
t has
a lo
ng g
row
ing
seas
on, b
ut a
sho
rt h
arve
st
peri
od, a
nd th
eref
ore
stag
gere
d pl
anti
ng is
impo
rtan
t to
ensu
re th
e av
aila
bili
ty o
f gr
een
bean
s ov
er a
long
er p
erio
d of
ti
me.

146
Con
sum
pti
on
reco
mm
end
atio
n N
otes
reg
ard
ing
pro
du
ctio
n c
onsi
der
atio
ns
Gre
en p
eppe
rs
The
se w
arm
-sea
son
crop
s ca
n on
ly b
e es
tabl
ishe
d af
ter
the
last
fro
st. T
he c
rop
shou
ld b
e ha
rves
ted
befo
re th
e fi
rst
fros
t. T
he c
rops
are
est
abli
shed
wit
h se
edli
ngs.
Gre
en p
eppe
rs y
ield
25
to 3
0 t/
ha-1
und
er ir
riga
tion
. The
pla
nt
flow
ers
cont
inuo
usly
and
ther
efor
e pe
pper
s ca
n be
ava
ilab
le f
or a
long
per
iod
of ti
me.
Sun
sca
ld a
nd b
loss
om e
nd r
ot
(cal
cium
def
icie
ncy)
are
som
e of
the
prob
lem
s to
look
out
for
. Sca
ld c
an b
e re
duce
d by
ens
urin
g a
heal
thy
leaf
ca
nopy
, whi
le c
orre
ct ir
riga
tion
and
the
appl
icat
ion
of c
alci
um c
an r
educ
e bl
osso
m e
nd r
ot.
Gre
en p
eppe
rs r
equi
re s
imil
ar p
rodu
ctio
n pr
acti
ces
as to
mat
oes.
L
egum
es (
dhal
, dry
be
ans,
etc
.)
The
Dep
artm
ent o
f A
gric
ultu
re is
sup
port
ing
and
enco
urag
ing
the
prod
ucti
on o
f th
is c
rop
in a
ll th
e pr
ovin
ces.
The
se
war
m-s
easo
n cr
ops
can
only
be
esta
blis
hed
afte
r th
e la
st f
rost
. The
cro
p sh
ould
be
harv
este
d be
fore
the
firs
t fro
st.
The
y ar
e so
wn
dire
ctly
into
the
fiel
d. D
eep,
wel
l-dr
aine
d so
ils
wit
hout
aci
dity
pro
blem
s ar
e pr
efer
red.
Ino
cula
tion
w
ith
the
corr
ect n
itro
gen-
fixi
ng b
acte
ria
is im
port
ant t
o su
cces
sful
pro
duct
ion.
Dry
bea
ns h
ave
a ve
ry s
hort
gro
win
g se
ason
of
85 to
120
day
s. T
wo
plan
ting
s pe
r se
ason
can
be
done
if w
ater
is a
vail
able
. The
mos
t pop
ular
dry
bea
ns
are
suga
r/re
d sp
eckl
ed b
eans
, fol
low
ed b
y sm
all w
hite
and
big
whi
te k
idne
y be
ans.
Yie
lds
vary
fro
m le
ss th
an 1
t un
der
dryl
and
to a
s hi
gh a
s 5
t/ha
-1 u
nder
irri
gati
on.
Let
tuce
L
ettu
ce is
a c
ool-
seas
on c
rop.
In
sum
mer
con
diti
ons,
it a
lso
gets
dam
aged
by
tem
pera
ture
and
wat
er s
tres
s, w
hich
le
ads
to p
oor
head
dev
elop
men
t and
a s
hort
she
lf li
fe. L
ettu
ce p
refe
rs c
lay
soil
s w
ith
a lo
w s
alt c
onte
nt a
nd a
pH
of
abou
t 6.5
. Fer
tili
zati
on, e
spec
iall
y ni
trog
en, i
s im
port
ant.
No
fert
iliz
ers
cont
aini
ng c
hlor
ine
shou
ld b
e ap
plie
d, s
ince
it
can
aff
ect t
he s
alt c
onte
nt o
f th
e so
il. Y
ield
s of
20
to 2
5 t/
ha-1
can
be
obta
ined
und
er ir
riga
tion
.

147
Con
sum
pti
on
reco
mm
end
atio
n N
otes
reg
ard
ing
pro
du
ctio
n c
onsi
der
atio
ns
Oni
ons
O
nion
s ar
e bi
annu
al (
as a
re c
abba
ge, b
eetr
oot a
nd c
arro
ts).
The
y pr
oduc
e th
e ed
ible
par
t in
the
firs
t yea
r an
d fl
ower
in
the
seco
nd y
ear.
Oni
ons
can
flow
er a
t the
wro
ng ti
me
(bol
ting
), w
hich
lead
s to
the
crac
king
of
the
onio
n bu
lb.
Flo
wer
ing
is m
ainl
y co
ntro
lled
by d
ay le
ngth
and
it is
impo
rtan
t to
only
use
cul
tiva
rs r
ecom
men
ded
for
the
area
. The
co
rrec
t pla
ntin
g da
te is
als
o im
port
ant.
Pla
ntin
g to
o ea
rly
or to
o la
te c
an a
ffec
t the
yie
ld. Y
ield
s of
30
to 7
0 t/
ha-1
can
be
obt
aine
d w
ith
irri
gati
on. O
nion
s ca
n be
sow
n di
rect
ly, e
stab
lish
ed a
s se
edli
ngs
or b
y us
ing
sets
. Too
muc
h ni
trog
en la
te in
the
seas
on c
an le
ad to
poo
r bu
lb f
orm
atio
n, a
nd s
low
-rel
ease
fer
tili
zers
and
org
anic
mat
eria
l sho
uld
not b
e us
ed. A
dee
p, w
ell-
drai
ned
sand
y to
san
dy-l
oam
soi
l mak
es h
arve
stin
g ea
sier
. In
clay
soi
l, th
e cr
op w
ill n
eed
to b
e w
ashe
d be
fore
sel
ling
. It i
s al
so m
ore
diff
icul
t to
lift
the
crop
fro
m th
e so
il. I
n sa
ndy
soil
, one
can
exp
ect m
ore
prob
lem
s w
ith
nem
atod
es. C
rop
rota
tion
wil
l be
esse
ntia
l to
prev
ent t
he b
uild
-up
of n
emat
ode
popu
lati
ons.
Oni
ons
are
sens
itiv
e to
soi
l sal
init
y. A
soi
l pH
of
5.8
to 6
.8 is
idea
l. O
rang
e-fl
eshe
d sw
eet
pota
toes
/whi
te f
lesh
ed
swee
t pot
atoe
s
The
se w
arm
-sea
son
crop
s ca
n on
ly b
e es
tabl
ishe
d af
ter
the
last
fro
st. T
he c
rop
shou
ld b
e ha
rves
ted
befo
re th
e fi
rst
fros
t. S
wee
t pot
atoe
s ar
e es
tabl
ishe
d w
ith
vege
tati
ve m
ater
ial (
cutt
ings
) an
d sh
ould
be
free
fro
m d
isea
ses.
The
se
vege
tabl
es n
eed
deep
, wel
l-dr
aine
d so
ils
wit
h no
t too
muc
h cl
ay. I
n cl
ay s
oil,
the
crop
wil
l nee
d to
be
was
hed
befo
re
sell
ing
and
it is
als
o m
ore
diff
icul
t to
lift
it f
rom
the
soil
. In
sand
y so
il, t
here
are
mor
e pr
oble
ms
wit
h ne
mat
odes
. C
rop
rota
tion
wil
l be
esse
ntia
l to
prev
ent t
he b
uild
-up
of n
emat
ode
popu
lati
ons.
App
lyin
g m
anur
e an
d co
mpo
st c
an
also
lead
to th
in, p
oorl
y sh
aped
tube
rs.
Yie
lds
of 4
0 to
60
t/ha
-1 c
an be
obt
aine
d un
der
irri
gati
on c
ondi
tion
s.
Par
sley
P
arsl
ey is
a v
ery
easy
her
b to
gro
w. I
t can
re-
grow
and
can
thus
be
harv
este
d co
ntin
uous
ly.
Pea
s T
his
cool
-sea
son
crop
yie
lds
of 3
to 5
t/ha
-1 u
nder
irri
gati
on. D
epen
ding
on
the
cult
ivar
, it c
an b
e ha
rves
ted
once
or
over
a p
erio
d of
tim
e.
Pot
atoe
s T
his
crop
is v
ery
sens
itiv
e to
dro
ught
and
it is
not
rec
omm
ende
d fo
r ra
in-f
ed c
ondi
tion
s in
Sou
th A
fric
a. I
t can
be
prod
uced
thro
ugho
ut th
e ye
ar, b
ut in
sum
mer
the
yiel
d an
d qu
alit
y ar
e m
uch
low
er th
an in
the
cool
er m
onth
s. U
nder
ir
riga
tion
con
diti
ons,
yie
lds
of 4
0 to
80
t/ha
-1 c
an b
e ob
tain
ed.

148
Con
sum
pti
on
reco
mm
end
atio
n N
otes
reg
ard
ing
pro
du
ctio
n c
onsi
der
atio
ns
Sw
iss
char
d (o
ften
in
corr
ectl
y re
ferr
ed to
as
spi
nach
)
Sw
iss
char
d is
a c
ool-
wea
ther
cro
p th
at h
as a
dapt
ed to
war
mer
con
diti
ons
and
can
be p
rodu
ced
thro
ugho
ut th
e ye
ar.
It is
usu
ally
sow
n di
rect
ly in
the
fiel
d. I
t is
easy
to g
row
, but
inse
cts
and
dise
ases
can
be
a pr
oble
m in
the
sum
mer
m
onth
s. C
onti
nuou
s ha
rves
ting
mak
es it
an
idea
l lea
fy c
rop
to h
ave
in th
e ga
rden
. Und
er ir
riga
tion
, yie
lds
of 1
5 to
20
t/ha
-1ca
n be
obt
aine
d.
Tom
atoe
s F
resh
pro
duce
mar
ket c
ulti
vars
nee
d su
ppor
t to
keep
the
plan
t upr
ight
wit
h st
akes
or
trel
lise
s. I
t wil
l pro
duce
fru
it
cont
inuo
usly
and
can
thus
be
harv
este
d ov
er a
per
iod
of m
onth
s. T
omat
oes
cann
ot b
e gr
own
succ
essf
ully
wit
hout
cr
op r
otat
ion
due
to d
isea
ses
that
att
ack
this
cro
p. T
here
are
als
o pr
oble
ms
wit
h nu
mer
ous
dise
ases
. Tom
atoe
s ne
ed
any
type
of
soil
that
is d
eep
and
wel
l dra
ined
, and
the
frui
ts a
re s
usce
ptib
le to
cal
cium
def
icie
ncie
s th
at c
ause
bl
osso
m e
nd r
ot. T
oo m
uch
wat
er o
r w
ater
on
the
frui
t sur
face
can
cau
se c
rack
ing
and
can
affe
ct th
e qu
alit
y of
the
frui
t’s
appe
aran
ce. P
oor
cano
py c
over
due
to in
sect
s an
d di
seas
e at
tack
s ca
n le
ad to
sun
-sca
lded
fru
it. Y
ield
s ca
n be
as
low
as
10 t/
ha-1
for
poor
dry
land
pro
duce
rs, b
ut c
an g
o up
to 1
20 t/
ha-1
und
er c
omm
erci
al ir
riga
ted
cond
itio
ns.

149
Appendix C: Publications and product outputs
The following publications and presentations have been published and presented to date.
Published journal articles
• Hendriks SL, Van der Merwe C, Ngidi MS, Manyamba C, Mbele M, McIntyre M, Molefe QN, Mphephu MN, Mgwane L (2016). What are we measuring? A comparison of household food security indicators from a sample of households in the Eastern Cape Province, South Africa. Ecology of Food and Nutrition. http://www.tandfonline.com/doi/full/10.1080/03670244.2015.1094063.
• Ngidi MS and Hendriks SL (2014). Coping with food insecurity in rural South Africa: the case of Jozini, KwaZulu-Natal. Mediterranean Journal of Social Sciences, 5 (25), 278-289. http://mcser-org.ervinhatibi.com/journal/index.php/mjss/ article/viewFile/5374/5186.
Papers submitted to journals for consideration
Ngidi MSC, Hendriks SL and Njonono M (2014). Does crop production buffer rural households from food insecurity and applying erosive coping strategies? Paper resubmitted to Development Southern Africa, January 2015.
Papers in preparation
• Hendriks SL, Viljoen AT, Marais D, Wenhold F, McIntyre AM, Ngidi MS, Van der Merwe C, Annandale J, Kalaba M, Stewart D. (forthcoming). What crops can rural poor communities produce to improve their food security? Paper in preparation for submission.
• Hendriks SL, Gallei M (forthcoming). What are we measuring? A comparison of household food security indicators from a sample of households in the poorest provinces of South Africa. Paper in preparation for submission to Global Food Security.
Research briefs
• Hendriks SL, Viljoen AT, Marais D, Wenhold F, McIntyre AM, Ngidi MS, Van der Merwe C, Annandale J, Kalaba M, Stewart D (2016). What should rural households grow and eat to improve their nutrition? Research Brief No 1. Water Research Commission (WRC Project No. Project K5/2172/4). Water Research Commission and Institute for Food, Nutrition and Well-being, Pretoria: University of Pretoria. http://www.up.ac.za/media/shared/238/1601-ifnuw-fs-article_-lowres.zp84288.pdf
• Hendriks SL, Viljoen AT, Marais D, Wenhold F, McIntyre AM, Ngidi MS, Van der Merwe C, Annandale J, Kalaba M, Stewart D (2016). What should rural households grow and eat to improve their nutrition? Ingquza Hill. Research Brief No 2. Water

150
Research Commission (WRC Project No. Project K5/2172/4). Water Research Commission and Institute for Food, Nutrition and Well-being. Pretoria: University of Pretoria. http://www.up.ac.za/media/shared/238/1601-ifnuw-a4-brochure-ingquza-hill-0316.zp83908.pdf
• Hendriks SL, Viljoen AT, Marais D, Wenhold F, McIntyre AM, Ngidi MS, Van der Merwe C, Annandale J, Kalaba M, Stewart D (2016). What should rural households grow and eat to improve their nutrition? Jozini. Research Brief No 3. Water Research Commission (WRC Project No. Project K5/2172/4). Water Research Commission and Institute for Food, Nutrition and Well-being. Pretoria: University of Pretoria. http://www.up.ac.za/media/shared/238/1601-ifnuw-a4-brochure-jozini-0316.zp83910.pdf
• Hendriks SL, Viljoen AT, Marais D, Wenhold F, McIntyre AM, Ngidi MS, Van der Merwe C, Annandale J, Kalaba M, Stewart D (2016). What should rural households grow and eat to improve their nutrition? Maruleng. Research Brief No 4. Water Research Commission (WRC Project No. Project K5/2172/4). Water Research Commission and Institute for Food, Nutrition and Well-being. Pretoria: University of Pretoria. http://www.up.ac.za/media/shared/238/1601-ifnuw-a4-brochure-maruleng-0316.zp83912.pdf
• Hendriks SL, Viljoen AT, Marais D, Wenhold F, McIntyre AM, Ngidi MS, Van der Merwe C, Annandale J, Kalaba M, Stewart D (2016). What should rural households grow and eat to improve their nutrition? Ratlou. Research Brief No 5. Water Research Commission (WRC Project No. Project K5/2172/4). Water Research Commission and Institute for Food, Nutrition and Well-being. Pretoria: University of Pretoria. http://www.up.ac.za/media/shared/238/1601-ifnuw-a4-brochure-ratlou-0316.zp83914.pdf
Invited presentations in which the results have been presented
Hendriks SL (2016). Contextualisation of food security. Invited presentation to the Joint Workshop on Food Security and Food Safety: Portfolio Committees on Agriculture, Forestry and Fisheries, Health, Social Development and the Select Committee on Land and Mineral Resources, Cape Town, 2 February 2016.
Papers presented at conferences
• Makamo CT, Viljoen AT, Hendriks SL and Ngidi M. (2016). Food consumption patterns and dietary diversity of rural households in Ratlou, North-West Province, South Africa. Paper presented at the 12th International SAAFECS Conference, St Georges Hotel and Conference Centre, Pretoria, 22-26 February 2016.
• McIntyre AM and Hendriks SL (2015). South Africa’s changing food security landscapes: using mixed methodologies for analysis. Paper presented at the 2nd Global Food Security Conference, Cornell University, Ithaca, NY, 14 October 2015.
• Molefe QN and Hendriks SL (2016). Contributions of agricultural production to food security in rural households of South Africa. Paper accepted for presentation at the

151
South African Association of Family Ecology and Consumer Science, St George’s Hotel, Pretoria, February 2016.
• Manyamba C. (2014). Application of the Women’s Empowerment in Agriculture Index. The Cases of Eastern Cape, South Africa. Paper presented at the Gender, water and development: the untapped connection conference held at the International Convention Centre, East London, 3-7 November 2014.
• Ngidi MS and Hendriks SL (2014). Coping with food insecurity in rural South Africa: the case of Jozini, KwaZulu-Natal. Conference presentation International Academic Conference on Business and Social Sciences (ICBSS), Blue Waters Hotel, Durban, 6-8 November 2014.
• Ngidi MS and Hendriks SL (2014). Investigating the food insecurity coping strategies at Ingquza Hill Municipality, Eastern Cape. Conference presentation ASSAf Annual South African Young Scientists’ Conference, Pretoria, 14-16 October.
Popular media
Hendriks SL and McIntyre AM (2016). Why a diverse diet is crucial for rural South African. The Conversation Africa, 19 May 2016. https://theconversation.com/why-a-diverse-diet-is-crucial-for-rural-south-africans-57304.
Software
Van der Merwe C, Hendriks SL, Viljoen AT, Marais D, Wenhold F, Annandale J, Kalaba M and Stewart D (2016). Grow smart: crop choice options to improve rural diets. Digital application software developed for the Water Research Commission Project No. Project K5/2172/4. Water Research Commission and Institute for Food, Nutrition and Well-being. Pretoria: University of Pretoria. http://www.up.ac.za/media/shared/238/presentation1. zp83916.pdf

152
Figure 12: Screenshot of the Grow Smart application

153
Appendix D: Capacity building
The project initially proposed the inclusion of three masters degree students and one PhD candidate. Four masters degree students and one PhD candidate are using the data for their research projects. A postdoctoral researcher led the survey fieldwork for the team and has presented papers at conferences and published papers using the data. Another PhD candidate was involved in the survey design, fieldwork and data analysis. The list of theses and dissertations expected from analysis of the data by the postgraduates engaged in the project includes the following: McIntyre AM. Pathways to the right to food in South Africa. Unpublished PhD thesis in Rural Development Planning. Department of Agricultural Economics, Extension and Rural Development, University of Pretoria. Supervisor: Prof SL Hendriks. Molokomme M. The minimum cost of the diet in Ingquza Hill, South Africa. Unpublished MCom dissertation. Department of Agricultural Economics, Extension and Rural Development, University of Pretoria. Supervisor: Prof SL Hendriks. Co-supervisors: Dr M Kalaba and Prof HC Schönfeldt. Van der Merwe CH. How can information systems support rural South Africa’s decision-making processes? Unpublished MCom dissertation. Department of Informatics, University of Pretoria. Supervisor: Dr M Turpin. Co-Supervisor: Prof SL Hendriks. Molefe QN. The contribution of crop production to food security in three poor rural communities in South Africa. Unpublished masters dissertation. Department of Agricultural Economics, Extension and Rural Development, University of Pretoria. Supervisor: Prof SL Hendriks. Makamo CT. Food consumption patterns and dietary diversity of rural households in Ratlou North West Province, South Africa. Unpublished masters dissertation in Consumer Science. Department of Consumer Science, University of Pretoria. Supervisor: Dr AT Viljoen. There have been many opportunities for skills development. Dr Ngidi (a postdoctoral researcher) has been supporting a survey with DAFF as part of the establishment of the South African Food Security Information System. For many of the postgraduates working on this project, this is their first experience of survey work. Working with the data in the masters degree module helped develop the skills of six postgraduate students. In addition, the researchers hired a team of six to eight young people in each community as enumerators to help with the household surveys. These 35 young people were trained in anthropometric measurement, survey and interview skills. In each community, the researchers worked with Lima staff members. Four Lima staff members were trained in these skills as well.

154
List of students involved in this project Name Degree Research topic Role Notes Dr Mjabuliseni Ngidi
Postdoctoral researcher
Coping strategies Field survey team leader
Completed March 2015
Mr Christopher Manyamba
PhD candidate Gender and food security
Survey questionnaire leader, sampling, data cleaning and analysis
Continuing
Ms Angela McIntyre
PhD candidate Food sovereignty Lead person for the qualitative survey component and analysis
Continuing
Ms Maria Molokomme
Masters degree student
Minimum cost of a food basket
Economic analysis and survey data collection
Continuing
Mr Corné van der Merwe
Honours degree student in 2013and now a masters degree student
Use of digital technology for food security
Digitisation of survey questionnaire
Graduated with an honours degree cum laude and is now registered for a masters degree
Ms Queeneth Molefe
Masters degree student in Rural Development
Contribution of agricultural production to food security in rural households of South Africa
Fieldwork in North West
Continuing
Ms Carlibet Makamo
Masters degree student in Consumer Science
Food consumption patterns and dietary diversification of rural poor households
Survey lead person in North West
Continuing