Embed Size (px)
Citation preview
Product and Policy Life Cycle Inventories with Market Driven Demand: An Engine Selection Case Study
Hillary Grimes-Casey3, Carol Girata1, Katie Whitefoot2, Gregory A. Keloeian3, James J. Winebrake4, Steven J. Skerlos1,2
{1Mechanical Engineering, 2Design Science, 3Natural Resources and Environment}, University of Michigan 4Public Policy, Rochester Institute of Technology
Abstract This paper introduces consequential life cycle assesment with market driven demand (LCA-MDD) to permit endogenous estimation of economic effects that are important in evaluating the environmental characteristics of product and policy design options. While the derivation of a computational LCI-MDD framework is shown to be straightforward, a major challenge is appropriately managing and communicating the uncertainties. To better understand and explore these uncertainties, this paper develops a case study that estimates the life cycle greenhouse gas emissions associated with selecting an engine for a mid-sized vehicle. A comparison is made between extrapolating a reference LCI model and employing LCI-MDD.
Keywords: LCA; Sustainable Design
1 INTRODUCTION
Industrial ecology “focuses on the potential role of industry in reducing environmental burdens throughout the product lifecycle [1]. To enable that focus, life cycle inventory (LCI) - a stage of life cycle assessment (LCA) - characterizes materials, energy, wastes, and emissions flows through a product or service system [2,3]. While LCI as a formality is intended only for the evaluation of an existing system, it is often called into service as an aid to future product or policy design [4-8]. The more prevalent attributional LCI quantifies product system material and energy consumption and emissions using average production and environmental data, often for existing systems [9]. Otherwise, attributional LCI often relies on use of exogenous assumptions to extrapolate existing economic and behavioral interactions intofuture product system scenarios. These assumptions can neglect how those market interactions may change as a result of design changes to provide the same service, with the result that environmental performance may be much different than anticipated.
Conventional, process-based LCI has rarely utilized economic models that demonstrate how product design attributes influence market response in purchasing and use, ultimately dictating much of the life cycle environmental performance. The result is a potential for industrial design improvements based on attributional LCI to be later thwarted by otherwise unforeseen consequences such as economic rebound effects which have been found through general equilibrium modeling to reduce or even reverse intended improvements in performance such as energy efficiency [10-11].
On the other hand, the lesser-used consequential LCI employs marginal production and environmental data to quantify the material, energy and emissions consequences of changes in product systems, often due to policy decisions [8, 9, 12]. This modeling approach may better incorporate economic and technical simulations to determine environmental feedback (disproportionate decrease or increase in resource use or emissions for a change in technology that also impacts demand for that technology) and rebound effects of changes in product designs.
This paper contributes to the consequential LCI methodology, extending the boundaries of process-based LCI (Figure 1A) to include the impacts of economic behavior of markets and individuals on a product system via endogenous models (Figure 1B). Figure 1B can be considered an approach to life cycle inventory with market driven demand (LCI-MDD), which pursues the idea that the utility of LCI can be enhanced with respect to the needs of stakeholders such as policymakers and designers when economic and behavioral information is incorporated. While this area has not been widely studied, the idea itself is not new. In fact it is well known that prices, economic policy instruments, and other socio-economic factors change material flows and influence the environmental burdens of a product system [13-14], and that changes in materials flows through a product system can have macro-economic repercussions [15-16].
Michalek et al. (2005) demonstrated that a game theoretic approach could be used to evaluate the impact of government policies on vehicle design decisions made by automotive producers [17]. Below we propose to extend the example using a game theoretic approach to LCI-MDD and its application to product and policy design. The objective is to better understand the feasibility of LCI-MDD and to demonstrate its application for the study of rebound effects in product and policy design contexts. Another objective is to stress the need to develop a set of standards and best practices for LCI-MDD – recognizing that additional uncertainties must be managed when incorporating market simulations within a LCI framework. These additional uncertainties, and the modeling approaches used to address them, should be presented in a transparent and clear manner. For this reason it is important to distinguish between LCI and LCI-MDD as the distinction denotes a host of uncertainties in market simulation modeling that are separate from, and in addition to, the system and data uncertainties already present in LCI.
Section 2 introduces a case study used to test the feasibility of the LCI-MDD approach. Section 3 presents the results of the case study. Section 4 offers a discussion of the usefulness and practice of LCI-MDD based on the learning of this research.
558J. Hesselbach and C. Herrmann (eds.), Glocalized Solutions for Sustainability in Manufacturing: Proceedings of the 18th CIRP International Conference on Life Cycle Engineering, Technische Universität Braunschweig, Braunschweig, Germany, May 2nd - 4th, 2011, DOI 10.1007/978-3-642-19692-8_97, © Springer-Verlag Berlin Heidelberg 2011

2 LCI-MDD CASE STUDY OVERVIEW: ENGINE SELECTION FOR MID-SIZE VEHICLE
This case study considers the selection of engine power during the design of a mid-size vehicle. As the engine power varies, the body mass of the vehicle also must vary to support the selected engine while all other aspects of the vehicle are assumed fixed and equivalent to the mid-sized vehicle considered in [4]. A larger engine power decreases fuel economy and increases acceleration and production costs. It also increases upstream material and manufacturing emissions as well as downstream end-of-life unit processes. Also varying with engine power is the vehicle operating cost (e.g., dollars per mile driven) and so vehicles with larger engine sizes will on average have fewer miles driven per year.
The following paragraphs summarize the life cycle unit processes and models employed. In the interest of brevity and focus, many of the details are left to references. The descriptions are only meant to show that realistic models from the literature were utilized, leading to results presented in Section 3. We do not intend for the actual numerical results in Section 3 to reflect real-world results; rather the goal here is to explore LCI-MDD concepts in the form of Figure 1B and share the findings.
Life Cycle Unit Processes (Materials, Manufacturing, and End of Life). The unit process model begins with the generic vehicle life cycle inventory from the US Automotive Materials Partnership [4], which estimates the material and energy profile for a mid-sized vehicle with a gasoline engine (3 L, 104 kW). The baseline vehicle material inputs represent 90% of the body mass, 86.5% of the powertrain mass and 97% of the suspension mass. The vehicle
characterization is simplified and does not account for certain processes and components not impacted by the powertrain system (further discussed below). In the LCI-MDD model, producers are allowed to select different engines in the range of 75%-150% of the power ratings of the base vehicle from the USAMP study. To determine the mass of these engines, the analysis here combines the power-displacement data from [18] with the displacement-mass data from [19]. The vehicle frame and body must support the weight of any engine option while taking into account the ‘secondary’ weight effects for the entire vehicle. This effect is accounted for with a weight-compounding factor of 0.5 from [20]. In manufacturing engines and vehicle bodies, the appropriate quantity of materials are combined with energy inputs. Here it is assumed that energy inputs for engine manufacture are constant for any engine size, and that energy used in body manufacture varies with body mass. A suspension system of constant size is also manufactured with materials and energy as modeled in the generic vehicle LCI of [4].
Vehicles are assembled from the manufactured systems with additional inputs of materials (no other systems manufacturing is modeled) and energy. After production, the new vehicles are driven their useful life and then sent to a shredder, which recovers metals and sends non-metals to a landfill. Other non-metal inputs are not currently modeled and the model also does not consider transportation between processing facilities.
Life Cycle Unit Processes (Use Phase). A typical LCI might calculate the total number of miles travelled during the lifetime of the vehicle using a fixed age (in years) and constant VMT per year.
Figure 1: (A) The life cycle inventory approach, and (B) the predictive life cycle inventory framework. Solid arrows indicate the flow of materials and information (including market information). In 1B, the dashed arrows indicate a potential extension of the framework to test
policy strategies.
Information and Knowledge Management 559
This analysis considers a vehicle lifetime of 15 years with the number of miles travelled per year varying depending on vehicle fuel economy, fuel price and age. It is recognized that vehicles might be replaced after a fixed mileage or that vehicles can be used longer than 15 years but for brevity these issues are not considered in Section 3. VMT per year is estimated using two independent econometric models that have been derived to explain fuel consumption trends for light duty vehicles in the US [21-22] and compared to US Department of Transportation VMT data. Demographic and transportation infrastructure variables that factor into these models were assigned constant average values using 1990’s data to align with the input LCI data. Vehicle operating costs and price variables were dependent on the results of the market-optimal product design emanating from the LCI-MDD producer decision model.
Producer Decision Model. The LCI-MDD methodology utilizes profit-maximization in game-theoretic Nash equilibrium as a model of producer decision-making and follows the approach described in [23]. Five producers are nominally modeled, but the qualitative results of the analysis for this case study do not change as a result of this assumption. To start, each producer k decides on a set of
products to produce including design decisions, prices, and production volumes. Specifications of the design variables xj (engine size and final drive ratio) determine the product characteristics yj (fuel consumption and acceleration) that are observed by the consumer (subscript is “for vehicle j”). The mapping xj to yj occurs using the vehicle simulation and production costs described in [17]. Consumers make purchasing choices among the set of all products based on the product characteristics and price of each product, resulting in an overall number of products sold for each engine size calculated by the demand model. Each producer k attempts to maximize its profit πk (sales revenue for quantity qj at price pj, minus costs cj) by making the best possible design, pricing, and production decisions according to Equation 1:
(1)
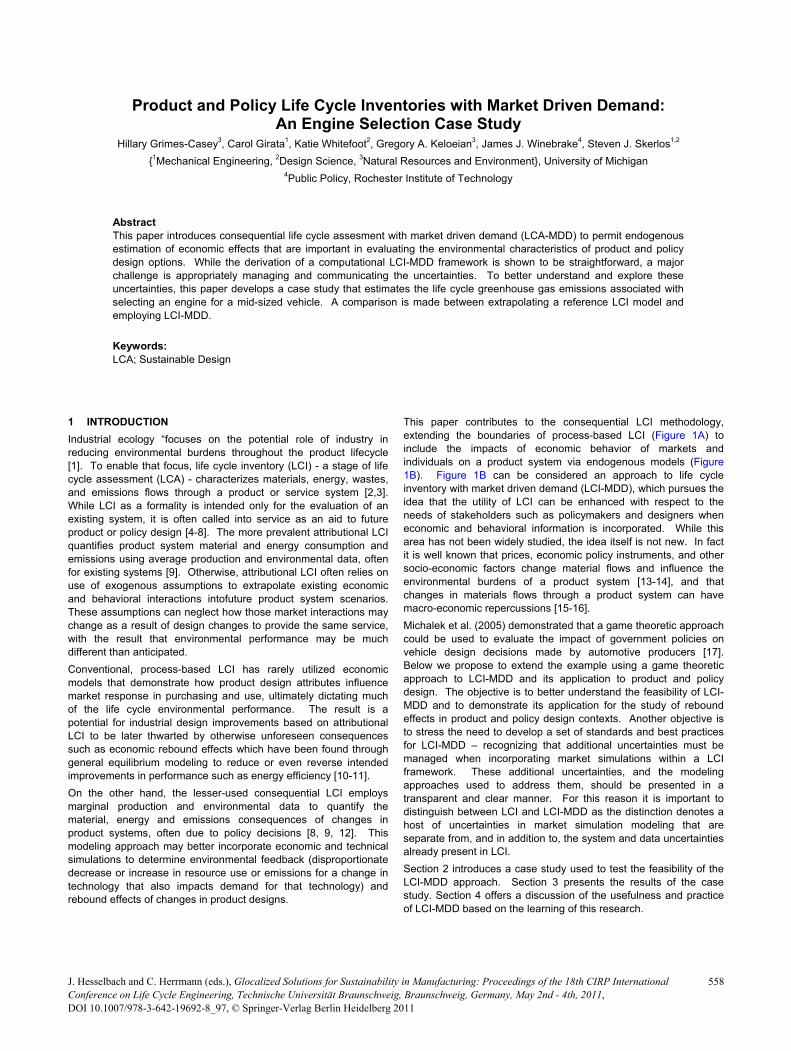
Figure 2: (A) Effect of varying VMT on life cycle CO2-equivalent emissions using LCI framework, and (B) Emissions from the 104kW engine when VMT is 11,200 miles broken down by life cycle stage.
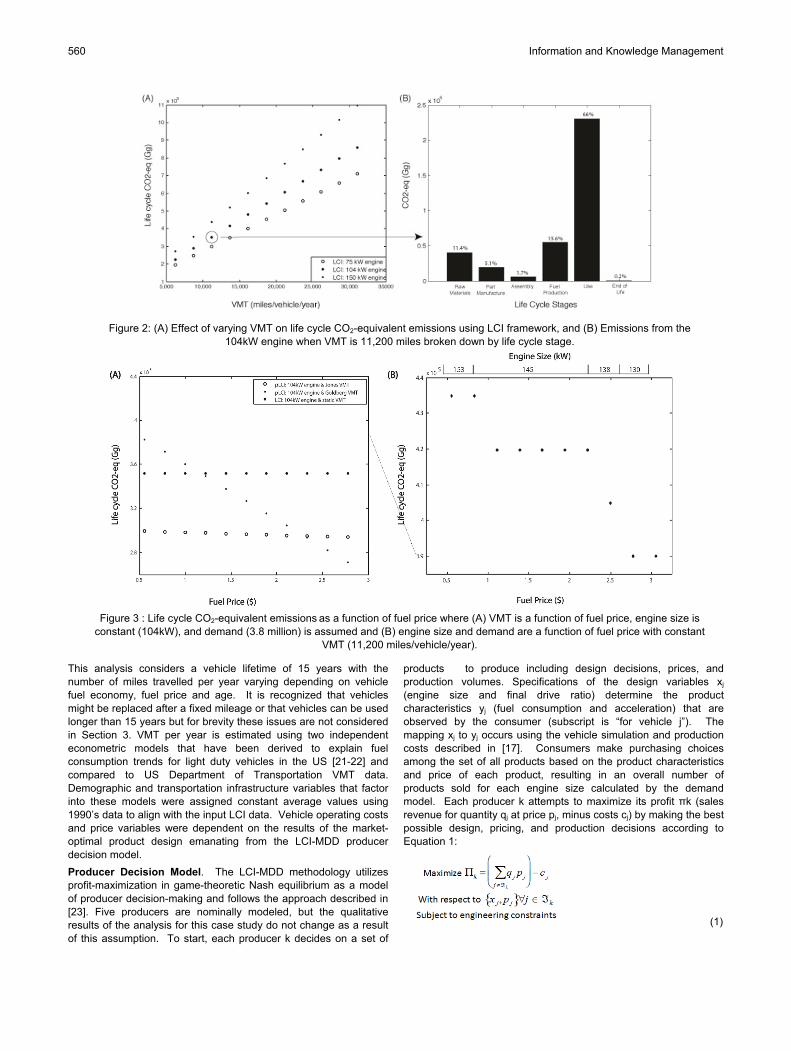
Figure 3 : Life cycle CO2-equivalent emissions as a function of fuel price where (A) VMT is a function of fuel price, engine size is constant (104kW), and demand (3.8 million) is assumed and (B) engine size and demand are a function of fuel price with constant
VMT (11,200 miles/vehicle/year).
Information and Knowledge Management560
Demand Model Selection. A logit model is used to represent consumer preferences based on [24]. Again, the model is used for illustrative purposes only. While dated, this econometric analysis presents attractively simple relationships between vehicle attributes and vehicle demand, and serves this paper’s purpose for testing the LCI-MDD approach by deriving a representative vehicle demand estimate. The model incorporates the possibility that consumers will reject the product offering and not purchase a vehicle. This means lower fuel economy vehicles are kept on the road, since the distribution of ‘pre-existing’ mid-size vehicles on average had 0.7 MPG less than new mid-size vehicles in 1995, while pre-existing cars on the road of all types got on average 1.9 MPG lower than a average 1995 new vehicle in the US.
Market Simulation. To account for competition as a driver for producers to select a specific engine size, game theory is used to find the market (Nash) equilibrium among competing producers. In game theory, a set of actions is in Nash equilibrium if, for each producer k=1,2,…,K, given the actions of its rivals, the producer cannot increase its own profit by choosing an action other than its equilibrium action. In order to find the Nash equilibrium point for a set of K producers, the decision variables of each producer are optimized to maximize the profit of that producer while holding the decisions of all other producers’ constant. This process is then iterated, optimizing all producers k = 1,2,…,K in sequence until convergence, yielding the Nash equilibrium for K producers, where K in the example below is set to the largest value that yields positive profit for the producers. Additional details on this approach can be found in [17].
3 RESULTS AND DISCUSSION: LCI-MDD CASE STUDY
Results. In order to provide context for the LCI-MDD results, a foundational LCI (to be compared with LCI-MDD below) was developed as described in Section 2. Figure 2A provides life cycle greenhouse gas emissions expressed as CO2-equivalents. The results are presented assuming 3.8 million vehicles were sold and each of these vehicles is driven the same amount. Both VMT and engine size are variables for which a sensitivity analysis is provided. VMT ranges from 5,000 to 30,000 miles/vehicle-year and three different engines are considered (75kW, 104kW, and 150kW, or 56 hp, 78 hp and 112 hp). Results are generally as expected showing a dominance of the use-phase; values differ slightly from previous total vehicle life cycle results [4] due to the vehicle system boundary simplifications defined in Section 2. For example, the results show that doubling VMT will cause a 79% increase in life cycle CO2-equivalent emissions for the 104 kW engine and an 83% increase for the 150 kW engine. Figure 3B illustrates how the life cycle CO2-
equivalent emissions are broken down by life-cycle stage for the case where VMT is 11,200 miles and the selected engine is 104kW.
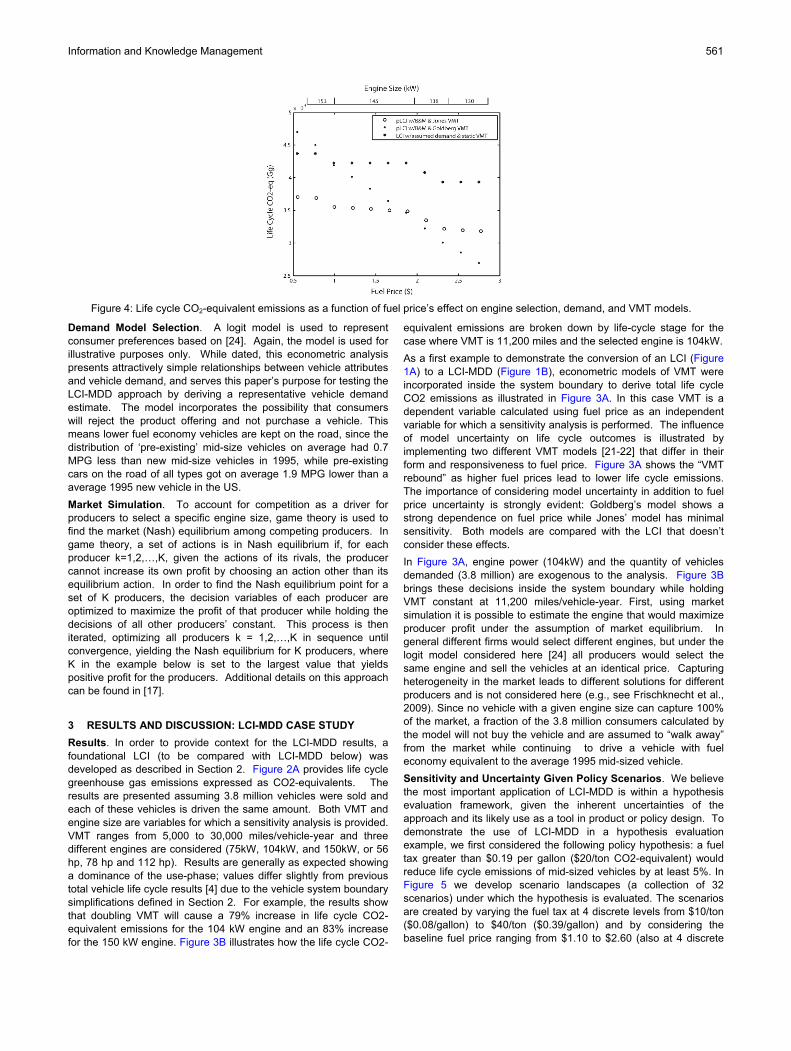
As a first example to demonstrate the conversion of an LCI (Figure 1A) to a LCI-MDD (Figure 1B), econometric models of VMT were incorporated inside the system boundary to derive total life cycle CO2 emissions as illustrated in Figure 3A. In this case VMT is a dependent variable calculated using fuel price as an independent variable for which a sensitivity analysis is performed. The influence of model uncertainty on life cycle outcomes is illustrated by implementing two different VMT models [21-22] that differ in their form and responsiveness to fuel price. Figure 3A shows the “VMT rebound” as higher fuel prices lead to lower life cycle emissions. The importance of considering model uncertainty in addition to fuel price uncertainty is strongly evident: Goldberg’s model shows a strong dependence on fuel price while Jones’ model has minimal sensitivity. Both models are compared with the LCI that doesn’t consider these effects.
In Figure 3A, engine power (104kW) and the quantity of vehicles demanded (3.8 million) are exogenous to the analysis. Figure 3B brings these decisions inside the system boundary while holding VMT constant at 11,200 miles/vehicle-year. First, using market simulation it is possible to estimate the engine that would maximize producer profit under the assumption of market equilibrium. In general different firms would select different engines, but under the logit model considered here [24] all producers would select the same engine and sell the vehicles at an identical price. Capturing heterogeneity in the market leads to different solutions for different producers and is not considered here (e.g., see Frischknecht et al., 2009). Since no vehicle with a given engine size can capture 100% of the market, a fraction of the 3.8 million consumers calculated by the model will not buy the vehicle and are assumed to “walk away” from the market while continuing to drive a vehicle with fuel economy equivalent to the average 1995 mid-sized vehicle.
Sensitivity and Uncertainty Given Policy Scenarios. We believe the most important application of LCI-MDD is within a hypothesis evaluation framework, given the inherent uncertainties of the approach and its likely use as a tool in product or policy design. To demonstrate the use of LCI-MDD in a hypothesis evaluation example, we first considered the following policy hypothesis: a fuel tax greater than $0.19 per gallon ($20/ton CO2-equivalent) would reduce life cycle emissions of mid-sized vehicles by at least 5%. In Figure 5 we develop scenario landscapes (a collection of 32 scenarios) under which the hypothesis is evaluated. The scenarios are created by varying the fuel tax at 4 discrete levels from $10/ton ($0.08/gallon) to $40/ton ($0.39/gallon) and by considering the baseline fuel price ranging from $1.10 to $2.60 (also at 4 discrete
Figure 4: Life cycle CO2-equivalent emissions as a function of fuel price’s effect on engine selection, demand, and VMT models.
Information and Knowledge Management 561

levels). Using two different VMT models with one landscape each containing 16 scenarios yields 32 scenarios in total. Scenarios for which the hypothesis is rejected under the model assumptions are indicated with (X), and those scenarios which exhibit support for the hypothesis are indicated with (check). Since the Boyd and Mellman (1980) model is an econometric model with parameters estimated from data, a parametric uncertainty analysis was also performed. In some cases, the uncertainty of the parameters would not allow a clear determination of support or rejection of the hypothesis. In these cases an (O) is indicated in Figure 5.
Figure 6 shows that it is also possible to establish hypotheses related to the consequences of design decisions. For instance, one could hypothesize that a new technology costing $3000 that can increase fuel economy by 5 miles per gallon is able to reduce life cycle CO2-equivalent emissions by 10%, even if the manufacturing emissions would need to double to achieve this fuel economy improvement. Figure 6 is the scenario landscape plot created by evaluating this hypothesis under 8 scenarios (four different base fuel prices and two different VMT models). The results show that at low fuel prices, where VMT is relatively high, the new technology can be effective to reduce life cycle CO2-equivalent emissions by 5% relative to the vehicle without the new technology. Results at higher fuel prices are mixed since VMT is reduced and therefore the manufacturing phase of the life cycle is relatively more important.
4 CONCLUSIONS
Sustainability is ultimately a challenge to technology and policy design processes that urges them to consider economic success simultaneously with environmental and societal performance. Life Cycle Inventory (LCI) considers environmental performance independent of economic behavior while Predictive Life Cycle Inventory (LCI-MDD) considers environmental performance as an outcome of economic behavior. A LCI-MDD is constructed by considering the consequences of incorporating economic and behavioral models within the system boundary of an LCI. This paper has shown that LCI-MDD is useful when considering the ramifications of future technology or policy design decisions, particularly ones which may exhibit rebound effects that would
otherwise be undetectable by extrapolating the foundational LCI on which the LCI-MDD is based. While LCI-MDD as a concept is shown to be feasible, it creates additional structure, models, parameters, and variables that inherently make the system more complex. This complexity increases the already stringent demands within LCI to explicitly manage uncertainty and to transparently communicate results.
To better understand the challenges of LCI-MDD, a hypothetical case study of engine selection for a mid-sized vehicle was considered. While the case study itself was not meant to be representative of today’s automotive market, the constituent models selected were realistic enough to explore the details of LCI-MDD methodology. For instance, it was found that the rebound effects that are known to exist in the design stage and in the use-phase of the vehicle life cycle are detectable as a function of the price of fuel. In the design stage, assumptions of higher future fuel prices lead producers to select smaller engines with higher fuel economy since consumers will be more interested in these vehicles. In the use-phase of the life cycle, consumers drive less as the fuel price increases. Comparing these rebound effects, it was found that the “use-phase rebound” is more significant than the “design-stage rebound”. Although neither rebound effect is a surprise, the true power of LCI-MDD lies in its ability to quantify the results under uncertainty and to provide the basis for hypothesis evaluation.
Hypothesis evaluation is relevant both for technology design and for policy design and examples of both were provided in this article. For instance, it was shown that 1) the impact of carbon taxes on engine selection and life cycle emissions could be estimated, and 2) the life cycle benefits of new technologies designed to reduce use-phase emissions could be estimated. While these examples were hypothetical, the models employed could be updated to more closely capture real market behavior. For instance, research that is required to improve the demand models (e.g., [25]), vehicle performance models [26], and simulation approaches [27] is on-going. Instead of incorporating these more sophisticated models, this work was meant to serve as a basic blueprint for the predictive life cycle inventory method in the hope of inspiring interest for future research in this area within the life cycle assessment community
Figure 5: Scenario landscape results for a policy hypothesis with varying tax levels and fuel price.
Figure 6: Scenario landscape results for the design hypothesis with varying fuel prices.
Information and Knowledge Management562

and beyond, working together with needed experts in technology design, behavioral research, policy, economics, etc. We expect the resulting discussion will advance LCI-MDD and further increase its relevance to the sustainable design of products and the design of technology policies intending to promote sustainable development.
5 ACKNOWLEDGEMENTS
This research was supported by the Michigan Memorial Phoenix Energy Institute, Alcoa Foundation’s Conservation and Sustainability Fellowship Program and a National Science Foundation MUSES (National Science Foundation Materials Use: Science, Engineering and Society) grant (CMMI 0628162). One of the authors was funded through the Alcoa Foundation Conservation and Sustainability postdoctoral fellowship program which is a separate entity from Alcoa. Any opinions, findings, and conclusions or recommendations expressed in this material are those of the author(s) and do not necessarily reflect the views of the National Science Foundation. The authors are grateful for valuable input from Colin McMillan, Bart Frischknecht, Dr. Hyung-Ju Kim, and Esra Suel at the University of Michigan, and for contributions from Professor Jeremy Michalek, Carnegie Mellon University.
6 REFERENCES
[1] Lifset, R. (2006): Industrial ecology and life cycle assessment, what’s the use? International Journal of Life Cycle Assessment 11(1):14-16.
[2] SETAC. (1993): Guidelines for Life-Cycle Assessment: A “Code of Practice”, Edition 1, Society of Environmental Toxicology and Chemistry Workshop, Sesimbra, Portugal.
[3] ISO (1997): ISO 14040: Environmental Management-Life Cycle Assessment—Principles and Framework, International Organization for Standardization, Geneva.
[4] Keoleian, G.A., G.M. Lewis, R.B. Coulon, V.J. Camobreco, and H.P. Toulon (1998): LCI modeling challenges and solutions for a complex product system: a mid-sized automobile. SAE Technical Papers Series, no.982169.
[5] Ehrenfeld, J. (1997): The importance of LCAs—warts and all, Journal of Industrial Ecology, 1(2).
[6] Nielsen, P.H., H. Wenzel (2002): Integration of environmental aspects in product development: a stepwise procedure based on quantitative life cycle assessment. J. Cleaner Production, 10:247-257.
[7] Spielmann, M., R. Scholz, O. Tietje, and P. de Haan. Scenario modeling in prospective LCA of transport systems. International Journal of Life Cycle Assessment, 10(5):325-335.
[8] Sanden, B.A., and M. Karlstrom (2007): Positive and negative feedback in consequential life cycle assessment. Journal of Cleaner Production 15(15):1469-1481.
[9] Finnveden, G., M. Hauschild, T. Ekvall, J. Guin’ee, R. Heijungs, S. Hellweg, A. Koehler, D. Pennington, S. Suh. (2009): Recent developments in life cycle assessment. Journal of Environmental Management, 91:1-21.
[10] Allan, G., N.Hanley, P. McGregor, K. Swales, K. Turner. (2007): The impact of increased efficiency in the industrial use of energy: a computable general equilibrium analysis for the United Kingdom. Energy Economics, 29:779-798.
[11] Turner, K. (2009): Negative rebound and disinvestment effects in response to an improvement in energy efficiency in the UK economy. Energy Economics, 31:648-666.
[12] Ekvall, T. and B. Weidema (2004): System boundaries and input data in consequential life cycle inventory analysis. International Journal of Life Cycle Assessment,9(3): 161-171.
[13] Kandelaars, P. P.A.A.H. and JCJM van den Bergh (1997): Dynamic analysis of materials-product chains: an application to window frames. Ecological Economics, 22:41-61.
[14] Frischknecht, R. (2000): Allocation in life cycle inventory analysis for joint production. International Journal of Life Cycle Assessment 5(2):85-95.
[15] Suh, S., G. Huppes (2005): Methods for life cycle inventory of a product. Journal of Cleaner Production, 13, pp.687-697.
[16] Takase, K., Y. Kondo, A. Washizu (2005): An analysis of sustainable consumption by the waste input-output model. Journal of Industrial Ecology 9(1-2): 201-219.
[17] Michalek, J.J., P.Y. Papalambros, and S.J. Skerlos. A study of fuel efficiency and emission policy impact on optimal vehicle design decisions. Transactions of the ASME, 126(November):1062-1070.
[18] Arnold, S., C. Balis, D. Jeckel, S.Larcher, P.Uhl, S.M. Shahed. (2005): Advances in turbocharging technology and its impact on meeting proposed California GHG emission regulations. SAE Technical Paper Series, SAE World Congress, Detroit MI, April 11-15.
[19] Messner, C. (2007): Werkstoffe fur Motoren und Antriebssyteme, I Otto- und Dieselmotoren.
[20] Lave, L., H. Maclean, C. Hendrickson, and R.Lankey (2000): Life cycle analysis of alternative automobile fuel/propulsion technologies. Environmental Science and Technology, 34:3598-3605.
[21] Jones, C.T., Another look at US passenger vehicle use and the 'rebound' effect from improved fuel efficiency, Energy Journal, 14:4, pp.99-110, 1993. Boyd, J.H. and R.E. Mellman. 1980. The effect of fuel economy standards on the US automotive market: an hedonic demand analysis, Transportation Research Record A, 14:367-78.
[22] Goldberg, P.K. (1998): The effects of the corporate average fuel efficiency standards in the US. Journal of Industrial Economics, 46(1):1-33.
[23] Skerlos, S.J., Morrow, W.R., and J.J. Michalek (2005): Sustainable Design Engineering and Science: Selected Challenges and Case Studies. Sustainability Science and Engineering, M. Abraham Ed., Elsevier, 477-525.
[24] Boyd, J.H. and R.E. Mellman 1980: The effect of fuel economy standards on the US automotive market: an hedonic demand analysis, Transportation Research Record A, 14, pp.367-78.
[25] Frischknecht, B., K. Whitefoot, and P.Y. Papalambros (2009): Methods for evaluating suitability of econometric demand models in design for market systems, 2009 ASME International Design Engineering Technical Conferences, San Diego, CA, August 30-September 2, DETC2009-87165.
[26] Frischknecht, B. (2009): Exploring public/private tradeoffs in vehicle design through engineering models and market simulation. Doctoral Thesis, University of Michigan, Ann Arbor.
[27] Morrow, R. (2008): Equilibrium pricing in empirically relevant differentiated product market models. Doctoral Thesis, University of Michigan, Ann Arbor.
Information and Knowledge Management 563