Embed Size (px)
Citation preview
PRODUCE CONSUMPTION PATTERNS
AMONG PREGNANT WOMEN IN DELAWARE:
HEALTH, INCOME,
AND POLICY IMPLICATIONS
by
Erin Dugan
A thesis submitted to the Faculty of the University of Delaware in partial fulfillment of the requirements for the degree of Honors Degree in Public Policy with Distinction
Spring 2016
© Year Author All Rights Reserved
1 1
Produce Consumption Patterns
Among Pregnant Women In Delaware:
Health, Income, and Policy Implications
by
Erin Dugan
Approved:
Daniel Rich, Ph.D. Professor in charge of thesis on behalf of the Advisory Committee
Approved:
Erin Knight, Ph.D. Committee member from the Department of Public Policy
Approved:
Avron Abraham, Ph.D. Committee member from the Board of Senior Thesis Readers
2 2

Approved:
Michael Arnold, Ph.D. Director, University Honors Program
3 3

ACKNOWLEDGMENTS
I owe a great deal of thanks to my undergraduate thesis committee. Throughout this process, they have offered me incredible guidance, and I am so grateful for their expertise. I would also like to acknowledge the help of Mary Joan McDuffie of the Health Services Policy Research Group for possessing a wealth of knowledge on health databases and advising my data usage efforts. A special thanks goes to Dr. Erin Knight, who exposed me to the study of public health and stood by me at every step of my undergraduate career, providing me with academic opportunities, research opportunities, and internship opportunities. Dr. Knight, you cemented my passion for social change by sharing yours, and I cannot thank you enough.
I would also like to thank my friends and family, who have given me
all the support that I could have ever asked for in the past year. This was not an easy undertaking, and I know I am lucky to have such an amazing network of people in my life. Mom and Dad, thank you for encouraging me to tackle this project, and thank you for always picking up the phone to listen to me complain about my academic stressors and problems. Kelly Daniels and Victoria Snare, you motivated me and kept me laughing in all thesisrelated crises. Finally, this project was made much more enjoyable through my partnership with Yousef Aly. Thank you so much for the study breaks, the sugarfilled coffee, the music recommendations. Thank you for keeping me on track and taking an interest in my project. I am so fortunate to have had you sitting across from me in the library and the ISE lab.
Finally, I want to thank the Honors Program at the University of Delaware. I am here because of the Honors Program. My four years as a blue hen have been defined by the experiences that I was offered through the faculty and staff of this university, and I will never forget the encouragement that I have received here. Mr. Peters, thank you for always appreciating my intellect and spurring me to consider topics outside of my comfort zone. Kristin Bennighoff, thank you for giving me the extra push and the additional boost of confidence necessary for the most important moments of my undergraduate career. You are my biggest cheerleader and I cannot imagine college without you. This paper is undoubtedly a representation of my commitment to academics, but my experience at the University of Delaware will always be more clearly defined by the people that I have been fortunate enough to surround myself with.
4 4

5 5

TABLE OF CONTENTS
LIST OF TABLES LIST OF FIGURES ABSTRACT
INTRODUCTION
1 LITERATURE REVIEW
Importance of Fruits and Vegetables for Overall Health Congenital Anomalies Birth Weight Wheezing, Asthma, and Cardiovascular Disease Influence of Socioeconomic Status on Diet Quality
2 METHODS
The Behavioral Risk Factor Surveillance System
About the BRFSS Benefits of the BRFSS Limitations of the BRFSS Use of the BRFSS Responses 2012 Delaware BRFSS 2013 Delaware BRFSS
Analyzing the Data
3 RESULTS
4 DISCUSSION
5 POLICY RECOMMENDATIONS
6 CONCLUSION
REFERENCES
6 6

7 7
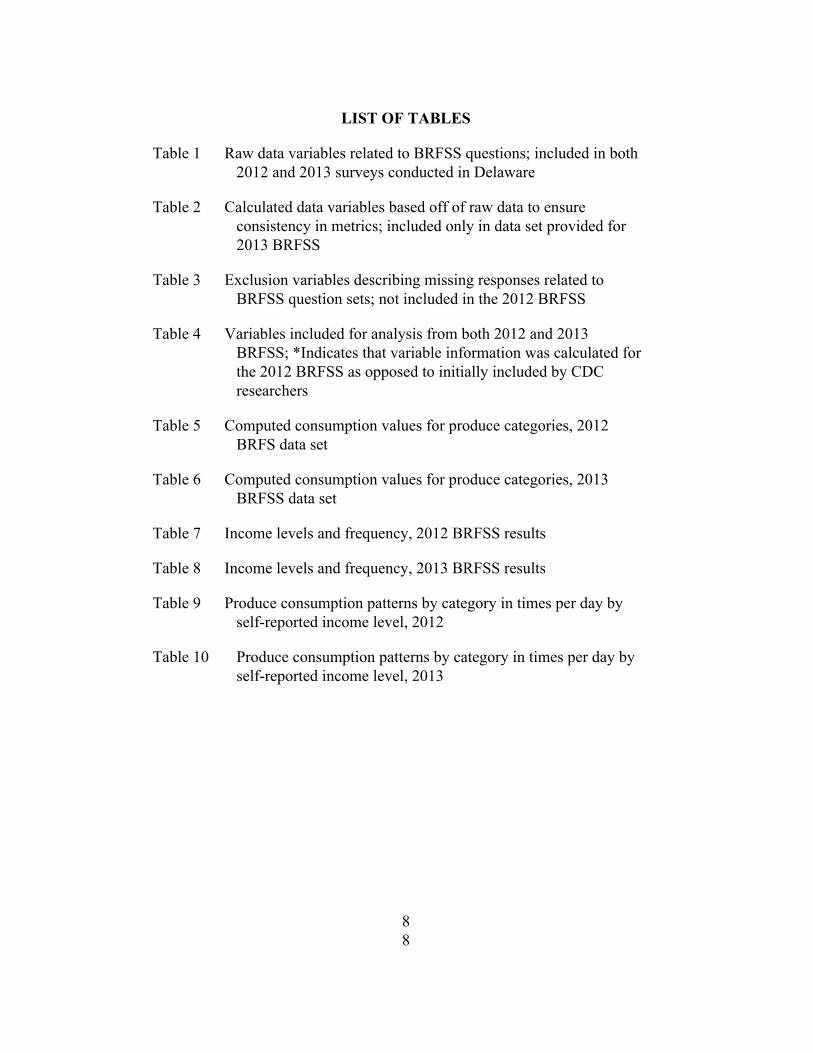
LIST OF TABLES
Table 1 Raw data variables related to BRFSS questions; included in both 2012 and 2013 surveys conducted in Delaware
Table 2 Calculated data variables based off of raw data to ensure consistency in metrics; included only in data set provided for 2013 BRFSS
Table 3 Exclusion variables describing missing responses related to BRFSS question sets; not included in the 2012 BRFSS
Table 4 Variables included for analysis from both 2012 and 2013 BRFSS; *Indicates that variable information was calculated for the 2012 BRFSS as opposed to initially included by CDC researchers
Table 5 Computed consumption values for produce categories, 2012 BRFS data set
Table 6 Computed consumption values for produce categories, 2013 BRFSS data set
Table 7 Income levels and frequency, 2012 BRFSS results
Table 8 Income levels and frequency, 2013 BRFSS results
Table 9 Produce consumption patterns by category in times per day by selfreported income level, 2012
Table 10 Produce consumption patterns by category in times per day by selfreported income level, 2013
8 8

LIST OF FIGURES
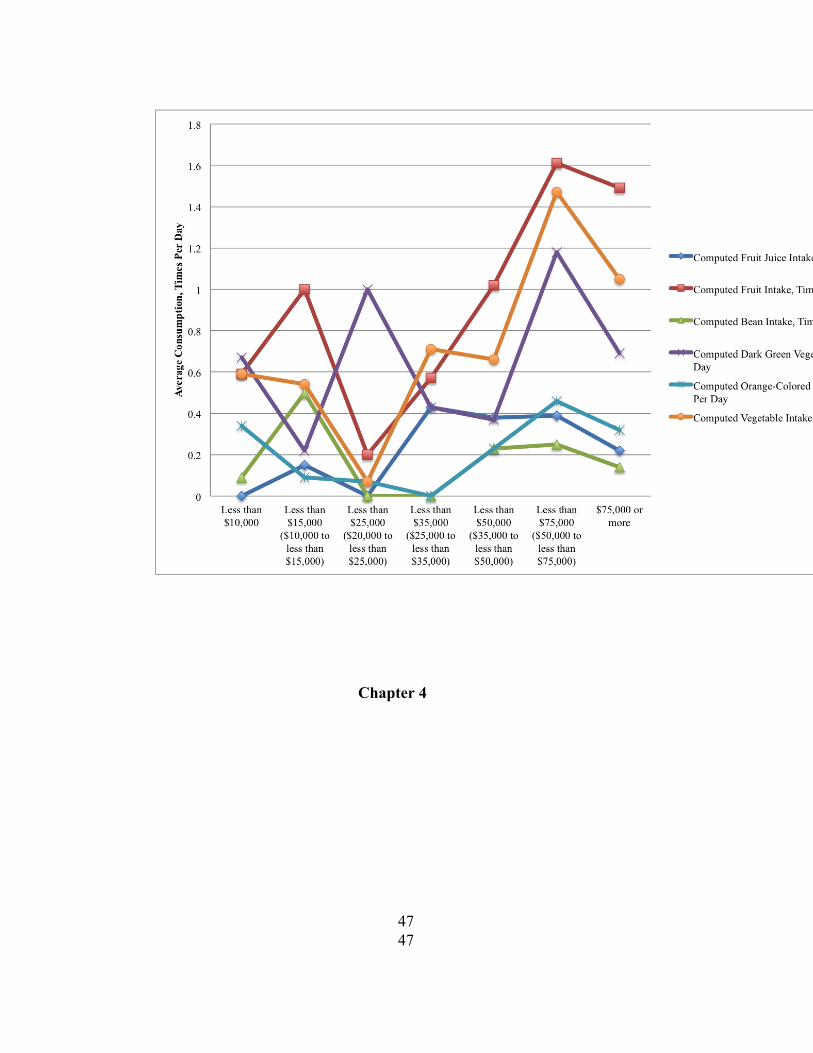
Figure 1 Average produce intake by selfreported income level, 2012
Figure 2 Average produce intake by selfreported income level, 2013
9 9
ABSTRACT
Produce plays an integral role in a wellbalanced diet and research has continually demonstrated the importance of consuming fruits and vegetables to reduce one’s risk of cancers, heart disease, obesity, type 2 diabetes and other health problems. For pregnant women, diet is especially important. Certain vitamins and minerals, such as folic acid, are vital for a healthy pregnancy, and have been found to reduce birth defects in infants as well as the risk of developing other, more longterm health problems in children. Most of these nutrients are found in fruits and vegetables.
The consumption of fruits and vegetables in the United States is notoriously low, and very few Americans eat the World Health Organization’s recommended five daily servings. A lowquality diet is thought to be the result of a variety of factors, but the social determinants of health such as income may play a meaningful role. This paper examines the importance of produce consumption during pregnancy and the fruit and vegetable consumption patterns of pregnant women in the state of Delaware, as indicated by the Behavioral Risk Factor Surveillance System. Furthermore, this paper will assess whether or not income is related to the produce consumption patterns of pregnant women, and assess the research concerning motivations behind personal diet choices.
10 10
INTRODUCTION The health status of a mother is a major determinant in the health
outcomes of an infant. Around the world, countries have begun to examine the health of mothers and children, largely spurred by the United Nations Millennium Development Goal 5, improving maternal health (Filippi, 2006). The United States is not exempt from these working efforts, ranking 33rd of 179 countries in Save the Children’s (2015) 16th annual Mothers’ Index, which assesses the health and wellbeing of women and children. According to Amnesty International (2011), 34,000 women die each year in the U.S. of pregnancy related complications and care for childbearing women and newborns is the number one reason for hospitalization. Furthermore, the situation of childbearing women shows few signs of recent improvement. In a report for Maternal and Child Health Journal, Atrash et. al. (2006) explains that despite the advances in medical technology and usage, there has been a slowing of improvements in maternal health and infant outcomes over the course of the last two decades of the 20th century, and in some cases, these outcomes have even deteriorated. Furthermore, although some infant deaths “might have been prevented through interventions targeted at improving the health of mothers and modifying behaviors contributing to adverse pregnancy outcomes, poor maternal health, behaviors contributing to adverse pregnancy outcomes, and maternal complications of pregnancy continue to be prevalent,” (Atrash et. al., 2006, p.4).
A vital component of health, especially the health of pregnant women, is diet and nutrition. According to the U.S. Department of Agriculture [USDA] and the Department of Health and Human Services (2010), a healthy diet is essential for the prevention of chronic disease and the promotion of overall health. Such a diet is often characterized by limited intakes of sodium, fats, added sugars and refined grains, with an emphasis on nutrientdense foods, such as fresh produce, whole grains, lowfat dairy products, seafood, and lean meats (USDA, 2010). Consumption of such nutrient dense foods is especially important when it comes to experiencing a healthy pregnancy and positive child outcomes. Nutrition is one area of risk screening for preconception care as defined by the American Academy of Pediatrics and the American College of Obstetricians and Gynecologists (Johnson, 2006) and diseases associated with an unhealthy diet (such as obesity and type 2 diabetes) have been linked to adverse pregnancy outcomes for both mothers and children (Leddy, 2008; Rosenberg, 2005).
For the purposes of my undergraduate thesis, I chose to analyze one of the pillars of a healthy diet, the consumption of fruit and vegetables, among a
11 11
specific target group, pregnant women in Delaware. A food group that is “universally promoted as healthy” (Slavin, 2012, p.506), fruits and vegetables are also consumed far less often in the United States than international and national guidelines recommend. My analysis focused on responses from the 2012 and 2013 Behavioral Risk Factor Surveillance System [BRFSS] conducted in the state of Delaware. First, I wanted to gain a better understanding of the importance of fruit and vegetable consumption for overall health, specifically for a vulnerable population such as pregnant women. I conducted extensive research on past studies aimed at understanding the connection between various health conditions and diets rich in produce, as well as studies that described the impact of produce consumption on pregnancies. Next, I utilized responses from the BRFSS to understand whether or not pregnant women in Delaware consumed an adequate amount of fruits and vegetables, defined by the World Health Organization and the Centers for Disease Control as five servings per day. I assessed this data using only descriptive statistics given the small size of my data set. Finally, I used the BRFSS to examine whether or not selfreported income demonstrated a connection to the level of consumption of fruits and vegetables. My background in health policy informed my work efforts and encouraged me to examine the societal influences on produce consumption among different groups. My research questions can be described as follows:
Question 1: Why are fruits and vegetables an important component of a
woman’s diet during pregnancy? Question 2: Are pregnant women in Delaware consuming an adequate
amount of fruits and vegetables as indicated by responses from the Behavioral
Risk Factor Surveillance System for 2012 and 2013? Question 3: Is there a relationship between selfreported income and
the consumption of fruits and vegetables among pregnant women in
Delaware who participated in the 2012 and 2013 Behavioral Risk Factor
Surveillance System?
12 12

Chapter 1
13 13
LITERATURE REVIEW
Importance of Fruits and Vegetables for Overall Health In everyday discourse, the concept of “health” is often considered in
terms of disease, a static condition in which illness is not present. However, scholars understand the term to be much more comprehensive. In 1948, the World Health Organization offered the following definition: “a state of complete physical, mental and social wellbeing and not merely the absence of disease or infirmity.”
One of the most important factors in determining overall health status is diet. Rozin (1999) writes “For human beings, food is a critical contributor to physical well being, a major source of pleasure, worry and stress, a major occupant of waking time and, across the world, the single greatest category of expenditures,” (p.163). In an article for Health Affairs, Bleich et. al. (2015) describes the paradox of food, a fuel that can help us live longer and healthier lives or a poison that can lead to premature death. Based on a search conducted through the University of Delaware’s library services, since 2011, over 18,000 peerreviewed studies have been published detailing the importance of diet for health (key phrase: “importance of diet for health”). A commonly touted centerpiece of a healthy diet is the consumption of fruits and vegetables, which have been connected to reductions in chronic diseases such as cancer, obesity, type 2 diabetes, and stroke, according to a systematic review of epidemiological literature by Boeing et.al. (2012).
One significant area of research is the association between produce consumption and cancer, a subject of concern since the late 1970s (Key, 2011). A 1992 review by Block et. al. of approximately 200 studies that examined the relationship between the intake of fruits and vegetables and a number of cancers, including lung, colon, ovary, pancreas, breast, cervix, oral cavity, stomach, bladder, and esophagus found that “a statistically significant protective effect of fruit and vegetable consumption was in 128 of 156 dietary studies in which results were expressed in terms of relative risk,” (para.1). The body of research on the topic has continued to grow. A search of peerreviewed articles using the key phrase “cancer fruits and vegetables” in the University of Delaware library system generated 4,559 articles published on the subject since the year 2011, including articles detailing this specific dietary connection to pancreatic cancer, breast cancer, esophageal cancer, and lung cancer.
According to the World Cancer Research Fund (2007), nonstarchy vegetables are associated with protection against cancers of the mouth, pharynx, larynx, esophagus, and stomach. Fruits are associated with similar protections, including a protection against lung cancer (World Cancer
14 14
Research Fund, 2007). Furthermore, dietary fiber, which can only naturally occur in plant foods, has been observed to have a doseresponse relationship to the protection against colorectal cancer in cohort studies (World Cancer Research Fund, 2007). Using cancer prevention estimates from a metaanalysis of nutritional epidemiology studies, and cancer risk estimates from the EPA, USDA, and potency estimates from rodent bioassays, Reiss et. al. (2012) estimate that an increase in fruit and vegetable consumption among Americans could prevent approximately 20,000 cancer cases per year.
However, the etiology of cancer and its connection to diet remains a subject of debate. In a review of large prospective studies and pooled analyses for the association of produce consumption and cancer risk, Key (2011) enunciated the importance of acknowledging confounding variables related to overall cancer risk, explaining that the relationship between produce consumption and overall cancer risk could also be explained by the relationship between overall cancer risk and the use of drugs and alcohol.
Several studies have also been completed on the relationship between fruit and vegetable consumption and the development of cardiovascular disease. A search of peerreviewed articles using the key phrase “cardiovascular disease fruits and vegetables” in the University of Delaware library system generated 1,753 articles published on the subject since the year 2011. A search of the key phrase “heart disease fruits and vegetables” generated 1,381 peerreviewed articles from the same time constraints.
In a paper describing the evidence for diet as a preventative measure against cardiovascular disease, Verschuren (2012) outlines the protective effect of consuming fruits and vegetables on the incidence of cardiovascular disease, demonstrated by a number of observational studies. Although most of this evidence has come from prospective cohort studies, “results in different cohort studies have been quite homogenous, and several metaanalyses have reported statistically significant effect estimates,” (Verschuren, 2012, p.704).
Using data from the Nurses Health Study, the Nurses Health Study II, and the Health Professionals Followup Study, Muraki et. al. (2013) found that individuals who consumed blueberries, grapes, apples, and other fruits were at a significantly lower risk of developing type 2 diabetes. In 2014, the largest systematic review and metaanalysis on fruit and vegetable intake and risk of type 2 diabetes to date was completed, which reached a similar conclusion: “Higher fruit or green leafy vegetables intake is associated with a significantly reduced risk of type 2 diabetes,” (Li et. al., p.1).
In a comprehensive analysis of studies examining the role of fruits and vegetables in the prevention of chronic disease, Boeing et. al. (2012) found convincing evidence to suggest a bloodpressure lowering effect related to an increase in the consumption of vegetables and fruits, based on consistent
15 15

results from cohort and intervention studies. Similar studies indicated an inverse association between the consumption of vegetables and fruit and the risk of stroke, and convincing evidence was found to suggest that increased levels of produce consumption could also work to prevent coronary heart disease (Boeing et. al., 2012).
Some research has also been conducted on the role of fruit and vegetable consumption in gastrointestinal health. A search of peerreviewed articles using the key phrase “gastrointestinal disease fruits and vegetables” in the University of Delaware library system generated 343 articles published on the subject since the year 2011. Andersen et. al. (2012) described an inverse relationship between fruit and vegetable intake and the symptoms of gastrointestinal inflammation, citing a number of retrospective studies that had also found fruits and vegetables to demonstrate a protective effect against inflammatory bowel disease. The positive associations between produce consumption and gastrointestinal health might be due to the high content of dietary fiber found to naturally occur only in plant foods, which has been demonstrated to prevent digestive health problems by reducing the time that it takes for food to travel through the digestive tract (Liu, Heying, Tanumihardjo, 2012). In a review of 19 studies focused on inflammatory bowel diseases, Hou, Abraham, and Serag (2011) found negative associations between fruit intake and risk of Crohn’s disease, as well as a negative association between high vegetable intake and risk of ulcerative colitis.
Congenital Anomalies One of the first major connections drawn between maternal diet and
infant health was related to the consumption of folic acid. Folic acid is a B vitamin that is used to help generate new cells (CDC, 2015, “Facts about Folic Acid”). In technical terms, folic acid is the synthetic form of the naturally occurring folate, a watersoluble B vitamin found naturally occurring in certain types of foods (Mayo Clinic, 2014). The best food sources of folate all fall into the vegetables and legumes category, including spinach, broccoli, chickpeas, beans, and lentils (Dietitians of Canada, 2014). For decades, researchers have examined the connection between folate and folic acid intake and the incidence of congenital anomalies or birth defects. Professor Richard Smithells of the University of Liverpool conducted the first studies on the topic in the 1960’s (University of Leeds, n.d.). Smithells demonstrated that the mothers of infants who were born with physical deformities were significantly more likely to be folate deficient than the mothers of health babies (University of Leeds, n.d.). By the early 1990’s, folate and folic acid deficiencies were under serious scrutiny for contributing to congenital anomalies in the United States, specifically spina bifida and neural tube defects, or NTDs (United States
16 16

Department of Agriculture, 1997) and in 1992, the Public Health Service released the following recommendations:
“All women of childbearing age in the United States who are capable
of becoming pregnant should consume 0.4 mg of folic acid per day for the purpose of reducing their risk of having a pregnancy affected with spina bifida or other NTDs.” (CDC, Recommendations for Use of Folic Acid, 1992, para. 2).
By 1996, the U.S. had authorized the fortification of enriched cereal
grain products with folic acid. For every 100 grams of enriched cereal grain product, 140 micrograms of folic acid is added, a program that was fully implemented in 1998 (Crider, 2011).
Studies continue to demonstrate the importance of maternal consumption of folic acid in the prevention of congenital anomalies. A search of peerreviewed articles using the keywords “folic acid” and “pregnancy” in the University of Delaware library system generated 2,272 articles published on the subject since the year 2011.
Taruscio et. al. (2011) described the consumption of folic acid as “a critical factor for effective prevention of NTDs [neural tube defects]” (p.281), a vitamin that has the potential to reduce the incidence several other kinds of birth defects as well, including cardiac, facial, and limb anomalies (2011). Ramakrishnan et. al. (2012) found high quality evidence from a number of intervention trials to suggest significant benefits from maternal preconception folic acid for reducing the risk of neural tube defects, one of the most common kinds of congenital anomalies. Bortolus et. al. (2014) states, “in the context of foetus development disorders, the neural tube defects represent the paradigm of the congenital malformations avoidable by means of FA [folic acid] intake,” (p.3).
Birth Weight According to Allen J. Wilcox (2001) of the National Institutes of
Health, “A baby’s weight at birth is strongly associated with mortality risk during the first year and, to a lesser degree, with developmental problems in childhood and the risk of various diseases in adulthood,” (p.1233). The Centers for Disease Control (2010) describes low birth weight as the “single most important factor affecting neonatal mortality and a significant determinant of postneonatal mortality,” (“What: Is low birthweight a problem?”, para.1). Bortolus et. al. (2014) described birth weight as a sort of finish line, the culmination of fetal growth patterns associated with adverse exposures during the course of pregnancy.
17 17

A more limited number of studies have attempted to analyze the connections between infant birth weight and maternal diet with somewhat mixed results. In a search of the University of Delaware’s library system, the key phrase “birth weight maternal diet” returned 2,297 peerreviewed articles since 2011. A review of article titles suggests that studies have chosen to examine specific nutrition and diet features, as well as patterns of weight gain. For the purposes of this project, I chose to focus on many studies that described diet quality from a macro and micronutrient perspective, as opposed to quantity of weight gained or calories consumed.
In a 2011 study of 41 women of various body mass index rankings, Marshall et. al. conducted 24 hour food recalls and the Block Food Frequency Questionnaire as well as a number of physical measurements related to body composition or before 37 weeks gestation. These results were assigned numerical values based on the 2010 Health Eating Index, which scored study subjects on a maximum 100point scale (Marshall et. al. 2011). An analysis of birth outcomes demonstrated an inverse relationship between a high 2010 Healthy Eating Index score and low infant birth weight (Marshall et. al. 2011).
A randomized factorial experiment of 4,436 pregnant women in Bangladesh generated different results. Persson et. al. (2012) used two food groups and three micronutrient groups to test the hypothesis “that prenatal multiple micronutrient supplementation and an early invitation to food supplementation would increase maternal hemoglobin level and birth weight” (p.2050) and found that “there was no significant difference in birth weight among treatment groups” (p.2055). In a similar demographic study of women in Mumbai, India, Potdar et. al. (2014) conducted an individually randomized controlled trial in which a daily snack made from fruit, milk, and green leafy vegetables was distributed to a treatment group while a snack of potato and onion was given to a control group from 90 days or more before pregnancy until delivery as an addition to the usual diet (2014). Results of the study indicated that the daily snack, or treatment, did not have an effect on the birth weight of infants (Potdar et. al., 2014).
Wheezing, Asthma, and Cardiovascular Disease Researchers have also made attempts to understand the connections
between wheezing, asthma, the development of heart disease, and maternal diet quality. However, these areas of research have been explored far less frequently and provide somewhat conflicting evidence.
A search of peerreviewed articles published after 2011 in the University of Delaware’s library system using the key phrase “heart disease maternal diet” returned 1,097 studies. However, the range in focus areas of these studies was wide, and few included specific discussions related to
18 18
maternal health and cardiovascular disease as a larger consequence of diet. Consequently, I refined my search by instead using the following keywords in conjunction: “cardiovascular disease”, “maternal diet”, and “pregnancy”, which generated 778 articles.
In 1970, a group women from Motherwell district of the United Kingdom became part of the British Cohort Study, which used all 17,000+ British births during the week of April 511 as subjects for an initial survey intended to provide information on modern trends in obstetric and neonatal care (Bynner et. al., 2000). Since the initial survey, multiple researchers have continued to use the subjects and samples of the subjects to explore long and shortterm impacts of certain neonatal environments and influences (Bynner et. al., 2000).
A 2012 study used one of these samples, examining 34 individuals aged 40 whose mothers had been part of the Motherwell cohort of the 1970 British Cohort Study, and had been shown as eating an unhealthy diet during pregnancy that was associated with increased blood pressure and cortisol levels in the women’s adult children (Drake et. al., 2012). The goal of the study was to “investigate relationships between an unbalanced maternal diet in pregnancy, neonatal and adult anthropometric variables with methylation at key genes controlling tissue glucocorticoid action and foetal growth,” (Drake et. al., 2012, p.808). Researchers wanted to assess whether or not maternal diet influenced the function of DNA and thus physical traits of offspring in both infancy and adulthood. Using DNA sequencing, Drake et. al. (2012) found that data indicated “a persisting epigenetic link between earlylife maternal diet and/or foetal growth and cardiovascular disease risk in humans,” (p.808).
Herrick et. al. (2011) found similar connections between maternal diets and cardiovascular health characteristics although a heavier focus was placed on health implications in adulthood. Using British birth records, the researchers examined anthropometric features of mothers such as height and weight gain during pregnancy, as well as age, social class, history of smoking, diet, maximum blood pressure during pregnancy, and number of children (Herrick et. al., 2011). The dietary intake surveys used by Herrick et. al. (2011) allowed clerical assistants to use “a standard format to record in the obstetric notes the number of times and amounts that the women had eaten 10 different food commodities during the previous week” (p.3555) including meat, fish, eggs, milk, cheese, potatoes, green vegetables, bread, baked goods, and sweets. Then, researchers began the process of tracking down the offspring of the women associated with the study. Once they had gathered a suitable number of participants, researchers analyzed their cardiovascular health, specifically through total plasma cortisol levels. The study concluded that “the offspring of mothers who reported high meat/fish and low green vegetable intakes in late
19 19
pregnancy tend to have increased adult fasting plasma cortisol concentrations” (p.3559) and that this unbalanced diet might “present a metabolic stress to the mother and program the HPA [hypothalamicpituitaryadrenal] axis of the offspring, leading to lifelong hypercortisolemia,” (p.3560). Elevated fasting plasma cortisol concentrations are often linked to larger health problems, including heart disease.
Other researchers have generated slightly different findings. A 2013 review conducted by Blackmore and Ozanne aimed to understand the risk of cardiovascular disease that was programmed in early fetal development as a result of adverse exposures including under and over nutrition, obesity, insufficient placenta development, and oxygen deficiency. After examining both human studies and some animal models, the authors found consistent evidence that pregnant women who suffered from obesity and thus exposed their children to an environment characterized by overnutrition in utero increased their children’s risk of developing cardiovascular disease later on in life (Blackmore and Ozanne, 2013). However, Blackmore and Ozanne (2013) did not reach a conclusion the reasons behind such an association, and called for a better understanding of how maternal diet influenced risk factors.
Allergies and wheezing have also been examined in connection to maternal health, however, far fewer studies on the topic have been completed and the results have been relatively inconsistent. In a search of peerreviewed articles in the University of Delaware’s Library System, I was able to find 107 articles that had been published after 2011 and contained the key phrase “wheezing maternal diet”.
A systematic review and metaanalysis of the influence of fruit and vegetable intake on risk of wheezing and asthma be Seyedrezazadeh et. al. (2014) examined two cohort studies, three populationbased casecontrol studies and thirteen crosssectional studies. All showed that a high consumption of vegetables had a modest association with reduced risk of asthma, and there was a significant association between high consumption of fruits and vegetables and decreased risk of asthma (Seyedrezazadeh et. al., 2014). However, in subgroup analysis, there was no inverse association found in populationbased casecontrol studies as well as cohort studies between high levels of vegetable consumption and risk of asthma (Seyedrezazadeh et. al., 2014).
In a review article analyzing the effect that consumption of various nutrients in pregnancy can have on infant development of allergic disease, Miles and Calder (2014) found that omega 3 LC PUFAs, vitamin D, and folic acid had “demonstrated neonatal immunomodulatory effects and some reduction in early allergen sensitisation,” (p.63). However, evidence for the effect of vitamin D and reductions in allergic disease was less meaningful,
20 20

based primarily on observational studies that were somewhat inconsistent (Miles and Calder, 2014). Evidence relating “antenatal folate status or supplementation with folic acid with offspring risk of allergic disease” (p.71) was found to be inconclusive (Miles and Calder, 2014). Finally, few studies had shown omega 3 LC PUFA supplementation during pregnancy to have an effect on allergy symptoms in children (Miles and Calder, 2014).
Influence of Socioeconomic Status on Diet Quality Members of the medical community have come to recognize the
important and influential connection between socioeconomic status and health outcomes. According to the World Health Organization (2016) “higher income and social status are linked to better health. The greater the gap between the richest and poorest people, the greater the differences in health,” (“The determinants of health”, para. 4). In an article describing the World Health Organization’s Commission on the Social Determinants of Health, Marmot and Bell (2010) reiterate this notion that health outcomes often worsen as socioeconomic position decreases, enunciating that even the most middleclass individuals are less healthy and more likely to live a shorter life than those in the top rungs of society. Several studies have even drawn associations between lower socioeconomic status and increased mortality (Lantz et. al 1998; Smith, 1990; Sorlie, 1995).
There are a number of possible contributing factors to these disparities in health status and outcomes. Part of this association is thought to be the result of increased health risk behaviors, such as smoking and physical inactivity, among those of lower socioeconomic status (National Center for Health Statistics, 1998). Furthermore, according to Kington and Smith (1997) individuals with “few economic resources may also be less able to alter their environment to reduce the impact of changes in physical functioning,” (p.810).
An important area of specific study relevant for this project has been research conducted on the association between diet and socioeconomic status. In a paper published in Public Health Reports, Bravemen and Gottlieb (2014) describe this association in terms of setting:
“Neighborhood socioeconomic disadvantage and higher concentration of
convenience stores have been linked to tobacco use, even after adjusting for
several individuallevel characteristics such as educational attainment and household income. Lower availability of fresh produce, combined with
concentrated fastfood outlets and few recreational opportunities, can lead to
poorer nutrition and less physical activity,” (p.1516)
21 21

A search of peerreviewed articles published since 2011 in the
University of Delaware’s library system using the key phrase “income and diet” returned 4,695 articles. Several of these studies sought to understand the larger impact of income on diet quality across racial, ethnic, education, and age demographics.
Backholer et. al. (2016) sought to understand the relationship between socioeconomic position (described primarily as a function of educational attainment level and income) and diet quality by using data from the baseline survey of the Australian Diabetes, Obesity, and Lifestyle study. The diet quality index used represented the most current national dietary guidelines, and the 9,926 participants were selected at random (Backholer et. al., 2016). The researchers discovered that higher levels of “educational attainment and income and a lower level of arealevel disadvantage were significantly associated with a higher DGI [dietary guideline index] score, across the gradient of SEP [socioeconomic position],” (Backholer et. al., 2016, p. 477). Overall, a higher socioeconomic position was consistently associated with the consumption of a higherquality diet (Backholer et. al., 2016).
Graubard and Kant (2013) used dietary and socioeconomic status data from the National Health and Nutrition Examination Survey (NHANES) conducted by the National Center for Health Statistics at the Centers for Disease Control and Prevention from 19711974, 1976 1980, 19881994, 19992000, 20012002, 20032004, 20052006, and 20072008 to examine 30year trends “in the association of dietary and meal behaviors with family income and education to understand the possible contribution of these trends to SES [socioeconomic status] trends in obesity rates in 219 year old Americans,” (p.690). The NHANES included both a home interview as well as an exam in a mobile health center, and the total sample size included 39,822 individuals. Changes in the association of family income and education with dietary behaviors and meal behaviors were analyzed using multivariable regression methods (Graubard & Kant, 2013). Results from the study found significant increases in energy intake, food, and beverage quantities among individuals in the lowest category for family socioeconomic status and suggested that “both income and education differentials in susceptibility to secular increases in reported energy intake and amount of foods and beverages,” (Graubard & Kant, 2013, p.698).
Storey and Anderson (2014) also utilized data from the National Health and Nutrition Examination Survey, NHANES, to examine the dietary fiber intake of Americans across a number of demographic categories including age, sex, race and ethnicity, and family income. The focus of the analysis was information gathered from total nutrient intake files as well as data from a
22 22
24hour dietary recall questionnaire (Storey & Anderson, 2014). Dietary fiber intake was evaluated in comparison to the Institute of Medicine’s 2002 recommendations, which established an adequate intake level of 14 grams of dietary fiber per 1,000 calories for those older than two years of age in order to promote heart health (Storey & Anderson, 2014).
The results of the study indicated that dietary fiber intake was far below recommendations for all Americans: adult males consumed approximately half of the recommended adequate intake levels of dietary fiber, while adult females consumed approximately twothirds (Storey & Anderson, 2014). Results from the study indicated that annual family income “does not appear to influence DF [dietary fiber] intake among children and adolescents; however, this study supported the hypothesis that lower family income negatively affects DF intake among adults,” (Storey & Anderson, 2014, p.847). Adults with an annual family income of $75,000 or greater consumed, on average, significantly more dietary fiber than adults in lowerincome categories; this trend held for both males and females (Storey & Anderson, 2014). In addition “certain subpopulations, such as nonHispanic blacks, are at particular risk for having very low intakes of DF compared with other race/ethnic groups,” (Storey & Anderson, 2014, p.847848). This data was found to be consistent with other studies examining dietary fiber intake among Americans, and the researchers concluded, “living in poverty exacerbates low consumption of all vegetables and appears to be a primary factor in eating fewer vegetables,” (Storey & Anderson, 2014, p.849).
In a systematic literature review of articles connecting the price of food, diet quality, and socioeconomic status, Darmon and Drewnowski (2015) examined how food prices and diet cost acted as contributors to socioeconomic inequalities in diet quality with the specific goals of understanding whether healthy foods and diets of higherquality were more costly in different societies and discussing the relationship between food prices and diet quality for those in lowsocioeconomic status groups across several countries. The search of only full text articles published after the year 2000 that specifically pertained to the topic, was conducted in 2014 and included PubMed, Google Scholar, and Web of Science databases; it generated 151 studies on the topics of diet cost and nutrition economics (Darmon & Drewnowski, 2015).
Results from the review indicated that income and socioeconomic status were influential in determining diet quality (Darmon & Drewnowski, 2015). As incomes decrease, the percentage of spending that is devoted to food increases, and although average American families may only spend 11% of their income on food, “households in poverty can spend more than 25%,” (Darmon & Drewnowski, 2015, p.646). For lowincome survey respondents, the price of food was cited as a central factor in making food consumption
23 23
choices along with taste and convenience, and economic factors were often identified as “the main barriers to adopting healthier diets,” (Darmon & Drewnowski, 2015, p.646).
However, not all studies have reinforced the notion that income plays an important role in determining an individual’s diet. In a literature review of the articles that focused on relationships between income, food budgeting, food prices, and associations to obesity and diet quality among Americans, Carlson and Frazao (2014) found evidence to suggest that “while higherincome households spend considerably more on food than lower income households, their diet quality is not improved in a meaningful manner,” (p.30). The researchers reiterated the need for Americans to improve their diets and suggested that those “who wish to consume a healthier diet need to reallocate their current food budget by spending less on protein foods and foods of limited nutritional value and more on fruits and vegetables,” (Carlson & Frazao, 2014, p.30). Finally, the study suggested that Americans spent an appropriate proportion of their food budgets on grains and dairy foods, but that individuals needed to shift to selecting lowfat dairy products and whole grains (Carlson & Frazao, 2014). The most significant finding of the review was that “healthy foods are affordable, but there is considerable need for education and other mechanisms such as making different price metrics available to consumers and promoting healthy eating as a way to save money,” (Carlson & Frazao, 2014, p.30).
Chapter 2
24 24
METHODS
The Behavioral Risk Factor Surveillance System
About the BRFSS In order to examine fruit and vegetable consumption levels among
Delaware’s pregnant population in 2012 and 2013, I used responses from the Behavioral Risk Factor Surveillance System. The Behavioral Factor Risk Surveillance System (BRFSS) was developed by the Centers for Disease Control and Prevention (CDC) as a “state based system of crosssectional health surveys of adults,” (Institute of Medicine, 2011, p.66). The survey was first used in 1984 with 15 participating states engaged in monthly data collection (CDC, 2014, “About the Behavioral Risk Factor Assessment Survey”). In its first four years of use, the BRFSS only included a standard core questionnaire, which addressed topics including “smoking, alcohol use, physical inactivity, diet, hypertension, and seat belt use,” (CDC, 2014, “About the Behavioral Risk Factor Assessment Survey”, para.4). In 1988, the CDC added what are now known as “optional modules”. Optional modules allow states to ask a set of standard questions on more specific topics, evaluating particular needs related to a given health concern, and compare them to other states. In 2013, the most recent year that data for this project was analyzed, optional modules available for all states’ use included arthritis management, colorectal cancer screening, and childhood asthma presence (CDC, 2014, “2013 State Module”).
In 1993, the BRFSS was redesigned to include a set of fixed questions, core questions for all states that rotated each year, and up to five core questions on emerging health issues (CDC, 2014, “About the Behavioral Risk Factor Assessment Survey”). Today the BRFSS is nationally coordinated by the Centers for Disease Control and Prevention and statehealth departments in all 50 states and the District of Columbia (Institute of Medicine, 2011).
The Behavioral Risk Factor Surveillance System is continually administered via telephone using randomdigit dialing sampling methods for both landline and cellphone numbers (Institute of Medicine, 2011). Only one person per household between the ages of 18 and 99 is surveyed (Institute of Medicine, 2011). The funding for data collection is provided by state and federal agencies as well as some private organizations (Institute of Medicine, 2011).
25 25

Benefits of the BRFSS There are a number of benefits associated with the Behavioral Risk
Factor Surveillance System, specifically for the purposes of this project. First, the BRFSS is somewhat flexible. Although its core and modules are designed with the expertise of the CDC, optional modules allow states to research and address areas of high need within their localities (Utah Department of Health, 2013). Furthermore, states have the authority to add their own questions without input from the CDC (Nelson, 2001). The oversight and control provided by the CDC ensures that data collected by each state is accurate, and comparable across borders (Institute of Medicine, 2011).
The BRFSS is also incredibly consistent. The survey is conducted regularly by each and every state using the same data collection methods with the same core questions, rendering high quality data (Nelson, 2001). This consistency allows for yeartoyear comparisons by states and federal agencies. With the support of the Behavioral Risk Factor Surveillance System, the personal health decisions and behaviors of Americans can be collected, analyzed, and compared at both the state and national level.
Limitations of the BRFSS All data sets have limitations. The Behavioral Risk Factor Surveillance
System is no exception. One of the biggest issues associated with the survey is sample size, largely a consequence of state budget constraints. In an effort to reduce costs for states, sample sizes are kept relatively small (Agency for Healthcare Research and Quality, 2014). The median sample size for individual states was 1,541 in 2012 (CDC, “2012 Summary Data Quality Report”) and 2,291 in 2013 (CDC, “2013 Summary Data Quality Report”). These small sample sizes “increase the variance of estimates and decrease the size of the difference between town subpopulations that can be detected through the survey responses,” (Agency for Healthcare Research and Quality, 2014, para.4). Furthermore, large segments of the population may not be included because the survey excludes those who do not utilize a residential phone or who have been institutionalized (Agency for Healthcare Research and Quality, 2014). The sample utilized by BRFSS analysts is not typically a locally representative survey sample, which indicates that the data should be limited in its use; more specifically, the data should not be used to examine geographic disparities (Institute of Medicine, 2011).
Finally, the Behavioral Risk Factor Surveillance System data is selfreported, which presents several challenges. Data that is selfreported is dependent on the memory, awareness, understanding, and perceptions of
26 26
survey respondents, which can vary a great deal among members of a given population (Agency for Healthcare Research and Quality, 2014). Limited knowledge of personal health status as well as language barriers may further complicate these issues (Agency for Healthcare Research and Quality, 2014).
Use of the BRFSS Responses I chose to utilize responses from the Behavioral Risk Factor
Surveillance System for several reasons. First and foremost was access. With the help of Mary Joan McDuffie, an Associate Policy Scientist at the Center for Community Research and Service in Delaware’s School of Public Policy and Administration, I was offered the full set of BRFSS responses from 20112013 for all 50 states. This data set had previously been exported to SPSS format, and was deidentified, meaning that it would not require approval from the Institutional Review Board. Furthermore, among the various data sets that I contemplated using, the BRFSS was the most detailed yet coherent in its questions regarding fruit and vegetable consumption.
2012 Delaware BRFSS The 2012 Behavioral Risk Factor Surveillance System administered in
the state of Delaware assessed a number of core health factors as well as questions related to optional Centers for Disease Control modules of special interest to the state. Core sections of the 2012 nationally utilized survey included health status, self described healthy days and healthrelated quality of life, health care access, exercise, chronic health conditions, oral health, demographics, disability, tobacco use, alcohol consumption, immunization, falls, seatbelt use, drinking and driving, breast and cervical cancer screening, colorectal cancer screening, and HIV/AIDS (CDC, 2012, “2012 Behavioral Risk Factor Surveillance System Questionnaire”). Delaware also included the following optional modules: adult human papilloma virus (HPV), diabetes, fruits and vegetables, prediabetes, prostate cancer screening decision making, sugar sweetened beverages, and menu labeling (CDC, 2014, “Questionnaires 2012 Modules By State”).
The 2012 survey was the second year in which data was collected from both cellphones and landlines (CDC, 2013, “2012 Summary Data Quality Report”). In total, surveyors from the Centers for Disease Control conducted 5,294 surveys in Delaware from a combined sample of almost 70,000 residents (CDC, 2013, “2012 Summary Data Quality Report”). Of the total landline sample of 52,739 individuals, 4,197, or 8.0%, completed the survey (CDC, 2013, “2012 Summary Data Quality Report”). Within the landline sample, 2,991 or 5.7% of individuals refused to complete or terminated the survey
27 27
(CDC, 2012 Summary Data Quality Report, 2013). The cellphone sample in 2012 was significantly smaller in size than the landline sample, but responses were still numerous. Of the 14,670 Delaware residents in the cellphone sample, 1,097, or 7.5% completed the survey and only 34, or 0.2% refused to complete or terminated (CDC, 2013, “2012 Summary Data Quality Report”).
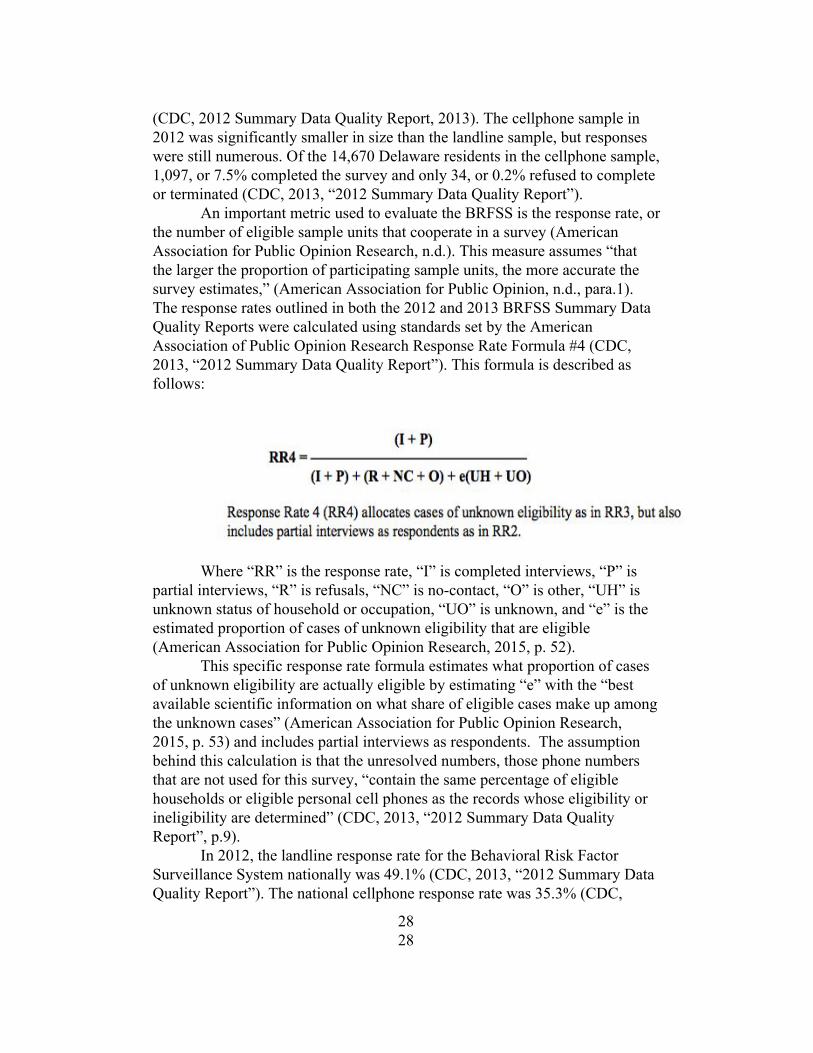
An important metric used to evaluate the BRFSS is the response rate, or the number of eligible sample units that cooperate in a survey (American Association for Public Opinion Research, n.d.). This measure assumes “that the larger the proportion of participating sample units, the more accurate the survey estimates,” (American Association for Public Opinion, n.d., para.1). The response rates outlined in both the 2012 and 2013 BRFSS Summary Data Quality Reports were calculated using standards set by the American Association of Public Opinion Research Response Rate Formula #4 (CDC, 2013, “2012 Summary Data Quality Report”). This formula is described as follows:
Where “RR” is the response rate, “I” is completed interviews, “P” is
partial interviews, “R” is refusals, “NC” is nocontact, “O” is other, “UH” is unknown status of household or occupation, “UO” is unknown, and “e” is the estimated proportion of cases of unknown eligibility that are eligible (American Association for Public Opinion Research, 2015, p. 52).
This specific response rate formula estimates what proportion of cases of unknown eligibility are actually eligible by estimating “e” with the “best available scientific information on what share of eligible cases make up among the unknown cases” (American Association for Public Opinion Research, 2015, p. 53) and includes partial interviews as respondents. The assumption behind this calculation is that the unresolved numbers, those phone numbers that are not used for this survey, “contain the same percentage of eligible households or eligible personal cell phones as the records whose eligibility or ineligibility are determined” (CDC, 2013, “2012 Summary Data Quality Report”, p.9).
In 2012, the landline response rate for the Behavioral Risk Factor Surveillance System nationally was 49.1% (CDC, 2013, “2012 Summary Data Quality Report”). The national cellphone response rate was 35.3% (CDC,
28 28
2013, “2012 Summary Data Quality Report”). Delaware’s combined response rate was 37.4%, with a 39.2% response rate for landlines and a 31% response rate for cellphones (CDC, 2013, “2012 Summary Data Quality Report”). Generally speaking, cellphone response rates tend to be lower than landline response rates for a multitude of surveys the BRFSS has “achieved a cellular telephone response rate that compares favorably with other similar surveys,” (CDC, 2013, “2012 Summary Data Quality Report”, p.3).
2013 Delaware BRFSS In 2013, the BRFSS survey in Delaware differed slightly from the year
prior. Factors assessed by the survey on a national level included the following: tobacco use, HIV/AIDS knowledge and prevention, exercise, immunization, health status, healthy days, healthrelated quality of life, health care access, inadequate sleep, hypertension awareness, cholesterol awareness, chronic health conditions, alcohol consumption, fruit and vegetable consumption, arthritis burden, and seatbelt use (CDC, 2014, “Overview: BRFSS 2013”). At a state level, Delaware included optional modules on colorectal cancer screening, diabetes, health care access, prediabetes, prostate cancer screening, and prostate cancer screening decision making module (CDC, 2014, “Questionnaires 2013 Modules By State”). Again, the survey utilized both landline and cellphone numbers.
Surveyors completed 5,343 interviews in Delaware in 2013 (CDC, 2014, “2013 Summary Data Quality Report”). Of the total landline sample of 73,940 Delaware residents, 5.4%, or 3,978 individuals, completed interviews; 1,717 individuals either terminated or refused to complete the survey, representing 2.3% of the total landline sample (CDC, 2014, “2013 Summary Data Quality Report”). Similar numbers were found for cellphone respondents. Of the total cellphone sample of 25,740 Delaware residents, 5.3%, or 1,365 individuals completed interviews (CDC, 2014, “2013 Summary Data Quality Report”). Only 241 individuals either terminated or refused to complete the survey, 0.9% of the total cell phone sample (CDC, 2014, “2013 Summary Data Quality Report”). The national landline response rate in 2013 was 49.6% and for cell phones, the rate was 37.8% (CDC, 2014, “2013 Summary Data Quality Report”). The combined response rate for Delaware in 2013 was 40.1%, with a landline response rate of 42.4% and a cellphone response rate of 33.6% (CDC, 2014, “2013 Summary Data Quality Report”).
29 29

Analyzing the Data The first step in my analysis was to isolate my data. I had access to the
full set of Behavioral Risk Factor Surveillance System responses from all 50 states from 20112013. Although I initially intended to examine all three years, upon reviewing the data from 2011, I became aware that the question regarding current pregnancy status did not seem to have been asked. Therefore I focused only on 2012 and 2013. These two years were the two most recent years available, and I still wanted to examine multiple years instead of focusing on just one to minimize the risk of selecting a year that was characterized by a number of anomalies. This file included those responses to every possible variation of the survey that was utilized in each year, both the core module as well as all state supplemental modules, formatted as an SPSS file. SPSS, Statistical Package for the Social Sciences, is an IBM program that is equipped to handle large sets of data and perform various forms of statistical analysis (University of Vermont, n.d.). Given the size of this data set, the file format was vital. Using SPSS involves the input of variables, possible responses to these variables, and finally, the entry of coded response data.
To focus on the data concerned specifically with my research questions, I made a series of cuts to the larger data file within SPSS, isolating responses from pregnant women in Delaware. My data was limited to responses that included the state code for Delaware, “10”, and those responses that included an affirmative answer to the question regarding pregnancy, a variable described as “pregnancy status” with a positive response recorded as a “1” in SPSS, indicating that the respondent was pregnant at the time the survey was conducted.
After narrowing the full BRFSS set for each year to my target demographic, I further examined the data set to focus on available responses relevant to my outlined research questions. For the 2012 BRFSS questionnaire, I examined variables related to responses from Section 7, “Demographics”, specifically the responses to questions 7.10 (annual household income) and 7.21 (pregnancy status) and all calculated variables related to Module 8, “Fruits and Vegetables”. In the following year, the BRFSS slightly altered the numbering of questions. For the 2013 BRFSS questionnaire, I examined variables related to Section 8, “Demographics”, specifically 8.10 (annual household income) and 8.22 (pregnancy status), and all responses to questions in Section 11, “Fruits and Vegetables”. All question responses were used to ascertain more information regarding produce consumption patterns among my target demographic and all responses were selfreported, as is characteristic of the Behavioral Risk Factor Surveillance System.
30 30
One challenge in examining BRFSS responses in multiple years is the difference between not only the questions asked but the types of variables included as well. To properly analyze my data, I had to ensure consistency. For the years 2012 and 2013, the questions related to fruit and vegetable consumption were the same, and asked in the same way, although they were numbered somewhat differently within the context of the survey. However, the data set for 2012 only contained raw variables, whereas the 2013 file contained calculated variables. These raw variables were often given similar names and descriptions within the SPSS file, but in 2013, there were additional and related variables that sought to enhance raw data responses with calculations. For example, both years, the following variables related to BRFSS survey questions were included in the SPSS data set:
Table 1
31 31
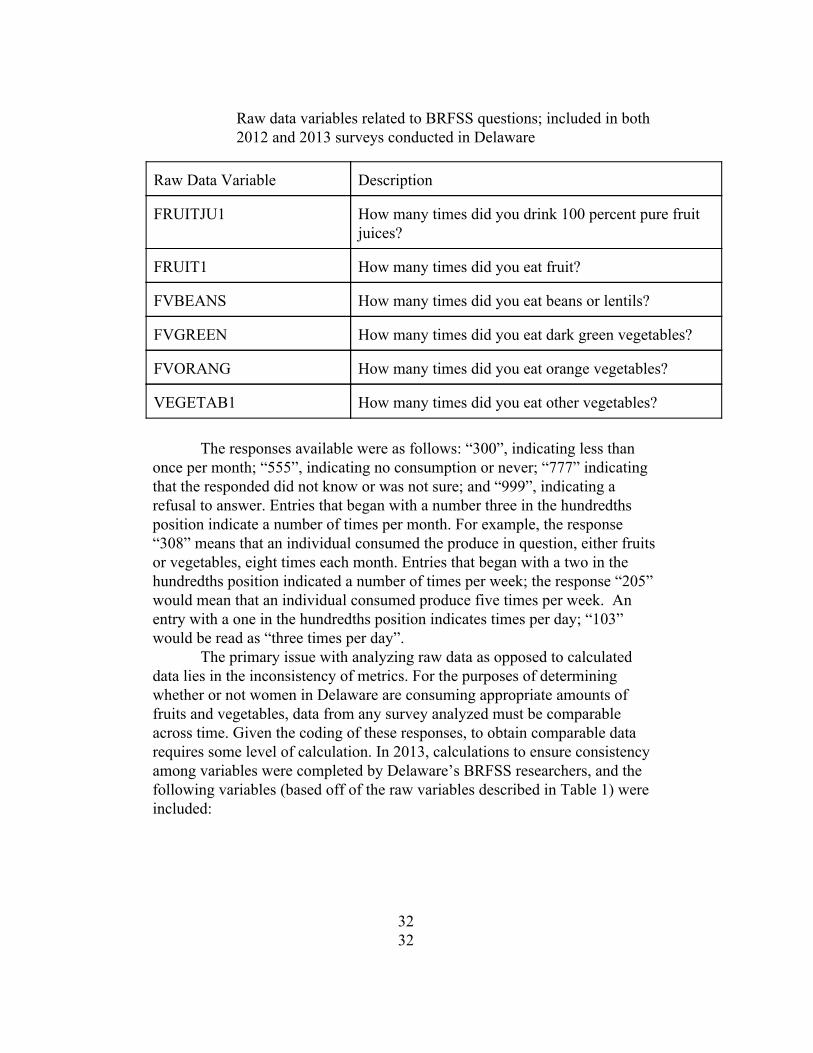
Raw data variables related to BRFSS questions; included in both 2012 and 2013 surveys conducted in Delaware
Raw Data Variable Description
FRUITJU1 How many times did you drink 100 percent pure fruit juices?
FRUIT1 How many times did you eat fruit?
FVBEANS How many times did you eat beans or lentils?
FVGREEN How many times did you eat dark green vegetables?
FVORANG How many times did you eat orange vegetables?
VEGETAB1 How many times did you eat other vegetables?
The responses available were as follows: “300”, indicating less than
once per month; “555”, indicating no consumption or never; “777” indicating that the responded did not know or was not sure; and “999”, indicating a refusal to answer. Entries that began with a number three in the hundredths position indicate a number of times per month. For example, the response “308” means that an individual consumed the produce in question, either fruits or vegetables, eight times each month. Entries that began with a two in the hundredths position indicated a number of times per week; the response “205” would mean that an individual consumed produce five times per week. An entry with a one in the hundredths position indicates times per day; “103” would be read as “three times per day”.
The primary issue with analyzing raw data as opposed to calculated data lies in the inconsistency of metrics. For the purposes of determining whether or not women in Delaware are consuming appropriate amounts of fruits and vegetables, data from any survey analyzed must be comparable across time. Given the coding of these responses, to obtain comparable data requires some level of calculation. In 2013, calculations to ensure consistency among variables were completed by Delaware’s BRFSS researchers, and the following variables (based off of the raw variables described in Table 1) were included:
32 32

Table 2 Calculated data variables based off of raw data to ensure consistency in metrics; included only in data set provided for 2013 BRFSS
Calculated Data Variable
Description
FTJUDA1 Computed fruit juice intake in times per day
FRUTDA1_ Computed fruit intake in times per day
BEANDAY_ Computed bean intake in times per day
GRENDAY_ Computed dark green vegetable intake in times per day
ORNGDAY_ Computed orangevegetable intake in times per day
VEGEDA1_ Computed vegetable intake in times per day
For responses to the 2012 BRFSS, I was required to complete my own
calculations. These calculations were based off of the standards set by the data in 2013, and focused primarily on translating each type of response (month, week, day) into a single measurement of “times per day”. In 2013, times per day were presented as a percent. I followed the same process for completing my calculations, dividing each amount by the specified time period and multiplying by a factor of 100. For measurements that were coded in the 300’s, or times per month, I divided the specified number from the tenths and ones places by 30 and multiplied by 100; similar calculations were completed for those measurements coded in the 200’s and 100’s, simply with different dividing values (seven for 200’s and one for 100’s). This approach allowed for consistent presentation of data across both years.
In addition to calculating the consumption variables based on a uniform metric, I was also tasked with examining the data to determine the appropriate coding and responses for the following variables, which were not calculated for the 2012 BRFSS:
33 33

Table 3 Exclusion variables describing missing responses related to BRFSS question sets; not included in the 2012 BRFSS
Data Variable
Description
MISFRTN THE NUMBER OF MISSING FRUIT RESPONSES
MISVEGN THE NUMBER OF MISSING VEGETABLE RESPONSES
FRTRESP MISSING ANY FRUIT RESPONSES
VEGRESP MISSING ANY VEGETABLE RESPONSES
FRT16 REPORTED CONSUMING FRUIT >16/DAY
VEG23 REPORTED CONSUMING VEGETABLES >23/DAY
FRUITEX FRUIT EXCLUSION FROM ANALYSES
VEGETEX VEGETABLE EXCLUSION FROM ANALYSES
The purpose of the variables outlined above, what I will refer to as the
exclusion variables, is to provide a better understanding of the accuracy and completeness of the set of BRFSS responses. All of the variables are focused on ensuring that those who utilize the BRFSS data set recognize the inherent gaps associated with selfreported survey data. In the case of the 2012 BRFSS, there were individuals from within and outside of my sample that opted not to answer certain questions. These variables are measures of missing responses, accounting for gaps in knowledge that are often characteristic of the results of survey data.
Coding my data to reflect responses to these variables simply required a more intensive examination of my data. The nature of the response options, and the limited number of individuals who did not answer certain questions, made this examination fairly simple. Each of the exclusion variables was formatted as a nominal variable as opposed to a scale variable, the type of
34 34
variable associated with the responses in Table 2. A nominal variable is a variable with values representing unranked categories; one nominal variable value is not greater than another. An example would be zip code although the values of the variable may be distinct there is not one zip code that is greater in quantity than another. In contrast, there are also scale variables, which are characterized as having an order of categories as well as a metric that is associated with rankings and meanings. The exclusion variables naturally fall into the nominal category either the subject opted to answer questions related to fruit and vegetable consumption or they did not. The numerical code associated with a complete response is not greater in quantity than the numerical code associated with an incomplete response both are simply describing different situations.
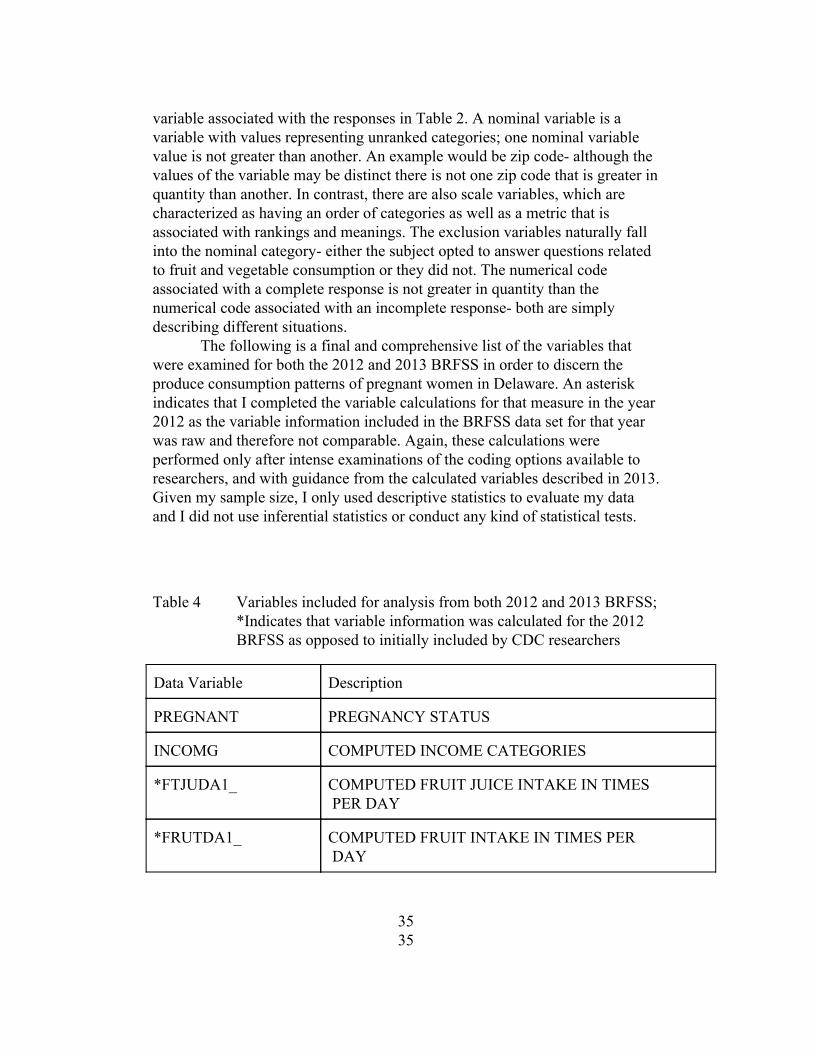
The following is a final and comprehensive list of the variables that were examined for both the 2012 and 2013 BRFSS in order to discern the produce consumption patterns of pregnant women in Delaware. An asterisk indicates that I completed the variable calculations for that measure in the year 2012 as the variable information included in the BRFSS data set for that year was raw and therefore not comparable. Again, these calculations were performed only after intense examinations of the coding options available to researchers, and with guidance from the calculated variables described in 2013. Given my sample size, I only used descriptive statistics to evaluate my data and I did not use inferential statistics or conduct any kind of statistical tests.
Table 4 Variables included for analysis from both 2012 and 2013 BRFSS; *Indicates that variable information was calculated for the 2012 BRFSS as opposed to initially included by CDC researchers
Data Variable Description
PREGNANT PREGNANCY STATUS
INCOMG COMPUTED INCOME CATEGORIES
*FTJUDA1_ COMPUTED FRUIT JUICE INTAKE IN TIMES PER DAY
*FRUTDA1_ COMPUTED FRUIT INTAKE IN TIMES PER DAY
35 35

*BEANDAY_ COMPUTED BEAN INTAKE IN TIMES PER DAY
*GRENDAY_ COMPUTED DARK GREEN VEGETABLE INTAKE IN TIMES PER DAY
*ORNGDAY_ COMPUTED ORANGECOLORED VEGETABLE INTAKE IN TIMES PER DAY
*VEGEDA1_ COMPUTED VEGETABLE INTAKE IN TIMES PER DAY
MISFRTN THE NUMBER OF MISSING FRUIT RESPONSES
MISVEGN THE NUMBER OF MISSING VEGETABLE RESPONSES
FRTRESP MISSING ANY FRUIT RESPONSES
VEGRESP MISSING ANY VEGETABLE RESPONSES
*FRUTSUM TOTAL FRUITS CONSUMED PER DAY
*VEGESUM TOTAL VEGETABLES CONSUMED PER DAY
FRT16 REPORTED CONSUMING FRUIT >16/DAY
VEG23 REPORTED CONSUMING VEGETABLES >23/DAY
FRUITEX FRUIT EXCLUSION FROM ANALYSES
VEGETEX VEGETABLE EXCLUSION FROM ANALYSES
In the 2012 BRFSS, there were 484 variables described within the
SPSS data set. Only 376 of these variables were provided with labels. Unlabeled measurements were determined to be irrelevant or beyond the scope of this project based on information from the BRFSS codebook. To compute various types of produce consumption in a comparable quantity, I initially examined only the variables outlined in Table 1, but later calculated all variables described in Table 4 for the sake of consistency. In 2013, there were 512 variables described within the SPSS data set and only 330 were provided
36 36

with labels. For the purposes of this study, I examined only the variables outlined in Table 4. No further calculations were required for the 2013 BRFSS data set.
To ensure consistency in my data analysis efforts, as well as validate my calculation methods, I made sure to initially calculate all missing 2012 values as a percent, or out of 100. These values calculated however do not provide an intuitive presentation of the data, especially when variables are labeled in “times per day”. The final step of my process involved converting all data values initially displayed as a percent into values that could truly be described as a given quantity on a daily period. This simply involved multiplying each value specified by a factor of 0.01.
Finally, in an effort to discern whether Delaware’s pregnant women were consuming the recommended daily allowances fruits and vegetables (five servings per day), I conducted a summation of computed fruit values and computed vegetables values for each year, 2012 and 2013.
37 37

Chapter 3
38 38
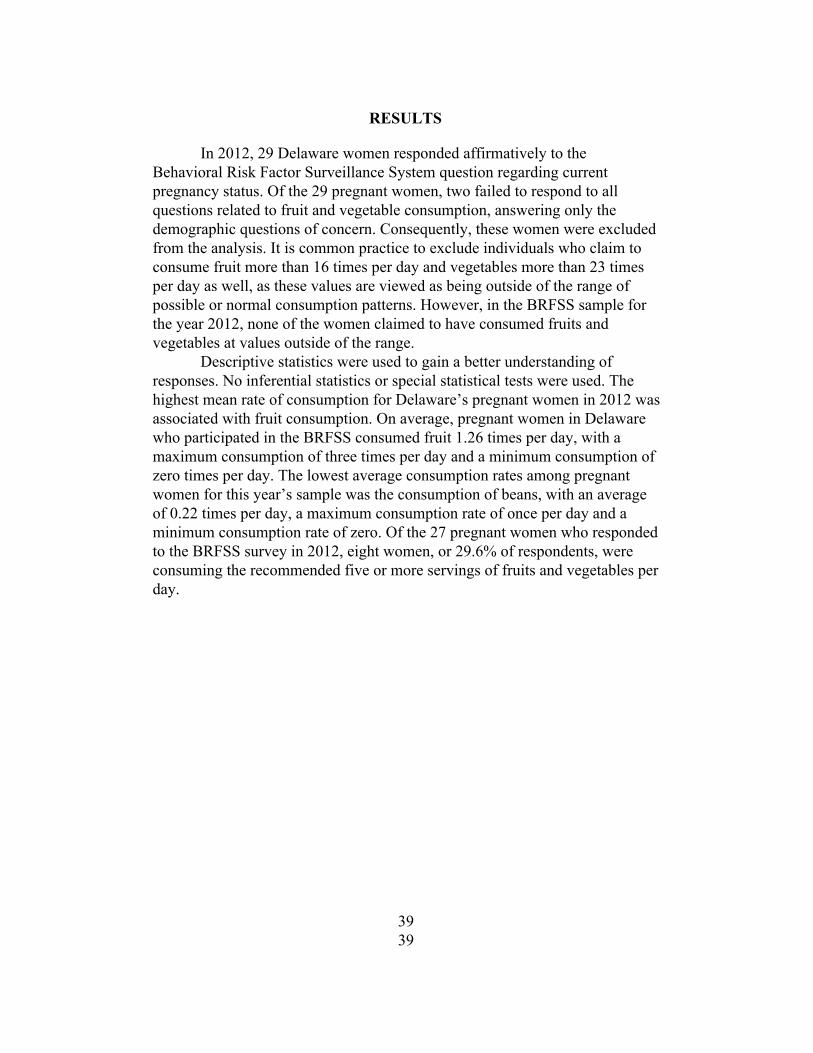
RESULTS
In 2012, 29 Delaware women responded affirmatively to the Behavioral Risk Factor Surveillance System question regarding current pregnancy status. Of the 29 pregnant women, two failed to respond to all questions related to fruit and vegetable consumption, answering only the demographic questions of concern. Consequently, these women were excluded from the analysis. It is common practice to exclude individuals who claim to consume fruit more than 16 times per day and vegetables more than 23 times per day as well, as these values are viewed as being outside of the range of possible or normal consumption patterns. However, in the BRFSS sample for the year 2012, none of the women claimed to have consumed fruits and vegetables at values outside of the range.
Descriptive statistics were used to gain a better understanding of responses. No inferential statistics or special statistical tests were used. The highest mean rate of consumption for Delaware’s pregnant women in 2012 was associated with fruit consumption. On average, pregnant women in Delaware who participated in the BRFSS consumed fruit 1.26 times per day, with a maximum consumption of three times per day and a minimum consumption of zero times per day. The lowest average consumption rates among pregnant women for this year’s sample was the consumption of beans, with an average of 0.22 times per day, a maximum consumption rate of once per day and a minimum consumption rate of zero. Of the 27 pregnant women who responded to the BRFSS survey in 2012, eight women, or 29.6% of respondents, were consuming the recommended five or more servings of fruits and vegetables per day.
39 39
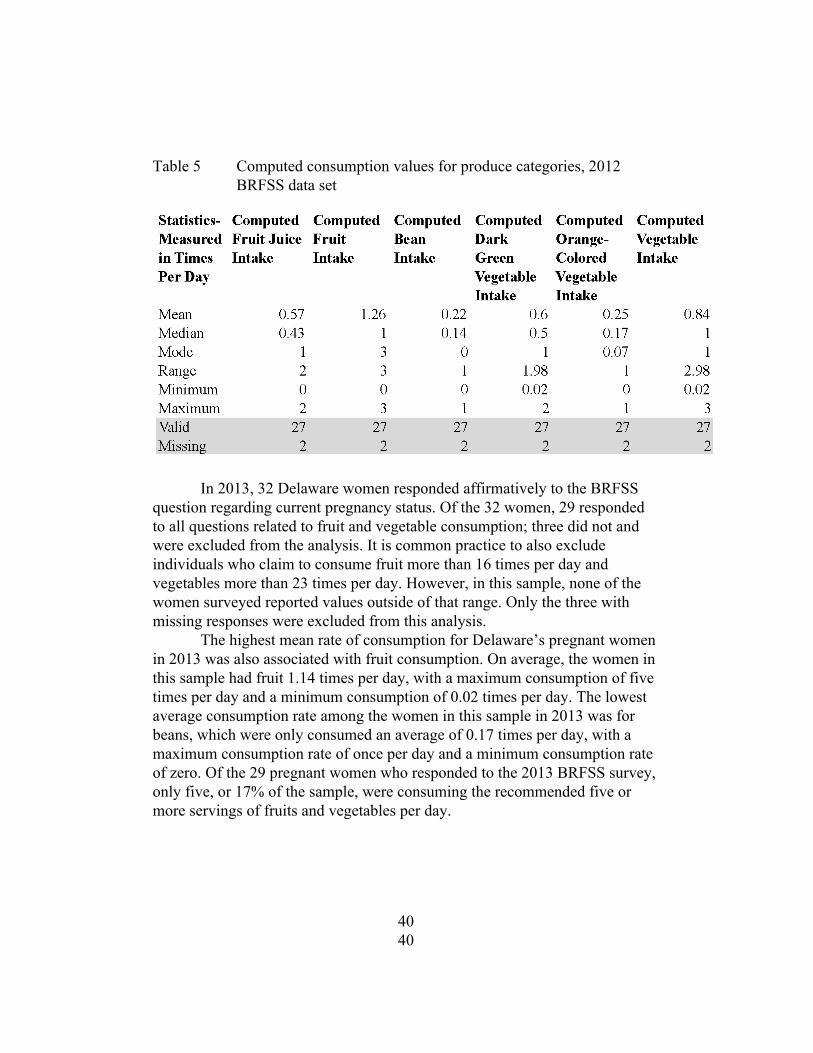
Table 5 Computed consumption values for produce categories, 2012 BRFSS data set
In 2013, 32 Delaware women responded affirmatively to the BRFSS
question regarding current pregnancy status. Of the 32 women, 29 responded to all questions related to fruit and vegetable consumption; three did not and were excluded from the analysis. It is common practice to also exclude individuals who claim to consume fruit more than 16 times per day and vegetables more than 23 times per day. However, in this sample, none of the women surveyed reported values outside of that range. Only the three with missing responses were excluded from this analysis.
The highest mean rate of consumption for Delaware’s pregnant women in 2013 was also associated with fruit consumption. On average, the women in this sample had fruit 1.14 times per day, with a maximum consumption of five times per day and a minimum consumption of 0.02 times per day. The lowest average consumption rate among the women in this sample in 2013 was for beans, which were only consumed an average of 0.17 times per day, with a maximum consumption rate of once per day and a minimum consumption rate of zero. Of the 29 pregnant women who responded to the 2013 BRFSS survey, only five, or 17% of the sample, were consuming the recommended five or more servings of fruits and vegetables per day.
40 40
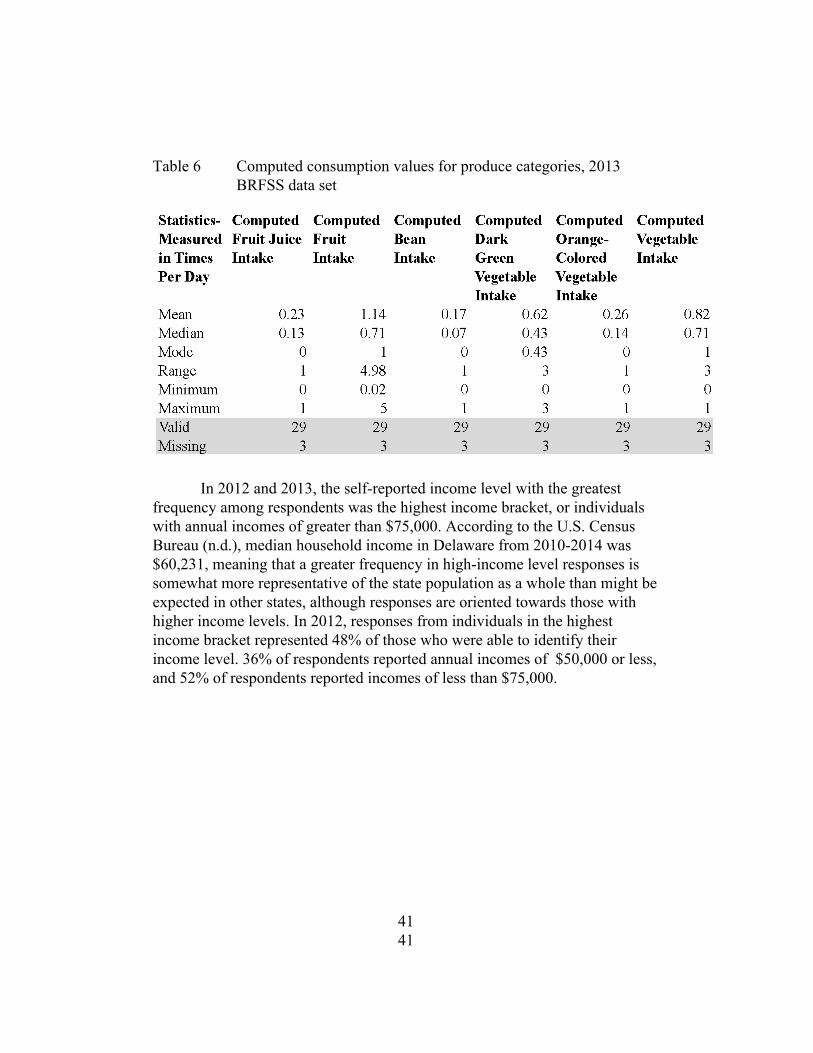
Table 6 Computed consumption values for produce categories, 2013 BRFSS data set
In 2012 and 2013, the selfreported income level with the greatest
frequency among respondents was the highest income bracket, or individuals with annual incomes of greater than $75,000. According to the U.S. Census Bureau (n.d.), median household income in Delaware from 20102014 was $60,231, meaning that a greater frequency in highincome level responses is somewhat more representative of the state population as a whole than might be expected in other states, although responses are oriented towards those with higher income levels. In 2012, responses from individuals in the highest income bracket represented 48% of those who were able to identify their income level. 36% of respondents reported annual incomes of $50,000 or less, and 52% of respondents reported incomes of less than $75,000.
41 41
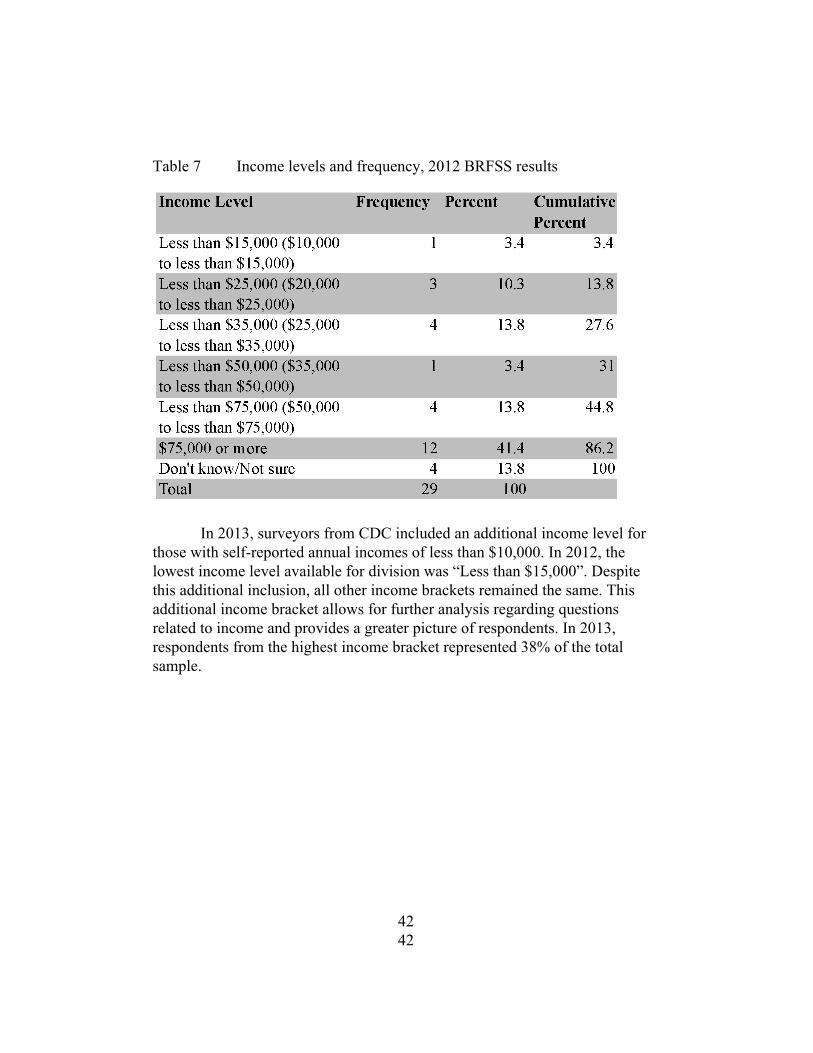
Table 7 Income levels and frequency, 2012 BRFSS results
In 2013, surveyors from CDC included an additional income level for
those with selfreported annual incomes of less than $10,000. In 2012, the lowest income level available for division was “Less than $15,000”. Despite this additional inclusion, all other income brackets remained the same. This additional income bracket allows for further analysis regarding questions related to income and provides a greater picture of respondents. In 2013, respondents from the highest income bracket represented 38% of the total sample.
42 42

Table 8 Income levels and frequency, 2013 BRFSS results
In 2012, respondents with the highest level of income also had the
highest levels of produce consumption across categories. The most pronounced difference between consumption levels by income was in the category of computed “other vegetables” (not including green leafy vegetables or orange vegetables) consumption category. This connection was not reflected for every income level however. Pregnant women who reported incomes of $35,000$50,000 also reported the lowest levels of vegetable consumption across all categories.
43 43
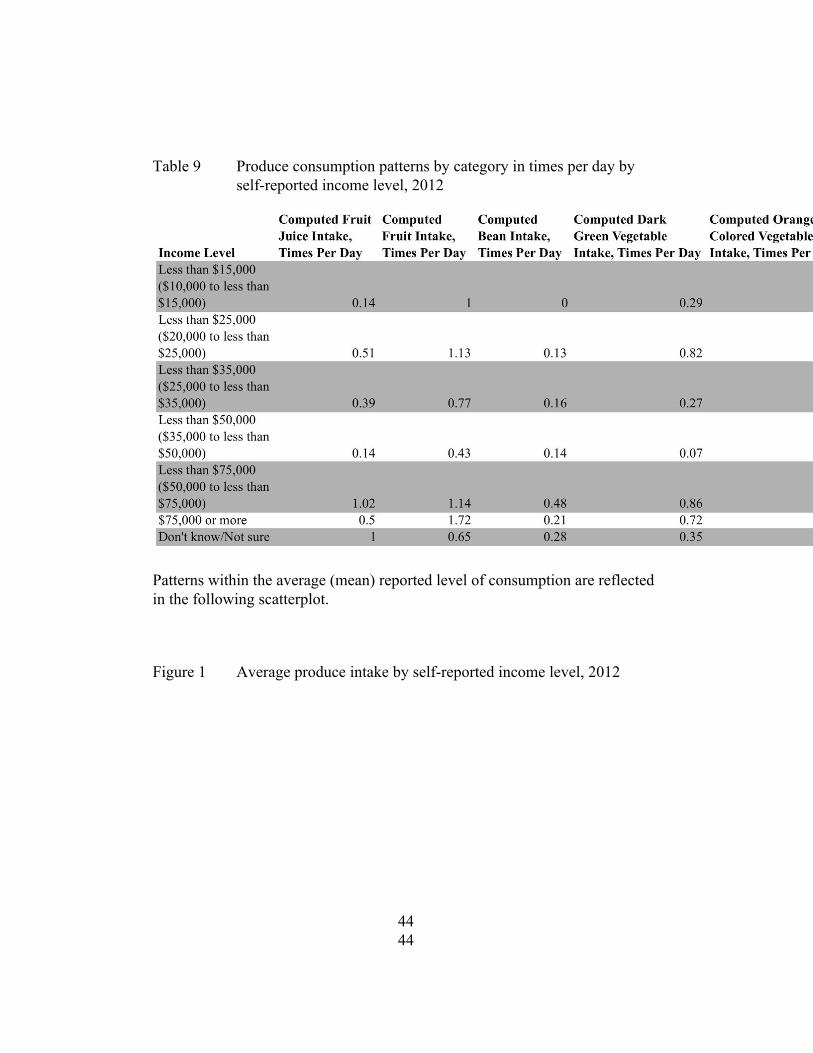
Table 9 Produce consumption patterns by category in times per day by selfreported income level, 2012
Patterns within the average (mean) reported level of consumption are reflected in the following scatterplot.
Figure 1 Average produce intake by selfreported income level, 2012
44 44

In 2013, respondents with the highest income levels were also those
with the highest levels of produce consumption across all categories. The connection between higher incomes and higher consumption was somewhat more consistent in 2013 than in 2012 across all categories. Although there was a trough in consumption levels for individuals with incomes between $20,000$25,000, it was not as meaningful as the trough observed in 2012. Overall, it appears that women in this sample who had higher incomes were also more likely to demonstrate higher levels of average produce consumption across all categories.
45 45
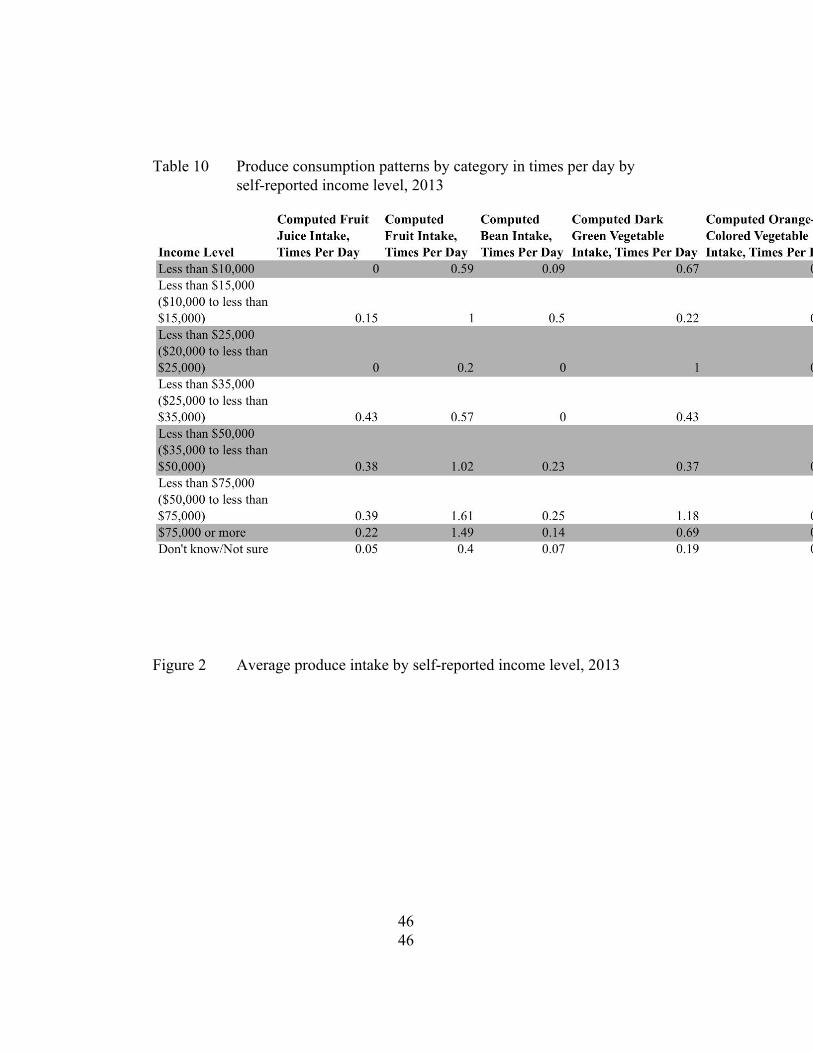
Table 10 Produce consumption patterns by category in times per day by selfreported income level, 2013
Figure 2 Average produce intake by selfreported income level, 2013
46 46
Chapter 4
47 47

DISCUSSION
The results of the 2012 and 2013 Behavioral Risk Factor Surveillance System indicate that the pregnant women in Delaware, who responded, regardless of income level, did not typically consume the dailyrecommended amount of fruits and vegetables. On average, women with higher incomes did consume fruits and vegetables at higher rates than their counterparts of lower income levels, however, most did not reach five servings per day.
The population sample that I chose to work with was undoubtedly small for a number of reasons. First, I chose to examine a very specific demographic. Second, I was interested in examining this demographic in a very low population state regardless of the group that I chose to focus on, the number of individual respondents would be lower in Delaware than it would be in states with larger populations. Third, I used results from a selfreported survey. Although the BRFSS is intended to be representative of a state’s larger population, it is not a survey that is given to every individual in a geographical area and responses are not mandatory. Finally, I only examined two years worth of data.
Given the small size of my population sample, I briefly considered aggregating the BRFSS data from 2012 and 2013 to create a larger, more comprehensive sample. However, given the fact that I manipulated the data from 2012 and calculated responses based on raw variable information, I did not feel comfortable aggregating the two years of data in order to generate a larger sample. Furthermore, there were slight differences between the 2012 and 2013 surveys that could not necessarily allow for aggregation. For example, in 2012, the lowest category for selfreported income level was “Less than $15,000”; by 2013, this had been changed and the category “Less than $10,000” had been added.
Although a small sample of data was used, the results are important to note and may be explained in part by the factors that impact individual diet. There are many reasons why pregnant women in Delaware might fail to consume the necessary amounts of fruits and vegetables. According to the European Food Information Council (2004), food choice is influenced by a number of interconnected factors. From a biological perspective, the central reason for eating is hunger and satiety, but our physiological and nutritional needs are not the only determinants for food choice, and other factors that may influence food choices include sensory properties such as taste and smell; social factors; emotional responses; personal values and beliefs; cultural factors; and economic conditions (European Food Information Council, 2004).
Studies have found similar reasons behind personal food choices and produce consumption patterns. In the late 1990s, researchers focused on the
48 48
reasons behind taste preferences, and why individuals chose to eat the way that they did. In a crosssectional study of 14,331 subjects aged 15 and older from EU member states, Lennernas et. al. (1997) completed facetoface interviewassisted questionnaires in order to gather comparable data from EU member countries on the perceived influences associated with dietary choices. Results from the study indicated that the five most important factors “influencing consumers food choice were 'quality or freshness' (74%), 'price' (43%), 'taste' (38%), 'trying to eat healthy' (32%) and 'family preferences' (29%),” (Lennernas, 1997, para.4). Demographics factors were associated with certain stated influences on food choice (Lennernas, 1997). Researchers found that women, older, and more educated subjects were more likely than other subjects to state that the attempt to eat healthy was a major influence on their diets (Lennernas, 1997). Unemployed and retired subjects found price to be the most important factor in dietary decisions (Lennernas, 1997).
Glanz et. al. (1998) examined the selfreported importance of several factors related to personal dietary choices, including taste, nutrition, cost, convenience, and weight control, and whether those factors varied by demographic group, if they were associated with other healthy lifestyle choices, and if those choices predicted eating behavior in two crosssectional surveys of 2,957 adults. Outcomes measured included the consumption of several food group, including fresh produce, cheese, breakfast cereals, and fast foods (Glanz et. al., 1998).
Survey respondents reported that the most important influence on food choices was the taste of a food, followed by the cost, and when eating behaviors were analyzed demographic features “predicted consumption of fruits and vegetables, fast foods, cheese, and breakfast cereal,” (Glanz et. al., 1998, p.1118). Nutrition was more important to older respondents, women, and certain ethnic groups and the importance of nutrition had no significant relationship to income (Glanz et. al., 1998). Cost was most important for younger respondents, women, people with lower incomes, and nonwhite respondents (Glanz et. al., 1998). Convenience was also rated as being most important for younger respondents and those with lower incomes; “nonwhites and especially blacks rating convenience as more influential on their food choices,” (Glanz et. al., 1998, p.1124). Researchers concluded that the relative importance of cost and convenience was largely predicted by age; the importance of taste, nutrition, cost, and weight control was predicted by gender; and the importance of cost and convenience was largely predicted by income, and was most important to those with lower incomes (Glanz et. al., 1998).
In a study published in the American Journal of Clinical Nutrition (Kamphuis et. al., 2015), researchers carried out a discrete choice experiment
49 49
during facetoface interviews with approximately 20 olderadults (mean age of 63.3). Participants “were offered a series of choice sets about a usual dinner at home and asked to choose in each choice set between 2 meals, with different combinations of attribute levels,” (Kamphuis et. al., 2015, p.768). Meal attributes included health, taste, preparation time required, time associated with traveling to shops, and price; each attribute was given three or four levels (Kamphuis et. al., 2015). Researchers found that “Healthiness, taste, price, and travel time to the grocery store proved to significantly influence older adults’ meal decisions” (p.768) and for all participants, the health of the meal was designated as the most important attribute (Kamphuis et. al., 2015). However, the background of participants did generate some variations in responses. Participants with higher levels of education designated healthy, less expensive meals as being more important than those with lower levels of education; those with high incomes designated healthy and tasteful meals to be of greater importance than those with lower incomes (Kamphuis et. al., 2015).
Other researchers have focused on examining the motivations behind consumption choices related to nutrition intervention programs. Hardcastle and Blake (2016) examined the underlying perceptions and attitudes that influence food choices and sought to assess the impact of a schoolbased healthy eating intervention program on mothers living in an economically disadvantaged community. The study was qualitative, and was conducted through phone interviews with mothers after their children had participated in an afterschool healthy cooking intervention program that was held for six weeks (Hardcastle & Blake, 2016). The results of the study “demonstrated the wider economic and social influences on food choices and eating practices,” (Hardcastle & Blake, 2016, p.1). Households described the important influence of cultural norms on eating habits, family diet, and “parental decisions underpinning food choices and attitudes towards the control of food within the family,” (Hardcastle & Blake, 2016, p.1). Finally, the study made clear “the importance of parental involvement in schoolbased interventions if improvements in healthy eating are to be evidenced at the family level and maintained,” (Hardcastle & Blake, 2016, p.7).
A number of studies have reiterated and examined the influence that familial factors have on individual diets, another possible reason behind the consumption patterns of pregnant women in Delaware surveyed by the BRFSS. Fulkerson et. al. (2014) conducted a literature review of studies that examined the association “between family meal frequency and dietary outcomes as well as weight status across the lifespan” (p.2). The review was aimed at improving the “understanding of the mechanisms involved in the positive associations seen with family meal frequency,” (Fulkerson et. al., 2014, p.2). Findings from the review provided important evidence that family meals during a person’s
50 50
youth and shared meals among adults were associated with higher consumption levels of fruits and vegetables, eating breakfast, high intakes of micronutrients and vitamins, and low levels of consumption of soda, highfat foods, and unhealthy snacks (Fulkerson et. al., 2014). These findings were consistent across the lifespan, but the study also noted “barriers to eating meals together (eg, busy families, contextual factors in lowSES households) exist,” (Fulkerson et. al., 2014, p.15). An extension of this research could assess the familial structure of pregnant women in Delaware, and assess whether or not there is an association between certain family structures and dynamics and consumption of fruits and vegetables. However, this would likely require a survey with a greater emphasis on questions about familial structure than the standard BRFSS.
These studies demonstrate the various reasons why individuals choose to consume the foods that they do. The factors that influence diet, including taste, cost, convenience, nutritional value, and culture, are often tied to personal preferences as well as demographic characteristics. This is likely the case for those pregnant Delaware women who were surveyed in the 2012 and 2013 BRFSS. Fruit and vegetable consumption is undoubtedly low in this sample population, however, there are reasons for this situation. For pregnant women of lower incomes, the cost associated with fresh produce may be a factor limiting their consumption. For pregnant women of higher incomes, the taste of fruits and vegetables may not be appealing. Further research is needed to understand the specific influences on pregnant women’s diets in the state of Delaware and elsewhere, but BRFSS data coupled with research does indicate a number of possibilities associated with lower than recommended consumption rates.
51 51

Chapter 5
52 52

POLICY RECOMMENDATIONS
In order to provide concrete and specific policy recommendations, I would need to analyze a far larger set of data for a greater number of consecutive years, an undertaking beyond the scope of an undergraduate thesis. The Behavioral Risk Factor Surveillance System data analyzed for the purposes of this project is simply too smallscale to provide a full picture of pregnant women’s diets in the state of Delaware. However, these results do offer a snapshot of the situation in Delaware, and can provide some guidance for more general policy recommendations that state and local policymakers, as well as medical professionals, should consider. Physicians should take an active role in discussing the importance of diet during pregnancy with their patients and the state of Delaware should pay close attention to pregnant women who may be at higher risk for an unhealthy or difficult pregnancy.
A woman’s time of pregnancy presents an excellent opportunity for physicians to conduct indepth conversations regarding health. Women have more frequent doctor visits, and in a qualitative study by Stotland et. al. (2010) which used seven focus groups of general obstetricians, gynecologists, midwives, and nurse practitioners, pregnancy was viewed as “an opportune time to address behavior changes because women have the additional motivation of the child's health and avoiding complications during birth,” (p.807). However, nutrition counseling can be a difficult undertaking, and Stotland et. al. (2010) also identified several barriers for providers. Although the majority of study participants expressed frustration at rising rates of obesity and other health risks in pregnancy, providers felt burdened by “insufficient training, concern about the sensitivity of the topic, and the perception that counseling is ineffective,” (Stotland et. al., 2010, p.807). These barriers are significant for members of the medical community, but the study also noted the power of providers, which is often greater than they may be aware of, a power that can help patients make longterm changes even when immediate results are not visible (Stotland et. al., 2010). Although provider confidence may be lacking, “prenatal weight gain counseling, provided in a nonjudgmental, individualized manner, has the potential to improve the health and lives of women, their offspring, and their community,” (Stotland et. al., 2010, p.813).
Other studies have provided similar guidance for providers. Focus groups conducted by Herzig et. al. (2006) found that “assessment and counseling techniques directed at encouraging, enhancing, or supporting patients’ motivation to change can become core elements in protocols that can be brief, structured, and tailored to individual patients, a patientcentered approach also found in many proven interventions,” (p.233). All providers in the state of Delaware should take a proactive role in discussing the importance of diet quality and quantity during pregnancy, in a way that is both sensitive to
53 53
and cognizant of a patient’s needs. Wellformulated conversations surrounding nutrition and fruit and vegetable consumption can go a long way to advance the health of mothers and their children.
Physicians should also be aware of the additional resources and support that may be necessary for improving diet during pregnancy in highrisk populations, including teen mothers, Spanish speaking populations and lowincome women.
In a paper published in the Journal of Perinatal Education, Dr. Kristin Montgomery (2003) offers seven recommendations to advance the goal of improving nutrition among pregnant adolescents. These recommendations were directed at providers and include the following: focusing on foods, not nutrients; individualizing and working within current eating habits; considering the context of family and peer groups; rewarding efforts; simplifying the process; focusing on weight gain patterns for optimal birth outcomes; and referring patients to a dietician (Montgomery, 2003).
For Spanish speaking women, community based programs may be especially effective. From 20042006, the University of Michigan School of Public Health designed and implemented an intervention in Detroit entitled Healthy Mothers on the Move (MOMs), which was a culturally tailored, Spanishlanguage program that lasted 11 weeks (Kieffer et. al., 2012). The program “offered home visits, group classes, related activities, and social support from trained community health workers (CHWs) and peers,” (Kieffer et. al., 2012, p.526). The goal of the program was to evaluate the effectiveness of communitybased intervention, and researchers used food frequency questionnaires and linear mixed models to estimate pre and postintervention changes within the experimental (MOMs) group and the control group (Kieffer et. al., 2012). The results of the intervention were positive. Women in the MOMs intervention program “showed significant improvement in all dietary behaviors” (p.526), decreasing their consumption of added sugar, total fat, saturated fat, and increasing their vegetable and fiber consumption compared to women in the control or nonintervention group (Kieffer et. al., 2012).
Government programs may be especially helpful for lowincome women to ensure the adequate consumption of fruits and vegetables during pregnancy. One of the most wellknown of these programs is WIC, the Special Supplemental Food Program for Women, Infants, and Children, which was created in 1972 to “provide food assistance, nutrition, education, and health and social service referrals to pregnant women who live in poverty (<185% of the federal poverty level) and are a nutritional risk as determined by a qualified health professional,” (Brinberg & Axelson, 2002, p.100). According to the United States Department of Agriculture’s Food and Nutrition Service (2015), 53% of infants participated in WIC in 2015. The federal grant program, which
54 54
Congress authorizes a specific amount of funds to each year, is administered at the Federal level by the United State Department of Agriculture’s Food and Nutrition Services [USDA FNS], as well as 90 WIC state agencies, operating at 10,000 clinic sites in five territories, 34 Indian Tribal Organizations, and 50 state health departments as well as the District of Columbia (USDA FNS, 2015). Services may be provided at a number of locations including hospitals and mobile clinics, health departments and migrant health centers, community centers, schools, and public housing sites (USDA FNS, 2015).
Although a full discussion of WIC is beyond the scope of this undergraduate thesis, it has been widely examined in regards to its impact on maternal and child health. Research has demonstrated the benefits associated with WIC, and metaanalyses have shown that providing “WIC benefits to pregnant women is estimated to reduce low birth weight rates 25 percent and reduce very low birth weight births by 44 percent” (Avruch & Cackley, 1995, p.27). In an analysis of enrollment numbers and costsavings associated with better birth outcomes, researchers at the Government Accountability Office determined that for every $1 spent on WIC services “the Federal Government saved $.93 in Medicaid costs and State governments saved $0.77. Private payershospitals, insurers, and private personssaved an additional $1.37 for each Federal dollar spent. Firstyear medical savings totaled $3.07 for every dollar invested in prenatal WIC services,” (Avruch & Cackley, 1995, p.33).
WIC distributions are organized as packages, each package intended for a different group of participants (pregnant women, infants, young children, etc.). In 2007, the package contents were revised for the first time since 1980 to bring them into alignment with guidelines from the American Academy of Pediatrics on infant feeding and the Dietary Guidelines for Americans, and state agencies “were required to implement the new food packages by October 2009,” (Food Research and Action Center, 2014, p.2). Some of the features of the newpackages include more low and nonfat dairy offerings, fruits and vegetables, and whole grain bread with the option to substitute wholegrain tortillas, pasta, rice, and other grains (Food Research and Action Center, 2014). There is also the opportunity to “allow the substitution of soymilk, tofu, and (in 2015) yogurt for milk and cheese,” (Food Research and Action Center, 2014, p.2).
Research suggests that these revised packages have had positive impacts on the diets of WIC participants, including pregnant women. Whaley et. al. (2012) compared surveys conducted before and after the implementation of the new food basket requirements to understand the impact of the change California WIC families. It was discovered that wholegrain food consumption increased by 17.3 percentage points, consumption of whole milk was reduced by 19.7 percentage points, and increases in the consumption of fruits and
55 55
vegetables were also observed (Whaley et. al., 2012). According to researchers from the Center on Budget and Policy Priorities, “children whose mothers participated in WIC while pregnant scored higher on assessments of mental development at age 2 than similar children whose mothers did not participate, and they later performed better on reading assessments while in school,” (Carlson & Neuberger, 2015, para.3). Furthermore, the researchers described WIC as reducing the national risk of infant mortality and supporting healthier pregnancies and births by promoting healthy eating with nutrition evaluations and counseling; connecting pregnant women to vital prenatal care; and providing specifically tailored and healthy foods to meet the needs of expectant mothers and their babies (Carlson & Neuberger, 2015).
Given what we know about pregnant women's diets in Delaware, policy makers should make a special effort to understand the demographics of women in this group, and pay close attention to the needs of women who may belong to a sensitive or highrisk demographic. This includes teen mothers, Spanish speakers, and women who are lowincome. The first step in this process will involve further research, likely using both BRFSS data as well as U.S. Census Bureau data. This research should be conducted with the goal of gathering further information about pregnant women in Delaware, information that can be used to better inform policies and initiatives at the state and local level. In the meantime, physicians can take an active role in discussing the importance of fruit and vegetable consumption, focusing on pregnant patients as individuals and taking account of outside factors that could impact diet quality. Community health centers, social service providers, and local nonprofits should seek to provide additional support for Spanishspeaking pregnant women in the form of Community Health Workers, and organizations across the state should consider appropriate and effective programming that can be implemented at the local level to address diet during pregnancy. Finally, members of the state’s Congressional delegation should work to ensure that WIC is allocated an appropriate amount of funding each year. Leaders in the Delaware’s WIC agency must make sure that they are efficient and effective in their use of federal funds.
56 56

Chapter 6
57 57
CONCLUSION
The body of evidence pointing to the importance of eating fruits and vegetables is overwhelming. Produce is an integral part of the human diet and plays a vital role in maintaining one’s health. This is especially important to consider in an era when chronic diseases brought on my obesity are becoming increasingly prevalent among all population groups, including pregnant women, who’s health should be taken into special consideration.
Expectant mothers are a specific segment of the population that public health researchers should devote time to researching. The health status of a pregnant woman is an important factor in determining the health status of an infant; the health status of an infant will impact the health status of that infant as a child and finally, as an adult. Prioritizing the health of women during pregnancy is not just an issue for women’s health. It is a public health issue for our society as a whole.
For pregnant women, a diet rich in fruits and vegetables is essential. Although the data described in this paper cannot offer conclusive evidence regarding the produce consumption patterns of pregnant women in Delaware, it does offer a snapshot of the current condition in which very few women are consuming recommended daily servings.
This condition must be addressed as a way to enhance the overall health of the population. With the help of further research, we can begin to understand the reasons that expectant mothers in Delaware eat the way that they do, and the obstacles that they face in making healthier diet choices. This knowledge can inform stronger healthcare system policies to advise doctors and nurses on how to discuss diet and nutrition with their pregnant patients, and how to encourage greater fruit and vegetable consumption. Information can also enable us to understand and serve our most vulnerable populations, and minimize the detrimental impact that a low household income may have on diet choices.
58 58

REFERENCES
American Association for Public Opinion Research. (2015, April). Standard
Definitions Final Dispositions of Case Codes and Outcome Rates for
Surveys. Retrieved from
http://www.aapor.org/AAPOR_Main/media/publications/StandardDefi
nitions2015_8theditionwithchanges_April2015_logo.pdf
American Association for Public Opinion Research. (n.d.). Response Rates An
Overview. Retrieved from
http://www.aapor.org/EducationResources/ForResearchers/PollSurve
yFAQ/ResponseRatesAnOverview.aspx
Amnesty International. (2011, May). U.S. Maternal Health Crisis Facts.
Retrieved from
http://www.amnestyusa.org/aboutus/amnesty50years/50yearsofhu
manrights/usmaternalhealthcrisisfacts
Andersen, V., Olsen, A., Carbonne, F., Tjønneland, A. & Vogel, U. (2012,
March). Diet and risk of inflammatory bowel disease. Digestive and
Liver Disease, 44(3), 185194. doi: 10.1016/j.dld.2011.10.001
59 59

Agency for Healthcare Research and Quality. (2014, October). Asthma Care
Quality Improvement: E. Behavioral Risk Factor Surveillance System
(BRFSS) Measures, Data, and Benchmarks. Retrieved from
http://www.ahrq.gov/professionals/qualitypatientsafety/qualityresour
ces/tools/asthmaqual/asthmacare/appendixe.html
Atrash, H.K., Johnson, K., Adams, M., Cordero, J.F., & Howse, J. (2006,
September). Preconception Care for Improving Perinatal Outcomes:
The Time to Act. Maternal and Child Health Journal, 10 (1), 311. doi:
10.1007/s1099500601004
Avruch, S. & Cackley, A. P. (1995 January). Savings Achieved by Giving
WIC Benefits to Women Prenatally. Public Health Reports, 110(1),
27–34. Retrieved from
http://www.ncbi.nlm.nih.gov/pmc/articles/PMC1382070/
Backholer, K., Spencer, E., Gearon, E., Magliano, D. J., McNaughton, S. A.,
Shaw, J. E. & Peeters, A. (2015 May). The association between
socioeconomic position and diet quality in Australian adults. Public
Health Nutrition, 19(3), 477485. doi:
http://dx.doi.org/10.1017/S1368980015001470
60 60
Bazzano, L., Li, T., Joshipura, K. & Hu, F. (2008 July). Intake of Fruit,
Vegetables, and Fruit Juices and Risk of Diabetes in Women. Diabetes
Care, 31 (7), 13111317. doi: 10.2337/dc080080
Blackmore, H. L. & Ozanne, S. E. (2013). Maternal dietinduced obesity and
offspring cardiovascular health. Journal of Developmental Origins of
Health and Disease, 4(5), 338347. doi:10.1017/S2040174412000761
Bleich, S.N., JonesSmith, J., Wolfson, J.A., Zhu, X. & Story, M. (2015,
November). The Complex Relationship Between Diet and Health.
Health Affairs, 34(11), 18131820. doi: 10.1377/hlthaff.2015.0606
Block, G., Patterson, B. & Subar, A. (1992). Fruit, vegetables, and cancer
prevention: a review of the epidemiological evidence. Nutrition and
Cancer, 18, 129. Retrieved from
http://www.ncbi.nlm.nih.gov/pubmed/1408943
Boeing H., Bechthold A., Bub A., Ellinger S., Haller D., Kroke A., et al (2012,
September). Critical review: vegetables and fruit in the prevention of
chronic diseases. European Journal of Nutrition, 51(6), 637663.
Retrieved from
http://link.springer.com/article/10.1007/s003940120380y
61 61
Bortolus, R. et. al. (2014). Prevention of congenital malformations and other
adverse pregnancy outcomes with 4.0 mg of folic acid:
communitybased randomized clinical trial in Italy and the Netherlands.
BMC Pregnancy and Childbirth, 14, 166.
doi: 10.1186/1471239314166
Braveman, P. & Gottlieb, L. (2014 January). The Social Determinants of
Health: It's Time to Consider the Causes of the Causes. Public Health
Reports, 129(2), 1931. Retrieved from
http://www.ncbi.nlm.nih.gov/pmc/articles/PMC3863696/
Brinberg, D. & Axelson, M. L. (2002). Improving the Dietary Status of
LowIncome Pregnant Women at Nutritional Risk. Journal of Public
Policy & Marketing, 21(1), 100104. Retrieved from
http://www.jstor.org/stable/30000712?seq=1#page_scan_tab_contents
62 62
Bynner, J., Butler, N., Ferri, E., Shepherd, P. & Smith, K. (2000). The Design
and Conduct of the 19992000 Surveys of the National Child
Development Study and the 1970 British Cohort Study. University of
London Centre for Longitudinal Studies, CLS Cohort Studies Working
Paper 1. Retrieved from
http://www.esds.ac.uk/doc/5578/mrdoc/pdf/user_guide_19992000_vol
_1_design_and_conduct_of_the_19992000_surveys.pdf
Carlson, A. & Frazao, E. (2014 July). Food costs, diet quality and energy
balance in the United States. Physiology and Behavior, 134, 2031.
doi:10.1016/j.physbeh.2014.03.001
Carlson, S. & Neuberger, Z. (2015, May 4). WIC Works: Addressing the
Nutrition and Health Needs of LowIncome Families for 40 Years.
Center on Budget and Policy Priorities. Retrieved from
http://www.cbpp.org/research/foodassistance/wicworksaddressingth
enutritionandhealthneedsoflowincomefamilies
Centers for Disease Control and Prevention. (1992, September 11).
Recommendations for the Use of Folic Acid to Reduce the Number of
Cases of Spina Bifida and Other Neural Tube Defects. Retrieved from
http://www.cdc.gov/mmwr/preview/mmwrhtml/00019479.htm
63 63
Centers for Disease Control and Prevention. (2010). What: Is low birth weight
a problem? Retrieved from
http://www.cdc.gov/pednss/how_to/interpret_data/case_studies/low_bir
thweight/what.htm
Centers for Disease Control and Prevention. (2012, January 6). 2012
Behavioral Risk Factor Surveillance System Questionnaire. Retrieved
from http://www.cdc.gov/brfss/questionnaires/pdfques/2012_brfss.pdf
Centers for Disease Control and Prevention. (2013, July 3). 2012 Summary
Data Quality Report. Retrieved from
http://www.cdc.gov/brfss/annual_data/2012/pdf/summarydataqualityre
port2012_20130712.pdf
Centers for Disease Control and Prevention. (2014, July 13). About the
Behavioral Risk Factor Surveillance System (BRFSS). Retrieved from
http://www.cdc.gov/brfss/about/about_brfss.htm
Centers for Disease Control and Prevention. (2014, August 15). Overview:
BRFSS 2013. Retrieved from
http://www.cdc.gov/brfss/annual_data/2013/pdf/overview_2013.pdf
64 64
Centers for Disease Control and Prevention. (2014, August 15). 2013 Summary
Data Quality Report. Retrieved from
http://www.cdc.gov/brfss/annual_data/2013/pdf/2013_dqr.pdf
Centers for Disease Control and Prevention. (2014, November 4).
Questionnaires 2013 Modules by State. Retrieved from
http://www.cdc.gov/brfss/questionnaires/state2013.htm
Centers for Disease Control. (2014, November 4). 2013 State Module.
Retrieved from http://www.cdc.gov/brfss/questionnaires/state2013.htm
Centers for Disease Control and Prevention. (2014, December 15).
Questionnaires 2012 Modules by State. Retrieved from
http://www.cdc.gov/brfss/questionnaires/state2012.htm
Centers for Disease Control and Prevention. (2015, April 28). Facts About
Folic Acid. Retrieved from
http://www.cdc.gov/ncbddd/folicacid/about.html
Crider, K. S., Bailey, L. B. & Berry, L. J. (2011, March). Folic Acid Food
Fortification—Its History, Effect, Concerns, and Future Directions.
Nutrients, 3, 370384. doi: 10.3390/nu3030370
65 65
Darmon, N. & Drewnowski, A. (2015). Contribution of food prices and diet
cost to socioeconomic disparities in diet quality and health: a
systematic review and analysis. Nutrition Reviews, 73(10), 643660.
doi: 10.1093/nutrit/nuv027
Dietitians of Canada. (2014, February 25). Food Sources of Folate. Retrieved
from
http://www.dietitians.ca/YourHealth/NutritionAZ/Vitamins/FoodSo
urcesofFolate.aspx
Drake, A. J., McPherson, R. C., Godfrey, K. M., Cooper, C., Lillycrop, K. A.,
Hanson, M. A., Meehan, R. R., Seckl, J. R. and Reynolds, R. M.
(2012), An unbalanced maternal diet in pregnancy associates with
offspring epigenetic changes in genes controlling glucocorticoid action
and foetal growth. Clinical Endocrinology, 77, 808–815.
doi:10.1111/j.13652265.2012.04453.x
European Food Information Council. (2004 May). Why do we eat what we eat:
Food choice a complex behavior. Retrieved from
http://www.eufic.org/article/en/artid/foodchoicecomplexbehaviour/
66 66
Filippi, V., Ronsmans, C., Campbell, O., Graham, W., Mills, A., Borghi, J.,
Koblinsky, M., & Osrin, D. (2006 November). Maternal health in poor
countries: the broader context and a call for action. The Lancet, 368
(9546), 15351541. doi: 10.1016/S01406736(06)693847.
Food Research and Action Center. (2014 September). Impact of the Revised
WIC Food Packages on Nutrition Outcomes and the Retail Food
Environment. Retrieved from
http://frac.org/pdf/frac_brief_revised_wic_food_package_impact_nutrit
ion_retail.pdf
Fulkerson, J. A., Larson, N., Horning, M. & NeumarkSztainer, D. (2014
January). A Review of Associations Between Family or Shared Meal
Frequency and Dietary and Weight Status Outcomes Across the
Lifespan. Journal of Nutrition Education and Behavior, 46(1), 219.
doi:10.1016/j.jneb.2013.07.012
Glanz, K., Basil, M., Maibach, E., Goldberg, J. & Snyder, D. (1998 October).
Why Americans Eat What They Do: Taste, Nutrition, Cost,
Convenience, and Weight Control Concerns as Influences on Food
Consumption. Journal of the American Dietetic Association, 98(10),
1181126. doi: 10.1016/S00028223(98)002600.
67 67
Hardcastle, S. J. & Blake, N. (2016 January). Influences underlying family
food choices in mothers from an economically disadvantaged
community. Eating Behaviors, 20, 18.
doi:10.1016/j.eatbeh.2015.11.001
Herrick, K., Phillips, D. I. W., Haselden, S., Shiell, A. W., CampbellBrown,
M., Godfrey, K. M. (2011). Maternal Consumption of a HighMeat,
LowCarbohydrate Diet in Late Pregnancy: Relation to Adult Cortisol
Concentrations in the Offspring. The Journal of Clinical Endocrinology
and Metabolism, 88(8), 3554–3560. doi:
http://dx.doi.org/10.1210/jc.2003030287
Herzig, K., Danley, D., Jackson, R., Petersen, R., Chamberlain, L. & Gerbert,
B. (2006 May). Seizing the 9month moment: Addressing behavioral
risks in prenatal patients. Patient Education and Counseling, 61(2),
228235. doi: 10.1016/j.pec.2005.04.001
Hou, J. K., Abraham, B &, ElSerag, H. (2011 April). Dietary Intake and Risk
of Developing Inflammatory Bowel Disease: A Systematic Review of
the Literature. The American Journal of Gastroenterology, 106,
563573. doi:10.1038/ajg.2011.44
68 68
Institute of Medicine (US) Committee on a National Surveillance System for
Cardiovascular and Select Chronic Diseases. A Nationwide Framework
for Surveillance of Cardiovascular and Chronic Lung Diseases.
Washington (DC): National Academies Press (US); 2011. 5, Existing
Surveillance Data Sources and Systems. Available from:
http://www.ncbi.nlm.nih.gov/books/NBK83157
Johnson, K., Posner, S.F., Bierman, J., Cordero, J.F., Atrash, H.K., Parker,
C.S., Boulet, S. & Curtis, M.G. (2006, April 21). Recommendations to
Improve Preconception Health and Health Care United States: A
Report of the CDC/ATSDR Preconception Care Work Group and the
Select Panel on Preconception Care. Morbidity and Mortality Weekly
Report. Retrieved from
http://origin.glb.cdc.gov/mmwR/preview/mmwrhtml/rr5506a1.htm
Kamphuis, C. B. M., de BekkerGrob, E. W. & van Lenthe, F. J. (2015 April).
Factors affecting food choices of older adults from high and low
socioeconomic groups: a discrete choice experiment. The American
Journal of Clinical Nutrition, 101(4), 768774. doi:
10.3945/ajcn.114.096776
69 69
Kant, A. K. & Graubard, B. I. (2013 May). Family Income and Education
Were Related with 30Year Time Trends in Dietary and Meal
Behaviors of American Children and Adolescents. The Journal of
Nutrition, 143(5), 690700. Retrieved from
http://search.proquest.com/docview/1372456869?accountid=10457
Key, T.J. (2011). Fruit and vegetables and cancer risk. British Journal of
Cancer, 104, 611. doi: 10.1038/sj.bjc.6606032
Kieffer, E. C., Welmerink, D. B., Sinco, B. R., Welch, K. B., Rees Clayton, E.
M., Schumann, C. Y. & Uhley, V. E. (2014 March). Outcomes in a
SpanishLanguage Randomized Controlled Diabetes Prevention Trial
With Pregnant Latinas. American Journal of Public Health, 104(3),
526533. doi: 10.2105/AJPH.2012.301122
Kington, R.S. & Smith, J.P. (1997, May). Socioeconomic Status and Racial
and Ethnic
Differences in Functional Status Associated with Chronic Diseases.
American Journal of Public Health, 87 (5), 805810. Retrieved from
http://www.ncbi.nlm.nih.gov/pmc/articles/PMC1381054/pdf/amjph005
040095.pdf
70 70
Lantz, P.M., House, J.S., Lepkowski, J.M., Williams, D.R., Mero, R.P., &
Chen, J. (1998, June 3). Socioeconomic Factors, Health Behaviors, and
Mortality: Results From a Nationally Representative Prospective Study
of US Adults. Journal of American Medicine, 279 (21), 17031728.
doi: 10.001/jama.279.21.1703.
Leddy, M.A., Power, M.L. & Schulkin, J. (2008). The Impact of Maternal
Obesity on Maternal and Fetal Health. Review in Obstetrics &
Gynecology, 1(4), 170178. Retrieved from
https://www.researchgate.net/profile/Meaghan_Leddy/publication/2395
2406_The_impact_of_maternal_obesity_on_maternal_and_fetal_health
/links/00b49527e8795b9e5d000000.pdf
Lennernas, M., Fjellstrom, C., Becker, W., Giachetti, I., Schmitt, A., Remaut
de Winter, A. & Kearney, M. (1997 June). Influences on food choice
perceived to be important by nationallyrepresentative samples of
adults in the European Union. European Journal of Clinical Nutrition,
51, S815. Abstract retrieved from the National Center for
Biotechnology Information database.
71 71
Li, M., Fan, Y., Zhang, X., Hou, W. & Tang, Z. (2014). Fruit and vegetable
intake and risk of type 2 diabetes mellitus: metaanalysis of prospective
cohort studies. BMJ Open. doi:10.1136/bmjopen2014 005497
Liu, Y., Heying, E. & Tanumihardjo, S. A. (2012, October 16). History, Global
Distribution, and Nutritional Importance of Citrus Fruits.
Comprehensive Reviews in Food Science and Food Safety, 11(6),
530545. doi: 10.1111/j.15414337.2012.00201.x
Marmot, M. & Bell, R. (2010 February). Health Equity and Development: the
Commission on Social Determinants of Health. European Review,
18(1), 17. doi: http://dx.doi.org/10.1017/S1062798709990081
Marshall, N., Murphy, E., Haas, K., King, J., Purnell, J. & Thornburg, K.
(2015, January). 210: Healthier maternal diet index score is associated
with healthier birth weight. American Journal of Obstetrics and
Gynecology, 212(1), S118S119. doi: 10.1016/j.ajog.2014.10.256
Mayo Clinic. (2014, February 1). Folate. Retrieved from
http://www.mayoclinic.org/drugssupplements/folate/background/hrb2
0059475
72 72
Miles, E. A., & Calder, P. C. (2015). Maternal diet and its influence on the
development of allergic disease. Clinical & Experimental Allergy, 45,
6374. doi: 10.1111/cea.12453
Miyake, Y., Okubo, H., Sasaki, S., Tanaka, K. & Hirota, Y. (2011 November).
Maternal dietary patterns during pregnancy and risk of wheeze and
eczema in Japanese infants aged 16–24 months: The Osaka Maternal
and Child Health Study. Pediatric Allergy and Immunology, 22(7),
734741. doi: 10.1111/j.13993038.2011.01176.x
Montgomery, K. S. (2003). Improving Nutrition in Pregnant Adolescents:
Recommendations for Clinical Practitioners. Journal of Perinatal
Education, 12(2), 2230. doi: 10.1624/105812403X106801
Muraki, I., Imamura, F., Manson, J., Hu, F., Willett, W., van Dam, R. & Sun,
Q. (2013). Fruit consumption and risk of type 2 diabetes: results from
three prospective longitudinal cohort studies. The BMJ, 347. doi:
http://dx.doi.org/10.1136/bmj.f5001
National Center for Health Statistics. (1998). Health, United States, 1998:
Socioeconomic Status and Health Chartbook. Retrieved from
http://www.cdc.gov/nchs/data/hus/hus98cht.pdf
73 73
Nelson, D. E. (2001, August). The Behavioral Risk Factor Surveillance
System: FederalState Relationships and Roles. Paper presented at the
annual meeting of the American Statistical Association. Retrieved from
https://www.amstat.org/sections/srms/Proceedings/y2001/Proceed/0006
4.pdf
Persson, L. A., Arifeen, S., Ekstrom, E. C., Rasmussen, K. M., Frongillo, E. A.
& Yunus, M. (2012, May). Effects of Prenatal Micronutrient and Early
Food Supplementation on Maternal Hemoglobin, Birth Weight, and
Infant Mortality Among Children in Bangladesh. JAMA, 307(19),
20502059. doi:10.1001/jama.2012.4061
Potdar, R. D. et. al. (2014 November). Improving women’s diet quality
preconceptionally and during gestation: effects on birth weight and
prevalence of low birth weight—a randomized controlled efficacy trial
in India (Mumbai Maternal Nutrition Project). American Journal of
Clinical Nutrition, 100(5), 12571268. doi: 10.3945/ajcn.114.084921
74 74

Ramakrishnan, U., Grant, F., Goldenberg, T., Zongrone, A. & Martorell, R.
(2012, July). Effect of Women's Nutrition before and during Early
Pregnancy on Maternal and Infant Outcomes: A Systematic Review.
Pediatric and Perinatal Epidemiology, 26(1), 285301. doi:
10.1111/j.13653016.2012.01281.x
Reiss, R., Johnston, J., Tucker, K., DeSesso, J. M. & Keen, C. L. (2012
December). Estimation of cancer risks and benefits associated with a
potential increased consumption of fruits and vegetables. Food and
Chemical Toxicology, 50(12), 44214427. doi:
10.1016/j.fct.2012.08.055
Rosenberg, T.J., Garbers, S., Lipkind, H. & Chiasson, M.A. (2005,
September). Maternal Obesity and Diabetes as Risk Factors for
Adverse Pregnancy Outcomes: Differences Among 4 Racial/Ethnic
Groups. American Journal of Public Health, 95(9), 15451551.doi:
10.2105/AJPH.2005.065680
75 75
Rozin, P., Fischler, C., Imada, S., Sarubin, A., & Wrzesniewski, A. (1999
October). Attitudes to Food and the Role of Food in Life in the U.S.A.,
Japan, Flemish Belgium and France: Possible Implications for the
DietHealth Debate. Appetite, 33 (2), 163180. doi:
10.1006/appe.1999.0244.
Save the Children. (2015). The Urban Disadvantage: State of the World’s
Mothers 2015. Retrieved from
http://www.savethechildren.org/atf/cf/%7B9def2ebe10ae432c9bd0d
f91d2eba74a%7D/SOWM_2015.PDF
Seyedrezazadeh, E., Moghaddam, M. P., Ansarin, K., Vafa, M. R., Sharma, S.
& Kolahdooz, F. (2014). Fruit and vegetable intake and risk of
wheezing and asthma: a systematic review and metaanalysis. Nutrition
Reviews, 72(7), 411428. doi: http://dx.doi.org/10.1111/nure.12121
Slavin, J.L. & Lloyd, B. (2012, July). Health Benefits of Fruits and Vegetables.
Advances in Nutrition, 3, 506512. doi: 10.3945/an.112.002154
76 76
Smith, D., Shipley, M.J., Rose, G. (1990). Magnitude and causes of
socioeconomic differentials in mortality: further evidence from the
Whitehall Study. Journal of Epidemiology and Community Health, 44,
265270. Retrieved from http://jech.bmj.com/content/44/4/265.full.pdf
Sorlie, P.D., Backlund, E. & Keller, J.B. (1995, July). US mortality by
economic, demographic, and social characteristics: the National
Longitudinal Mortality Study. American Journal of Public Health, 85
(7), 949956. Retrieved from
http://www.ncbi.nlm.nih.gov/pmc/articles/PMC1615544/pdf/amjph004
450055.pdf
Storey, M. & Anderson, P. (2014 October). Income and race/ethnicity
influence dietary fiber intake and vegetable consumption. Nutrition
Research, 34(10), 844850. doi: 10.1016/j.nutres.2014.08.016
Stotland, N. E., Gilbert, P., Bogetz, A., Harper, C. C., Abrams, B. & Gerbert,
B. (2010 April). Preventing Excessive Weight Gain in Pregnancy: How
Do Prenatal Care Providers Approach Counseling? Journal of Women’s
Health, 19(4), 807814. doi: 10.1089/jwh.2009.1462
77 77
Taruscio, D., Carbone, P., Granata, O., Baldi, F. & Mantovani, A. (2011 July).
Folic acid and primary prevention of birth defects. BioFactors, 27(4),
280284. doi: 10.1002/biof.175
United States Census Bureau. (n.d.). Quick Facts: Delaware. Retrieved from
http://www.census.gov/quickfacts/chart/INC110214/10
United States Department of Agriculture, AgResearch Magazine. (1997, June).
Foods To Be Fortified With Folic Acid. In Agricultural Research/June
1997. Retrieved from
http://agresearchmag.ars.usda.gov/AR/archive/1997/Jun/folate.pdf
United States Department of Agriculture Food and Nutrition Service. (2015,
February 27). About WIC. Retrieved from
http://www.fns.usda.gov/wic/aboutwicwicglance
United States Department of Agriculture & United States Department of
Health and Human Services. (2010, December). Dietary Guidelines for
Americans, 2010. Retrieved from
http://www.cnpp.usda.gov/sites/default/files/dietary_guidelines_for_am
ericans/PolicyDoc.pdf
78 78

University of Leeds. (n.d.). Richard W Smithells (1924 2002). Retrieved from
http://medhealth.leeds.ac.uk/info/299/history_of_the_school/365/peopl
e_of_achievement/11
University of Vermont. (n.d.). What is SPSS? In Introduction to SPSS.
Retrieved from
http://www.uvm.edu/~dhowell/fundamentals7/SPSSManual/SPSSLong
erManual/SPSSChapter1.pdf
Utah Department of Health. (2013, February 11). Versatility of the BRFSS.
Retrieved from
http://health.utah.gov/opha/IBIShelp/brfss/Background.htm
Verschuren, M. (2012 December). Diet and Cardiovascular Disease. Current
Cardiology Reports, 14(6), 701708. doi: 10.1007/s1188601203182
Wilcox, A. (2001). On the importanceand the unimportanceof birthweight.
International Journal of Epidemiology, 30, 12331241. Retrieved from
http://ije.oxfordjournals.org/content/30/6/1233.full.pdf
79 79
World Cancer Research Fund/American Institute for Cancer Research. (2007).
Food, Nutrition, Physical Activity, and the Prevention of Cancer: a
Global Perspective. Retrieved from
http://www.dietandcancerreport.org/cancer_resource_center/downloads
/Second_Expert_Report_full.pdf
World Health Organization. (2016). The determinants of health. Retrieved
from http://www.who.int/hia/evidence/doh/en/
80 80