Embed Size (px)
Citation preview
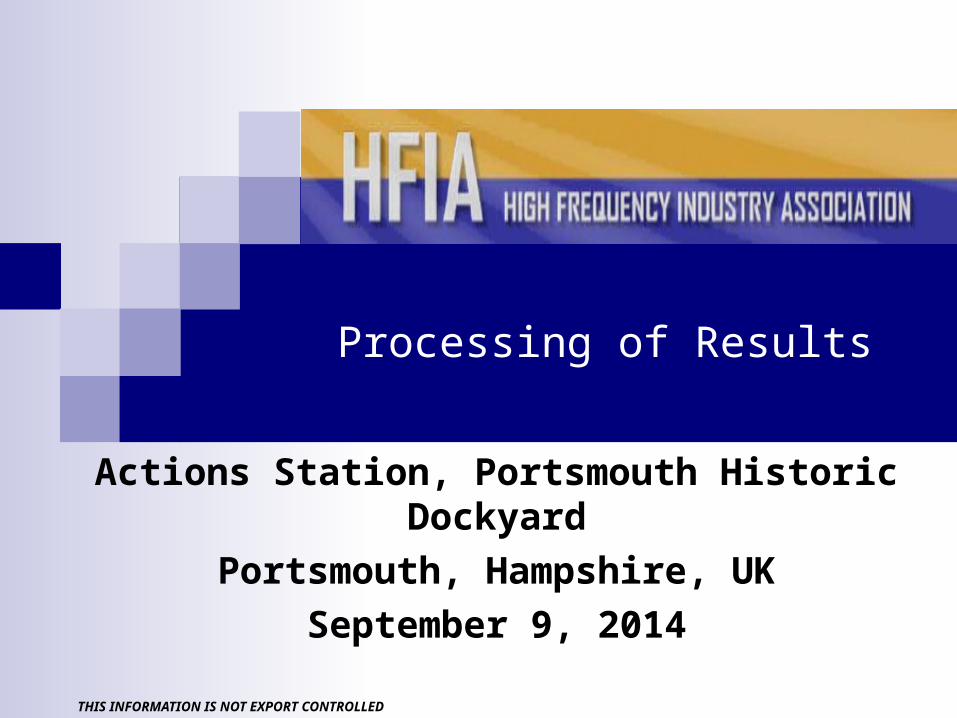
Processing of Results
Actions Station, Portsmouth Historic Dockyard
Portsmouth, Hampshire, UK
September 9, 2014
THIS INFORMATION IS NOT EXPORT CONTROLLED
THIS INFORMATION IS APPROVED FOR RELEASE WITHOUT EXPORT RESTRICTIONS IN ACCORDANCE WITH A REVIEW OF THE INTERNATIONAL TRAFFIC IN ARMS REGULATIONS (ITAR), 22CFR 120-130, AND THE EXPORT ADMINISTRATION REGULATIONS (EAR) 15 CFR 730-774.
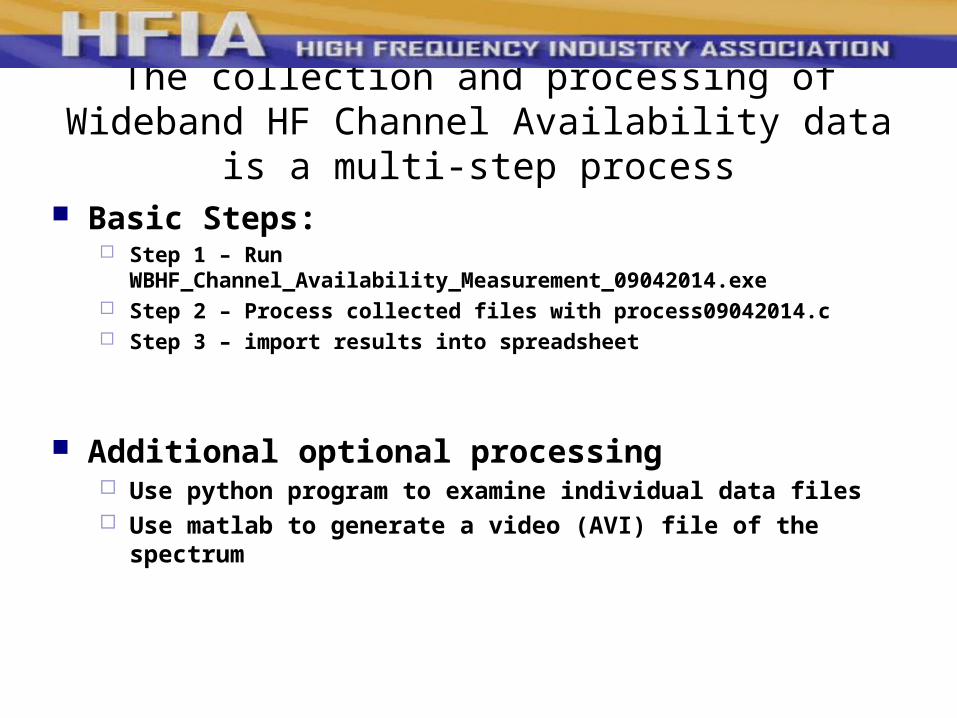
The collection and processing of Wideband HF Channel Availability data is a multi-step process
Basic Steps: Step 1 – Run WBHF_Channel_Availability_Measurement_09042014.exe Step 2 – Process collected files with process09042014.c Step 3 – import results into spreadsheet
Additional optional processing Use python program to examine individual data files Use matlab to generate a video (AVI) file of the spectrum
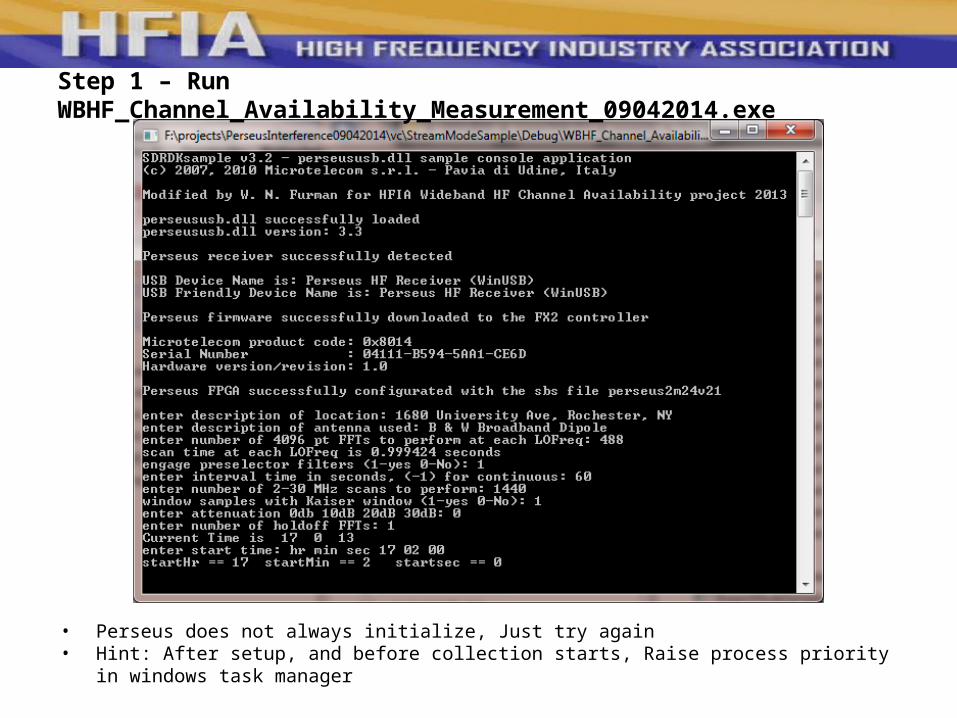
Step 1 – Run WBHF_Channel_Availability_Measurement_09042014.exe
• Perseus does not always initialize, Just try again• Hint: After setup, and before collection starts, Raise process priority in windows task manager
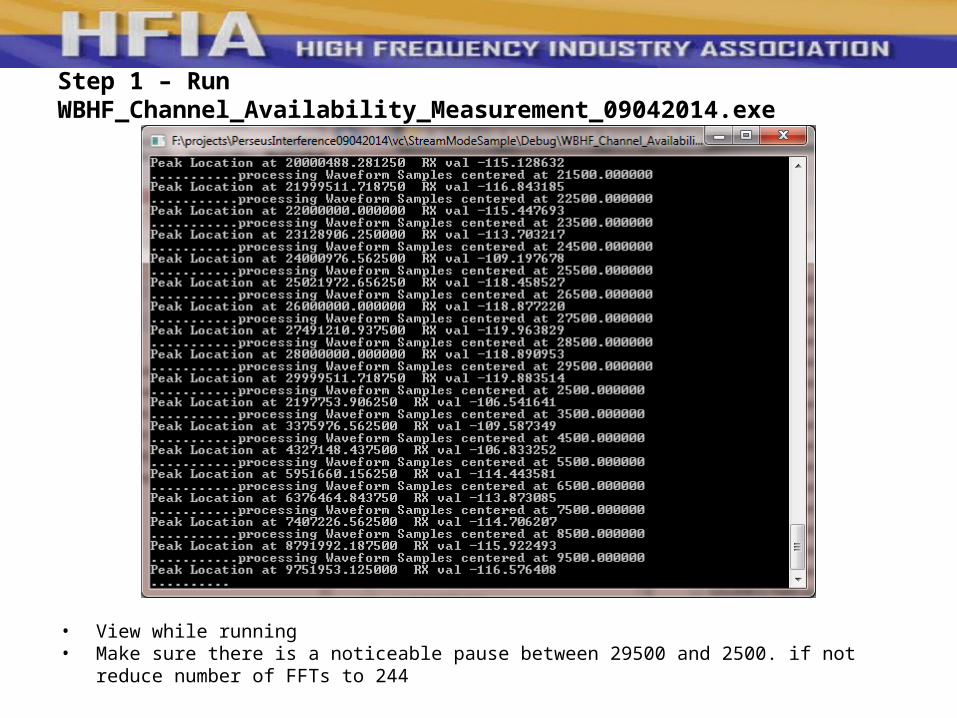
Step 1 – Run WBHF_Channel_Availability_Measurement_09042014.exe
• View while running• Make sure there is a noticeable pause between 29500 and 2500. if not reduce number of FFTs to
244
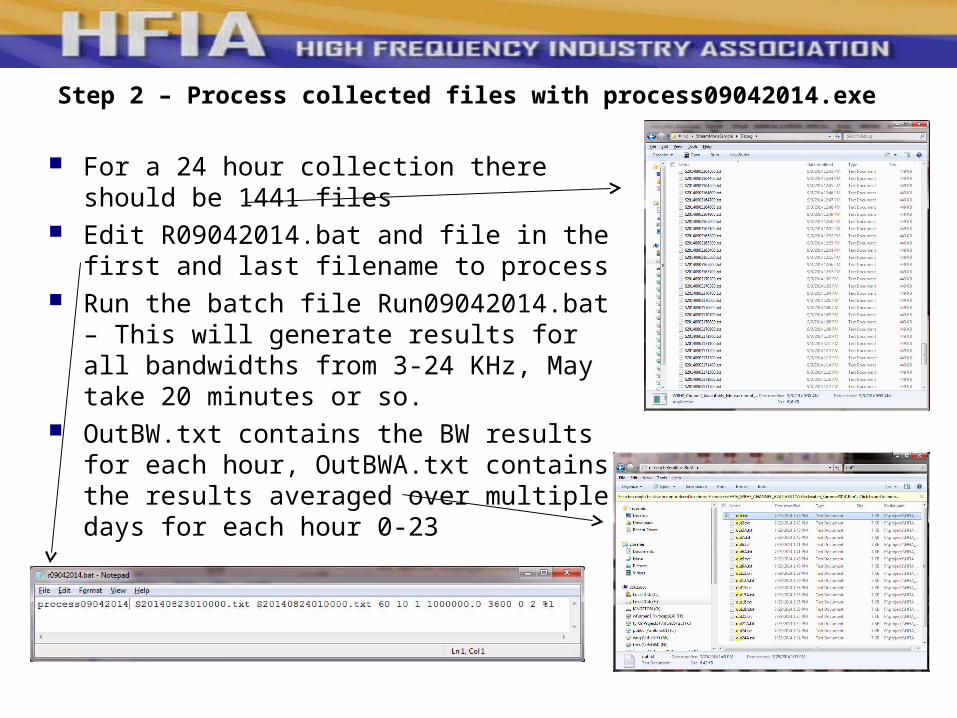
Step 2 – Process collected files with process09042014.exe
For a 24 hour collection there should be 1441 files
Edit R09042014.bat and file in the first and last filename to process
Run the batch file Run09042014.bat – This will generate results for all bandwidths from 3-24 KHz, May take 20 minutes or so.
OutBW.txt contains the BW results for each hour, OutBWA.txt contains the results averaged over multiple days for each hour 0-23
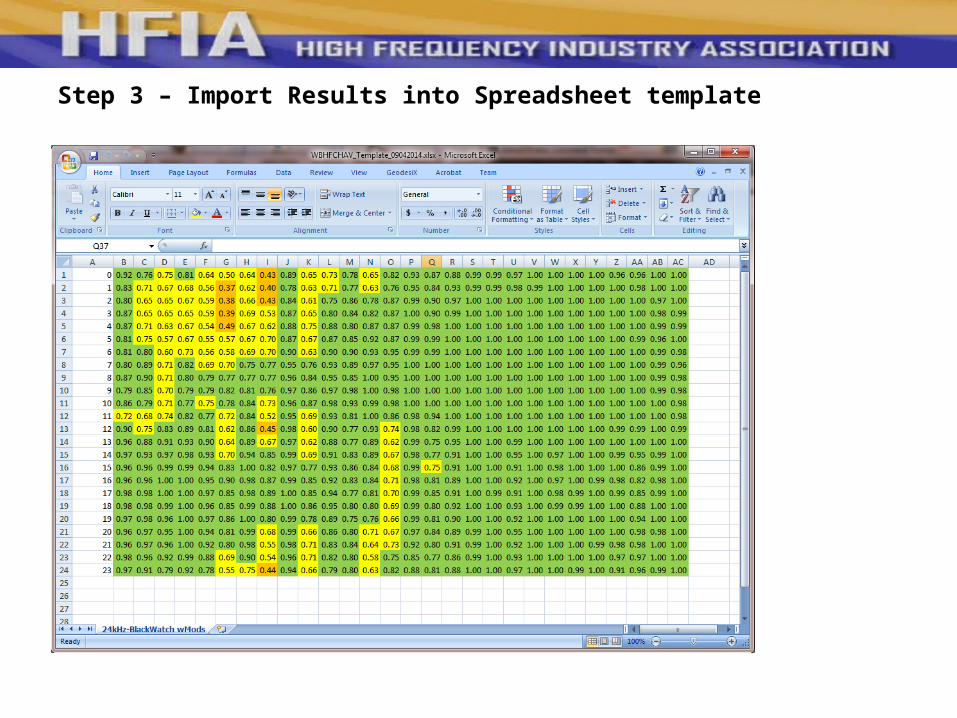
Step 3 – Import Results into Spreadsheet template
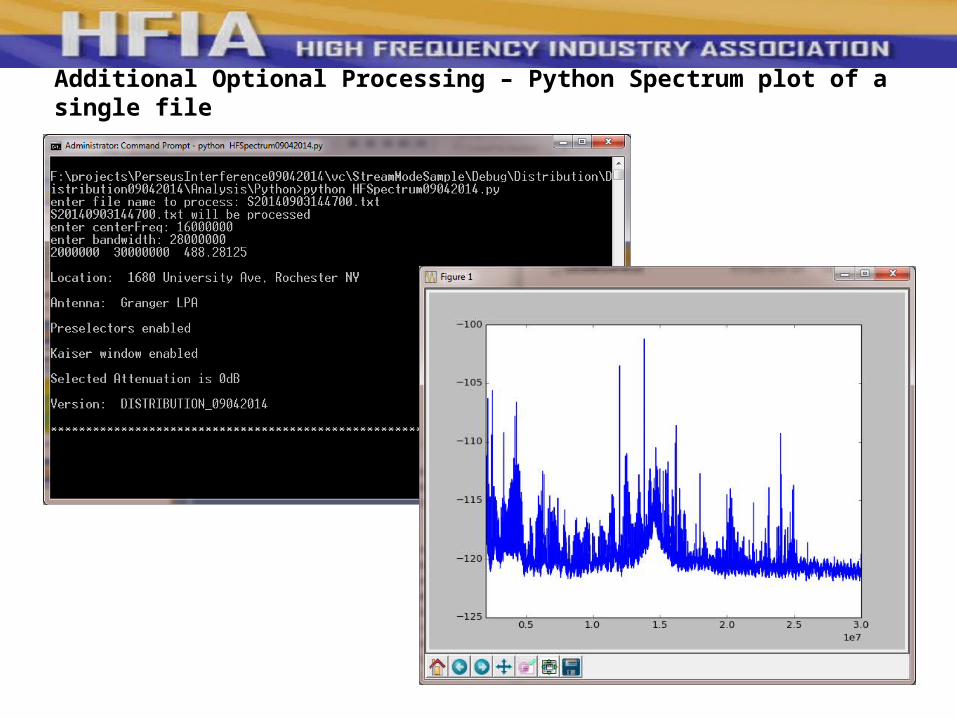
Additional Optional Processing – Python Spectrum plot of a single file
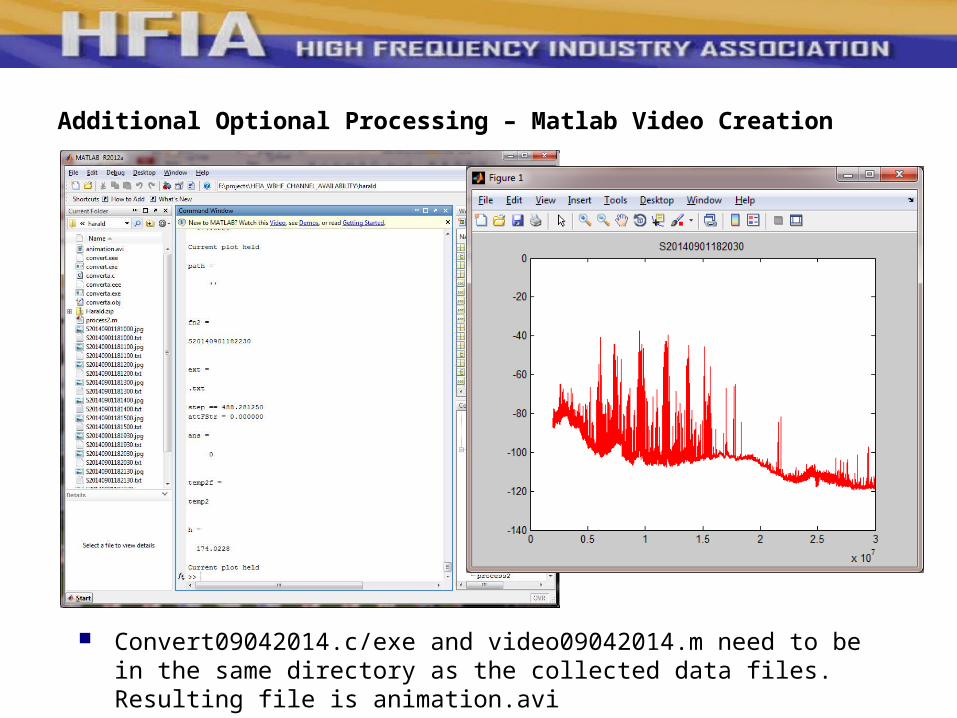
Additional Optional Processing – Matlab Video Creation
Convert09042014.c/exe and video09042014.m need to be in the same directory as the collected data files. Resulting file is animation.avi