Embed Size (px)
Citation preview
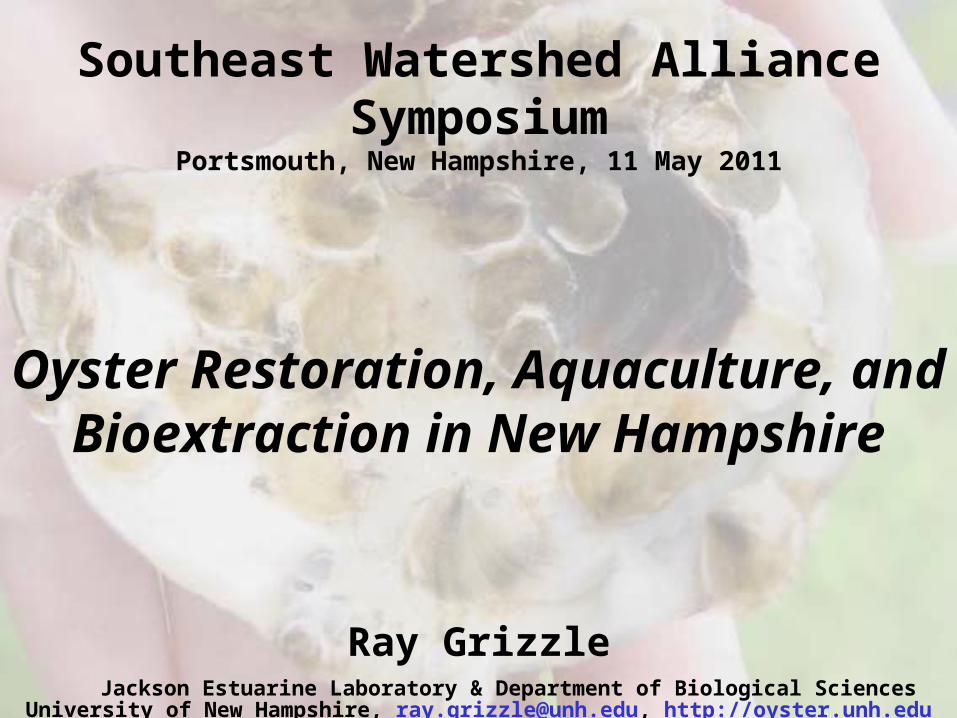
Southeast Watershed Alliance SymposiumPortsmouth, New Hampshire, 11 May 2011
Oyster Restoration, Aquaculture, and Bioextraction in New Hampshire
Ray GrizzleJackson Estuarine Laboratory & Department of Biological Sciences
University of New Hampshire, [email protected], http://oyster.unh.edu

• Status of natural oyster populations
• Restoration of natural reefs
• The aquaculture/restoration connection
• Oyster farming in New Hampshire
• Nitrogen bioextraction by farmed oysters
Presentation Overview
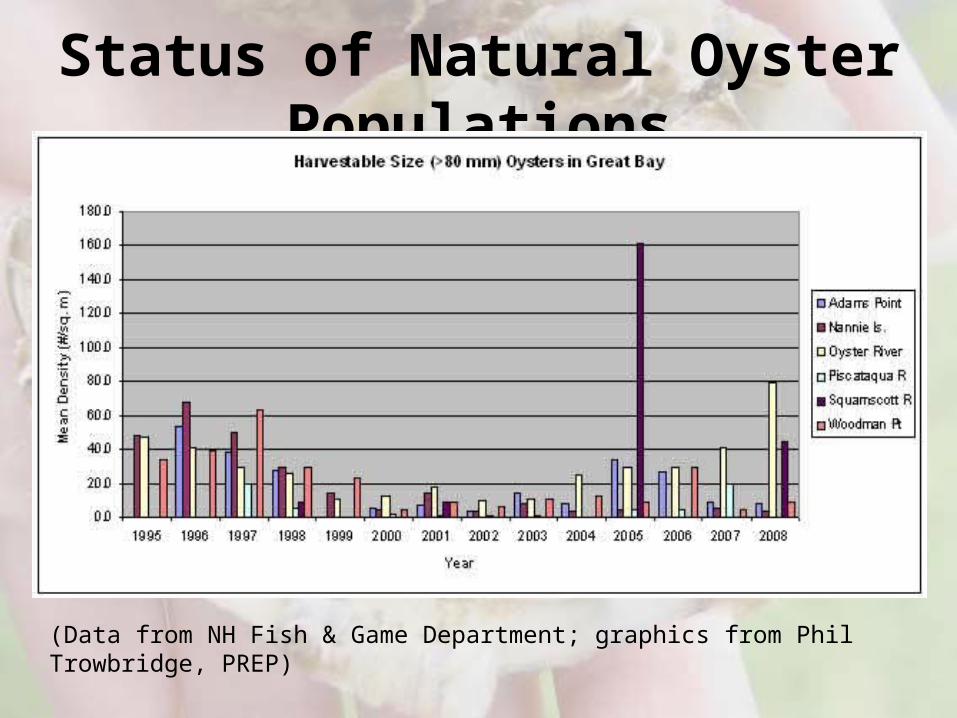
Status of Natural Oyster Populations
(Data from NH Fish & Game Department; graphics from Phil Trowbridge, PREP)

The 2006 Recruitment

General Oyster Reef Restoration Protocol in NH
• Identify restoration site: site survey, consultations with stakeholders, etc. • Design restoration project: shell “planting,” remote setting/spat-on-shell production, nursery grow-out, “spat seeding,”• Secure permits from relevant regulatory agencies• Purchase, arrange for delivery of needed materials: dead mollusc shells, oyster larvae, etc.• Secure contracts with marine construction company, other subcontractors• Do restoration work (if you have time/energy/$ left)…
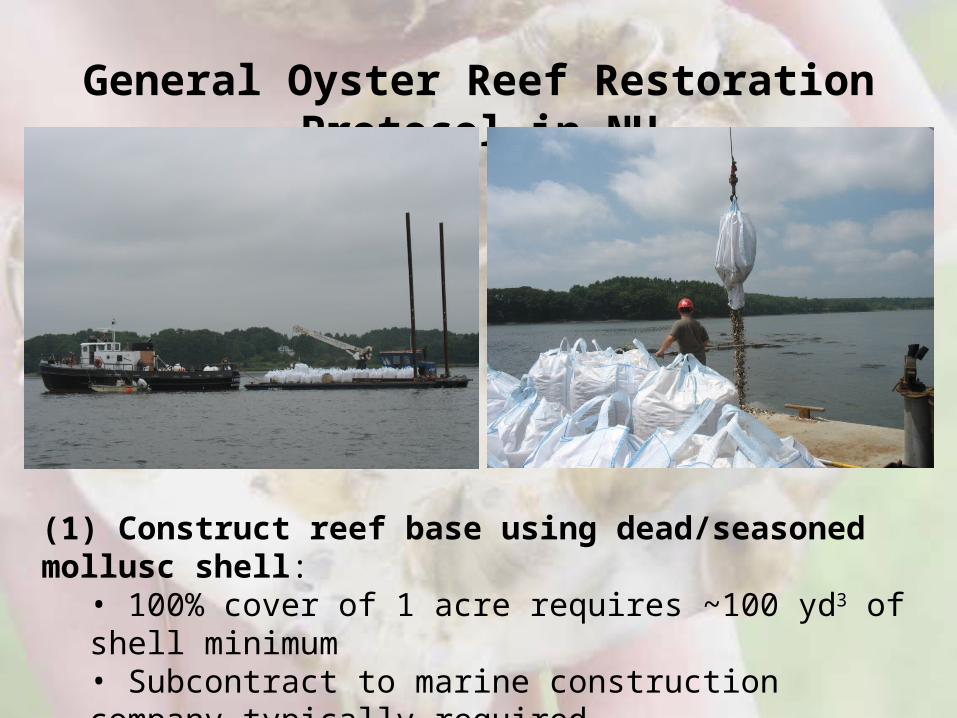
General Oyster Reef Restoration Protocol in NH
(1) Construct reef base using dead/seasoned mollusc shell:• 100% cover of 1 acre requires ~100 yd3 of shell minimum• Subcontract to marine construction company typically required• General method shown above

General Oyster Reef Restoration Protocol in NH
(2) “Seed” reef base with spat-on-shell from remote setting of oyster larvae

Summary of NH Oyster Restoration Projects
Restoration Site, Size Restoration Methods Species InvolvedConstruction
Date Success Metrics
Last Observation
Date General Condition at Last Sampling
Salmon Falls River, 0.1 acre adult transfer, spat-on-shell Crassostrea virginica 2000shellfish density & size;
water filtration 2007high oyster density from 2006 natural
spat set
South Mill Pond, 0.05 acre adult transfer, spat-on-shellCrassostrea virginica;
Mytilus edulis 2001shellfish density & size;
water filtration 2007 ~100% mortality of mussels and oyster
Adams Point (Great Bay), 0.05 acre gravel base, spat-on-shell Crassostrea virginica 2003 shellfish density & size 2006
heavy silt accumulation; ~100% oyster mortality
Nannie Island (Great Bay), 2.5 acres gravel base, spat-on-shell Crassostrea virginica 2004 shellfish density & size 2006
high oyster density from 2006 natural spat set
Bellamy River, 1.55 acres adult transfer, spat-on-shellCrassostrea virginica;
Mytilus edulis 2005 - 2007 shellfish density & size 2008moderate oyster density from 2006 natural
spat set; 100% mussel mortality
Nannie Island (Great Bay), 1.5 acres spat-on-shell Crassostrea virginica 2007
shellfish density & size; resident plants and
animals 2009~80% spat mortality; high density from 2006
natural spat set
Oyster River (TNC), 0.2 acre shell planting, spat-on-shell Crassostrea virginica 2009 shellfish density & size 2009 substantial 2009 natural spat set
Berry's Brook, 1.0 acre shell planting, spat-on-shell Crassostrea virginica 2009
shellfish density & size; water filtration;
associated animals 2009 high spat mortality
Oyster River (TNC), 1.0 acre shell planting, spat-on-shell Crassostrea virginica 2010 shellfish density & size 2010 (early post-construction obersations only)
Oyster River (NRCS/GSS), 1.0 acre shell planting, spat-on-shell Crassostrea virginica 2010 shellfish density & size 2010 (early post-construction obersations only)
Little Bay (NRCS/LBOC), 1.0 acre shell planting, spat-on-shell Crassostrea virginica 2010 shellfish density & size 2010 (early post-construction obersations only)

HISTORIC Funding Sources for Oyster Restoration
• Piscataqua Region Estuaries Partnership • US Environmental Protection Agency• National Oceanic & Atmospheric Admin.• Cooperative Institute for Coastal and Estuarine
Environmental Technology• National Estuarine Research Reserve System• New Hampshire Sea Grant• The Nature Conservancy• City of Dover• Natural Resources Conservation ServiceNatural Resources Conservation Service

The Aquaculture/Restoration Connection
• Rationale: oyster farmers know how to raise oysters…
• USDA/NRCS funded restoration of 3 acres of bottom area in NH in 2010; a 0.5-acre project is scheduled for 2011
• The future?

Existing Oyster Farms in New Hampshire

• Secure maps or data needed to produce maps• Produce maps of major factors affecting shellfish farming• Interview stakeholders• Assess all relevant environmental information in context of social factors
• Assist prospective farmers• Interface with regulatory and management agencies
Determining the Potential for Expansion of Oyster Aquaculture in New
Hampshire

Mapping the Major Factors
Maximum PSP toxicity values in estuary Bathymetry, eelgrass, shellfish closures

Interpreting the Maps
• Map overlay method assesses multiple factors
• Potential aquaculture areas = adequate depth + open for harvesting + no eelgrass (+ or - other factors)

Nitrogen bioextraction by farmed oysters
•Two age/size classes (0 year, 1 year) deployed at 6 sites
•Deployed off-bottom in oyster bags typical for NE
•Variables: shell height, soft tissue DW, %N, %C
•CHN/O elemental analyzer (USEPA, Narragansett, RI)
•ANOVAs on dependent variables

Results

Results Soft Tissue Shell Whole Oyster
Shell Height (mm)
Shell DW (g)
Soft Tissue DW (g) %C %N %C %N Total C (g) Total N (g) Source
7.8 n/d 0.03 32.1 7.71 n/d n/d n/d n/d Present study
12.7 n/d 0.20 37.6 9.10 n/d n/d n/d n/d Present study
35.7 n/d 0.06 27.6 6.52 n/d n/d 0.585* 0.013* Present study
55.6 n/d 0.24 32.9 7.86 n/d n/d 3.082* 0.065* Present study
76 150 1 n/d 7 n/d 0.3 n/d 0.52 Newell et al. 2005
43.6 4.8 0.20 43.30 8.15 11.8 0.18 0.647 0.025 Higgins et al. 2011
64.8 24.3 0.80 44.30 8.06 12.4 0.19 3.391 0.112 Higgins et al. 2011
85.5 37.6 1.58 45.10 7.28 12.4 0.17 5.375 0.176 Higgins et al. 2011
117.8 71.9 3.00 46.20 7.37 12 0.26 10.011 0.394 Higgins et al. 2011

Some ‘what/if’ Scenarios
Today:• 10 acres, 200,000 oysters/ac/yr, 0.3 g N/oyster:
0.67 ton N
The Future?:• 50 acres 3.4 tons N/yr
• 100 acres 6.8 tons N/yr

What factors are involved in estimating the nitrogen bioextraction potential for farmed oysters in NH?
Present: • Three farms, <100,000 oysters sold in 2010
Future: • How many farms can be permitted in NH?• What is maximum farm production?• How do we accurately quantify bioextraction?• What role(s) should oyster farming play?

Next Steps
2011/2012 USEPA-funded study• 1-yr deployment, multiple sites, etc.
2012 Completion of NOAA/NMFS-funded study• Assessment of shellfish aquaculture expansion potential
Ongoing management/regulatory process• ?????