Embed Size (px)
Citation preview
PROCESS DATA ANALYTICS IN THE ERA OF BIG DATA
S. Joe Qin1
The Chinese University of Hong Kong, Shenzhen
2001 Longxiang Blvd., Longgang, Shenzhen, 518172, China
1On leave from The Mork Family Department of Chemical Engineering and Materials Science
University of Southern California, Los Angeles, CA 90089 USA
Email: [email protected]
1. Introduction
For engineering systems where processes, units, and equipment are designed with clear objectives and
usually operated under well-controlled circumstances as designed, mechanistic models and first principles
are dependable. However, for emerging circumstances that are not factored in the design, data become
indispensable assets for the decision-making in safe and efficient operations. In this perspective paper we
offer a brief introduction to the essence of big data, how data have been effectively used in process
operations and control, and new perspectives on how chemical process systems might evolve to a new
paradigm of data-enhanced operations and control. The discussed perspectives include i) mining of time
series data with expanded depth in history and breadth in location for event discovery, decision-making,
and causality analysis; ii) exploring the power of new machine learning techniques that have enjoyed
tremendous development in nearly two decades; and iii) anticipating a system architecture shift towards a
data-friendly information system to complement the current distributed control systems (DCS)-centric
information system. In addition, high level systems engineering tasks such as planning and scheduling
(Grossmann, 2012) can also benefit from information extracted from big data, since optimization as well
as control has always relied on the interplay between models and data. We note that “big data” is not the
answer to everything, but historical and real-time data are valuable for safe and efficient operations,
especially for abnormal process behaviors or circumstances that are not considered in the design phase.
2. The Roles of Data in Science and Engineering
With the recent development of the internet, internet of things, smart and wireless sensors, wireless
communications, mobile devices, smart devices, e-commerce, and smart manufacturing (Davis et al.,
2012), the amount of data collected and stored has grown exponentially, analogous to the Moore’s law in
the increase of solid state transistor density. The explosion of data size has made all sectors including
engineering, medicine, business, commerce, finance, and even science to endorse the concept and power
of big data. Take bioinformatics and genomes for example. The Human Genome Project as an
international effort to sequence the entire human genome aimed to uncover the sequence of 3 billion base
pairs of the haploid human genome (Collins et al., 2003; Bickel et al., 2009). Recently, BGI Institute of
China launched the 3-Million Genomes Project (BGI, 2013), which includes a Million Plant and Animal
Genomes, a Million Human Genomes, and a Million Micro-ecosystem Genomes. The goal of this project
is to establish the baseline for specific populations and connect the phenotypes of diseases and traits to
Perspective AIChE JournalDOI 10.1002/aic.14523
This article has been accepted for publication and undergone full peer review but has not beenthrough the copyediting, typesetting, pagination and proofreading process which may lead todifferences between this version and the Version of Record. Please cite this article asdoi: 10.1002/aic.14523© 2014 American Institute of Chemical Engineers (AIChE)
2
genetic variations to understand the disease mechanism. The massive amount of information-packed data,
while promised to lead to new scientific discoveries in this field, produces a pressing need for effective
analytics by combining biological and information sciences (Waterman, 1995; Bickel, 2009).
The available massive amount of data has prompted many disciplines and industries to reexamine their
traditional roles and views, such as statistics, management science, econometrics, computer science, and
engineering. As a result, a new discipline known as data science or informatics is forming to derive
knowledge and information from massive data. Several examples have shown that the possession of huge
amount of data has tremendous advantage when combined with effective analytics and superior
computing power to distill the data into knowledge. The Google’s flu prediction is such an example
(Ginsberg et al., 2009), which could predict the spread of the winter flu outbreak in 2009 in the United
States and down to the states level. Google took 50 million most common searches and compared them to
the Center for Disease Control (CDC) data on the spread of winter flu from 2003 to 2008. Google’s data
processing power screened through 150 million models to discover 45 features with a mathematical
model that had high correlation to the data from CDC. In addition, Google could predict nearly in real
time, while CDC’s data took weeks to compile. While this data analytic approach is entirely new to
chemical engineers, the functionality of the models is known as inferential sensors and practiced in
process systems engineering (Tham, 1991; Qin and McAvoy, 1992).
Needless to say, the relevance of big data to science, engineering, and commerce seems to be higher than
one might think. The bestseller monograph by Mayer-Schönberger and Cukier (2013) gives an account of
the technology for the general public. It is argued that by collecting a complete set of data rather than a
sample, we can now analyze the data set in its entirety. Data analytics in the big data era will shift from
statistical sampling and inference to the focus on “N=all”.
3. Big Data and Analytics
Big data is arguably a major focus of the next round of information technology transformation in industry.
According to research by McKinsey Global Institute (MGI) and McKinsey's Business Technology Office,
analyzing large data sets will become a key basis of competitiveness, productivity growth, and
innovations (Manyika et al., 2011), which depicts five ways of using big data to create values.
Unlock significant value by making information transparent and usable.
Collect more accurate and detailed performance information, and therefore, expose variability
and boost performance.
Precisely tailored products or services.
Sophisticated analytics can substantially improve decision-making.
Finally, big data can improve the development of the next generation of products and services.
For instance, manufacturers are using data obtained from sensors embedded in products to create
innovative after-sales service offerings, such as proactive maintenance.
Big data refers to the size and variety of data sets that challenge the ability of traditional software tools to
capture, store, manage, and analyze. Increasingly massive data are gathered by equipment and process
sensors, mobile and wireless devices, software logs, cameras, microphones, and wireless sensor networks.
Often three V’s are used to characterize the essence of big data (Manyika et al., 2011).
Volume: Enterprises have ever-growing data of all types, easily amassing terabytes, even
petabytes. For example, converting 350 billion annual meter readings to better predict
consumption.
3
Velocity: For time-sensitive processes such as catching frauds, big data must be used as it
streams into the enterprise.
Variety: Big data is composed of all types of data – structured and unstructured data such as text,
sensor data, audio, video, log files and so on.
In addition to these basic characteristics, some have included Value and Veracity as additional "V"s for
big data. Establishing trust in big data and conclusions based on them presents a challenge, which makes
statistical learning theory an indispensable framework that brings science into the big data picture
(National Research Council, 2013).
Both governments and private sectors make serious effort to embrace the opportunities in big data. In
2012, the U.S. President Obama announced the Big Data Research and Development Initiative which
explored how big data could be used to address important problems facing the government. China
considers big data, internet of things, cloud computing, and smart cities as key technologies for the leap
forward in the process of industrialization, digitalization, and urbanization. Traditional retail giant,
Walmart, handles more than one million customer transactions every hour, which is imported into
databases that contain more than 2.5 petabytes of data, while e-commerce leaders like Amazon build their
processes around data and derive significant market information from them.
It is interesting to note that the thrust of interest in big data does not only come from large information
technology companies like Google, IBM, and Microsoft, it also comes from traditional companies such as
GE and P&G. In 2011, GE announced a $1 billion investment to build software and expertise for GE’s
version of big data analytics (TATA Consultancy Services, 2013). Its objective is to build a global
software center to power up data science capabilities in GE’s ‘Industrial Internet’. The list goes on from
search engines (Google, Microsoft) and social networks (Twitter, Facebook, LinkedIn) to financial
institutions, the health care industry, engineering companies, retail analytics, mobile analytics, marketing
agencies, data science vendors (e.g., Teradata, SAS, SPSS), utilities and government. The opportunity for
the process systems engineering (Stephanopoulos and Reklaitis, 2011) is how to integrate engineering,
design, operation, and customer data to improve process operation, efficiency, product quality, and
customer satisfaction with individualized specifications.
4. Massive and Diverse Multivariate Process Data
Manufacturing process operation databases are massive due to the use of process operation and control
computers and information systems. The diversity of process measurement technology from conventional
process sensors to images, videos and indirect measurement technologies has compounded the variety,
volume, and complexity of process data. Multi-level and multi-scale data in semiconductor
manufacturing, for example, provides at least the following levels of massive data.
Equipment level process measurement data
Process level metrology data
Add-on indirect quality measurement data
In-process wafer electrical property test data
Final wafer electrical property test data
It is typical in a modern FAB that over 50,000 statistical process control charts are monitored to control
the quality of over 300 manufacturing steps in fabricating the chip (Qin et al., 2006). A recent AIChE
perspective paper (Venkatasubramanian, 2009) characterizes the massiveness as drowning in data.
Although process operations are rich in data, without effective analytical tools and efficient computing
technology to derive information from data, it is often the case that data are compressed and archived for
record keeping and only retrieved for use in emergency analysis after the fact, rather than routine use in
4
the decision-making process. Short-term archiving is typically adopted as the values from rare use of the
historical data do not justify the expense of added hardware storage capacity. This current state in the
chemical manufacturing industry is in sharp contrast against new data giants such as Amazon, Google,
and E-Bay, who archive everything as they consider data as assets.
Process operations are of tiered and hierarchical objectives, making process data more or less structured
rather than unstructured as those derived from social networks. In fact, the vast amount of informative
data is collected in the form of time series with regular sampling periods and usually well-defined
purposes to measure them. Some analytical and monitoring tools such as multivariate statistics and neural
networks have been adopted by chemical manufacturers with varying degrees of success. These
techniques often achieve detection and root-cause diagnosis of quality related operational faults, sooner
than the actual product quality control and customer feedback. In other cases they detect process
degradation or changes that could lead to more serious process failure or unsafe incidents. Process
operations benefit from statistical and data-driven methods due to:
Complexity of process operations with multiple grades and varying raw materials
Control complexity with multi-level objectives
Rich instrumentation and control feedback
Rich process data collection and archiving
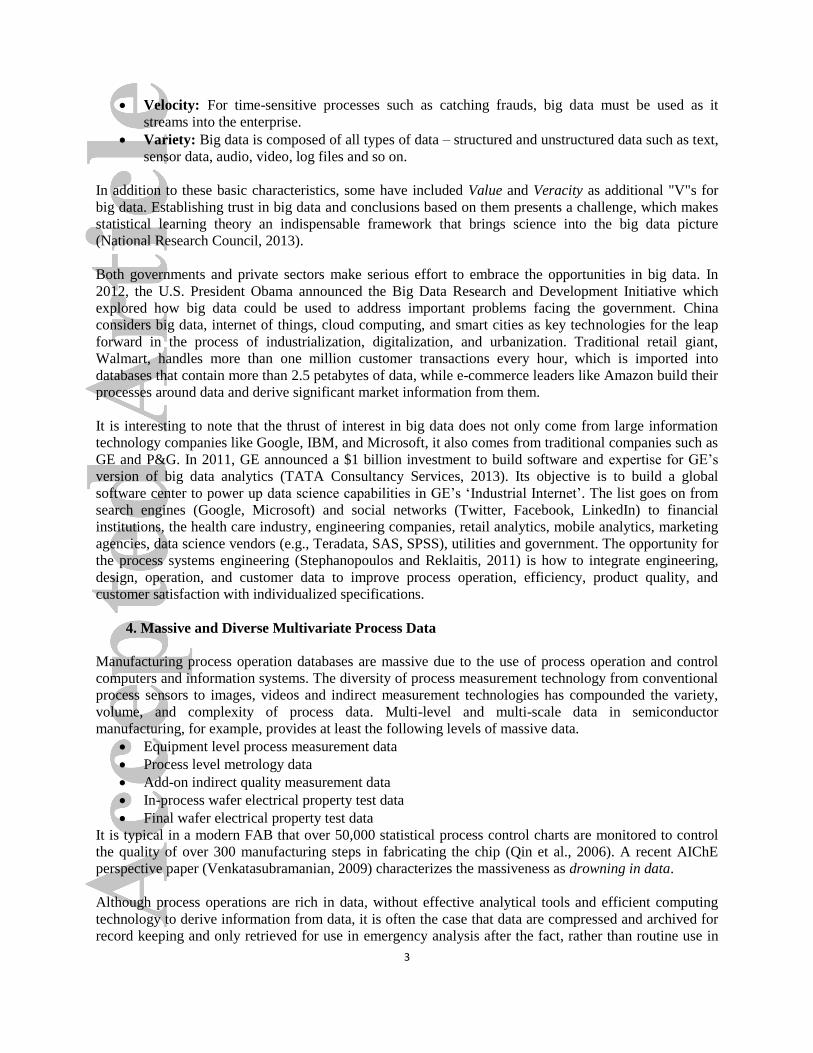
The process and data considered for the data-driven fault detection and diagnosis are illustrated in Figure
1, where the hierarchical data structure is shown. At the bottom level are the equipment sensor
measurements that can be in milli-seconds. At the process level are regularly sampled process control data.
The product quality measurements come in all forms and often irregularly sampled. The top level is the
customer feedback data that can go from customer service channels to social network complaints.
Compared to the expense and effort of rigorous process modeling, the advantages of the data driven latent
structure modeling methods, such a principal component analysis (PCA) and projection to latent
structures (PLS), are obvious; they can be used to detect abnormal changes in process operations from
real-time data due to the dimension-reduction capability, ease of visualization, and ease of real
applications. The related fault diagnosis methods have been intensively studied and applied successfully
in many industrial processes, e.g. chemicals, iron and steel, polymers, and semiconductor manufacturing.
Sub
Process
Quality
Metrics
Disturbances
PID
Controller
PLS
Sub
Process
Unsupervised
Latent Structure
Modeling
Process data
PCA、ICA
Operation Data
Equipment Data
Supervised
Latent
Structure
Modeling
Feature extraction of
equipment (production
facility, actuator, etc)
Sensors
Process Data
Customer Data
Process data
Figure 1. Process data hierarchy.
5
Process data are often categorized into process input and output data, quality output data, and indirect
(e.g., vibration signals and images) types of data, as shown in Figure 1. The typical procedure of the
current multivariate process data analytics is
Collection of (very clean) normal data with good coverage of the operating regions
Fault data cases can be useful, but not required
Latent variable methods (PCA, PLS, etc.) to model the data (Geladi and Kowalski, 1986)
Fault detection indices and control limits
Fault diagnosis and troubleshooting
While multivariate statistical approaches are the favorite choice in recent two decades, it should be noted
that data have been an integral part of process engineering solutions since the time models have been used
for process optimization and control. Data reconciliation (Mah et al, 1976) has been a necessary function
to deploy real time optimization using real time data. Neural networks for inferential property modeling
(Tham, 1991; Qin and McAvoy, 1992) are routinely used in industry now. Time series trend analysis
(Bakshi and Stephanopoulos, 1994) was proposed to obtain real-time patterns from operating data for
diagnosis and control. System identification and time series modeling is a necessary tool to apply model
based control and control performance assessment. The Kalman filter (Kalman, 1960; Gibbs, 2011)
developed half a century ago provides an elegant framework to make a balanced use of both data and a
mechanistic model. At the higher level of production planning and scheduling, industry has accounted for
the typical uncertainty in, e.g., product demand and price, using time series analysis and data mining
(Klatt and Marquardt, 2009).
However, these aforementioned data analytics and practice in process systems engineering have
apparently not connected to the recent development in machine learning, data mining, and big data
analytics. They differ not only in terms of sizes, but also in how and what data should be used in solving
real operation problems. In some ways the process systems engineering solutions are confined to one set
of principles that are believed to be sound, while the machine learning and data mining communities take
the other way and achieve unexpected results and solutions that defy the conventional wisdom. For
example,
While the multivariate data analytics tend to require a set of carefully collected clean data or pre-
treat outliers and missing values (Nelson et al., 1996), the data mining and machine learning
communities develop robust methods that use imperfect data as the norm rather than the
exception.
While neural networks are used for inferential modeling with a minimalist representation with as
few layers and parameters as possible, deep learning techniques (Hinton and Salakhutdinov,
2006; Bengio et al., 2007) outperform all the alternatives by using many layers or being ‘greedy’.
While the time series trend analysis (Bakshi and Stephanopoulos, 1994) from operating data are
only one of few papers published in the process systems engineering with little attention in many
years, the time series data mining community developed a whole set of techniques that are
essentially trend analysis (Keogh and Kasetty, 2002; Fu, 2011).
While most research work in process systems engineering focuses on having a clean matrix of
data with great regularity, leaving irregularly and indirectly measured data largely unused, other
industries extract valuable information from highly unstructured data (Ginsberg et al., 2009).
These gaps motivate the author to provide several perspectives in the remainder of the paper so as to
inspire new ideas to enrich the process data analytics methodologies in the era of big data. The discussed
perspectives include: i) to increase variety, analyzing heterogeneous sources of data during process
operations and after products are made; ii) to increase volume, mining of massive historical time series
data for event discovery, decision-making, and causality analysis; iii) to improve value and veracity,
embracing the power of new machine learning techniques developed in nearly 20 years; and iv) to
6
improve velocity, a potential shift in system architecture towards a data-friendly information system to
complement the current control-centric system.
5. For Variety: Multi-level Heterogeneous Data Analytics
Process data analytics for process monitoring should have the following desirable features:
Scalable (up to 100,000 variables)
Making use of all kinds of data, e.g., process, spectra, vibration, and image (Yu and MacGregor,
2003)
Relatively easy to apply to real processes comparing to other methods
Online use for real-time operations and decision making
Offline troubleshooting as a valuable tool for continuous improvement
To make use of all kinds of data from historical and real-time process operations, one obvious direction
for process systems engineering to embrace the new techniques in big data is to increase the diversity of
data to be used in the analysis. Principal component analysis has been a favorite tool for process analysis
(Kourti and MacGregor, 1995), but it is only capable of analyzing data from a single level, i.e., all
variables are considered of the same importance to explore cross-correlations or auto-associations. The
machine learning literature considers the PCA type of models single-layer modules (Bengio et al., 2013).
A recent survey in Qin (2012) as well as the references therein gives an account of the available process
data analytics and applications in process and quality monitoring. Projection to latent structures (PLS)
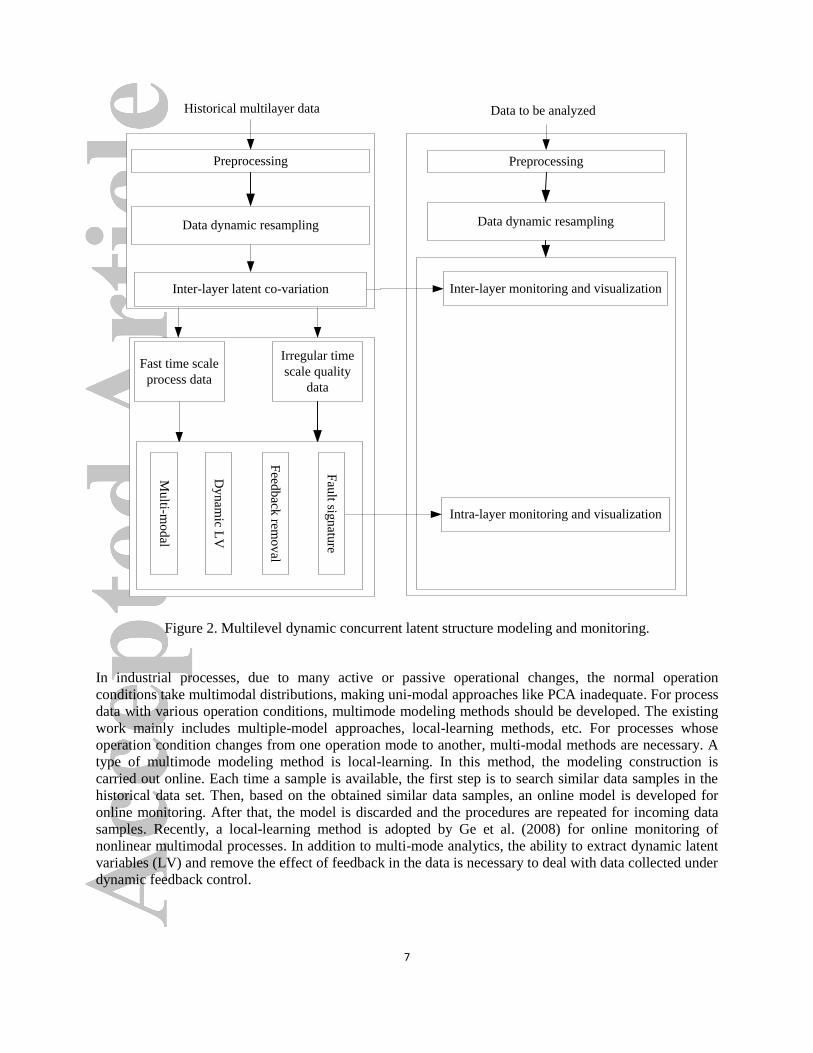
offers one option to explore multi-level data correlation and intra-level variations. Figure 2 depicts a
scheme for a two-level dynamic concurrent latent structure modeling and monitoring. Data from tiered
operation objectives can be pre-processed and resampled to align features for latent structure modeling.
The inter-level analysis and intra-level analysis in the concurrent PLS in Qin and Zheng (2013) explain
variations not only for the output level, but also within the input level. The tiered analytic objectives are
found in the semi-supervised scheme of machine learning, defined in Bengio et al. (2013) as follows.
Semi-supervised learning: with inputs X and target Y to predict, a subset of the factors explaining
X’s distribution explain much of Y, given X.
7
Preprocessing Preprocessing
Historical multilayer data Data to be analyzed
Inter-layer latent co-variation
Data dynamic resampling
Fast time scale
process data
Irregular time
scale quality
data
Multi-m
odal
Data dynamic resampling
Inter-layer monitoring and visualization
Intra-layer monitoring and visualization
Dynam
ic LV
Feed
back
removal
Fau
lt signatu
re
Figure 2. Multilevel dynamic concurrent latent structure modeling and monitoring.
In industrial processes, due to many active or passive operational changes, the normal operation
conditions take multimodal distributions, making uni-modal approaches like PCA inadequate. For process
data with various operation conditions, multimode modeling methods should be developed. The existing
work mainly includes multiple-model approaches, local-learning methods, etc. For processes whose
operation condition changes from one operation mode to another, multi-modal methods are necessary. A
type of multimode modeling method is local-learning. In this method, the modeling construction is
carried out online. Each time a sample is available, the first step is to search similar data samples in the
historical data set. Then, based on the obtained similar data samples, an online model is developed for
online monitoring. After that, the model is discarded and the procedures are repeated for incoming data
samples. Recently, a local-learning method is adopted by Ge et al. (2008) for online monitoring of
nonlinear multimodal processes. In addition to multi-mode analytics, the ability to extract dynamic latent
variables (LV) and remove the effect of feedback in the data is necessary to deal with data collected under
dynamic feedback control.
8
6. For Volume: Time Series Data Representation
Existing process data analytics usually focus on well-defined data samples for carefully selected variables
that bear the same conditions as the current process operation. There is virtually no effort in pooling
together data from a diverse source of measurements, years of historical operations and from globally
distributed plants that make the same products. Until these are explored, traditional process data analytics
dwarfs itself compared to the big data practice happening in other industrial sectors (Ginsberg et al.,
2009). The capability of big data analytics has the potential to knock down these somewhat artificial
barriers to really enrich the volume and representativeness of the data. While the traditional data analysis
tools emphasize on the cleanness of the data to avoid potential misleading conclusions, the big data
analytics considers data errors or messiness as unavoidable, but uses massive data to develop models and
extract features that are robust to the imperfection in the data.
Even as data are pooled across spatial-temporal sources, the majority of process data are of time series
forms with regular sampling periods. This characteristic makes it appropriate to apply time series data
mining and representation methods that have been studied extensively in other areas (Fu, 2011). The
various tasks in time series data mining research include:
Indexing (Query by Content): Given a query time series, and some similarity/dissimilarity
measure, find the nearest matching time series in database.
Clustering: Find natural groupings of the time series in database under some
similarity/dissimilarity measure.
Classification: Given an unlabeled time series, assign it to one of two or more predefined classes.
Segmentation: Given a time series containing plenty of datapoints, construct a model with smaller
piecewise segments such that the latter closely approximates the former. This representation
makes the storage, transmission and computation of the data more efficient. Specifically, in the
context of data mining, piecewise linear representation (PLR) has been used.
Dynamic Time Warping: Measure the distance between two time series after first aligning them
in the time axis.
The segmentation may simply be performed to create a simpler representation of the time series that
supports indexing, clustering and classification (Keogh and Kasetty, 2002; Fu, 2011). It should be noted
that the segmentation of time series is similar to the trend analysis technique explored in Bakshi and
Stephanopoulos (1994) very early in process systems engineering. Pattern matching for disturbance
mining is studied in Singhal and Seborg (2006). It is unfortunate that these efforts have not brought
enough attention in process systems engineering, although a dynamic PCA approach (Ku et al., 1995) was
used for the limited categories of disturbances simulated using the Tennessee Eastman Challenge problem.
The recent work in Sun et al. (2013) explores the use of historical time series data to assess the
disturbance model adequacy and model prediction accuracy in a model predictive control context.
With time series historical data, another important analytic tool is the Granger causality analysis (Granger
1988). Due to its simplicity, interpretability, and ease of implementation, Granger causality has found
wide applications in economics. Recently Granger causality has gained great attention in many other
areas to extract useful information and inner causal relationships, including the identification of root-
causes of important process features such as the root cause of plant-wide oscillations (Yuan and Qin,
2014). The Granger causality builds a straightforward connection between causality and prediction and
employs a statistical hypothesis test to determine whether one time series is helpful in forecasting another.
7. For Value and Veracity: Statistical Machine Learning
9
Machine learning and artificial neural networks have gone through several ups and downs since their
inception. Initially showed promise to make machines learn from data in the sixties, machine learning saw
its downturn in the seventies until it caught a new resurgence in the mid-eighties. This time the process
systems researchers and practitioners joined the effort in applying them to chemical engineering problems
(Hoskins and Himmelblau, 1988; Ydstie, 1990; Tham, 1991). After the limitations and benefits of
artificial neural networks were debated and explored, the whole domain of machine learning techniques
boiled down to the adoption of multilayer feedforward networks for use as inferential sensors for
chemical processes. This more or less wrapped up the process systems engineering’s interest in machine
learning and neural networks. In the meantime, the machine learning community also ran into its own
bottleneck in searching for new ideas.
The golden period for statistical machine learning is between 1996 and 2006 with the development of
support vector machines (SVM) proposed by Vapnik (1999), and the Boosting and kernel methods
discussed by Freund and Schapire (1996). Statistical machine learning becomes a major branch in
computer science and artificial intelligence (National Research Council, 2013; Boyd et al., 2011).
Recently, Judea Pearl won the Turing Award in 2011
http://amturing.acm.org/award_winners/pearl_2658896.cfm for fundamental contributions to artificial
intelligence through the development of a calculus for probabilistic and causal reasoning.
Statistical machine learning is considered to bridge computation and statistics, with ties to information
theory, signal processing, algorithms, control theory and optimization theory (National Research Council,
2013). Effective techniques developed in this area include boosting and SVMs, kernel principal
component analysis (KPCA), and multidimensional scaling (MDS). In addition, the work of Hinton and
Salakhutdinov (2006) published in Science is focused on deep learning. The recent statistical machine
learning development possesses three attractive features: i) it is focused on its ability to extract knowledge
from data, while traditional ones focus on making the machine learn; ii) it establishes a theoretical basis in
statistics as a discipline to control the errors in inference; and iii) it is data-driven and target-driven which
enjoy new contributions from the information industry sectors.
In addition to kernel methods and support vector machines, the so-called latent data models are effective
tools to analyze multi-dimensional data. There are three attractive features for the latent variables
specified in a latent data model: i) they can potentially have useful physical meaning; ii) they are
relatively independent instead of a strong correlation among the original variables; iii) they can be
designed with more efficient computation methods. Latent structure models such as PLS and PCA as
applied to chemometrics and process monitoring were actually developed for the same purposes and
reasons. It is, therefore, worthwhile to explore what latent data models can offer for process data analytics
and their connections to latent structure models.
Another interesting problem in statistical machine learning is the low-rank matrix approximation. In
theory and practical applications, it is shown that a data matrix can usually be expressed as a low-rank
matrix plus a sparse matrix. Robust PCA and matrix completion models are proposed and applied
effectively to video data and text data analysis. An important feature of the robust methods is that they are
made insensitive to outliers or missing values by using zero-norm or one-norm, rather than the typical
two-norm used in the standard PCA approach. For the low-rank matrix approximation methods, it is
important to design an appropriate computation method. The rich process systems expertise in
optimization promises to great contributions in the area of optimization for machine learning, as
highlighted in Sra et al. (2011).
It is inspiring to see that optimization and control researchers in process systems engineering already
make contributions for the interplay between optimization and machine learning (Cozad et al., 2014; Choi
10
et al., 2004). Process data analytics techniques developed from big data analytics could provide distilled
data or data representation for the following systems engineering tasks.
Meta-modeling – using data-analytics techniques to generate surrogate or reduced-dimension
process models that are accurate and computationally efficient.
Derivative-free optimization – optimization based on techniques that make use of data or their
effective representation.
Optimization under uncertainty – characterizing uncertainty using data-driven machine learning
tools to enhance optimization techniques to work with uncertainty.
8. For Velocity: Real-Time, Data-Centric System Architecture
At present, process data historians are built around distributed control systems (DCS), where the central
task is to perform feedback control and some form of operator user interface. Data historian systems such
as the OSI PI are real-time databases that replaced strip chart recorders. One limitation of such systems is
that it is very difficult to even manually integrate them with other high level operational databases. It is
not realistic to expect that this type of system architecture would support the massive requirement in
accessing a diverse source of historical and real time data and be fast enough to build models on the fly.
Data-centric system architecture and computational framework are mainly built on large-scale distributed
storage and processers. The storage structure and computing engine are constructed to be suitable for real-
time data analysis, while knowledge is extracted from massive data using data analytics. The extracted
knowledge can usually be delivered to the end users by cloud services.
Hadoop, developed by Doug Cutting and Michael J. Cafarella in 2005 with support from Yahoo is the
most popular big data processing platform due to the attractive characteristics of high reliability, high
efficiency, and high scalability (Vance, 2009). It is based on the Google file system (GFS) and the idea of
MapReduce. Hadoop has become the de facto standard for the big data processing framework. As a
storage and processing platform of large distributed data processing systems, Hadoop is composed of two
main parts, a distributed file system to support massive data storage, and a distributed computing
framework to support MapReduce (Dean and Ghemawat, 2004) data processing. The computational
frameworks can be operated in clusters, while the computations and resources are managed and scheduled
by the resource management system with efficient resource utilization. Computing frameworks can be
categorized into three modes, that is, the streaming mode, the batch mode, and the mixed mode.
a) Streaming mode
The streaming mode considers the data flowing in as a steady stream. When new data arrive, they are
processed immediately. The processing is usually performed in memory due to the real-time requirement,
making the processing rely on clever data structure in memory. The limited memory capacity can become
a major bottleneck. The application of streaming models mainly focuses on real-time statistical analysis,
online monitoring, etc.
b) Batch mode
MapReduce as a typical batch framework was developed by Google Inc. (Dean and Ghemawat, 2004). It
is originally designed to accomplish parallel processing of large amount of data through large-scale low-
cost server clusters. MapReduce has advantages in simple interface and powerful data processing on
large-scale parallel executions, fault tolerance and load balancing implementations. MapReduce has been
widely used in data mining, machine learning, information retrieval, computer simulation, and scientific
experiments.
c) Mixed mode
11
The streaming mode and batch mode can be integrated to form a mixed mode. The basic idea is to apply
the MapReduce model for streaming processing. For example, Thusoo et al. (2009) discussed the
framework adjustment when applying MapReduce to streaming single pass processing. On the basis of
this analysis, Mazur et al. (2011) introduced a realization of scalable platform of MapReduce for single
pass analysis. In streaming MapReduce discussed in Li et al. (2011), which considers event stream
processing, the Mapper and Reducer in MapReduce are redefined to improve the processing ability for
continuous data.
Process data analytics in the traditional data processing architecture and the MapReduce-based big data
processing architecture are faced with the following issues: i) As MapReduce is a batch-oriented parallel
computing model, it has unsatisfying performance for real-time data analytics; ii) Even common data
analytics (e.g., PCA) algorithms cannot be easily performed when the amount of data is too large; and iii)
the existing big data processing platform usually performs simple data query but not in-depth data
analytics. It is desirable to establish a data-centric architecture for real-time data analytics of multi-level
heterogeneous data across spatial and temporal domains. The following directions are speculated:
integrate streaming processing algorithms with the MapReduce architecture, e.g., incremental
computing modeling and iterative incremental computing modeling;
establish a hardware-software architecture in which data resources and computing resources can
be shared, allocated and merged, e.g., parallel operation of multiple computing platforms to
increase the utilization and reduce maintenance cost.
develop efficient statistical machine learning algorithms on the MapReduce (or Hadoop)
framework to implement real-time data analysis, e.g. feature extraction, mining, query, clustering,
and classification of time series data. For process data analytics, efficient query of data
segmentation can be achieved by using parallel computation of open source software.
9. Summary
Process Data Analytics has been an indispensable tool in chemical process operations. However, in the
era of big data and the development of advanced analytics in other sectors of industries and business
operations, there appears to be much more room to grow. Physical and chemical sciences develop
principles based on which mechanistic models are established for phenomena or processes with well-
understood mechanisms; data, on the other hand, provide realistic information that reflects unknown
changes in the operation of these processes, and are the only reliable source of information to characterize
uncertainty and emerging situations not considered in the process design phase. This perspective paper
covers several recent developments in data analytics from other disciplines that are perceived to be
relevant to chemical process operations. These new perceived ways of using massive amount of data
might shift the balance between a mechanistic model and the data, much like what the Kalman filter has
enabled half a century ago. In addition, high level optimization tasks such as planning and scheduling can
also benefit from information extracted from massive data, since optimization has always been based on
the interplay between models and data.
Inference using massive data with controlled error tolerance is of major interest, where the goal is to turn
data into knowledge and to support effective decision-making and optimization. While it was possible to
require clean and accurate data in small data samples, we might have to live with messiness of the data
with large scale data samples and contain the errors by using massive data. Robust methods in statistical
machine learning are effective ways to handle messy data, although some level of pre-processing is
always helpful.
12
To make use of machine learning to extract knowledge from big data, sometimes all data but not small
data, the practitioners should familiarize themselves with data science tools which are relevant to but
different from information science and statistics. The scientists or engineers are encouraged to possess: i)
the ability to develop or use the big data processing architecture (MapReduce or Hadoop); ii) the ability to
develop or appropriately use algorithms; iii) the ability to model data and judge the validity of the
knowledge discovered from analyzing data.
As process data analytics could be routinely used for process operations and decision making, the issue of
cybersecurity in process operations and control becomes important due to increased reliance on data and
sensors. Although no computer systems are immune to this potential risk, process operations and control
often require much higher security than other systems such as social networks. Data analytics itself with
validity check and intrusion detection could provide useful solutions. Another related issue, although
somewhat deliberate, is the perpetual question of confidentiality of accessing data and the ownership of
the process or equipment data. Industries including vendors and end-users must agree to engage in a new
relationship which allows for a win-win situation to maximize the benefit from big data analytics.
Finally, it should be noted that big data is not likely the answer to everything. Due to Silicon Valley’s
typical over-reaction to new ideas, it would not surprise anyone if the big data excitement will settle down
with progresses in a few areas where they are most effective. However, it is often that the tide will come
back again with breakthroughs happening somewhere. The up-and-down progressions in machine
learning and time series data modeling over half a century has provided enough food for thoughts in that
innovations require an open mind and persistent effort. It takes patience and insight to bring a new
technology to process systems operations where traditional procedures and solutions are in place.
Acknowledgments
The author is grateful to Drs. Qiang Liu, Quan Xu, Lei Zhang, Zhihua Zhang and Gang Li for discussions
in organizing the paper and anonymous reviewers for insightful comments. He would like to acknowledge
funding from the Natural Science Foundation of China under Grant 61020106003, the 111 Project of
Ministry of Education of China under Grant B08015, and the SAPI Fundamental Research Funds
(2013ZCX04), CiSoft between Chevron and the University of Southern California, and members of the
Texas-Wisconsin-California Control Consortium.
13
Literature Cited
Bakshi, B. R., and G. Stephanopoulos, "Representation of Process Trends—IV. Induction of Real-time
Patterns from Operating Data for Diagnosis and Supervisory Control," Computers & Chemical
Engineering, 18(4), 303-332 (1994).
Bengio, Y., A. Courville, and P. Vincent, "Representation Learning: A Review and New Perspectives,"
IEEE Transactions on Pattern Analysis and Machine Intelligence, 35(8), 1798-1828 (2013).
Bengio, Y., P. Lamblin, D. Popovici, and H. Larochelle, "Greedy Layer-wise Training of Deep
Networks," Advances in Neural Information Processing Systems, 19, 153-160 (2007).
Bickel, P. J., J. B. Brown, H. Huang, and Q. Li, "An Overview of Recent Developments in Genomics and
Associated Statistical Methods," Philos Trans A Math Phys Eng Sci., 367, 4313-4337 (2009).
BGI, "3Million" Project. http://www.genomics.cn/en/navigation/show_navigation?nid=5658.
Boyd, S., N. Parikh, E. Chu, B. Peleato, and J. Eckstein, "Distributed Optimization and Statistical
Learning via the Alternating Direction Method of Multipliers," Foundations and Trends in Machine
Learning, 3(1), 1-122 (2011).
Choi, J., M. J. Realff, and J. H. Lee, "Dynamic Programming in A Heuristically Confined State Space: A
Stochastic Resource-constrained Project Scheduling Application," Computers & chemical
engineering, 28(6), 1039-1058 (2004).
Collins, F. S., M. Morgan, and A. Patrinos, "The Human Genome Project: Lessons From Large-Scale
Biology," Science, 300(5617), 286-290 (2003).
Cozad, A., N. V. Sahinidis, and D.C. Miller, "Learning Surrogate Models for Simulation-based
Optimization," AIChE Journal, 60(6), 2211-2227 (2014).
Davis, J., T. Edgar, J. Porter, J. Bernaden, and M. Sarli, "Smart Manufacturing, Manufacturing
Intelligence and Demand-dynamic Performance," Computers and Chemical Engineering, 47, 145-
156 (2012).
Dean, J., and S. Ghemawat, "MapReduce: Simplified Data Processing on Large
Clusters," Communications of the ACM, 51(1), 107-113 (2008).
Freund, Y., and R. E. Schapire, "A Short Introduction to Boosting," Journal of Japanese Society for
Artificial Intelligence, 14(5), 771-780 (1999).
Fu, T. C., "A Review on Time Series Data Mining," Engineering Applications of Artificial Intelligence,
24, 164-181 (2002).
Ge, Z. Q., C. J. Yang, Z. H. Song, and H. Q. Wang, "Robust Online Monitoring for Multimode Processes
Based on Nonlinear External Analysis," Ind. Eng. Chem. Res., 47, 4775-4783 (2008).
Geladi, P., B. R. Kowalski, "Partial Least-squares Regression: A Tutorial," Analytica Chimica Acta, 185,
1-17 (1986).
Gibbs, B.P., “Advanced Kalman Filtering, Least-Squares and Modeling: A Practical Handbook,” Wiley,
New York (2011).
Ginsberg, J., M. H. Mohebbi, R. S. Patel, and L. Brammer, M. S. Smolinski, L. Brilliant, "Detecting
Influenza Epidemics Using Search Engine Query Data," Nature, 457, 1012-1014 (2009).
Granger, C., "Some Recent Development in a Concept of Causality," Journal of Econometrics, 39, 199-
211 (1988).
Grossmann, I. E., "Advances in Mathematical Programming Models for Enterprise-wide Optimization,"
Computers and Chemical Engineering, 47, 2-18 (2012).
Hinton, G. E., and R. Salakhutdinov, "Reducing the Dimensionality of Data with Neural Networks,"
Science, 313(5786), 504-507 (2006).
Hoskins, J.C. and D.M. Himmelblau, “Artificial neural network models of knowledge representation in
chemical engineering,” Computers & Chemical Engineering, 12, 881–890 (1988).
14
Kalman, R. E., "A New Approach to Linear Filtering and Prediction Problems," Journal of Basic
Engineering, 82(1), 35-45 (1960).
Keogh, E., and S. Kasetty, "On the Need for Time Series Data Mining Benchmarks: A Survey and
Empirical Demonstration," Proceedings of the eighth ACM SIGKDD international conference on
Knowledge discovery and data mining, 102-111 (2002).
Klatt, K. U., and W. Marquardt, "Perspectives for Process Systems Engineering—Personal Views from
Academia and Industry," Computers & Chemical Engineering, 33, 536-550 (2009).
Kourti, T., and J. F. MacGregor, "Process Analysis, Monitoring and Diagnosis, Using Multivariate
Projection Methods," Chemometrics and Intelligent Laboratory Systems, 28(1), 3-21 (1995).
Ku, W., R. Storer, C. Georgakis, "Disturbance Detection and Isolation by Dynamic Principal Component
Analysis," Chemometrics and Intelligent Laboratory Systems, 30(1), 179-196 (1995).
Lim, B., E. Mazur, Y. Diao, A. McGregor, and P. Shenoy, "A Platform for Scalable One-pass Analytics
Using MapReduce," SIGMOD '11, 985-996 (2011).
Mah, R.S., Gregory M. Stanley*, and Dennis M. Downing, Reconciliation and Rectification of Process
Flow and Inventory Data, Ind. Eng. Chem. Process Des. Dev., 15(1), 175-183 (1976).
Manyika, J., M. Chui, B. Brown, J. Bughin, R. Dobbs, C. Roxburgh, and A. H. Byers, "Big Data: The
Next Frontier for Innovation, Competition, and Productivity," McKinsey Global Institute Report,
http://www.mckinsey.com/insights/business_technology/big_data_the_next_frontier_for_innovation (2011).
Mayer-Schönberger, V., and K. Cukier, "Big Data: A Revolution that will Transform How We Live,
Work, and Think," Houghton Mifflin Harcourt, Boston (2013).
Mazur, E., B. Li, Y. Diao, P. Shenoy, "Towards Scalable One-pass Analytics Using MapReduce," IPDPS
Workshops, 1102-1111 (2011).
National Research Council, "Frontiers in Massive Data Analysis," The National Academies Press,
Washington, DC (2013).
Nelson, P. R., P. A. Taylor, J. F. MacGregor, "Missing Data Methods in PCA and PLS: Score
Calculations with Incomplete Observations," Chemometrics and Intelligent Laboratory Systems, 35,
45-65 (1996).
Qin, S. J., Y. Y. Zheng, "Quality-Relevant and Process-Relevant Fault Monitoring with Concurrent
Projection to Latent Structures," AIChE Journal, 59, 496-504 (2013).
Qin, S. J., "Survey on Data-Driven Industrial Process Monitoring and Diagnosis," Annual Reviews in
Control, 36, 220-234 (2012).
Qin, S. J., G. Cherry, R. Good, J. Wang, and C. A. Harrison, "Semiconductor Manufacturing Process
Control and Monitoring: A Fab-Wide Framework," J. of Process Control, 16, 179-191 (2006).
Qin, S. J. and T. J. McAvoy, "A Data-Based Process Modeling Approach and Its Applications,"
Proceedings of the 3rd IFAC DYCORD Symposium, 321-326, College Park, Maryland (1992).
Singhal, A. and D. E. Seborg, "Evaluation of A Pattern Matching Method for the Tennessee Eastman
Challenge Process," J. Process Control, 16, 601-613 (2006).
Sra, S., S. Nowozin and S. J. Wright, "Optimization for Machine Learning," MIT Press, Cambridge, MA
(2011).
Stephanopoulos, G., and G. V. Reklaitis, "Process Systems Engineering: From Solvay to Modern Bio-
and Nanotechnology. A History of Development, Successes and Prospects for the Future," Chemical
Engineering Science, 66, 4272-4306 (2011).
Sun, Z. L., S. J. Qin, A. Singhal, and L. Megan, "Performance Monitoring of Model-Based Controllers
via Model Residual Assessment," Journal of Process Control, 23, 473-482 (2013).
TATA Consultancy Services, "The Emerging Big Returns on Big Data," A TCS 2013 Global Trend
Study (2013).
Tham, M., "Soft-Sensors for Process Estimation and Inferential Control," Journal of Process Control,
1(1), 3-14 (1991).
15
Thusoo, A., J. S. Sarma, N. Jain, Z. Shao, P. Chakka, N. Zhang, S. Antony, H. Liu and R. Murthy, "Hive-
A Petabyte Scale Data Warehouse Using Hadoop," ICDE, 996-1005 (2010).
Vance, A., "Hadoop, A Free Software Program, Finds Uses Beyond Search," The New York Times,
http://www.nytimes.com/2009/03/17/technology/business-computing/17cloud.html?_r=0 (2009).
Vapnik, V., "The Nature of Statistical Learning Theory," Springer-Verlag, New York (1999).
Venkatasubramanian, V., "Drowning in Data: Informatics and Modeling Challenges in a Data-Rich
Networked World," AIChE Journal, 55(1), 2-8 (2009).
Waterman, M. S., "Introduction to Computational Biology: Maps, Sequences and Genomes," CRC Press,
(1995).
Ydstie, B. E., "Forecasting and Control Using Adaptive Connectionist Networks," Computers &
Chemical Engineering, 14(4), 583-599 (1990).
Yu, H. and John F. MacGregor. “Multivariate image analysis and regression for prediction of coating
content and distribution in the production of snack foods,” Chemometrics and Intelligent Laboratory
Systems, 67, 125–144 (2003).
Yuan, T. and S. J. Qin, "Root Cause Diagnosis of Plant-wide Oscillations Using Granger Causality,"
Journal of Process Control, 24, 450–459 (2014).


![Data Explosion Big Data Analytics in the new Cognitive Era › wp-content › ...Does the Era of Big Data Signify the End of the Data Warehouse? NO! “Instead they [organizations]](https://img.pdfslide.us/doc/110x75/5f1f86ddd8a5ac09c05591bc/data-explosion-big-data-analytics-in-the-new-cognitive-era-a-wp-content-a-.jpg)