Embed Size (px)
Citation preview
Principals and Interests:
Common Agency and Multilateral Development Bank
Lending
Daniel L. Nielson
Brigham Young University [email protected]
Michael J. Tierney
College of William and Mary [email protected]
November 2006
Abstract
Are IOs accountable to their member states? There are good reasons to think that they may not be. We extend and apply agency theory to account for divergence between member-country environmental preferences and lending behavior at the multilateral development banks (MDBs). We treat governments in international organizations as members of a collective principal, an understudied concept in political science. A collective principal must overcome collective-action problems before and while delegating. If voting rules within MDBs are efficacious, then MDB behavior will be responsive to changes in the preferences of the winning coalition on the MDB board. We address such claims theoretically and statistically with a sample of more than 7,500 loans issued by the World Bank, the African Development Bank and Fund, the Asian Development Bank, the Inter-American Development Bank, and the Islamic Development Bank from 1980 to 2000. To measure preferences, we employ three additional new databases of countries’ revealed environmental policy preferences, environmental foreign aid, and voting shares in MDBs for the same period. For previous comments on this paper we thank Bill Bernhard, Scott Cooper, David Dessler, Dan Drezner, Jay Goodliffe, Darren Hawkins, Robert Keohane, Dave Lewis, Mona Lyne, Lisa Martin, Scott Morgenstern, Brian Sala, Mike Thies, and Sven Wilson. The project was funded by National Science Foundation grant SES-0454384.
Principals and Interests:
Common Agency and Multilateral Development Bank
Lending
Effective performance by any public agency depends largely upon the
incentives and constraints that the agencies’ sponsors impose upon it…If
there are a number of significant sponsors with varying interests, effective
performance becomes increasingly difficult to measure or even define, and
the staff’s own agenda becomes increasingly predominant within the constraints imposed by the sponsors.
James Burnham, former US Executive Director at the World Bank, 1994
Introduction
Governments in advanced industrial democracies began embracing environmentalism in the early 1970s. “Green” policy preferences among these states increased and converged steadily during subsequent decades. Yet only in the late-1980s did the multilateral development banks (MDBs) significantly alter their lending practices in favor of the environment. Moreover, substantial differences persist among the MDBs in their environmental lending. These patterns present puzzles for international relations (IR) theory and for political science more broadly. In IR, neorealists and neoliberals expect that international organization (IO) behavior will follow smoothly from the preferences of the great power(s). Constructivists argue that IOs typically initiate and diffuse normative changes and policy innovations, not simply follow them. Current theory in international relations thus cannot explain environmental patterns at the MDBs.
We employ agency theory to help solve these puzzles. We argue that IOs can be
usefully conceived as agents (Hawkins et al 2006; Vaubel 2006), like firms in economics and bureaucracies in domestic politics. Member governments make up the principals that create IOs and delegate authority to them in order to solve specific problems in an effort to improve their own welfare. But member governments of an IO typically comprise a collective principal, and they must overcome a host of familiar collective-action problems before and while they delegate authority to an agent (Nielson and Tierney 2003).
However, analysts often assume away collective-action problems when considering
delegation in such settings, presuming that the principal can be characterized as a unified actor. We find this assumption problematic in the context of sovereign states and IOs. Instead, coordination problems within a collective principal magnify the difficulties of hidden action, hidden information and Madison’s dilemma common to all delegation settings. Agency slack – where the agent works against the principal’s preferences – may thus increase (Kiewiet and McCubbins 1991).
Hence, we simultaneously consider collective-action problems and delegation
problems in the same model. We expect that under collective delegation, environmental
2
lending at MDBs will follow shifts towards environmentalism within the collective principal. Testing this hypothesis requires a method for determining the collective principals’ preferences and some measure of agent behavior. Collective principal preferences are a function of the individual preferences of member states aggregated by some political process. We employ two new measures of environmental preferences and we check the plausibility of our measures against public opinion data in member countries. In order to model preference aggregation through a majority-voting process we borrow from coalition theory in comparative politics, adapting pivotal-player models to our question of preference aggregation within collective principals at the MDBs. Once we have measured a collective principal’s preference for the environment, we can compare this to the actual lending behavior of the MDB in question to compare levels of agency slack.
The development lending activities of MDBs provide a good setting for the
evaluation of models focused on complex principals, or what has been termed “common agency.” Donor-country preferences over development lending – particularly in the area of environmental protection – shifted markedly from 1980 to 1999. And since these IOs are distributing billions of taxpayer dollars from donor countries every year, we should observe efforts by these donors to alter the behavior of their agents in a direction that is consistent with new policy goals.1 While analogous conditions occur within domestic political settings, few efforts have been made to study the responsiveness of IO agents to state principals (Vaubel 1994; Pollack 1997; Nielson and Tierney 2003; Copelovitch 2006). And little systematic empirical work has been done to test an explicit common agency model in the field of international relations.2 Thus, MDB loan portfolios provide a useful set of observations with which to test our common-agency model, and the empirical focus of this study helps to judge the generalizability of the principal-agent framework.
Some scholars of international relations are surely skeptical about the utility of
institutionalist models developed in the study of American politics. After all, international politics is characterized by anarchy where no leviathan is available to resolve disputes between states. The binding rules that characterize domestic politics are in short supply internationally. Hence, if our common agency model can explain the relative levels of agency slippage within different MDBs, then the prospects for its application elsewhere seem promising.3 We suggest that voting procedures within MDBs act as structures that can induce delegation equilibria. Thus, IO behavioral change that is
1 Of course, while Western donors are not the only members of MDBs, they do have
disproportionate power on most MDB executive boards because of the weighted voting systems
that make the G-7 countries part of almost every winning coalition. When we operationalize our
collective principal model we consider the weighted preferences of all member states. For elaboration see Lyne, Nielson, and Tierney 2006.
2 For an exception see Martin 2006. 3 For similar efforts to integrate explanations of politics from across the sub-disciplines of
political science see Milner 1998; Lake and Powell 1999; Pollack 2002; and Lake and McCubbins 2004.
3
responsive to shifting preferences within a collective principal should occur only when majority coalitions of member states agree about what they want agents to do.4
We evaluate this hypothesis by estimating an ordered logit model that allows us to
track variation in the environmental impact of MDB loans following changes in the preferences of member governments. We employ a dataset of more than 7,500 loans issued by five multilateral development banks over twenty-one years (1980 to 2000). In addition to compiling an MDB loan database, these tests required that we construct several additional databases: an index of cross-national environmental policy preferences that varies over time, the percentage of bilateral environmental foreign aid by year, and data on voting shares at the MDBs.
International Relations Theory and IOs
In recent debates among IR theorists, IOs have become a focal point (Mearsheimer 1994; Mearsheimer 1995; Keohane and Martin 1995; Martin and Simmons 1998; Barnett and Finnemore 2004). However, in discussing the importance of IOs, the debate among neorealists, neoliberals and constructivists has centered on two questions. First, can IOs effectively coordinate or alter states’ actions? And second, are IOs merely a reflection of the balance of power and thus ephemeral and epiphenomenal, or are they meaningful institutions resilient to shifts in the balance of power and perhaps even strategic actors in their own right?
Neorealists have long denied that IOs have significance for international relations.
States are the only actors that matter, and IOs merely reflect the interests of the most powerful state(s) (Krasner 1985; Mearsheimer 1994; Mearsheimer 1995). The only international institutions that truly matter for neorealists are military alliances. But such alliances are famously brittle and short-lived, responding only to the interests of the states that created them, and then only when immediate interests match prior commitments (Walt 1987). Neorealism’s state-centric ontology has reduced its ability to explain the increasing cooperation and multilateral governance that we frequently observe in the world today.
Neoliberals and constructivists have exploited this weakness. Constructivists argue
that IOs develop their own norms of appropriateness and thus become important means for spreading related norms to nation states and other international actors. IOs act as “teachers” of norms or as “platforms” through and from which normatively motivated actors can press their causes (Finnemore 1993; Risse-Kappen 1996; Finnemore and Sikkink 1998). IOs often act at the vanguard of normative movements, becoming important sources of change in international relations (Finnemore 1993, 1996).
Neoliberals adopt a nearly identical ontology to neorealists. Yet, neoliberals have
shown both theoretically and empirically that international cooperation is not only
4 This assumes that decisions are taken by majority vote. If a supermajority or unanimity is
required in order to change the status quo, then member states face more significant collective action problems and IO bureaucrats are presumably freer to select their preferred policy.

4
possible under anarchy, but common (Keohane 1984; Oye 1986; Martin 1992). More importantly, international institutions facilitate cooperation by reducing transaction costs, lessening information asymmetries and providing quasi-legal frameworks for governments (see Keohane 1984; Krasner 1984; Richardson 1999). However, the adoption of the state-centric ontology hampers neoliberalism’s ability to fully explore the mechanisms through which IOs influence outcomes in world politics. Even if IOs can be seen to do things – independent of directives and interests of nation states – there is no place in the state-centric ontology to accommodate such independence.5
International organizations pose significant difficulties for scholars interested in
adapting and applying the insights of agency theory (Pollack 2003; Hawkins et. al. 2004). In particular, IOs present the problem of common agency, where IOs typically resemble a collective principal (Bernheim and Whinston 1986; Kiewiet and McCubbins 1991; Dixit, Grossman and Helpman 1997; Lyne 2003). Modeling IOs as agents thus requires the simultaneous consideration of delegation problems and collective action problems.
Toward a Model of Collective Delegation
Common agency – where more than one principal delegates authority to an agent – is everywhere in politics. Voters delegate to legislators, legislators delegate to party leaders, politicians delegate to bureaucrats, and groups of states delegate to international organizations. Despite the ubiquity of common agency, analysts have only recently begun grappling with the concept in an explicit way (Bernheim and Whinston 1986; Dixit et al 1997, 1999). Moreover, when analysts do address the question of common agency, they often conflate bargaining games involving multiple principals with those entailed by a collective principal. However, these two situations are conceptually distinct (Kiewiet and McCubbins 1991, 26-27).
Multiple principals are independent of one another, and each holds a discrete contract
with the same agent. Each principal can unilaterally alter his or her own contract with the agent without the consent of other principals. Alternatively, members of a collective
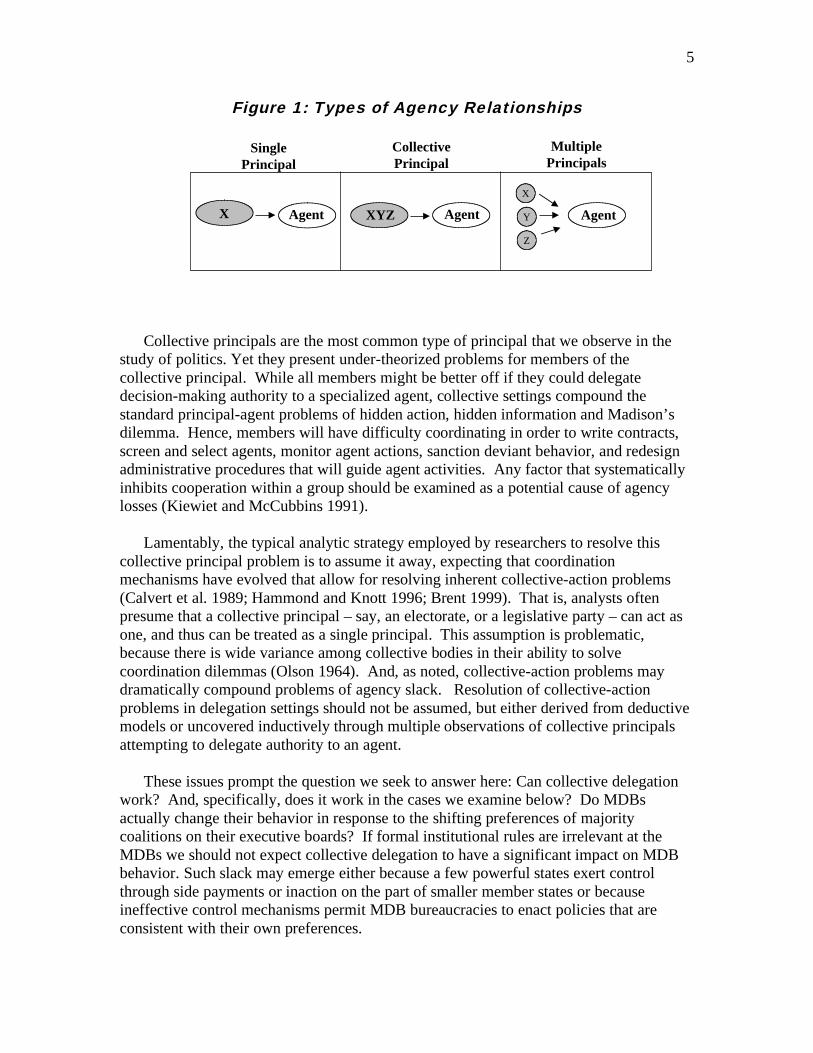
principal cannot act independently from one another, but must first solve collective-action problems before issuing authoritative directions to their agents. Members collectively hold only a single contract with the agent, and no individual member of this group can alter the contract unilaterally. In order to re-contract with their agent, members within a collective principal must act as one – usually by majority vote or some analogous decision rule. In other words, the members must form a voting coalition. See Figure 1.
5 This argument is developed by Nielson and Tierney (2003) and Barnett and Finnemore
(2004).
5
Figure 1: Types of Agency Relationships
AgentAgent AgentX XYZ
X
Y
Z
Single
Principal
Collective
Principal
Multiple
Principals
Agent
Collective principals are the most common type of principal that we observe in the
study of politics. Yet they present under-theorized problems for members of the collective principal. While all members might be better off if they could delegate decision-making authority to a specialized agent, collective settings compound the standard principal-agent problems of hidden action, hidden information and Madison’s dilemma. Hence, members will have difficulty coordinating in order to write contracts, screen and select agents, monitor agent actions, sanction deviant behavior, and redesign administrative procedures that will guide agent activities. Any factor that systematically inhibits cooperation within a group should be examined as a potential cause of agency losses (Kiewiet and McCubbins 1991).
Lamentably, the typical analytic strategy employed by researchers to resolve this
collective principal problem is to assume it away, expecting that coordination mechanisms have evolved that allow for resolving inherent collective-action problems (Calvert et al. 1989; Hammond and Knott 1996; Brent 1999). That is, analysts often presume that a collective principal – say, an electorate, or a legislative party – can act as one, and thus can be treated as a single principal. This assumption is problematic, because there is wide variance among collective bodies in their ability to solve coordination dilemmas (Olson 1964). And, as noted, collective-action problems may dramatically compound problems of agency slack. Resolution of collective-action problems in delegation settings should not be assumed, but either derived from deductive models or uncovered inductively through multiple observations of collective principals attempting to delegate authority to an agent.
These issues prompt the question we seek to answer here: Can collective delegation
work? And, specifically, does it work in the cases we examine below? Do MDBs actually change their behavior in response to the shifting preferences of majority coalitions on their executive boards? If formal institutional rules are irrelevant at the MDBs we should not expect collective delegation to have a significant impact on MDB behavior. Such slack may emerge either because a few powerful states exert control through side payments or inaction on the part of smaller member states or because ineffective control mechanisms permit MDB bureaucracies to enact policies that are consistent with their own preferences.
6
The central methodological problem with testing any collective delegation model follows from observational equivalence in equilibrium. Without observing a principal that is actively altering an agent’s incentives, the analyst cannot know if inaction on the part of the agent stems from the principal’s satisfaction or from the inability to coordinate its many members. Thus, evaluating common agency models requires that we examine cases where both the agent’s actions and the collective principal’s preferences vary. By looking at five different MDBs over time we can observe such variation.
Measuring Collective Preferences
Answering the neglected question, “does collective delegation work?” requires two components. First, we must focus on the preferences and preference distribution of members within a collective principal. Second, we should consider the institutions that can provide structure for voting equilibria among the members. For the first component, we derive government environmental preferences for international environmental protection using two measures. We measure domestic policy outcomes in the area of environmental protection. We infer that countries most interested in environmental protection at home will be similarly motivated to protect the environment outside their own borders. In order to ensure the robustness of this measure we also use the percent of bilateral environmental foreign aid. Plausibly, governments that direct a greater slice of their aid portfolio to environmental protection will be similarly motivated to push for environmental loans and oppose dirty loans when casting votes on MDB boards. Hence, the “revealed preferences” we derive are based both on an index of policy outcomes and on bilateral environmental aid. We discuss these decisions at length below.
Formal decision rules within MDBs suggest clear hypotheses about equilibrium
outcomes; hence, we draw on coalition theory in comparative politics, which suggests ways in which coalitions will be constructed given majority voting rules. We explore a promising model for predicting voting coalitions within a collective principal: the pivotal-player approach.
Some simplifying assumptions will help in constructing our collective principal
model. First, we assume unidimensional policy space, where actor preferences can be arrayed along a single policy dimension. The coalition literature makes it clear that multidimensionality complicates coalition formation considerably (Laver and Schofield 1991; Krehbiel 1988). Our single policy dimension of environmental protection makes this assumption useful for our initial empirical tests, even if many more policy dimensions are in play at the MDBs.6
6 If trading or logrolling of policies between issue areas occurs extensively in the voting
body, the assumption of unidimensionality grows problematic. However, in the case of MDBs, voting in the Executive Board occurs on discrete loans, so omnibus packages do not occur. While
trading may indeed take place at the margins, formal institutions mitigate against it. Still,
unidimensionality is a useful assumption even where logrolling is extensive, such as the U.S.
Congress. Fortunately, the practice in our topic area makes this assumption more both useful and plausible.
7
Second, we assume that our actors form voting coalitions, not governing coalitions. Because voting takes place on discrete policy questions that can be arrayed in unidimensional space, and where the votes do not affect executive tenure (as in confidence votes), little incentive exists for the formation of voting coalitions that are non-contiguous (see Laver and Schofield 1991). That is, we do not expect that actors will vote against a measure if it is closer to their ideal point on the issue continuum than other actors voting favorably. Coalitions will not drop “dummies,” or potential members that are not necessary to reach the majority threshold but that nevertheless are aligned in issue space (see Laver and Schofield 1991, 98-101). While voting coalitions are arguably less stable than governing coalitions, they do less violence to the assumptions of preference aggregation models than governing coalitions, where office holding is a key consideration.
Our pivotal-players model injects a concern for veto players into coalition formation.
That is, of the many possible connected majority coalitions that might form, some potential members might be “pivotal” in the sense that the combination of their centrist position and their size makes them very attractive coalition partners. It will prove difficult to form connected coalitions without them. Thus, pivotal players can veto a large set of the possible coalitions that might form and can extract policy benefits from their coalition partners that their size alone would not necessarily predict. Large centrist players thus have a strong advantage over similarly large extremist players. In terms of measuring coalition preferences, the privotal-players model counts all possible connected coalitions that might form. Then, it examines how many of the potential coalitions collapse when a party at the far end of the coalition exits. These are the pivotal players. In using this model to determine preferences for a group, the analyst can then weight each player’s preferences by the proportion of possible coalitions for which it proves the crucial defector (Garrett and Tsebelis 1996).
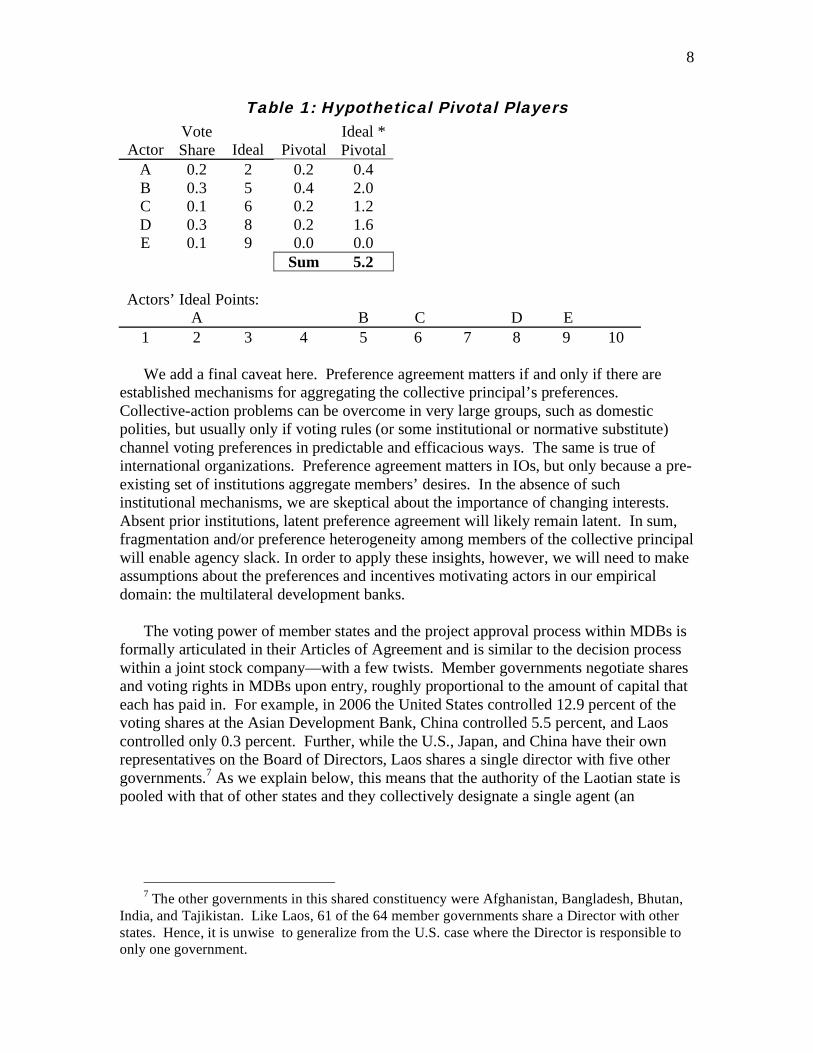
We provide a simple example of this technique in Table 1. First, the hypothetical
principals are arrayed according to their preferred outcome along a ten-point scale in issue space. Next, all possible contiguous coalitions, where the combined voting shares are greater than .50, are identified. In this example there are five such potential coalitions: (1) ABC, (2) ABCD, (3) ABCDE, (4) BCD, and (5) BCDE. For the first coalition, either actor A or actor C could prove pivotal by defecting. For coalitions 2 and 3 there are no critical defectors (no defections drop the coalition below .50). For coalition 4 either actor B or D could prove pivotal. And only actor B could critically defect for coalition 5. The total number of potential critical defections is 5, with actors A, C and D each proving pivotal in 20 percent of the critical defections, and actor B in 40 percent. Actor E is never pivotal. We then weight each actor’s ideal point by the “pivotalness” share. For example, Actor A’s ideal point of 2 is multiplied by its pivotalness share of .20, producing a product of .40. Finally, we sum each of these products to produce an overall preference for the collective principal. In the hypothetical example in Table 1, the pivotal-weighted collective preference is 5.2.
8
Table 1: Hypothetical Pivotal Players
Actor Vote Share Ideal Pivotal
Ideal * Pivotal
A 0.2 2 0.2 0.4 B 0.3 5 0.4 2.0 C 0.1 6 0.2 1.2 D 0.3 8 0.2 1.6 E 0.1 9 0.0 0.0
Sum 5.2
Actors’ Ideal Points:
A B C D E
1 2 3 4 5 6 7 8 9 10 We add a final caveat here. Preference agreement matters if and only if there are
established mechanisms for aggregating the collective principal’s preferences. Collective-action problems can be overcome in very large groups, such as domestic polities, but usually only if voting rules (or some institutional or normative substitute) channel voting preferences in predictable and efficacious ways. The same is true of international organizations. Preference agreement matters in IOs, but only because a pre-existing set of institutions aggregate members’ desires. In the absence of such institutional mechanisms, we are skeptical about the importance of changing interests. Absent prior institutions, latent preference agreement will likely remain latent. In sum, fragmentation and/or preference heterogeneity among members of the collective principal will enable agency slack. In order to apply these insights, however, we will need to make assumptions about the preferences and incentives motivating actors in our empirical domain: the multilateral development banks.
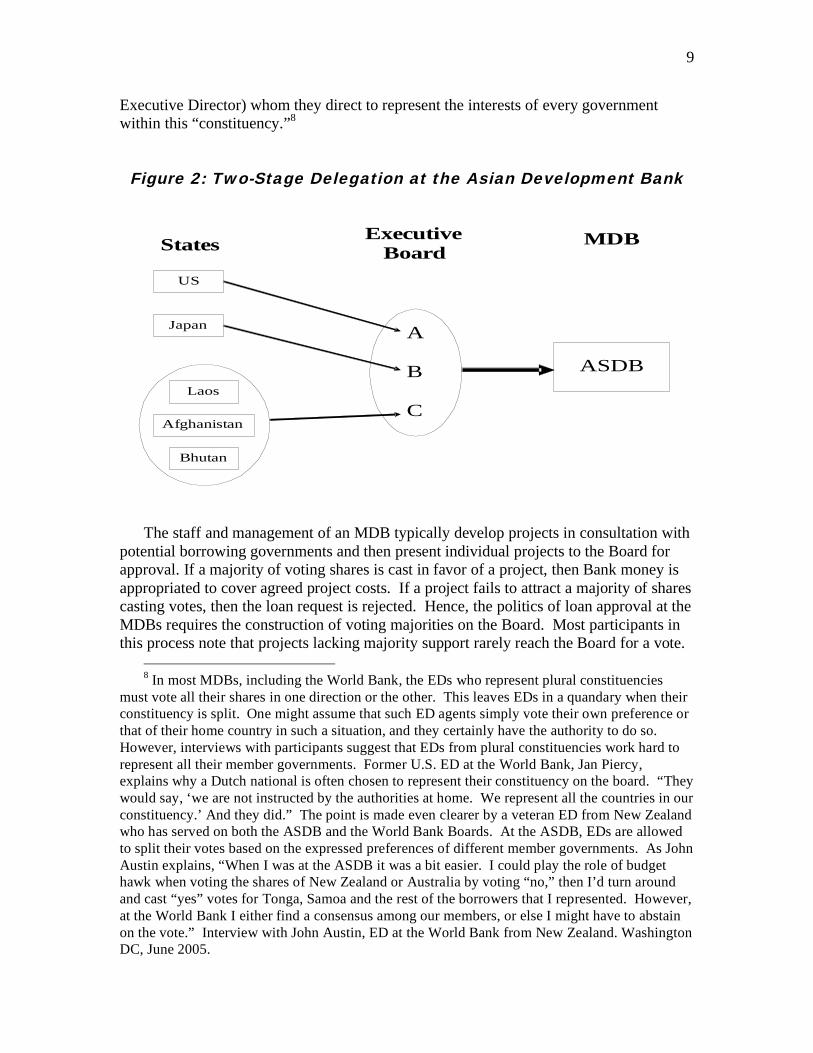
The voting power of member states and the project approval process within MDBs is
formally articulated in their Articles of Agreement and is similar to the decision process within a joint stock company—with a few twists. Member governments negotiate shares and voting rights in MDBs upon entry, roughly proportional to the amount of capital that each has paid in. For example, in 2006 the United States controlled 12.9 percent of the voting shares at the Asian Development Bank, China controlled 5.5 percent, and Laos controlled only 0.3 percent. Further, while the U.S., Japan, and China have their own representatives on the Board of Directors, Laos shares a single director with five other governments.7 As we explain below, this means that the authority of the Laotian state is pooled with that of other states and they collectively designate a single agent (an
7 The other governments in this shared constituency were Afghanistan, Bangladesh, Bhutan,
India, and Tajikistan. Like Laos, 61 of the 64 member governments share a Director with other
states. Hence, it is unwise to generalize from the U.S. case where the Director is responsible to only one government.
9
Executive Director) whom they direct to represent the interests of every government within this “constituency.”8
Figure 2: Two-Stage Delegation at the Asian Development Bank
The staff and management of an MDB typically develop projects in consultation with
potential borrowing governments and then present individual projects to the Board for approval. If a majority of voting shares is cast in favor of a project, then Bank money is appropriated to cover agreed project costs. If a project fails to attract a majority of shares casting votes, then the loan request is rejected. Hence, the politics of loan approval at the MDBs requires the construction of voting majorities on the Board. Most participants in this process note that projects lacking majority support rarely reach the Board for a vote.
8 In most MDBs, including the World Bank, the EDs who represent plural constituencies
must vote all their shares in one direction or the other. This leaves EDs in a quandary when their constituency is split. One might assume that such ED agents simply vote their own preference or
that of their home country in such a situation, and they certainly have the authority to do so.
However, interviews with participants suggest that EDs from plural constituencies work hard to
represent all their member governments. Former U.S. ED at the World Bank, Jan Piercy, explains why a Dutch national is often chosen to represent their constituency on the board. “They
would say, ‘we are not instructed by the authorities at home. We represent all the countries in our
constituency.’ And they did.” The point is made even clearer by a veteran ED from New Zealand who has served on both the ASDB and the World Bank Boards. At the ASDB, EDs are allowed
to split their votes based on the expressed preferences of different member governments. As John
Austin explains, “When I was at the ASDB it was a bit easier. I could play the role of budget hawk when voting the shares of New Zealand or Australia by voting “no,” then I’d turn around
and cast “yes” votes for Tonga, Samoa and the rest of the borrowers that I represented. However,
at the World Bank I either find a consensus among our members, or else I might have to abstain
on the vote.” Interview with John Austin, ED at the World Bank from New Zealand. Washington DC, June 2005.
US
Japan
Laos
Afghanistan
Bhutan
A
B
C
ASDB
States Executive
Board MDB
10
“If lots of EDs have concerns, or if individual EDs have strong concerns, the project is not likely to come before the Board. Lots of projects get dumped early in the loan approval process.”9 Therefore, while formal roll-call votes are the exception, all actual and potential funding decisions within the Board take place in the shadow of the formal majority rule. And the decisions derive from the preferences that member-state representatives bring from their home governments.
Actors and Preferences
Whole forests have been killed attempting to specify the preferences of citizens, interest groups, parties, bureaucracies, bureaucrats, politicians, and nation-states. In future iterations of this project we will provide a more lengthy derivation of actor preferences. For now, few will be surprised by the assumptions we make here.
Generally, all the actors in our model make purposive choices in pursuit of their own
interests – but intentions do not necessarily equal outcomes. The ability of any actor to achieve its goals is constrained by its relative power, institutional rules, and the expected and actual choices of other actors pursuing their own ends. In this sense, all the actors in our model are making strategic choices – their ability to achieve their own ends is conditioned by the actions that others take (Lake and Powell 1999). This assumption applies to representatives of national governments, but also extends to leaders and staff members at the MDBs. IO agents are strategic actors in their own right (Hawkins et al 2006) and their strategic choices are likely to shape outcomes in IR – in our case the type and size of development loans.10 Our substantive assumptions flesh out this general strategic choice perspective and suggest how hierarchical delegation contracts can structure the strategic choices of the actors in our model.
Legislators, presidents, prime ministers, party leaders within national political
systems, and chief executives within MDBs all seek at a minimum to maintain their positions of authority by serving those groups or individuals who are empowered to remove them (Mayhew 1974; Roeder 1993; Bueno de Mequita et al 2003). If leaders stray too far from the preferences of the “selectorate,” they are at risk of being replaced. Staying in the leadership position is a necessary condition for achieving personal or policy aims that might also be driving behavior. Hence, in equilibrium we assume that leaders will attempt to stay in office.
Staff members of MDBs seek to maximize their budgets and minimize the uncertainty
about the substance and security of their jobs (Niskanen 1971; Miller and Moe 1983; Allison and Zelikow 1999). Many – but not all – of these motives can be reduced to the size of their organization's budget. MDB bureaucrats will be interested in increasing the
9 Interview with former U.S. Executive Director at a regional development bank.
Washington, DC. June 2005. 10 Senator Patrick Leahy recognizes the ability of IO agents to shape outcomes while
discussing the efforts of World Bank President, James Wolfensohn, to change the practices of the
Bank. “Frankly, I am concerned that despite his best intentions, the Bank bureaucracy continues
to put up fierce resistance and may in the end succeed in thwarting many of his reforms” (Leahy 1997).
11
size of their own organization’s budget (and may be even more interested in avoiding reductions) for several reasons. First, the bureaucrat’s own compensation and future career prospects may be tied to the size of his/her organization's budget. Second, if individuals are motivated by non-material ends such as power or prestige, then leading a larger and more powerful organization may provide precisely that type of ego gratification. Third, most bureaucrats actually do care about the mission of their own organization, since it pursues goals that may have initially attracted them to public service, such as reducing poverty. Staff members who work in MDBs tend to be interested in questions of development, and they understand that the stakes are high in their field. It is not hard to understand why task managers and even Presidents at MDBs believe that increased funding for their organizations will be money well spent.
Relatedly, we assume that the key MDB staffers in our story – task managers, with
roles similar to loan officers at commercial banks – seek to pursue their careers within the banks in two ways. First, task managers pursue the types of loans to which they are accustomed, usually in the traditional infrastructure sectors of industry, mining, urban development, irrigation, and transportation. Second, task managers take up larger projects over smaller loans. Larger projects are much more visible within the banks, more readily serve institutional interests of moving large amounts of money to recipients, and function to establish managers as competent administrators of complicated responsibilities. Larger loans build resumes. While assumptions do not have to be “true” to be useful, this one is well grounded in the qualitative literature on the development banks and corroborated by scores of interviews we have performed at the MDBs over the last decade (See Ascher 1992; Rich 1994; Fox and Brown 1998; Miller-Adams 1998; Nielson and Tierney 2003).
Multilateral Development Banks and the Environment
Given these assumptions, we evaluate the applicability of our collective delegation model by examining behavioral change at the MDBs from 1980 to 1999. The MDBs offer a particularly useful place to examine the value of our argument. First, international relations settings likely possess the thinnest institutionalized structures that we should expect to induce decisionmaking equilibria. Members of collective principals in international organizations thus likely face substantial collective-action problems compared to their domestic counterparts in legislatures (Maltzman 1998) or on corporate boards (Gourevitch 2003).
Moreover, MDBs are among the largest and allegedly most autonomous of all
international organizations (see Ascher 1992; Barnett and Finnemore 1999, 2004). The World Bank alone employs more than 10,000 full-time staff members and issued an average of $20 billion per year in development lending from 1980 to 1999. The Inter-American Development Bank and the Asian Development Bank are each roughly half the size of the World Bank. Moreover, approximately 80 percent of MDB lending capital is raised on world debt markets by leveraging AAA bond ratings, making the MDBs financially independent of member states to a significant degree. Further, the MDBs as a class are known for the highly technical nature of their enterprise, where specialized expertise makes monitoring by principals difficult. MDBs therefore constitute unlikely
12
places to encounter evidence for our model, which expects agents to be responsive to principals under the conditions we specify.
The empirical focus of this study – the changing patterns of lending behavior at the MDBs – offers a natural experiment of sorts in the area of environmental protection. Member states pressured MDBs to champion environmental projects in their lending only after the mid-1980s. This clear break allows us to track both shifts in member-state interests along with their effects, if any, on subsequent MDB behavior. Specifically, in the wake of World Bank-sponsored environmental fiascoes the Bank drew strong criticism from environmentalists (see Rich 1994; Wade 1997; Fox and Brown 1998). Moreover, as societal interests in the developed world shifted toward environmentalism, environmental groups placed increasing pressure on donor-country governments to compel the Bank to adopt more environmentally sound practices.
However, agency theory suggests that these pressures should manifest only to the degree that environmentalists gain influence in domestic political contexts. Thus, we do not focus on demands from interest groups, but instead on the policy interests of governments – who are the proximate principals of the multilateral development banks (see Nielson and Tierney 2003). Collective delegation mechanisms allow governments to express their preferences via voting mechanisms and expect that the MDB will then follow their preferences. This leads us to the following hypothesis:
Hypothesis: As the policy interests of member countries shift toward environmental
concerns, MDB environmental loans will increase.
Data and Methods
We evaluate these hypotheses with an 1,100-loan sample from a new dataset of more than 7,200 loans issued by the World Bank, the Inter-American Development Bank and the Asian Development Bank from 1980 to 1999, focusing specifically on environmental lending by the banks. We also employ two additional new databases: the first measures the environmental policy preferences of member states year-by-year since 1980, the second tracks member states’ voting shares in the MDBs over time. We employ two-part estimation and a Heckman-selection model to the data.
Dependent Variable
To assess patterns in bilateral aid and multilateral development finance, we have compiled the Project-Level Aid Database (PLAID), which is funded by National Science Foundation grant SES-0454384. This database re-codes nearly all multilateral development bank loans, in addition to nearly all other bilateral and multilateral development agency projects, for a variety of characteristics, including the degree to which each project causes or ameliorates damage to the natural environment.
Our coding rules for the dependent variable under study, Environmental Impact, are
extensive. The codebook currently runs to more than 6,000 words and is too long to reproduce here; however, interested readers can access it at on the Internet.11 To ensure the validity of our
11See <http://mjtier.people.wm.edu/intlpolitics/aid/>. Accessed 10 March 2005.
13
data we precoded projects for six months and consulted numerous environmental specialists in five different disciplines while constructing and revising these coding rules. We then coded each project twice with intercoder reliability in excess of 90 percent. Discrepancies were resolved by a senior member of the research team in consultation with the coders.
Each project in the database is categorized on a five-point ordinal scale that ranges from most damaging to most beneficial for the natural environment. The values that each project can take are dirty strictly defined (DSD), dirty broadly defined (DBD), neutral (N), environmental broadly defined (EBD), and environmental strictly defined (ESD).
DSD projects have a direct negative impact on the environment and are associated with
sixteen specific types of projects detailed in the codebook. DSD projects may strip the environment of irreplaceable natural resources, as in the case of extractive industries (such as mining or logging). Projects that severely pollute or degrade the environment also fall under DSD; examples include heavy industry, such as fertilizer, tire, and brick factories, and most energy sector loans (obvious exceptions include renewable energy projects and some efficiency-enhancing projects). By comparison, DBD projects have a moderate but negative impact on the environment, with thirty-nine types of projects specified in the codebook. Overwhelmingly, these finance agricultural projects.12 Other projects that appear frequently in this category include electrical transmission, fisheries, pharmaceuticals, and textiles.
Neutral (N) projects have no immediate impact on the environment. Thirty-one specific types of projects are listed in the codebook as typically neutral. Examples include anticorruption projects, export promotion, education, telecommunications, and disaster aid. Although we can imagine how export promotion could hurt the environment (depending on what is being exported) or how disaster relief could prevent environmental degradation, the environmental effects are typically indirect and not easily predictable.
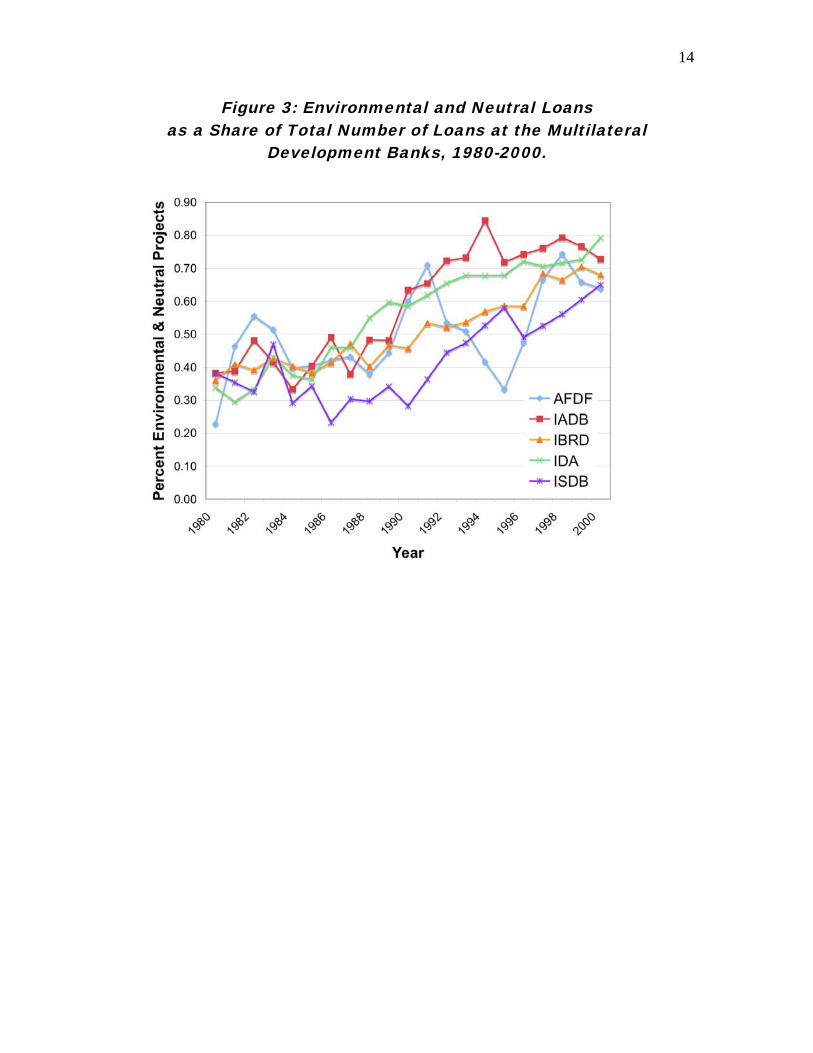
EBD projects generally have fewer obvious environmental benefits and tend to be more preventative than ESD projects. We specify seventeen distinct types of EBD projects, including nuclear safety and erosion-control projects, which do not immediately improve the environment. Instead, they insure against environmental disasters that nuclear power plants and erosion could cause. By contrast, ESD projects have an immediate positive impact on the environment, for example, projects designed to reduce air pollution, chloroflurocarbon (CFC) production, or carbon-dioxide emissions. The codebook specifies twenty-eight specific ESD project types. The patterns of environmental lending (ESD + EBD + Neutral / Total Number of Loans) are shown in Figure 3.
12While we recognize that different crops can have dramatically different environmental impacts,
for instance drought tolerant crops such as millet do less damage than cotton, which typically
requires large amounts of water and fertilizer. Future refinements of this coding scheme rely on
surveys of environmental scientists which will help us to place different crops (and industries) into specific categories.
14
Figure 3: Environmental and Neutral Loans
as a Share of Total Number of Loans at the Multilateral
Development Banks, 1980-2000.
15
If more than one bank co-financed a project, we coded each bank’s lending commitment as an individual loan. Since each bank’s portion had to be approved through its own institutional mechanisms, thus, in the sense most important to our argument, the commitments are effectively independent. While we treat each loan as an independent observation, we do not expect that a given loan to any given country is necessarily independent from other loans to the same country, but we do assume that the loans are independent across countries. Below we explain how these potential problems are addressed.
Independent Variables
We evaluate our hypothesis empirically by coding the following variables. Environmental Preferences. This variable represents our effort to quantify the
environmental interests of the member countries that are represented on the executive boards of the four MDBs under study.13 “Environmental Preferences” represents a proxy of countries’ environmental policy interest or environmental foreign aid scaled according to voting share and weighted by the degree to which the country might prove pivotal to potential voting coalitions in multi-country constituencies and, then, by the degree to which each executive director representing the various constituencies can prove pivotal to executive board votes.
Specifically, for each bank year we arrayed all countries in each constituency from
highest to lowest based on the combined proxy measure of preference for percentage of social loans. We then summed all possible values of the voting shares of countries adjoining one another, creating a matrix of all potential coalitions. For all of the coalitions where the sum of voting shares was greater than .50 of the constituency’s total vote, we computed the consequence to the potential coalition of each extreme partner’s defection. If the defection of a partner on one of the ends of the potential coalition would cause the coalition’s collapse (vote shares fell below a majority + 1), we counted this as an instance where the defecting country would prove “pivotal.”
We summed all such instances where the given country proved pivotal to a potential
coalition and gave each country a “pivotalness” score within the constituency. In general this meant that countries proved more pivotal where they had large vote shares and/or where their scores were near the center of the constituency’s continua for the social indices. We then weighted all countries’ social preference by the pivotalness score. Finally, we summed the products of all of the countries’ social index values multiplied by their pivotalness scores to produce an aggregate preference for social lending for each constituency by bank year. Using these values for each constituency, we then repeated this process for each executive board for each bank year.14 This produces an
13 Since voting shares differ for the two major branches of the World Bank – the IBRD and
the IDA – we computed each separately. 14 We developed a program to perform these calculations, written for both STATA and SAS, which is
available free of charge online at omitted for review.
16
environmental preference for each MDB for each year for each of the measures of environmental preferences.
Calculating voting share is relatively straightforward. Countries receive a share of
voting power on MDB executive boards that is weighted according to their financial contribution. Each bank publishes this information in their annual reports. However, we are not as interested in all countries’ vote shares as we are in any given country’s ability to build a voting coalition on issues before the Board. The problem is one of collective action.
Determining countries’ environmental preferences poses potentially greater
challenges. A promising and conventional method for determining government preferences toward the environment would measure actual environmental policy outcomes. Alternatively, one could measure aid-giving and receipts as a measure of policy preferences (Lyne, Nielson and Tierney 2006). Either fits the revealed-preferences approach (See Samuelson 1938, 1948; Varian 1982; Sippel 1997; Snidal 1985).
From environmental policy outcomes we inferred comparative environmental policy
preferences.15 This approach has the advantage of not presuming that public opinion is translated directly into government preferences.16 Instead, a country’s environmental interest is derived from observed outcomes after all relevant interest organizations and political institutions have filtered environmental demands.
Environmental Policy Index. For these reasons we constructed an environmental
policy index, modeled closely on the Environmental Sustainability Index project (Esty 2001).17 In constructing the index we gathered 1996 data for 122 countries on 22 distinct measures of environmental policy outcomes, ranging from atmospheric sulfur dioxide concentration to dissolved oxygen levels in freshwater to number of reporting commitments kept as part of the Convention on International Trade in Endangered Species. Data on these variables were gathered from World Development Indicators (2000) and World Resources, various years.
We standardized the measures, aggregated them into 17 indicators (air pollution,
water pollution, biodiversity, etc), and then averaged them to generate the environmental
15 We thank Robert Keohane for this suggestion. 16 It has the concomitant disadvantage of assuming that countries with poor environmental
records are relatively disinterested in producing sound environmental policy. Countries with
environmentally disadvantageous geographies are thus punished in the index. We understand this
limitation. However, the wide variety of variables and indicators used to construct the index should mitigate most of the problems stemming from difficulties in one, or a few, environmental
areas. The empirical alternative seems less justifiable in our minds. Measures of environmental
public opinion face the strong disadvantage that we do not know if opinion is politically meaningful unless it translates into outcomes.
17 This project is a joint effort by researchers at the Yale Center for Environmental Law and
Policy (YCELP) and Columbia University’s Center for International Earth Science Information
Network (CIESIN) in collaboration with the Environment Task Force of the World Economic Forum, Davos, Switzerland.
17
policy index. We used this 1996 index as a baseline from which we calculated a pooled time series for all countries with voting shares in MDBs from 1980-2000 (the largest set was 179 countries in the IBRD for 2000), allowing index scores to vary over time. Our environmental policy index is a comparative measure of environmental sustainability, not an absolute measure. The higher a country’s score on our index, the more sustainable are its environmental outcomes compared to the 179 countries in the index in 1996. Hence, this offers us a relative measure of environmentalism, which varies over time.18 These index scores were weighted according to countries’ voting shares, and then summed for each year for each MDB, creating an overall environmental voting score for each bank year. Figure 2 displays the time trend for each of the four institutions. For details on the construction of the index, see the Appendix.
Environmental Foreign Aid. To provide an alternative measure of environmental
preferences, we measure environmental foreign aid (EFA), using proportions of foreign aid targeted to environmental purposes for each donor and recipient, which will arguably reflect the environmental foreign policy preferences of governments more directly. Specifically, we calculate the percentage of the total loans that fall into either the ESD or EBD categories as a share of total loans. Alternatively, as a third measure of environmental preferences, we also include the proportion of projects in ESD, EBD, and Neutral categories as share of the total. We assume that those governments interested in giving or receiving more bilateral environmental aid will lobby for similar policies on MDB executive boards. Of course, we recognize that even if bilateral aid is a reasonable proxy for donor country preferences, it may reflect the interests of recipient nations less well, since recipients may have less influence over the type of bilateral grants they receive than they have over the loan contracts that they negotiate with MDBs. The trends for Environmental Preferences measured through foreign aid at the MDBs are shown in Figure 4.
Objections might be raised about either measure of preferences, and thus we employ
both here. If we find similar results using both measures, this lends greater confidence to our argument.
Lender. We generated dummy variables for each institution in the sample, with the
IBRD and the IDA being coded separately. This is particularly helpful because no set of dummy variables must ever include all of the possible categories or intractable collinearity will result. We thus report estimates for IBRD, ADB and IDB, leaving the effects of IDA to be captured in the intercept. One can think of these dummy variables as capturing the residual effects of differences in institutions and organization that are not encompassed by environmental voting and vote concentration.
18 We are collecting data on 22 distinct variables for all the countries with voting shares in
each of the four MDBs for every year from 1980-1999.

18
Figure 4: MDB Environmental Preferences
(Environmental + Neutral Aid Percentage), 1980-2000
Control Variables. In addition to these independent variables that stem from our
argument, we also included a relatively large set of control variables. Log of GDP and GDP Per Capita are standard comparative measures and control for the size of a given country’s economy and its relative wealth, respectively. Following the conventional wisdom, environmental loans should grow more frequent and larger as each of the measures increases.19
We also include a set of controls that probe the need that given borrower countries
might have for environmental loans. We include Organic Water Pollution to control for water pollution.20
Forestation, or net change in hectares in the extent of forest lands, provides a control for the destruction of natural ecosystems. Threatened Birds controls for biodiversity under habitat and/or overhunting stress.21 Sanitation controls for the
19 These numbers came from World Development Indicators 2000 (WDI). 20 These data came from WDI. 21 For both deforestation and threatened biodiversity, bank officers might be interested in
large-scale losses even if they do not represent a significant share of total forests or biodiversity, as in the cases of Brazil or Indonesia. Or, they might be interested in preserving natural resources
in places where the number of hectares or species threatened is small compared to other countries,
but is large relative to totals in that country, as in the case of Costa Rica or Rwanda. Thus, we
include both measures. Data for these last four variables were gathered from World Resources
(various years).
19
demand for sewerage and water projects. Infant Mortality controls for environmental health problems that commonly increase the death rate for children. Fertility Rate provides a measure of the stress that increased population may place on the environment. Agricultural Value Added may help control for the pressures that farming places on the environment. Finally, CITES Commitments Kept provides a proxy for the degree of sensitivity countries may show toward international pressure from environmental interests.22 Savings, Log of Population, and Exports/GDP are conventional economic controls that may systematically affect lending portfolios.
Methods and Results
Independent of the method employed here, we have reason to believe that not all of our observations are independent from all others. In particular, we suspect that given loans for any specific country are not independent from other loans for that same country. It is unlikely that we would be able to control for all the common factors that lead to MDB lending for a given country even if our list of control variables were longer. This problem will likely violate ordinary least squares and maximum likelihood estimation assumptions. In an attempt to correct for this potential problem, we employ cluster estimation in all three models by grouping observations within countries. This technique re-estimates the standard errors and re-computes the variance-covariance matrix (though not the coefficients) while relaxing the assumption that observations are independent within groups.23 The results reported thus include robust standard errors.
In the econometric analysis, we employed ordered logit regression on more than
7,500 MDB loans from all five banks (seven institutions). We seek to assess the probability that a given loan will fall into one of the five ordered categories: DSD, DBD, N, EBD, ESD. This problem employs a discrete, ordinal dependent variable and is conducive to ordered logit regression analysis.
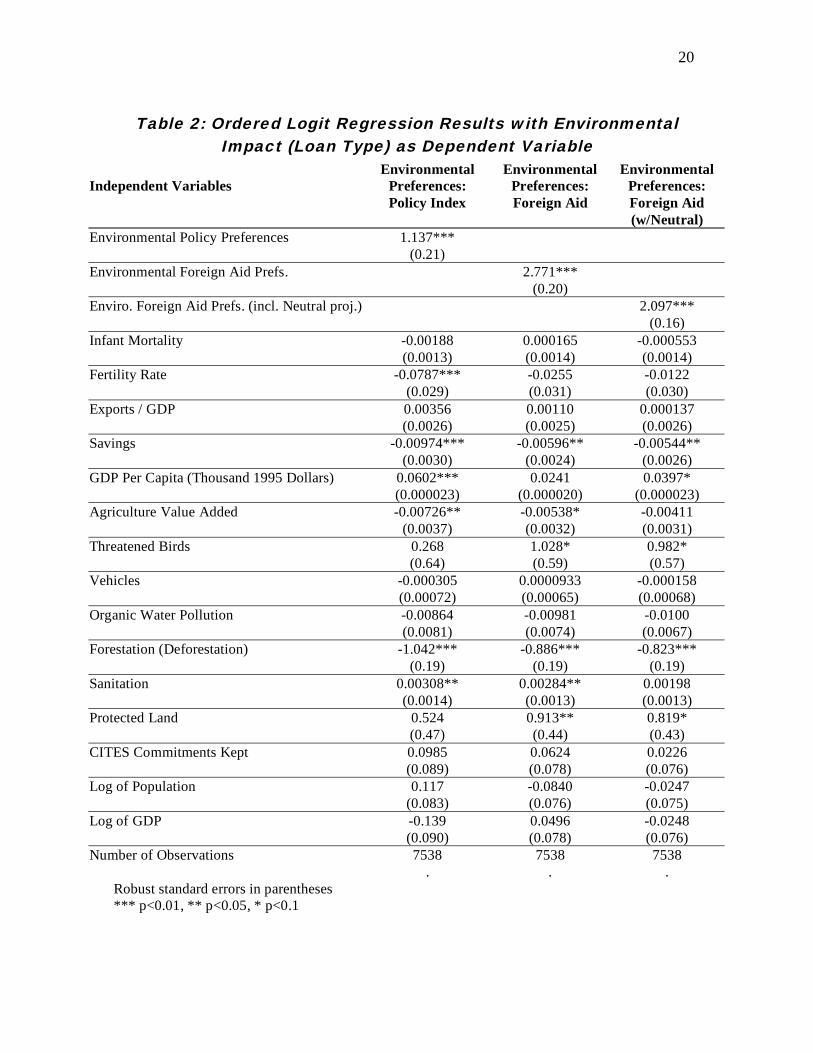
The results are displayed in Table 2. Here we find support for our key hypothesis
regarding preference formation in a collective principal. Environmental Preferences was positively and significantly (at the .001 level) related to Environmental Impact for all three measures of the independent variable: EPI, environmental foreign aid percentage, and environmental plus neutral aid proportion.
The ordered logistic results can also be used to predict probabilities for environmental
loans. These results suggest that an upward shift of a single standard deviation (.14) in Environmental Preferences using the EPI is associated with a decrease in the probability of dirty loans of 4.6 percent, an increase in the probability of neutral loans of 2.5 percent, and an increase in the probability of environmental loans of 1.6 percent.
22 Data for these last controls also came from WDI. 23 Although it still assumes that observations are independent between groups – an
assumption that we believe is reasonable given this data. We also assume that observations are
independent from year to year. The controls for total number of loans per year, total lending per
year and year should capture most residual temporal autocorrelation that escapes the cluster technique.
20
Table 2: Ordered Logit Regression Results with Environmental
Impact (Loan Type) as Dependent Variable
Environmental Environmental Environmental
Independent Variables Preferences: Preferences: Preferences:
Policy Index Foreign Aid Foreign Aid
(w/Neutral)
Environmental Policy Preferences 1.137***
(0.21)
Environmental Foreign Aid Prefs. 2.771***
(0.20)
Enviro. Foreign Aid Prefs. (incl. Neutral proj.) 2.097***
(0.16)
Infant Mortality -0.00188 0.000165 -0.000553
(0.0013) (0.0014) (0.0014)
Fertility Rate -0.0787*** -0.0255 -0.0122
(0.029) (0.031) (0.030)
Exports / GDP 0.00356 0.00110 0.000137
(0.0026) (0.0025) (0.0026)
Savings -0.00974*** -0.00596** -0.00544**
(0.0030) (0.0024) (0.0026)
GDP Per Capita (Thousand 1995 Dollars) 0.0602*** 0.0241 0.0397*
(0.000023) (0.000020) (0.000023)
Agriculture Value Added -0.00726** -0.00538* -0.00411
(0.0037) (0.0032) (0.0031)
Threatened Birds 0.268 1.028* 0.982*
(0.64) (0.59) (0.57)
Vehicles -0.000305 0.0000933 -0.000158
(0.00072) (0.00065) (0.00068)
Organic Water Pollution -0.00864 -0.00981 -0.0100
(0.0081) (0.0074) (0.0067)
Forestation (Deforestation) -1.042*** -0.886*** -0.823***
(0.19) (0.19) (0.19)
Sanitation 0.00308** 0.00284** 0.00198
(0.0014) (0.0013) (0.0013)
Protected Land 0.524 0.913** 0.819*
(0.47) (0.44) (0.43)
CITES Commitments Kept 0.0985 0.0624 0.0226
(0.089) (0.078) (0.076)
Log of Population 0.117 -0.0840 -0.0247
(0.083) (0.076) (0.075)
Log of GDP -0.139 0.0496 -0.0248
(0.090) (0.078) (0.076)
Number of Observations 7538 7538 7538
. . .
Robust standard errors in parentheses *** p<0.01, ** p<0.05, * p<0.1
21
The results for the other two measures of Environmental Preferences, environmental aid percent and environmental plus neutral aid percent, are even more dramatic. An increase of a standard deviation of .12 and .16, respectively, is associated with 8.3 and 7.3 percent decreases in the probabilities of dirty loans, 4.9 and 4.4 percent decreases in the probabilities of neutral loans, and 3.0 and 3.4 percent increases in the probabilities of environmental loans. These last results suggest substantive as well as statistical significance.
Results for the control variables are mixed to weak. Only Savings and Forestation are
significantly and consistently related to Environmental Impact of MDB projects. The probability of more environmental loans decreases as each factor rises, all else equal, suggesting that environmental loans go to countries with relatively lower savings and higher deforestation rates. None of the other controls are significantly related to Environmental Impact in a consistent fashion, though GDP per capita, Agriculture Value Added, Threatened Birds, Sanitation, and Protected Land are each significant in two of the three specifications. More threatened birds, better sanitation, and greater protected land area all increased the probabilities of environmental loans; greater agricultural content in the economy decreased the odds of environmental loans.
Conclusion
We are encouraged by the evidence we have encountered in support of hypotheses related to this common agency application. In the suggestive case of environmental reform at the multilateral development banks, the frequency of environmental loans was positively and significantly associated with the environmental preferences of predicted coalitions of member states on executive boards.
This article takes merely an early step in developing and applying a model of
collective delegation. More advanced theoretical work must take place in fleshing out the strategic dynamics of principal-agent relations given the compounded problem of common agency associated with IOs. Theorists need to consider that principal-agent relations are two-way and reciprocal. Simple models implying that principals fully dominate agents, which we hope we have not replicated here, are inadequate to address the complex relationship between member states and international organizations.
Moreover, additional empirical work ought to be accomplished. Multilateral
development banks, while important, form only one category of IOs potentially subject to a principal-agent logic. Intriguing possibilities present themselves for addressing multilateral trade organizations, security alliances, human rights institutions, environmental accords and the European Union. In all, however, we see this early step as relatively successful at advancing a promising analytic tool into a new arena in political science.
22
References
Aggarwal, Vinod, ed. 1998. Institutional Design for a Complex World. Ithaca: Cornell University Press.
Allison and Zelikow. 1999. Essence of Decision: Explaining the Cuban Missile Crisis. (Boston: Addison-Wesley).
Acharya. 2001.
Ascher, William. 1992. “The World Bank and US Control,” in M. Karns and K. Mingst (eds.) The United States and Multilateral Institutions: Patterns of Changing
Instrumentality and Influence. (London: Routledge: 115-140).
Barnett, Michael N. and Martha Finnemore. 1999. “The Politics, Power, and Pathologies of International Organizations.” International Organization 54, 4 (Autumn): 699-732.
Barnett, Michael and Martha Finnemore. 2004. Rules for the World: International Organizations in World Politics. Cornell University Press.
Bernheim, B. Douglas and Michael D. Whinston. 1986. “Common Agency.” Econometrica 54, 4 (July): 923-942.
Bueno de Mesquita, Bruce, Alastair Smith, Randolph M. Siverson, and James D. Morrow. 2003. The Logic of Political Survival . Cambridge: MIT Press.
Burnham, James B. 1994. “Understanding the World Bank: A Dispassionate Analysis,” in ed. Doug Bandow and Ian Vasquez, Perpetuating Poverty: The World Bank, the
IMF, and the Developing World. Washington DC: The Cato Institute.
Brent. 1999.
Copelovitch, Mark. 2006. “Master or Servant? Agency Slack and the Politics of IMF Lending.” APSA Paper.
Dixit, Avinash, Gene Grossman and Elhanan Helpman. 1997. “Common Agency and Coordination: General Theory and Application to Government Policy Making.” Journal of Political Economy 105 (4): 752-769.
Dixit, Grossman and Helpman. 1999.
Esty, Daniel C. 2001. 2001 Environmental Sustainability Index: An Initiative of the
Global Leaders of Tomorrow Environmental Task Force, World Economic Forum.
New Haven, CN: Yale Center for Environmental Law and Policy.
23
Finnemore, Martha. 1993. “International Organizations as Teachers of Norms: The United Nations Educational, Scientific, and Cultural Organzation and Science Policy.” International Organization 47 (4): 565-597.
Finnemore, Martha. 1996. National Interests in International Society. Ithaca, NY: Cornell University Press.
Fox, Jonathan and David Brown. 1998. The Struggle for Accountability: The World
Bank, NGOs, and Grassroots Movements (Cambridge, Massachusetts: MIT Press).
Garrett, Geoffrey and George Tsebelis. 1996. “An Institutional Critique of Intergovernmentalism,” International Organization. v50 n2 p269-299.
Gourevitch, Peter. 2003. “Corporate Governance: Global Markets, National Politics,” in David Lake and Miles Kahler, eds. Governance in a Global Economy: Political
Authority in Transition. Princeton University Press.
Haftendorn, Keohane and Walander. 1999. Imperfect Unions: Security Institutions
Over Time and Space. Oxford: Oxford University Press.
Hammond, Thomas and Jack Knott. 1996. “Who Controls the Bureaucracy? Presidential Power, congressional Dominance, Legal Constraints, and Bureaucratic Autonomy in a Model of Multi-institutional Policy-Making.” Journal of Law, Economics and
Organization 12 (1): 119-166.
Hardin, Russell. 1982. Collective Action. Baltimore, MD: Johns Hopkins University Press.
Hawkins, Darren, David Lake, Daniel Nielson, and Michael Tierney. 2006. Delegation
and Agency in International Organizations. Cambridge: Cambridge University Press.
Inglehart. 1998
Keohane, Robert and Lisa Martin. 1999. “Institutional Theory, Endogeneity, and Delegation.” Paper prepared for Lakatos Methodological Seminar. Scottsdale, AZ. January 15, 1999.
Keohane, Robert and Lisa Martin. 1995. “The Promise of Institutionalist Theory.” International Security 20:39-51.
Keohane, Robert. 1984. After Hegemony: Cooperation and Discord in the World
Political Economy. Princeton NJ: Princeton University Press.
Kiewiet, D. Roderick, and Mathew D. McCubbins. 1991. The Logic of Delegation:
Congressional Parties and the Appropriations Process. Chicago: University of Chicago Press.
24
Korten, Frances F. 1992. “Environmental Loans: More Harm than Good?” Paper presented at the 5th Annual Conference of the Northwest Consortium for Southeast Asian Studies, Vancouver, British Columbia, October 18, 1992.
Krasner, Stephen D. 1985. Structural Conflict: The Third World against Global
Liberalism. Berkeley, CA: University of California Press.
Krehbiel, Keith. 1988. “Spatial Models of Legislative Choice.” Legislative Studies
Quarterly 3: 259-319.
Lake, David and McCubbins, Mathew. 2006. “The Logic of Delegation to International Organizations.” In Hawkins, et al. eds., Delegation and Agency in International
Organizations. Cambridge: Cambridge University Press.
Lake, David and Robert Powell. 1999. Strategic Choice and International Relations. Princeton, NJ: Princeton University Press.
Laver, Michael and Norman Schofield. 1991. Multiparty Government: The Politics of
Coalition in Europe. New York: Oxford University Press.
Leahy, Patrick. 1997. Congressional Record, November 13, 1997, S12530.
Lyne, Mona. 2003. “Rethinking Economic Development and Democratic Accountability: The Voters Dilemma, Institutions, and Citizen-Politician Linkages.” In Citizen-Politician Linkages in Democratic Politics, eds. Herbert Kitschelt and Steven Wilkinson.
Lyne, Mona and Michael Tierney. 2002. “Variation in the Structure of Principals: Conceptual Clarification for Research on Delegation and Agency Control.” Paper presented at Utah Conference on Delegation to International Organizations, May 2002.
Lyne, Mona, Daniel Nielson, and Michael Tierney. 2006. “A Problem of Principals: Common Agency and Social Lending at Multilateral Development Banks,” APSA Meeting, Philadelphia, PA, September 2006.
Lyne, Mona, Daniel Nielson, and Michael Tierney. 2006a. “Who Delegates? Alternative Models of Principals in Development Aid.” In Hawkins, et al. eds., Delegation and
Agency in International Organizations. Cambridge: Cambridge University Press. Maltzman, Forrest. 1998. Competing Principals: Committees, Parties, and the
Organization of Congress. Ann Arbor, MI: University of Michigan Press.
Martin, Lisa and Beth Simmons. 1998. “Theories and Empirical Studies of International Institutions.” International Organization 52, 4: 729-57.
25
Martin, Lisa L. 1992. Coercive Cooperation: Explaining Multilateral Economic
Sanctions. Princeton, NJ: Princeton University Press.
Martin, Lisa. 2006. “Distribution, Information, and Delegation to International Organizations: The Case of IMF Conditionality.” In Hawkins, et al. eds., Delegation
and Agency in International Organizations. Cambridge: Cambridge University Press.
Mayhew, David R. 1974. Congress: The electoral connection. New Haven, Connecticut: Yale University Press.
Mearsheimer, John. 1990. “Back to the Future: Instability in Europe After the Cold War.” International Security 15: 5-57.
Mearsheimer, John. 1994/95. “The False Promise of International Institutions.” International Security 19: 5-49.
Miller and Moe. 1983. “Bureaucrats, Legislators and the Size of Government.” American Political Science Review. 77 (June): 297-322.
Miller-Adams, Michelle. 1999. The World Bank: New agendas in a changing world. London: Routledge.
Milner, Helen. 1998. “Rationalizing Politics: The Emerging Synthesis of International, American and Comparative Politics.” International Organization 52 (4): 759-86.
Milner, Helen V. 1997. Interests, Institutions and Information: Domestic Politics and
International Relations. Princeton, NJ: Princeton University Press.
Milner, Helen. 1988. Resisting Protectionism: Global Industries and the Politics of
International Trade Princeton, NJ: Princeton University Press.
Nielson, Daniel L. and Michael J. Tierney. 2003. “Delegation to International Organizations: Agency Theory and World Bank Environmental Reform,” International Organization.
Niskanen, William A. 1971. Bureaucracy and Representative Government. Chicago, IL: University of Chicago Press.
Olson, Mancur. 1965. The Logic of Collective Action and the Theory of Groups.
Cambridge, MA: Harvard University Press.
Olson, Mancur. 1971.
Oye, Kenneth A. 1986. Cooperation Under Anarchy. Princeton, NJ: Princeton University Press.
Mark A. Pollack. 1997. “Delegation, Agency and Agenda Setting in the European Community.” International Organization 51 (1): :99-134.
26
Mark A. Pollack. 2002. “Learning from the Americanists (Again): Theory and Method in the Study of Delegation.” West European Politics 25 (1): 200-219.
Pollack, Mark. 2003. The Engines of European Integration: Delegation, Agency, and
Agenda Setting in the EU. Oxford: Oxford University Press.
Rich, Bruce. 1994. Mortgaging the Earth: The World Bank, Environmental
Impoverishment, and the Crisis of Development. Boston, MA: Beacon Press.
Richardson, Louise. 1999. “The Concert of Europe and Security Management in the Nineteenth Century.” In Haftendorn et al, Imperfect Unions: Security Institutions over
Time and Space. Oxford University Press.
Risse-Kappen, Thomas. 1996. Collective Identity in a Democratic Community: The Case of NATO. In P.Katzenstein, ed. The Culture of National Security.
Roeder, Phil. 1993. Red Sunset: The Failure of Soviet Politics. Princeton, NJ: Princeton University Press.
Samuelson, J.A. 1938. “A Note on the Pure Theory of Consumer’s Behavior.” Economica 5 (17): 61–71.
Samuelson, J.A. 1948. “Consumption Theory in Terms of Revealed Preference.” Economica 15 (60): 243–253.
Sippel, Reinhard. 1997. “An Experiment on the Pure Theory of Consumer’s Behavior.” The Economic Journal 107 (444): 1431–44.
Snidal, Duncan. 1985a. “The Game Theory of International Politics.” World Politics 38 (1): 25–57.
Snidal, Duncan. 1985b. “The Limits of Hegemonic Stability Theory.” International
Organization v. 39, no. 4: 579-614.
Varian, H.R. 1982. “The Nonparametric Approach to Demand Analysis.” Econometrica 50 (4): 945–73.
Vaubel, Roland. 2006. “Principal-Agent Problems in International Organizations.” Review of International Organizations 1 (2): 125-138.
Vaubel, Roland. 1994. The Political Economy of Centralization and the European Community. Public Choice 81(1-2): 151-190.
Wade, Robert. 1997. Greening the Bank: The Struggle over the Environment, 1970-1995. In The World Bank: Its First Half Century, vol. 2: Perspectives, edited by D. Kapur, J. Lewis and R. Webb, Washington, D.C.: Brookings Institution Press.
World Bank. 1995. Mainstreaming the Environment. Washington, DC: World Bank.
27
World Bank. 1997. Environment Matters, Annual Review. Washington, DC: World Bank.
World Bank. 2001. World Development Indicators. Washington, DC: World Bank.
World Resources Institute. 2000. World Resources. Washington, DC: World Resources Institute.
28
Appendix:
Constructing a Pooled Time-Series Index
of Environmental Policy
The most sophisticated and successful attempt to look at environmental outcomes
cross-nationally is the Environmental Sustainability Index (ESI), an initiative of the Environment Task Force of the Davos, Switzerland-based World Economic Forum (Esty 2001). A set of researchers at the Yale Center for Environmental Law and Policy (YCELP) and Columbia University’s Center for International Earth Science Information Network (CIESIN) have collaborated in collecting environmental data on 122 countries for 2001. The broad index that results encompasses 67 different variables grouped into 22 overall indicators. It is by far the most significant effort to date to develop a comparative measure of environmental outcomes cross-nationally. A detailed description of the process used to construct the ESI is found in the 2001 Environmental Sustainability
Index. However, the ESI exists only for a single year and its intent does not precisely match ours.
The ESI is probing a broader question than the one that interests us. We are concerned with revealed policy preferences, not overall environmental sustainability – some part of which is not affected by government policy. Thus, we were compelled to remove from consideration the variables where we felt a credible argument could not be made that they were the product, at least to a significant degree, of government policies. This eliminated several possible indicators, such as water quantity (a function of geography) and private-sector responsiveness (largely market driven). We also eliminated the indicator for international environmental financing, feeling that this indicator would create endogeneity problems for our model.
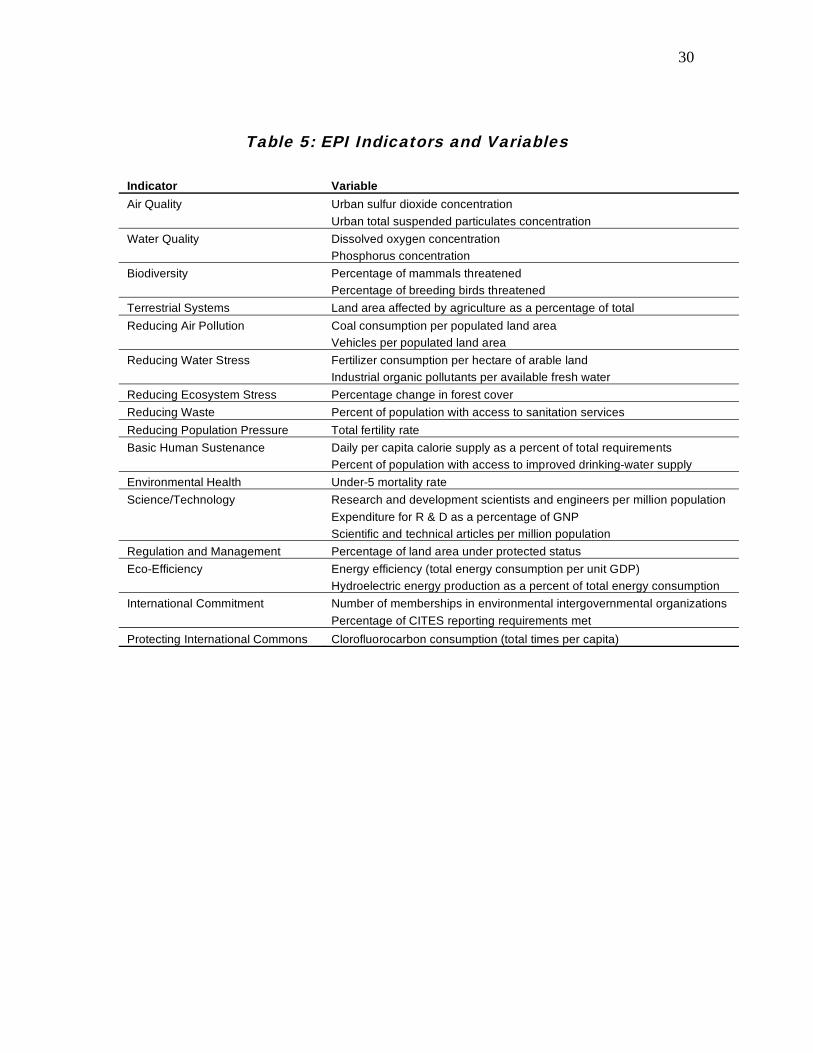
After dropping from consideration these three indicators, we gathered data. Time series data on 26 of the underlying variables, involving 16 of the 22 indicators, exist for the key MDB donor countries.24 Using these variables and indicators, a partial ESI can thus be reconstructed over time for the countries in question.25 A list of the indicators and their constituent variables appears in Table 5.
There do not exist absolute standards of environmental sustainability from which we can judge a given country’s position in a given year. The ESI and our index are entirely
24 Each ESI indicator encompasses multiple variables. For example, the variables of
dissolved oxygen levels, phosphorus concentration, electrical conductivity and suspended solids were aggregated into the indicator of water pollution. We preserved this approach where
possible. However, given the lack of time series data availability for many of the ESI variables,
seven of our indicators are composed of a single variable alone, and are not composites. 25 Our partial index is reasonably consistent with the full ESI for 2001, with an overall
correlation coefficient of 0.56. All of the indicators in our partial index are highly and
significantly related to their ESI counterparts. More important than having the two measures be
perfectly consistent, however, is the fact that our index varies over time, allowing us to track the response in lending patterns to changing environmental interests of MDB donor countries.
29
relative and comparative measures. Thus, we needed a baseline year. The year 1996 was the last year for which the largest amount of necessary data was available. (While many of the variables were available through 1999, some were last collected in 1996.) This became our baseline year. Following the steps suggested by the ESI team, we collected data for all 122 ESI countries for 1996. Where data were missing, again following the ESI procedures, we imputed them from values on variables that were significantly related, in the statistical sense, to the variables with the missing values. We transformed highly skewed variables (skewness values in excess of 5) using the base-10 log. Next, we truncated distributions to the 95-percent range, setting all values above the 97.5 percentile and below the 2.5 percentile to those threshold values. We then standardized the variables by computing a z-score (value minus mean divided by standard deviation). These became our baseline indicators, which we then employed in calculating index scores in the time series.
We collected the time series data from two primary sources: the World Bank’s World
Development Indicators 2000 and World Resources (various years), which is published by the World Resources Institute. For the time series, we imputed missing values by two methods. First, if the time series data showed a discernable time trend, we imputed missing values by fitting a polynomial to the existing values. If a time trend was absent, we imputed missing values using the impute command in the statistical program, Stata 7.0, based on the values for other variables that were found to be significantly related to the variable with the missing values. For each variable in the time series, we followed the same procedure listed above: transforming skewed variables, truncating them to the 95 percent range, and standardizing them with z-scores. The difference with the time series was that we used the 97.5 threshold, the 2.5 percentile value, the mean and the standard deviation from the 1996 baseline in computing the z scores for each variable.
Again following the ESI procedure, for all country years we then averaged the variables’ z scores constituting each indicator. Next, we averaged all of the indicators for each country year. Finally, we computed the overall percentile rank for each country year. But we computed the country year’s percentile rank as if it had appeared in 1996, according to the baseline. This allows the index scores to vary over time.
30
Table 5: EPI Indicators and Variables
Indicator Variable
Air Quality Urban sulfur dioxide concentration
Urban total suspended particulates concentration
Water Quality Dissolved oxygen concentration
Phosphorus concentration
Biodiversity Percentage of mammals threatened
Percentage of breeding birds threatened
Terrestrial Systems Land area affected by agriculture as a percentage of total
Reducing Air Pollution Coal consumption per populated land area
Vehicles per populated land area
Reducing Water Stress Fertilizer consumption per hectare of arable land
Industrial organic pollutants per available fresh water
Reducing Ecosystem Stress Percentage change in forest cover
Reducing Waste Percent of population with access to sanitation services
Reducing Population Pressure Total fertility rate
Basic Human Sustenance Daily per capita calorie supply as a percent of total requirements
Percent of population with access to improved drinking-water supply
Environmental Health Under-5 mortality rate
Science/Technology Research and development scientists and engineers per million population
Expenditure for R & D as a percentage of GNP
Scientific and technical articles per million population
Regulation and Management Percentage of land area under protected status
Eco-Efficiency Energy efficiency (total energy consumption per unit GDP)
Hydroelectric energy production as a percent of total energy consumption
International Commitment Number of memberships in environmental intergovernmental organizations
Percentage of CITES reporting requirements met
Protecting International Commons Clorofluorocarbon consumption (total times per capita)