Embed Size (px)
Citation preview

Primary author: Kern-Hansen, Claus (DMI - Danish Meteorological Institute, Data and Climate Division), [email protected] Abstract ID: 1O1 From observation to climatological informations Founded in 1872 with the purpose to “observe the weather, disseminate these observations (to the public) and conduct research with in the field of scientific meteorology” the Danish Meteorological Institute has a long history in data-collection and -management.
From the very beginning the climatological data-management was highly prioritized.
The Climatological Department operated the Climatological Network and issued the Climatological Reports. Such a focus lasted for more than 100 years.
However as the scientific meteorology and technology developed in the decades after the Second World War, the overall focus shifted towards the new possibilities in the use of computers and numerical weather prediction. Leading to a less profound role for climatology and climatological data-management.
With the digitization of observations on a regular basis (late 1950’ies/beginning 1960’ies) and the installation of a digital database, new options were present and the focus shifted from traditional climatology to the utilization of weather observations in climatological reports and statistics.
With a historical touch the presentation will address the major issues and challenges of the climatological data management at DMI within the last decades and the present situation and challenges.
From observation to
climatological information (national overview, Denmark)
Claus Kern-HansenHead of Data & Climate Divison

Intentions of the presentation
to give you
a little flavour of the history of climate data and management in Denmark
snapshots of the present day situation and topics which will be covered in depth the coming days,
a view of some of the major challenges for the years to come
The answer to the Question ? – what does the weight of 10 elephants has to do with Danish observations and climate data ?

Intentions of the presentation
to give you
a little flavour of the history of climate data and management in Denmark
snapshots of the present day situation and topics which will be covered in depth the coming days,
a view of some of the major challenges for years to come
The answer to the Question ? – what does the weight of 10 elephants has to do with Danish observations and climate data ?
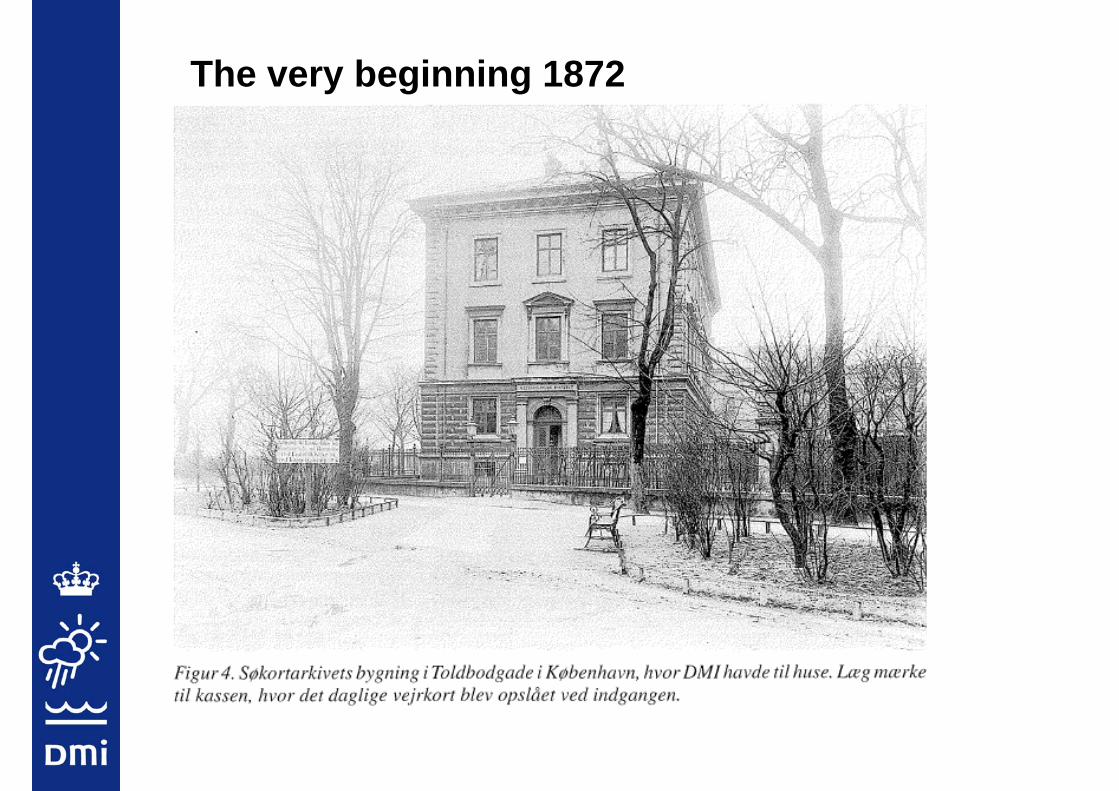
The very beginning 1872

3 areas of focus
observe the weather
disseminate these observations (to the public)
conduct research with in the field of “scientific meteorology”
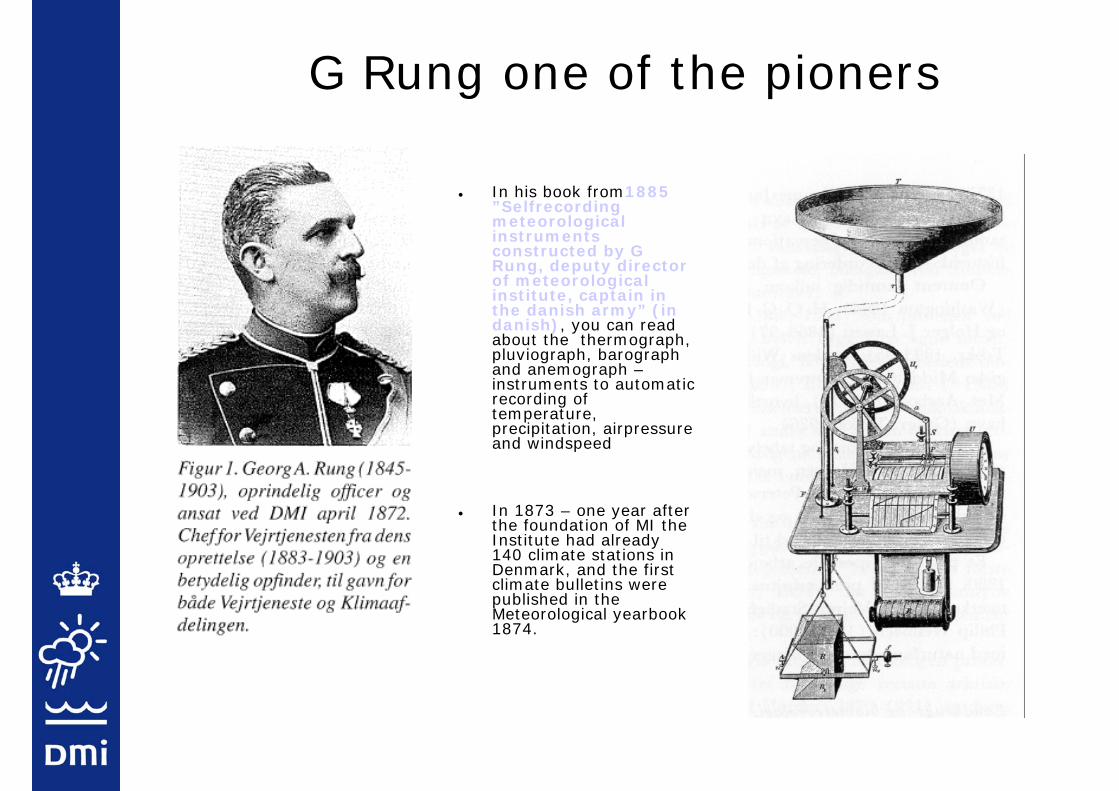
G Rung one of the pioners
In his book from1885 ”Selfrecordingmeteorological instruments constructed by G Rung, deputy director of meteorological institute, captain in the danish army” (in danish), you can read about the thermograph, pluviograph, barograph and anemograph –instruments to automatic recording of temperature, precipitation, airpressureand windspeed
In 1873 – one year after the foundation of MI the Institute had already 140 climate stations in Denmark, and the first climate bulletins were published in the Meteorological yearbook 1874.

The History of the Danish Meteorological Services
1872: Establishment of the Meteorological Institute (1)(under the Naval Ministry)
1926: Establishment of the Aeronautical Meteorological Service (2)(under the Civil Aviation Administration)
1953: Establishment of the Danish Defence Weather Service (3)(under the Danish Armed Forces)
1990: The Weather Services fusion -> DMI (1+2+3) and are placedunder the Ministry of Transport
Today DMI is under the Ministry of Climate & Energy

Pre-Meteorological Institute (before 1872)
In 1751 meteorological observations in the Round Tower in Copenhagen were initiated.
But only data from 1767 and onwards are usable as measures of the outside air temperature ……
(you will get the answer on Friday….)From 1751 to 1766 the thermometer was situated inside a room in the little observatory on the top of the tower (!)In 1767 the thermometer was situated outside the observatory facing north.
DMI are in possession of the meteorological observations from the Round Tower from the period 1767 – 1819. From 1818 meteorological observations from the old Botanical Garden in Copenhagen also are available.
However as the scientific meteorology and technology developed in the decades after the Second World War, the overall focus shifted towards the new possibilities in the use of computers and numerical weather prediction. Leading to a less profound role for climatology and climatological data-management.
With the digitization of observations on a regular basis (late 1950’ies/beginning 1960’ies) and the installation of a digital databases, new options were present and the focus shifted from traditional climatology to the utilization of weather observations in climatological reports and statistics.

The hightech computerinstal-lation at DMI 1983
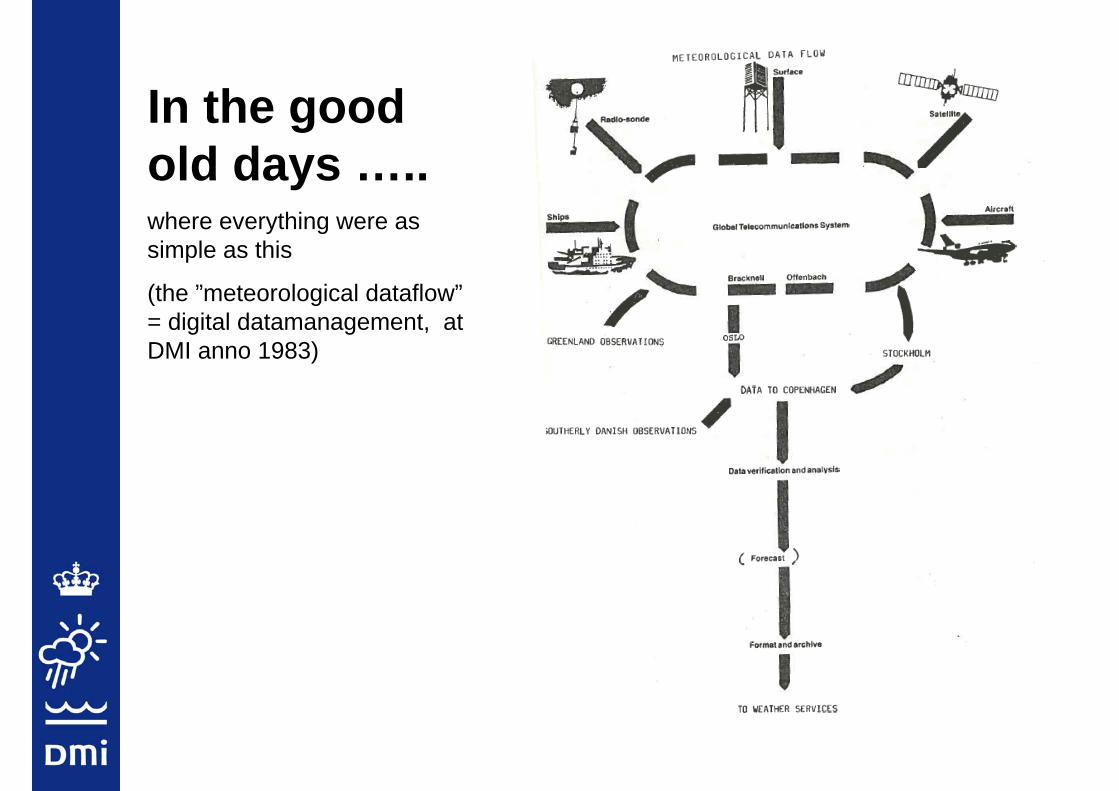
In the good old days …..where everything were as simple as this
(the ”meteorological dataflow”= digital datamanagement, at DMI anno 1983)
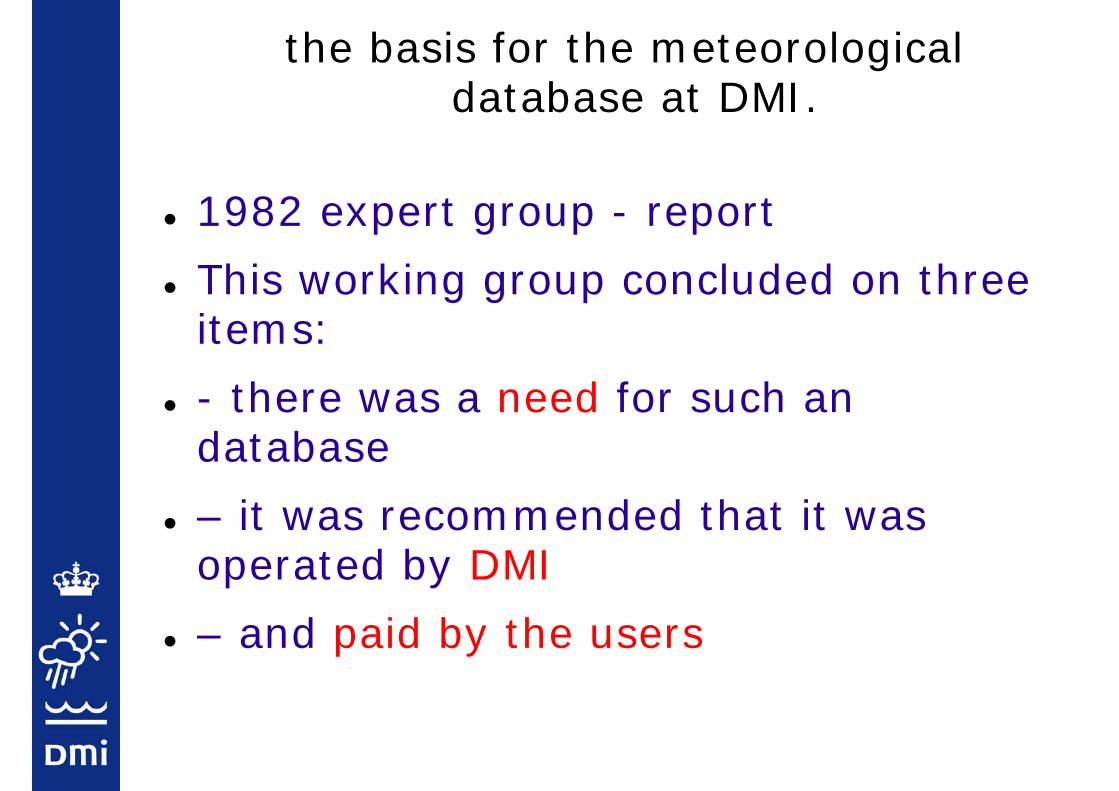
the basis for the meteorological database at DMI.
1982 expert group - report
This working group concluded on three items:
- there was a need for such an database
– it was recommended that it was operated by DMI
– and paid by the users

Landsvejretfra
DMIMansag: idag bliver det rigtig dejlig koldtTirsdag: imorgen bliver detrigtig dejlig koldtOnsdag: i overmorgen bliverdet rigtig dejlig koldt.Torsdag: og på torsdag bliverdet rigtig rigtig dejlig koldt
+2
+5
User driven (and financed )

Org. historyclimatedata:
Climatologicaldepartment
DataProcessing
DeptDatabase
DeptWeather Service
dept
Database Sektion
Weather& Climateinformation
1872… ….…….~1987--------------------1990’ies-------------1997-----------2006--->
Obs service -> 19801980’’iesies:Organization according to purpose (climate, weather, aeronautic, oceanographic..)⇒Different station networks, routines, techniques and data management
• manual instrumentation (or none evaluative)
Obs service i 1980 & 90 and 1980 & 90 and 0000’’ies ies :One unified observation department Modernisation of the station network, data management and data storage.
First Electronic database
•Automatic stations & and Remote sensing (radar satellite)
Obs service today.today.
Completing the automatisation of station networkProject on new unified databasesFocus on increased sampling frequency Incorporating remote sensing
Data & techdept
Data &Climate
Intentions of the presentation
to give you
a little flavour of the history of climate data and management in Denmark
snapshots of the present day situation and topics which will be covered in depth the coming days,
a view of some of the major challenges for years to come
The answer to the Question ? – what does the weight of 10 elephants has to do with Danish observations and climate data ?

Org. historyclimatedata:
Climatologicaldepartment
DataProcessing
DeptDatabase
DeptWeather Service
dept
Database Sektion
Weather& Climateinformation
1872… ….…….~1987--------------------1990’ies-------------1997-----------2006--->
Obs service -> 19801980’’iesies:Organization according to purpose (climate, weather, aeronautic, oceanographic..)⇒Different station networks, routines, techniques and data management
• manual instrumentation (or none evaluative)
Obs service i 1980 & 90 and 1980 & 90 and 0000’’ies ies :One unified observation department Modernisation of the station network, data management and data storage.
First Electronic database
•Automatic stations & and Remote sensing (radar satellite)
Obs service today.today.
Completing the automatisation of station networkProject to unification of databases Focus on increased sampling frequency Incorporating remote sensing
Data & techdept
Data &Climate
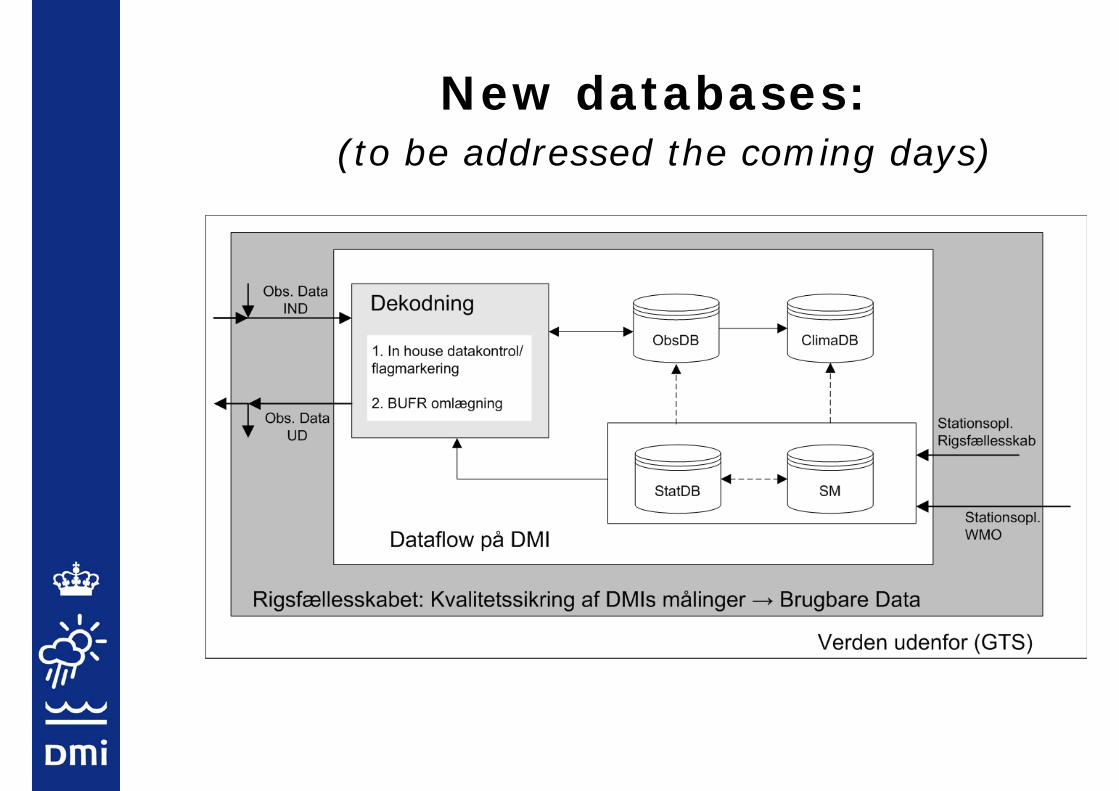
New databases:(to be addressed the coming days)

Mapping of datatypes at DMI (2002)
”..,.more that 50 og 100 different types of meteorological in-data…
…as output more that 400 different products are generated
….the number of operational databases are around 15
……unknown number of analoge data archives

New databases:(to be addressed the coming days)
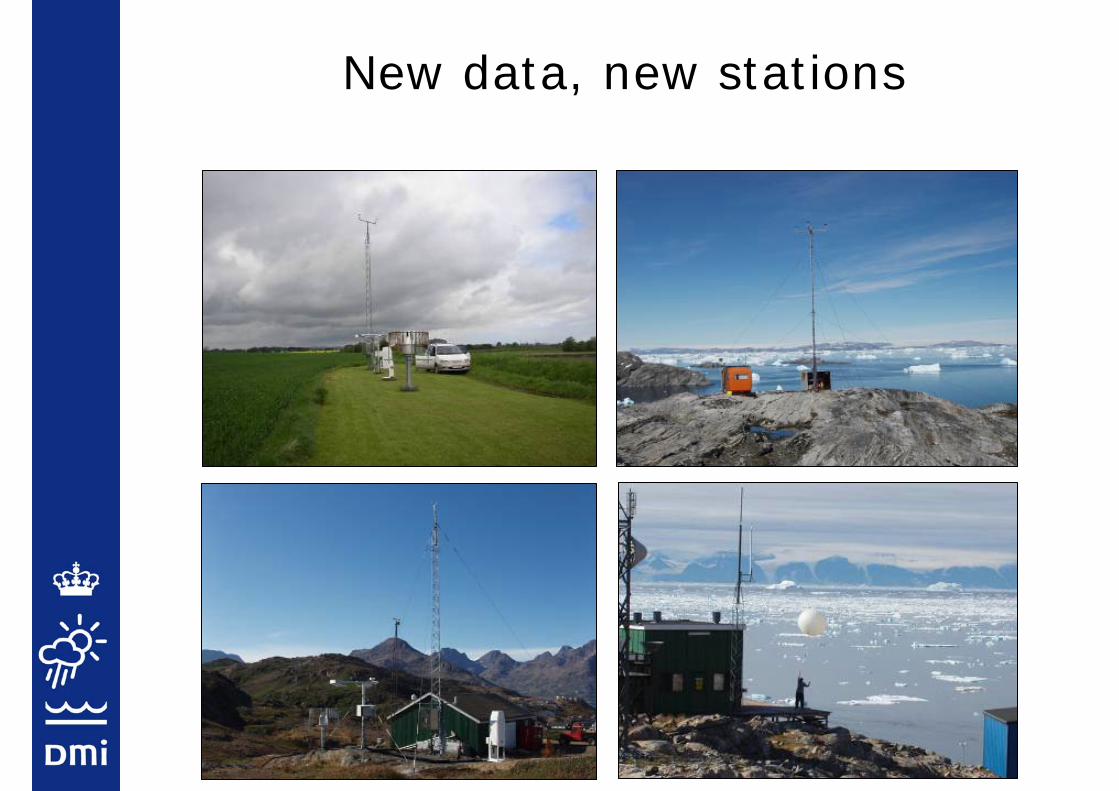
New data, new stations

DATA FROM STATIONS
OTHER THAN NMSs
Greenland-Denmark-U.S. Joint CommitteeEnvironment, Science, Technology and Health Working GroupReport to the PlenaryWashinton May 8, 2008May 8, 2008::
'
The U.S. (NASA) will enhance the capabilities of its GC-NET, in cooperation with the PROMICE project (Greenlandic ASIAQ and Danish GEUS and DTU) and the Danish Meteorological Institute so that data from the instruments can be transmitted in real time to the WMO
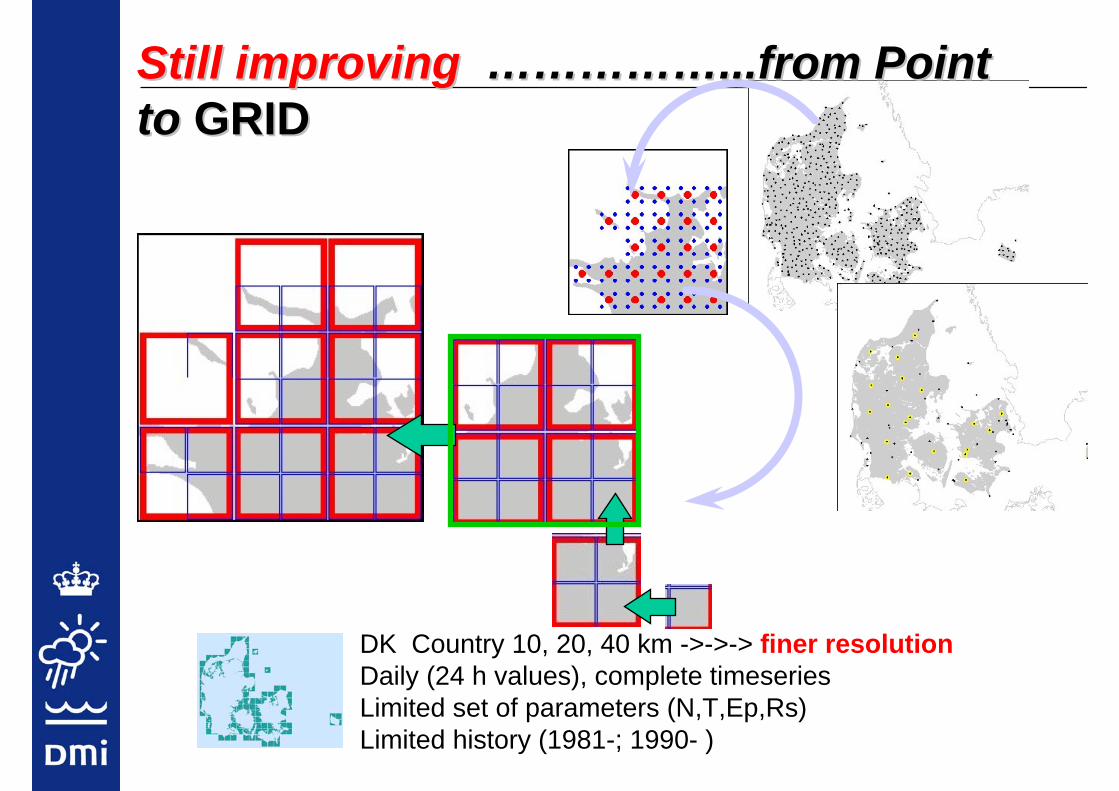
Still Still improvingimproving …………………………...from Point...from Pointtoto GRIDGRID
DK Country 10, 20, 40 km ->->-> finer resolutionDaily (24 h values), complete timeseriesLimited set of parameters (N,T,Ep,Rs) Limited history (1981-; 1990- )
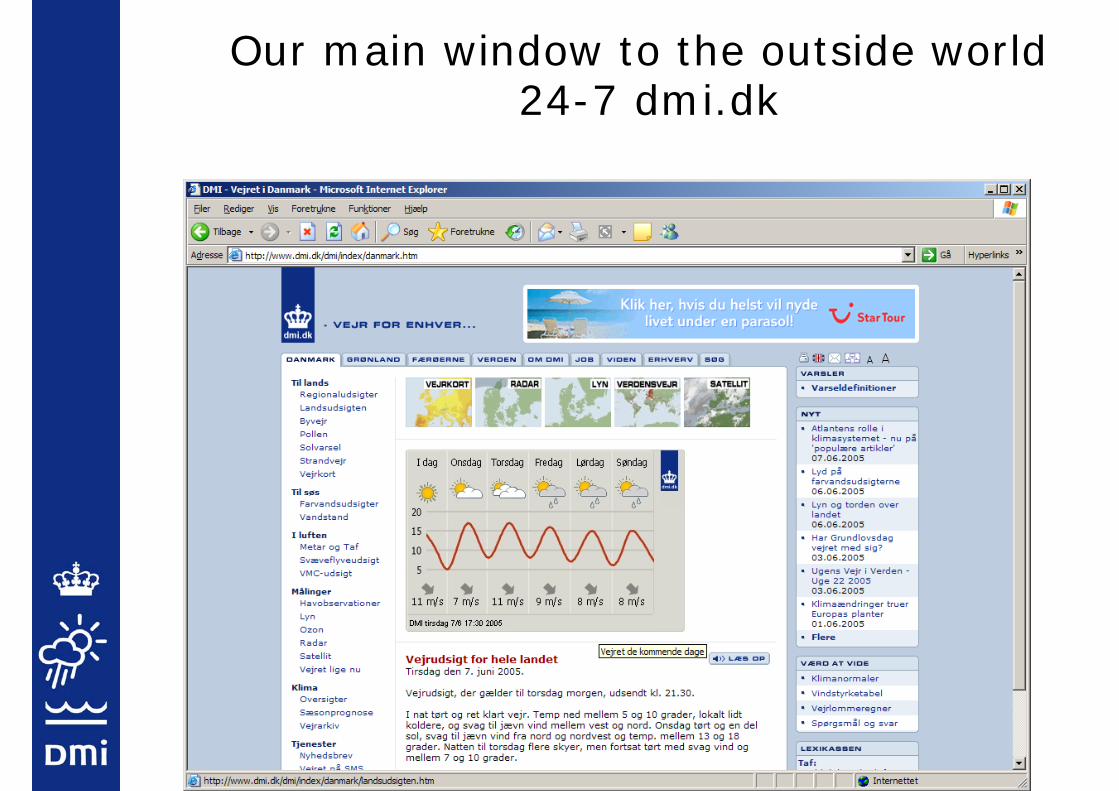
Our main window to the outside world24-7 dmi.dk

Ever increasing requirementsPresentation…presentation…presentation
(without sacrificing the scientific & technical quality)
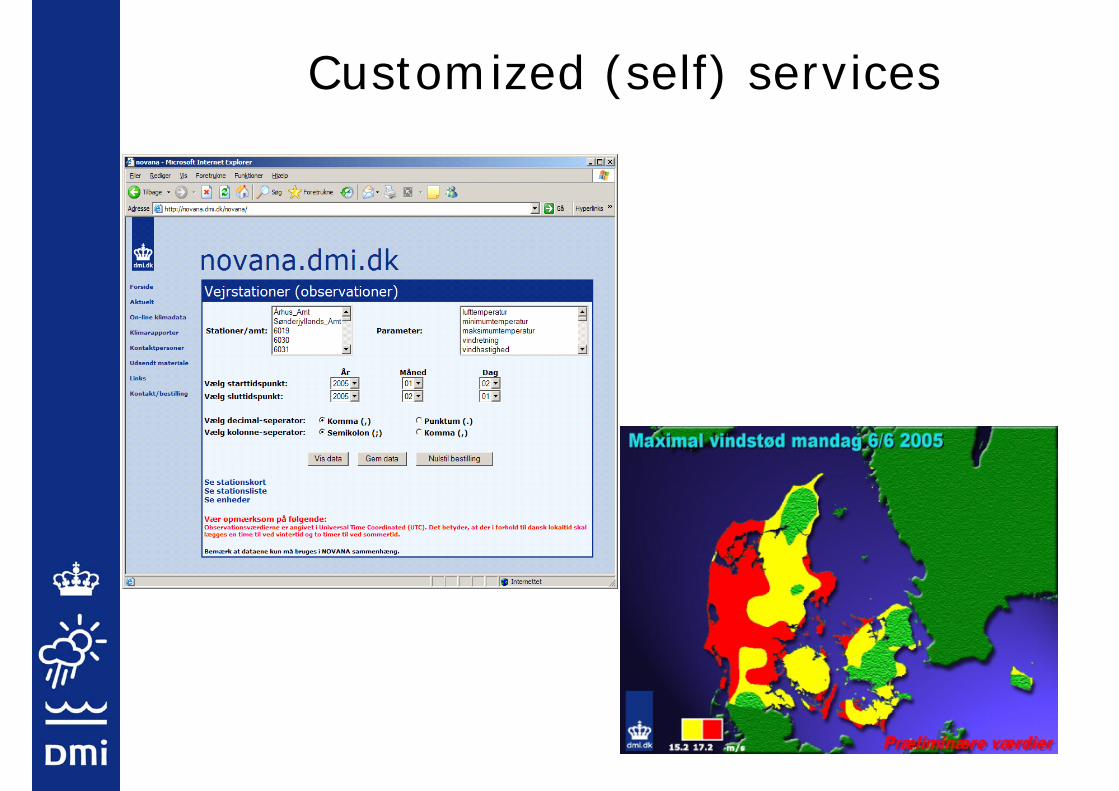
Customized (self) services

Maintaining and constantly updating the climatological
overview
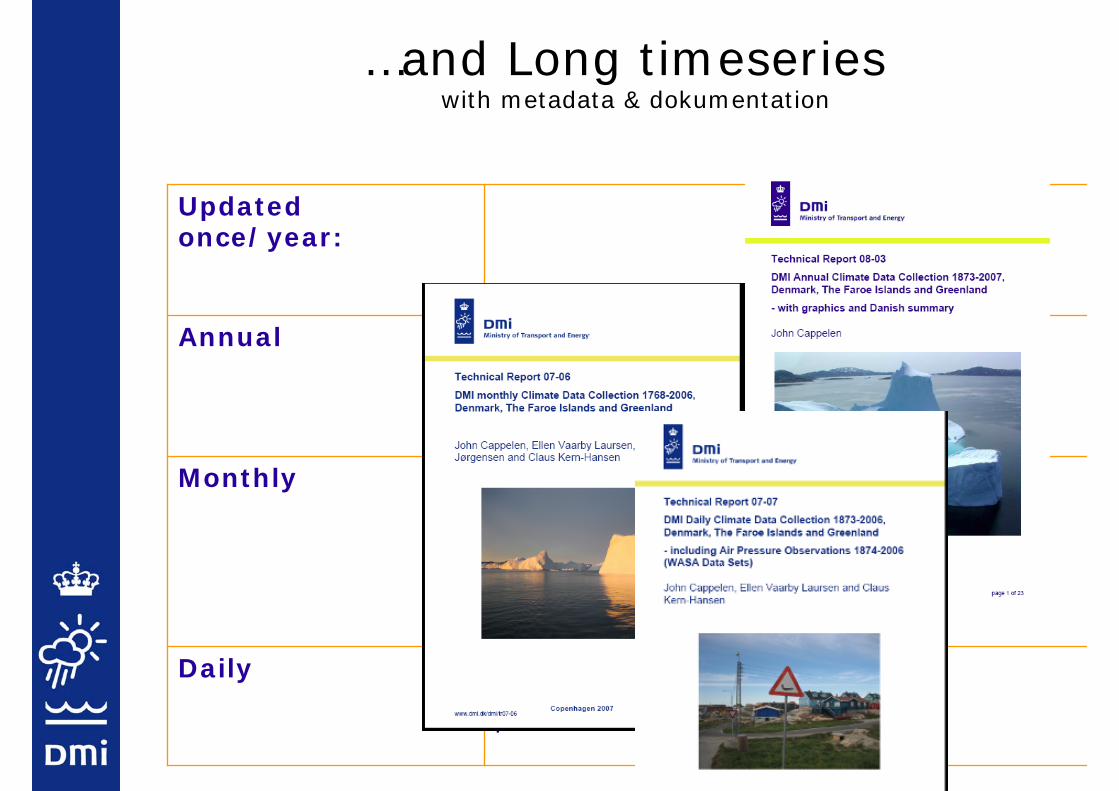
…and Long timeserieswith metadata & dokumentation
1873 (1)
1897 (1)
Tx Tm Precip
pressure
Daily
1873/1895 (6)
1961 (1)
1948 (1)
1924 (1)
T, Tx Tm, Precip
Pressure, days withsnowcover cloud
Monthly
1873 (4 stations)
1895 (1 station)
1948 (2 stations)
Mean temperatureAnnual
Updatedonce/year:
The ”core values” of climate data management
We serve the present
We pre-serve for the future

Intentions of the presentation
to give you
a little flavour of the history of climate data and management in Denmark
snapshots of the present day situation and topics which will be covered in depth the coming days,
a view of some of the major challenges for the years to come
The answer to the Question ? – what does the weight of 10 elephants has to do with Danish observations and climate data ?
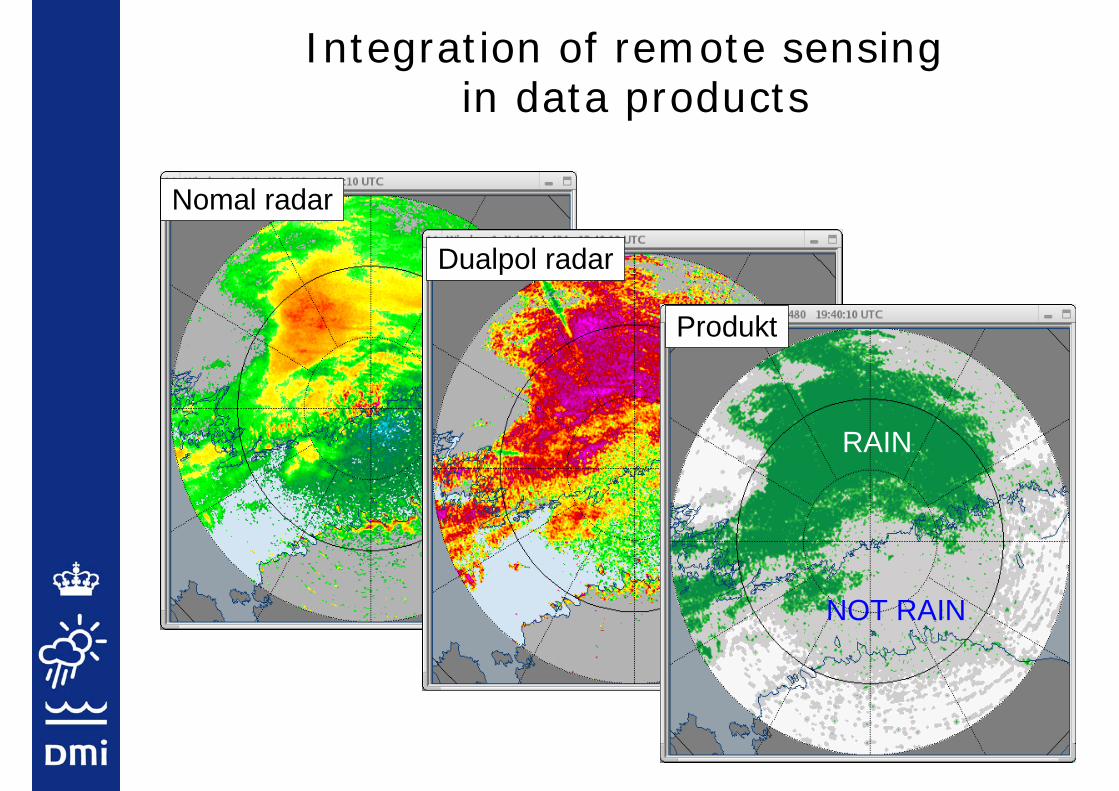
Integration of remote sensingin data products
Nomal radar
Dualpol radar
RAIN
NOT RAIN
Produkt
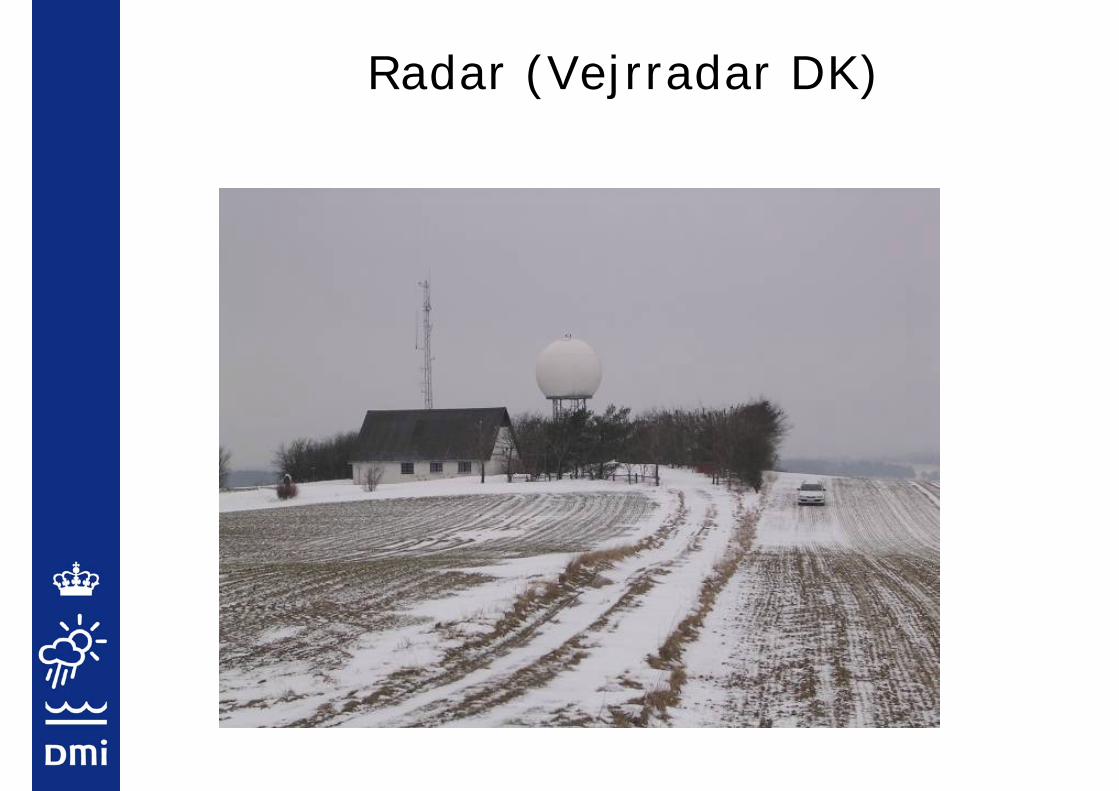
Radar (Vejrradar DK)

Cirklerne angiver en afstand på120 km. fra radaren, svarende til en højde over jorden på ca. 2 km. ved cirklens kant
Weather radar coverage anno 2009
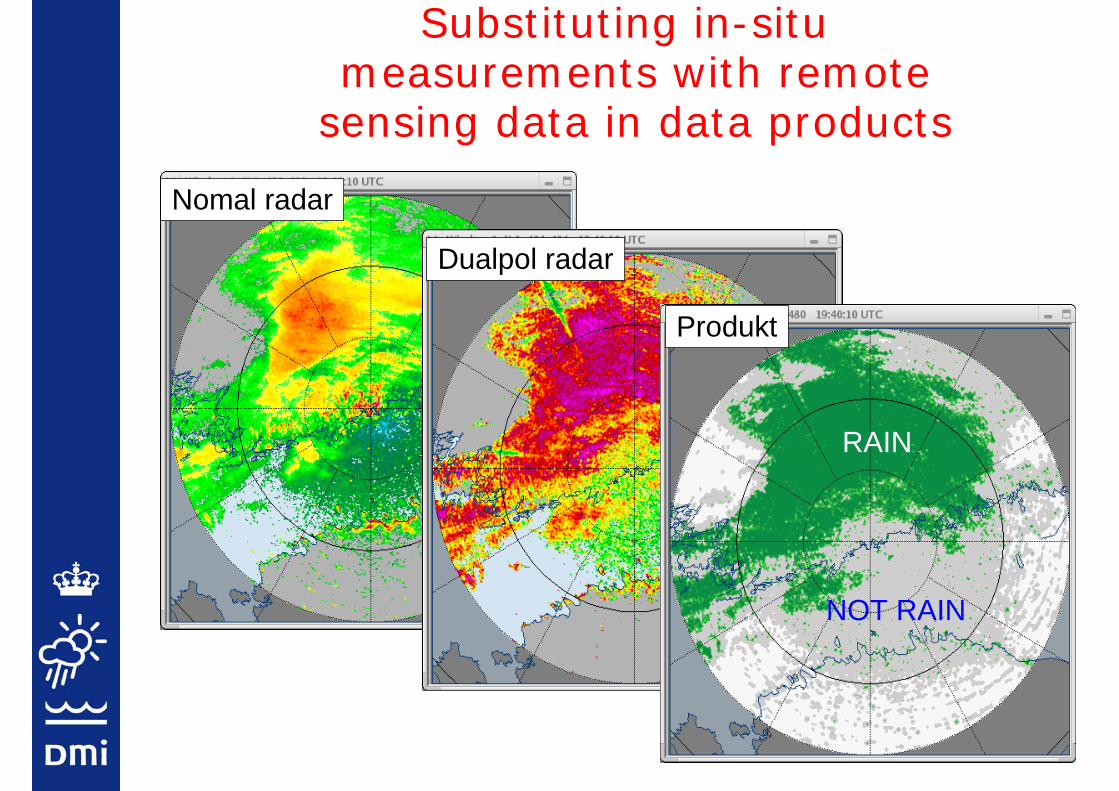
Substituting in-situmeasurements with remote
sensing data in data products
Nomal radar
Dualpol radar
RAIN
NOT RAIN
Produkt
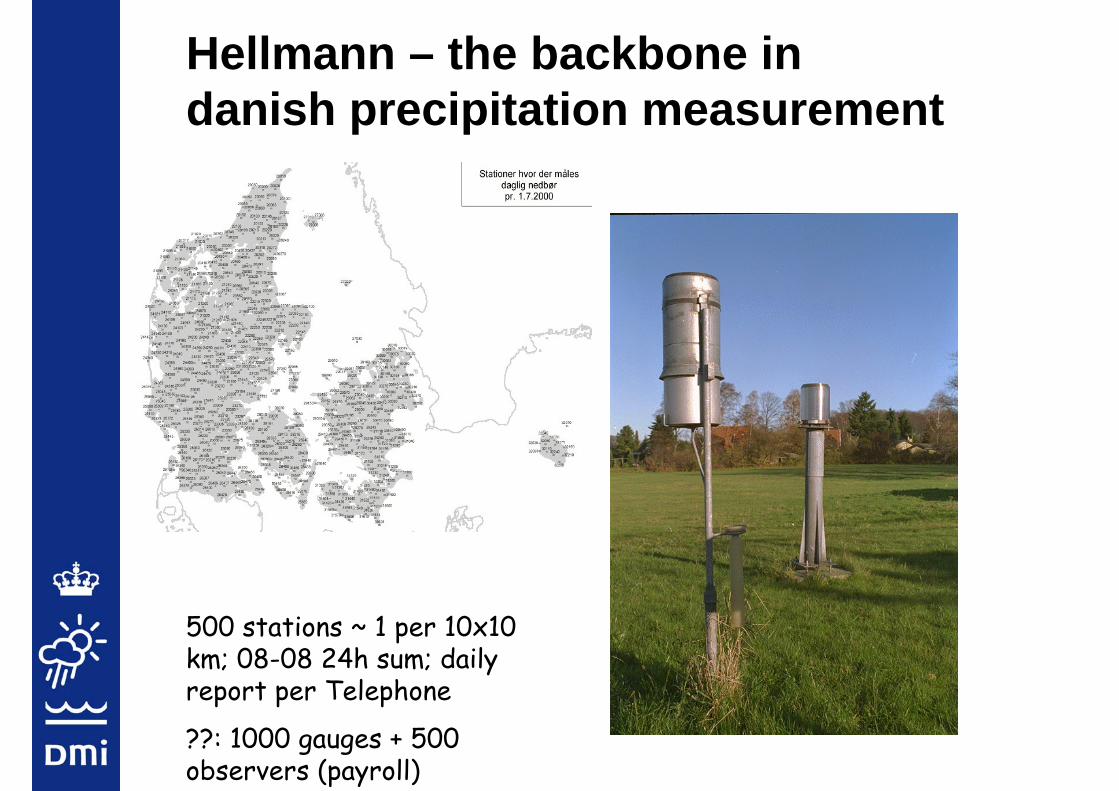
Hellmann – the backbone in danish precipitation measurement
500 stations ~ 1 per 10x10 km; 08-08 24h sum; dailyreport per Telephone
??: 1000 gauges + 500 observers (payroll)
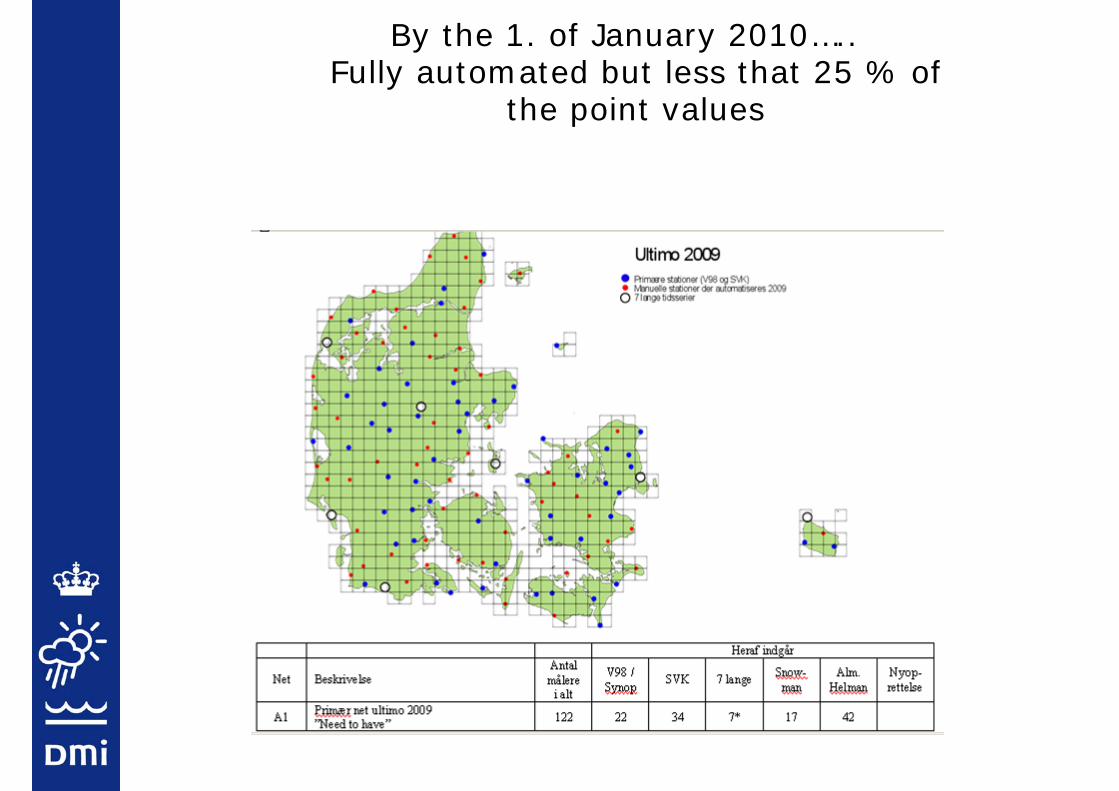
By the 1. of January 2010…..Fully automated but less that 25 % of
the point values

Utilization of SAFs and other satellite data products in the
climate data productsMeteosat billeder modtages på DMI hver 15. minut fra EUMETSAT
Satellitbilleder bliver behandlet påDMI og anvendt af meteorologerne og i vejrmodellerne

From ”Climatological data” to Climate change indicators
From ”Climatological data” to Climate change indicators
International (like GCOS; ECA&D, WMO…..
as well as
At a National level (new Danish national program for climate change monitoring)
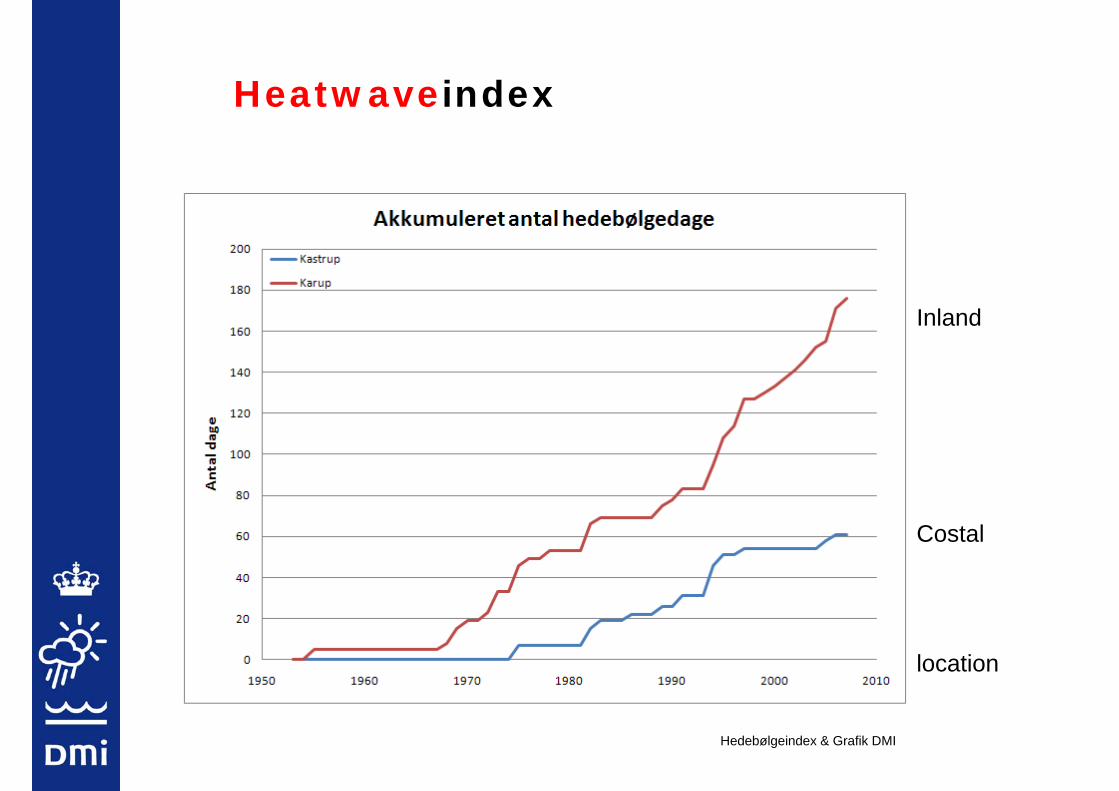
Heatwaveindex
Inland
Costal
location
Hedebølgeindex & Grafik DMI
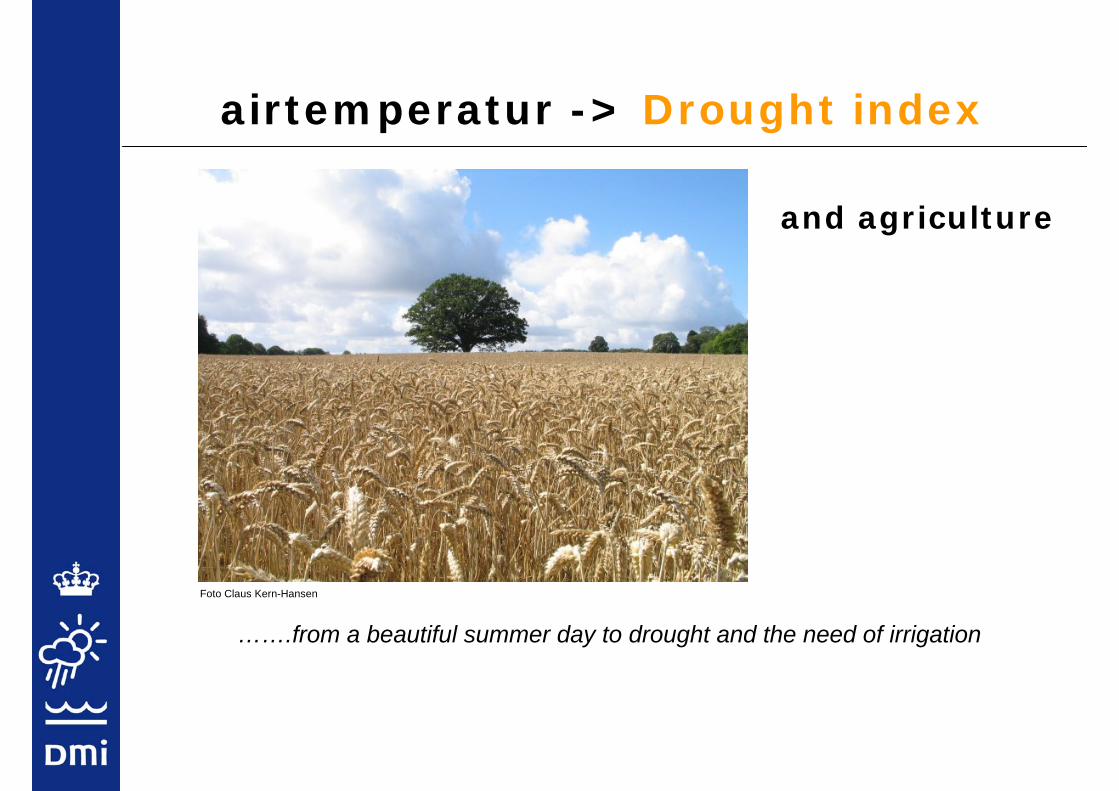
airtemperatur -> Drought index
…….from a beautiful summer day to drought and the need of irrigation
Foto Claus Kern-Hansen
and agriculture
Headlines…..
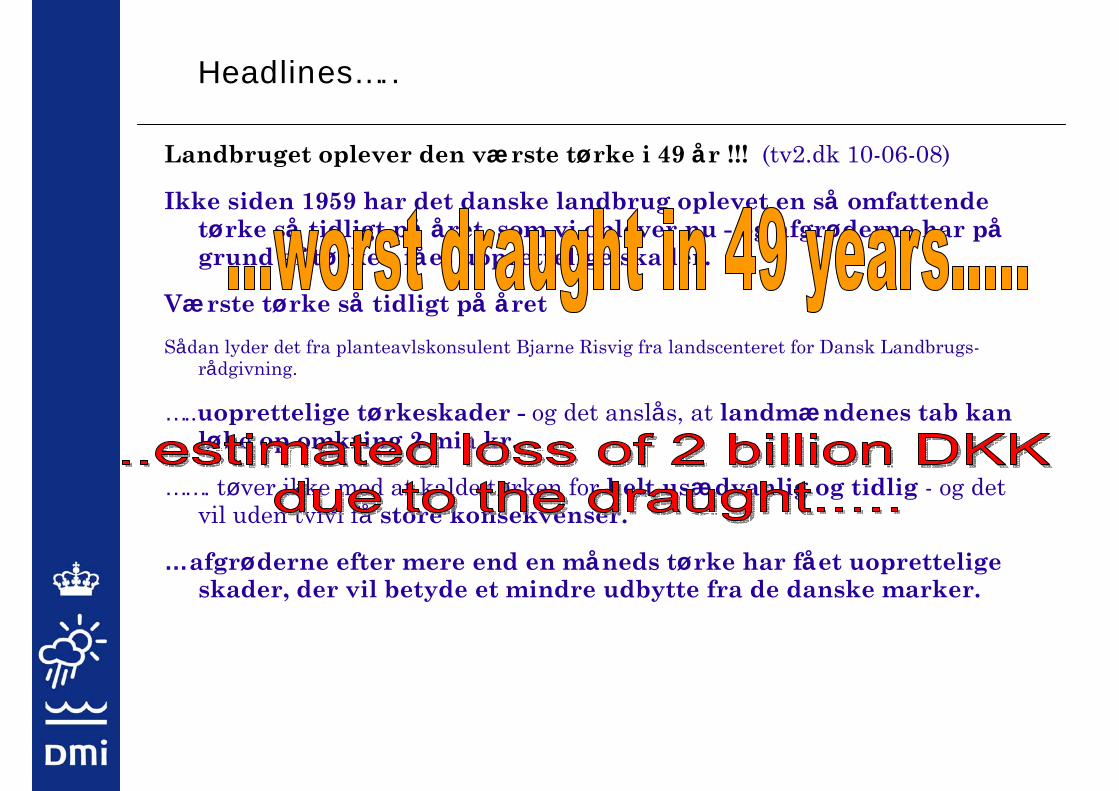
Landbruget oplever den værste tørke i 49 år !!! (tv2.dk 10-06-08)
Ikke siden 1959 har det danske landbrug oplevet en så omfattende tørke så tidligt på året, som vi oplever nu - og afgrøderne har pågrund af tørken fået uoprettelige skader.
Værste tørke så tidligt på åretSådan lyder det fra planteavlskonsulent Bjarne Risvig fra landscenteret for Dansk Landbrugs-
rådgivning.
…..uoprettelige tørkeskader - og det anslås, at landmændenes tab kan løbe op omkring 2 mia kr.
……. tøver ikke med at kalde tørken for helt usædvanlig og tidlig - og det vil uden tvivl få store konsekvenser.
…afgrøderne efter mere end en måneds tørke har fået uoprettelige skader, der vil betyde et mindre udbytte fra de danske marker.
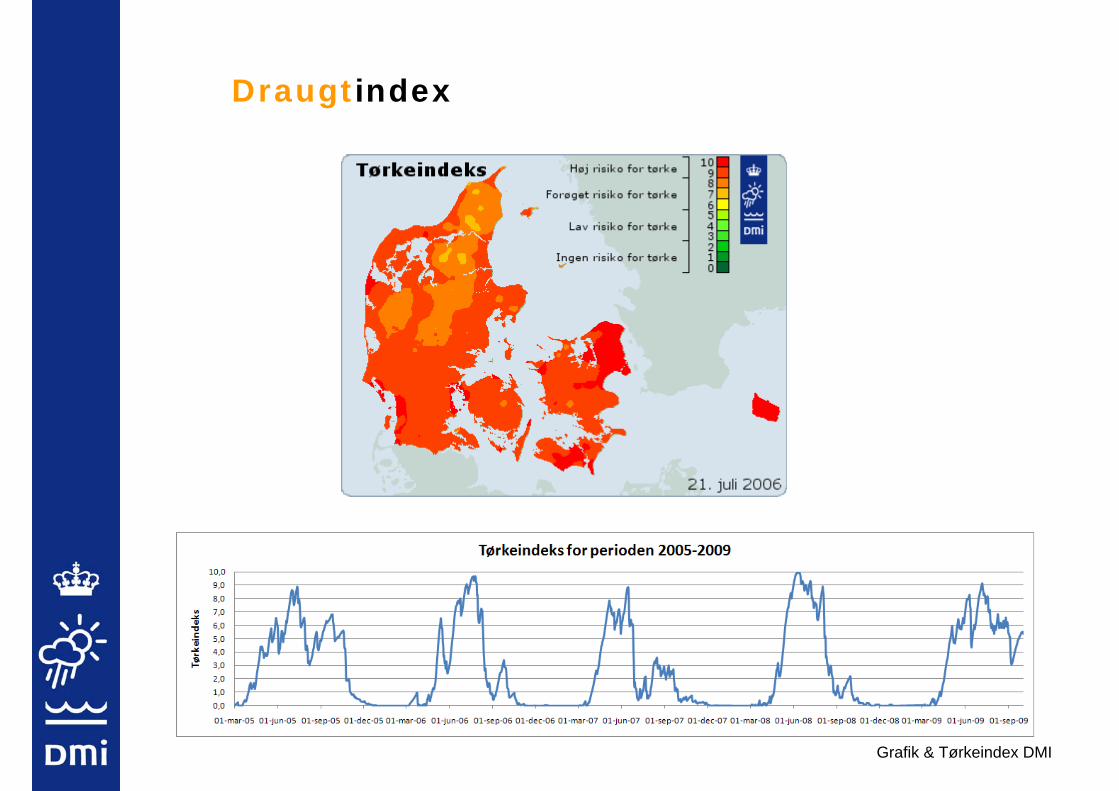
Draugtindex
Grafik & Tørkeindex DMI

airtemperatur -> Drought index
Markbrand ved NystedFoto: Margit Olsen .www.folketidende.dk
SkovbrandFoto: scanpix
and nature fire

Draught index and number of nature fires in 2006
Grafik & Tørkeindex DMI - Kilde antal naturbrande: Beredskabsstyrelsen
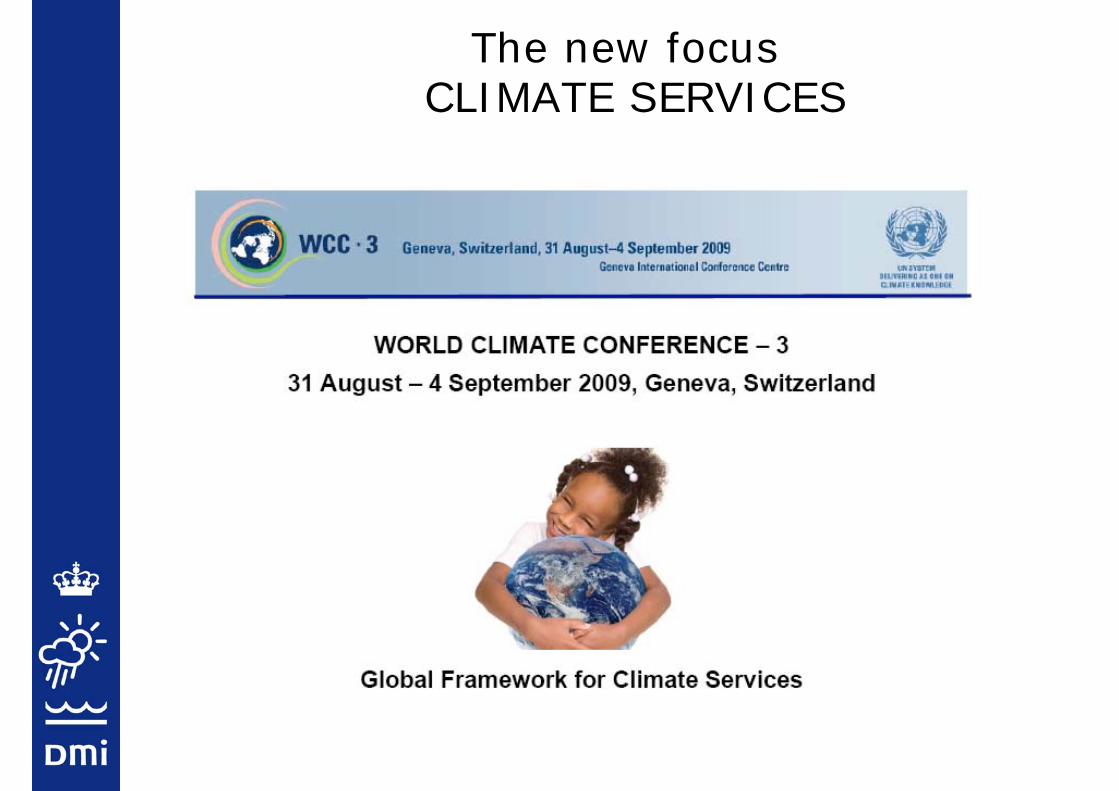
The new focusCLIMATE SERVICES

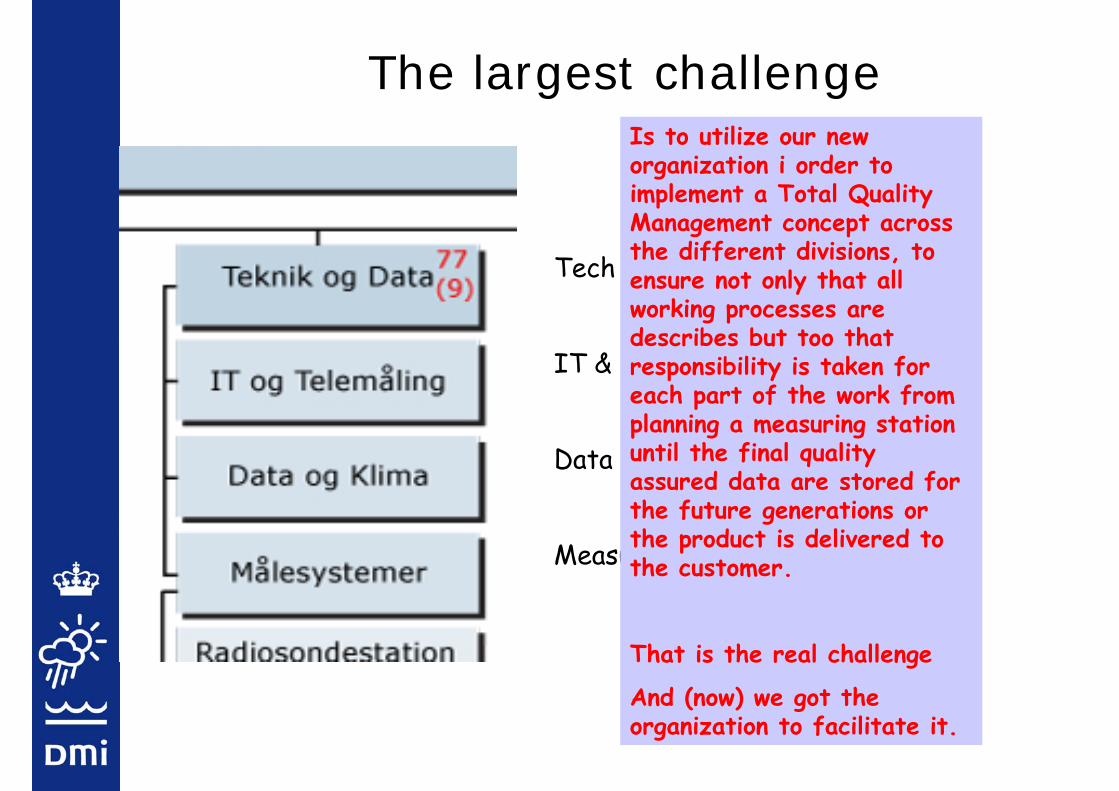
The largest challenge
Tech & Data Department
IT & Remotesensing Div
Data & Climate div
Measuring systems div
The largest challenge
Tech & Data Department
IT & Remotesensing Div
Data & Climate div
Measuring systems div
Is to utilize our new organization i order to implement a Total Quality Management concept across the different divisions, to ensure not only that all working processes are describes but too that responsibility is taken for each part of the work from planning a measuring station until the final quality assured data are stored for the future generations or the product is delivered to the customer.
That is the real challenge
And (now) we got the organization to facilitate it.
Intentions of the presentation
to give you
a little flavour of the history of climate data and management in Denmark
snapshots of the present day situation and topics which will be covered in depth the coming days,
a view of some of the major challenges for the years to come
The answer to the Question ? – what does the weight of 10 elephants has to do with Danish observations and climate data ?
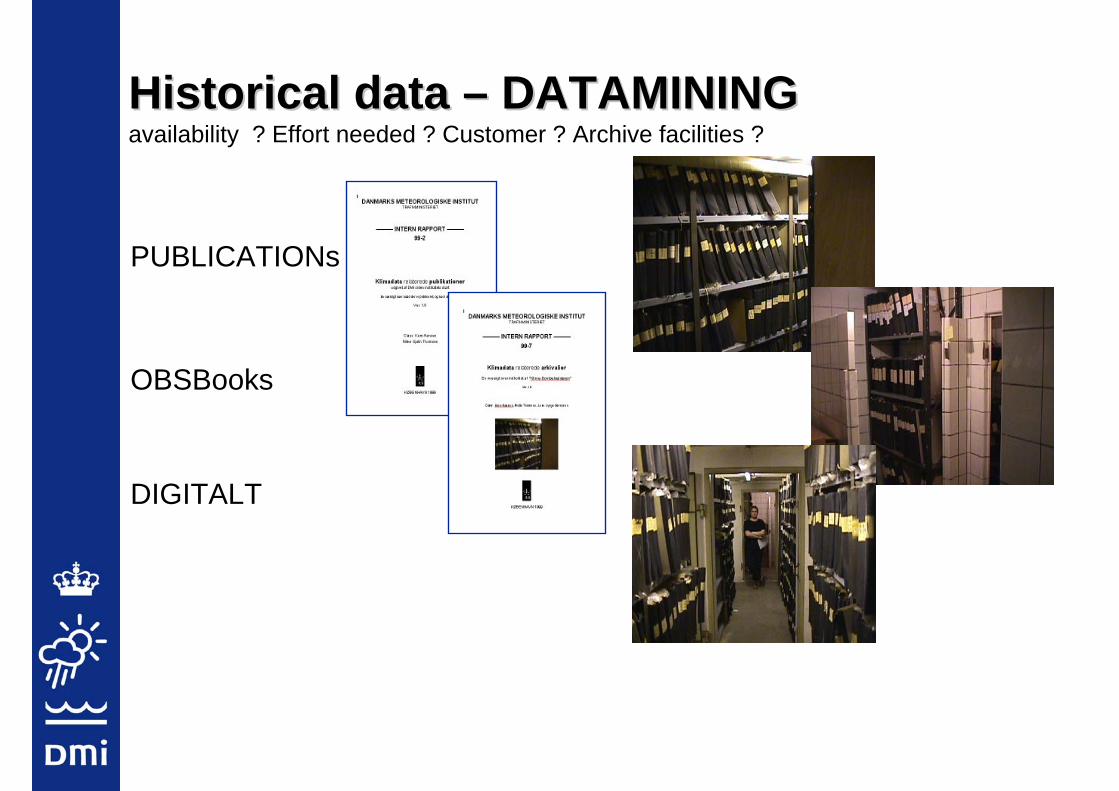
HistoricalHistorical data data –– DATAMINING DATAMINING availability ? Effort needed ? Customer ? Archive facilities ?
OBSBooks
DIGITALT
PUBLICATIONs
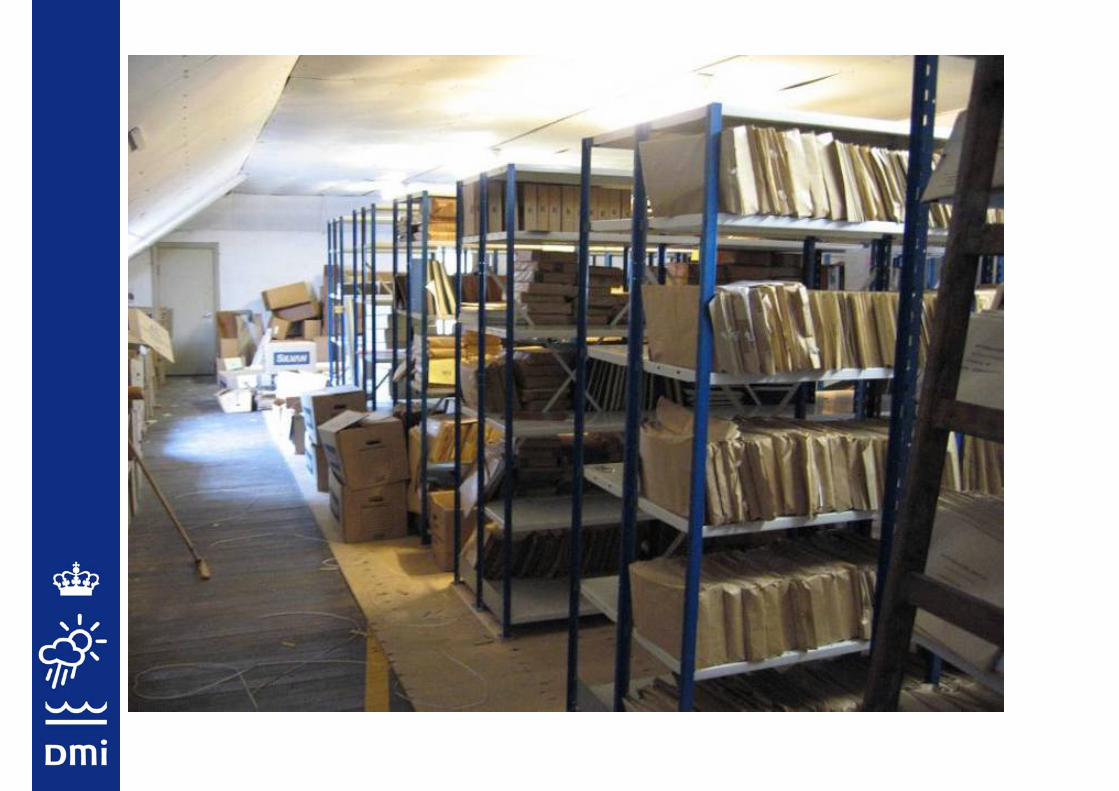
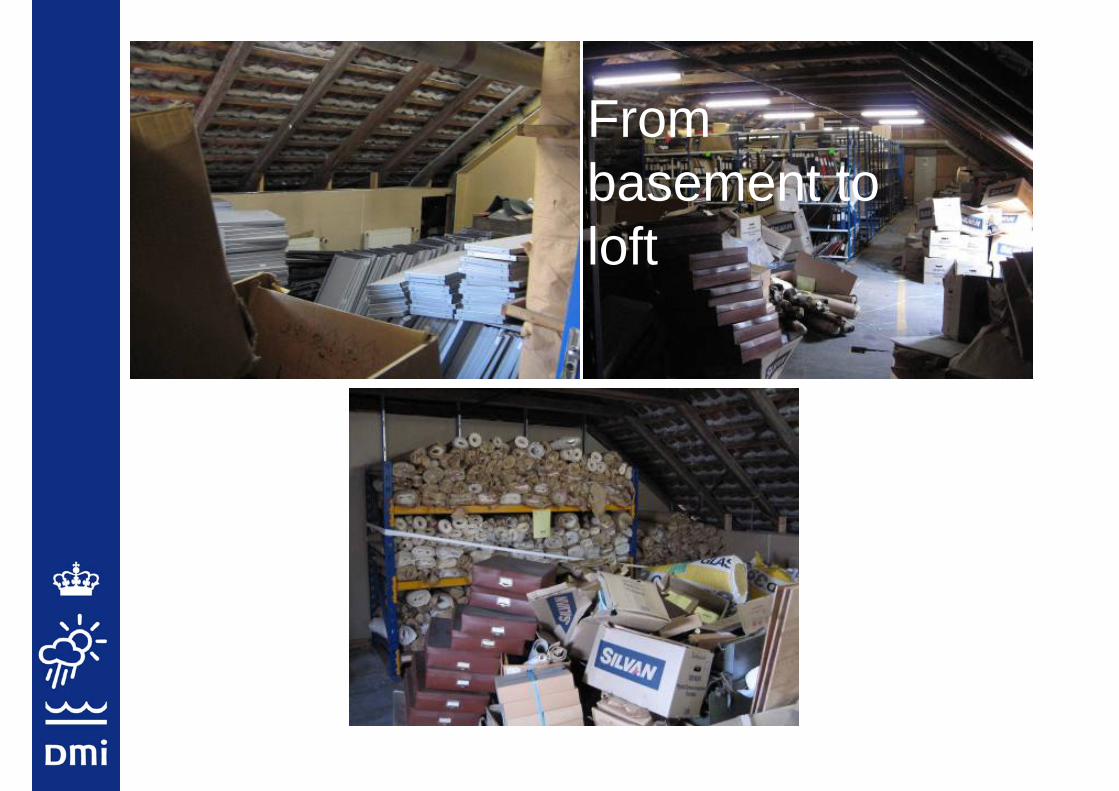
From basement to loft
in 2006 cleaned up and organized all analogue archives

and deposited the major part at the national archives

And this is where the elephant comes into the picture
1422 m2 cleared (including other things than archives)
1677,6 shelf meters
Of this 300 shelf meters deposited
and~ 100 meters kept as active archives at DMI
Clearing/dumped 50,5 tons
Deposited ~15 tons
Discarded archives ~25 tons
Total 90 –100 tons
Elephant:
10.000 kg

300 shelf meters
3300 boxes
990.000 pieces of paper
~15 tons
17.8 m3
Would we recomend it ?
It is not funny
It is heavy
It is dirty
It is expensive
…… but it is very satisfying and relieving knowing that the heritance from Rung and others are now cleaned, preserved and kept in a professional archive
– and available (within two days) if and when we want to hold them.

…and that may be called another kind of data-management
Thank you for your attention

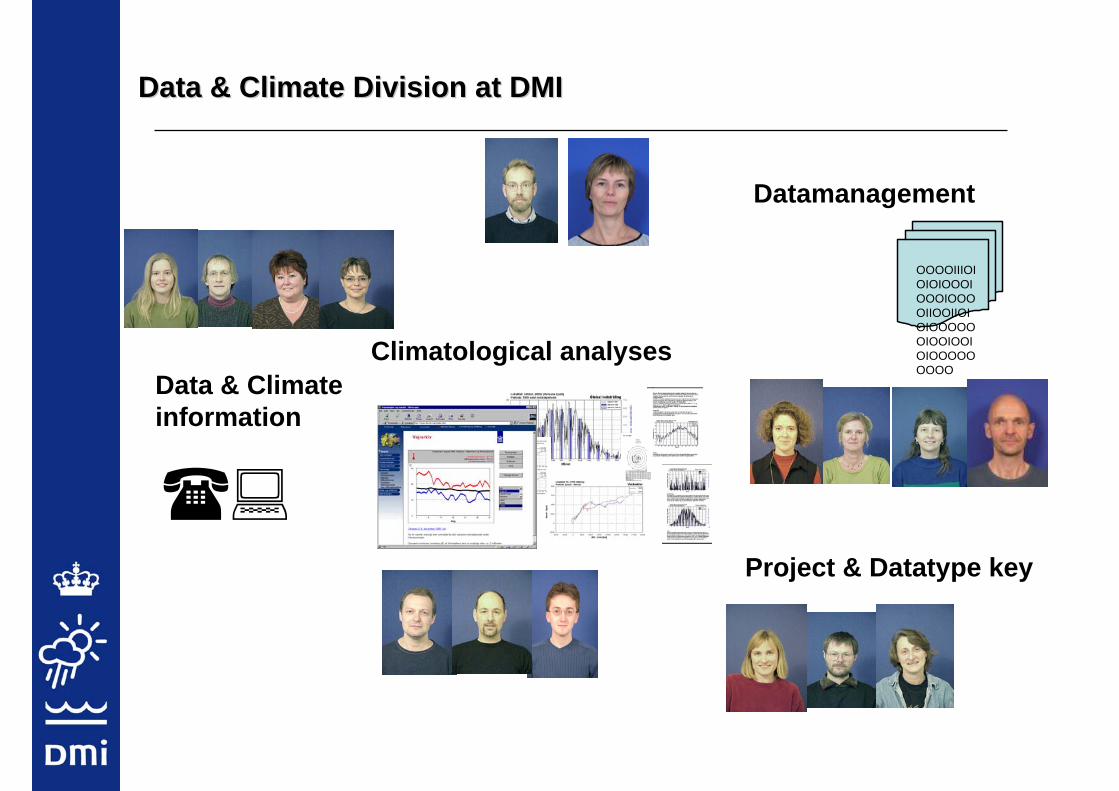
Data & Data & ClimateClimate Division at DMIDivision at DMI
Data & Climateinformation
Climatological analyses
Datamanagement
OOOOIIIOIOIOIOOOIOOOIOOOOIIOOIIOIOIOOOOOOIOOIOOIOIOOOOOOOOO
Project & Datatype key
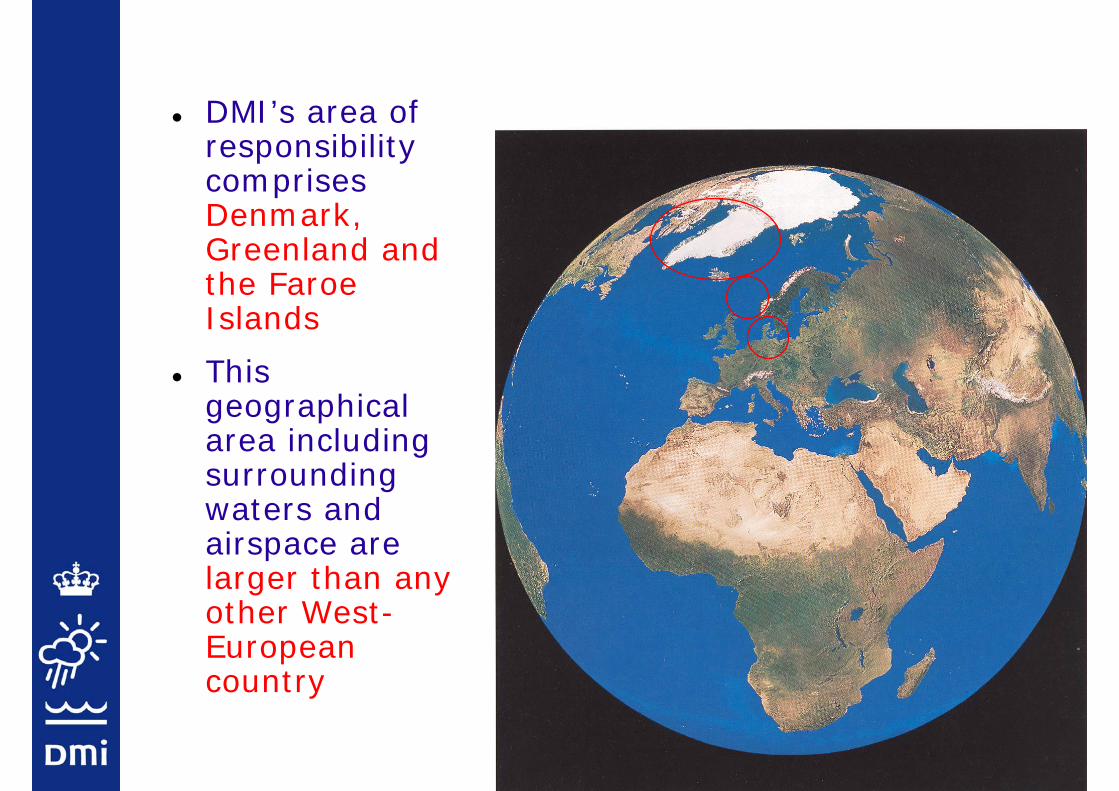
DMI’s area of responsibilitycomprisesDenmark, Greenland and the FaroeIslands
This geographical area including surrounding waters and airspace are larger than any other West-European country

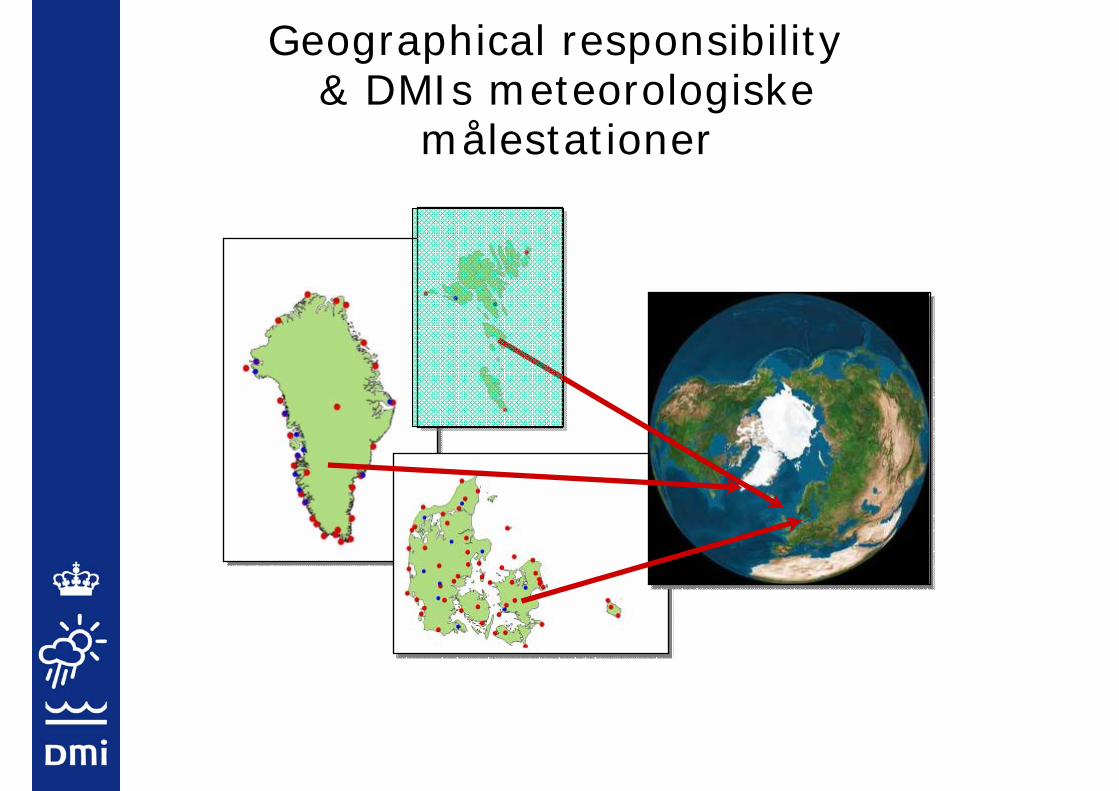
Geographical responsibility& DMIs meteorologiske
målestationer