Embed Size (px)
Citation preview
Preventing Obesity and Type 2 Diabetes in Youth
Phil Zeitler MD, PhDUniversity of Colorado Denver
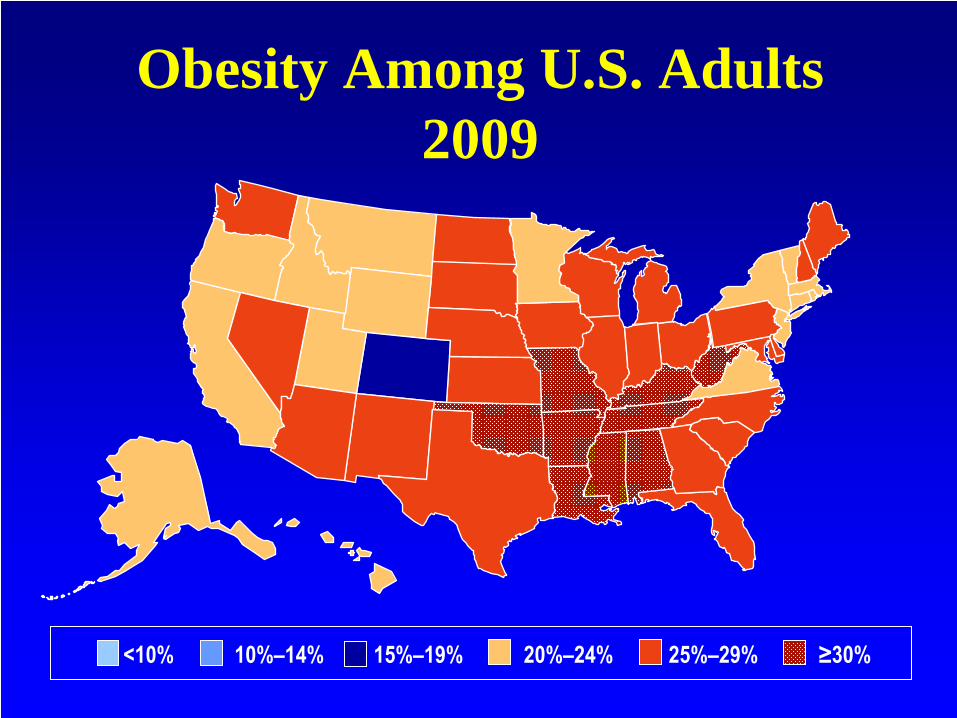
Obesity Among U.S. Adults 2009
<10% 10%–14% 15%–19% 20%–24% 25%–29% ≥30%

The Prevalence of Childhood Obesity Continues to rise in US
4 4
7
11
16
19
56
5
11
1617
0
2
4
6
8
10
12
14
16
18
20
1963-70 1971-74 1976-80 1988-94 1999-2002 2003-04
Perc
enta
ge
6-11 years 12-19 years
NHANES/CDC Report
Year of presentation
1982
1983
1984
1985
1986
1987
1988
1989
1990
1991
1992
1993
1994
1995
1996
1997
1998
0
4
8
12
16
20
24
% n
ew o
nset
pat
ient
s w
ith T
2DM
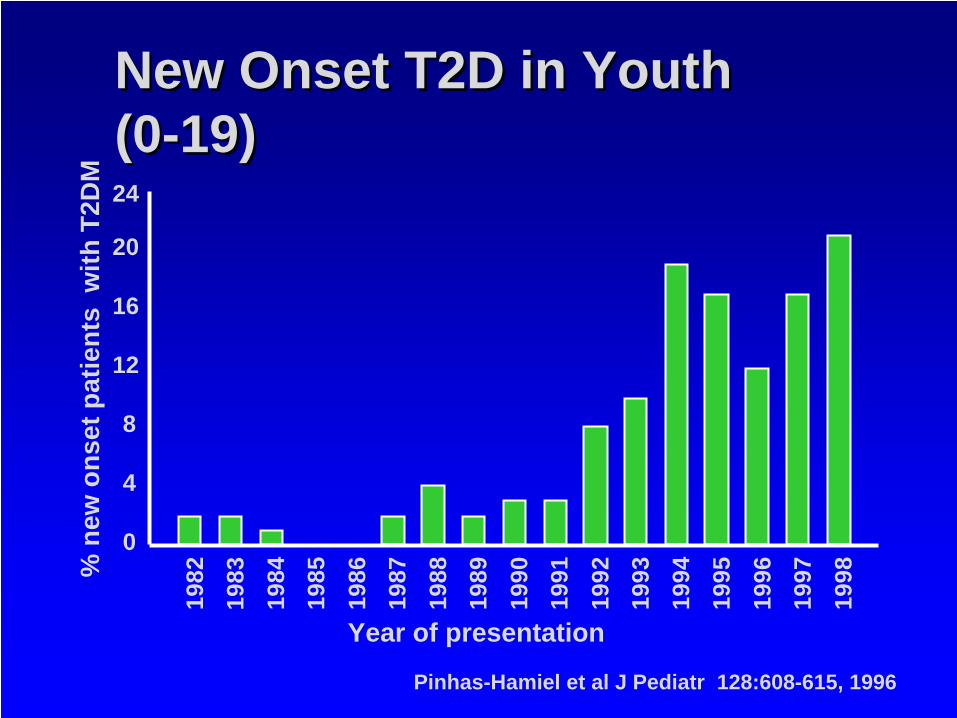
New Onset T2D in Youth (0-19) New Onset T2D in Youth (0-19)
Pinhas-Hamiel et al J Pediatr 128:608-615, 1996
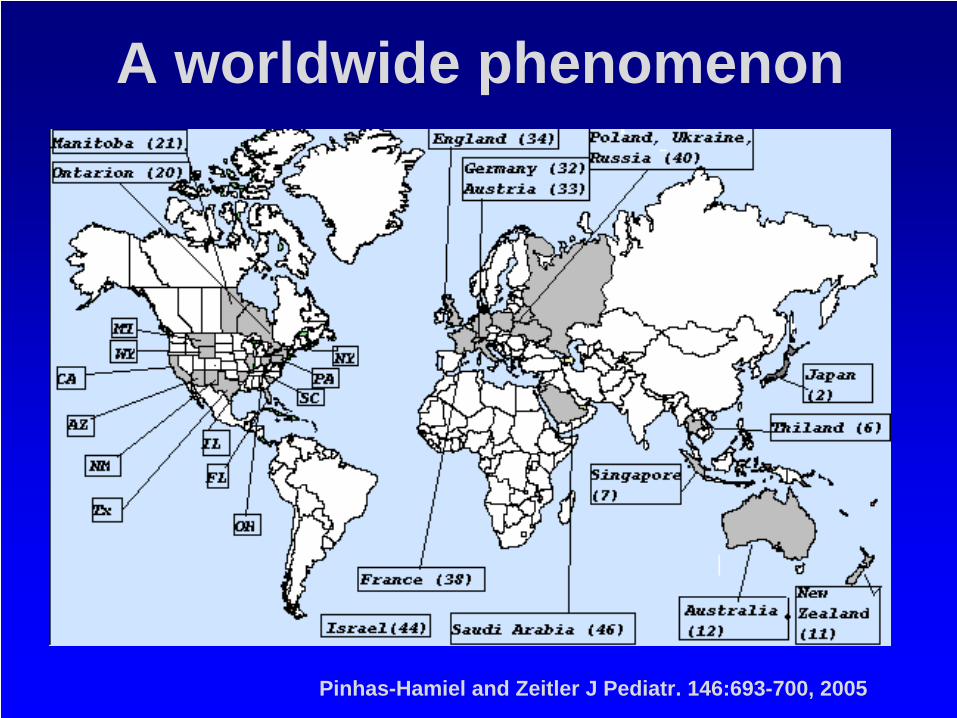
A worldwide phenomenon
Pinhas-Hamiel and Zeitler J Pediatr. 146:693-700, 2005

6
Who are these kids?
Are they a genetic “extreme”?
Is this environment?
If so, why now?
Unique aspects of type 2 in youth
Current US Demographics
• 1211 kids screened for a large study of T2D– Average age 14.2– 37% male– Average BMI 35– Ethnicity
• 21% white• 34% Hispanic• 35% African-American• 5% American-Indian• 2% Asian
Current Incidence of T2D in Adolescents
• SEARCH for Diabetes in Youth– rare in children younger than 10 years of age,
regardless of race or ethnicity.– after 10 years of age, newly diagnosed cases
• 14.9% in non-Hispanic whites (NHW) – 0.19 cases per 1000 NHW youth
• 46.1% in Hispanic youth• 57.8% in non-Hispanic Blacks (NHB)• 69.7% in Asian/Pacific Islanders• 86.2% in American Indian (AI)
– 1.74 cases per 1000 AI youth
– In total, approximately 3700 youth under 20 years of age are diagnosed with T2D in the US annually
Liese et al. Pediatrics 118:1510-1518, 2006
The prevalence of undiagnosed diabetes is low
• NHANES 1999-2000 – 915 12-19 years– DM based on fasting criteria < 1%
• STOPP-T2D – 1750 8th graders, BMI > 85%ile
• 0.4% - DM – fasting criteria• 0.1% - DM - OGTT• 2% with IGT
Williams et al Pediatrics 116: 1122-1126, 2005Baranowski et al Diab Care 29:212-217
The Prevalence of Impaired Fasting Glucose is high
• NHANES 1999-2000 – 915 12-19 years – All adolescents IFG 7%,
• 13% Mexican-Americans • 7% African-Americans • 4% NHW
– Obese Adolescents 11.7%
• STOPP-T2D– 1750 8th graders , BMI > 85%ile
• 40.5% IFG• 2% IGT
Williams et al Pediatrics 116: 1122-1126, 2005Baranowski et al Diab Care 29:212-217
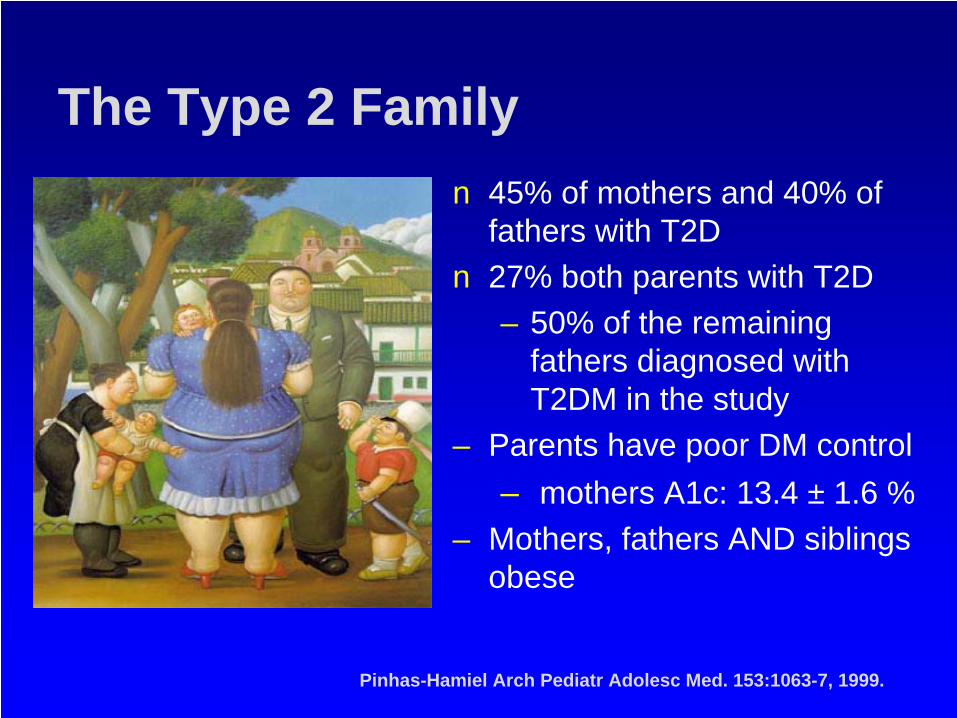
The Type 2 Familyn 45% of mothers and 40% of
fathers with T2D n 27% both parents with T2D
– 50% of the remaining fathers diagnosed with T2DM in the study
– Parents have poor DM control– mothers A1c: 13.4 ± 1.6 %
– Mothers, fathers AND siblings obese
Pinhas-Hamiel Arch Pediatr Adolesc Med. 153:1063-7, 1999.
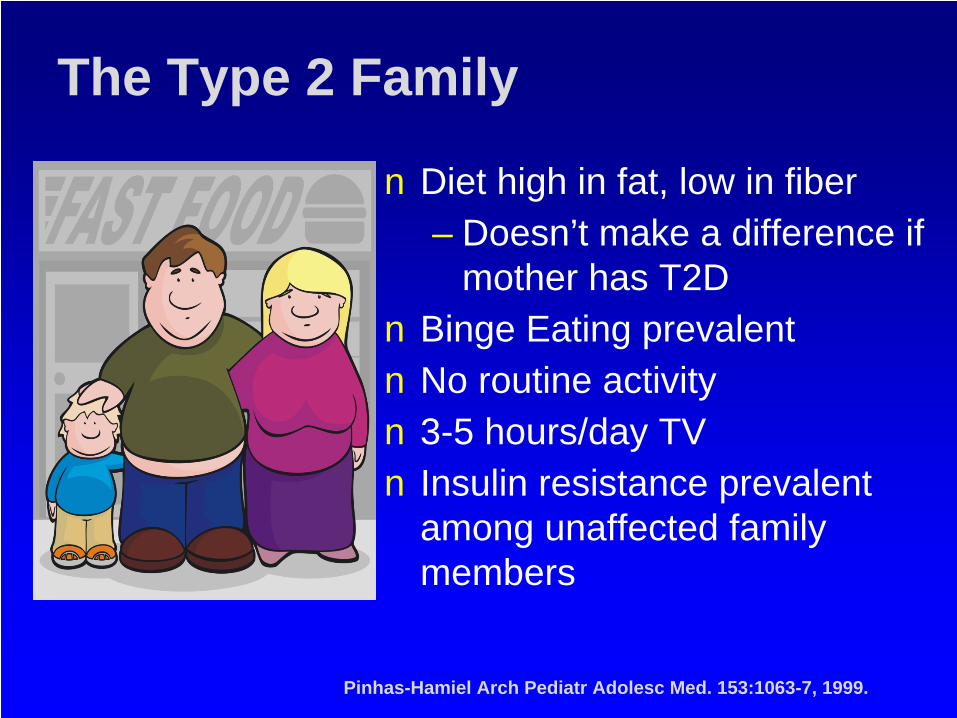
The Type 2 Family
n Diet high in fat, low in fiber– Doesn’t make a difference if
mother has T2Dn Binge Eating prevalentn No routine activityn 3-5 hours/day TVn Insulin resistance prevalent
among unaffected family members
Pinhas-Hamiel Arch Pediatr Adolesc Med. 153:1063-7, 1999.
The Type 2 Family – newer insights
n Frequent family dysfunctionn Unstable residence and transportationn Contact with justice systemn School absences or dropoutsn Poor communicationn Poor parentingn Domestic violence
n Increased family health burdenn diabetes and non-diabetes related disordersn Psychological and psychiatric disorders in parents and
family members.
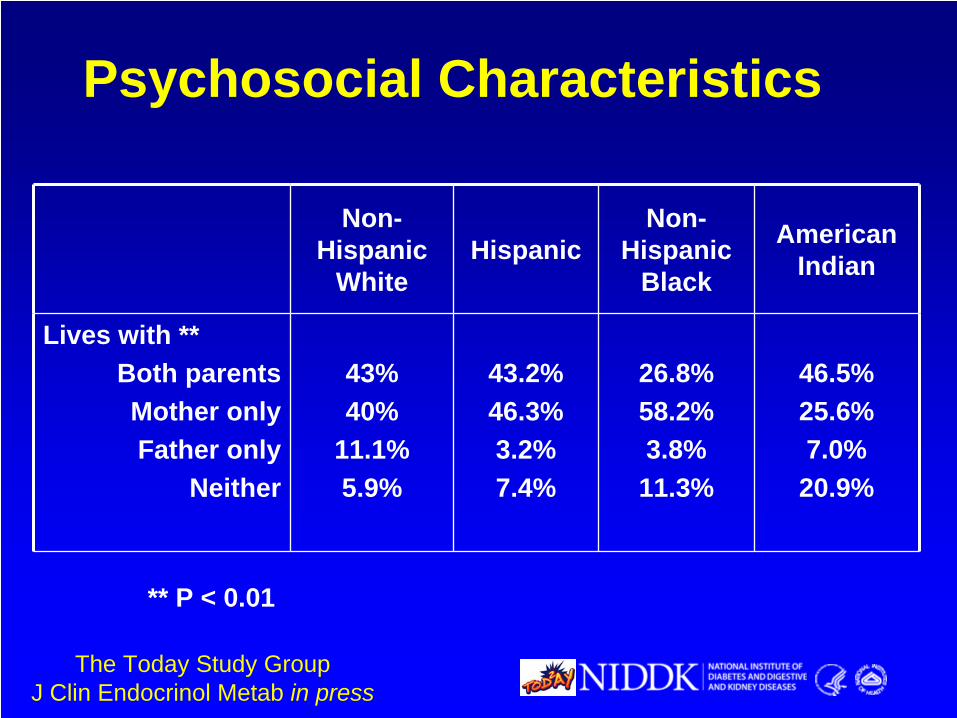
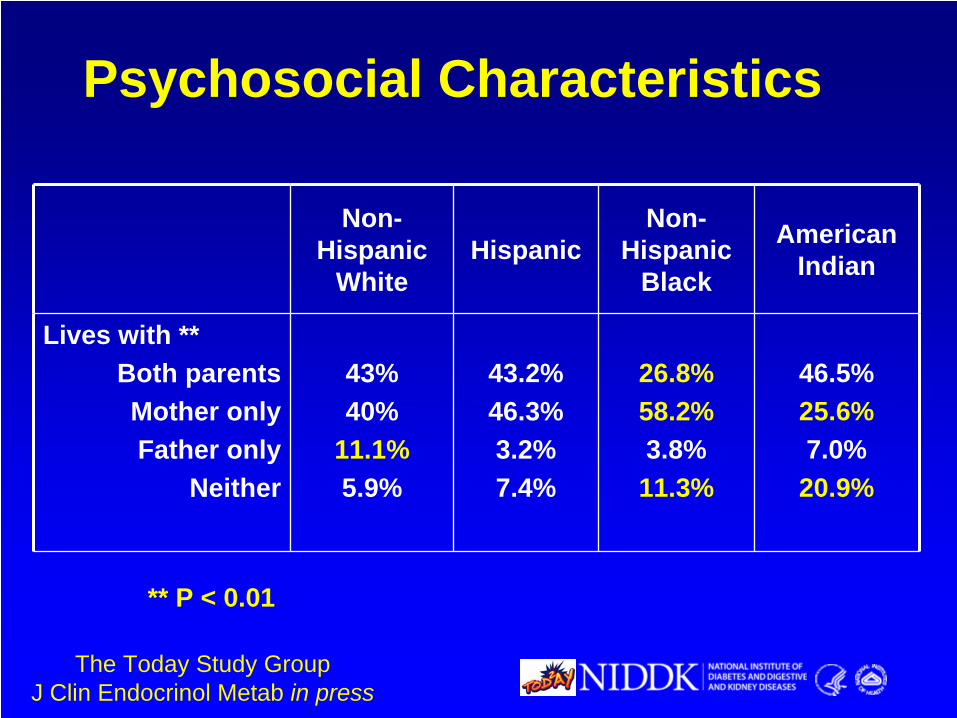
Non- Hispanic
WhiteHispanic
Non- Hispanic
Black
American Indian
Lives with **Both parentsMother onlyFather only
Neither
43%40%
11.1%5.9%
43.2%46.3%3.2%7.4%
26.8%58.2%3.8%11.3%
46.5%25.6%7.0%
20.9%
** P < 0.01
Psychosocial Characteristics
The Today Study GroupJ Clin Endocrinol Metab in press
Non- Hispanic
WhiteHispanic
Non- Hispanic
Black
American Indian
Lives with **Both parentsMother onlyFather only
Neither
43%40%
11.1%5.9%
43.2%46.3%3.2%7.4%
26.8%58.2%3.8%11.3%
46.5%25.6%7.0%
20.9%
** P < 0.01
Psychosocial Characteristics
The Today Study GroupJ Clin Endocrinol Metab in press
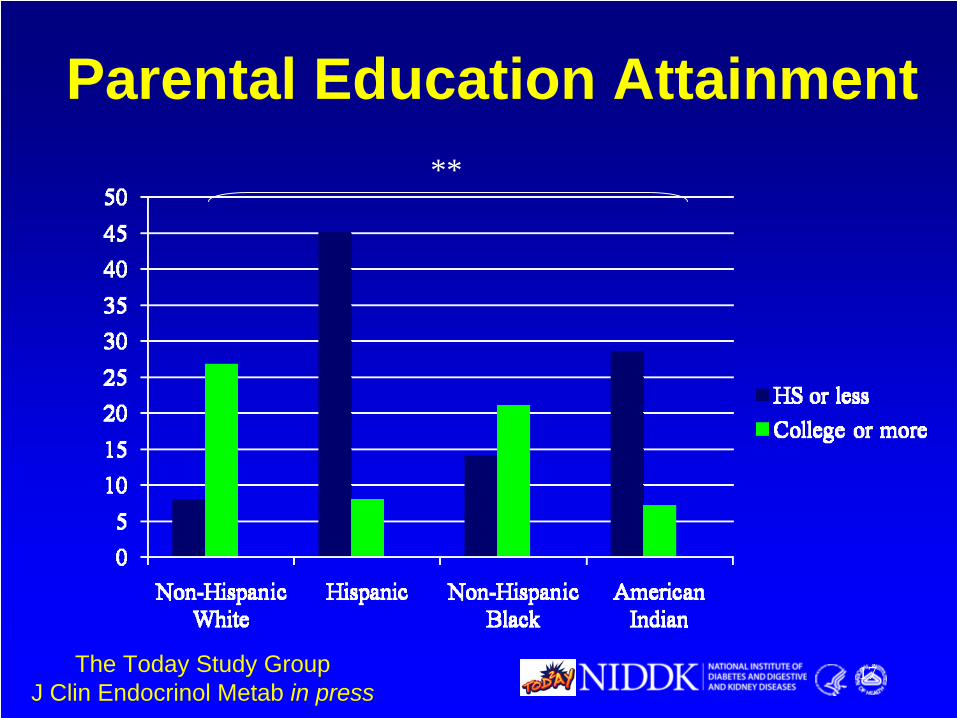
Parental Education Attainment
17
**
The Today Study GroupJ Clin Endocrinol Metab in press
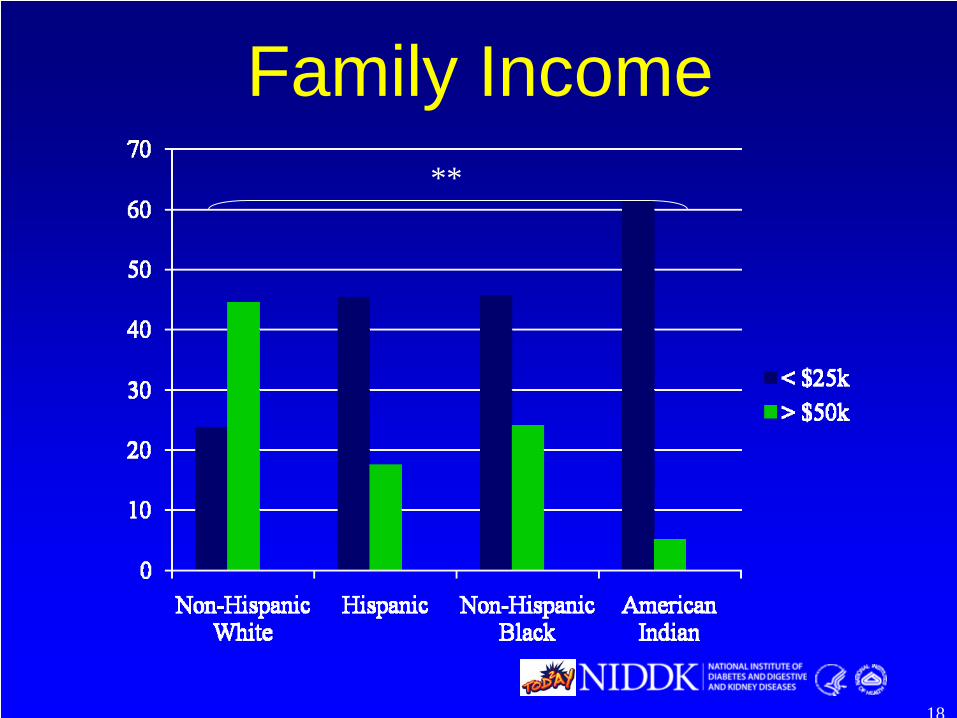
Family Income
18
**
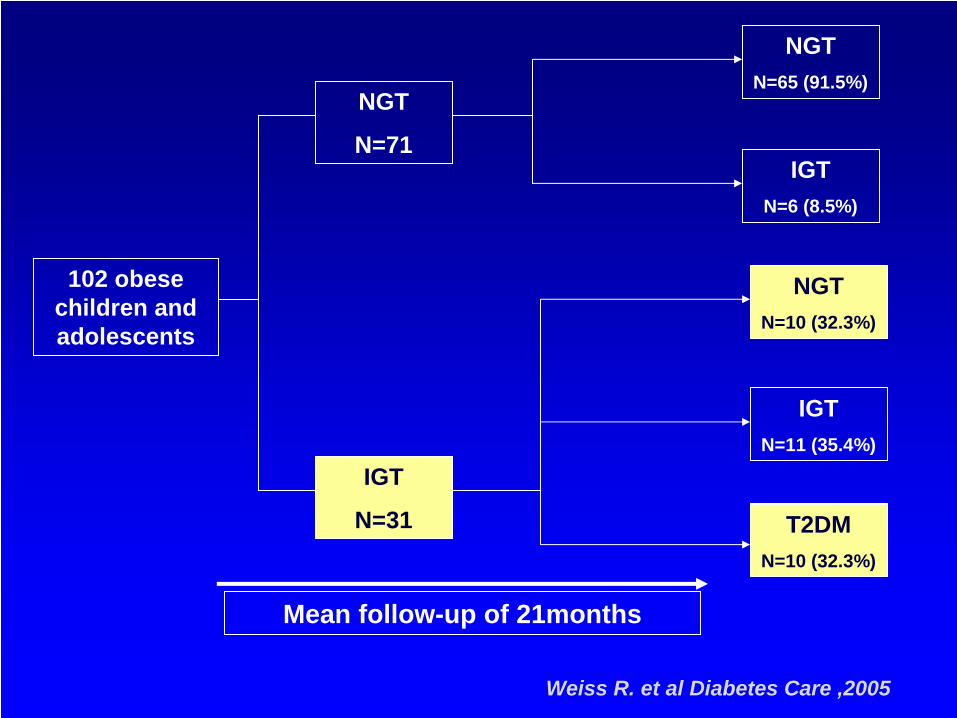
NGT
N=71
IGT
N=31
NGTN=65 (91.5%)
IGTN=6 (8.5%)
NGTN=10 (32.3%)
IGTN=11 (35.4%)
T2DMN=10 (32.3%)
102 obese children and adolescents
Mean follow-up of 21months
IGT
N=31
NGTN=10 (32.3%)
T2DMN=10 (32.3%)
Weiss R. et al Diabetes Care ,2005
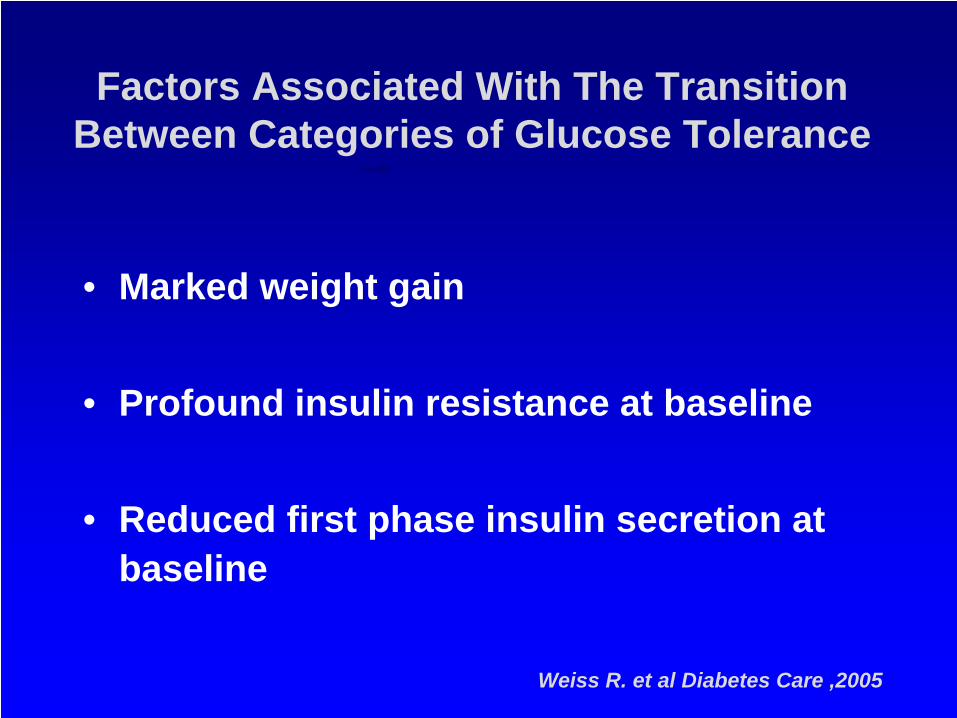
Factors Associated With The Transition Between Categories of Glucose Tolerance
• Marked weight gain
• Profound insulin resistance at baseline
• Reduced first phase insulin secretion at baseline
Weiss R. et al Diabetes Care ,2005
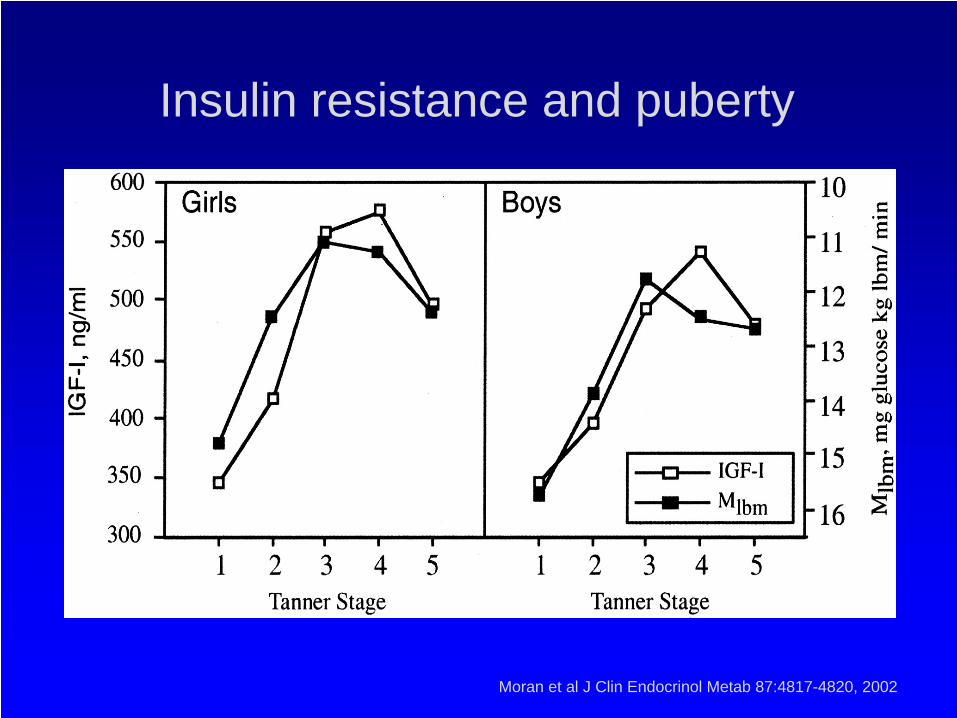
Moran et al J Clin Endocrinol Metab 87:4817-4820, 2002
Insulin resistance and puberty
7
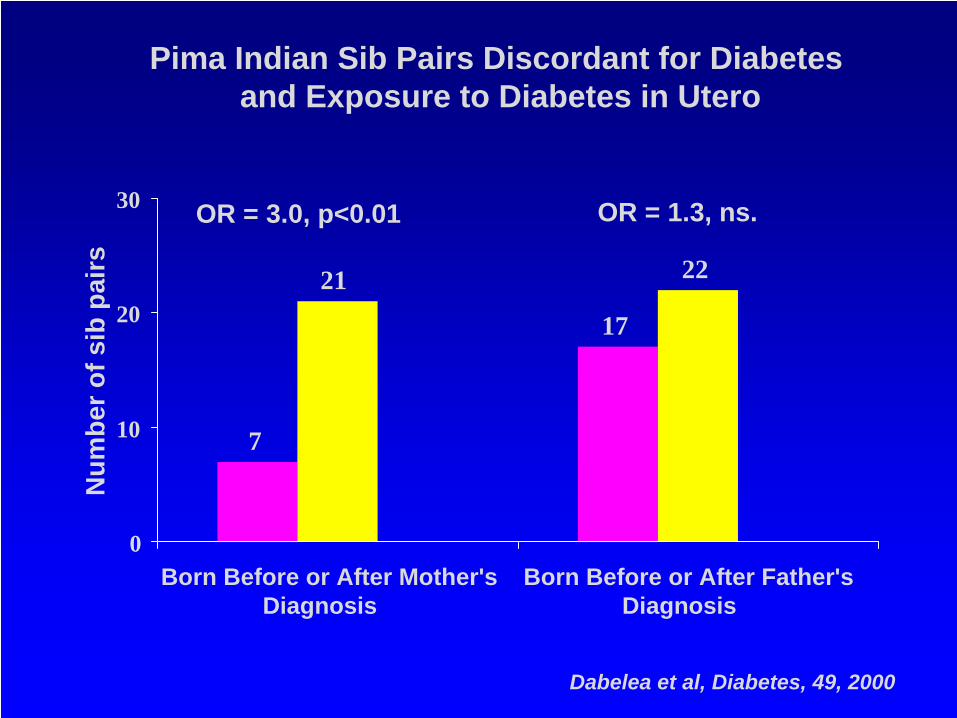
17
21 22
0
10
20
30
Born Before or After Mother'sDiagnosis
Born Before or After Father'sDiagnosis
Num
ber o
f sib
pai
rs
OR = 3.0, p<0.01 OR = 1.3, ns.
Pima Indian Sib Pairs Discordant for Diabetesand Exposure to Diabetes in Utero
Dabelea et al, Diabetes, 49, 2000
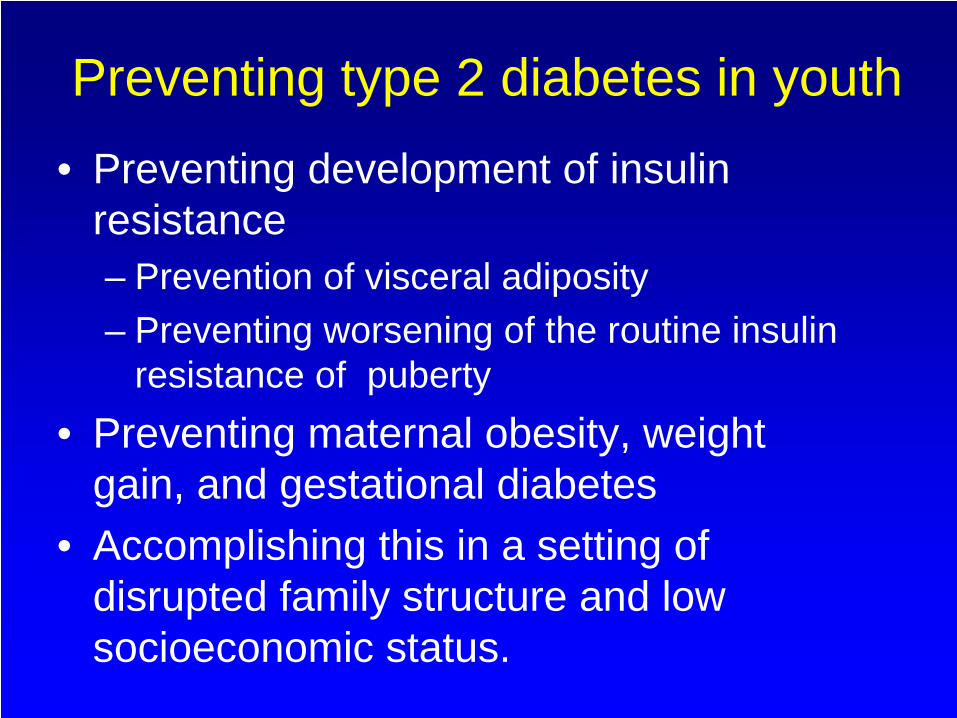
Preventing type 2 diabetes in youth• Preventing development of insulin
resistance– Prevention of visceral adiposity– Preventing worsening of the routine insulin
resistance of puberty• Preventing maternal obesity, weight
gain, and gestational diabetes• Accomplishing this in a setting of
disrupted family structure and low socioeconomic status.

Energy Balance
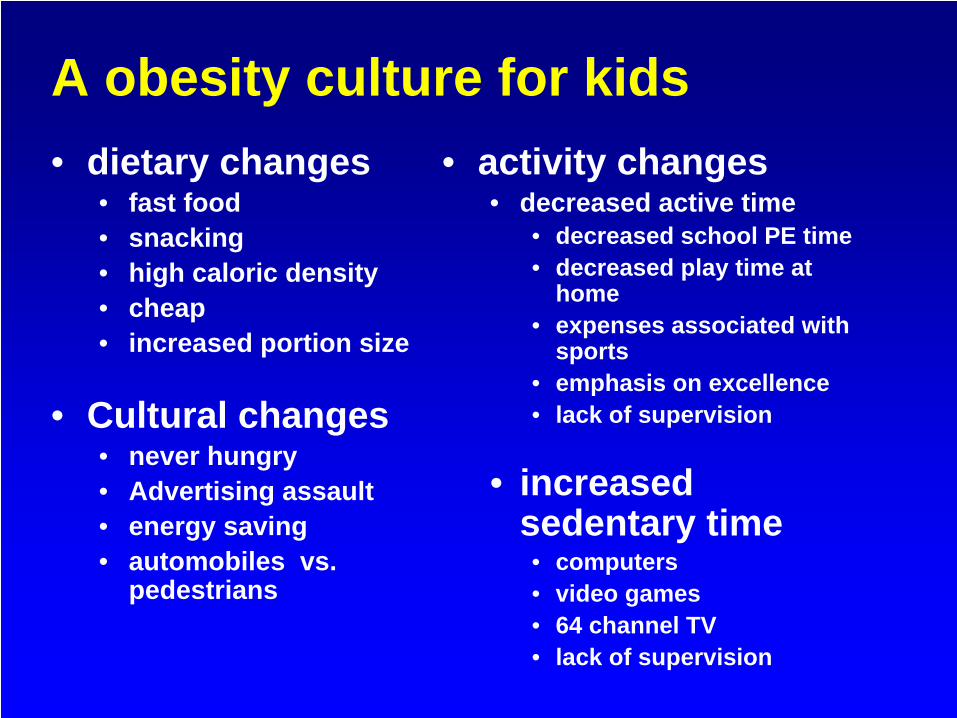
A obesity culture for kids• dietary changes
• fast food• snacking• high caloric density• cheap• increased portion size
• Cultural changes• never hungry• Advertising assault• energy saving• automobiles vs.
pedestrians
• activity changes• decreased active time
• decreased school PE time• decreased play time at
home• expenses associated with
sports• emphasis on excellence• lack of supervision
• increased sedentary time• computers• video games• 64 channel TV• lack of supervision
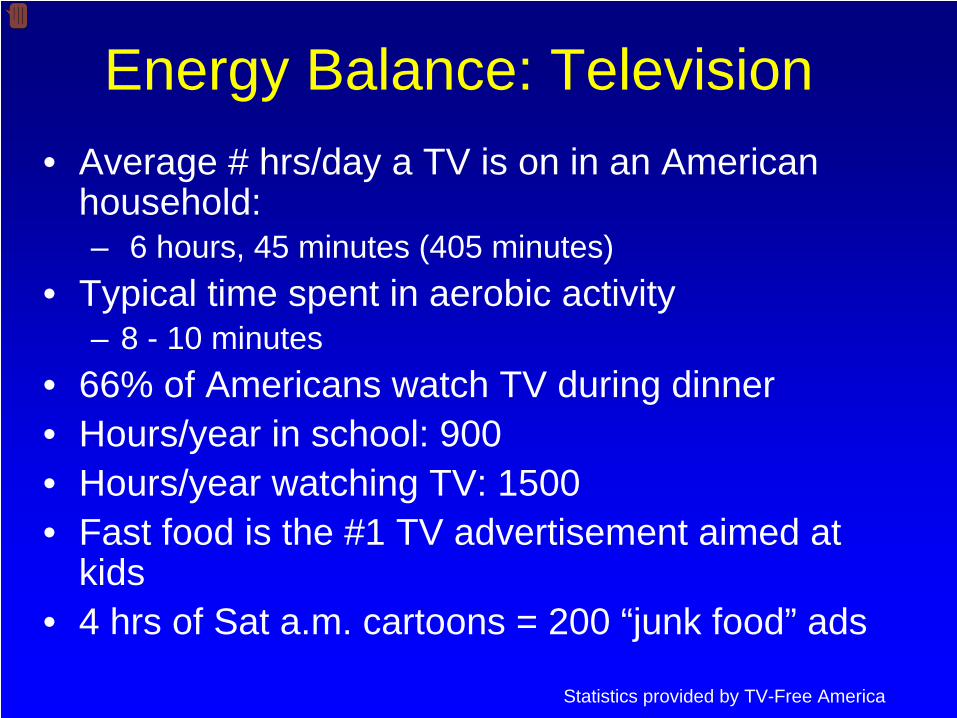
Energy Balance: Television• Average # hrs/day a TV is on in an American
household:– 6 hours, 45 minutes (405 minutes)
• Typical time spent in aerobic activity– 8 - 10 minutes
• 66% of Americans watch TV during dinner• Hours/year in school: 900• Hours/year watching TV: 1500• Fast food is the #1 TV advertisement aimed at
kids• 4 hrs of Sat a.m. cartoons = 200 “junk food” ads
Statistics provided by TV-Free America

Energy Balance: Nutrition • Consumption of sugar beverages• Americans eat approximately 1/3 meals outside
home • Most of these meals are high fat, low nutrient • High fat food intake leads to more high fat food
intake• Family eating practices are key
– What are the parental eating practices?– Are meals eaten together?– Is there a “dinner table”?
Jelalian, 2007; Trost et al., 2001; Fitzgibbon & Stolley, 2004)
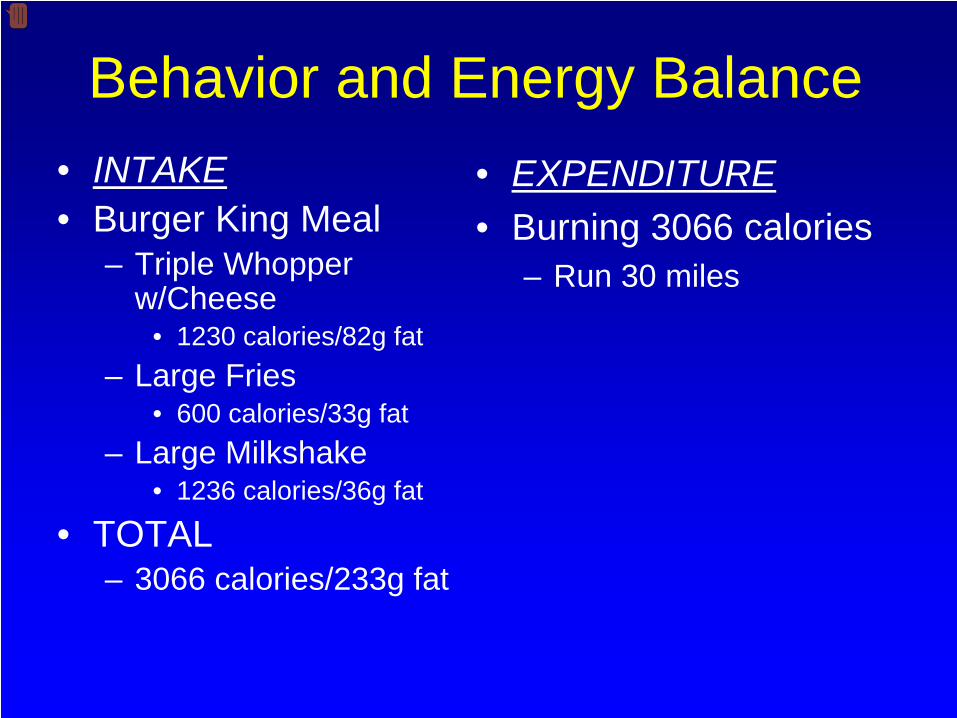
Behavior and Energy Balance• INTAKE• Burger King Meal
– Triple Whopper w/Cheese
• 1230 calories/82g fat– Large Fries
• 600 calories/33g fat– Large Milkshake
• 1236 calories/36g fat
• TOTAL – 3066 calories/233g fat
• EXPENDITURE• Burning 3066 calories
– Run 30 miles

Lifestyle Modification

In principle, it’s easy!
• Reduce the accretion of visceral fat through lifestyle modification
• Reverse the trends in the toxic environment through thermodynamics– Reduce caloric intake– Increase caloric expenditure
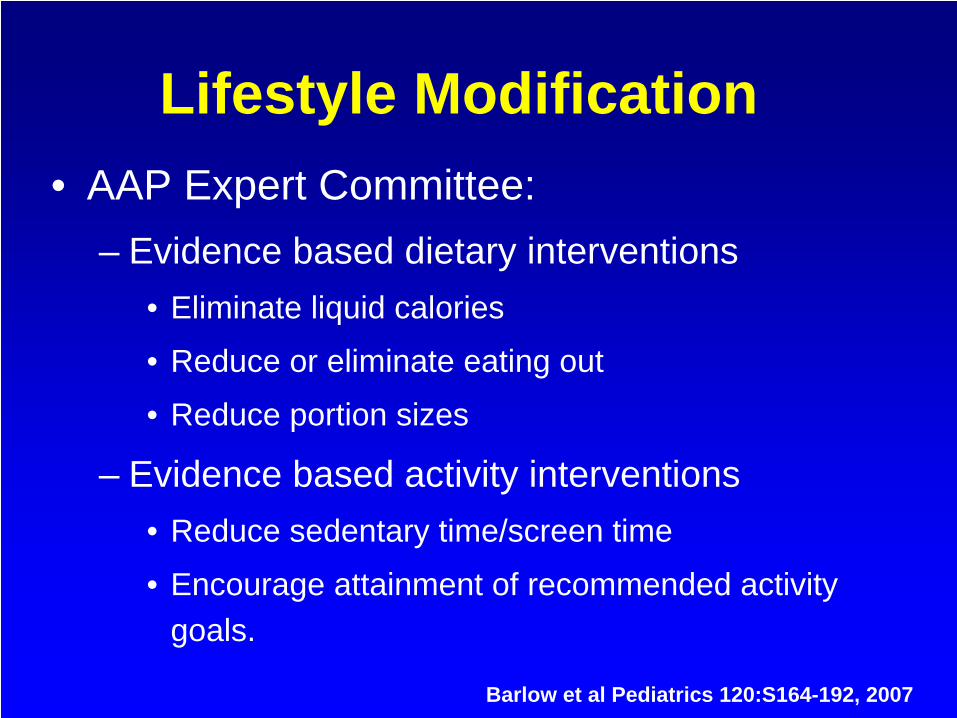
Lifestyle Modification• AAP Expert Committee:
– Evidence based dietary interventions• Eliminate liquid calories
• Reduce or eliminate eating out
• Reduce portion sizes
– Evidence based activity interventions• Reduce sedentary time/screen time
• Encourage attainment of recommended activity goals.
Barlow et al Pediatrics 120:S164-192, 2007
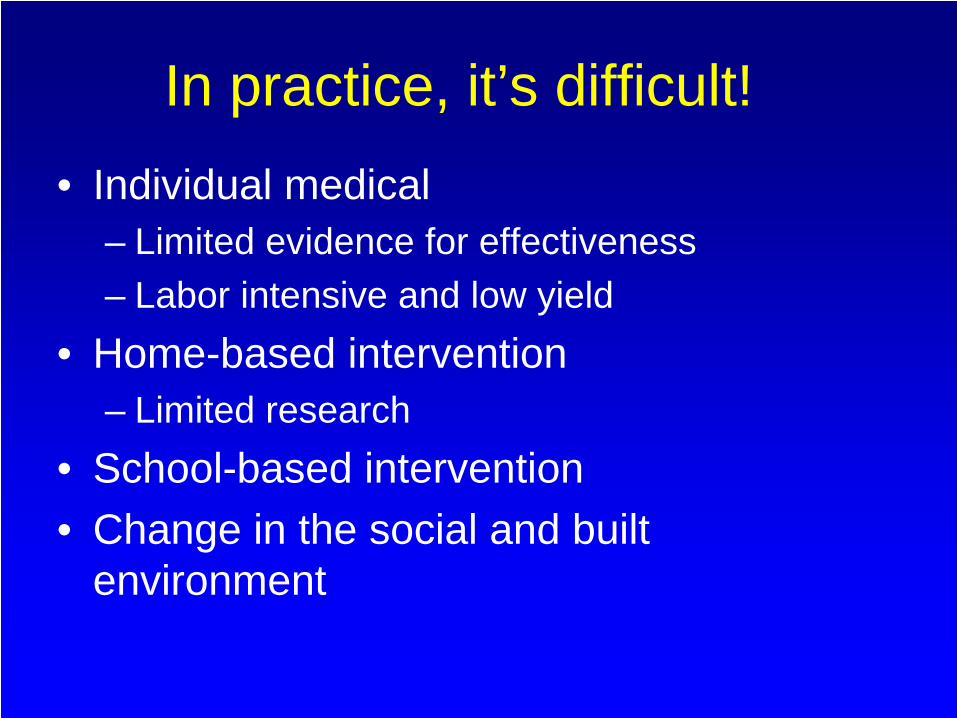
In practice, it’s difficult!• Individual medical
– Limited evidence for effectiveness– Labor intensive and low yield
• Home-based intervention– Limited research
• School-based intervention• Change in the social and built
environment
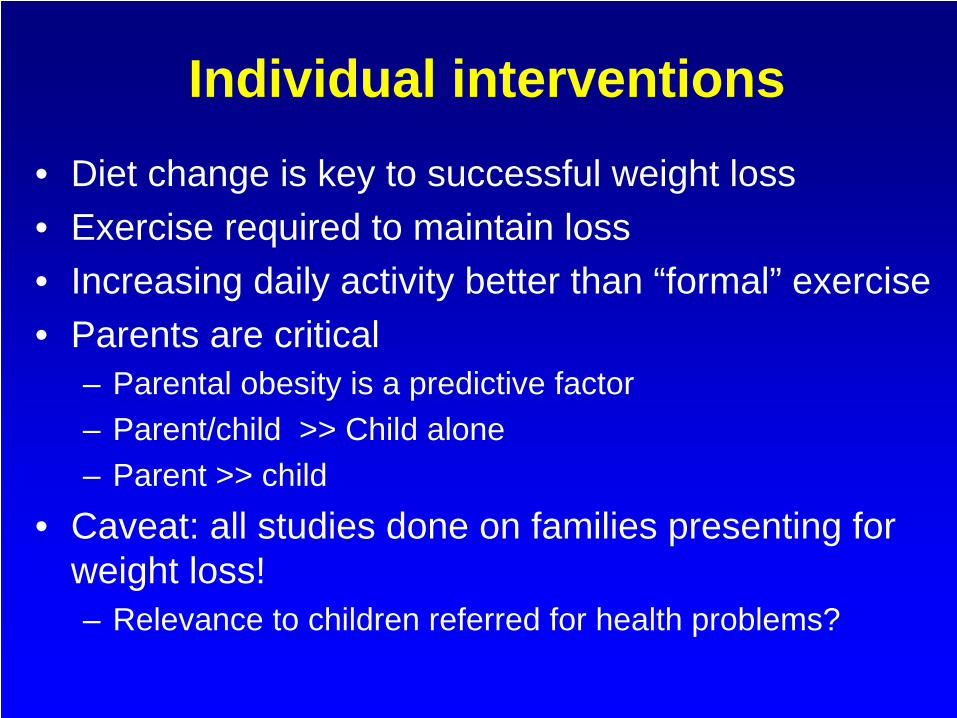
Individual interventions• Diet change is key to successful weight loss• Exercise required to maintain loss• Increasing daily activity better than “formal” exercise• Parents are critical
– Parental obesity is a predictive factor– Parent/child >> Child alone– Parent >> child
• Caveat: all studies done on families presenting for weight loss!– Relevance to children referred for health problems?

School Interventions
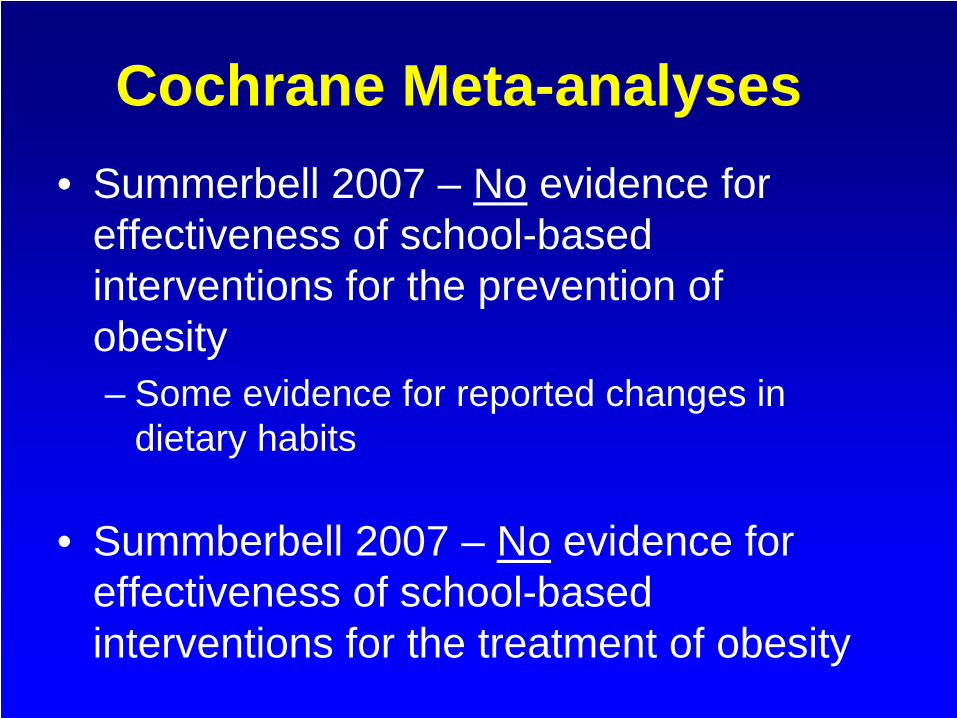
Cochrane Meta-analyses• Summerbell 2007 – No evidence for
effectiveness of school-based interventions for the prevention of obesity– Some evidence for reported changes in
dietary habits
• Summberbell 2007 – No evidence for effectiveness of school-based interventions for the treatment of obesity
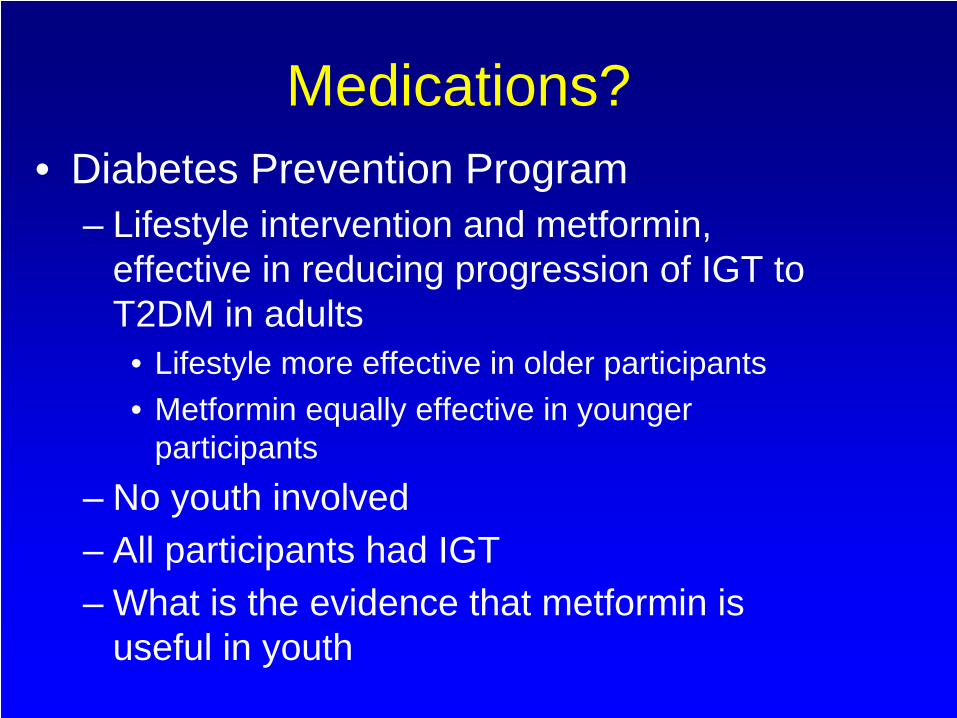
Medications?• Diabetes Prevention Program
– Lifestyle intervention and metformin, effective in reducing progression of IGT to T2DM in adults
• Lifestyle more effective in older participants• Metformin equally effective in younger
participants– No youth involved– All participants had IGT– What is the evidence that metformin is
useful in youth

Metformin• Non-controlled case studies• Freemark and Bursey
– 29 mixed white and black boys and girls– BMI > 30 kg/m2, Fasting insulin > 15 – At least 1 1st or 2nd degree relative with T2DM– Metformin 500 mg BID or placebo for 6 months– BMI decreased 0.12 SD (1%) vs. increase of
0.23 SD (2%)– Decreased fasting glucose (all normal) and
insulinFreemark and Bursey, Pediatrics 107: E55, 2001
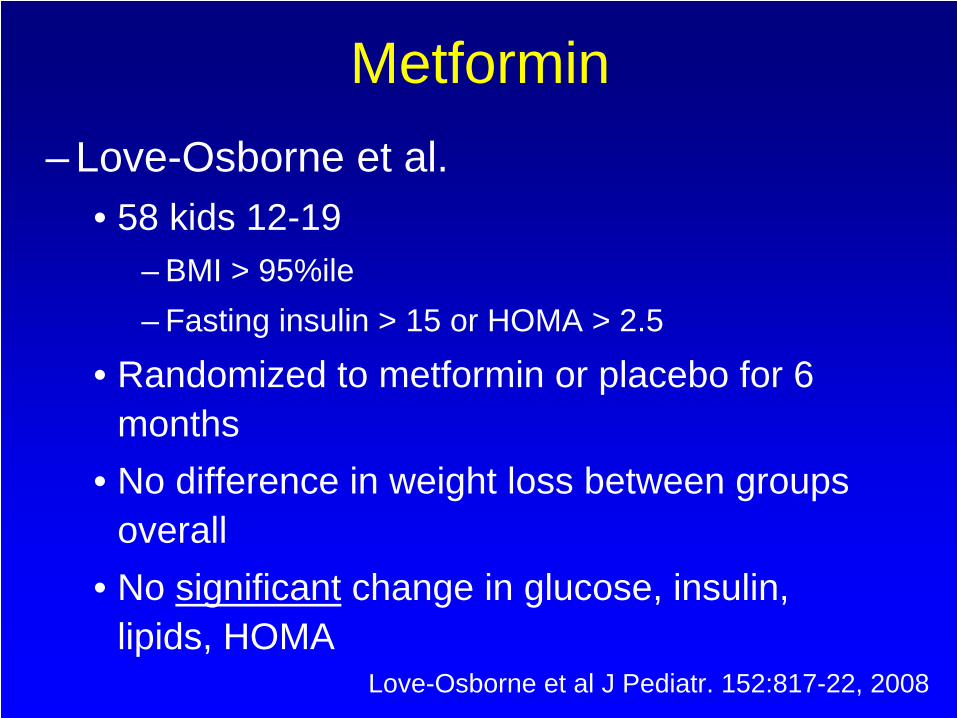
Metformin– Love-Osborne et al.
• 58 kids 12-19 – BMI > 95%ile– Fasting insulin > 15 or HOMA > 2.5
• Randomized to metformin or placebo for 6 months
• No difference in weight loss between groups overall
• No significant change in glucose, insulin, lipids, HOMA
Love-Osborne et al J Pediatr. 152:817-22, 2008
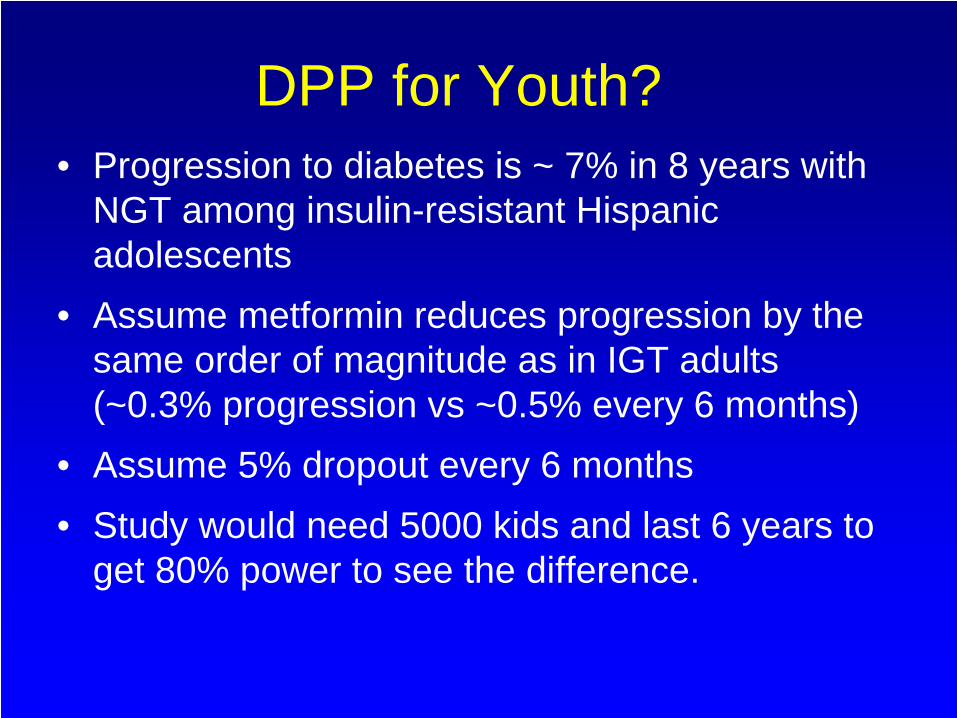
DPP for Youth?• Progression to diabetes is ~ 7% in 8 years with
NGT among insulin-resistant Hispanic adolescents
• Assume metformin reduces progression by the same order of magnitude as in IGT adults (~0.3% progression vs ~0.5% every 6 months)
• Assume 5% dropout every 6 months• Study would need 5000 kids and last 6 years to
get 80% power to see the difference.
Summary• Insulin resistance is the underlying defect in risk for
type 2 diabetes• The development of Type 2 diabetes reflects the
progressive loss of compensation for insulin resistance due to β-cell failure
• Fat depots play an important role in insulin resistance and β-cell failure
• Prevention of type 2 diabetes in youth will require reversal of fat accumulation through reduction in caloric intake and increase in caloric expenditure
• We do not yet know how to accomplish this given the complex social and cultural factors involved
The Big Texan – Amarillo, Texas
Thank you for your attention


![Obesity Diabetes and Complications[1]](https://img.pdfslide.us/doc/110x75/544958b7af7959a0538b47b6/obesity-diabetes-and-complications1.jpg)


![Obesity and diabetes [autosaved]](https://img.pdfslide.us/doc/110x75/5a669cdb7f8b9a0c768b4a7b/obesity-and-diabetes-autosaved.jpg)