Embed Size (px)
Citation preview
Prevalence rates of the common non-
communicable diseases and their risk factors
in Lusaka district, Zambia
2008
Ministry of Health
Zambia
November 2008

2
Prevalence rates of the common non-communicable
diseases and their risk factors in Lusaka district,
Zambia 2008
Recommended citation
Ministry of Health [Zambia] and World Health Organization Country Office [Zambia].
Prevalence rates of the common non-communicable diseases and their risk factors in
Lusaka district, Zambia 2008. Lusaka, Zambia: Ministry of Health and World Health
Organization.

3
CONTENTS
Page
________________________________________________________________________
Tables 5
Figures 6
Preface 7
Acknowledgements 9
Executive summary 12
Abbreviations 17
1. Introduction 18
2. Literature review 20
3. Justification for Study and objectives 23
4. Materials and methods 24
4.1 Setting 24
4.2 Study Design 25
4.3 Eligibility criteria 25
4.4 Sample Size Determination 25
4.5 Sampling 27
4.6 Data Collection 29
4.7 Data Entry 32
4.8 Data Analysis 32
4.9 Ethical Consideration 32
5. Results 33
5.1 Demographics 33
5.2 Tobacco use 34
5.3 Alcohol consumption 36
5.4 Diet 38
5.5 Physical activity 38
5.6 Overweight or obese 44
5.7 Blood pressure 47

4
5.8 Impaired glucose tolerance or diabetes 50
5.9 Cholesterol 53
6. Discussion 55
6.1 Tobacco use 55
6.2 Alcohol consumption 56
6.3 Diet 57
6.4 Physical activity 58
6.5 Overweight or obese 59
6.6 Blood pressure 59
6.7 Impaired glucose tolerance or diabetes 60
6.8 Cholesterol 60
7. Possible limitations 62
8. Conclusions 63
9. Recommendations 64
10. References 65
11. Appendices 72
11.1 Participants’ Information Sheet
11.2 Consent Form
13.2 Questionnaire
5
TABLES
Number Caption Page
________________________________________________________________________
4.4.1 Information required for computing the sample size 25
4.4.2 Sample size distribution by province/district 26
4.4.3 Sample size allocation per ward in Lusaka district 27
5.1.1 Demographic characteristics for the sampled population 33
5.2.1 Tobacco use 34
5.2.2 Factors associated with tobacco smoking 35
5.3.1 Alcohol consumption 36
5.3.2 Factors associated with alcohol consumption 37
5.4.1 Consumption of fruits and vegetables 38
5.5.1.1 Vigorous-intensity activity at work 39
5.5.2.1 Vigorous-intensity recreational activity 40
5.5.3.1 Moderate-intensity physical activity at work 41
5.5.4.1 Moderate-intensity recreational activity 41
5.5.5.1 Walking or cycling to and from places 42
5.5.6.1 Sedentary behaviour 43
5.5.6.2 Factors associated with sedentary behaviour 44
5.6.1 Over weight or obese 45
5.6.2 Factors associated with over weight or obese 46
5.7.1 Raised blood pressure 47
5.7.2 Factors associated with moderate or severe hypertension 49
5.8.1 Diabetes 50
5.8.2 Factors associated with impaired glucose tolerance or diabetes 52
5.9.1 Cholesterol 53
5.9.2 Factors associated with raised levels of cholesterol 54
6
FIGURES
Number Caption Page
________________________________________________________________________
4.1.1 Map of Zambia showing the locations of the current 24
site, and proposed districts that will be covered for
non-communicable diseases nation-wide surveys

7
PREFACE
This report presents findings of a cross sectional study conducted in 2008 in Lusaka
district, Zambia, to determine prevalence rates of the common non-communicable
diseases and their risk factors. The Ministry of Health [Zambia] and the Word Health
Organization (WHO) through the Country Office [Zambia] provided the funding.
Quality health information is essential for planning and implementing health policy in all
countries. Risk factor data are especially important as predictors of future disease or
injury. The World Health Report 2002: Reducing risks, promoting healthy life, identifies
five important risk factors for non-communicable disease in the top ten leading risks to
health. These are raised blood pressure, raised cholesterol, tobacco use, alcohol
consumption, and overweight. The disease burden caused by these leading risk factors is
global. In every region of the world, including the poorest, raised blood pressure,
cholesterol, and tobacco use are causing serious disease and untimely deaths.
Country-level data is rare for many of these major non-communicable disease (NCD) risk
factors. When data is available, it is not always complete or comparable, especially if it is
based on self-reported health assessments or behaviour. A consistent approach to
collecting and analyzing NCD risk factor data is needed to promote the usefulness of this
data both for country health policy development and also for comparisons across
countries and regions. WHO is promoting the use of the STEPwise approach to enable
countries to set up surveillance systems for NCD risk factors.
STEPs is a sequential process of gathering comparable and sustainable NCD risk factor
information at the country-level. By using the same standardized questions and protocols,
all countries can develop surveillance systems containing quality information about NCD
risk factors in their unique settings. This information can, in turn, be used to plan for and
implement currently available interventions to address the disease patterns caused by
these risk factors.
8
The STEPS approach is based on the concept that NCD surveillance systems need to be
simple, focusing on a minimum number of risk factors that predict disease - before
placing too much emphasis on costly disease registers which are difficult to sustain in the
long-term.
STEPS is now being planned or implemented in 33 countries in WHO's South-East Asian
Region, Western Pacific Region, African Region and Eastern Mediterranean Region.
WHO/HQ is offering technical support in order to ensure quality control and enhance the
comparability of data collection. Some 40 countries including Zambia are in the process
of STEPS implementation.
Dr Peter Songolo
World Health Organization
Country Office
Zambia

9
ACKNOWLEDGEMENTS
The following people contributed to the study during the proposal development, data
collection, analysis, or report writing:
Professor Seter Siziya, UNZA, SoM, Lusaka, Zambia
Dr Peter Songolo, WHO Country Office, Lusaka, Zambia
Dr Fastone Goma, UNZA, SoM, Lusaka, Zambia
Dr Aggrey Mweemba, MoH, Lusaka, Zambia
Dr Godfrey Biemba, MoH, Lusaka, Zambia
Dr Mutale Nsakashalo-Senkwe, MoH, Lusaka, Zambia
Dr Victor Mukonka, MoH, Lusaka, Zambia

10
Non-communicable diseases’ steering committee:
Dr Victor Mukonka, DPHR, MoH, Lusaka, Zambia
Dr Lumbwe Chiwele, MSMH, Lusaka, Zambia
Professor Seter Siziya, UNZA, SoM, Lusaka, Zambia
Dr Peter Songolo, WHO Country Office, Lusaka, Zambia
Dr Fastone Goma, UNZA, SoM, Lusaka, Zambia
Dr Aggrey Mweemba, MoH, Lusaka, Zambia
Dr Godfrey Biemba, MoH, Lusaka, Zambia
Dr Peter Mwaba, UTH, Lusaka, Zambia
Dr Mutale Nsakashalo-Senkwe, MoH, Lusaka, Zambia
Dr Nanthalile Mugala, HSSP, Lusaka, Zambia

11
Research assistants
Mr Wilson Sakala
Mr Bothe Malunda
Mr Denis Mwamba
Mrs Eurita Phiri
Mrs Febby Hamalambo
Mr Henry Sinsungwe
Mrs Violet Phiri
Mr Charles Mate
Ms Martha Sakala
Ms Maureen Sakala
Ms Halina Chibuta

12
EXECUTIVE SUMMARY
Background
Developing countries are undergoing an epidemiological transition, from Communicable
or Infectious to ‘Non-Communicable’ diseases. (http://www.prb.org/Articles/2006
/ChronicDiseases BeleaguerDevelopingCountries.aspx>p=1), such that cardiovascular
disease, chronic respiratory diseases, cancer, and diabetes were responsible for 60% of all
deaths globally in 2005, with more than 75% of these deaths occurring in developing
countries (World Health Organization, 2005a). Unhealthy diet, physical inactivity,
tobacco and alcohol use are important preventable major risk factors for chronic diseases
that are related to lifestyle choices (http://www.prb.org/Articles/2006/Chronic
DiseasesBeleaguer DevelopingCountries.aspx>p=1). The basis for prevention is the
identification of these risk factors which underlie most chronic non-communicable
diseases. The leading risk factor globally is raised blood pressure, followed by tobacco
use, raised total cholesterol, and low fruit and vegetable consumption (World Health
Organization, 2005b). Although limited Global School-Based Student Health Surveys
and Global Youth Tobacco Survey enquiring on the lifestyles of adolescents had been
conducted in Zambia (http://www.who.int/chp/gshs/Zambia%20fs%202004.pdf; Siziya,
Rudatsikira & Muula, 2007a; Siziya, Rudatsikira, Muula & Ntata, 2007b; Muula &
Siziya, 2007; Siziya, Muula, Kazembe & Rudatsikira, 2008; Muula, Kazembe,
Rudatsikira & Siziya, 2007), no similar studies or more comprehensive studies had been
conducted among the older age groups.
Objectives:
The aim of the survey was to determine the prevalence of common Non-Communicable
Diseases (NCDs) and their associated risk factors in Zambia. Specifically the study was
designed to determine the prevalence rates of the common NCDs and the extent to which
behavioural and biological factors are associated with NCDs among Zambians.

13
Methodology
A cross sectional study utilizing a modified WHO STEPwise approach to surveillance of
NCDs was conducted in Lusaka district, Zambia. Altogether 1928 individuals of ages 25
years or more participated in the study. Sex was not recorded on six of these participants,
leaving us with 634 males and 1288 females. Multi-stage cluster sampling technique
was used to select study participants. Finally all eligible members of a household that
was selected were requested to participate in the study.
Information was gathered using a structured interview schedule. Data that was collected
included socio-demographic factors, tobacco use, alcohol consumption, low intake of
fruit and vegetable, physical inactivity, raised blood pressure, raised fasting blood
glucose, obesity, and high levels of fat in the blood. Measurements of height, weight,
waist, and blood pressure were taken, and blood tests for sugar and fats were conducted.
Data was double entered by two data entry clerks using Epi Data version 3.1. After data
editing, analysis was done using SPSS version 14.0. Unadjusted odds ratios (OR) and
their 95% confidence intervals (CI) are presented together with adjusted odds ratios
(AOR) with their 95%CI obtained using Complex samples logistic regression having
considered Standard Enumeration Areas as strata in order to determine independent
predictors for selected risk factors for NCDs. Only significant factors at 5% level in
bivariate analyses were considered in a multivariate analysis.
Results
A total of 1928 individuals participated in the survey, of which 33.0% were males.
About half of the participants were of age 25-34 years (53.2%), and about a third of the
respondents had attained secondary level of education (35.8%). The rate for current
tobacco smoking was 6.8% (17.5% for males and 1.5% for females), current consumption
of alcohol was 20.7% (37.9% of males and 12.2% of females), fruit was 23.6% and
vegetable was 94.9% for most of the week, and physical activity was 31.4% (33.4% of
males and 30.5% of females) for moderate-intensity recreational-related activities, and
15.1% (29.7% of males and 8.7% of females) for vigorous-intensity recreational

14
activities. Overweight or obese was estimated at 39.3% (20.6% of males, and 48.6% of
females). The rate for moderate or severe hypertension was 12.5% (11.0% of males and
13.2% of females). The prevalence for impaired glucose level or diabetes was 4.0%, and
that for raised cholesterol levels was 15.8%.
In multivariate analysis, factors associated with cigarette smoking were: sex, and body
mass index (BMI). Female respondents were 90% (AOR=0.10, 95%CI [0.05, 0.23]) less
likely to smoke cigarettes compared to male respondents. Compared to respondents who
had <18.5 BMI, respondents who had higher BMI were less likely to smoke (AOR=0.30
(95%CI [0.15, 0.61]) for 18.5-24.9 BMI; AOR=0.12 (95%CI [0.05, 0.31]) for 25.0-29.9
BMI; and AOR=0.03 (95%CI [0.00, 0.26]) for 30+ BMI.
Sex was associated with alcohol consumption, with females being 68% (AOR=0.32,
95%CI [0.20, 0.51]) less likely to consume alcohol compared to male respondents.
Factors associated with sitting or reclining for at least three and half hours on a typical
day were age, and work involving vigorous-intensity and moderate-intensity, Compared
to respondents of age 25-34 years, respondents who were of age 45 years or more were
31% (AOR=0.69, 95%CI [0.55, 0.87]) less likely to have sedentary behaviour.
Respondents who were not involved in moderate-intensity and vigorous-intensity
activities at work were 32 % (AOR=0.68, 95%CI [0.55, 0.84]) and 48% (AOR=0.52,
95%CI [0.39, 0.69]) less likely, respectively, to have sedentary behaviour compared to
respondents who were involved in such work-related activities.
Age, sex, cigarette smoking, and blood pressure were significantly associated with
overweight or obese. Participants in the age groups 35-44 years and 45+ years were more
likely to be overweight or obese (AOR=3.17 (95%CI [1.85, 5.44]) for age group 35-44
years; and AOR=2.37 (95%CI [1.32, 4.26]) for the age group 45+ years) compared to
participants who were of age 25-34 years.. The female gender was positively associated
with being overweight or obese (AOR=3.94, 95%CI [2.45, 6.33]). Non-smokers were
3.62 (95%CI [1.74, 7.54]) times more likely to be overweight or obese compared to
15
smokers. Compared to participants who had normal blood pressure, participants who had
mild or moderate hypertension were more likely to be overweight or obese (AOR=1.74
(95%CI [1.05, 2.88]) for mild hypertension, and AOR=3.37 (95%CI [1.53, 7.39]) for
moderate hypertension).
Factors associated with moderate or severe hypertension were: age, BMI, and cholesterol.
Compared to respondents in the age group 25-34 years, older respondents were more
likely to have moderate or severe hypertension (AOR=2.27 (95%CI [1.41, 3.67]) for 35-
44 years age group, and AOR=8.66 (95%CI [5.75, 13.04]) for age group 45+ years).
Compared to respondents with BMI of <18.5, those with BMI of 25+ were more likely to
have moderate or severe hypertension (AOR=2.63 (95%CI [1.23, 5.63]) for 25.0-29.9
BMI, and AOR=4.16 (95%CI [1.91, 9.06]) for 30+ BMI). Participants with raised
cholesterol levels were 63% (95%CI [1.11, 2.40]) more likely to have moderate or severe
hypertension compared to participants with normal cholesterol levels.
Age and mild hypertension were significantly associated with impaired levels of glucose
or diabetes. Compared to participants in the age group 25-34 years, older participants
were more likely to have impaired glucose tolerance or diabetes (AOR=2.49 (95%CI
[1.35, 2.92]) for 35-44 years age group, and AOR=3.80 (95%CI [2.00, 7.23]) for 45+
years age group). Mild hypertension was associated with impaired glucose tolerance or
diabetes (AOR=2.57 (95%CI [1.44, 4.57]).
Factors associated with raised cholesterol levels were: age, and BMI. Older participants
were less likely to have raised cholesterol levels compared to participants in the age
group 25-34 years (AOR=0.44 (95%CI [0.31, 0.61]) for 35-44 years age group, and
AOR=0.66 (95%CI [0.46, 0.95]) for 45+ years age group. Respondents who had BMI of
25 or more were more likely to have raised cholesterol levels compared to those who had
BMI of less than 18.5 (AOR=3.38 (95%CI [1.68, 6.79] for 25.0-29.9 BMI, and
AOR=2.92 (95%CI [1.38, 6.17]) for 30+ BMI).
16
Conclusions and recommendations
The tobacco smoking epidemic is in its early stage, as well as for diabetes. Hypertension,
hypercholesterolemia, alcohol consumption, and overweight or obese are already at
alarming levels. Although most people in the study setting consumed vegetables, the
amount eaten was below the amount recommended by WHO. The frequency and amount
of fruit consumption was also below the levels recommended by WHO. Only a small
proportion of the respondents were involved in physical activity. Concerted effort to
control tobacco use among adolescents when a significant proportion of adults initiate the
habit guided by the WHO FCTC is needed. Health education interventions for people to
adopt healthier lifestyles should be formulated taking into account the observed
associations of the risk factors. This should include diet and physical activity in the
programs.
17
ABBREVIATIONS
AIDS Acquired Immunodeficiency Syndrome
DPHR Directorate of Public Health and Research
HIV Human Immunodeficiency Virus
HSSP Health Systems and Support Program
MoH Ministry of Health
MSMH Maina Soko Military Hospital
NCDs Non-Communicable Diseases
SoM School of Medicine
UNZA University of Zambia
UTH University Teaching Hospital
WHO World Health Organization

18
CHAPTER 1
INTRODUCTION
“Non-communicable diseases (NCDs)” is a term used for chronic diseases that are non-
infectious. They share common important features which include the following: They
have their origin at young ages and epidemics take several years to become well
recognized; NCDs to be treated, need long term systemic approach; and in view of their
long duration, there are opportunities for prevention. Cardiovascular disease, chronic
respiratory diseases, cancer, and diabetes were responsible for 60% of all deaths globally
in 2005, with more than 75% of these deaths occurring in developing countries (World
Health Organization, 2005a).
Some NCDs like cardiovascular diseases are increasingly affecting the working-age
populations (ages 35 to 64 years) in low- and middle-income countries than in the United
States and Portugal (Leeder et al, 2004). The control of NCDs has received little
attention. For instance, the reduction of Non Communicable diseases is not a Millennium
Development Goal (Horton, 2005). Many governments and organisations have focussed
on controlling diseases like HIV/AIDS, malaria and Tuberculosis, and neglecting NCDs
(Horton, 2005).
Current estimates indicate that Zambia may be one of the countries with a high
prevalence of NCDs. For example, the number of people suffering from Diabetes
mellitus in Zambia was estimated at 70,000 in 2000. This number is expected to increase
to 186, 000 by 2030 (http://www.who.int/diabetes/facts/world_figures/en/index1.html).
Hypertension was estimated around 608,034 from the same population
(http://www.wrongdiagnosis.com/h/ hypertension/stats-country.htm). These are only
estimates which may not represent the actual prevalence of hypertension and Diabetes
mellitus.
In view of the fact that the main risk factors associated with NCDs like tobacco smoking,
excessive alcohol intake, sedentary lifestyles, including poor diet, are modifiable through

19
changes in lifestyles, it is important that levels of these risk factors in the communities
are identified and interventions put in place.
20
CHAPTER 2
LITERATURE REVIEW
The major NCDs which include cardiovascular diseases (CVD), cancer, chronic
respiratory diseases and diabetes contribute immensely to mortality (World Health
Organization, 2005a). All these diseases are associated with identifiable behavioural risk
factors and biological risk factors. The two groups of risk factors are closely linked. The
major behavioural risk factors are tobacco use, unhealthy diet and physical inactivity
(http://www.prb.org/Articles/2006/ChronicDiseasesBeleaguerDevelopingCountries.aspx
>p=1). And the major biological risk factors include; obesity, hypertension, diabetes and
dyslipidemia (Yusuf et al, 2001). Most of these factors are modifiable through lifestyle
interventions. Below we discuss associations of behavioural risk factors and biological
risk factors on one hand and the NCDs on the other.
2.1 Tobacco smoking.
Worley (http://www.prb.org/Articles/2006/ChronicDiseasesBeleaguerDeveloping
Countries.aspx>p=1) reports that the most important risk factors like unhealthy diet,
tobacco use and physical inactivity, for chronic diseases are related to lifestyle choices.
The author further reports that smoking is a risk factor for a number of chronic diseases,
including CVD, cancer, and chronic respiratory conditions. In the Europe, the proportion
of CVD deaths attributable to smoking in 35-69 years age group is 32% among men and
6% among women (http://rum.ctsu.ox.ac.uk/~tobacco/FINALAPP34.PD).
There is scarcity of information on smoking in Zambia. Recent findings from school
health surveys suggest that as much as 27% of school going adolescents in Chongwe
district of Zambia smoke (Siziya et al, 2007b). The earlier a person starts to smoke, the
higher the chances of being a smoker in later life (Chen & Millar, 1998). There is
evidence that smoking is increasing in low income countries. This is supported by data
showing that the numbers of deaths due to smoking are as many in developing countries
as in developed countries. For example 1.3 billion people world wide smoke and 84% of
these are in developing and middle class countries (www.who.int).

21
2.2 Harmful alcohol use
Despite communities having the knowledge of the physical, psychological and social
problems associated with abuse of alcohol, it is being used in most cultures (Naranjo et
al, 1993). Apart from social consequences related to alcohol intoxication like impaired
driving, aggression and violence towards others and self, unemployment, productivity
losses, marital discord, alcohol consumption is also associated with chronic diseases
(Naranjo et al, 1993; http://www.hc-sc.gc.ca/ahc-asc/activit/strateg/drugs-drogues).
The drinking of home brewed alcohol has been linked to oesophageal carcinoma in parts
of Zambia. The association has been linked to contaminants like Zinc, Iron, Copper and
Nitrosamine-like compounds which result from the use of old metal drum during
production (Reilly, 1976). Home brewed alcohol which is unrecorded may account for a
significant percent of total alcohol consumption in Zambia. One survey reported 29% of
those surveyed indicated consuming illicit alcohol (Haworth & Simpson, 2004).
In another survey in Kitwe among miners, Buchanan showed that 30% of accident cases
had measurable blood alcohol levels. Buchanan also reports that a third of randomly
selected miners had measurable alcohol before starting work and 9% of these had levels
above 17.8 mmol/l. He further reports that two thirds of a group of miners referred to
hospital on suspicion of being under the influence of alcohol had blood alcohol levels
exceeding 35.2 mmol/l. He concludes that the studies were significant enough to justify
further studies (Buchanan, 1988). It would be important to find out if these findings still
apply even today.
A recent report on the Zambia 2004 Global School-based Student Health Survey
indicates that levels of drinking alcohol among 13-15 year-olds-school going adolescents
are as high as 38.7% among males, and 45.1% among females (http://www.who.int/chp/
gshs/Zambia%20fs%202004.pdf).

22
2.3 Physical inactivity and unhealthy diets.
Work and living situations have become more sedentary and diets have shifted to foods
high in fats and sugars increasing the risk of NCDs (http://www.prb.org/Articles/2006/
ChronicDiseasesBeleaguerDevelopingCountries.aspx>p=1). Physical inactivity increases
the risk of many chronic diseases, such as type 2 diabetes (Dunstan et al, 2007; Booth et
al, 2002).
Data shows that there is an increase in obesity in developing countries with more than
30% of the populations in Latin America, the Caribbean, the Middle East and northern
Africa being obese (Delpeuch & Maire, 1997). Metabolic syndrome which is a group of
disorders that include obesity, insulin resistance, glucose intolerance, abnormal lipids and
hypertension has been associated with reduced physical activities (Gao et al, 2007;
Nelson & Gordon-Larsen, 2006).
Low physical activity like prolonged television viewing may contribute to metabolic
syndrome through related poor eating habits (Dunstan et al, 2007). Several studies have
showed an association between prolonged television viewing and metabolic syndrome
(Dunstan et al, 2007; Gao et al, 2007). Metabolic syndrome has been linked to type 2
Diabetes mellitus, cardiovascular diseases and mortality and therefore reducing sedentary
behaviour has a role in the prevention of these chronic diseases (Dunstan et al, 2007).
Nelson and Gordon-Larsen (2006) observed that enhancing opportunities for increased
exercises and sport may have a beneficial effect in leading risk behaviours.
In 2004, 33.1% of male and 32.7% of female school going adolescents of age 13-15 years
in Zambia reported spending three or more hours during a typical day sitting and
watching television, playing computer games, talking with friends, or doing other sitting
activities (http://www.who.int/chp/gshs/Zambia%20fs%202004.pdf). No similar studies
have been conducted among non-school going adolescents or among older age groups.
23
CHAPTER 3
STUDY JUSTIFICATION AND OBJECTIVES
The key to controlling the global NCDs epidemics is primary prevention based on
comprehensive population-wide programmes. The aim is to avert these epidemics
whenever possible and to control them as quickly as possible when they have already
occurred. The basis for prevention is the identification of the major common risk factors
and their prevention and control programmes. It is thus important to conduct surveys
from time to time to assess the prevalence of behavioural and biological risks for NCDs.
These data generated provide information on the magnitude of some of the NCDs and
provide a platform for planning and implementation to prevention and treatment.
The general objective of the survey was to determine the prevalence of common NCDs
and their associated risk factors in Zambia.
The specific objectives were: To determine the prevalence rates of the common NCDs,
and to determine the extent of behavioural factors and biological factors associated with
NCDs among Zambians.
24
CHAPTER 4
MATERIALS AND METHODS
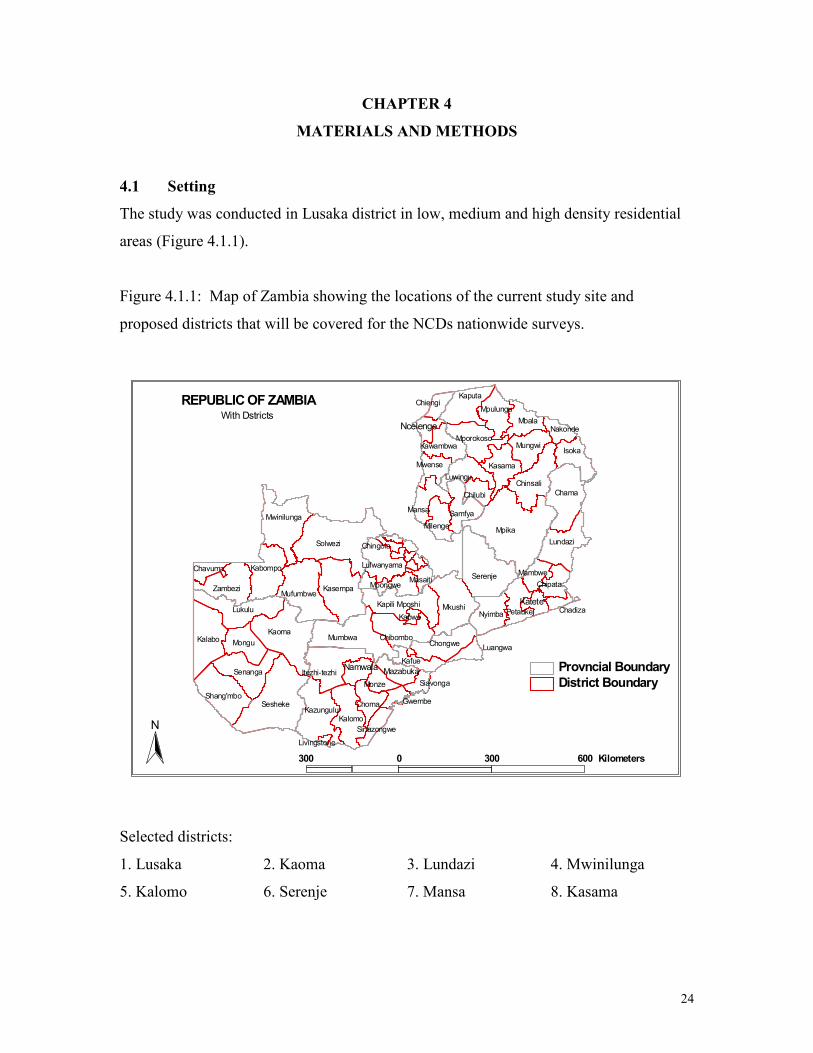
4.1 Setting
The study was conducted in Lusaka district in low, medium and high density residential
areas (Figure 4.1.1).
Figure 4.1.1: Map of Zambia showing the locations of the current study site and
proposed districts that will be covered for the NCDs nationwide surveys.
Selected districts:
1. Lusaka 2. Kaoma 3. Lundazi 4. Mwinilunga
5. Kalomo 6. Serenje 7. Mansa 8. Kasama
Mpika
Solwezi
Sesheke
Kaoma
Serenje
Mkushi
Kalabo
Chama
Mumbwa
Lukulu
Kasempa
Chinsali
Mufumbwe
Mwinilunga
Kalomo
Lundazi
Kazungulu
Kaputa
Senanga
Isoka
Zambezi
Kabompo
Shang'mbo
Mongu
Itezhi-tezhi
Nyimba
Mbala
Samfya
Chibombo
Mungwi
Chongwe
Kapili Mposhi
Kasama
Mansa
Mporokoso
Luwingu
Mpulungu
Petauke
Choma
Kafue
Milenge
Lufwanyama
Mpongwe Chipata
Kawambwa
Mwense
Chilubi
Monze
Mambwe
Nakonde
Chiengi
Masaiti
Chavuma
Luangwa
Sinazongwe
Siavonga
Gwembe
ChadizaKabwe
Chingola
Livingstone
Ncelenge
Katete
MazabukaNamwala
District Boundary
Provncial Boundary
300 0 300 600 Kilometers
N
REPUBLIC OF ZAMBIAWith Dstricts

25
4.2 Study Design
A cross sectional study utilising a modified WHO global surveillance initiative NCD-
STEP 3 (World Health Organization, 2005b) was used in the proposed study.
4.3 Eligibility Criteria
Individuals (male or female) aged 25 years or older were eligible to participate in the
study.
4.4 Sample Size Determination
The following formulae were used to determine the required sample size using the Statcal
programme in Epi Info version 6.04:
n
Sample size = ________________
n
1 + ____________
Population size
P (1-P)
Where n = Z2 ____________
e2
Using the information in the Table 4.4.1, the sample size needed was 383.
Table 4.4.1: Information required for computing the sample size
Total Population Size 1123753
Level of Confidence Measure 1.96 (at 95% Confidence level)
Margin of Error (e2) 5%
Baseline levels of the indicators (P) 50% (as no estimates exist)
Number of provincial estimates 8 provinces
Design effect 2.00 (as no information on
previous surveys is available)
26
Correcting for the loss of sampling efficiency due to the use of cluster sampling and
considering the 8 provinces, we then have a sample size of 6128. Adjusting for 80%
response rate, we get a sample size of 7660. By the end of a series of surveys to be
conducted country-wide, we would have recruited 7660 participants from one urban and
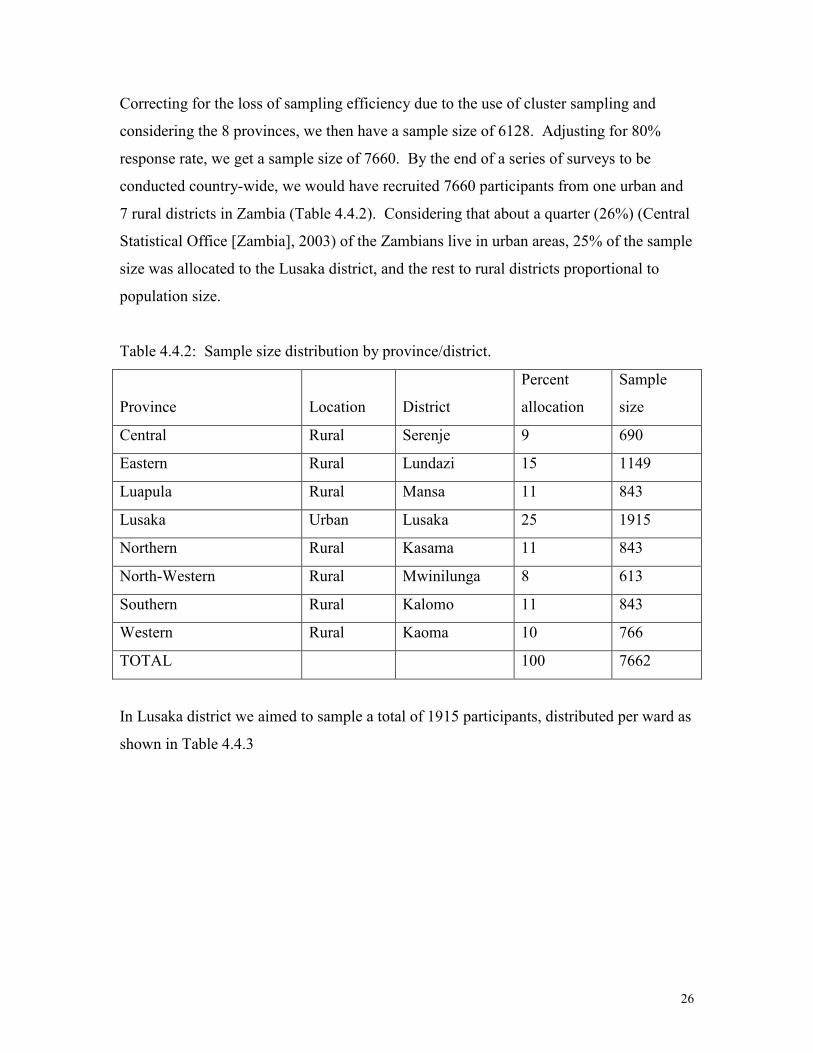
7 rural districts in Zambia (Table 4.4.2). Considering that about a quarter (26%) (Central
Statistical Office [Zambia], 2003) of the Zambians live in urban areas, 25% of the sample
size was allocated to the Lusaka district, and the rest to rural districts proportional to
population size.
Table 4.4.2: Sample size distribution by province/district.
Province
Location
District
Percent
allocation
Sample
size
Central Rural Serenje 9 690
Eastern Rural Lundazi 15 1149
Luapula Rural Mansa 11 843
Lusaka Urban Lusaka 25 1915
Northern Rural Kasama 11 843
North-Western Rural Mwinilunga 8 613
Southern Rural Kalomo 11 843
Western Rural Kaoma 10 766
TOTAL 100 7662
In Lusaka district we aimed to sample a total of 1915 participants, distributed per ward as
shown in Table 4.4.3

27
Table 4.4.3: Sample size allocation per ward in Lusaka district.
Ward
Percent allocation
proportional to
population size
Sample size
Chakunkula 11 211
Kamwala 14 268
Mulungushi 4 77
Mwembeshi 46 881
Nkoloma 25 479
TOTAL 100 1916
4.5 Sampling
A multi-stage cluster sampling technique was used to select study participants.
First stage of sampling 1 urban and 7 rural provinces
We conveniently sampled Lusaka to represent urban provinces (Lusaka and Copperbelt).
The rest of the provinces that were rural were included in the sample: Central, Eastern,
Luapula, Northern, North-Western, Southern, and Western.
Second stage of sampling 1 urban and 7 rural districts
There were 9 urban and 63 rural districts in Zambia. A district was classified as urban if
it had more urban than rural health centres, and conversely, it was classified as rural if it
had more rural than urban health centres (Ministry of Health [Zambia], 2008).
Central province had 5 rural districts (Chibombo, Kapiri Mposhi, Mkushi, Mumbwa, and
Serenje) and one urban district, Kabwe. With the exclusion of the urban district from the
sampling frame, Serenje district was randomly selected from the remaining rural districts.
Lundazi district was randomly selected from all 8 rural districts (Chadiza, Chama,
Chipata, Katete, Lundazi, Mambwe, Nyimba, and Petauke) in Eastern province. In
Luapula province, Mansa distict was randomly selected among 7 rural districts (Chiengi,
Kawambwa, Mansa, Milenge, Mwense, Nchelenge, and Samfya). All the 12 districts in

28
Northern province were rural (Chilubi, Chinsali, Isoka, Kaputa, Kasama, Luwingu,
Mbala, Mpika, Mporokoso, Mpulungu, Mungwi, and Nakonde), and Kasama was
randomly selected form the list. All the 7 districts (Chavuma, Kabompo, Kasempa,
Mufumbwe, Mwinilunga, Solwezi, and Zambezi) in North-Western province were rural,
and Mwinilunga was randomly selected. Southern province had 1 urban district
(Livingstone) and 10 rural districts (Choma, Gwembe, Itezhi tezhi, Kalomo, Kazungula,
Mazabuka, Monze, Namwala, Siavonga, and Sinazongwe). Livinstone being an urban
district was excluded from the sampling frame. Kalomo was randomly selected from the
10 rural districts. All the 7 districts in Western province were rural (Kalabo, Kaoma,
Lukulu, Mongu, Senanga, Sesheke, and Shang’ombo), and Kaoma was randomly
selected.
Sampling stages 3 to 6
We present here the 3rd to 6
th stages of sampling that were done for the Lusaka survey
only, and for the remaining districts, sampling procedures will be presented in later
versions of the report when those districts will be surveyed.
Third stage of sampling constituencies
Lusaka district had 7 constituencies (Chawama, Kabwata, Kanyama, Lusaka Central,
Matero, Munali, and Mandevu), out of which 5 (Chawama, Kabwata, Matero, Munali,
and Mandevu) were randomly selected.
Fourth stage of sampling wards
From each selected constituency, one ward was selected. Mandevu constituency had 6
wards (Chaisa, Justine Kabwe, Mulungushi, Ngwerere, Raphael Chota, and Roma).
Roma and Mulungushi wards were mainly low density areas, and Mulungushi was
randomly selected to represent low density areas in Lusaka district. Chawama ward was
randomly selected among other wards: Lilayi and Nkoloma in Chawama constituency.
Kabwata constituency had Chilenje, Kabwata, Kamwala, and Libala wards; and
Kamwala was randomly selected. In Matero constituency, Mwembeshi was randomly
selected among other wards: Kapwepwe, Lima, Matero, and Muchinga. Finally, in
29
Munali constituency, Chakunkula was randomly selected among other wards: Chainda,
Kalingalinga, Mtendere, and Munali.
Fifth stage of sampling Standard Enumeration Areas (SEAs)
The number of Standard Enumeration Areas (SEAs) selected in each ward was
proportional to its population size. Six SEAs were selected using a 1 in 4 systematic
random sampling method from 24 SEAs in Chakunkula ward. Nine out of 31 SEAs were
selected from Kamwala wards using a 1 in 3 systematic random sampling method. From
Mulungushi ward, 4 out of 15 SEAs were selected using a 1 in 4 systematic random
sampling method. Mwembeshi had 45 SEAs, out of which 12 were selected using a 1 in
4 systematic random sampling method. In Nkoloma ward, 11 out of 42 SEAs were
selected using a 1 in 4 systematic random sampling method.
Sixth stage of sampling households and eligible persons
Households were systematically sampled in order to widely cover the selected SEAs. All
persons of ages 25 or more years were requested to participate in the survey.
4.6 Data collection
The WHO global surveillance initiative for NCD (World Health Organization, 2005b)
has three steps: Step 1 is the questionnaire, Step 2 is physical examinations, and Step 3 is
biochemical examinations. All these steps were conducted within the participant’s house.
Two nurses, 2 technologists, 1 undergraduate student, 1 Diploma student, and 1 person
with experience with the Central Statistical Office in surveys, and 1 person with little
experience in surveys who later had intensive training worked initially in two groups and
later in four groups. A driver was tasked to drive the interviewers around and carry field
equipment.
Interviews
An interview schedule was used to elicit responses from the interviewees. The
questionnaires was divided into the following sections: Demographic information,

30
Tobacco use, Alcohol consumption, Diet, Physical activity (physical activity at work, for
transport, during leisure time, and sedentary behaviour), History of raised blood
pressure, History of diabetes, biological measurements (Height and Weight, Waist, Blood
pressure, Hip circumference and Heart rate) and biochemical measurements (Blood
glucose, Blood lipids, and Triglycerides and HDL cholesterol).
Measurements
The WHO STEPs surveillance training and practical guide recommends that physical
measurements be taken in the following order: height, weight, waist circumference, and
blood pressure. We chose to take blood pressure readings first, after having administered
the questionnaire. This gave the participant enough time to have settled down.
Blood pressure
The Omron Digital Automatic BP Monitor M4-1 was used to measure the blood pressure
of the participants. Three minutes of rest was given to the participant in between three
successive readings of blood pressure. Although the three readings were different with
the largest value being the first reading and the smallest being the third reading on
average, these differed by no more than 2 mm/Hg of systolic blood pressure, and no more
than 4.5 mm/Hg of diastolic blood pressure. We chose to take an average of the three
reading, and not the average of the second and third readings as recommended by World
Health Organisation in order to increase the degrees of freedom for the mean.
Height
The Seca Brand 214 Portable Stadiometer was used to measure the height of the
participant. Height was measured without the participant wearing foot or head gear.
Before the reading was taken, the participant was requested to have feet together, heels
against the back board, knees straight, and look straight ahead. Height was recorded in
centimetres.

31
Weight
Weight was measured using the Heine Portable Professional Adult Scale 737.
Participants were asked to stand still, face forward, and place arms on the sides of the
body. Weight was recorded in kilograms.
Waist circumference
The Figure Finder Tape Measure was used to measure the waist circumference in
centimetres. This measurement was taken in a private area. The midpoint between the
inferior margin of the last rib and the crest of the ilium were marked using a tape
measure. With the assistance of the participant, the tape measure was wrapped around
the waist directly over the skin or light clothing. Just before the measurement was taken,
the participant was requested to stand with their feet together, place their arms at their
side of their body with the palms of their hands facing inwards, and breathe out gently.
Hip circumference
The measurement for hip circumference was taken in a private area immediately after the
waist circumference. The Figure Finder tape Measure was used in measuring the hip
circumference in centimetres. The measurement was taken at the maximum
circumference over the buttocks, after requesting the participant to relax the arms at the
sides.
Heart rate
The heart rate was recorded simultaneously while taking blood pressure readings using
the ORMRON digital automatic blood pressure monitor M4-1.
Biochemical measurements
Fasting glucose and total cholesterol were determined using an Accutrend GCT Meter
Three-in-One System (Glucose, Cholesterol and Triglycerides).

32
4.7 Data entry
Two data entry clerks were trained to enter the data using Epi Data version 3.1. Data was
double entered and validated. The data entry template had consistency and range checks
embedded in it. The data entry clerks were trained and supervised by the Principal
Investigator. The validated data was exported to SPSS version 14.0 for analysis.
4.8 Data Analysis
The analysis included running frequencies, cross-tabulations, bivariate, and multivariate
Backward logistic regression. Unadjusted odds ratios (OR) and their 95% confidence
interval (CI), and adjusted odds ratios (AOR) and their 95%CI are presented.
Body mass Index (BMI) was categorized as <18.5 (lean), 18.5-24.9 (normal), 25.0-29.9
(over weight), and 30+ (obese); waist-hip ratios was grouped into two: <1 (normal) and
>1 (raised); systolic blood pressure was grouped into four levels: <140 (normal), 140-169
(mild hypertension), 170-179 (moderate hypertension), and 180+ (severe hypertension);
similarly diastolic blood pressure was grouped into four levels: <90 (normal), 90-99
(mild hypertension), 100-109 (moderate hypertension), and 110+ (severe hypertension).
Glucose levels were grouped into hypoglycaemia, normal, impaired glucose tolerance,
and diabetes; and cholesterol levels were either normal (<5.2 mmol/L) or otherwise
raised.
4.9 Ethical considerations
The study protocol was reviewed by the University of Zambia (UNZA) Research Ethics
Committee (REC), and the study only commenced when approval from the UNZA REC
was granted. All entry forms were kept in the office of the Principal Investigator. Entry
forms were only viewed by approved study personnel.

33
CHAPTER 5
RESULTS
5.1 Demographics
A total of 1928 individuals participated in the survey, of which 33.0% were males.
About half of the participants were of age 25-34 years (53.2%), and a third of the
respondents had attained secondary level of education (35.8%). About 1 in 5 of the
respondents were either self employed (22.5%) or housewives (20.0%). Further
description of the sample is presented in Table 5.1.1
Table 5.1.1: Demographic characteristics for the sampled population.
Total Male Female
Factor n (%) n (%) n (%)
Age group (years)
25-34 1015 (53.2) 337 (53.7) 675 (52.9)
35-44 413 (21.6) 135 (21.5) 277 (21.7)
45+ 481 (25.2) 156 (24.8) 323 (25.3)
Sex
Male 634 (33.0) - -
Female 1288 (67.0) - -
Education
None 408 (21.5) 76 (12.2) 330 (26.0)
Primary 276 (14.5) 61 (9.8) 214 (16.9)
Secondary 679 (35.8) 242 (38.8) 435 (34.3)
College/university 534 (28.1) 244 (39.2) 290 (22.9)
Main work status
government employee 231 (12.0) 116 (18.5) 115 (9.1)
non-government employee 224 (11.6) 124 (19.8) 100 (7.9)
self employed 433 (22.5) 160 (25.6) 273 (21.5)
domestic worker 73 (3.8) 39 (6.2) 34 (2.7)
Student 65 (3.4) 31 (5.0) 34 (2.7)
house wife 385 (20.0) - 383 (30.2)
Retired 81 (4.2) 52 (8.3) 29 (2.3)
unemployed (able to work) 234 (12.1) 84 (13.4) 148 (11.7)
unemployed (unable to work) 174 (9.0) 20 (3.2) 152 (12.0)
34
5.2 Tobacco use
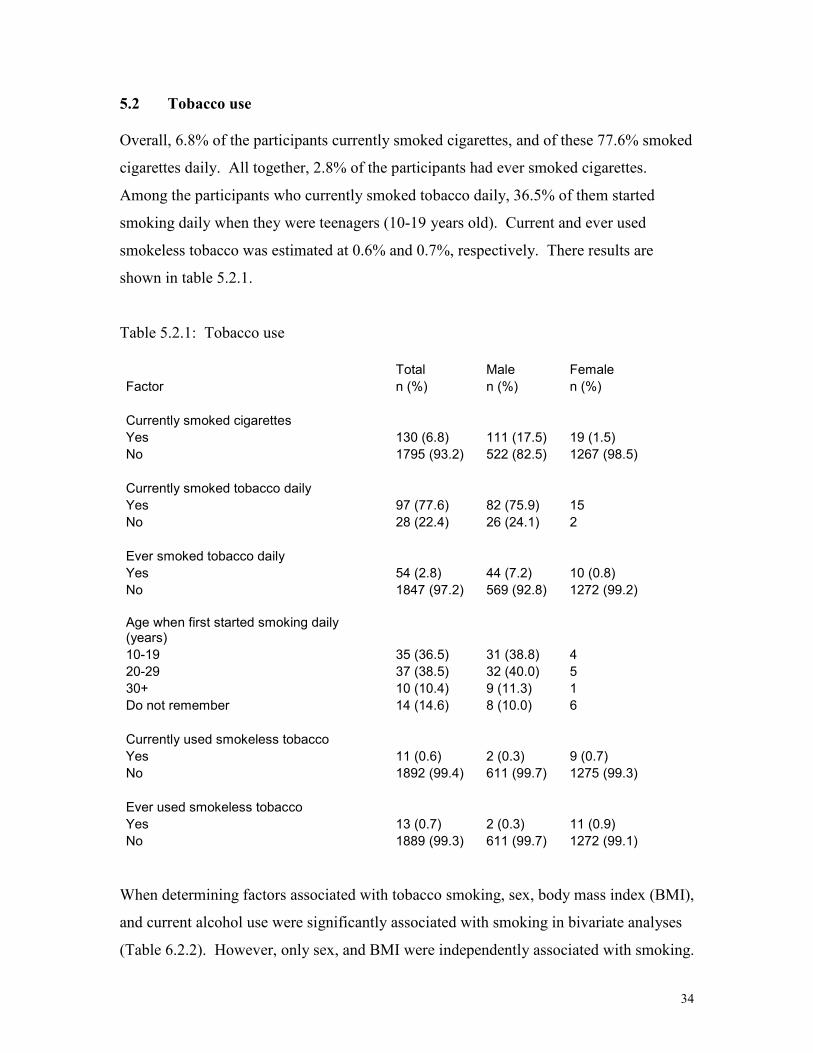
Overall, 6.8% of the participants currently smoked cigarettes, and of these 77.6% smoked
cigarettes daily. All together, 2.8% of the participants had ever smoked cigarettes.
Among the participants who currently smoked tobacco daily, 36.5% of them started
smoking daily when they were teenagers (10-19 years old). Current and ever used
smokeless tobacco was estimated at 0.6% and 0.7%, respectively. There results are
shown in table 5.2.1.
Table 5.2.1: Tobacco use
Total Male Female
Factor n (%) n (%) n (%)
Currently smoked cigarettes
Yes 130 (6.8) 111 (17.5) 19 (1.5)
No 1795 (93.2) 522 (82.5) 1267 (98.5)
Currently smoked tobacco daily
Yes 97 (77.6) 82 (75.9) 15
No 28 (22.4) 26 (24.1) 2
Ever smoked tobacco daily
Yes 54 (2.8) 44 (7.2) 10 (0.8)
No 1847 (97.2) 569 (92.8) 1272 (99.2)
Age when first started smoking daily (years)
10-19 35 (36.5) 31 (38.8) 4
20-29 37 (38.5) 32 (40.0) 5
30+ 10 (10.4) 9 (11.3) 1
Do not remember 14 (14.6) 8 (10.0) 6
Currently used smokeless tobacco
Yes 11 (0.6) 2 (0.3) 9 (0.7)
No 1892 (99.4) 611 (99.7) 1275 (99.3)
Ever used smokeless tobacco
Yes 13 (0.7) 2 (0.3) 11 (0.9)
No 1889 (99.3) 611 (99.7) 1272 (99.1)
When determining factors associated with tobacco smoking, sex, body mass index (BMI),
and current alcohol use were significantly associated with smoking in bivariate analyses
(Table 6.2.2). However, only sex, and BMI were independently associated with smoking.

35
Female respondents were 90% (AOR=0.10, 95%CI [0.05, 0.23]) less likely to smoke
cigarettes compared to male respondents. Compared to respondents who had <18.5 BMI,
respondents who had higher BMI were less likely to smoke (AOR=0.30 (95%CI [0.15,
0.61]) for 18.5-24.9 BMI; AOR=0.12 (95%CI [0.05, 0.31]) for 25.0-29.9 BMI; and
AOR=0.03 (95%CI [0.00, 0.26]) for 30+ BMI.
Table 5.2.2: Factors associated with tobacco smoking
Unadjusted Adjusted
Factor OR (95%CI) AOR (95%CI)
Age (years)
25-34 1 -
35-44 1.36 (0.88, 2.12)
45+ 1.20 (0.77, 1.85)
Sex
Male 1 1
Female 0.07 (0.04, 0.12) 0.10 (0.05, 0.23)
Completed level of education
None 1 -
Primary 1.21 (0.69, 2.09)
Secondary 0.92 (0.58, 1.47)
College/university 0.62 (0.36, 1.06)
Body Mass Index (BMI)
<18.5 1 1
18.5-24.9 0.43 (0.27, 0.69) 0.30 (0.15, 0.61)
25.0-29.9 0.12 (0.06, 0.24) 0.12 (0.05, 0.31)
30+ 0.05 (0.02, 0.18) 0.03 (0.00, 0.26)
Consumed alcohol in past 30 days
Yes 1 1
No 0.39 (0.20, 0.76) 0.68 (0.32, 1.44)
Time usually spent sitting or reclining on a typical day
<1.5 1 -
1.5-3.4 1.06 (0.68, 1.67)
3.5+ 0.98 (0.61, 1.58)
36
5.3 Alcohol consumption
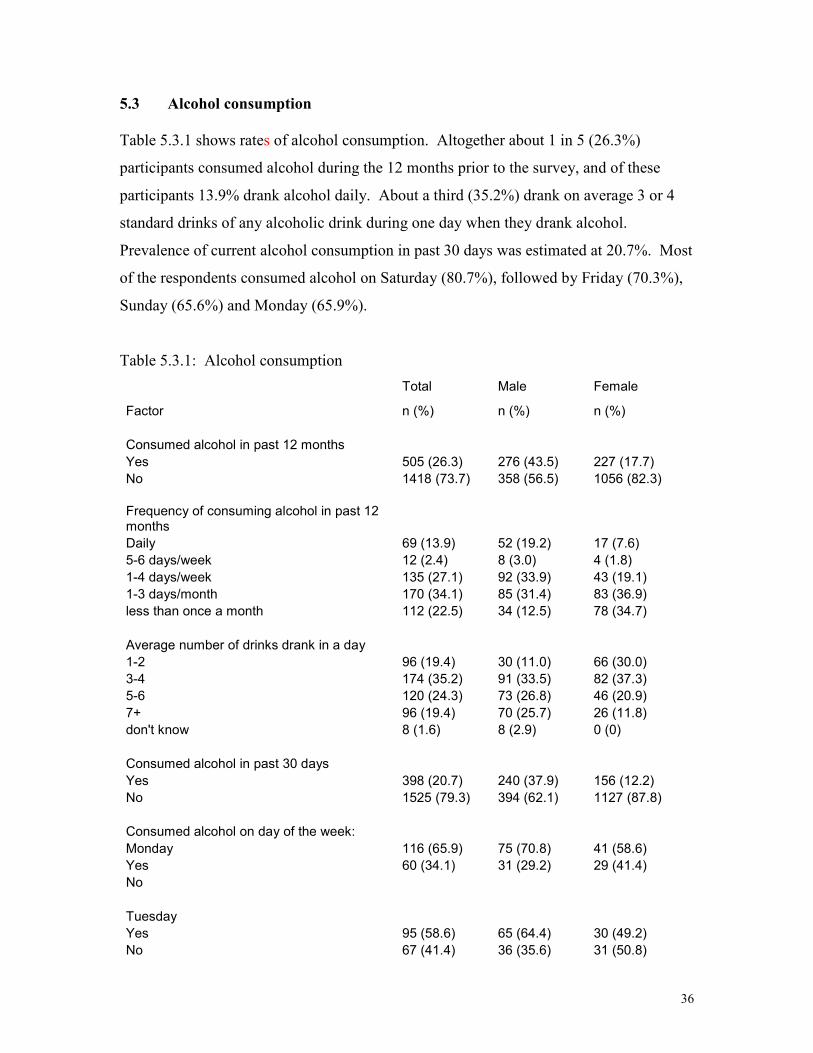
Table 5.3.1 shows rates of alcohol consumption. Altogether about 1 in 5 (26.3%)
participants consumed alcohol during the 12 months prior to the survey, and of these
participants 13.9% drank alcohol daily. About a third (35.2%) drank on average 3 or 4
standard drinks of any alcoholic drink during one day when they drank alcohol.
Prevalence of current alcohol consumption in past 30 days was estimated at 20.7%. Most
of the respondents consumed alcohol on Saturday (80.7%), followed by Friday (70.3%),
Sunday (65.6%) and Monday (65.9%).
Table 5.3.1: Alcohol consumption
Total Male Female
Factor n (%) n (%) n (%)
Consumed alcohol in past 12 months
Yes 505 (26.3) 276 (43.5) 227 (17.7)
No 1418 (73.7) 358 (56.5) 1056 (82.3)
Frequency of consuming alcohol in past 12 months
Daily 69 (13.9) 52 (19.2) 17 (7.6)
5-6 days/week 12 (2.4) 8 (3.0) 4 (1.8)
1-4 days/week 135 (27.1) 92 (33.9) 43 (19.1)
1-3 days/month 170 (34.1) 85 (31.4) 83 (36.9)
less than once a month 112 (22.5) 34 (12.5) 78 (34.7)
Average number of drinks drank in a day
1-2 96 (19.4) 30 (11.0) 66 (30.0)
3-4 174 (35.2) 91 (33.5) 82 (37.3)
5-6 120 (24.3) 73 (26.8) 46 (20.9)
7+ 96 (19.4) 70 (25.7) 26 (11.8)
don't know 8 (1.6) 8 (2.9) 0 (0)
Consumed alcohol in past 30 days
Yes 398 (20.7) 240 (37.9) 156 (12.2)
No 1525 (79.3) 394 (62.1) 1127 (87.8)
Consumed alcohol on day of the week:
Monday 116 (65.9) 75 (70.8) 41 (58.6)
Yes 60 (34.1) 31 (29.2) 29 (41.4)
No
Tuesday
Yes 95 (58.6) 65 (64.4) 30 (49.2)
No 67 (41.4) 36 (35.6) 31 (50.8)

37
Wednesday
Yes 105 (59.0) 67 (61.5) 37 (54.4)
No 73 (41.0) 42 (38.5) 31 (45.6)
Thursday
Yes 91 (55.8) 59 (59.0) 32 (50.8)
No 72 (44.2) 41 (41.0) 31 (49.2)
Friday
Yes 142 (70.3) 93 (73.8) 49 (64.5)
No 60 (29.7) 33 (26.2) 27 (35.5)
Saturday
Yes 196 (80.7) 121 (82.9) 74 (77.1)
No 47 (19.3) 25 (17.1) 22 (22.9)
Sunday
Yes 128 (65.6) 86 (70.5) 42 (57.5)
No 67 (34.4) 36 (29.5) 31 (42.5)
Among the factors considered to be associated with alcohol consumption in Table 5.3.2,
the most important predictor for alcohol consumption was sex. Female respondents were
68% (AOR=0.32, 95%CI [0.20, 0.51]) less likely to consume alcohol compared to male
respondents.
Table 5.3.2: Factors associated with alcohol consumption
Unadjusted Adjusted
Factor OR (95%CI) AOR (95%CI)
Age (years)
25-34 1 -
35-44 0.89 (0.53, 1.52)
45+ 1.02 (0.57, 1.81)
Sex
Male 1 1
Female 0.32 (0.20, 0.51) 0.32 (0.20, 0.51)
Completed level of education
None 1 -
Primary 1.51 (0.69, 3.30)
Secondary 1.74 (0.92, 3.30)
College/university 1.67 (0.86, 3.23)
38
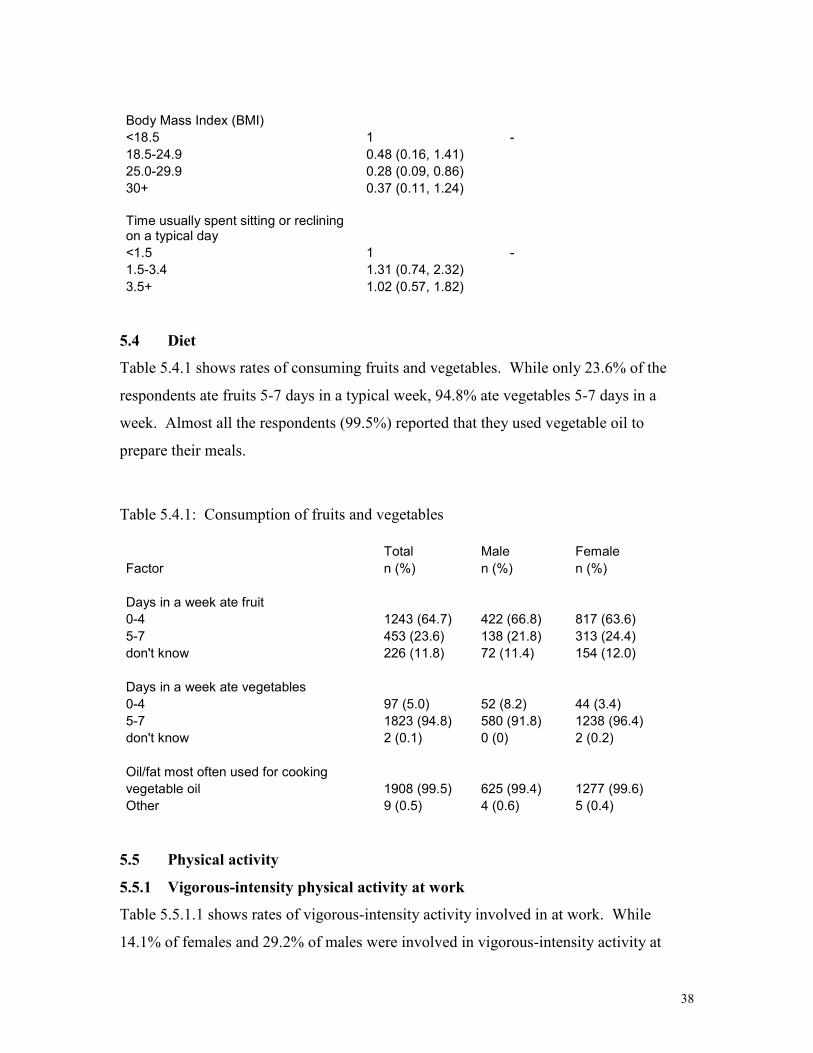
Body Mass Index (BMI)
<18.5 1 -
18.5-24.9 0.48 (0.16, 1.41)
25.0-29.9 0.28 (0.09, 0.86)
30+ 0.37 (0.11, 1.24)
Time usually spent sitting or reclining on a typical day
<1.5 1 -
1.5-3.4 1.31 (0.74, 2.32)
3.5+ 1.02 (0.57, 1.82)
5.4 Diet
Table 5.4.1 shows rates of consuming fruits and vegetables. While only 23.6% of the
respondents ate fruits 5-7 days in a typical week, 94.8% ate vegetables 5-7 days in a
week. Almost all the respondents (99.5%) reported that they used vegetable oil to
prepare their meals.
Table 5.4.1: Consumption of fruits and vegetables
Total Male Female
Factor n (%) n (%) n (%)
Days in a week ate fruit
0-4 1243 (64.7) 422 (66.8) 817 (63.6)
5-7 453 (23.6) 138 (21.8) 313 (24.4)
don't know 226 (11.8) 72 (11.4) 154 (12.0)
Days in a week ate vegetables
0-4 97 (5.0) 52 (8.2) 44 (3.4)
5-7 1823 (94.8) 580 (91.8) 1238 (96.4)
don't know 2 (0.1) 0 (0) 2 (0.2)
Oil/fat most often used for cooking
vegetable oil 1908 (99.5) 625 (99.4) 1277 (99.6)
Other 9 (0.5) 4 (0.6) 5 (0.4)
5.5 Physical activity
5.5.1 Vigorous-intensity physical activity at work
Table 5.5.1.1 shows rates of vigorous-intensity activity involved in at work. While
14.1% of females and 29.2% of males were involved in vigorous-intensity activity at

39
work, 45.7% of females and 32.8% of males were involved in such activities 7 days in a
week. Female respondents (68.3%) tended to be involved in such activities for less than
1 hour 30 minutes on a typical day compared to males (31.8%).
Table 5.5.1.1: Vigorous-intensity activity at work.
Total Male Female
Factor n (%) n (%) n (%)
Work involved vigorous-intensity activity
Yes 360 (19.1) 182 (29.2) 177 (14.1)
No 1522 (80.9) 442 (70.8) 1076 (85.9)
Number of days vigorous-intensity activity was done as part of work in a typical week
1 27 (7.6) 8 (4.4) 19 (10.9)
2 38 (10.7) 17 (9.4) 21 (12.0)
3 34 (9.6) 17 (9.4) 17 (9.7)
4 13 (3.7) 5 (2.8) 7 (4.0)
5 52 (14.6) 38 (21.1) 14 (8.0)
6 53 (14.9) 36 (20.0) 17 (9.7)
7 139 (39.0) 59 (32.8) 80 (45.7)
Time spent on vigorous-intensity activity at work on a typical day (hours)
<1.5 125 (54.8) 27 (31.8) 97 (68.3)
1.5-3.4 57 (25.0) 27 (31.8) 30 (21.1)
3.5+ 46 (20.2) 31 (36.5) 15 (10.6)
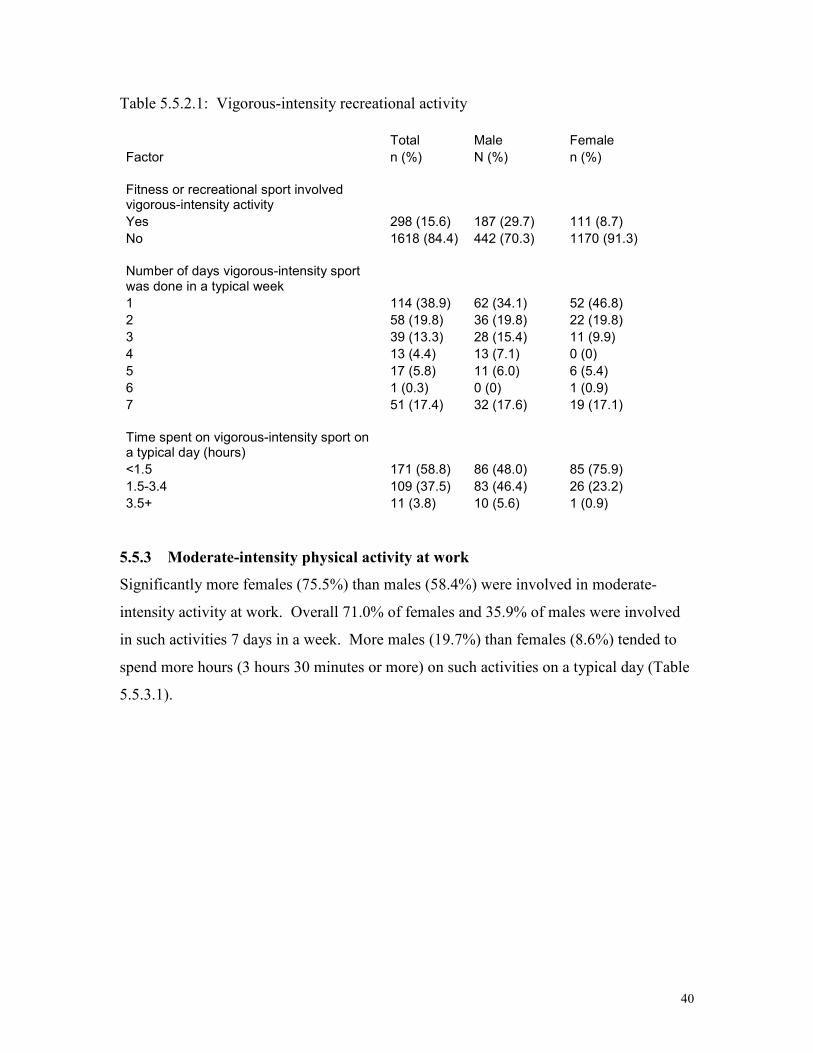
5.5.2 Vigorous-intensity recreational activity
More males (29.7%) than females (8.7%) were engaged in vigorous-intensity sport,
fitness or recreational activity, with 17.6% of males and 17.1% of females being engaged
in such activities 7 days in a week (Table 5.5.2.1). Female respondents (75.9%) tended to
spend less time on a typical day (1 hour 30 minutes) on such activities than males
(48.0%).
40
Table 5.5.2.1: Vigorous-intensity recreational activity
Total Male Female
Factor n (%) N (%) n (%)
Fitness or recreational sport involved vigorous-intensity activity
Yes 298 (15.6) 187 (29.7) 111 (8.7)
No 1618 (84.4) 442 (70.3) 1170 (91.3)
Number of days vigorous-intensity sport was done in a typical week
1 114 (38.9) 62 (34.1) 52 (46.8)
2 58 (19.8) 36 (19.8) 22 (19.8)
3 39 (13.3) 28 (15.4) 11 (9.9)
4 13 (4.4) 13 (7.1) 0 (0)
5 17 (5.8) 11 (6.0) 6 (5.4)
6 1 (0.3) 0 (0) 1 (0.9)
7 51 (17.4) 32 (17.6) 19 (17.1)
Time spent on vigorous-intensity sport on a typical day (hours)
<1.5 171 (58.8) 86 (48.0) 85 (75.9)
1.5-3.4 109 (37.5) 83 (46.4) 26 (23.2)
3.5+ 11 (3.8) 10 (5.6) 1 (0.9)
5.5.3 Moderate-intensity physical activity at work
Significantly more females (75.5%) than males (58.4%) were involved in moderate-
intensity activity at work. Overall 71.0% of females and 35.9% of males were involved
in such activities 7 days in a week. More males (19.7%) than females (8.6%) tended to
spend more hours (3 hours 30 minutes or more) on such activities on a typical day (Table
5.5.3.1).

41
Table 5.5.3.1: Moderate-intensity physical activity at work
Total Male Female
Factor n (%) n (%) n (%)
Work involved moderate-intensity activity
Yes 1334 (69.8) 365 (58.4) 966 (75.5)
No 576 (30.2) 260 (41.6) 313 (24.4)
Number of days moderate-intensity activity was done as part of work in a week
1 71 (5.3) 26 (7.2) 45 (4.7)
2 64 (4.8) 23 (6.4) 41 (4.3)
3 62 (4.7) 21 (5.8) 41 (4.3)
4 46 (3.5) 22 (6.1) 24 (2.5)
5 166 (12.5) 93 (25.7) 73 (7.6)
6 103 (7.8) 47 (13.0) 55 (5.7)
7 816 (61.4) 130 (35.9) 684 (71.0)
Time spent on moderate-intensity activity at work on a typical day
<1.5 614 (57.0) 106 (47.5) 508 (59.7)
1.5-3.4 345 (32.0) 73 (32.7) 270 (31.7)
3.5+ 118 (11.0) 44 (19.7) 73 (8.6)
5.5.4 Moderate-intensity recreational activity
About a third of both male (33.4%) and female (30.5%) respondents were in involved in
moderate-intensity sport. Overall 40.9% of males and 33.7% of females reported being
involved in such activities 7 days in a typical week. Most of the respondents (79.8% of
males, and 83.7% of females) spent less than 1 hour 30 minutes on a typical day on such
activities (Table 5.5.4.1).
Table 5.5.4.1: Moderate-intensity recreational activity
Total Male Female
Factor n (%) n (%) n (%)
Fitness or recreational sport involved moderate-intensity activity
Yes 598 (31.4) 208 (33.4) 389 (30.5)
No 1306 (68.6) 415 (66.6) 886 (69.5)
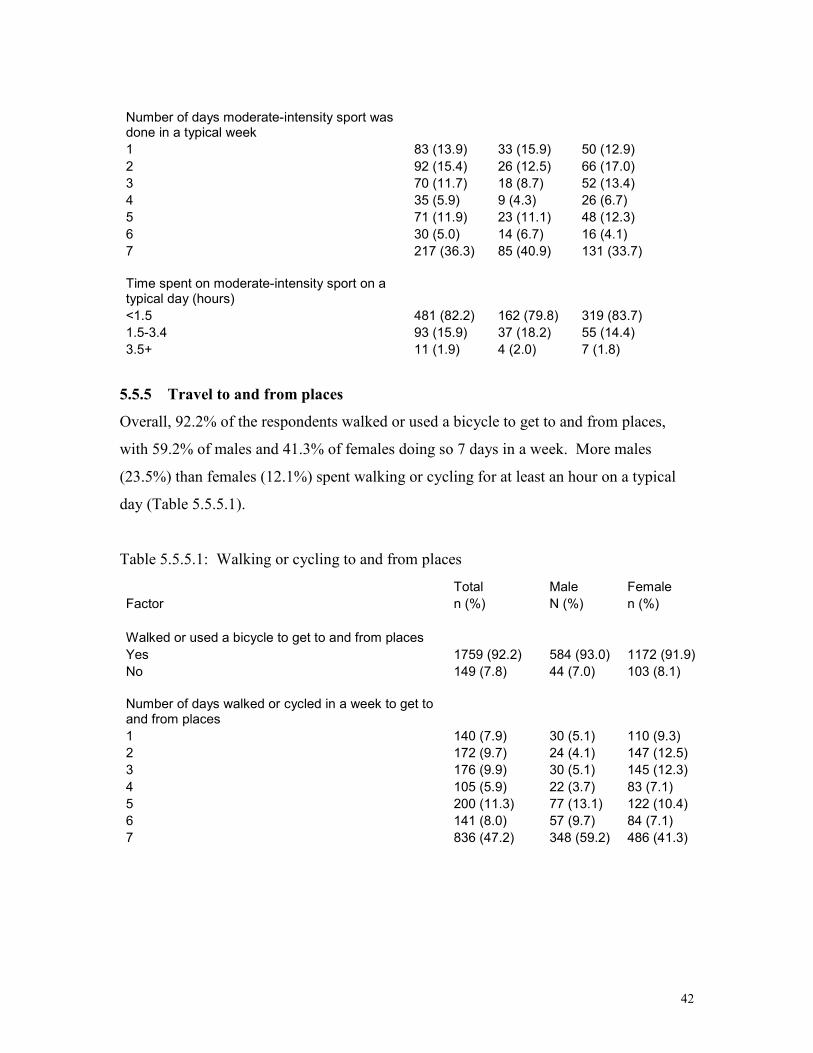
42
Number of days moderate-intensity sport was done in a typical week
1 83 (13.9) 33 (15.9) 50 (12.9)
2 92 (15.4) 26 (12.5) 66 (17.0)
3 70 (11.7) 18 (8.7) 52 (13.4)
4 35 (5.9) 9 (4.3) 26 (6.7)
5 71 (11.9) 23 (11.1) 48 (12.3)
6 30 (5.0) 14 (6.7) 16 (4.1)
7 217 (36.3) 85 (40.9) 131 (33.7)
Time spent on moderate-intensity sport on a typical day (hours)
<1.5 481 (82.2) 162 (79.8) 319 (83.7)
1.5-3.4 93 (15.9) 37 (18.2) 55 (14.4)
3.5+ 11 (1.9) 4 (2.0) 7 (1.8)
5.5.5 Travel to and from places
Overall, 92.2% of the respondents walked or used a bicycle to get to and from places,
with 59.2% of males and 41.3% of females doing so 7 days in a week. More males
(23.5%) than females (12.1%) spent walking or cycling for at least an hour on a typical
day (Table 5.5.5.1).
Table 5.5.5.1: Walking or cycling to and from places
Total Male Female
Factor n (%) N (%) n (%)
Walked or used a bicycle to get to and from places
Yes 1759 (92.2) 584 (93.0) 1172 (91.9)
No 149 (7.8) 44 (7.0) 103 (8.1)
Number of days walked or cycled in a week to get to and from places
1 140 (7.9) 30 (5.1) 110 (9.3)
2 172 (9.7) 24 (4.1) 147 (12.5)
3 176 (9.9) 30 (5.1) 145 (12.3)
4 105 (5.9) 22 (3.7) 83 (7.1)
5 200 (11.3) 77 (13.1) 122 (10.4)
6 141 (8.0) 57 (9.7) 84 (7.1)
7 836 (47.2) 348 (59.2) 486 (41.3)

43
Time spent on walking or cycling for travel on a typical day
<10 minutes 234 (13.2) 73 (12.4) 161 (13.7)
10-29.9 minutes 706 (39.9) 193 (32.8) 510 (43.3)
30 minutes - 1 hour 548 (30.9) 184 (31.3) 364 (30.9)
more than 1 hour 283 (16.0) 138 (23.5) 143 (12.1)
5.5.6 Sedentary behaviour
About a third of the respondents (35.3% of males, and 32.6% of females) spent at least 3
hours 30 minutes sitting or reclining on a typical day (Table 5.5.6.1)
Table 5.5.6.1: Sedentary behaviour
Total Males Females
Factor n (%) n (%) n (%)
Time usually spent sitting or reclining on a typical day (hours)
<1.5 462 (24.2) 125 (19.8) 337 (26.6)
1.5-3.4 804 (42.2) 283 (44.8) 518 (40.8)
3.5+ 640 (33.6) 223 (35.3) 414 (32.6)
Factors associated with sitting or reclining for at least 3 hours 30 minutes on a typical day
are presented in Table 5.5.6.2. Age, work involving vigorous-intensity and moderate-
intensity activities were significantly associated with sedentary behaviour in bivariate
analyses, as well as in the multivariate analysis. Compared to respondents of age 25-34
years, respondents who were of age 45 years or more were 31% (AOR=0.69, 95%CI
[0.55, 0.87]) less likely to have sedentary behaviour. Respondents who were not
involved in moderate-intensity and vigorous-intensity activities at work were 32 %
(AOR=0.68, 95%CI [0.55, 0.84]) and 48% (AOR=0.52, 95%CI [0.39, 0.69]) less likely,
respectively, to have sedentary behaviour compared to respondents who were involved in
such work-related activities.
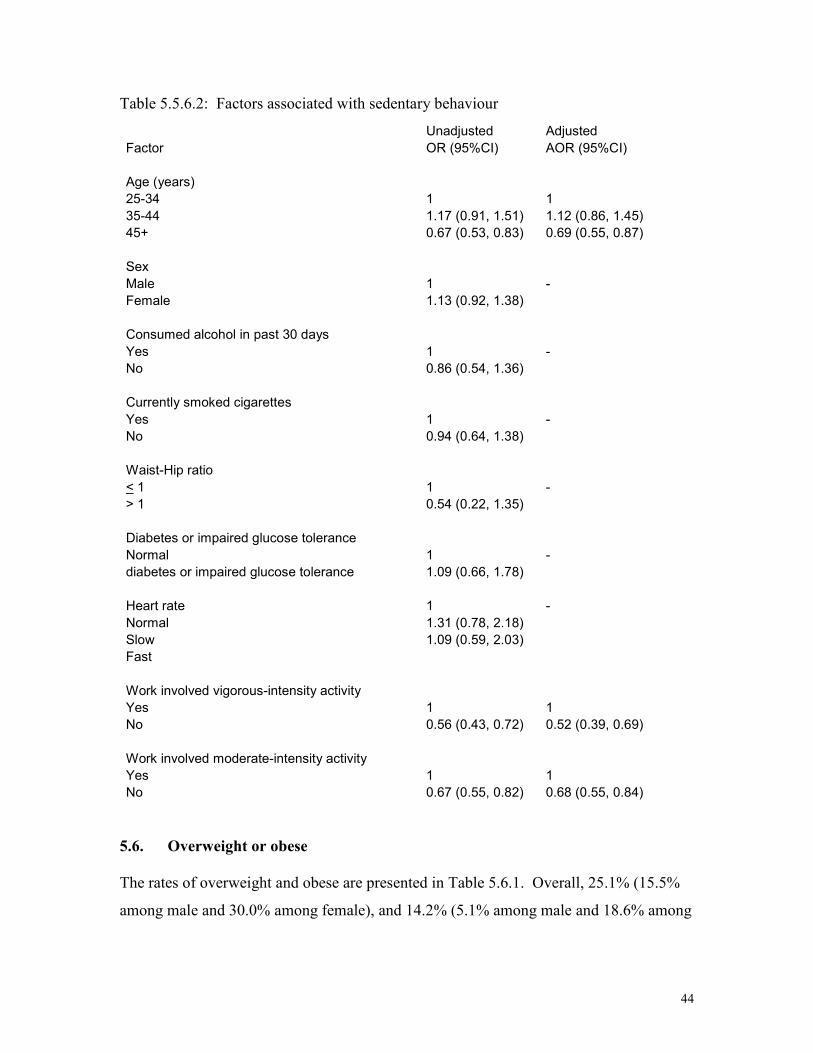
44
Table 5.5.6.2: Factors associated with sedentary behaviour
Unadjusted Adjusted
Factor OR (95%CI) AOR (95%CI)
Age (years)
25-34 1 1
35-44 1.17 (0.91, 1.51) 1.12 (0.86, 1.45)
45+ 0.67 (0.53, 0.83) 0.69 (0.55, 0.87)
Sex
Male 1 -
Female 1.13 (0.92, 1.38)
Consumed alcohol in past 30 days
Yes 1 -
No 0.86 (0.54, 1.36)
Currently smoked cigarettes
Yes 1 -
No 0.94 (0.64, 1.38)
Waist-Hip ratio
< 1 1 -
> 1 0.54 (0.22, 1.35)
Diabetes or impaired glucose tolerance
Normal 1 -
diabetes or impaired glucose tolerance 1.09 (0.66, 1.78)
Heart rate 1 -
Normal 1.31 (0.78, 2.18)
Slow 1.09 (0.59, 2.03)
Fast
Work involved vigorous-intensity activity
Yes 1 1
No 0.56 (0.43, 0.72) 0.52 (0.39, 0.69)
Work involved moderate-intensity activity
Yes 1 1
No 0.67 (0.55, 0.82) 0.68 (0.55, 0.84)
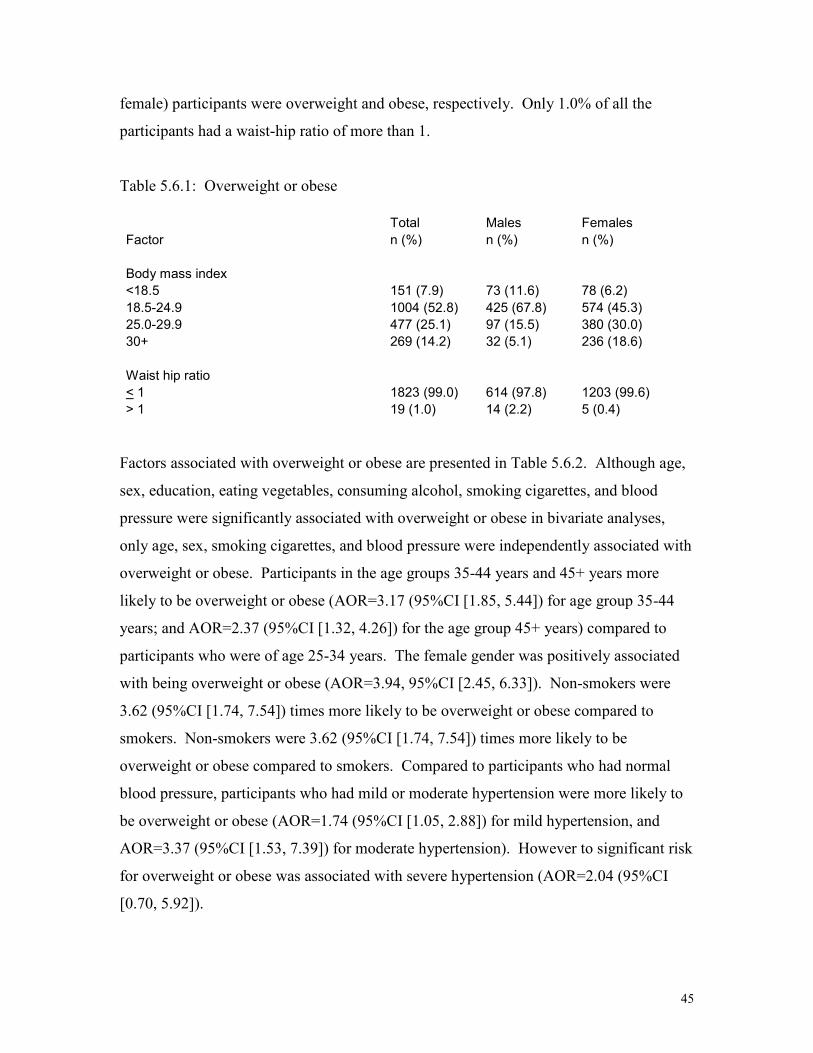
5.6. Overweight or obese
The rates of overweight and obese are presented in Table 5.6.1. Overall, 25.1% (15.5%
among male and 30.0% among female), and 14.2% (5.1% among male and 18.6% among
45
female) participants were overweight and obese, respectively. Only 1.0% of all the
participants had a waist-hip ratio of more than 1.
Table 5.6.1: Overweight or obese
Total Males Females
Factor n (%) n (%) n (%)
Body mass index
<18.5 151 (7.9) 73 (11.6) 78 (6.2)
18.5-24.9 1004 (52.8) 425 (67.8) 574 (45.3)
25.0-29.9 477 (25.1) 97 (15.5) 380 (30.0)
30+ 269 (14.2) 32 (5.1) 236 (18.6)
Waist hip ratio
< 1 1823 (99.0) 614 (97.8) 1203 (99.6)
> 1 19 (1.0) 14 (2.2) 5 (0.4)
Factors associated with overweight or obese are presented in Table 5.6.2. Although age,
sex, education, eating vegetables, consuming alcohol, smoking cigarettes, and blood
pressure were significantly associated with overweight or obese in bivariate analyses,
only age, sex, smoking cigarettes, and blood pressure were independently associated with
overweight or obese. Participants in the age groups 35-44 years and 45+ years more
likely to be overweight or obese (AOR=3.17 (95%CI [1.85, 5.44]) for age group 35-44
years; and AOR=2.37 (95%CI [1.32, 4.26]) for the age group 45+ years) compared to
participants who were of age 25-34 years. The female gender was positively associated
with being overweight or obese (AOR=3.94, 95%CI [2.45, 6.33]). Non-smokers were
3.62 (95%CI [1.74, 7.54]) times more likely to be overweight or obese compared to
smokers. Non-smokers were 3.62 (95%CI [1.74, 7.54]) times more likely to be
overweight or obese compared to smokers. Compared to participants who had normal
blood pressure, participants who had mild or moderate hypertension were more likely to
be overweight or obese (AOR=1.74 (95%CI [1.05, 2.88]) for mild hypertension, and
AOR=3.37 (95%CI [1.53, 7.39]) for moderate hypertension). However to significant risk
for overweight or obese was associated with severe hypertension (AOR=2.04 (95%CI
[0.70, 5.92]).

46
Table 5.6.2: Factors associated with overweight or obese
Factor OR (95%CI) AOR (95%CI)
Age (years)
25-34 1 1
35-44 1.88 (1.49, 2.39) 3.17 (1.85, 5.44)
45+ 2.30 (1.84, 2.88) 2.37 (1.32, 4.26)
Sex
Male 1 1
Female 3.65 (2.92, 4.56) 3.94 (2.45, 6.33)
Education
None 1 1
Primary 1.06 (0.78, 1.45) 1.52 (0.71, 3.23)
Secondary 0.74 (0.57, 0.95) 1.77 (0.92, 3.42)
college/university 1.10 (0.85, 1.43) 2.51 (1.26, 5.01)
Number of days ate vegetables in a typical week
0-4 1 1
5-7 1.86 (1.16, 2.96) 1.47 (0.57, 3.75)
Number of days ate fruits in a typical week
0-4 1 -
5-7 1.06 (0.85, 1.32)
Number of hours spent on sitting or reclining on a typical day (Sedentary behaviour)
<1.5 1 -
1.5-3.4 1.04 (0.82, 1.31)
3.5+ 1.01 (0.79, 1.30)
Consumed alcohol in past 30 days
Yes 1 1
No 1.69 (1.07, 2.68) 1.03 (0.60, 1.75)
Currently smoked cigarettes
Yes 1 1
No 5.29 (3.06, 9.14) 3.62 (1.74, 7.54)
Blood pressure
Normal 1 1
Mild 1.83 (1.46, 2.30) 1.74 (1.05, 2.88)
Moderate 3.23 (2.20, 4.81) 3.37 (1.53, 7.39)
Severe 3.10 (2.10, 4.57) 2.04 (0.70, 5.92)

47
5.7 Blood pressure
Only 29.2% of males and 52.4% of females had their blood pressure measured with the
previous one year to the survey. Overall, 13.7% of the respondents were told by the
health workers in the previous 12 months to the survey that they had raised blood
pressure. Altogether, 7.6% of the respondents currently received any advice or treatment
for high blood pressure. Moderate or severe blood pressure was estimated at 12.5%
(12.05 of males and 13.2% of females) at the time of the survey. The above results are
shown in Table 5.7.1.
Table 5.7.1: Raised blood pressure
Total Males Females
Factor n (%) n (%) n (%)
Last time blood pressure was measured by health worker (years ago)
<1 856 (44.7) 185 (29.2) 670 (52.4)
1-5 407 (21.2) 94 (14.8) 311 (24.3)
>5 654 (34.1) 354 (55.9) 297 (23.2)
Told that has raised blood pressure in past 12 months
Yes 262 (13.7) 64 (10.1) 198 (15.5)
No 1650 (86.3) 567 (89.9) 1077 (84.5)
Currently received drugs for high blood pressure in the past 2 weeks
Yes 105 (5.5) 20 (3.2) 85 (6.7)
No 1812 (94.5) 613 (96.8) 1193 (93.3)
Currently on special prescribed diet for high blood pressure
Yes 78 (4.1) 17 (2.7) 61 (4.8)
No 1836 (95.9) 616 (97.3) 1214 (95.2)
Currently received advice or treatment to lose weight to control high blood pressure
Yes 63 (3.3) 11 (1.7) 52 (4.1)
No 1851 (96.7) 622 (98.3) 1223 (95.9)
Currently received advice or treatment to stop smoking
Yes 38 (2.0) 11 (1.7) 27 (2.1)
No 1876 (98.0) 621 (98.3) 1249 (97.9)

48
Currently received advice to start or do more exercise to control high blood pressure
Yes 79 (4.1) 24 (3.8) 55 (4.3)
No 1836 (95.9) 609 (96.2) 1221 (95.7)
Currently received any of the above advice or treatment for high blood pressure
Yes 146 (7.6) 34 (5.4) 112 (8.7)
No 1782 (92.4) 600 (94.6) 1176 (91.3)
Blood pressure in the current survey
Normal 1231 (65.2) 387 (62.0) 840 (66.7)
Mild 422 (22.3) 168 (26.9) 253 (20.1)
Moderate 119 (6.3) 37 (5.9) 82 (6.5)
Severe 117 (6.2) 32 (5.1) 84 (6.7)
Treated with drugs for hypertension in past 2 weeks
Yes 51 (3.0) 7 (1.3) 44 (3.8)
No 1664 (97.0) 539 (98.7) 1119 (96.2)
Heart rate
Slow 64 (3.4) 48 (7.6) 16 (1.3)
Normal 1716 (89.8) 555 (88.2) 1153 (90.6)
Fast 130 (6.8) 26 (4.1) 104 (8.2)
Seen a traditional healer for high blood pressure in past 12 month
Yes 6 (0.3) 3 (0.5) 3 (0.2)
No 1910 (99.7) 630 (99.5) 1274 (99.8)
Currently took any herbal or traditional remedy for high blood pressure
Yes 16 (0.8) 3 (0.5) 13 (1.0)
No 1900 (99.2) 630 (99.5) 1264 (99.0)
Factors associated with moderate or severe hypertension are presented in Table 5.7.2. Of
the factors considered in bivariate analyses to be associated with moderate or severe
hypertension, age, education level, sedentary behaviour, body mass index, waist-hip ratio,
levels of cholesterol, and fasting blood glucose were significantly associated with raised
blood pressure. In multivariate analysis, compared to respondents in the age group 25-34
years, older respondents were more likely to have moderate or severe hypertension
(AOR=2.27 (95%CI [1.41, 3.67]) for 35-44 years age group, and AOR=8.66 (95%CI
[5.75, 13.04]) for age group 45+ years). Compared to respondents with BMI of <18.5,

49
those with BMI of 25+ were more likely to have moderate or severe hypertension
(AOR=2.63 (95%CI [1.23, 5.63]) for 25.0-29.9 BMI, and AOR=4.16 (95%CI [1.91,
9.06]) for 30+ BMI). Participants with raised cholesterol levels were 63% (95%CI [1.11,
2.40]) more likely to have moderate or severe hypertension compared to participants with
normal cholesterol levels.
Table 5.7.2: Factors associated with moderate or severe hypertension
Unadjusted Adjusted
Factor OR (95%CI) AOR (95%CI)
Age group (years)
25-34 1 1
35-44 2.68 (1.72, 4.18) 2.27 (1.41, 3.67)
45+ 10.40 (7.21, 15.0) 8.66 (5.75, 13.04)
Sex
Male 1 -
Female 0.22 (0.91, 1.65)
Education
None 1 1
Primary 0.71 (0.46, 1.10) 0.94 (0.57, 1.57)
Secondary 0.58 (0.41, 0.83) 0.98 (0.64, 1.49)
college/university 0.60 (0.41, 0.88) 0.88 (0.56, 1.36)
Time usually spent sitting or reclining on a typical day (hours) (sedentary behaviour)
<1.5 1 1
1.5-3.4 1.14 (0.78, 1.67) 1.10 (0.72, 1.67)
3.5+ 1.70 (1.17, 2.47) 1.26 (0.82, 1.95)
Body Mass Index (BMI)
<18.5 1 1
18.5-24.9 1.67 (0.79, 3.52) 1.63 (0.76, 3.46)
25.0-29.9 3.20 (1.50, 6.80) 2.63 (1.23, 5.63)
30+ 6.56 (3.05, 14.10) 4.16 (1.91, 9.06)
Consumed alcohol in past 30 days
Yes 1 -
No 1.53 (0.81, 2.89)
Currently smoked cigarettes
Yes 1 -
No 1.29 (0.71, 2.32)

50
Waist-Hip ratio
< 1 1 1
>1 3.19 (1.20, 8.47) 1.39 (0.40, 4.76)
Cholesterol
Normal 1 1
Raised 2.46 (1.79, 3.39) 1.63 (1.11, 2.40)
Fasting blood glucose
Normal 1 1
Hypoglycemia 0.97 (0.69, 1.37) 1.18 (0.78, 1.80)
Impaired glucose tolerance or diabetic 2.41 (1.38, 4.21) 0.71 (0.35, 1.44)
Heart rate
Normal 1 -
Slow 0.82 (0.40, 1.69)
Fast 0.90 (0.38, 2.16)
5.8 Impaired glucose tolerance or diabetes
Altogether, 6.2% of the respondents (5.4% of males and 6.6% of females) reported
having had their blood sugar levels measured in the previous 12 months to the survey.
About two percent (1.9% of males and 1.8% of females were told by health workers that
they had diabetes. Meanwhile, 1.1% of males and 1.8% of females currently received
any advice or treatment for diabetes. During the survey, 2.1% of males and 2.9% of
females were found with diabetes. These results are presented in Table 5.8.1.
Table 5.8.1: Diabetes.
Total Males Females
Factor N (%) n (%) n (%)
Blood sugar measured in past 12 months
Yes 118 (6.2) 34 (5.4) 84 (6.6)
No 1799 (93.8) 599 (94.6) 1194 (93.4)
Told by health worker that has diabetes
Yes 35 (1.8) 12 (1.9) 23 (1.8)
No 1881 (98.2) 621 (98.1) 1255 (98.2)
Currently received insulin
Yes 14 (0.7) 2 (0.3) 12 (0.9)
No 1902 (99.3) 630 (99.7) 1266 (99.1)

51
Currently received oral drugs for diabetes in last 2 weeks
Yes 20 (1.0) 7 (1.1) 13 (1.0)
No 1894 (99.0) 625 (98.9) 1263 (99.0)
Currently received special prescribed diet for diabetes
Yes 23 (1.2) 7 (1.1) 16 (1.3)
No 1891 (98.8) 625 (98.9) 1260 (98.7)
Currently received advice or treatment for diabetes to lose weight
Yes 19 (1.0) 6 (0.9) 13 (1.0)
No 1896 (99.0) 627 (99.1) 1263 (99.0)
Currently received advice or treatment for diabetes to stop smoking
Yes 14 (0.7) 4 (0.6) 10 (0.8)
No 1901 (99.3) 629 (99.4) 1266 (99.2)
Currently received advice for diabetes to start or do more exercise
Yes 16 (0.8) 6 (0.9) 10 (0.8)
No 1899 (99.2) 627 (99.1) 1266 (99.2)
Currently received any of the above advice or treatment for diabetes
Yes 30 (1.6) 7 (1.1) 23 (1.8)
No 1898 (98.4) 627 (98.9) 1265 (98.2)
Glucose levels in the current survey
Hypoglycemia 396 (21.1) 119 (19.4) 277 (22.0)
Normal 1409 (74.9) 474 (77.2) 929 (73.7)
Impaired glucose tolerance 24 (1.3) 8 (1.3) 16 (1.3)
Diabetes 51 (2.7) 13 (2.1) 38 (3.0)
Seen a traditional healer for diabetes
Yes 1 (0.1) 1 (0.2) 0 (0)
No 1912 (99.9) 631 (99.8) 1275 (100)
Currently took any herbal or traditional remedy for diabetes
Yes 1 (0.1) 1 (0.2) 0 (0)
No 1911 (99.9) 630 (99.2) 1275 (100)
Factors associated with impaired levels of glucose or diabetes are presented in Table
5.8.2. Age, body mass index, waist-hip ratio, hypertension, and cholesterol were
significantly associated with impaired glucose tolerance or diabetes in bivariate analyses.
In multivariate analysis, compared to participants in the age group 25-34 years, older
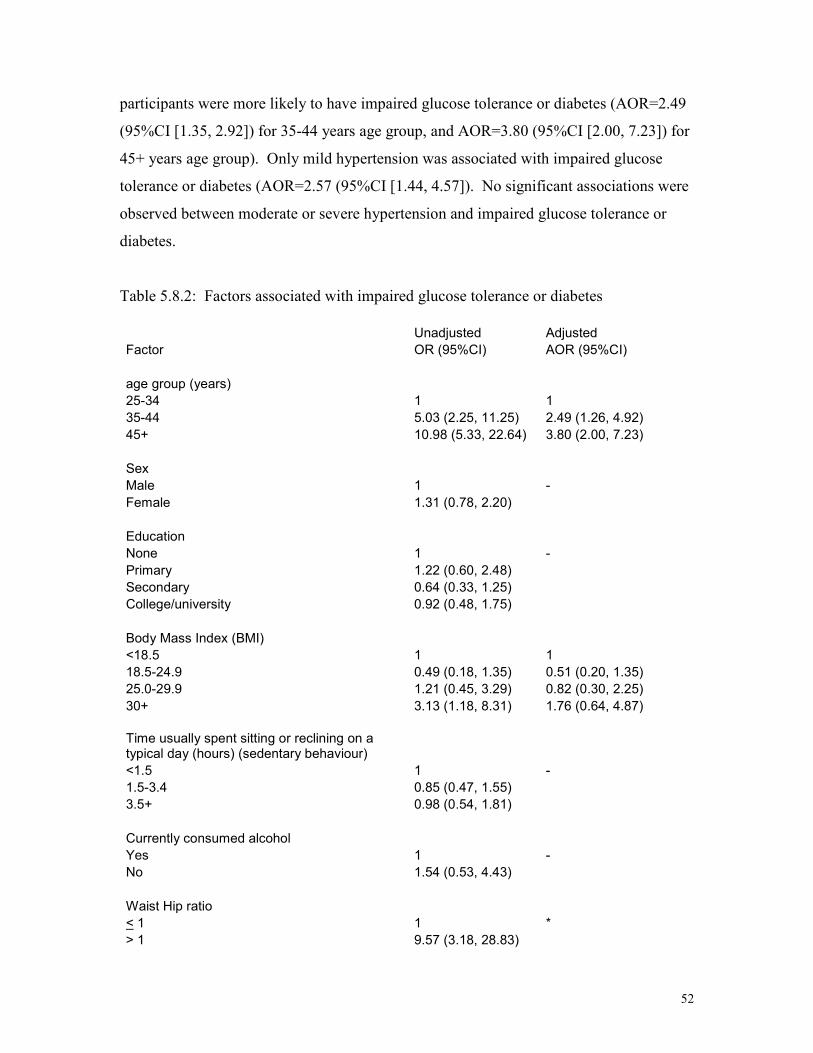
52
participants were more likely to have impaired glucose tolerance or diabetes (AOR=2.49
(95%CI [1.35, 2.92]) for 35-44 years age group, and AOR=3.80 (95%CI [2.00, 7.23]) for
45+ years age group). Only mild hypertension was associated with impaired glucose
tolerance or diabetes (AOR=2.57 (95%CI [1.44, 4.57]). No significant associations were
observed between moderate or severe hypertension and impaired glucose tolerance or
diabetes.
Table 5.8.2: Factors associated with impaired glucose tolerance or diabetes
Unadjusted Adjusted
Factor OR (95%CI) AOR (95%CI)
age group (years)
25-34 1 1
35-44 5.03 (2.25, 11.25) 2.49 (1.26, 4.92)
45+ 10.98 (5.33, 22.64) 3.80 (2.00, 7.23)
Sex
Male 1 -
Female 1.31 (0.78, 2.20)
Education
None 1 -
Primary 1.22 (0.60, 2.48)
Secondary 0.64 (0.33, 1.25)
College/university 0.92 (0.48, 1.75)
Body Mass Index (BMI)
<18.5 1 1
18.5-24.9 0.49 (0.18, 1.35) 0.51 (0.20, 1.35)
25.0-29.9 1.21 (0.45, 3.29) 0.82 (0.30, 2.25)
30+ 3.13 (1.18, 8.31) 1.76 (0.64, 4.87)
Time usually spent sitting or reclining on a typical day (hours) (sedentary behaviour)
<1.5 1 -
1.5-3.4 0.85 (0.47, 1.55)
3.5+ 0.98 (0.54, 1.81)
Currently consumed alcohol
Yes 1 -
No 1.54 (0.53, 4.43)
Waist Hip ratio
< 1 1 *
> 1 9.57 (3.18, 28.83)
53
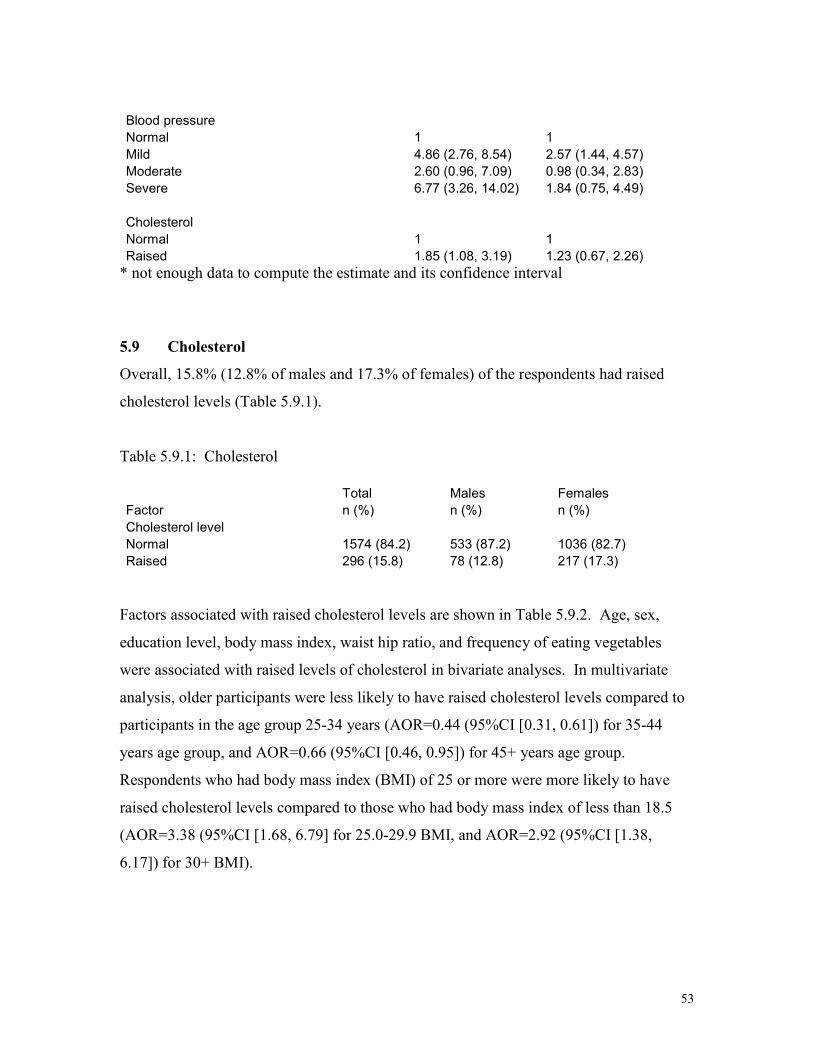
Blood pressure
Normal 1 1
Mild 4.86 (2.76, 8.54) 2.57 (1.44, 4.57)
Moderate 2.60 (0.96, 7.09) 0.98 (0.34, 2.83)
Severe 6.77 (3.26, 14.02) 1.84 (0.75, 4.49)
Cholesterol
Normal 1 1
Raised 1.85 (1.08, 3.19) 1.23 (0.67, 2.26)
* not enough data to compute the estimate and its confidence interval
5.9 Cholesterol
Overall, 15.8% (12.8% of males and 17.3% of females) of the respondents had raised
cholesterol levels (Table 5.9.1).
Table 5.9.1: Cholesterol
Total Males Females
Factor n (%) n (%) n (%)
Cholesterol level
Normal 1574 (84.2) 533 (87.2) 1036 (82.7)
Raised 296 (15.8) 78 (12.8) 217 (17.3)
Factors associated with raised cholesterol levels are shown in Table 5.9.2. Age, sex,
education level, body mass index, waist hip ratio, and frequency of eating vegetables
were associated with raised levels of cholesterol in bivariate analyses. In multivariate
analysis, older participants were less likely to have raised cholesterol levels compared to
participants in the age group 25-34 years (AOR=0.44 (95%CI [0.31, 0.61]) for 35-44
years age group, and AOR=0.66 (95%CI [0.46, 0.95]) for 45+ years age group.
Respondents who had body mass index (BMI) of 25 or more were more likely to have
raised cholesterol levels compared to those who had body mass index of less than 18.5
(AOR=3.38 (95%CI [1.68, 6.79] for 25.0-29.9 BMI, and AOR=2.92 (95%CI [1.38,
6.17]) for 30+ BMI).

54
Table 5.9.2: Factors associated raised cholesterol levels
Unadjusted Adjusted
Factor OR (95%CI) AOR (95%CI)
age group (years)
25-34 1 1
35-44 1.56 (1.12, 2.16) 0.44 (0.31, 0.61)
45+ 2.39 (1.79, 3.19) 0.66 (0.46, 0.95)
Sex
Male 1 1
Female 1.43 (1.08, 1.89) 1.10 (0.80, 1.53)
Education
None 1 1
Primary 0.68 (0.44, 1.05) 0.67 (0.42, 1.08)
Secondary 0.66 (0.47, 0.93) 0.75 (0.52, 1.10)
college/university 0.96 (0.68, 1.34) 1.18 (0.81, 1.72)
Body Mass Index (BMI)
<18.5 1 1
18.5-24.9 1.66 (0.85, 3.26) 1.34 (0.68, 2.64)
25.0-29.9 4.25 (2.16, 8.36) 3.38 (1.68, 6.79)
30+ 4.55 (2.25, 9.17) 2.92 (1.38, 6.17)
Waist Hip ratio
< 1 1 1
> 1 4.18 (1.66, 10.52) 2.73 (0.93, 8.03)
Consumed alcohol in past 30 days
Yes 1 -
No 1.35 (0.75, 2.43)
Frequency of having eaten vegetable in a typical week
<5 1 1
5-7 2.25 (1.03, 4.93) 2.07 (0.79, 5.40)

55
CHAPTER 6
DISCUSSION
This is the first study to report results from a comprehensive general population-based
survey on the prevalence rates for risk factors for non-communicable diseases among
persons of age 25 years or more. We found that the rate for current tobacco smoking was
6.8% (17.5% for males and 1.5% for females), current consumption of alcohol was
20.7% (37.9% of males and 12.2% of females), fruit was 23.6%, and vegetable was
94.9% most of the week, and physical activity was 31.4% (33.4% of males and 30.5% of
females) for moderate-intensity recreational-related activities, and 15.1% (29.7% of
males and 8.7% of females) for vigorous-intensity recreational activities. Overweight or
obese was estimated at 39.3% (20.6% of males, and 48.6% of females). The rate for
moderate or severe hypertension was 12.5% (11.0% of males and 13.2% of females).
The prevalence for impaired glucose level or diabetes was 4.0%, and that for raised
cholesterol levels was 15.8%.
6.1 Tobacco use
Our rate for current smoking of 6.8% (17.5% among males and 1.5% among females) is
much lower than that reported in Mauritius of 35.9% among males and 5.1% among
females of age 20-74 years (Ministry of Health & Quality of Life, 2006). Higher rates
among 15-64 year-olds for current smoking of 52.9% overall, and 56% among males and
49.7% among females have been reported in Nauru, Australia (Ministry of Health
[Nauru] et al, 2005). In Purworejo district of Java Island in Indonesia, the prevalence of
smoking of 53.9% among males is much higher than the rate in the current study but
comparable to that of women of 1.7% among females (Ng et al, 2006).
Closer home, compared to our findings, a study conducted in three provinces (Midlands,
Mashonaland Central, and Matebeleland South) of Zimbabwe among persons of age 15-
74 years showed higher rates of current use of any tobacco of 33.4% among males and
5% among females, with most of the tobacco products used being smoked substances
(Ministry of Health and Child Welfare et al, 2005). In Dar es Salaam, Tanzania, the rate

56
of daily smokers among persons in the age group 25-64 years averaged 23% (range 19.6-
24.0%) among males, and 1.3% (range 0.8-5.5%) among females, compared to 13% and
1.2% among males and females in the current study. A study conducted in South Africa
20 years ago among Whites of age 15-64 years in a rural community reported rates of
48.1% and 17.9% for current smoking among males and females, respectively
(Steenkamp et al., 1988). Generally the rate for current cigarette smoking in Zambia is
lower than in other countries. The differences may partly be due to different age groups
of the participants in the surveys. In Zambia the age group that we studied was 25 years
or more. The age group in the Zambian study excluded the adolescents who are more
likely to smoke but not for a long time before they quit smoking. Among the school
going adolescents in Lusaka, Zambia, 43.4% of males and 35.6% of females had ever
smoked cigarettes (Muula & Siziya, 2007). Another explanation for lower rates for
current smoking in Zambia is that the tobacco control regulations that the Government of
the Republic of Zambia has put in place may be working.
All the above findings are consistent in that more males than females were current
cigarette smokers. The finding in the current study that respondents with little or no
formal education were more likely to be current smokers than the more educated
respondents, suggest that tobacco control information may not be reaching our to the less
educated people. Channels of getting the information across to the less educated should
be investigated.
We also found that overweight or obese people were less likely to be current smokers
than lean people. If smoking makes people to lose weight, in a population experiencing
an HIV/AIDS pandemic, being lean may be associated with the HIV infection, and
because of stigma people would not want to lose weight.
6.2 Alcohol consumption
Alcohol consumption in the past 12 months was reported by 26.3% (43.5% of male and
17.7% of female) respondents in Zambia. These rates are much lower than those reported
in Cameroon (Health of Populations in Transition Research Group, 2004) of 85% overall

57
(89% among males, and 82% among females). An overall alcohol consumption rate of
39.6% in the past 12 months to the survey has been reported in Eritrea (Usman et al.,
2006). In Nauru, alcohol consumption in the past 12 months was reported by 46.2%
(60.7% of male and 32.1% of female) respondents. We again see that Zambia has lower
rates of alcohol consumption, partly because in the Zambian study, adolescents were
excluded from participation in the survey.
The finding that females were less likely to consume alcohol than males suggests that
societies may be less tolerant to females who consume alcohol. Rarely are women, other
than sex workers, in Zambia seen in drinking places consuming alcohol. They may
consume alcohol at kitchen parties where males are absent, or they may consume alcohol
at home in the absence of the public. It is therefore most likely that most women, who
reported consuming alcohol in the past 12 months, may not have consumed it daily. In
the current study the daily alcohol consumption in the past 12 months was estimated at
13.9% (19.2% among males, and 7.6% among females), and it compares very well with
the rate of 11% reported in Cameroon of drinking alcohol in 5 or more days of the week
(Health of Populations in Transition Research Group, 2004).
We have discussed the results of alcohol consumption in the past 12 months because
several studies report alcohol consumption over this period. However, it would have
been more appropriate to report alcohol consumption in the past 30 days, as a measure of
current alcohol consumption rate.
6.3 Diet
In the current study fruits were rarely eaten. Only 23.6% of the respondents ate fruits 5-7
days in a typical week. Most (94.8%) of the respondents reported eating vegetables 5-7
days in a typical week. Vegetables are a part of one of the cheapest meals. Many
families are not able to afford the cost of fruits; as a result they may eat seasonal fruits
that are grown in their backyards (mangoes or guavas), or can be bought from markets at
a cheap price when they are in season. Temperate fruits such as apples and grapes are out
of reach for most families. In Eritrea, 15.3% and 49.4% of the respondents ate fruits and
58
vegetables during most of the usual week, respectively (Usman et al., 2006). It appears
fruits and vegetables are not easily available for most of the families in Eritrea. Low cost
technology on preservation of seasonal fruits should be introduced to families so that
family members could eat fruits all year around.
6.4 Physical activity
Overall, one in five (29.2% males, 14.1% females) of the respondents was engaged in
work that involved vigorous-intensity activity. Meanwhile, 15.6% of the respondents
(29.7% males, and 8.7% females) were engaged in fitness or recreational sport that
involved vigorous-intensity activity. About two thirds of the respondents (58.4% males,
and 75.5% females) were engaged in work that involved moderate-intensity activity,
while one third of the respondents were engaged in fitness or recreational sport that
involved moderate-intensity activity. Over 90% of the respondents were either walked or
used a bicycle to get to and from places, and about one third of the respondents spent at
least 3.5 hours sitting or reclining on a typical day. The observed sedentary prevalence in
the current study was lower than that was observed in Eritrea of 60.6% (Usman et al.,
2006) but higher than that found in the Nauru of 17% (Ministry of Health [Nauru] et al.,
2005) and in urban Indian population of 59.3% among males and 58.5% among females
(Singh et al., 2007).
Factors that were positively associated with sedentary behaviour in the current study were
having engaged in work that involved in moderate or vigorous intensity activity. A study
among youth in Ontario, Canada reported that sedentary behaviour was significantly
associated with physical activity (Leatherdale & Wong, 2008). No significant
associations were observed with waist-hip-ratio or with alcohol consumption in our
study, contrary to Keenan et al (1992) findings who found significant associations.
Differences in the results among different studies may be due to different definitions for
sedentary behaviour. Our definition of sedentary behaviour did not exclude those who
were engaged in work that involved moderate or vigorous intensity activity.
59
6.5 Over weight or obese
While a higher proportion of females (48.6%) than males (20.6%) were over weight or
obese, more males (2.2%) than females (0.4%) had elevated waist-hip-ratios. Our
prevalence rates of over weight or obesity are much lower with gender difference than
those reported by Ministry of Health [Nauru] et al (2005) of 82.2% among males, and
82.1% among females that did not find gender difference in the rates. A study in
Zimbabwe (Ministry of Health and Child Welfare et al., 2005) reported a higher
prevalence of over weight or obesity in females than in males that accords the finding in
the present study. While in the same study in Zimbabwe, a different cut off point for
elevated waist-hip ratio (central obesity) of 0.85 for females, and 0.95 for males was
used, our results with a cut off point of 1 do not agree with the Zimbabwean findings of
9.5% and 23.4% among males and females, respectively. A study done in Eritrea also
found a higher prevalence rate of central obesity among females than males (Usman et
al., 2006).
We found that older respondents were more likely to be over weight or obese, and that
female respondents and none cigarette smokers were associated with being over weight
or obese. Other studies elsewhere found age (Singh et al., 2007; Amoah, 2003), and
female gender (Amoah, 2007) to be associated with over weight or obesity.
6.6 Blood pressure
We found 12.0% of males and 13.2% of females to have moderate or severe
hypertension, and that obese, raised cholesterol, and older age group were associated with
moderate or severe hypertension. Our rates are higher than those reported in Nauru of
8.7% among males and 4.85 among females (Ministry of Health [Nauru] et al., 2005) but
lower than those reported in Zimbabwe of 41% among females and 26% among males
(Mufunda et al., 2000), and 25.5% among females and 21.6% among males in South
Africa (Alberts et al., 2005). A rate for hypertension of 16% was reported in Eritrea
(Usman et al., 2006; Mufunda et al., 2006).

60
A study in South Africa found that age was positively correlated with blood pressure, and
that among females blood pressure was associated with body mass index and total serum
cholesterol (van Rooyen et al., 2000). In Cameroon, Shey Wiysonge et al (2004) reports
a significant association between obesity and hypertension. Meanwhile, in Egypt, El-
Shafei et al (2002) reported that age, and elevated BMI were significantly associated with
an increased risk of essential hypertension.
6.7 Impaired glucose tolerance or diabetes
The prevalence of diabetes was 2.1% among males and 3.0% among females in the
present study, and that of impaired glucose tolerance was 1.3% and 1.3% for males and
females, respectively. Diabetes or impaired glucose tolerance was associated with older
age groups, obesity, elevated waist-hip ratio and severe hypertension. The prevalence
rates of diabetes in Nauru of 9.4% among 25-64 years olds (Ministry of Health [Nauru] et
al., 2005) and in Northern Sudan of 9.9% among males and 7.5% among females (Elbagir
et al., 1998) are much higher than what we found in Lusaka district, Zambia. In South
Africa among elderly (age >65 years), the prevalence of diabetes was 25.7% among
males and 30.3% among females, and that of impaired glucose tolerance was 15% overall
(Charlton et al., 1997). Elbagir et al (1996) reported that obesity and age were
significantly associated with higher rates of diabetes. In 1998 these authors reported
significant associations between age and obesity on one hand and diabetes on the other
(Elbagir et al., 1998). Among the Hindu Indian immigrants in Dar es Salaam, the major
risk factors for diabetes were age and body mass index (Ramaiya et al., 1991).
6.8 Cholesterol
Overall, 12.8% of male and 17.3% of female respondents had raised cholesterol levels.
These rates are much lower than those reported by Gupta et al (2004) in Punjabi Bhatia
community of 33.2% among males and 28.9% among females, and lower than the rates
reported in Mauritius of 45% among males and 375 among females (Ministry of Health
[Mauritius] & Quality of Life, 2004). However, our rates are comparable to the overall
rate reported by Reddy et al (2002) of 18.6% in Andhra Pradesh, in another part of India,
and to those reported in Nauru of 20.8% among females and 14.9% among males

61
(Ministry of Health [Nauru] et al., 2005). The higher rates of hypercholesterolemia
observed in South Asia may be attributed to region’s economic development. Comparing
our prevalence rates of hypercholesterolemia to those found in the region, we note that
our rate is much lower than the 40% that was reported in older South Africans (Charlton
et al., 2001), and much lower than the 47% and 46% reported among males and females,
respectively, in a peri-urban working class community in South Africa (Steyn et al.,
2004).
Age and over weight or obesity were significantly associated with raised cholesterol
levels. Gupta et al (2004) also reported a significant association between body mass
index and hypercholesterolemia. Kruger et al (2003) reported that inactive overweight
persons had the highest total cholesterol levels. In a study done in Nauru (Ministry of
Health [Nauru] et al., 2005), age was found to be significantly associated with raised
cholesterol levels.

62
CHAPTER 7
POSSIBLE LIMITATIONS
Though the study design provides reliable and valid information, the study may have
some limitations. The survey was done in Lusaka district, and hence the results can only
be generalized to the sampled population. Some information was missing, especially for
total cholesterol. Most of the test strips for total cholesterol could not produce results.
We did not have reliable information on the number of household members of age 25
years or older in order to enable us to compute response rates. Therefore, we could not
compute weights that could have been used in the analysis. Our findings may be biased
to the extent that non-respondents differed from those that participated in the survey.
However, we are unable to suggest the direction of bias. Some study factors in our
survey were obtained through self-reports, and as in all such studies, both inadvertent and
deliberate reporting is a concern, more so that we obtained personal identifiers. In spite
of the above limitations, we believe that our findings are credible as they compare
favourably with those obtained in the Zambia Demographic and Health Survey.

63
CHAPTER 8
CONCLUSIONS
We conclude that the tobacco smoking epidemic is in its early stage, as well as for
diabetes. Hypertension, hypercholesterolemia, alcohol consumption, and overweight or
obese are already at alarming levels. Although most people in the study setting
consumed vegetables, the amount eaten was below the amount that is recommended by
WHO. The frequency and amount of fruit consumption was also below the levels
recommended by WHO. Only a small proportion of the respondents were involved in
physical activity. The results of this study can be generalized at most to urban
populations.

64
CHAPTER 9
RECOMMENDATIONS
Since a significant proportion of adults who smoke initiated the habit in their
adolescence, tobacco control interventions should be mostly targeted to this age group.
The implementation of the WHO FCTC should be the guiding principle in tobacco
control.
Health education interventions for people to adopt healthier lifestyles should be
formulated. This should include diet and physical activity in the programs.
Risk factors for non-communicable diseases may vary between rural and urban settings,
and it is thus recommended that a similar study be conducted in a rural setting.
The observed associations between behavioural (tobacco use, alcohol, physical activity
and nutrition) and physiological (obesity, blood pressure, high blood glucose and high
cholesterol) risk factors on one hand, with non-communicable diseases on the other
should be considered in the design of interventions to control these diseases.

65
CHAPTER 10
REFERENCES
Alberts M, Urdal P, Steyn K, Stensvold I, Tverdal A, Nel JH, Steyn NP. Prevalence of
cardiovascular diseases and associated risk factors in a rural black population of South
Africa. Eur J cardiovasc Prev Rehabil 2005;12:347-354.
Amoah AG. Sociodemographic variations in obesity among Ghanaian adults. Public
Health Nutr 2003;6:751-757.
Booth FW, Chakravarthy MV, Gordon SE, Spangenburg EE. Waging war on physical
inactivity: using modern molecular ammunition against an ancient enemy. J Appl Physiol
2002;93:3-30.
Bovet P, Ross AG, Gervasoni JP, Mkamba M, Mtasiwa DM, Lengeler C, Whiting D,
Paccaud F. Distribution of blood pressure, body mass index and smoking habits in the
urban population of Dar es Salaam, Tanzania, and associations with socioeconomic
status. Int J Epidemiol 2002;31:240-247.
Buchanan DJ. Studies on blood alcohol in the workers of a Zambian copper mine.
Alcohol Alcohol 1988;23:239-242.
Charlton KE, Levitt NS, Lombard CJ. The prevalence of diabetes mellitus and associated
risk factors in elderly coloured South African. S Afr Med J 1997;87:364-367.
Charlton KE, Schloss I, Visser M, Lambert EV, Kolbe T, Levitt NS, Temple N. Waist
circumference predicts clustering of cardiovascular risk factors in older South African.
Cardiovasc J S Afr 2001;12:142-150.
Chen J, Millar WJ. Age of smoking initiation: implications for quitting. Health Report
1998;9:39-46.

66
Delpeuch F, Maire B. Obesity and developing countries of the south. Med Trop
1997;57:380-388.
Diabetes in the WHO African region. http://www.who.int/diabetes/facts/world_figures/
en/index1.html. Accessed 2 March 2007
Dunstan DW, Salmon J, Healy GN, Shaw JE, Jolley D, Zimmet PZ, Owen N, on behalf
of the AusDiab Steering Committee. Association of television viewing with fasting and
2-hour postchallenge plasma glucose levels in adults without diagnosed diabetes.
Diabetes Care 2007;30:516-522.
Elbagir MN, Eltom MA, Elmahadi EM, Kadam IM, Berne C. A high prevalence of
diabetes mellitus and impaired glucose tolerance in the danagla community in northern
Sudan. Diabet Med 1998;15:164-169.
Elbagir MN, Eltom MA, Elmahadi EM, Kadam IM, Berne C. A population-based study
of the prevalence of diabetes and impaired glucose tolerance in adults in northern Sudan.
Diabetes Care 1996;19:1126-1128.
El-Shafei SA, Bassili A, Hassanien NM, Mokhtar MM. Genetic determinants of essential
hypertension. J Egypt Public Health Assoc 2002;77:231-246.
Gao X, Nelson ME, Tucker KL. Television viewing is associated with prevalence of
metabolic syndrome in Hipanic elders. Diabetes Care 2007;30:694-700
Global School-based Student Health Survey: Zambia 2004 fact sheet.
http://www.who.int/chp/gshs/Zambia%20fs%202004.pdf
Gupta R, saran M, Thanvi J, Rastogi P, Kaul V, Gupta VP. High prevalence of multiple
coronary risk factors in Punjabi Bhatia community: Jaipur Heart Watch-3. Indian Heart J
2004;56:646-652.

67
Haworth A, Simpson R (ed.) Moonshine markets: issues in unrecorded alcohol beverage
production and consumption. New York and Hove: Brunner Routledge, 2004.
Health of Populations in Transition Research Group. Cameroon burden of diabetes
project baseline survey report 2004. Cameroon: Health of populations in Transition
Research Group.
Horton R. The neglected epidemic of chronic disease. Lancet 2005;366(9496):1514
International guidelines for the estimation of the avoidable costs of substance abuse.
http://www.hc-sc.gc.ca/ahc-asc/activit/strateg/drugs-drogues. Accessed 24th February
2007.
Keenan NL, Strogatz DS, James SA, Ammerman AS, Rice BL. Distribution and
correlates of waist-hip-ratio in black adults: the Pitt County Study. Am J Epidemiol
1992;135:678-684.
Kruger HS, Ventor CS, Vorster HH, THUSA Study. Physical inactivity as a risk factor
for cardiovascular disease in communities undergoing rural to urban transition: the
THUSA study. Cardiovasc J S Afr 2003;14:16-23.
Leatherdale ST, Wong SL. Modifiable characyeristics associated with sedentary
behaviours among youth. Int J Pediatr Obes 2008;3:93-101.
Leeder S, Raymond S, Greenberg H, Liu H, Esson K. A race against time: The challenge
of cardiovascular disease in developing economies. New York: Trustees of Columbia
University, 2004.
Ministry of Health [Mauritius], Quality of Life. Mauritius non-communicable diseases
survey 2004. Port Louise, Mauritius: Ministry of Health.
68
Ministry of Health [Nauru], World Health Organization, Centre for Physical Activity and
Health [University of Sydney]. Nauru NCD risk factors STEPS report 2005. Town,
Nauru: Ministry of Health.
Ministry of Health and Child Welfare, University of Zimbabwe, World Health
Organization & United Nations Children’s Fund. National survey: Zimbabwe non-
communicable disease risk factors (ZiNCoDs) – preliminary report 2005. Harare,
Zimbabwe: Ministry of Health and Child Welfare.
Mufunda J, Mebrahtu G, Usman A, Nyarango P, Kosia A, Ghebrat Y, Ogbamariam A,
Masjuan M, Gebremichael A. The prevalence of hypertension and its relationship with
obesity: results from a national blood pressure survey in Eritrea. J Hum Hypertens
2006;20:59-65.
Mufunda J, Scott LJ, Chifamba J, Matenga J, Sparks B, Cooper R, Sparks H. Correlates
of blood pressure in an urban Zimbabwean population and comparison to other
populations of African origin. J Hum Hypetens 2000;14:65-73.
Muula AS, Kazembe LN, Rudatsikira E, Siziya S. Suicidal ideation and associated
factors among in-school adolescents in Zambia. Tanzan Health Res Bull 2007;9:202-206.
Muula AS, Siziya S. Prevalence and determinants of ever smoked cigarettes among
school-going adolescents in Lusaka, Zambia. Afr J Health Sci 2007;7:246-252.
Naranjo CA, Bremner KE. Behavioural correlates of alcohol intoxication. Addiction
1993;88:25-35.
Nelson MC, Gordon-Larsen P. Physical activity and sedentary behavior patterns are
associated with selected adolescent health risk behaviors. Pediatrics 2006;117:1281-1290.

69
Ng N, Stenlund H, Bonita R, Hakimi M, Wall S, Weinehall L. Preventable risk factors
for non-communicable diseases in rural Indonesia: prevalence study using WHO STEP
approach. Bull World Health Organ 2006;84:305-313.
Peto R, Lopez A D, Boreham J, Thun M. Mortality from smoking in developed countries
1950-2000. (2nd edition: data updated 15 July 2003) Oxford University Press.
http://rum.ctsu.ox.ac.uk/~tobacco/FINALAPP34.PD. Accessed 24 September 2007.
Ramaiya KL, Swai AB, McLarty DG, Alberti KG. Impaired glucose tolerance and
diabetes mellitus in Hindu Indian immigrants in Dar es Salaam. Diabet Med 1991;8:738-
744.
Reddy KK, Rao AP, Reddy TP. Socioeconomic status and the prevalence of coronanr
heart disease risk factors. Asia Pac J Clin Nutr 2002;11:98-103.
Reilly C. Cancer and the consumption of home-produced alcoholic drinks in Zambia: a
possible explanation. Afr J Med Med Sci 1976;5:191-194.
Shey Wiysonge CU, Ngu Blackett K, Mbuagbaw JN. Risk factors and complications of
hypertension in Yaounde, Cameroon. Cardiovasc J S Afr 2004;15:215-219.
Singh RB, Pella D, Mechirova V, Kartikey K, Demeester F, Tomar RS, et al. Prevalence
of obesity, physical inactivity and undernutrition, a triple burden of diseases during
transtion in a developing economy. The Five City Study Group. Acta Cardiol
2007;62:119-127.
Siziya S, Muula AS, Kazembe LN, Rudatsikira E. Harmful lifestyles’ clustering among
sexually active in-school adolewscents in Zambia. BMC Pediatrics 2008;8:6
Siziya S, Rudatsikira E, Muula S. Cigarette smoking among school-going adolescents in
Kafue, Zambia. Malawi Med J 2007a;19:75-78.

70
Siziya S, Rudatsikira E, Muula AS, Ntata PR. Predictors of cigarette smoking among
adolescents in rural Zambia: results from a cross sectional study from Chongwe
[corrected] district. Rural Remote Health 2007;7:728. Erratum in: Rural Remote Health
2007b;7:728.
Statistics by country for hypertension. http://www.wrongdiagnosis.com/h/hypertension/
stats-country.htm. Accessed 2 March 2007.
Steenkamp E, Jooste PL, Christopher KJ. The prevalence of smoking and its relationship
to other coronanry risk factors in a rural white community. S Afr Med J 1988;73:402-
405.
Steyn K, Levitt NS, Hoffman M, Marais AD, Fourie JM, Lambert EV, Gaziano TA,
Kepe L, Lombard CJ. The global cardiovascular diseases risk pattern in a peri-urban
working-class community in South Africa. The Mamre study. Ethn Dis 2004;14:233-
242.
Usman A, Mebrahtu G, Mufunda J, Nyarang’o P, Hagos G, Kosia A, Ghebrat Y,
Mosazghi A, Aranga SJ, Equbamichael MM. Prevalence of non-communicable disease
risk factors in Eritrea. Ethn Dis 2006;16:542-546.
Van Rooyen JM, Kruger HS, Huisman HW, Wissing MP, Margetts BM, et al. An
epidemiological study of hypertension and its determinants in a population in transition:
the THUSA study. J Hum Hypertens 2000;14:779-787.
World Health Organization. Preventing chronic disease: A vital investment. Geneva:
World Health Organization, 2005a.
World Health Organization. Tobacco free initiative. www.who.int. Accessed 24
September 2007
71
World Health Organization. WHO STEPS Surveillance Manual: The WHO STEPwise
approach to chronic disease risk factor surveillance Geneva: World Health Organization,
2005b.
Worley H. Chronic diseases beleaguer developing countries. http://www.prb.org/Articles/
2006/ChronicDiseasesBeleaguerDevelopingCountries.aspx>p=1. Accessed 24 February
2007.
Yusuf S, Reddy S, Ounpuu S, Anand S. Global burden of cardiovascular diseases Part I:
General consideration, the epidemiologic transition, risk factors, and impact of
urbanization. Circulation 2001;104:2746-2753
72
CHAPTER 11
APPENDICES
11.1 Participants’ Information Sheet
11.2 Consent Form
11.3 Questionnaire