Embed Size (px)
Citation preview
Prevalence and Distribution of Iron Overload in Patients with Transfusion-dependent Anemias Differs across Geographic
Regions: Results from the CORDELIA Study
Yesim Aydinok,1 John B Porter,2 Antonio Piga,3 Mohsen Elalfy,4 Amal El-Beshlawy,5
Yurdanur Kilinç,6 Vip Viprakasit,7 Akif Yesilipek,8 Dany Habr,9 Erhard Quebe-
Fehling10 and Dudley J Pennell11
1Ege University Hospital, Izmir, Turkey; 2University College London, London, UK; 3University of Turin, Turin, Italy; 4Ain Shams University, Cairo, Egypt; 5Cairo
University, Cairo, Egypt; 6Cukurova University Medical Faculty, Adana, Turkey; 7Siriraj Hospital, Mahidol University, Bangkok, Thailand; 8Akdeniz University,
Antalya, Turkey; 9Novartis Pharmaceuticals, East Hanover, NJ, USA; 10Novartis
Pharma AG, Basel, Switzerland; 11 NIHR Cardiovascular Biomedical Research Unit,
Royal Brompton Hospital, London, UK
Short title: Iron Burden in Transfusion-dependant Anemias (40 characters)
Word count: 4144 Figures/Tables: 2 figures/6 tables
1
1
2
3
45
6
7
8
9
10
11
12
13
14
15
16
17
18
19
AbstractObjectives: The randomized comparison of deferasirox to deferoxamine for cardiac
iron removal in patients with transfusion-dependent anemias (CORDELIA) gave the
opportunity to assess relative prevalence and body distribution of iron overload in
screened patients.
Methods: Patients aged ≥10 years with transfusion-dependent anemias from 11
countries were screened. Data were summarized descriptively, overall and across
regions.
Results: Among 925 patients (99.1% with β thalassemia major; 98.5% receiving prior
chelation; mean age 19.2 years), 36.7% had cardiac iron overload (cardiac T2*
≤20ms), 12.1% had low left ventricular ejection fraction. LIC (mean 25.8 mg Fe/g dw)
and serum ferritin (median 3702 ng/mL) were high. Fewer patients in the Middle East
(ME; 28.5%) had cardiac T2* ≤20ms versus patients in the West (45.9%) and Far
East (FE, 40.9%). Patients in the West had highest cardiac iron burden, but lowest
LIC (26.9% with LIC <7mg Fe/g dw) and serum ferritin. Among patients with normal
cardiac iron, a higher proportion of patients from the ME and FE had LIC ≥15 than
<7mg Fe/g dw (ME, 56.7 vs 17.2%; FE, 78.6 vs 7.8%, respectively), a trend which
was less evident in the West (44.6 vs 33.9%, respectively). Transfusion and
chelation practices differed between regions.
Conclusions: Evidence of substantial cardiac and liver iron burden across regions
revealed a need for optimization of effective, convenient iron chelation regimens.
Significant regional variation exists in cardiac and liver iron loading that are not well
explained; improved understanding of factors contributing to differences in body iron
distribution may be of clinical benefit.
Word count: 250 (max 250)
Key words: Thalassemia; heart; liver; iron; prevalence; distribution
2
20
21
22
23
24
25
26
27
28
29
30
31
32
33
34
35
36
37
38
39
40
41
42
43
44
45
46
47
IntroductionIron-induced cardiomyopathy has long been recognized as a leading cause of death
in patients with transfusion-dependent anemias (1-4). However, liver iron
concentration (LIC) and serum ferritin, both established markers of liver iron
overload, may not reliably reflect the presence of myocardial iron deposition (5, 6).
Prompted by such observations, the development of reliable non-invasive techniques
has facilitated investigation of myocardial iron burden in the setting of transfusion-
related iron overload in clinical practice. Cardiovascular magnetic resonance (CMR),
which provides an estimate of myocardial iron load through the measurement of
cardiac T2*, has been validated and recently calibrated (5, 7). A cardiac T2* value
<20 ms indicates clinically significant cardiac iron above the normal limit which is
associated with an increased risk of impaired ventricular function, with T2* <10 ms
(ie severe cardiac iron overload) being associated with the highest risk of heart
failure (8-10). Advances in the ability to measure myocardial T2* for the
management of cardiac siderosis (10-15) (including the relationship between T2*
and heart failure (10)); a greater understanding of normal ventricular function in
thalassemia patients (16); and the availability of iron chelators with demonstrated
efficacy for the removal of cardiac iron (15, 17-22), have all contributed to the
decrease in cardiac-related mortality and morbidity over the last 10 years (23-25).
Although cardiac-related mortality continues to remain a key challenge in treating
these patients, an increasing number of deaths due to the long-term effects of iron-
induced liver toxicity are also being observed (25).
With these evolving management advances and challenges, it is important to re-
examine the prevalence of iron overload among chronically transfused patients.
Additionally, little is known about the distribution of iron burden across different
geographic regions, as few studies had sufficient sample size to enable such
assessment. CORDELIA (NCT00600938) was an international, multicenter, open-
label, randomized, Phase II clinical trial, which demonstrated the non-inferiority of
deferasirox versus deferoxamine (DFO) for the removal of cardiac iron in patients
with β thalassemia major (22). Overall, 925 patients were screened for entry into
CORDELIA. We examined the prevalence and distribution of body iron burden and in
3
48
49
50
51
52
53
54
55
56
57
58
59
60
61
62
63
64
65
66
67
68
69
70
71
72
73
74
75
76
77
78
79
particular cardiac iron overload, overall and by geographic region, in this large and
representative cohort of patients with transfusion-dependent anemias.
MethodsCORDELIA was a Phase II, open-label, randomized study (NCT00600938)
conducted between April 10, 2008 and March 1, 2012 to verify the non-inferiority of
deferasirox versus DFO in cardiac iron removal (22). Patients were screened for
study entry from countries within three regions: West (Canada [n=4], Cyprus [n=10],
Italy [n=2], Turkey [n=232], UK [n=11]); Middle East (Egypt [n=387], UAE [n=45],
Lebanon [n=31]); and Far East (Taiwan [n=22], Thailand [n=122], China [n=59]).
Turkey was included in the Western region by definition of the World Health
Organization assignment to their European Region, and in order to balance patient
numbers between regions assessed here.
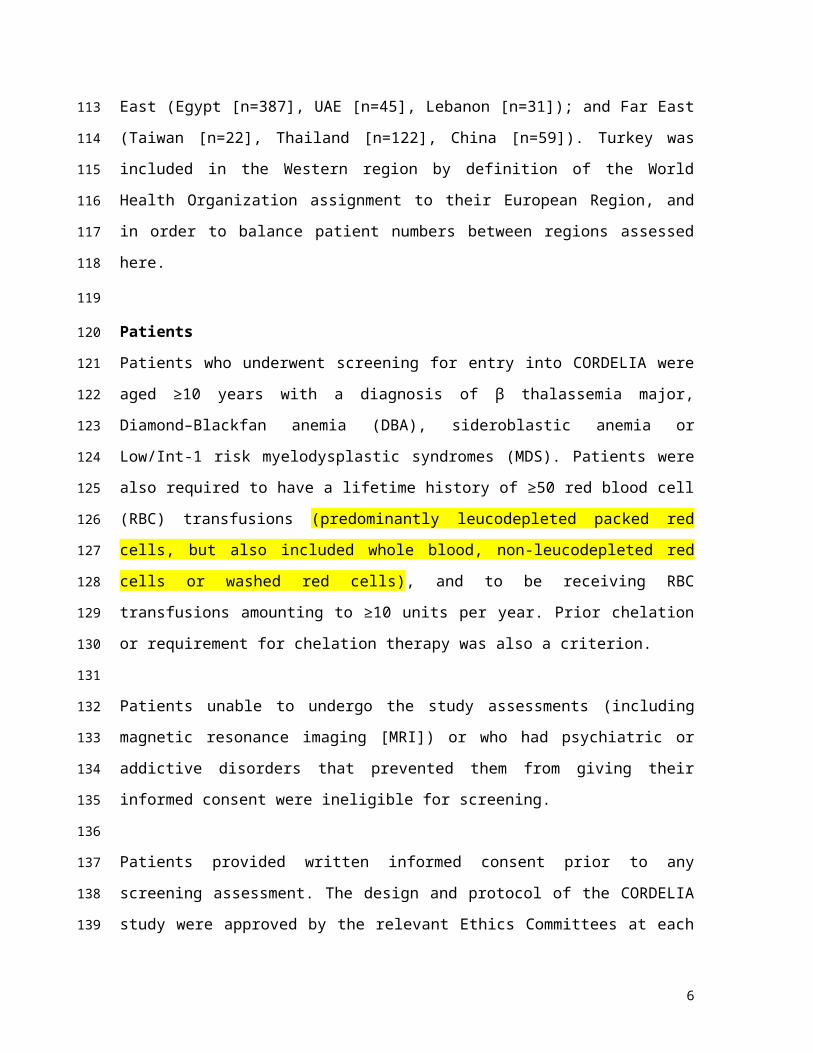
PatientsPatients who underwent screening for entry into CORDELIA were aged ≥10 years
with a diagnosis of β thalassemia major, Diamond–Blackfan anemia (DBA),
sideroblastic anemia or Low/Int-1 risk myelodysplastic syndromes (MDS). Patients
were also required to have a lifetime history of ≥50 red blood cell (RBC) transfusions
(predominantly leucodepleted packed red cells, but also included whole blood, non-
leucodepleted red cells or washed red cells), and to be receiving RBC transfusions
amounting to ≥10 units per year. Prior chelation or requirement for chelation therapy
was also a criterion.
Patients unable to undergo the study assessments (including magnetic resonance
imaging [MRI]) or who had psychiatric or addictive disorders that prevented them
from giving their informed consent were ineligible for screening.
Patients provided written informed consent prior to any screening assessment. The
design and protocol of the CORDELIA study were approved by the relevant Ethics
Committees at each study site. The study was conducted in accordance with the
4
80
81
82
83
84
85
86
87
88
89
90
91
92
93
94
95
96
97
98
99
100
101
102
103
104
105
106
107
108
109
110
guidelines for Good Clinical Practice stipulated by the International Conference on
Harmonisation and Declaration of Helsinki.
Screening assessmentsAssessments were performed at screening for evaluation of myocardial siderosis
(T2*), cardiac function (as evaluated by left ventricular ejection fraction [LVEF], %),
and other iron parameters (as evaluated by LIC, mg Fe/g dry weight [dw] and serum
ferritin, ng/mL level).
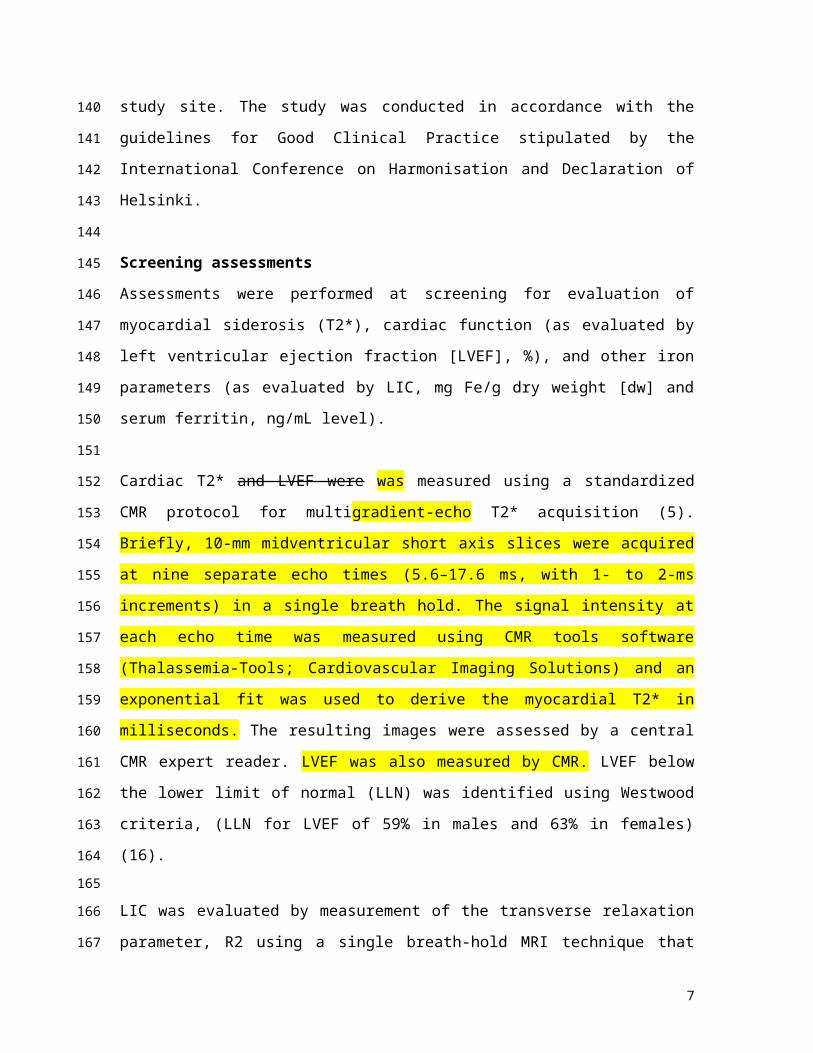
Cardiac T2* and LVEF were was measured using a standardized CMR protocol for
multigradient-echo T2* acquisition (5). Briefly, 10-mm midventricular short axis slices
were acquired at nine separate echo times (5.6–17.6 ms, with 1- to 2-ms increments)
in a single breath hold. The signal intensity at each echo time was measured using
CMR tools software (Thalassemia-Tools; Cardiovascular Imaging Solutions) and an
exponential fit was used to derive the myocardial T2* in milliseconds. The resulting
images were assessed by a central CMR expert reader. LVEF was also measured
by CMR. LVEF below the lower limit of normal (LLN) was identified using Westwood
criteria, (LLN for LVEF of 59% in males and 63% in females) (16).
LIC was evaluated by measurement of the transverse relaxation parameter, R2
using a single breath-hold MRI technique that previously demonstrated high
sensitivity and specificity of R2 to liver biopsy LIC thresholds (26). Measurements
were read centrally.
Serum ferritin levels were obtained from blood samples drawn at screening and were
analyzed by a central laboratory using a validated standard kit assay.
Statistical analysisAll screened patients were included in the analysis population. Patient characteristics
were summarized by cardiac T2* categories of myocardial iron overload (<6 ms, 6–
<10 ms, 10–≤20 ms; or normal threshold >20 ms), by three geographic regions
(West, Middle East and Far East), and by splenectomy status (yes/no).
5
111
112
113
114
115
116
117
118
119
120
121
122
123
124
125
126
127
128
129
130
131
132
133
134
135
136
137
138
139
140
141
142
143
Results are presented descriptively. For measures of iron burden, cardiac T2* is
shown as the geometric mean (anti-log of the mean of the log data) with 95%
confidence intervals (CI), while LIC and serum ferritin are recorded as mean
(standard deviation [SD]) and median (range), respectively. Data for cardiac function
(LVEF) are summarized as mean (SD).
Correlations between cardiac T2* and other iron parameters as well as age and
LVEF were assessed using Pearson’s correlation coefficient (r).
ResultsPatient characteristicsOverall, 925 patients screened for entry into CORDELIA were included in this
analysis, including patients from the West (n=259), Middle East (n=463) and Far
East (n=203) regions. The characteristics of patients are summarized in Table 1.
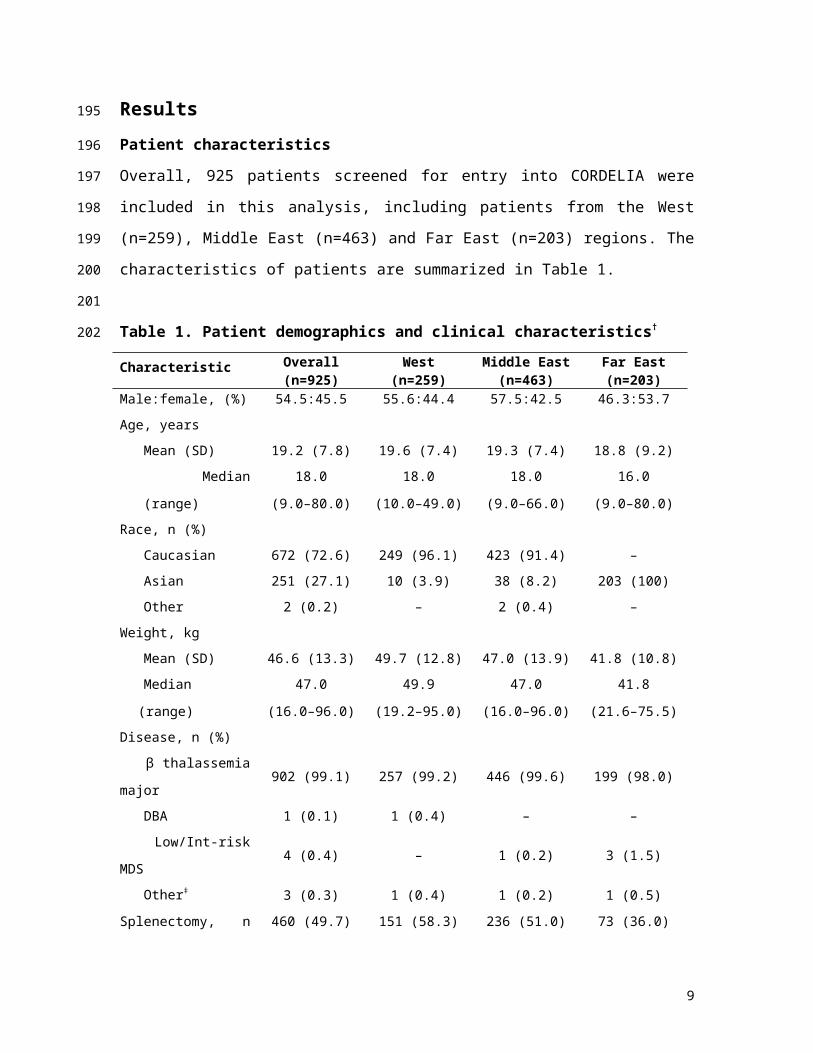
Table 1. Patient demographics and clinical characteristics†
Characteristic Overall(n=925)
West(n=259)
Middle East(n=463)
Far East(n=203)
Male:female, (%) 54.5:45.5 55.6:44.4 57.5:42.5 46.3:53.7
Age, years
Mean (SD) 19.2 (7.8) 19.6 (7.4) 19.3 (7.4) 18.8 (9.2)
Median
(range)
18.0
(9.0–80.0)
18.0
(10.0–49.0)
18.0
(9.0–66.0)
16.0
(9.0–80.0)
Race, n (%)
Caucasian 672 (72.6) 249 (96.1) 423 (91.4) –
Asian 251 (27.1) 10 (3.9) 38 (8.2) 203 (100)
Other 2 (0.2) – 2 (0.4) –
Weight, kg
Mean (SD) 46.6 (13.3) 49.7 (12.8) 47.0 (13.9) 41.8 (10.8)
Median (range) 47.0
(16.0–96.0)
49.9
(19.2–95.0)
47.0
(16.0–96.0)
41.8
(21.6–75.5)
Disease, n (%)
β thalassemia major 902 (99.1) 257 (99.2) 446 (99.6) 199 (98.0)
DBA 1 (0.1) 1 (0.4) – –
Low/Int-risk MDS 4 (0.4) – 1 (0.2) 3 (1.5)
6
144
145
146
147
148
149
150
151
152
153
154
155
156
157
158
159
Other‡ 3 (0.3) 1 (0.4) 1 (0.2) 1 (0.5)
Splenectomy, n (%) 460 (49.7) 151 (58.3) 236 (51.0) 73 (36.0)
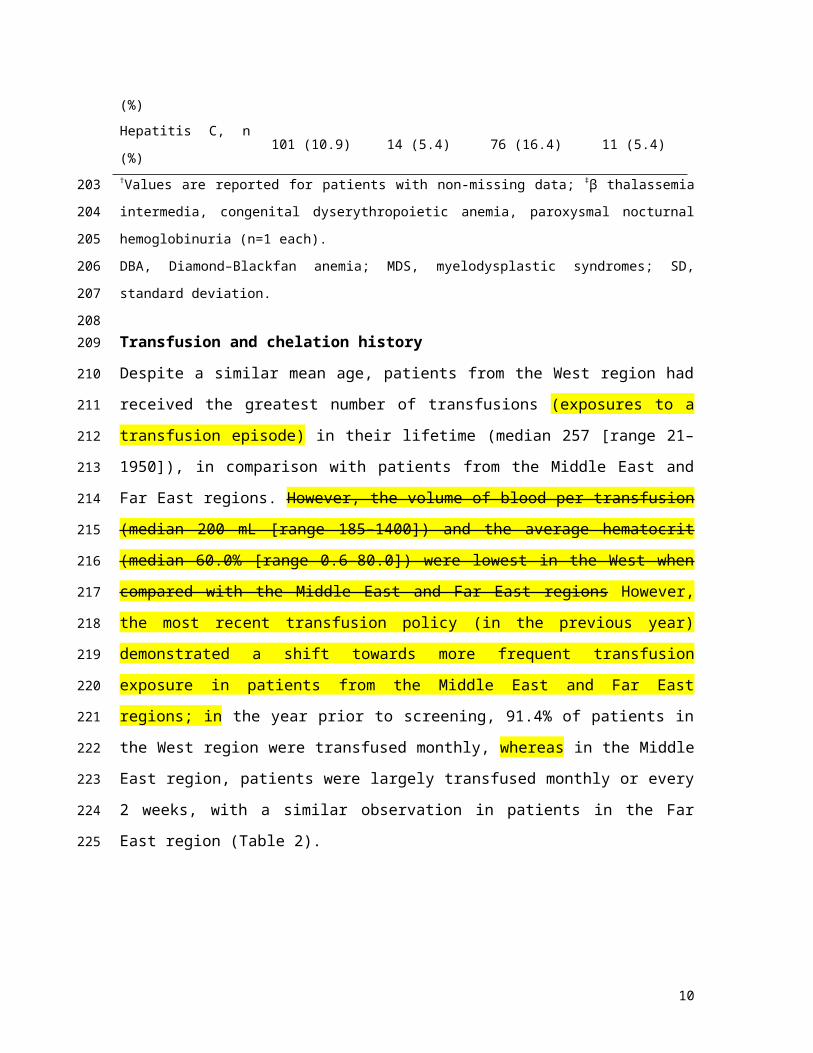
Hepatitis C, n (%) 101 (10.9) 14 (5.4) 76 (16.4) 11 (5.4)†Values are reported for patients with non-missing data; ‡β thalassemia intermedia, congenital
dyserythropoietic anemia, paroxysmal nocturnal hemoglobinuria (n=1 each).
DBA, Diamond–Blackfan anemia; MDS, myelodysplastic syndromes; SD, standard deviation.
Transfusion and chelation historyDespite a similar mean age, patients from the West region had received the greatest
number of transfusions (exposures to a transfusion episode) in their lifetime (median
257 [range 21–1950]), in comparison with patients from the Middle East and Far
East regions. However, the volume of blood per transfusion (median 200 mL [range
185–1400]) and the average hematocrit (median 60.0% [range 0.6–80.0]) were
lowest in the West when compared with the Middle East and Far East regions
However, the most recent transfusion policy (in the previous year) demonstrated a
shift towards more frequent transfusion exposure in patients from the Middle East
and Far East regions; in the year prior to screening, 91.4% of patients in the West
region were transfused monthly, whereas in the Middle East region, patients were
largely transfused monthly or every 2 weeks, with a similar observation in patients in
the Far East region (Table 2).
7
160
161
162
163164
165
166
167
168
169
170
171
172
173
174
175
176
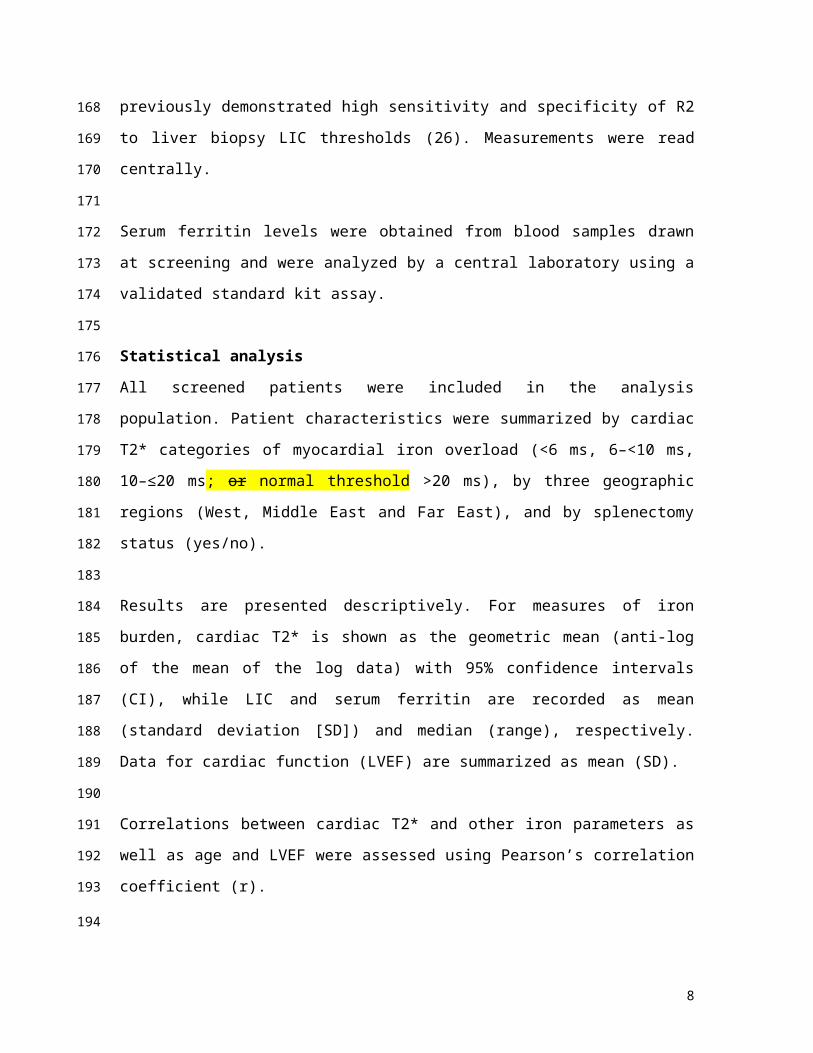
Table 2. History of blood transfusion by geographic region
Overall West Middle East Far East
Time since start of transfusions, years
Patients, n 839 257 383 199
Mean (SD) 17.6 (7.0) 18.6 (7.1) 18.0 (6.9) 15.8 (6.7)
Median (range) 16.5 (0–49.1) 17.3 (5.1–49.1) 17.4 (0–44.1) 14.2 (2.2–38.8)
Number of transfusions episodes
Patients, n 770 248 324 198
Mean (SD) 256 (184) 315 (228) 228 (145) 229 (163)
Median (range) 216 (15–1950) 257 (21–1950) 207 (15–840) 188 (30–1000)
Volume per blood transfusion, mL
Patients, n 774 201 375 198
Mean (SD) 364 (157) 279 (170) 400 (79) 380 (212)
Median (range) 350 (148–1400) 200 (185–1400) 350 (148–700) 300 (150–1000)
Average hematocrit, %
Patients, n 620 162 324 134
Mean (SD) 63.5 (8.1) 59.2 (5.5) 64.1 (6.5) 67.3 (11.3)
Median (range) 64.0 (0.6–80.0) 60.0 (0.6–80.0) 65.0 (35.0–76.0)
65.0 (50.0–80.0)
Usual transfusion frequency in the previous year, n (%)
Patients, n 859 257 401 201
Every 2 weeks 157 (18.3) 16 (6.2) 80 (20.0) 61 (30.3)
Every month 633 (73.7) 235 (91.4) 269 (67.1) 129 (64.2)
Every 6 weeks 30 (3.5) 5 (1.9) 23 (5.7) 2 (1.0)
Every 2 months 19 (2.2) 1 (0.4) 11 (2.7) 7 (3.5)
Every 3 months 12 (1.4) – 10 (2.5) 2 (1.0)
Every 4 months 3 (0.3) – 3 (0.7) –
Every 6 months 5 (0.6) – 5 (1.2) –
Most patients (98.5%) had received previous iron chelation therapy with a range of
agents for a median of 12.3 years (0.0–37.1; Table 3). In the West region,
deferasirox was most frequently used (54.8%) just prior to study entry, compared
with 8.0% in the Middle East and 15.2% in the Far East regions. DFO was the most
8
177
178
179
180
181
182
frequent last prior therapy in both the Middle East (46.4%) and Far East (36.4%)
regions. Time since initiation of chelation therapy was shortest in patients in the Far
East region (9.1 years [0.1–31.3]), indicating that these patients, who had a mean
age at screening for the study similar to patients from other regions, initiated
chelation therapy at a later age than in other regions – although these patients had
also started transfusions more recently (Table 2). Indeed, the median (range) time
difference between start of transfusions and initiation of chelation therapy was
longest in patients in the Far East region (4.8 years [‒7.0‒35.2]) compared with the
West (2.8 years [‒8.0‒27.3]) and Middle East regions (3.0 years [‒16.1‒26.0]).
Patients in the West and Far East regions had no interruption of chelation therapy
after it was initiated (median of 0 months without chelation), while for patients in the
Middle East region, the median duration of interruption was 10.0 months (0.0–600.0;
Table 3).
Table 3. Prior chelation therapy by geographic region
Overall(n=888)
West(n=259)
Middle East(n=427)
Far East(n=202)
Previous chelation, n (%) 875 (98.5) 259 (100.0) 418 (97.9) 198 (98.0)
DFO 300 (34.5) 37 (14.3) 191 (46.4) 72 (36.4)
Deferiprone 113 (13.0) 29 (11.2) 51 (12.4) 33 (16.7)
DFO + deferiprone 205 (23.6) 50 (19.3) 104 (25.2) 51 (25.8)
Deferasirox 205 (23.6) 142 (54.8) 33 (8.0) 30 (15.2)
Other† 46 (5.3) 1 (0.4) 33 (8.0) 12 (6.1)
Time since start of chelation, years
Mean (SD) 12.8 (6.7) 14.0 (7.2) 13.8 (6.1) 9.4 (5.7)
Median (range) 12.3 (0–37.1) 13.2 (0–37.1)13.4 (0.2–
34.1)9.1 (0.1–31.3)
Time without chelation after initiation, months
Mean (SD) 12.8 (38.0) 1.7 (10.9) 28.7 (54.2) 1.4 (8.6)
Median (range) 0 (0–600.0) 0 (0–108.0) 10.0 (0–600.0) 0 (0–87.0)†Unknown or patients received irregular deferiprone and/or DFO therapy.DFO, deferoxamine; SD, standard deviation.
9
183
184
185
186
187
188
189
190
191
192
193
194
195
196
197
198199200
201
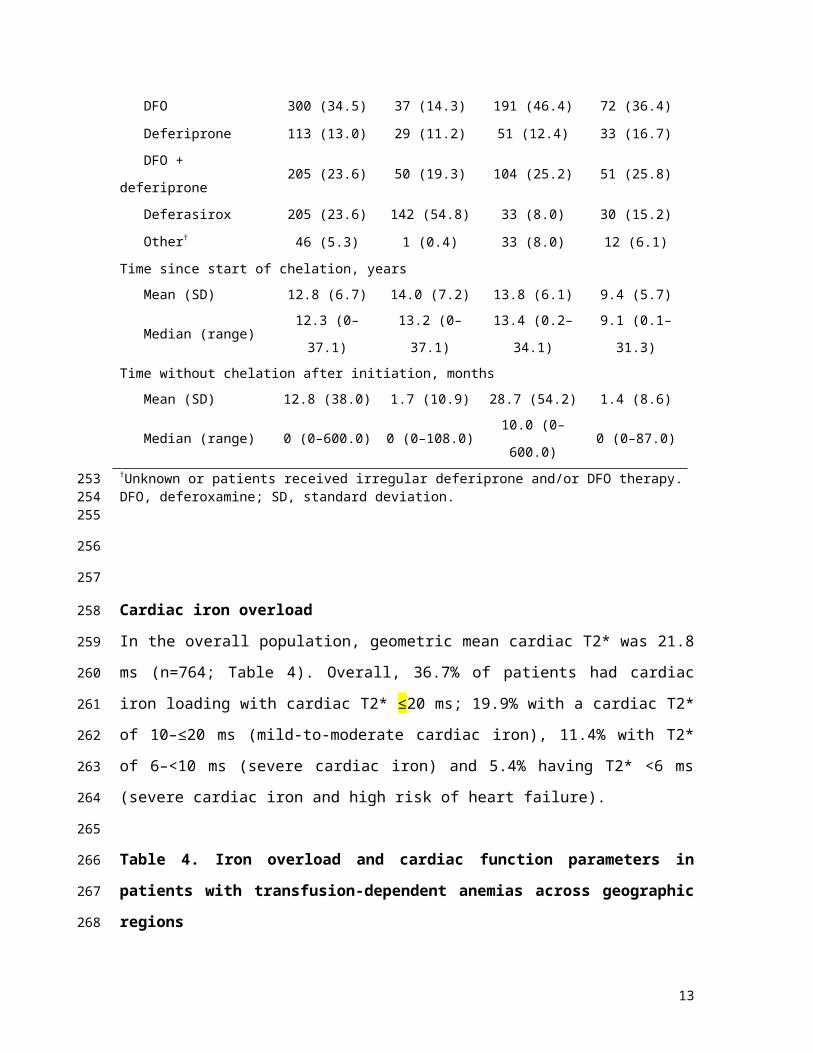
Cardiac iron overloadIn the overall population, geometric mean cardiac T2* was 21.8 ms (n=764; Table 4).
Overall, 36.7% of patients had cardiac iron loading with cardiac T2* ≤20 ms; 19.9%
with a cardiac T2* of 10–≤20 ms (mild-to-moderate cardiac iron), 11.4% with T2* of
6–<10 ms (severe cardiac iron) and 5.4% having T2* <6 ms (severe cardiac iron and
high risk of heart failure).
Table 4. Iron overload and cardiac function parameters in patients with transfusion-dependent anemias across geographic regions
Overall(n=925)
West(n=259)
Middle East(n=463)
Far East(n=203)
Geometric mean cardiac T2*
(95% CI), ms
21.8
(20.8, 22.9)
19.4
(17.8, 21.2)
24.5
(22.9, 26.3)
20.0
(18.0, 22.2)
Mean LVEF (SD), % 66.9 (5.8) 66.7 (5.5) 66.1 (6.1) 68.6 (5.2)
Mean LIC (SD), mg Fe/g dw 25.8 (17.1) 19.4 (14.6) 25.1 (16.5) 35.1 (16.9)
Median serum ferritin(range), ng/mL
3702(64–23,640)
2316(334–11,682)
3742(64–16,736)
5261(685–23,640)
CI, confidence interval; LIC, liver iron concentration; LVEF, left ventricular ejection fraction; SD,
standard deviation.
Geometric mean cardiac T2* differed across geographic regions, with the highest
value (indicating lower cardiac iron burden) in patients from the Middle East region
(Table 4). The distribution of cardiac iron overload severity categories also varied
between geographic regions as well as in comparison with the overall population
(Figure 1). In contrast to patients in the West (45.9%) and the Far East (40.9%)
regions, fewer patients in the Middle East regions had cardiac iron loading with T2*
≤20 ms (28.5%).
10
202
203
204
205
206
207
208
209
210
211
212
213
214
215
216
217
218
219
220
221
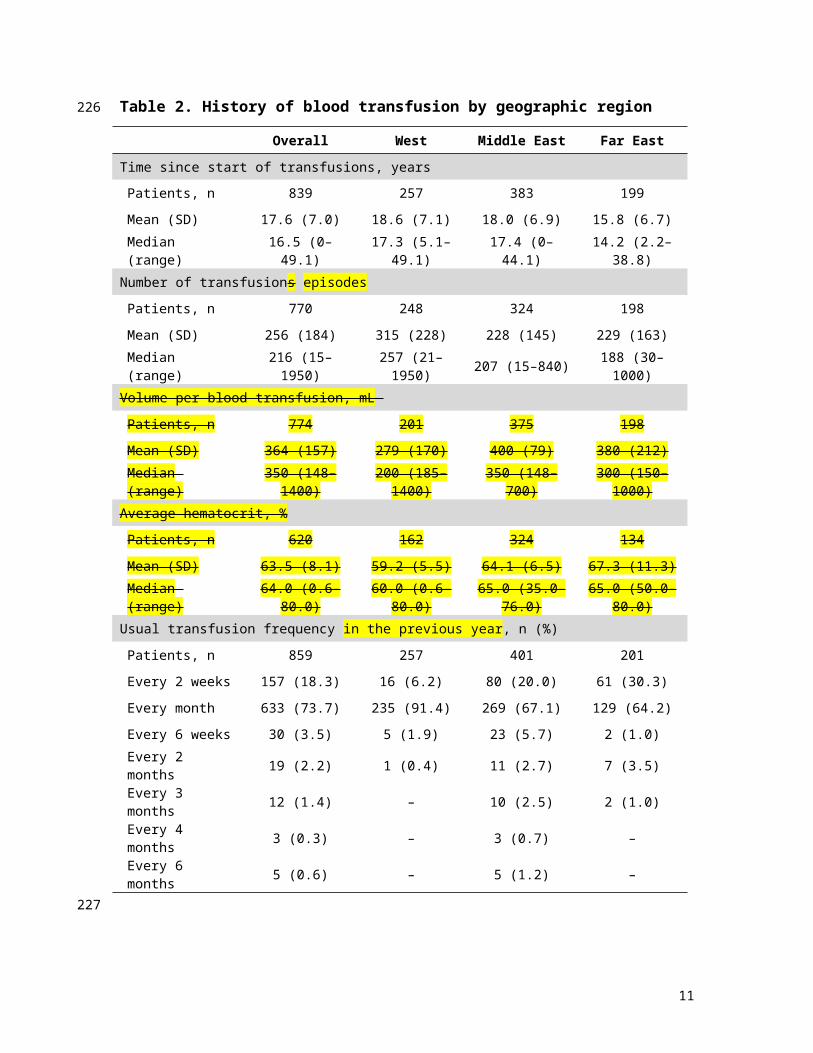
Figure 1. Prevalence of A) cardiac and B) liver iron overload in patients with transfusion-dependent anemias across geographic regions
5.4 5.6 4.5 6.811.4 15.0
7.913.6
19.925.3
16.120.5
63.454.1
71.559.1
0102030405060708090
100
Overall (n=764)
West (n=233)
Middle East (n=355)
Far East (n=176)
T2* <6ms T2* 6–<10msT2* 10–≤20ms T2* >20ms
64.151.2
63.482.0
19.4
21.9
22.6
10.616.4
26.914.0 7.4
0102030405060708090
100
Overall (n=767)
West (n=242)
Middle East (n=336)
Far East (n=189)
LIC ≥15 mg Fe/g dw LIC 7–<15 mg Fe/g dwLIC <7 mg Fe/g dw
Pat
ient
s(%
)
A B
Geometric mean cardiac T2* also differed by splenectomy status, with a slightly
higher value in non-splenectomized patients versus splenectomized patients (23.2
ms [95% CI 21.7, 24.7] vs 20.6 ms [19.2, 22.1], respectively). More non-
splenectomized patients had cardiac T2* >20 ms (67.7 vs 59.3% of splenectomized
patients), and 12.5% of non-splenectomized patients had severe cardiac siderosis
compared with 20.7% of splenectomized patients.
Cardiac functionThere were no differences across geographic regions in mean LVEF, which was in
the normal range among all patient populations (Table 4). Among T2* categories,
mean (SD) LVEF was lowest in patients with severe cardiac iron overload
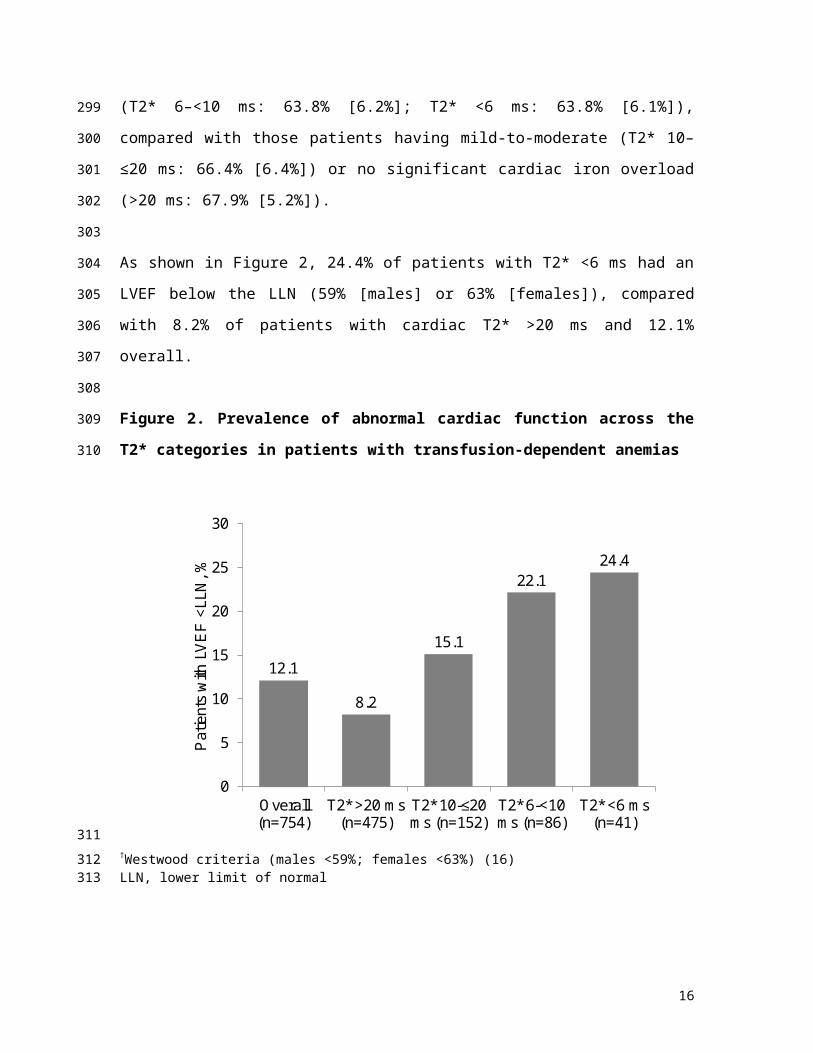
(T2* 6–<10 ms: 63.8% [6.2%]; T2* <6 ms: 63.8% [6.1%]), compared with those
patients having mild-to-moderate (T2* 10–≤20 ms: 66.4% [6.4%]) or no significant
cardiac iron overload (>20 ms: 67.9% [5.2%]).
As shown in Figure 2, 24.4% of patients with T2* <6 ms had an LVEF below the LLN
(59% [males] or 63% [females]), compared with 8.2% of patients with cardiac T2*
>20 ms and 12.1% overall.
11
222
223
224
225
226
227
228
229
230
231
232
233
234
235
236
237
238
239
240
241
242
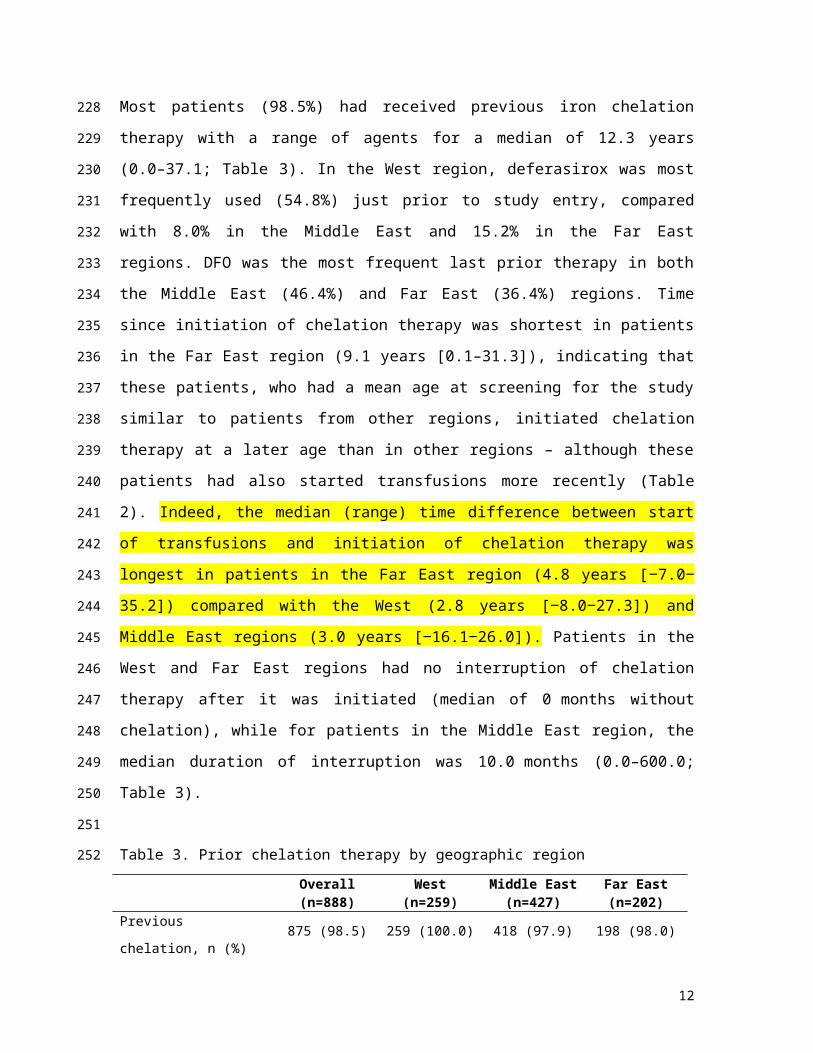
Figure 2. Prevalence of abnormal cardiac function across the T2* categories in patients with transfusion-dependent anemias
12.1
8.2
15.1
22.124.4
0
5
10
15
20
25
30
Overall (n=754)
T2* >20 ms (n=475)
T2* 10-≤20 ms (n=152)
T2* 6-<10 ms (n=86)
T2* <6 ms (n=41)
Pat
ient
s w
ith L
VE
F <L
LN, %
†Westwood criteria (males <59%; females <63%) (16)LLN, lower limit of normal
Other iron parametersLIC
Mean (SD) LIC was severely elevated in the overall population of screened patients
(25.8 [17.1] mg Fe/g dw) and when analyzed by geographic region (Table 4).
However, the magnitude of mean LIC elevations differed according to region, with
the lowest and highest LIC values observed in the West and Far East regions,
respectively (Table 4).
The proportions of patients meeting predefined categories of LIC severity (<7,
7–<15 and ≥15 mg Fe/g dw) are shown by geographic region in Figure 1. Overall,
64.1% of patients had severe liver iron burden, as shown by LIC ≥15 mg Fe/g dw.
The distribution of patients across categories of LIC severity varied between the
West, Far East and Middle East regions. The overwhelming majority (82.0%) of
12
243
244
245
246247248249
250
251
252
253
254
255
256
257
258
259
260
261
262
patients in the Far East region had LIC ≥15 mg Fe/g dw compared with
approximately half (51.2%) of patients from the West region and 63.4% from the
Middle East region (Figure 1). The proportion of patients with low liver iron burden
(LIC <7 mg Fe/g dw) was more than three-fold higher in the West region than in the
Far East region (Figure 1).
Distribution of cardiac and liver iron burden
We also examined the pattern of cardiac and liver iron distribution among screened
patients with data available for both assessments. Only four patients (all from the
West region) had severe cardiac iron burden but low LIC (T2* <10 ms and LIC
<7 mg Fe/g dw). Among patients with normal cardiac iron (T2* >20 ms), more than
half (58.5%) had an LIC ≥15 mg Fe/g dw, while 19.6 and 21.9% had LIC <7 or
7–<15 mg Fe/g dw, respectively. Within regions, a higher proportion of patients with
T2* >20 ms from the Middle East and Far East region had severe liver iron burden
(LIC ≥15 mg Fe/g dw) compared with those having LIC <7 mg Fe/g dw (Middle East
region, 56.7 vs 17.2%; Far East region, 78.6 vs 7.8%, respectively; Table 5). This
within-region trend for differences in liver iron loading among patients with normal
cardiac iron was less evident among patients from the West region (44.6% had LIC
≥15 mg Fe/g dw vs 33.9% with LIC <7 mg Fe/g dw).
13
263
264
265
266
267
268
269
270
271
272
273
274
275
276
277
278
279
280
281
282
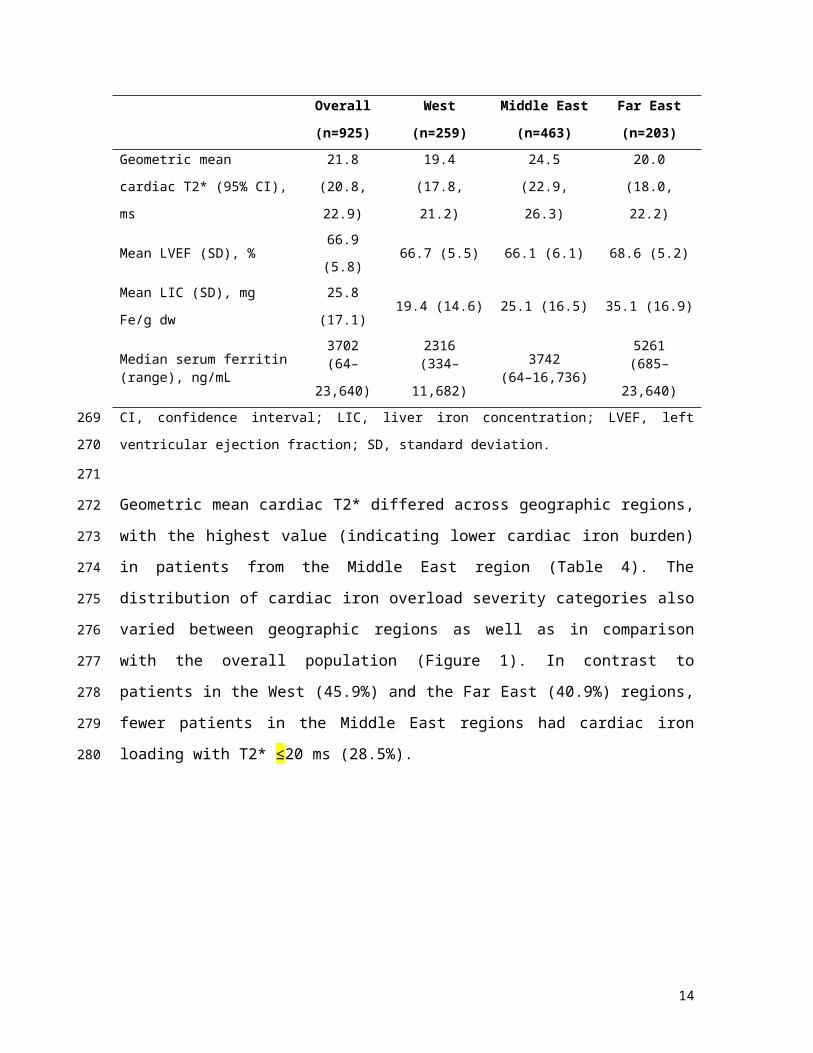
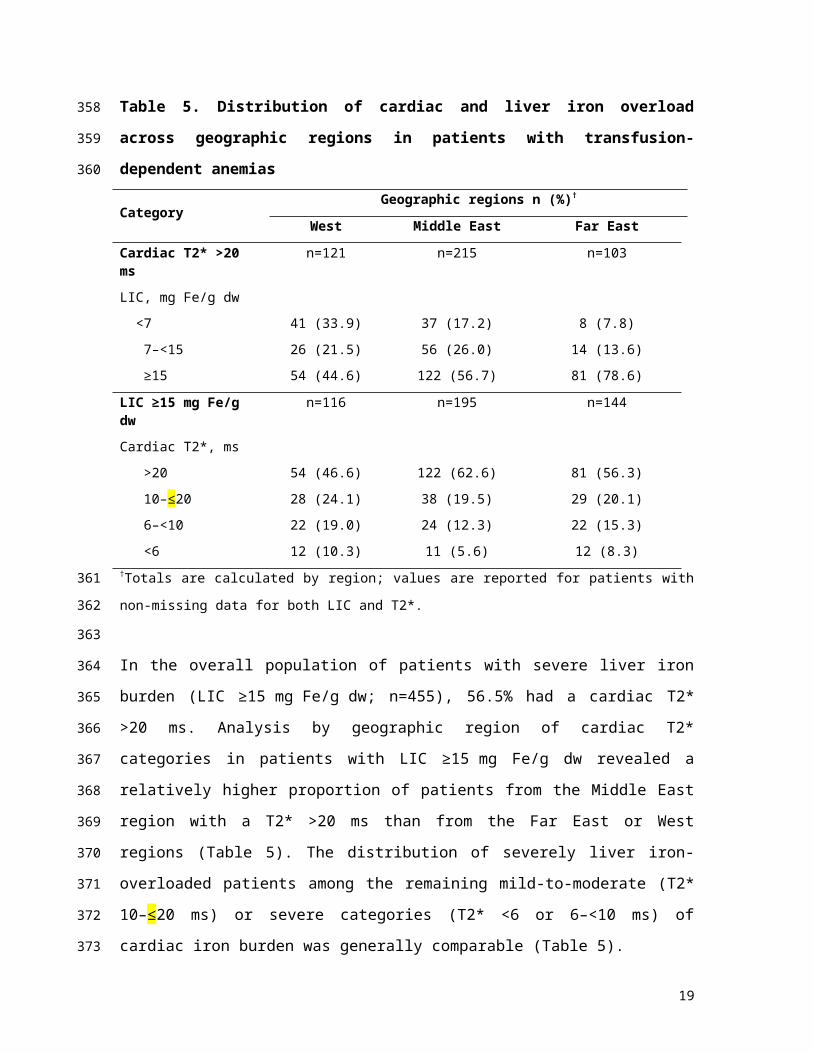
Table 5. Distribution of cardiac and liver iron overload across geographic regions in patients with transfusion-dependent anemias
CategoryGeographic regions n (%)†
West Middle East Far East
Cardiac T2* >20 ms n=121 n=215 n=103
LIC, mg Fe/g dw
<7
7–<15
≥15
41 (33.9)
26 (21.5)
54 (44.6)
37 (17.2)
56 (26.0)
122 (56.7)
8 (7.8)
14 (13.6)
81 (78.6)
LIC ≥15 mg Fe/g dw n=116 n=195 n=144
Cardiac T2*, ms
>20
10–≤20
6–<10
<6
54 (46.6)
28 (24.1)
22 (19.0)
12 (10.3)
122 (62.6)
38 (19.5)
24 (12.3)
11 (5.6)
81 (56.3)
29 (20.1)
22 (15.3)
12 (8.3)†Totals are calculated by region; values are reported for patients with non-missing data for both
LIC and T2*.
In the overall population of patients with severe liver iron burden (LIC
≥15 mg Fe/g dw; n=455), 56.5% had a cardiac T2* >20 ms. Analysis by geographic
region of cardiac T2* categories in patients with LIC ≥15 mg Fe/g dw revealed a
relatively higher proportion of patients from the Middle East region with a T2* >20 ms
than from the Far East or West regions (Table 5). The distribution of severely liver
iron-overloaded patients among the remaining mild-to-moderate (T2* 10–≤20 ms) or
severe categories (T2* <6 or 6–<10 ms) of cardiac iron burden was generally
comparable (Table 5).
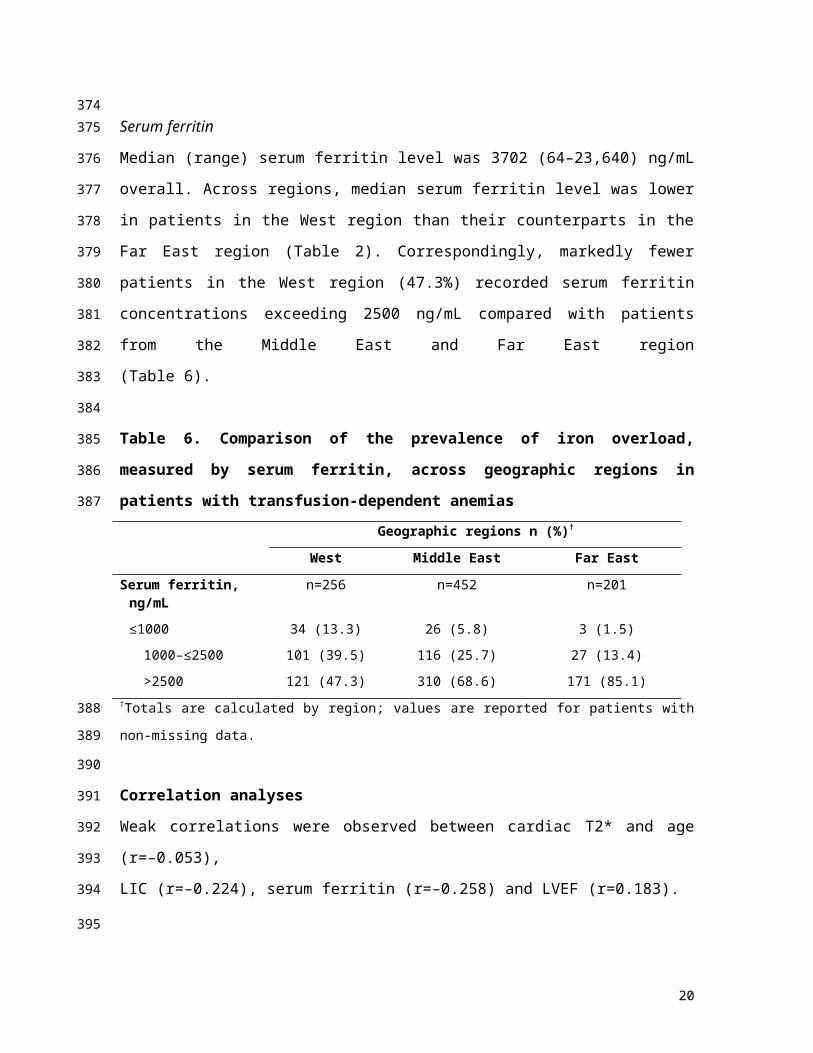
Serum ferritin
Median (range) serum ferritin level was 3702 (64–23,640) ng/mL overall. Across
regions, median serum ferritin level was lower in patients in the West region than
their counterparts in the Far East region (Table 2). Correspondingly, markedly fewer
patients in the West region (47.3%) recorded serum ferritin concentrations exceeding
2500 ng/mL compared with patients from the Middle East and Far East region
(Table 6).
14
283
284
285
286
287
288
289
290
291
292
293
294
295
296297
298
299
300
301
302
303
304

Table 6. Comparison of the prevalence of iron overload, measured by serum ferritin, across geographic regions in patients with transfusion-dependent anemias
Geographic regions n (%)†
West Middle East Far East
Serum ferritin, ng/mL n=256 n=452 n=201
≤1000
1000–≤2500
>2500
34 (13.3)
101 (39.5)
121 (47.3)
26 (5.8)
116 (25.7)
310 (68.6)
3 (1.5)
27 (13.4)
171 (85.1)†Totals are calculated by region; values are reported for patients with non-missing data.
Correlation analysesWeak correlations were observed between cardiac T2* and age (r=–0.053),
LIC (r=–0.224), serum ferritin (r=–0.258) and LVEF (r=0.183).
DiscussionAlthough cardiac-related mortality remains a leading cause of death in patients with
transfusion-dependent anemias, changing management strategies have brought
about a reduction in the number of deaths attributed to iron-induced cardiomyopathy
(23-25). Since there is a lack of awareness of the impact of these changes on the
prevalence of cardiac iron, the CORDELIA study (a randomized comparison of
deferasirox versus DFO) provided the opportunity to investigate the prevalence of
cardiac iron overload from a broader geographical perspective, as well as body iron
burden overall.
We found that approximately one-third of patients screened for entry to CORDELIA
had significant cardiac iron loading, and that the prevalence of severe cardiac
siderosis (T2* <10 ms) was 16.8%. The overall prevalence of cardiac iron overload
(T2* ≤20 ms) was of 36.7% observed in this analysis (36.7%) is slightly lower than
previous observations (27-29). A recent survey undertaken in 35 worldwide centers
among 3445 patients with β thalassemia major identified a cardiac iron overload
prevalence of 42.3% (29). Similar observations have also been reported in other
studies (27, 28). Patients screened for CORDELIA had very high liver iron burden
15
305
306
307
308
309
310
311
312
313
314
315
316
317
318
319
320
321
322
323
324
325
326
327
328
329
330
331
overall, with a mean LIC of 25.8 mg Fe/g dw and 64.1% of patients having an LIC
>15 mg Fe/g dw. Serum ferritin levels were also elevated, with a median of 3702
ng/mL. Most patients screened for CORDELIA fell into the category for severe liver
iron burden (LIC >15 mg Fe/g dw), but with cardiac T2* in the normal range (>20
ms). However, we observed several differences in the distribution of iron overload
among patients across the regions from the West, Middle East and Far East regions,
and this may have had an impact on the observations made. Patients in the West
region had the highest cardiac iron burden, but the lowest liver iron burden and
serum ferritin levels. Cardiac iron burden was lowest in the Middle East region,
although the large majority of these patients with T2* in the normal range (>20 ms)
also had severely elevated LIC, a trend which was observed least often in patients
from the West region. Patients in the West and Middle Eastern regions were of a
similar age and had a similar duration since initiation of transfusions, so these factors
were unlikely to have significant impact on the differences in body iron distribution
across these groups. El-Beshlawy et al (2013) have also recently reported similar
observations in that in Middle Eastern patients, the prevalence of cardiac iron
loading was low despite severe liver iron burden (30). Finally, the proportion of
patients with T2* ≤20 ms reported in the Middle East region here (28.5%) contrasts
with data reported in 2009 among 81 patients from Oman, where 46% of patients
had abnormal cardiac T2* (27). Genetic differences in the thalassemia genotype or
other modifying genetic influences are unlikely to explain this difference, why Oman
has a higher proportion of patients with low T2* than other countries in the region.
These differences in prevalence but may reflect the smaller patient population in the
Omani study, but could also follow on from differences in patient management of
these patients among various Middle Eastern countries.
Age at starting transfusion or chelation therapy, the nature of transfusion or chelation
regimens and patient age at screening may all contribute to iron accumulation and
distribution. and requires further systematic investigation. Information on transfusion
and chelation practices was collected at screening, and examined in an attempt to
understand any potential impact on the observed regional differences. It is well
known that inefficient blood supply and/or difficulty in patient access leads to a lower
16
332
333
334
335
336
337
338
339
340
341
342
343
344
345
346
347
348
349
350
351
352
353
354
355
356
357
358
359
360
361
362
363
frequency of transfusion in some countries (31). The large majority of patients in the
West region were transfused monthly. Approximately two-thirds of patient in the
Middle East and Far East regions also received monthly transfusions, but a
significant proportion received transfusions every 2 weeks instead. Importantly, both
the volume of blood per transfusion and the hematocrit were typically higher in
patients from the Middle East and Far East regions as well, which could have
implications on the iron loading rate (32). Furthermore, the majority of patients from
the Far East region were not splenectomized. If hypersplenism was present in these
patients, perhaps as a result of inadequate transfusion policies in the past, it could
explain the observed higher transfusion frequency in the year prior to screening and
volume per blood transfusion compared with Western patients, and could also
contribute to the higher body iron burden despite lower transfusion chronicity. Later
onset of transfusion dependency in patients from the Far East region (despite being
of a similar mean age at screening compared to patients from the other regions) may
explain the shorter exposure to prior chelation therapy. It is possible that some
patients from this region were non-transfusion-dependent thalassemia (NTDT)
patients who later became regularly transfused; a scenario which is quite common in
patients with HbE/β thalassemia in the Far East. This could also help clarify why the
highest liver iron burden was seen in this group. Serum ferritin levels in patients with
NTDT tend to underestimate liver iron burden (33-35), unless patients are initiated
on a regular transfusion program as their disease severity worsens. Thus, in these
patients serum ferritin assessments alone may not have reflected body iron burden
until later in their lives once significant liver iron deposition had already developed.
Finally, Pre-transfusional hemoglobin levels were not available in the data collected,
as this would give further insight into the local transfusion practices and the
implications on iron loading and distribution.
With regard to the last prior iron chelation therapy at screening, information on
adherence was not systematically collected. Although information on adherence was
not systematically collected, deferasirox was reported as last prior chelation in over
half of patients in the West region, but only a small proportion of patients in the
Middle and Far East regions. In these latter regions, DFO use was most common,
17
364
365
366
367
368
369
370
371
372
373
374
375
376
377
378
379
380
381
382
383
384
385
386
387
388
389
390
391
392
393
394
395
perhaps due to limited patient access to oral therapies. A recent longitudinal analysis
highlighted differences between cardiac and liver iron changes depending on the
type of chelation regimen utilized, suggesting that chelation therapy should ideally be
tailored based on individual patient body iron burden (36).
Since the spleen may have a role in iron regulation (28, 37), differences in
splenectomy practices may also influence the disparity in body iron distribution
across the regions examined. A greater proportion of patients from the West region
had undergone splenectomy (58.3 vs 51.0 and 36.0% of patients from the Middle
East and Far East regions, respectively), which could contribute to the higher cardiac
iron burden in these patients as splenectomy has been implicated in increased
cardiac siderosis. A role for splenectomy in increased cardiac siderosis has been
suggested (28), where the intact spleen acts as a reservoir of excess iron, providing
a possible non-transferrin-bound iron scavenging function; hence, in the absence of
the spleen, there is less control over body iron in general (38). However, multiple
confounding factors could also contribute to this observation, such as local
transfusion practices and attitude to the safety of splenectomy. and particularly since
splenectomy is often considered in more severe disease.
Furthermore, the kinetics of iron accumulation may differ across geographic regions
depending on the genetic background of patients and may play an underlying role in
the observed differences in both the extent and pattern of iron burden between the
regions (39-42). For example, the genetic basis for hereditary and non-hereditary
iron overload in sub-Saharan Africans has been localized to a common mutation
within the ferroportin 1 (SLC40A1) gene, which is not present in Caucasians with
normal or abnormal iron load. Such genetic factors, among others, may play an
underlying role in the observed differences in both the extent and pattern of iron
burden between the regions examined here.
There was no clinically meaningful correlation between cardiac T2* and age, LIC,
serum ferritin or LVEF in this analysis, of 925 screened patients with transfusion-
dependent anemias. These findings are also which is consistent with previous
18
396
397
398
399
400
401
402
403
404
405
406
407
408
409
410
411
412
413
414
415
416
417
418
419
420
421
422
423
424
425
426
427
observations (6, 43), including an earlier study in 652 patients with β thalassemia
major, which concluded that among the relationships between cardiac T2*, liver T2*
and serum ferritin, only the relationship between liver iron and serum ferritin
remained clinically meaningful (10). In particular, even though LIC was severely
elevated in the majority of patients, this parameter was not a reliable predictor of
cardiac iron loading, consistent with a disparity in the kinetics of iron accumulation
and removal between these organs (5, 44). Nevertheless, high LIC may be relevant
however because since preliminary data suggest that there may be an association
between LIC and the rate of cardiac iron removal in patients treated with deferasirox
(22, 45). Additionally, although a strong relationship between LVEF and cardiac T2*
was not shown in this analysis – likely related to the substantial number of patients
with cardiac T2* in the normal range (5) – we did observe that nearly one-quarter of
patients with very severe cardiac iron loading (T2* <6 ms) had cardiac dysfunction as
observed by LVEF below the LLN for thalassemic patients. There was also a trend
for a greater proportion of cardiac dysfunction at lower cardiac T2* categories. Kirk et
al (2009) (10) provided convincing evidence to support a relationship between the
severity of myocardial siderosis (T2* <20 ms) and the risk of heart failure or
arrhythmias, thus supporting the validity of cardiac T2* as an early predictor of heart
complications. Interestingly, however, in our study, 8% of patients with normal
cardiac T2* had abnormal LVEF, highlighting the importance of monitoring both
cardiac iron burden and cardiac function.
Despite the majority of patients having documented receipt of some prior iron
chelation therapy, total body iron burden in this large cohort was severe, indicating
that compliance and/or dosage may have been sub-optimal. Liver iron burden in
particular was severely elevated, providing evidence to support recent observations
that liver complications are on the rise, relative to heart complications (25, 46). After
heart failure, liver disorders were the second most common cause of death among
thalassemia patients in a Greek hemoglobinopathy registry study, accounting for
18% of deaths in thalassemia patients, and an increase in the number of deaths
attributed to liver complications has been observed in the last decade (25). The fact
that a significant proportion of patients continue to show cardiac iron loading, as well
19
428
429
430
431
432
433
434
435
436
437
438
439
440
441
442
443
444
445
446
447
448
449
450
451
452
453
454
455
456
457
458
459
as the substantial liver iron burden demonstrates that there remains a need for the
optimization of effective and convenient iron chelation treatment regimens. This can
be achieved through more head-to-head comparisons of various chelation strategies
to help identify which patients will benefit most from the available chelation regimens.
Findings from the CORDELIA study, the first randomized trial to compare deferasirox
to DFO for the removal of cardiac iron, confirmed the non-inferiority of deferasirox,
with a trend for superiority (22). Although the combination of deferiprone and DFO is
not indicated in the product labels, randomized controlled trial data also supports the
benefit of this regimen in patients with significant cardiac siderosis (19). As removal
of iron from the heart occurs more slowly than for the liver (5, 44), longer study
durations are valuable to help gauge the true efficacy of chelation treatments.
As with studies of a non-interventional design, the potential influence of patient
selection bias for screening should be a consideration when interpreting these
results from this study. CORDELIA entry criteria were stringent with regard to body
iron burden and transfusion dependence, and physicians may have been mindful of
these when identifying patients who were appropriate for screening for a study on
cardiac iron overload, possibly selecting those patients most likely to have cardiac
iron. Additionally, a high number of patients screened for entry originated from the
Middle East region (463 of 925 patients). Observations of a lower prevalence of
cardiac iron burden in these patients may have impacted the findings of the results
reported here. Local country transfusion and chelation practices may influence
regional observations, particularly when groups were unbalanced such as the large
number of patients from Turkey compared with other countries in the West region.
Finally, cross-sectional analyses such as these should be interpreted with caution,
particularly since differences in previous chelation practices and patient compliance
are likely to impact on iron chelation efficacy and the relationship between heart and
liver iron unloading (36). It should also be noted that the results from this exploratory
analysis are presented descriptively, as the study was neither designed nor powered
to detect statistical differences between different populations.
20
460
461
462
463
464
465
466
467
468
469
470
471
472
473
474
475
476
477
478
479
480
481
482
483
484
485
486
487
488
489
490
In summary In these patients with transfusion-dependent anemias screened for entry
into the CORDELIA study, cardiac siderosis was observed in approximately one-third
of patients screened for entry into the CORDELIA study. The burden of liver iron
loading in particular was severe in the majority of patients, despite prior chelation
therapy in almost all patients examined. We observed differences in the pattern of
iron accumulation across geographic regions examined, which may be the result of
patient age, transfusion, chelation and other disease management practices, as well
as inherent population differences; further investigation into these differences is
warranted. Collectively, these results suggest a need to optimize effective and
convenient chelation regimens for personalized treatment to better manage both
cardiac and liver burden in patients with transfusion-dependent anemias.
21
491
492
493
494
495
496
497
498
499
500
501
AcknowledgementsWe thank Debbi Gorman of Mudskipper Bioscience Ltd for medical editorial
assistance. Financial support for medical editorial assistance was provided by
Novartis Pharmaceuticals.
Funding sourceThe study was sponsored by Novartis Pharma AG and designed by the sponsor in
close collaboration with the Study Steering Committee. The sponsor conducted the
statistical analysis. Authors had full access to the data, and participated actively in
interpreting data and critically reviewing the article with the assistance of a medical
writer funded by the sponsor. All authors approved the final manuscript.
Authorship contributionsAE-B, AY, JBP, ME, VV, YA and YK served as investigators on this trial, screening
patients. They contributed to data interpretation, reviewed and provided their
comments on this manuscript. AP, DJP, JBP, and YA served as Study Steering
Committee members overseeing the conduct of the trial, from study design to
analysis plan and data interpretation. DH assisted in developing the trial protocol,
coordinating the execution of the trial and contributing to the analysis, interpretation
and reporting of the study data. EQF served as the study analysis statistician. All
authors approved the final manuscript.
DisclosuresYA reports participation in advisory boards consultancy and speaker’s bureau, and
receiving honoraria and research grant funding from Novartis Pharmaceuticals; and
participation in advisory boards consultancy and receiving research grant funding
from Shire. JBP reports consultancy, receiving research grant funding and honoraria
from Novartis Pharmaceuticals; consultancy and receiving research grant funding
from Shire; and consultancy for Celgene. AP reports participation in advisory boards
and receiving research grant funding from Novartis Pharmaceuticals, ApoPharma
and Shire. VV received research grant support, consultation and lecture fees from
Novartis Pharmaceuticals, Government Pharmaceutical Organization (GPO)
22
502
503
504
505
506
507
508
509
510
511
512
513
514
515
516
517
518
519
520
521
522
523
524
525
526
527
528
529
530
531
532
533
Thailand and Shire. DH is an employee of Novartis Pharmaceuticals, and EQF is an
employee of Novartis Pharma AG. AE-B, AY, YK, and ME have no relevant conflicts
of interest to disclose. DJP reports consultancy and receiving research grant funding
and honoraria from Novartis Pharmaceuticals and AMAG; lecture fees from Novartis
Pharmaceuticals; consultancy and honoraria from ApoPharma Inc and from Shire;
and is a director and equity holder in Cardiovascular Imaging Solutions.
23
534
535
536
537
538
539
References
1. Ehlers KH, Giardina PJ, Lesser ML, ENGLE MA, Hilgartner MW. Prolonged survival in patients with beta-thalassemia major treated with deferoxamine. J Pediatr 1991;118:540-545.
2. Brittenham GM, Griffith PM, Nienhuis AW, McLaren CE, Young NS, Tucker EE, Allen CJ, Farrell DE, Harris JW. Efficacy of deferoxamine in preventing complications of iron overload in patients with thalassemia major. N Engl J Med 1994;331:567-573.
3. Olivieri NF, Nathan DG, MacMillan JH, Wayne AS, Liu PP, McGee A, Martin M, Koren G, Cohen AR. Survival in medically treated patients with homozygous beta-thalassemia. N Engl J Med 1994;331:574-578.
4. Borgna-Pignatti C, Rugolotto S, De Stefano P, Zhao H, Cappellini MD, Del Vecchio GC, Romeo MA, Forni GL, Gamberini MR, Ghilardi R, Piga A, Cnaan A. Survival and complications in patients with thalassemia major treated with transfusion and deferoxamine. Haematologica 2004;89:1187-1193.
5. Anderson LJ, Holden S, Davis B, Prescott E, Charrier CC, Bunce NH, Firmin DN, Wonke B, Porter J, Walker JM, Pennell DJ. Cardiovascular T2-star (T2*) magnetic resonance for the early diagnosis of myocardial iron overload. Eur Heart J 2001;22:2171-2179.
6. Di Tucci AA, Matta G, Deplano S, Gabbas A, Depau C, Derudas D, Caocci G, Agus A, Angelucci E. Myocardial iron overload assessment by T2* magnetic resonance imaging in adult transfusion dependent patients with acquired anemias. Haematologica 2008;93:1385-1388.
7. Carpenter J-P, He T, Kirk P, Roughton M, Anderson LJ, de Noronha SV, Sheppard MN, Porter JB, Walker JM, Wood JC, Galanello R, Forni G, Catani G, Matta G, Fucharoen S, Fleming A, House MJ, Black G, Firmin DN, St Pierre TG, Pennell DJ. On T2* magnetic resonance and cardiac iron. Circulation 2011;123:1519-1528.
8. Tanner MA, Galanello R, Dessi C, Westwood MA, Smith GC, Nair SV, Anderson LJ, Walker JM, Pennell DJ. Myocardial iron loading in patients with thalassemia major on deferoxamine chelation. J Cardiovasc Magn Reson 2006;8:543-547.
9. Chouliaras GL, Kattamis A, Berdoukas V, Gotsis ED, Mavrogeni S, Ladis V. Cardiac magnetic resonance in transfusion dependent thalassaemia: assessment of iron load and relationship to left ventricular ejection fraction. Br J Haematol 2010;151:397-401.
10. Kirk P, Roughton M, Porter JB, Walker JM, Tanner MA, Patel J, Wu D, Taylor J, Westwood MA, Anderson LJ, Pennell DJ. Cardiac T2* magnetic resonance for prediction of cardiac complications in thalassemia major. Circulation 2009;120:1961-1968.
24
540
541542543544545
546547548549
550551552
553554555556
557558559560
561562563564
565566567568
569570571
572573574575
576577578579
11. Anderson LJ, Westwood MA, Holden S, Davis B, Prescott E, Wonke B, Porter JB, Walker JM, Pennell DJ. Myocardial iron clearance during reversal of siderotic cardiomyopathy with intravenous desferrioxamine: a prospective study using T2* cardiovascular magnetic resonance. Br J Haematol 2004;127:348-355.
12. Ghugre NR, Enriquez CM, Gonzalez I, Nelson MD, Jr., Coates TD, Wood JC. MRI detects myocardial iron in the human heart. Magn Reson Med 2006;56:681-686.
13. Tanner MA, He T, Westwood MA, Firmin DN, Pennell DJ. Multi-center validation of the transferability of the magnetic resonance T2* technique for the quantification of tissue iron. Haematologica 2006;91:1388-1391.
14. Pepe A, Positano V, Santarelli MF, Sorrentino F, Cracolici E, De Marchi D, Maggio A, Midiri M, Landini L, Lombardi M. Multislice multiecho T2* cardiovascular magnetic resonance for detection of the heterogeneous distribution of myocardial iron overload. J Magn Reson Imaging 2006;23:662-668.
15. Pennell DJ, Berdoukas V, Karagiorga M, Ladis V, Piga A, Aessopos A, Gotsis ED, Tanner MA, Smith GC, Westwood MA, Wonke B, Galanello R. Randomized controlled trial of deferiprone or deferoxamine in beta-thalassemia major patients with asymptomatic myocardial siderosis. Blood 2006;107:3738-3744.
16. Westwood MA, Anderson LJ, Maceira AM, Shah FT, Prescott E, Porter JB, Wonke B, Walker JM, Pennell DJ. Normalized left ventricular volumes and function in thalassemia major patients with normal myocardial iron. J Magn Reson Imaging 2007;25:1147-1151.
17. Pennell D, Porter JB, Cappellini MD, Chan LL, El-Beshlawy A, Aydinok Y, Ibrahim H, Li CK, Viprakasit V, Elalfy MS, Kattamis A, Smith G, Habr D, Domokos G, Roubert B, Taher A. Deferasirox for up to 3 years leads to continued improvement of myocardial T2* in patients with beta-thalassemia major. Haematologica 2012;97:842-848.
18. Pepe A, Lombardi M, Positano V, Cracolici E, Capra M, Malizia R, Prossomariti L, De Marchi D, Midiri M, Maggio A. Evaluation of the efficacy of oral deferiprone in beta-thalassemia major by multislice multiecho T2*. Eur J Haematol 2006;76:183-192.
19. Tanner MA, Galanello R, Dessi C, Smith GC, Westwood MA, Agus A, Roughton M, Assomull R, Nair SV, Walker JM, Pennell DJ. A randomized, placebo-controlled, double-blind trial of the effect of combined therapy with deferoxamine and deferiprone on myocardial iron in thalassemia major using cardiovascular magnetic resonance. Circulation 2007;115:1876-1884.
20. Porter JB, Tanner MA, Pennell DJ, Eleftheriou P. Improved myocardial T2* in transfusion dependent anemias receiving ICL670 (deferasirox). Blood 2005;106(11):abst 3600.
21. Wood JC, Kang BP, Thompson A, Giardina P, Harmatz P, Glynos T, Paley C, Coates TD. The effect of deferasirox on cardiac iron in thalassemia major: impact of total body iron stores. Blood 2010;116:537-543.
25
580581582583
584585
586587588
589590591592
593594595596
597598599600
601602603604605
606607608609
610611612613614
615616617
618619620
22. Pennell DJ, Porter JB, Piga A, Lai Y, El-Beshlawy A, Belhoul KM, Elalfy M, Yesilipek A, Kilinc Y, Lawniczek T, Habr D, Weisskopf M, Zhang Y, Aydinok Y. A 1-year randomized controlled trial of deferasirox versus deferoxamine for myocardial iron removal in beta-thalassemia major (CORDELIA). Blood 2014;123:1447-1454.
23. Thomas AS, Garbowski M, Ang AL, Shah FT, Walker JM, Moon JC, Pennell DJ, Porter JB. A decade follow-up of a thalassemia major (TM) cohort monitored by cardiac magnetic resonance imaging (CMR): significant reduction in patients with cardiac iron and in total mortality. Blood 2010;116(21):abst 1011.
24. Modell B, Khan M, Darlison M, Westwood MA, Ingram D, Pennell DJ. Improved survival of thalassaemia major in the UK and relation to T2* cardiovascular magnetic resonance. J Cardiovasc Magn Reson 2008;10:42.
25. Voskaridou E, Ladis V, Kattamis A, Hassapopoulou E, Economou M, Kourakli A, Maragkos K, Kontogianni K, Lafioniatis S, Vrettou E, Koutsouka F, Papadakis A, Mihos A, Eftihiadis E, Farmaki K, Papageorgiou O, Tapaki G, Maili P, Theohari M, Drosou M, Kartasis Z, Aggelaki M, Basileiadi A, Adamopoulos I, Lafiatis I, Galanopoulos A, Xanthopoulidis G, Dimitriadou E, Mprimi A, Stamatopoulou M, Haile ED, Tsironi M, Anastasiadis A, Kalmanti M, Papadopoulou M, Panori E, Dimoxenou P, Tsirka A, Georgakopoulos D, Drandrakis P, Dionisopoulou D, Ntalamaga A, Davros I, Karagiorga M. A national registry of haemoglobinopathies in Greece: Deducted demographics, trends in mortality and affected births. Ann Hematol 2012;91:1451-1458.
26. St Pierre TG, Clark PR, Chua-anusorn W, Fleming AJ, Jeffrey GP, Olynyk JK, Pootrakul P, Robins E, Lindeman R. Noninvasive measurement and imaging of liver iron concentrations using proton magnetic resonance. Blood 2005;105:855-861.
27. Daar S, Pathare AV, Jain R, Zadjali SA, Pennell DJ. T2* cardiovascular magnetic resonance in the management of thalassemia patients in Oman. Haematologica 2009;94:140-141.
28. Aydinok Y, Bayraktaroglu S, Yildiz D, Alper H. Myocardial iron loading in patients with thalassemia major in Turkey and the potential role of splenectomy in myocardial siderosis. J Pediatr Hematol Oncol 2011;33:374-378.
29. Carpenter JP, Roughton M, Pennell DJ. International survey of T2* cardiovascular magnetic resonance in beta-thalassemia major. Haematologica 2013;98:1368-1374.
30. El-Beshlawy A, El-Tagui M., Hamdy M, El GM, Azim KA, Salem D, Said F, Samir A, Pierre TS, Pennell DJ. Low prevalence of cardiac siderosis in heavily iron loaded Egyptian thalassemia major patients. Ann Hematol 2013;93:375-379.
31. Viprakasit V, Gattermann N, Lee JW, Porter JB, Taher AT, Habr D, Martin N, Domokos G, Cappellini MD. Geographical variations in current clinical practice on transfusions and iron chelation therapy across various transfusion-dependent anaemias. Blood Transfus 2012;1-14.
26
621622623624
625626627628
629630631
632633634635636637638639640641
642643644645
646647648
649650651
652653654
655656657
658659660661
32. Thalassaemia International Federation. Guidelines for the clinical management of thalassaemia, 2nd Revised Edition. 2008. Available at: http://www.thalassaemia.org.cy/wp-content/uploads/pdf/educational-programmes/Publications/Guidelines%20%282008%29/Thalassaemia%20Guidelines%20ENGLISH.pdf.
33. Taher AT, Musallam KM, Wood JC, Cappellini MD. Magnetic resonance evaluation of hepatic and myocardial iron deposition in transfusion-independent thalassemia intermedia compared to regularly transfused thalassemia major patients. Am J Hematol 2010;85:288-290.
34. Origa R, Galanello R, Ganz T, Giagu N, Maccioni L, Faa G, Nemeth E. Liver iron concentrations and urinary hepcidin in b-thalassemia. Haematologica 2007;92:583-588.
35. Tony S, Daar S, Elshinawy M, Al-Zadjaly S, Al-Khabori M, Wali Y. T2* MRI in regularly transfused children with thalassemia intermedia: serum ferritin does not reflect liver iron stores. Pediatr Hematol Oncol 2012;29:579-584.
36. Danjou F, Origa R, Anni F, Saba L, Cossa S, Podda G, Galanello R. Longitudinal analysis of heart and liver iron in thalassemia major patients according to chelation treatment. Blood Cells Mol Dis 2013;51:142-145.
37. Brewer CJ, Coates TD, Wood JC. Spleen R2 and R2* in iron-overloaded patients with sickle cell disease and thalassemia major. J Magn Reson Imaging 2009;29:357-364.
38. Tavazzi D, Duca L, Graziadei G, Comino A, Fiorelli G, Cappellini MD. Membrane-bound iron contributes to oxidative damage of b-thalassaemia intermedia erythrocytes. Br J Haematol 2001;112:48-50.
39. Gordeuk VR, Caleffi A, Corradini E, Ferrara F, Jones RA, Castro O, Onyekwere O, Kittles R, Pignatti E, Montosi G, Garuti C, Gangaidzo IT, Gomo ZA, Moyo VM, Rouault TA, MacPhail P, Pietrangelo A. Iron overload in Africans and African-Americans and a common mutation in the SCL40A1 (ferroportin 1) gene. Blood Cells Mol Dis 2003;31:299-304.
40. Barton JC, Acton RT, Lee PL, West C. SLC40A1 Q248H allele frequencies and Q248H-associated risk of non-HFE iron overload in persons of sub-Saharan African descent. Blood Cells Mol Dis 2007;39:206-211.
41. Oudit GY, Trivieri MG, Khaper N, Liu PP, Backx PH. Role of L-type Ca2+ channels in iron transport and iron-overload cardiomyopathy. J Mol Med 2006;84:349-364.
42. Lin H, Lian WS, Chen HH, Lai PF, Cheng CF. Adiponectin ameliorates iron-overload cardiomyopathy through the PPARalpha-PGC-1-dependent signaling pathway. Mol Pharmacol 2013;84:275-285.
43. Jensen PD. Evaluation of iron overload. Br J Haematol 2004;124:697-711.
27
662663664665666
667668669670
671672673
674675676
677678679
680681682
683684685
686687688689690
691692693
694695
696697698
699
44. Noetzli LJ, Carson SM, Nord AS, Coates TD, Wood JC. Longitudinal analysis of heart and liver iron in thalassemia major. Blood 2008;112:2973-2978.
45. Porter JB, Taher AT, Aydinok Y, Cappellini MD, Kattamis A, El-Ali A, Martin N, Pennell D. Impact of liver iron overload on myocardial T2* response in transfusion-dependent thalassemia major patients treated with deferasirox for up to 3 years. Blood 2013;122(21):abst 1016.
46. Lobo C, Angulo IL, Aparicio LR, Drelichman GI, Zanichelli MA, Cancado R. Retrospective epidemiological study of Latin American patients with transfusional hemosiderosis: the first Latin American epidemiological study in iron overload--the RELATH study. Hematology 2011;16:265-273.
28
700701
702703704705
706707708709
710711