Embed Size (px)
Citation preview

ORIGINAL ARTICLE
Pretreatment and enzymatic process modification strategiesto improve efficiency of sugar production from sugarcane bagasse
Siddhartha Pal1,2 • Shereena Joy1 • Kalpana D. Trimukhe3 • Pramod S. Kumbhar1,2 •
Anjani J. Varma2,3,4 • Sasisanker Padmanabhan1
Received: 20 January 2016 / Accepted: 26 May 2016 / Published online: 7 June 2016
� The Author(s) 2016. This article is published with open access at Springerlink.com
Abstract Pretreatment and enzymatic hydrolysis play a
critical role in the economic production of sugars and fuels
from lignocellulosic biomass. In this study, we evaluated
diverse pilot-scale pretreatments and different post-pre-
treatment strategies for the production of fermentable sug-
ars from sugarcane bagasse. For the pretreatment of
bagasse at pilot-scale level, steam explosion without cata-
lyst and combination of sulfuric and oxalic acids at low and
high loadings were used. Subsequently, to enhance the
efficiency of enzymatic hydrolysis of the pretreated
bagasse, three different post-pretreatment process schemes
were investigated. In the first scheme (Scheme 1), enzy-
matic hydrolysis was conducted on the whole pretreated
slurry, without treatments such as washing or solid–liquid
separation. In the second scheme (Scheme 2), the pre-
treated slurry was first pressure filtered to yield a solid and
liquid phase. Following filtration, the separated liquid
phase was remixed with the solid wet cake to generate
slurry, which was then subsequently used for enzymatic
hydrolysis. In the third scheme (Scheme 3), the pretreated
slurry was washed with more water and filtered to obtain a
solid and liquid phase, in which only the former was sub-
jected to enzymatic hydrolysis. A 10 % higher enzymatic
conversion was obtained in Scheme 2 than Scheme 1,
while Scheme 3 resulted in only a 5–7 % increase due to
additional washing unit operation and solid–liquid separa-
tion. Dynamic light scattering experiments conducted on
post-pretreated bagasse indicate decrease of particle size
due to solid–liquid separation involving pressure filtration
provided increased the yield of C6 sugars. It is anticipated
that different process modification methods used in this
study before the enzymatic hydrolysis step can make the
overall cellulosic ethanol process effective and possibly
cost effective.
Keywords Pilot-scale pretreatment � Dilute acid
treatment � High-solid enzymatic hydrolysis �Pressure filtration � Solid–liquid separation
Introduction
In recent times, various pilot and demonstration scale
operations have been carried out for the biochemical con-
version of lignocellulosic (LC) biomass to fuel ethanol and
other essential commodity biochemicals (Klein-Mar-
cuschamer and Blanch 2015; Agrawal et al. 2015; Larsen
et al. 2012). Typically, most of the large-scale LC ethanol
production processes (pilot or demonstration scale plants)
involve high-solid pretreatment followed by enzymatic
hydrolysis to yield desirable sugars that can subsequently
be fermented to ethanol or other biochemicals (Modenbach
and Nokes 2013; Kristensen et al. 2009). It has been widely
acknowledged that both pretreatment and enzymatic
Electronic supplementary material The online version of thisarticle (doi:10.1007/s13205-016-0446-2) contains supplementarymaterial, which is available to authorized users.
& Sasisanker Padmanabhan
Anjani J. Varma
1 Praj Matrix R&D Center, Urawade, Pune, Maharashtra, India
2 Department of Technology, Savitribai Phule Pune University,
Ganeshkhind, Pune, Maharashtra, India
3 Polymer Science and Engineering Division, CSIR-National
Chemical Laboratory, Pune, Maharashtra, India
4 Central University of Haryana, Post-Pali District,
Mahendergarh, Haryana 123029, India
123
3 Biotech (2016) 6:126
DOI 10.1007/s13205-016-0446-2
hydrolysis steps contribute significantly (*70 %) to the
overall process economics and energy (Klein-Mar-
cuschamer and Blanch 2015; Larsen et al. 2012; Macrelli
et al. 2012). This is because effective pretreatment strate-
gies overcome the recalcitrant nature of biomass and pro-
vide amenable substrate for the enzymatic hydrolysis.
Similarly, effective strategies for enzymatic hydrolysis of
pretreated materials provide better yield of sugar, ulti-
mately contributing to high ethanol concentration follow-
ing fermentation (Chundawat et al. 2011; Wyman et al.
2011).
Use of dilute acid (DA), hot-water and steam explosion
(SE) for the pretreatment of LC biomass is considered
relatively cost effective (Geng et al. 2015). These treat-
ments highly solubilize xylose in monomeric or oligomeric
form or a mixture of both in the aqueous phase (Geng et al.
2015; Guo et al. 2012; Hernandez et al. 2012). Further-
more, these treatments also keep the cellulose and lignin
parts intact in the solid phase, where the former is subse-
quently converted to monomeric glucose sugars using
cellulase enzymes.
In DA or SE process, high-solid ([15 %) pilot-scale
pretreatment is carried out followed by enzymatic hydrol-
ysis (Larsen et al. 2012; Modenbach and Nokes 2013;
Kristensen et al. 2009; Geng et al. 2015). After pretreat-
ment, the slurry is usually filtered to yield a solid phase
(lignin and cellulose) and liquid phase (xylose or xylo-
oligomers, HMF, furfural and phenolics), which is com-
monly denoted as pre-hydrolyzate or aqueous stream
(Zhang et al. 2015). In most of the published studies, the
separated liquid phase is then subsequently fermented
directly to ethanol without any preconditioning (Macrelli
et al. 2012). With regard to the solid part that remains after
filtration, various processes, such as separate enzymatic
hydrolysis and subsequent fermentation (SHF) and simul-
taneous saccharification and fermentation (SSF), are pos-
sible for the hydrolysis of cellulose to sugars and
subsequent fermentation to ethanol (Wingren et al. 2003).
In some studies, solid fraction is further washed exten-
sively with water to remove the inhibitors, and then
hydrolyzed and fermented separately or together with the
prehydrolyzate (Ioelovich and Morag 2012; Xue 2011). All
these processes require additional process water in the
overall scheme of bioethanol production, leading to lower
ethanol concentration and more energy input for distillation
(Larsen et al. 2012; Macrelli et al. 2012). Besides, gener-
ally, in laboratory-scale processes, solid loading of 5–10 %
is used in enzymatic hydrolysis to achieve accept-
able yields of sugar and ethanol (Wingren et al. 2003;
Ioelovich and Morag 2012). Therefore, new process
methods that enhance the yield of fermentable sugars by
enzymatic hydrolysis are highly desirable as higher sugar
concentration results in higher ethanol concentration (4–5
w/w %) leading to lower energy requirements for ethanol
distillation (Macrelli et al. 2012; Zacchi and Axelsson
1989).
To the best of our knowledge, only few studies have
been reported on the various process scenarios for cellulose
and hemicellulose hydrolysis using washed and unwashed
sugarcane bagasse (SB) at a higher substrate loading and an
enzyme concentration usually required for a large-scale
process. Hence, the primary goal of this study is to explore
various posttreatment methods to enhance enzymatic
hydrolysis efficiency of bagasse. The first process method
exploits whole-slurry hydrolysis concept (Scheme 1),
where the pretreated slurry is used directly for enzyme
hydrolysis, without any modifications such as washing or
solid–liquid separation. The second process, denoted as
reslurried hydrolysis (Scheme 2), uses pressure filtration
technique to separate the solid and liquid phases from the
pretreated slurry. The separated aqueous phase is remixed
with the solid phase (wet filter cake) to form slurry, which
is then used for enzyme hydrolysis. The third method uses
wet cake hydrolysis scheme (Scheme 3), where both
washing and pressure filtration were conducted on the
pretreated slurry. The solid part of the filtration is further
used for the enzymatic hydrolysis.
The streams required for this comparative study were
obtained from pilot-scale treatments conducted at different
values of combined severity factor (CSF), which is a
function of acid dose, temperature, and retention time
(Schell et al. 2003; Zhang et al. 2011, 2013). The three
types of pretreatment methods used in this study are (1)
dilute mixed-acid treatment at high severity (CSF 1.55), (2)
mild mixed-acid treatment at intermediate severity (CSF
1.43) and (3) SE without catalyst at low severity (CSF 0.7).
Sulfuric acid is chosen due to its high acidity, low cost, and
well-known efficiency in most of the pretreatments (Todd
and Wyman 2005). Oxalic acid is a strong but relatively
non-corrosive dicarboxylic acid that is useful for xylan
hydrolysis (Zhang et al. 2013).
Experimental methods and analytical procedures
Materials
SB was provided by Om Sai Chemicals, Maharashtra,
India, with approximately 30–35 % moisture. It was stored
under ambient conditions and used as such without any
further drying. Before feeding into the pilot-scale reactor,
SB was shredded in a hammer mill in the size range of
15–25 mm. Following is the composition of SB on dry
basis: cellulose (40.3 ± 2 %), xylan (21.3 ± 0.7 %), ara-
binan (2.2 ± 0.1 %), acid-insoluble lignin (19.3 ± 0.8 %),
acid-soluble lignin (3.9 ± 0.2 %), ash (2.6 ± 0.15 %),
126 Page 2 of 14 3 Biotech (2016) 6:126
123

proteins (3.0 ± 0.1 %), acetate (2.9 ± 0.1 %) and extrac-
tives (5.0 ± 0.4 %).
Compositional analysis methods
The composition of the raw material, pretreated solid and
the oligomer analysis of the filtrate post-pretreatment were
determined using the National Renewable Energy Labo-
ratory (NREL) analytical procedure (Sluiter et al.
2008a, b, 2012).
The composition of pretreated slurry, post-enzymatic
hydrolysis slurry, and post-co-fermentation slurry (fer-
mented wash) was determined by measuring glucose,
xylose, arabinose, acetic acid, hydroxymethylfurfural
(HMF) and furfural in Aminex� column (HPX-87H
300 9 7.8 mm BioRad column) with a flow rate of
0.6 mL/min, temperature of 55 �C, and mobile phase of
0.005 M sulfuric acid. The post-co-fermentation slurry was
also measured for ethanol concentration using the same
column.
The filtered samples of hydrolyzate (from pretreatment)
were restored to a final sulfuric acid concentration of 4
w/w %, autoclaved at 121 �C for 1 h, and centrifuged for
high-performance liquid chromatography (HPLC) deter-
mination of monomer sugars. The total oligomeric content
was determined as the difference between the amounts of
monomer obtained after post-acid hydrolysis, following the
correction of losses, and before acid hydrolysis.
The total phenolic content of the sample was measured
with spectrophotometrical method according to Folin–
Ciocalteu reagent redox reaction (Singleton et al. 1999).
The absorbance was measured after 30 min at room tem-
perature at 700 and 725 nm. Calibration curves based on
vanillin were used for quantification because gas chro-
matography–mass spectrum (GC–MS) indicated vanillin
being most present in the acid-treated slurry.
Pretreatment methods
Continuous pretreatment
Pretreatments were done using one ton per day (TPD)
continuous pilot-scale horizontal screw-type reactor. The
reactor set up is similar to the one described in the work of
Schell et al. (2003). The total solid handling capacity of
this reactor is up to 22 % (w/w). Size reduced SB was fed
to the pretreatment reactor using a belt conveyor. This
reactor was part of a reactor feeder blow tank system
operating at a feed rate of 30 kg on dry weight basis/hour.
The system is supplied with constant acid, steam pressure,
and temperature. Both acids (oxalic and sulfuric) were
mixed at room temperature in an acid tank and diluted to a
5–6 % (w/w) solution using process water. This DA
solution was then pumped with a metering type of dosing
pump under operating steam pressure. The pretreatment
digester can be operated at a temperature range of
140–200 �C, pressure of 4–20 bar, and retention time
between 15 and 30 min. The pretreatment reactor is made
of SS 316 steel. Pretreatments (low, intermediate, and high-
severity acid pretreatment) were conducted with process
conditions as discussed in the following sections.
Monomeric pretreatment (high-severity mixed-acid
treatment)
A batch of 15 kg size reduced dry bagasse (equivalent to
21.4 kg on weight basis) was fed to the pretreatment
digester, at a feed rate of 30 kg on dry weight basis per
hour, where it was diluted with 29 kg water to a solid
consistency of 30 %. This feed was then passed through a
plug screw feeder (part of digester system) where 20 kg
water was dewatered due to compression. The remaining
30 kg feed was mixed with 20 kg process water (1.3 g
H2O:g DM) with an acid concentration of 1.5 % sulfuric
acid and 1 % oxalic acid on dry weight basis, and the
digester was heated to 160 �C for 15 min. Because of the
addition of steam and acid solution during pretreatment,
the concentration of output solid reached up to 20 % w/w.
Mild acid pretreatment (intermediate severity mixed-acid
treatment)
Mixed-acid pretreatment was conducted at 180 �C using
mixtures of 0.5 % sulfuric acid and 0.5 % oxalic acid on
dry bagasse basis with a residence time of 15 min. Other
conditions are similar to the one explained in ‘‘Monomeric
pretreatment (high-severity mixed-acid treatment)’’.
SE pretreatment (low-severity pretreatment)
SE pretreatment processing was conducted at 180 �C with
a residence time of 15 min. Also here, all other details are
similar to the standardized format in ‘‘Monomeric pre-
treatment (high-severity mixed-acid treatment)’’.
Post-pretreatment methods and enzymatic
hydrolysis
Whole-slurry hydrolysis method (Scheme 1)
A batch of 7 kg pretreated slurry obtained from the pre-
treatment (*20 % w/w total solids) was adjusted to a pH
range of 5.2–5.5 using 500 mL 40 % (w/v) NaOH. Then,
enzyme hydrolysis experiments were conducted in a 10L
reactor equipped with an anchor impeller at 13–14 % total
insoluble solids (TIS). Commercial cellulase CTec3
3 Biotech (2016) 6:126 Page 3 of 14 126
123
Novozymes enzyme was added to the slurry at 60 mg/g of
glucan and was incubated at 50 �C for 120 h. The specific
activities of this commercial enzyme are not provided in
this study, as it is the proprietary information of the man-
ufacturer. The pH of the enzymatic slurry was maintained
in the range of 5.0–5.2. Samples were collected every 24 h
for the analysis of sugar and by-products using HPLC
(‘‘Compositional analysis methods’’). Efficiency of enzy-
matic hydrolysis was calculated by the ratio of glucose
yield (obtained at 120 h after hydrolysis) to the theoretical
glucose yield in the solid fraction.
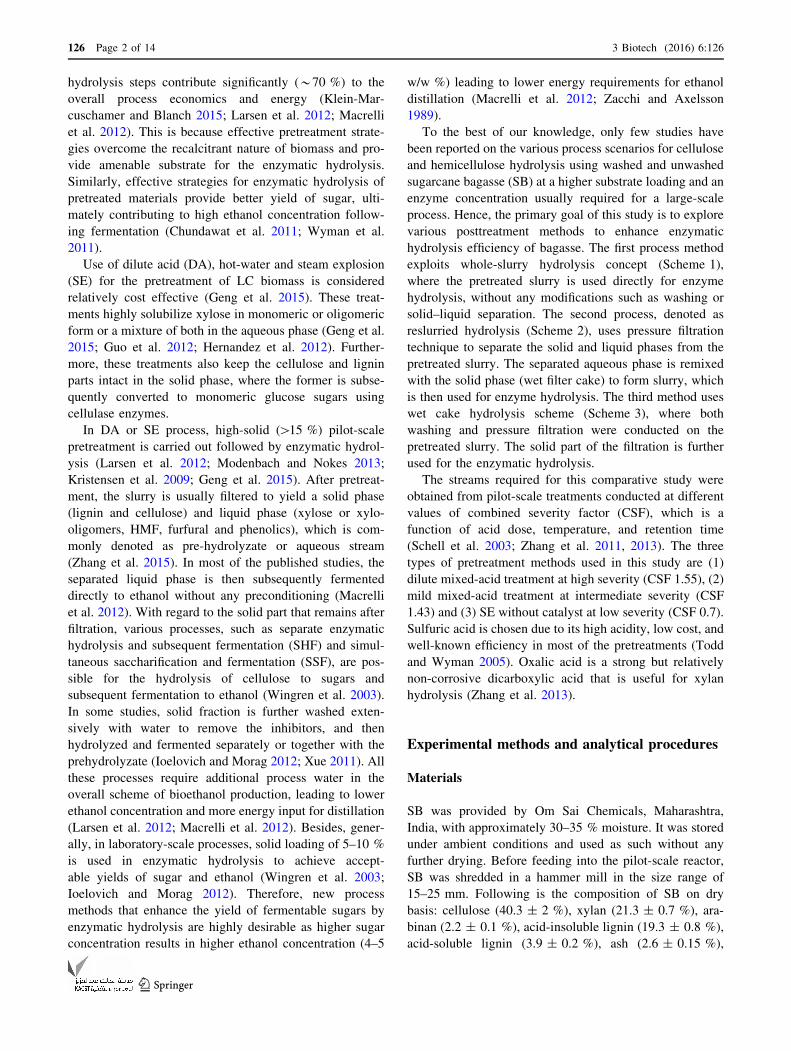
Hereafter, this post-pretreatment scheme is referred to as
Scheme 1 (Fig. 1) and the mass flow sheet is presented in
Figures S1–S3, which provide details of each pretreatment
type and mass balances of the entire process.
Reslurried hydrolysis methods (Scheme 2)
A batch of 70 kg pretreated slurry (*20 % w/w total
solids) containing 13–14 % TIS was diluted to 10 % w/w
TIS with the addition of 30 kg xylose or xylo-oligomer
stream (aqueous) obtained after the initial filtration of
pretreated slurry. Initially, some portion of the pretreated
slurry was centrifuged to obtain the aqueous phase, which
was used for dilution of the TIS to 10 % w/w. This aqueous
phase obtained at the start was used for the dilution of the
high-solid pretreated slurry. Because of the addition of
aqueous phase to the pretreated slurry, a lower concentra-
tion of insoluble solids was obtained, enabling effective
solid–liquid separation. A filter press with 11 plates
(470 9 470 mm) using a hydraulic cylinder serving as a
pressing of filter plates provides a filtration pressure of
8–9 bar (g). A filter area of 3 m2 and a cake thickness of
30 mm were achieved. After filtration, a solid phase (wet
cake) and aqueous phase (xylose-rich stream) were
obtained. A small portion of the separated aqueous phase
(equivalent to the aqueous phase obtained at the start up of
dilution) was reused for the next filtration cycle. The wet
cake and the remaining aqueous phase were again mixed to
obtain final slurry solids of 20 % (Figs. S4–S6). Following
this, enzyme hydrolysis experiments were conducted in a
10L reactor equipped with an anchor impeller at 13–14 %
Bagasse storage
Bagasse size reduction
Low pH pretreatments
Monomeric pretreatment Mild acid pretreatment Steam explosion pretreatment
Post pretreatment slurry
Steam Acid
Enzymatic hydrolysis
Co-fermentation
Fig. 1 Process flow diagram of
whole-slurry hydrolysis
(Scheme 1)
126 Page 4 of 14 3 Biotech (2016) 6:126
123

TIS. Commercial cellulase CTec3 enzyme loadings were
the same as mentioned in Scheme 1. The enzymatic slurry
was incubated at 50 �C for 120 h, while maintaining the
pH in the range of 5.0–5.2 using 500 mL 40 % (w/v)
NaOH. Samples were collected as described in ‘‘Whole-
slurry hydrolysis Method (Scheme 1)’’. This process
scheme is denoted as Scheme 2 (Fig. 2) and the mass flow
sheet is presented in Figs. S4–S6.
Wet cake hydrolysis (Scheme 3)
A batch of 70 kg pretreated slurry (*20 % w/w total
solids) was diluted with 70 kg fresh water to 5–7 % w/w
TIS and then pressure filtered in a filter press, whose
parameters are mentioned in ‘‘Reslurried hydrolysis
Methods (Scheme 2)’’. 25 kg solid phase was obtained
after separation of pretreated slurry which was further
diluted with 37 kg fresh water to a solid consistency of
16–17 % total solids and 14–15 % w/w TIS (Figs. S7–S9).
All the enzyme hydrolysis experiments were conducted in
a 10L reactor using the commercial cellulase CTec3
enzyme with the same enzyme loading as mentioned ear-
lier. The enzymatic slurry was incubated at 50 �C for 120 h
while maintaining the pH in the range of 5.0–5.2 using
220 mL 40 % (w/v) NaOH. Hydrolysis samples were
collected every 24 h for the analysis of sugar and by-
products using HPLC (‘‘Compositional analysis meth-
ods’’). This process is referred in this study as Scheme 3
(Fig. 3) and the mass flow sheet is presented in Figs.
S7–S9.
Co-fermentation
Post-enzymatic hydrolyzate from different schemes was
further taken for co-fermentation with genetically modified
Saccharomyces cerevisiae. The yeast was cultured in a yeast
extract peptone dextrose (YPD) broth containing yeast
extract (10 g/L), peptone (20 g/L), and glucose (30 g/L).
Bagasse storage
Bagasse size reduction
Low pH pretreatments
Monomeric pretreatment Mild acid pretreatment Steam explosion pretreatment
Post pretreatment slurry
Steam Acid
Filtration
Wet cake Aqueous phase
Mixing of aqueous phase and wet cake
Enzymatic hydrolysis
Co-fermentation
Part of aqueous phase recycle for filtraton
Fig. 2 Process flow diagram of
reslurry hydrolysis (Scheme 2)
3 Biotech (2016) 6:126 Page 5 of 14 126
123

The mixture was sterilized at 121 �C for 20 min. Then, a
yeast culture preserved in the form of glycerol stock at
-80 �C was inoculated onto the broth. The cells were grown
in 500-mL Erlenmeyer flasks with 100-mL medium in an
orbital shaker at 32 �C and 150 rpm. The pH of the inocu-
lum was adjusted to 5.5 using 40 % w/v NaOH. This
inoculum preparation was termed as stage 1. Stage 2 com-
prising 3 % w/w concentration of fermentable sugars (dex-
trose sugar source), 1 g/L of diammonium phosphate, and
1 g/L of urea and the mixture was sterilized at 121 �C for
20 min. Following 24-h growth, inoculum from stage 1 was
incorporated to stage 2 in 2-L Erlenmeyer flasks with 1-L
medium in an orbital shaker at 32 �C and 150 rpm. The pH
of the inoculum was adjusted to 5.5 using 40 % w/v NaOH
solution. Following 24 h of cell growth, the stage 2 inocu-
lum was transferred to a 10-L reactor containing 9-L enzy-
matic hydrolyzate (pH 5.5). Additional nutrients, 1 g/L of
urea, and 1 g/L of di ammonium phosphate were added to
the fermentation medium at 32 �C and 150 rpm using a
pitched-blade impeller. The inoculum volume was 10 % of
the fermentation medium. A simple flow diagram is depicted
in Figure S10.
Viscosity measurement
Viscosity of monomeric, mild acid, and SE-treated bagasse
samples was measured at room temperature using a
Brookfield rheometer RHE02000V2.7 with a shear rate of
50 s-1. The total solids of around 7–8 % (w/w) were used
for viscosity measurements. It was not possible to do
measurements at high-solid slurries ([15 % w/w) as the
flow was not easy even at higher shear rates. Similar
observations have been reported for giant reed (Kadic et al.
2014). Hence, in order to measure viscosity, the pretreated
Bagasse storage
Bagasse size reduction
Low pH pretreatments
Monomeric pretreatment Mild acid pretreatment Steam explosion pretreatment
Post pretreatment slurry
Steam Acid
Filtration
Wet cake
Water
Aqueous phase
Enzymatic hydrolysisWater
Co-fermentation
Fig. 3 Process flow diagram of
wet cake hydrolysis (Scheme 3)
126 Page 6 of 14 3 Biotech (2016) 6:126
123
slurry with total solids 20 % w/w was diluted with fresh
water to a solid consistency of 7–8 % w/w.
Dynamic light scattering
Dynamic light scattering (DLS) studies were performed
with instrumentation from Brookhaven Instruments Cor-
poration using 90 Plus Particle Sizing Software Version
3.94. Samples (1 % w/w) were dispersed in water by
sonication, and the uppermost 1 mL of the dispersion was
taken and diluted 100 times for the DLS studies. DLS was
performed on all pretreated slurries obtained from different
types of pretreatment mentioned earlier.
Results and discussion
The structurally ordered insoluble biomass constituents can
undergo chemical transformation, solubilization, and
physical redistribution due to the different pretreatment
schemes. The first part of the discussion section focuses on
the composition of the solid bagasse, following different
severity pretreatments and their effect on the yield of
xylose or xylo-oligomers. The second part focuses on the
yield of glucose and xylose for the three enzymatic
hydrolysis process schemes explored in this study. The
combined severity factor is defined as:
CSF ¼ log10 t� expT � 100
14:75
� �� pH
in which t and T are residence time (min) and temperature
(�C), respectively. In this work, we have considered three
different severities as mentioned in the introduction
section.
Similar range of severities was investigated with maple
wood and its effect on xylose yields with different types of
acids at different acid loadings and temperatures where
studied (Zhang et al. 2013).
Effect of different pretreatments on hemicellulose
and glucose yields
The major change due to the dilute mixed-acid pretreat-
ment is the solubilization of hemicellulose (xylose and
arabinose) and soluble lignin as phenolics. For all the
pretreatments studied, the final total solid of final slurry is
20 % w/w, which includes both insoluble and dissolved
solids. The only difference is in the ratio of insoluble solids
to dissolved solids depending on the severity of pretreat-
ment. The difference in the compositions of the solid phase
post-pretreatment is marginal for the three pretreatments,
as xylose is abundantly formed in either oligomeric or
monomeric form in the aqueous phase, and hence the
residual xylan remaining in the wet cake (2–3 % w/w,
Table 1) is always relatively lower. Different patterns of
sugar recovery have been observed in the aqueous phase or
pre-hydrolyzate (Table 2).
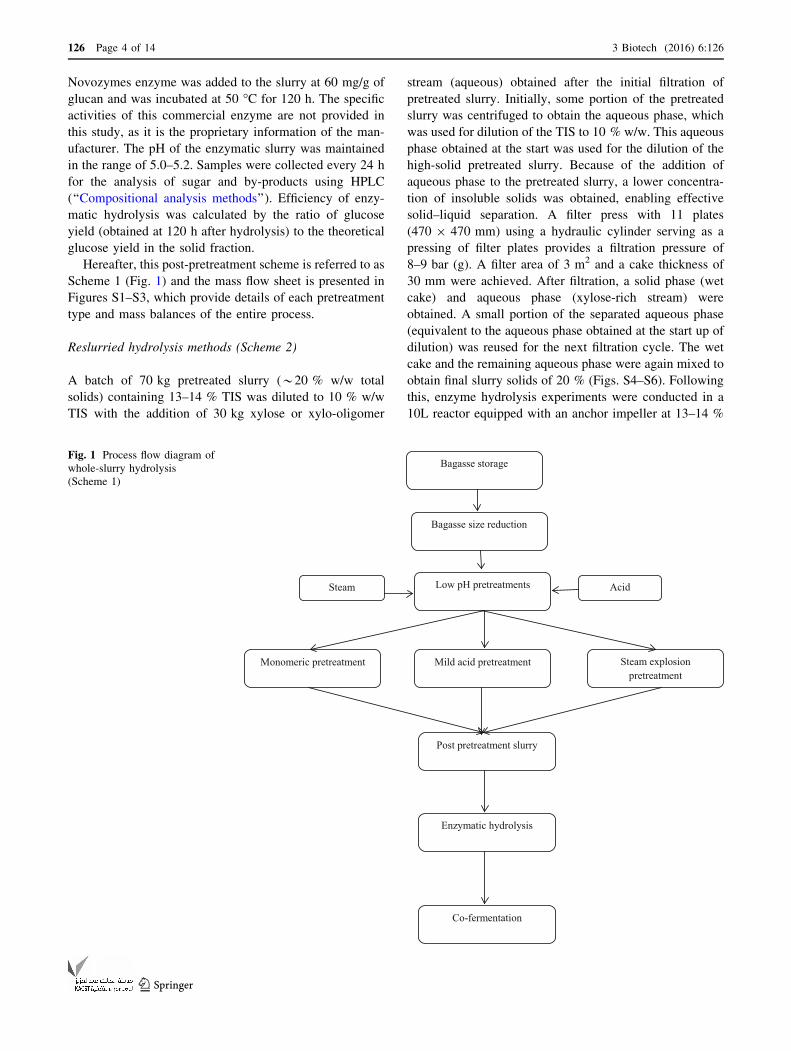
Glucose conversion (6.5 %) and monomeric xylose
conversion (82.8 %) are highest for monomeric
Table 1 Carbohydrate and lignin composition (dry basis) of bagasse solids before pretreatment (untreated) and after the following pretreat-
ments: dilute sulfuric acid ? oxalic acid (monomeric); dilute sulfuric acid ? oxalic acid (mild acid); and steam explosion
Pretreatment type Glucan (% w/w) Xylan (% w/w) Arabinan (% w/w) Acid-insoluble lignin (% w/w)
Untreated 40.3 ± 2 21.3 ± 0.7 2.2 ± 0.1 19.3 ± 0.8
Monomeric 55.8 ± 2.3 3.1 ± 0.15 0.18 ± 0.03 30.7 ± 1.4
Mild acid 55.8 ± 2.3 3.2 ± 0.16 0.19 ± 0.03 30.1 ± 1.4
Steam explosion 55.7 ± 2.3 3.6 ± 0.17 0.19 ± 0.03 29.3 ± 1.3
Table 2 Comparison of sugars and inhibitors produced in the pretreated slurry for the following treatments: dilute sulfuric acid ? oxalic acid
(monomeric); dilute sulfuric ? oxalic acid (mild acid) and steam explosion
Pretreatment pH Glucose
(% w/w)
Xylose
(% w/w)
Xylose
oligomer
(% w/w)
Acetic acid
(% w/w)
HMF
(% w/w)bFurfural
(% w/w)bPhenolics
(% w/w)
Xylanto xylose
monomer
efficiency (%)
Cellulose to
glucose
efficiency
(%)
Monomeric 1.2 0.60 ± 0.03 4.0 ± 0.2 0.12 ± 0.02 0.42 ± 0.04 0.01 0.01 0.27 ± 0.03 82.8 % ± 2.5 6.5 % ± 0.3
Mild acid 1.8 0.2 ± 0.01 2.4 ± 0.15 1.75 ± 0.1 0.28 ± 0.04 0.01 0.03 0.32 ± 0.03 50 % ± 1.8
(35 ± 1.5)a2 % ± 0.1
Steam
explosion
3.5 0.1 ± 0.005 0.78 ± 0.05 3.5 ± 0.2 0.18 ± 0.03 0.02 0.03 0.36 ± 0.04 15 % ± 0.5
(71 ± 2.3)a0.5 % ± 0.05
a Efficiency of soluble xylo-oligomers in pretreated slurryb Std. errors for HMF and Furfural are not provided as they are present in very low concentration
3 Biotech (2016) 6:126 Page 7 of 14 126
123

pretreatment (Table 2) with the pH of pretreated slurry at
1.2. The pretreated slurry containing 20 % w/w total solids
contains 13 % w/w insoluble solids and the rest 7 % w/w
being dissolved solids (Fig. S1). The above recovered mass
is equivalent to 650 kg for 1000 kg of dry bagasse. This
indicates approximately 35 % solubilization of raw bagasse
during the pretreatment. Similar solubilization and xylan
recoveries have been reported for the pretreatment of SB
using H2SO4 (2.5 % w/v) at 150 �C for 30 min (Canilha
et al. 2011). Concentrations of cellulose and lignin
increased on dry basis in the solid phase as compared with
the native untreated bagasse (Table 1).
For mild acid pretreatment, monomeric xylose conver-
sion is 50 and 35 % as soluble xylo-oligomers in the slurry,
corresponding to a total recovery of 85 % at a pretreated
slurry pH of 1.8 (Table 2). Because the acid dosage in mild
acid pretreatment is lower as compared to monomeric
treatment, the glucose conversion (*2 %) is lower. The
solubilized xylo-oligomers can be further hydrolyzed to
monomeric xylose using enzymatic treatment or by second-
stage acid treatment (Geng et al. 2015; Guo et al. 2012). As
an alternative to these methods, fixed-bed reactors packed
with a porous solid acid catalyst, such as sulfonic acid resin
and organosulfonic acid-functionalized silica catalyst, can
also be used for the hydrolysis of soluble xylo-oligomers to
monomeric xylose (Kim et al. 2005; Bootsma et al.
2008).The pretreated slurry insoluble solids mild acid
treatment is 13.7 % (Fig. S2) and this is equivalent to
685 kg for 1000 kg of dry bagasse used.
In SE pretreatment, 71 % of initial xylan is dissolved as
soluble oligomers in the pretreatment media, whereas only
15 % of the initial xylan is recovered in the pretreatment
liquid as monomeric xylose, providing overall xylose
release of 86 % (Table 2). Glucose monomer conversion in
pretreatment is 0.5 % of the initial glucan present in the
bagasse. The insoluble solid after SE pretreatment is
14.3 % w/w (Fig. S3) indicating a lesser solubilization of
bagasse in the aqueous phase. Previous studies have indi-
cated that, as the acid ratio decreases, the ratio of oligomer
to monomer increases, ultimately leading to an increase of
pH in pretreated slurries (Zhang et al. 2013; Kootstra et al.
2009).
The formation of inhibitory compounds is reported to
be related to the degradation of sugars forming furfural
and HMF (Kim et al. 2013). Acetic acid and phenolic
compounds are formed from the acetyl groups in hemi-
celluloses and lignin, respectively. Acetyl groups are
also released during the pretreatment, which are present
as acetic acid in the pretreated slurry (Kim et al. 2009).
Release of acetic acid is highest (0.52 %) in the mono-
meric treatment and lowest (0.18 %) in the SE pre-
treatment. This is due to the higher amount of acids
added in the monomeric treatment, resulting in a higher
monomeric xylose solubilization than steam pretreat-
ment. Phenolics are also released during this pretreat-
ment, leading to solubilization of acid-soluble lignin.
Phenolic compounds and other aromatics are formed by
pretreatment with an acid catalyst (Martın et al. 2002).
However, formation of phenolic compounds is highest
for steam pretreatment, because of degradation of more
soluble lignin at higher temperatures (Rasmussen et al.
2014).
Effect of different pretreatment and post-
pretreatment process methods on enzymatic
hydrolysis efficiencies
Figures 1, 2 and 3 show the overall schematic diagrams of
the schemes explored in this study. The effect of these
schemes on the yield of enzymatic hydrolysis and ulti-
mately on the concentration of ethanol is discussed in this
section. In this study, enzymatic hydrolysis has been per-
formed at almost the same concentration of insoluble solids
to ensure consistency, while comparing the efficiency of
each process.
Whole-slurry hydrolysis scheme (Scheme 1)
In Scheme 1, enzymatic hydrolysis was performed at
13–14 % total insoluble solids (20 % total solids) using
Novozymes Cellic CTec3 enzyme at a dose of 60 mg/g
glucan content. The combined effect of pretreatment and
enzymatic hydrolysis on sugar yields (glucose and xylose)
is summarized in Table 3. The monomeric treatment
achieved glucan hydrolysis efficiency of 54.5 % and
overall xylose efficiency of 85.1 %, including pretreatment
and enzyme hydrolysis. Similar glucan hydrolysis effi-
ciency (53.7 %) is observed also for mild acid treatment
(Table 3).
Increase of xylose yield from 50 to 85.1 % is observed
for mild acid treatment during enzymatic hydrolysis due to
xylanase activity of the enzyme cocktail. Um and Van
Walsum (2010) showed that enzymes containing hemicel-
lulase could produce up to 84–92 % soluble sugars with
either SHF or SSF.
Generation of by-products from pretreatment highly
depends on the treatment method used. In this study, high-
severity monomeric treatment had the highest acetic acid
concentration of 0.52 % at the start of the enzyme
hydrolysis, compared with 0.28 % for mild acid treatment
and 0.18 % for SE pretreatment. During enzyme hydroly-
sis, concentration of acetic acid increases from 0.28 to
0.53 % for the mild acid treatment and 0.18–0.56 % for the
SE pretreatment. This can be attributed to the conversion of
xylo-oligomers to xylose monomers coupled with the
release of an acetyl group (Ohgren et al. 2007). Low-pH
126 Page 8 of 14 3 Biotech (2016) 6:126
123

Table
3Concentrationofsugarsandinhibitors
before
andafterenzymehydrolysisfordifferentpretreatm
ents
anddifferentprocess
schem
es
Process
schem
esTim
e(h)
Total
solids
(%w/w)
Totalinsoluble
solids(%
w/w)
Glucose
(g/L)
Xylose
(g/L)
Aceticacid
(%w/w)
HMF
(%w/w)
Furfural
(%w/w)
Phenolics
(ppm)
Cellulose
to
glucose
enzymatic
efficiency
(%)
Overallxylanto
xylose
efficiency
(%)(pretreatm
ent?
enzymatic)
Monomeric
treatm
ent
Schem
e1
020.1
±0.4
13.2
±0.3
6.0
±0.3
40.1
±1.1
0.52±
0.04
0.01±
0.01
0.01±
0.01
0.3
±0.03
Schem
e1
120
50.1
±1.5
40.2
±1.1
0.54±
0.04
0.01±
0.01
0.01±
0.01
0.3
±0.03
54.5
±1.7
85.1
±2.5
Schem
e2
020.2
±0.4
13.2
±0.3
6.0
±0.3
40.3
±1.1
0.53±
0.04
0.01±
0.01
0.01±
0.01
0.3
±0.03
Schem
e2
120
60.2
±1.6
40.4
±1.1
0.55±
0.04
0.01±
0.01
0.01±
0.01
0.3
±0.03
65.9
±2.0
85.23±
2.5
Schem
e3
016.3
±0.4
14.0
±0.3
1.5
±0.02
10.1
±0.1
0.1
±0.01
ND
ND
0.10±
0.01
Schem
e3
120
62.8
±1.8
13.5
±0.1
0.15±
0.01
ND
ND
0.10±
0.01
69.0
±2.1
84.9
±2.5
Mildacid
treatm
ent
Schem
e1
019.9
±0.4
13.8
±0.3
0.28±
0.03
0.01±
0.01
0.01±
0.01
0.32±
0.03
Schem
e1
120
51.1
±1.51
39±
1.1
0.53±
0.05
0.01±
0.01
0.01±
0.01
0.32±
0.03
53.7
±1.7
84.9
±2.5
Schem
e2
020.1
±0.6
13.9
±0.3
2±
0.1
26±
0.9
0.29±
0.03
0.01±
0.01
0.01±
0.01
0.33±
0.03
Schem
e2
120
61.1
±1.9
39.±
1.1
0.54±
0.05
0.01±
0.01
0.01±
0.01
0.33±
0.03
64.8
±2.0
84.1
±2.5
Schem
e3
017.1
±0.4
14.5
±0.3
0.9
±0.01
3.1
±0.05
0.10±
0.01
ND
ND
0.09±
0.01
Schem
e3
120
65.3
±1.9
5.3
±0.1
0.14±
0.01
ND
ND
0.09±
0.01
69.0
±2.1
50.0
a±
1.6
Steam
explosion
Schem
e1
020.0
±0.5
14.5
±0.3
1±
0.05
7.8
±0.4
0.18±
0.02
0.02±
0.01
0.02±
0.01
0.36±
0.04
Schem
e1
120
43.1
±1.2
38.5
±1.1
0.56±
0.05
0.02±
0.01
0.02±
0.01
0.36±
0.04
48.5
±1.6
83.1
±2.4
Schem
e2
020.1
±0.5
14.6
±0.3
1±
0.05
7.8
±0.4
0.18±
0.02
0.02±
0.01
0.03±
0.01
0.36±
0.04
Schem
e2
120
52.2
±1.5
40.05±
1.1
0.55±
0.05
0.02±
0.01
0.02±
0.01
0.36±
0.04
61.9
±1.9
83.6
±2.4
Schem
e3
015.5
±0.4
14.2
±0.3
0.5
±0.01
0.9
±0.1
0.08±
0.02
ND
ND
0.11±
0.1
Schem
e3
120
60.1
±1.7
3.5
±0.2
0.55±
0.05
ND
ND
0.11±
0.1
65.3
±2.0
15.0
a±
0.4
aMonomeric
xylose
recoveryislesser
asenzymehydrolysisisconducted
intheabsence
ofaqueousphase
3 Biotech (2016) 6:126 Page 9 of 14 126
123

pretreatment usually degrades some portion of hemicellu-
losic sugars, forming furan aldehydes (5-HMF and fur-
fural). For mild acid treatment, HMF concentration is
found to be 0.01 % (w/w) at the start of enzyme hydrolysis.
There is no change in the concentration of furan aldehydes
with enzyme hydrolysis.
Lowest glucan hydrolysis conversion is observed for
the SE pretreatment. Glucan hydrolysis efficiency of
48.5 % and increase in xylose monomer conversion from
15 to 83.1 % are achieved during enzyme hydrolysis.
This very low conversion of glucan is expected as the
SE pretreatment is the less severe. Other SE treatment
does not have much impact on the biomass other than
removing hemicellulose as xylo-oligomers. Another
reason for the decrease in enzyme hydrolysis efficiency
is the higher amount of soluble xylo-oligomers generated
from SE pretreatment (Table 2). Previous studies have
indicated that the presence of xylobiose and higher-
chain-length xylo-oligomers generated by hydrothermal,
acid, or steam pretreatment can inhibit enzyme activity.
Therefore, in order to achieve a higher glucan conver-
sion, additional supplementary enzymes have to be
added, depending on the feedstock type and composition
(Kumar and Wyman 2009). Enzymatic efficiencies of
monomeric and mild acid treatments are similar, whereas
that of SE treatment is lowest (Table 3).
Release of phenolic compounds from the solubilization
of acid-soluble lignin is highest for SE treatment (0.36 %),
compared with monomeric pretreatment (0.28 %). These
phenolics can impact the degree of hydrolysis efficiencies,
leading to decrease in efficiencies (Kim et al. 2009). Both
HMF and furfural concentrations were found to be 0.01 %
w/w. In general, concentration of these compounds[5 g/L
becomes inhibitory for enzyme hydrolysis and affects
cellulase enzymes (Cantarella et al. 2004).
The lower enzymatic efficiency of SE pretreatment can
also be attributed to the fibrous and solid-like nature of
the slurry. Furthermore, the whole-slurry hydrolysis at
higher solids has relatively less free water for the
enzymes to diffuse to the reaction sites. As a result,
enzymes will be crowded at the reaction sites, thus not
allowing the process to reaching its full potential
(Bommarius et al. 2008). In addition, high viscosity of
this slurry prevents an efficient mixing, leading towards
lower enzymatic efficiency.
Table 4 shows that the bagasse slurry obtained from SE
pretreatment has higher viscosity than that from the other
two treatments. As already mentioned ‘‘Viscosity mea-
surement’’, viscosity measurements were carried out after
diluting to 7 % w/w. This allowed us to measure viscosity
without problems. Long fiber structure of bagasse provided
practical difficulties in viscosity measurements, in partic-
ular for bagasse at high-solid loadings. Similar difficulty in
estimating viscosity was also observed for giant reed
feedstock (Kadic et al. 2014). Viscosity of the slurry for
Scheme 1 obtained from monomeric treatment is
0.038 Pa s, whereas that of the steam-exploded bagasse
slurry is 0.068 Pa s.
In addition to viscosity, particle size affects the enzy-
matic process. In this regard, DLS experiments were con-
ducted to study the influence of particle size effect. Table 4
shows a comparison of particle sizes of whole slurry and
reslurried, pretreated substrates. These measurements were
done prior to enzymatic hydrolysis experiments to ascer-
tain the influence of different process schemes on the
enzymatic efficiency. It can be inferred from Table 4 that
bagasse substrates from Scheme 1 had a higher particle
size than those from Scheme 2, regardless of the pretreat-
ment type.
Difference in particle size with pretreatment type is also
evident from Table 4. Of the three pretreatment methods
studied in this study, monomeric treatment provided the
lowest particle size.
Reslurried hydrolysis scheme (Scheme 2)
Following Scheme 2, the efficiencies of glucan and xylan
hydrolysis after enzyme hydrolysis are 65.9 and 85.2 %,
respectively, for monomeric treatment. Similar enzymatic
efficiencies have also been obtained for mild acid treatment
(Table 3). Similar to Scheme 1, an increase in the con-
centration of xylose and acetic acid in enzyme hydrolysis is
observed for mild acid and SE treatments (Table 3).
Table 4 Comparison of viscosities (Pa s) at 298.15 K and particle sizes for Schemes 1 and 2 prior to enzyme hydrolysis following different
pretreatments
Monomeric pretreatment Mild acid pretreatment Steam explosion pretreatment
Scheme 1 Scheme 2 Scheme 1 Scheme 2 Scheme 1 Scheme 2
Total solids (% w/w)a 7.81 7.82 7.75 7.83 7.92 8.0
Viscosity(Pa s) 0.038 0.016 0.056 0.043 0.068 0.049
Effective diameter (nm) 5222.1 1647.2 14,136.1 5837.1 40,148.4 19,239.2
a This total solid reflects the solid used for the measurement of viscosity
126 Page 10 of 14 3 Biotech (2016) 6:126
123

Table 3 shows sugar yields, inhibitors, and glucan and
xylan hydrolysis efficiencies at the start and at the end of
enzyme hydrolysis. Despite having inhibitor profiles simi-
lar to Scheme 1 (Table 3), Scheme 2 provides a 10 %
higher enzyme hydrolysis efficiency than Scheme 1. This
probably indicates that physical restructuring of the
bagasse occurring at the mesoscopic and microscopic level
following Scheme 2 plays a pronounced role in achieving
higher enzyme hydrolysis efficiencies (Eibinger et al. 2014;
Adani et al. 2011). Another reason for the increase of
efficiency in Scheme 2 is the ease of mixing of slurry at the
start of enzyme hydrolysis when the aqueous phase and
solids are mixed after separation. The slurry obtained fol-
lowing Scheme 2 shows better flow properties than that
obtained following Scheme 1. The pressurized solid–liquid
separation and the reslurring process from Scheme 2 might
have changed the physical structure and nature of the
solids. As a result, higher solids can be effectively mixed
during enzymatic hydrolysis.
In Scheme 2, pressure filtration of the pretreated slurry
seems to have an impact on the nature of the bagasse. This
can be inferred from the viscosity and DLS data. For the
monomeric treatment, viscosity of the slurry obtained from
Scheme 1 is 0.038 Pa s, whereas that of the slurry obtained
from Scheme 2 is 0.016 Pa s (Table 4). DLS data indicate
that, for monomeric pretreatment, the particle size fol-
lowing Scheme 2 is 1647.2 nm, compared with 5222.1 nm
for those following Scheme 1 (Table 4). This confirms that
pressurized filtration induced some physical changes in the
bagasse.
Lower particle size enhances available surface area and
the penetration of enzymes into porous fiber walls and their
subsequent attack on cellulose surface (Peciulyte et al.
2015; Adani et al. 2011). It has been reported in previous
studies that decrease of particle size due to post-pretreat-
ment milling increases the accessibility of cellulose
enzymes to the substrate and subsequently leads to higher
enzyme conversion efficiencies (Chen et al. 2013). On the
above basis, it is possible to speculate that pressure filtra-
tion used in this study creates new internally accessible
surface area, thus enhancing the penetration of enzymes on
the cellulose.
Post-pretreatment size reduction is always more bene-
ficial in increasing the enzymatic digestibility than
mechanical size reduction prior to pretreatment (Chen et al.
2013) because of its less energy requirement, as some
portion of the biomass is already loosened during ther-
mochemical pretreatment (Chen et al. 2013).
SE pretreatment results in lower enzymatic conversions
(60 %), the reasons for which have been discussed in
‘‘Whole-slurry hydrolysis scheme (Scheme 1)’’. The
release of xylose into the slurry in enzyme hydrolysis has
increased from 15 to 84 %, similar to the result obtained
using Scheme 1. This shows that the different process
schemes primarily affect the release of glucose by
enzymes, and the release of xylose is similar in Schemes 1
and 2. Conversion of cellulose to glucose has been con-
sistently higher for Scheme 2 than Scheme 1 for all three
types of pretreatment (Table 3).
Wet cake hydrolysis (Scheme 3)
To increase the yield of enzymatic hydrolysis, the pre-
treated slurries were washed as outlined in Fig. 3, Figs. S7–
S9. These washing steps remove maximum soluble inhi-
bitors bound to the substrate and avoid the loss of sugars in
the solid residue. In fact, Scheme 3 is the normal routine
process used in most of the published articles (Frederick
et al. 2013; Hodge et al. 2008). Further, washing of the
pretreated biomass will be difficult to replicate at the
commercial scale because of its enormous water require-
ment. Therefore, in order to be cost effective, it is rea-
sonable to minimize or, if possible, avoid the washing
process. In this study, the TIS for hydrolysis were kept
constant at 14 %. A further increase of 5–7 % in glucan
hydrolysis efficiencies is observed, compared with
Scheme 2 (Table 3). This can be attributed to the removal
of soluble inhibitors bound to the substrate and hence a
lower inhibitor concentration at the start of enzyme
hydrolysis. The concentrations of acetic acid, furan alde-
hydes, and phenolics are much lower in Scheme 3
(Table 3) as the inhibitors liberated in the hemicellulose
hydrolysis during pretreatment are removed during wash-
ing. Minor amount of hemicellulose is still present in the
solid fraction after pretreatment. Another rationale is that
the pretreatment liquor contains compounds (e.g., solubi-
lized lignin derivatives) that can re-precipitate and recon-
dense on cooling the pretreated biomass, thus inhibiting the
cellulase enzymes during the hydrolysis.
For mild acid and steam pretreatments, similar trends of
increase in enzymatic efficiencies following Schemes 1
and 2 are also observed (Table 3). The overall xylan to
xylose conversion is lower for these pretreatments as the
hydrolysis was conducted in the absence of a xylose-rich
aqueous stream. An increase in xylose concentration during
enzyme hydrolysis is observed for mild acid and steam
pretreatments, as some of the soluble xylo-oligomers
bound to the substrate are converted to xylose monomers
during enzyme hydrolysis (Table 3). In Scheme 3, the
aqueous stream separated by filtration is very dilute and
will provide very less ethanol concentration post-fermen-
tation. For achieving a higher ethanol concentration, the
aqueous stream needs to be concentrated to higher sugar
concentrations. However, this may incur an additional cost
of evaporation in terms of operating cost and capital cost.
In Scheme 3, xylan to xylose monomer conversion is lower
3 Biotech (2016) 6:126 Page 11 of 14 126
123
for mild acid and steam pretreatments, as soluble xylo-
oligomers are formed in the slurry and enzyme hydrolysis
was conducted in the absence of an aqueous phase. An
additional step of converting the xylo-oligomers to xylose
monomers will be required with the help of an acid or
enzyme.
Effect of the different schemes on sugar yield
A noteworthy difference in the process schemes considered
in this study is the effect of pressure filtration and solid–
liquid separation on pretreatment that can result in an
enhanced yield of sugars and consequently ethanol.
Although different types of treatment have been explored
in this study, the effect of pretreatment is transferred
equally to the enzymatic process. This shows that irre-
spective of the pretreatment type, the different enzymatic
hydrolysis schemes used in this study should hold good.
To effectively compare different pretreatmentmethods and
posttreatment process configurations, it is important to pro-
vide material balance, enabling the tracking of sugars (cellu-
lose and hemicellulose) in the process for the generation of
fermentable sugars. Individual components, focusing on cel-
lulose/glucose, xylan/xylose, and total solids, have been
considered formass balance calculations.Mass balanceswere
established around the process block diagrams shown in
Figures S1–S9. Mass balances are based on processing of
1000 kg of dry bagasse. Table 3 summarizes the sugar con-
centrations of both glucose and xylose after enzyme hydrol-
ysis. Scheme 2provides a higher sugar concentration and total
fermentable sugars than Scheme 1. For the monomeric
treatment, Scheme 2 provides total mixed fermentable sugars
of 100 g/L andmixed fermentable sugars of 502 kg compared
with Scheme 1, which provides 90 g/L and 457 kg, respec-
tively. This difference is mainly due to the lower efficiency of
enzymehydrolysis obtainedwithScheme 1athigher solids.A
similar trend is observed for mild acid and steam pretreat-
ments in Scheme 2, thereby achieving a higher sugar con-
centration and fermentable sugar yield than Scheme 1.
Glucose concentration is highest for Scheme 3, because
of higher enzymatic efficiencies achieved by washing the
pretreated slurry and hence lower concentration of soluble
inhibitors in the enzymatic slurry as shown in Table 3.
However, xylose concentration is lower, as the liquid phase
is separated after filtration of pretreated slurry. The addi-
tional step of washing in Scheme 3 may lead to an increase
in the volume of reactors, thus increasing the cost of
ethanol production. Washing of pretreated slurry will lead
to dilution of sugar in the aqueous stream separated.
For a simple filtration, as done in Scheme 2, with all
other things such as solid content constant, the efficiency is
higher by 8–10 %. Washing of the pretreated slurry results
in a further increase of efficiency by 5–7 %. This shows
that filtration mechanism, where pressure filtration is
applied, might have affected the ultrastructure of biomass,
thereby enhancing the yield of enzymatic hydrolysis.
The efficiency of enzymatic hydrolysis is highest for
Scheme 3, although it requires an extra step of washing.
Co-fermentation of bagasse enzymatic hydrolyzate
generated from different schemes
Enzymatic hydrolyzates obtained from all the schemes
were taken for co-fermentation trials with a genetically
modified co-fermenting S. cerevisiae strain with high
sugars and tolerance to inhibitors. For Schemes 1 and 2,
the initial mixed sugar concentration was in the range of
80–90 g/L, of which 45–55 g/L is glucose and the rest
xylose. The consumption of glucose and xylose was not
simultaneous, and the former was more preferred. Xylose
consumption started only after all glucose was consumed.
The total retention time required for the formation of
ethanol for Schemes 1 and 2 is 72 h, of which glucose
consumption takes about 24 h and xylose consumption
takes another 48 h. The rate of consumption of glucose was
much higher than that of xylose, which is evident from the
lower retention time required for glucose consumption.
Table S1 shows the ethanol concentration for different
posttreatment schemes explored in this study. Ethanol
concentrations are higher for Scheme 2 than Scheme 1,
because of the higher enzymatic efficiency. The maximum
ethanol production (5.2 % v/v) corresponded to the maxi-
mum total sugar released (89.5 g/L) during the enzymatic
hydrolysis using Scheme 2 for monomeric treatment.
Similar ethanol concentration was also obtained in
Scheme 2 for mild acid-treated post-co-fermentation slurry
(Table S1).
Post-fermentation, a maximum of 5.1–5.2 % v/v of
ethanol, corresponding to theoretical maximum (90 %), is
produced from Scheme 2 for monomeric treatment. This
indicates that the co-fermenting strain is capable of pro-
viding high conversions to ethanol with high sugars and
tolerance to inhibitors. This high tolerance could be due to
the adaptation of the initial parent strain, which allows the
microorganisms to grow in inhibitors and then gradually
enhance their tolerance to the inhibitors.
The contribution of initial sugar for Scheme 3 is majorly
glucose and less amount of xylose (Table S1). The lower
concentration of xylose is attributed to fact that enzyme
hydrolysis was conducted in the presence of fresh water.
The total retention time for ethanol production was 48 h, of
which glucose consumption took 24 h and xylose con-
sumption took 24 h. In Scheme, 3 the retention time
required for ethanol conversion is lower, as the initial
xylose has a lower concentration at the start of co-fer-
mentation than other Schemes.
126 Page 12 of 14 3 Biotech (2016) 6:126
123

Conclusion
Pretreatment and enzymatic conversion were investigated
for different pretreatment and posttreatment process con-
figurations at high TIS concentration. The high-severity
dilute mixed-acid treatment resulted in maximum xylose
sugars. Of the three post-pretreatment process scenarios
investigated, the method which utilized pressure filtration
and remixing of liquid with filtered solid achieved more
sugar concentration, yield of fermentable mixed sugars,
and ethanol concentration. This process scheme also
resulted in lower process water for ethanol production from
SB. The third scheme, which involved a solid–liquid sep-
aration step and extensive washing steps, although,
achieved maximum enzymatic efficiency, but at the cost of
extra washing, which may be difficult to perform at
industrial scale. The use of high solids in the pretreatment
(*20 %) using a 1TPD pretreatment pilot plant loaded
with unwashed ‘‘as received’’ SB and enzyme hydrolysis at
the same solid loading provided reliable data for a com-
mercial scenario. The differences in enzymatic efficiencies
between the various schemes studied were attributed to the
mechanism of filtration of pretreated slurry, which changes
the ultrastructure, making it more amenable for enzymatic
hydrolysis to be conducted at high insoluble solids. The use
of high-solid model ultimately increases ethanol concen-
tration and reduces energy cost and capital cost associated
with distillation and reactors, respectively.
Acknowledgments This study constitutes the doctoral research of
Siddhartha Pal under the supervision of Anjani J. Varma (academic
institution) and Pramod S. Kumbhar and Sasisanker Padmanabhan
(Praj Matrix industrial research). Shereena Joy provided technical
inputs (compositional analysis, HPLC, and experimental inputs). All
experimental samples were generated at M/s Praj Matrix. The latter
part of this study was funded by M/s Praj Matrix. Studies on DLS
were conducted at CSIR-NCL by Kalpana D. Trimukhe. Anjani J.
Varma and Kalpana D. Trimukhe thank the director of CSIR-NCL for
providing instrumentation.
Compliance with ethical standards
Conflict of interest The authors declare that they have no conflict of
interest in the publication.
Open Access This article is distributed under the terms of the
Creative Commons Attribution 4.0 International License (http://
creativecommons.org/licenses/by/4.0/), which permits unrestricted
use, distribution, and reproduction in any medium, provided you give
appropriate credit to the original author(s) and the source, provide a
link to the Creative Commons license, and indicate if changes were
made.
References
Adani F, Papa G, Schievano A, Cardinale G, D’Imporzano G,
Tambone F (2011) Nanoscale structure of the cell wall
protecting cellulose from enzyme attack. Environ Sci Technol
45(3):1107–1113
Agrawal R, Satlewal A, Gaur R, Mathur A, Kumar R, Gupta RP, Tuli
DK (2015) Pilot scale pretreatment of wheat straw and
comparative evaluation of commercial enzyme preparations for
biomass saccharification and fermentation. Biochem Eng J
102:54–61
Bommarius AS, Katona A, Cheben SE, Patel AS, Ragauskas AJ,
Knudson K, Pu Y (2008) Cellulase kinetics as a function of
cellulose pretreatment. Metab Eng 10:370–381
Bootsma JA, Entorf M, Eder J, Shanks BH (2008) Hydrolysis of
oligo-saccharides from distillers grains using organic-inorganic
hybrid mesoporous silica catalysts. Bioresour Technol
99:5226–5231
Canilha L, Santos VTO, Rocha GJM, Silva JBA, Giulietti M, Silva
SS, Felipe MGA, Ferraz A, Milagres AMF, Carvalho W (2011)
A study on the pretreatment of a sugarcane bagasse sample with
dilute sulfuric acid. J Ind Microbiol Biotechnol 38:1467–1475
Cantarella M, Cantarella L, Gallifuoco A, Spera A, Alfani F (2004)
Effect of inhibitors released during steam-explosion treatment of
poplar wood on subsequent enzymatic hydrolysis and SSF.
Biotechnol Progr 20:200–206
Chen X, Kuhn E, Wang W, Park S, Flanegan K, Trass O, Tenlep L,
Tao L, Tucker M (2013) Comparison of different mechanical
refining technologies on the enzymatic digestibility of low
severity acid pretreated cornstover. Bioresour Technol
147:401–408
Chundawat SPS, Beckham GT, Himmel ME, Dale BE (2011)
Deconstruction of lignocellulosic biomass to fuels and chemi-
cals. Annu Rev Chem Biomol Eng 2:121–145
Eibinger M, Bubner P, Ganner T, Plank H, Nidetzky B (2014) Surface
structural dynamics of enzymatic cellulose degradation, revealed
by combined kinetic and atomic force microscopy studies. FEBS
J 281:275–290
Frederick N, Zhang N, Djioleu A, Ge X, Xu J, Carrier DJ (2013) The
Effect of washing dilute acid pretreated poplar biomass on
ethanol yields. In: Chandel A, da Silva S (eds) Sustainable
degradation of lignocellulosic biomass—techniques, applications
and commercialization. INTECH OPEN, New York, pp 105–117
Geng W, Jin Y, Jameel H, Park S (2015) Strategies to achieve high-
solids enzymatic hydrolysis of dilute-acid pretreated corn stover.
Bioresour Technol 187:43–48
Guo B, Zhang Y, Ha S-J, Jin Y-S, Morgenroth E (2012) Combined
biomimetic and inorganic acids hydrolysis of hemicellulose in
Miscanthus for bioethanol production. Bioresour Technol
110:278–287
Hernandez IP, Perez-Pimienta JA, Messina S, Duran CES (2012)
Dilute sulfuric acid hydrolysis of tropical region biomass.
J Renew Sustain Energy 4:021201
Hodge DB, Karim MN, Schell DJ, McMillan JD (2008) Soluble and
insoluble solids contributions to high-solids enzymatic hydrol-
ysis of lignocellulose. Bioresour Technol 99:8940–8948
Ioelovich M, Morag E (2012) Study of enzymatic hydrolysis of
pretreated biomass at increased solid loading. Bioresources
7(4):4672–4682
Kadic A, Palmqvist B, Liden G (2014) Effects of agitation on
particle-size distribution and enzymatic hydrolysis of pretreated
spruce and giant reed. Biotechnol Biofuels 7(77):1
Kim Y, Hendrickson R, Mosier N, Ladisch MR (2005) Plug-flow
reactor for continuous hydrolysis of glucans and xylans from
pre-treated corn fiber. Energy Fuels 19:2189–2200
Kim Y, Mosier NS, Ladisch MR (2009) Enzymatic digestion of liquid
hot water pretreated hybrid poplar. Biotechnol Progr 25:340–348
Kim Y, Kreke T, Hendrickson R, Parenti J, Ladisch MR (2013)
Fractionation of cellulase and fermentation inhibitors from steam
pretreated mixed hardwood. Bioresour Technol 135:30–38
3 Biotech (2016) 6:126 Page 13 of 14 126
123

Klein-Marcuschamer D, Blanch HW (2015) Renewable fuels from
biomass: technical hurdles and economic assessment of biolog-
ical routes. AIChE J 61:2689–2701
Kootstra AMJ, Beeftink HH, Scott EL, Sanders JPM (2009)
Comparison of dilute mineral and organic acid pretreatment
for enzymatic hydrolysis of wheat straw. Biochem Eng J
46:126–131
Kristensen JB, Felby C, Jørgensen H (2009) Yield-determining
factors in high-solids enzymatic hydrolysis of lignocellulose.
Biotechnol Biofuels 2:11
Kumar R, Wyman CE (2009) Effect of xylanase supplementation of
cellulase on digestion of corn stover solids prepared by leading
pretreatment technologies. Bioresour Technol 100:4203–4213
Larsen J, Haven MØ, Thirup L (2012) Inbicon makes lignocellulosic
ethanol a commercial reality. Biomass Bioenerg 46:36–45
Macrelli S, Mogensen J, Zacchi G (2012) Techno-economic evalu-
ation of 2nd generation bioethanol production from sugar cane
bagasse and leaves integrated with the sugar-based ethanol
process. Biotechnol Biofuels 5:22
Martın C, Galbe M, Nilvebrant N-O, Jonsson LJ (2002) Comparison
of the fermentability of enzymatic hydrolysates of sugarcane
bagasse pretreated by steam explosion using different impreg-
nating agents. Appl Biochem Biotech 98:699–716
Modenbach AA, Nokes SE (2013) Enzymatic hydrolysis of biomass
at high-solids loadings—a review. Biomass Bioenerg
56:526–544
Ohgren K, Bura R, Lesnicki G, Saddler J, Zacchi G (2007) A
comparison between simultaneous saccharification and fermen-
tation and separate hydrolysis and fermentation using steam-
pretreated corn stover. Process Biochem 42:834–839
Peciulyte A, Karlstrom K, Larsson PT, Olsson L (2015) Impact of the
supramolecular structure of cellulose on the efficiency of
enzymatic hydrolysis. Biotechnol Biofuels 8:56. doi:10.1186/
s13068-015-0236-9
Rasmussen H, Sørensen HR, Meyer AS (2014) Formation of
degradation compounds from lignocellulosic biomass in the
biorefinery: sugar reaction mechanisms. Carbohydr Res
385:45–57
Schell DJ, Farmer J, Newman M, McMillan JD (2003) Dilute-sulfuric
acid pretreatment of corn stover in pilot-scale reactor: investi-
gation of yields, kinetics, and enzymatic digestibilities of solids.
Appl Biochem Biotech 105–108:69–85
Singleton V, Orthofer R, Lamuela-Raventos RM (1999) Analysis of
total phenols and other oxidation substrates and antioxidants by
means of Folin-Ciocalteu reagent. Methods Enzymol 299(Oxi-
dants and Antioxidants Part A):152–178
Sluiter A, Hames B, Ruiz R, Scarlata C, Sluiter J, Templeton D,
Crocker D (2008a) Determination of extractives in biomass.
National Renewable Energy Procedure (LAP), USA. http://
www.nrel.gov/docs/gen/fy08/42619.pdf. Accessed 10 July 2014
Sluiter A, Hames B, Ruiz R, Scarlata C, Sluiter J, Templeton D,
Crocker D (2008b) Determination of ash in energy laboratory.
Laboratory analytical procedure (LAP), USA. http://www.nrel.
gov/biomass/pdfs/42622.pdf. Accessed 10 July 2014
Sluiter A,HamesB, RuizR, Scarlata C, Sluiter J, TempletonD, Crocker
D (2012) Determination of structural carbohydrates and lignin in
biomass. National Renewable Energy Procedure (LAP). http://
www.nrel.gov/biomass/pdfs/42618.pdf. Accessed 5 Nov 2014
Todd AL,Wyman CE (2005) Combined sugar yields for dilute sulfuric
acid pretreatment of corn stover followed by enzymatic hydrolysis
of the remaining solids. Bioresour Technol 96(18):1967–1977
Um B-H, Van Walsum GP (2010) Evaluation of enzyme mixtures in
releasing fermentable sugars from pre-pulping extracts of mixed
northeast hardwoods. Appl Biochem Biotech 161:432–447
Wingren A, GalbeM, Zacchi G (2003) Techno-economic evaluation of
producing ethanol from softwood: comparison of SSF and SHF
and identification of bottlenecks. Biotechnol Progr 19:1109–1117
Wyman CE, Balan V, Dale BE, Elander RT, Falls M, Hames B,
Holtzapple MT, Ladisch MR, Lee YY, Mosier N, Pallapolu VR,
Shi J, Thomas SR, Warner RE (2011) Comparative data on
effects of leading pretreatments and enzyme loadings and
formulations on sugar yields from different switchgrass sources.
Bioresour Technol 102:11052–11062
Xue (2011) Process modifications on enzymatic saccharification for
improved conversions and concentration of sugars for bioethanol
production. Ph.D. thesis, North Carolina University, Raleigh,
North Carolina
Zacchi G, Axelsson A (1989) Economic evaluation of preconcentra-
tion in production of ethanol from dilute sugar solutions.
Biotechnol Bioeng 34:223–233
Zhang R, Lu XB, Sun YS, Wang XY, Zhang ST (2011) Modeling and
optimization of dilute nitric acid hydrolysis on corn stover.
J Chem Technol Biot 86:306–314
Zhang T, Kumar R, Wyman CE (2013) Sugar yields from dilute
oxalic acid pretreatment of maple wood compared to those with
other dilute acids and hot water. Carbohydr Polym 92:334–344
Zhang L, Yan L, Wang Z, Laskar DD, Swita MS, Cort JR, Yang B
(2015) Characterization of lignin derived from water-only and
dilute acid flowthrough pretreatment of poplar wood at elevated
temperatures. Biotechnol Biofuels 8:203
126 Page 14 of 14 3 Biotech (2016) 6:126
123


![Praj Signs Strategic Alliance MOU with Gevo [Company Update]](https://img.pdfslide.us/doc/110x75/577cb2021a28aba7118beb8c/praj-signs-strategic-alliance-mou-with-gevo-company-update.jpg)
![Annual Report - Praj Industry [2010-11 ]](https://img.pdfslide.us/doc/110x75/5500511b4a7959995f8b47f2/annual-report-praj-industry-2010-11-.jpg)