Embed Size (px)
Citation preview
Pressure-induced loss of electronic interlayer state and metallization in ionic solid Li3N
A. Lazicki,1, 2, ∗ C. W. Yoo,1, † W. J. Evans,1 M. Y. Hu,3 P. Chow,3 and W. E. Pickett21Lawrence Livermore National Laboratory, Livermore, California 945502Physics Department, University of California, Davis, California 956163HPCAT/APS, Argonne National Laboratory, Argonne, Illinois 60439
Results of X-ray diffraction and nitrogen K-edge X-Ray Raman Scattering (XRS) investigationsof the crystal and electronic structure of ionic compound Li3N across two high pressure phase tran-sitions [1] are interpreted using density functional theory. A low-energy peak in the XRS spectrumwhich is observed in both low-pressure hexagonal phases of Li3N and absent in the high pressurecubic phase is found to originate from an interlayer band similar to the important free-electron-likestate present in the graphite and graphite intercalated systems, but not observed previously in ionicinsulators. XRS detection of the interlayer state is made possible because of its strong hybridizationwith the nitrogen p-bands. A pressure-induced increase in the band gap of the high pressure cubicphase of Li3N is explained by the differing pressure dependencies of different quantum-number bandsand is shown to be a feature of several low-Z closed-shell ionic materials.
I. INTRODUCTION
Lithium nitride is the only known thermodynamicallystable alkali metal nitride and is one of the most ionic ofall known nitrides. At ambient pressure, the nitrogen ex-ists in the multiply charged (N3−) state [2, 3] consideredto be stable only because of its crystal environment - ahexagonal bipyramid of Li+ ions [4, 5] unique to the Nion. This material is a superionic conductor via vacancy-induced Li+ diffusion within the Li2N layers [6–8]. Itspotential for use as an electrolyte in lithium batteries [5],a hydrogen storage medium [9–12] and a component inthe synthesis of GaN [13] have prompted several studiesincluding investigations into its behavior at high pressure[1, 14].
It has been demonstrated that Li3N retains its ioniccharacter up to very high pressure, while undergoing asignificant structural transition [1]. Inelastic X-ray scat-tering experiments as well as first-principles calculationsreveal that this structural change is accompanied by dis-tinct changes in the electronic bands. Electronic changesaccompanying pressure-driven structural phase transi-tions in covalently bonded materials (such as graphiteand boron nitride) are relatively well understood becausetheir directional bonding is affected in a predictable wayby changes in the local crystal environment. However, innon-directionally-bonded closed-shell ionic materials thesituation is more subtle and electronic changes not as welldocumented. Here we explore the origins of these changesand identify an important feature in the band structure;an interlayer band (to our knowledge, reported here forthe first time in an ionic solid) which was previously un-derstood to have Li 2s character [2].
A pressure-driven widening of the electronic band gap
∗Now at: Geophysical Laboratory, Carnegie Institution of Wash-ington, Washington DC 20015†Now at: Washington State University, Pullman, Washington99164
is examined and related to an expected rapid increasein energy of the conduction bands relative to the valencebands as a result of their lack of d-character, higher prin-ciple quantum number and kinetic energy. Neighboringionic insulators Li2O and LiF are shown to demonstratesimilar behavior under pressure.
II. TECHNIQUES
Experimental details and results of an angle-dispersiveX-ray diffraction and nitrogen K-edge X-ray Raman spec-troscopy study of Li3N in the diamond anvil cell up to200 GPa have been reported in [1].
We performed first-principles electronic structure cal-culations to explore and clarify the electronic changesoccurring under pressure. Because of the large six-fold compression carried out in these calculations, weused two methods for comparison: full-potential lin-earized augmented plane-waves (LAPW) as implementedin WIEN2k code [19] within the Generalized Gradi-ent Approximation [21] and a full-potential nonorthog-onal local-orbital minimum basis band structure scheme(FPLO) [20], within the local spin-density approximation(LSDA) [22]. For the LAPW calculation, muffin tin radii(Rmt) were set so that neighboring muffin tin sphereswere nearly touching at each volume and the plane wavecutoff Kmax was determined by RmtKmax = 9.0. TheBrillouin zone was sampled on a uniform mesh with 185irreducible k-points. The energy convergence criterionwas set to 0.1 mRy. For both calculations we found itnecessary to put the lithium 1s core electrons into thevalence states. Thus, in the FPLO scheme, Li 1s, 2s, 3p,3s, 3p and 3d states and N 2s, 2p, 3s, 3p and 3d stateswere used as valence states and only the lower-lying N1s state was treated as a core state. The results of thesetwo codes are in reasonable agreement with one anotherand with experimental data, indicating that the approxi-mations made and procedures adopted are reasonable forthis system.
2
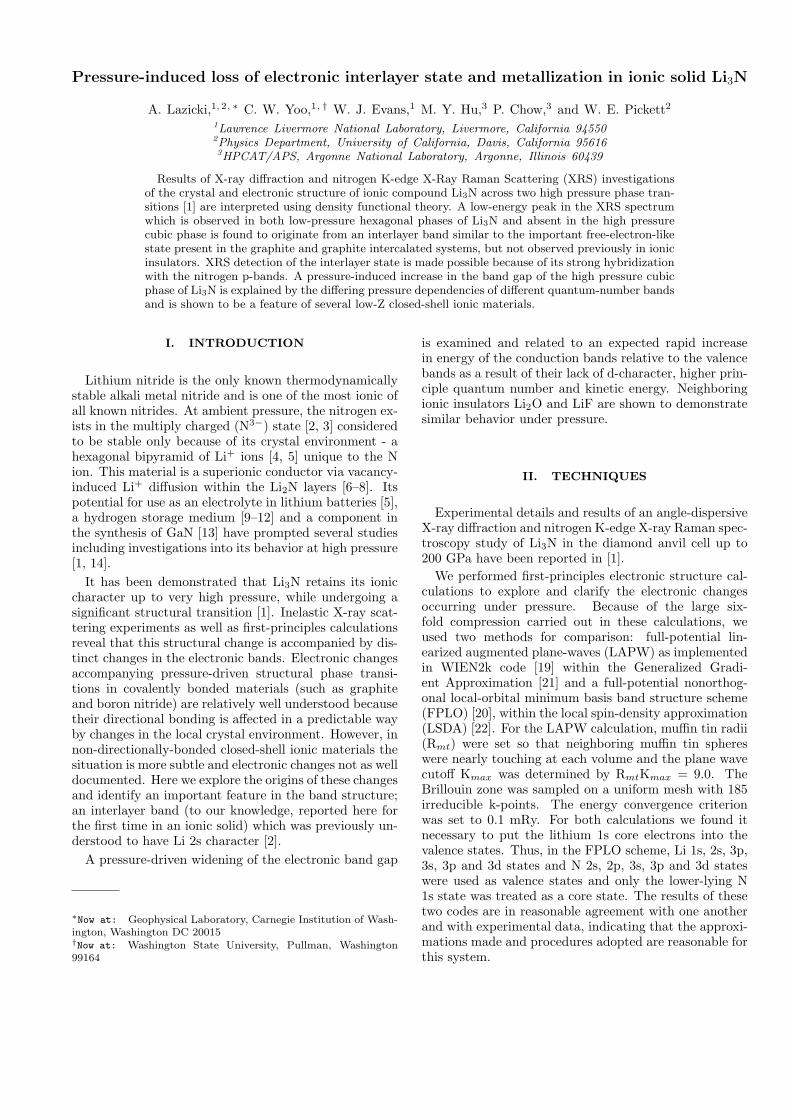
FIG. 1: (Color online) Crystal structures of each phase withlarger spheres representing the nitrogen ions, smaller repre-senting lithium.
III. RESULTS
A. X-ray Diffraction
X-ray diffraction results from [1] identified the struc-tures shown in Figure 1. At ambient conditions, thepowder sample exists as a combination of two hexago-nal phases known as α-Li3N (P6/mmm) and metastableβ-Li3N (P63/mmc). α-Li3N fully transforms to β-Li3Nnear 0.5 GPa, and a second phase transition to a cubicphase, γ-Li3N (Fm3m), occurs near 40 GPa. The cubicphase can be understood as the rocksalt structure withthe two additional Li ions occupying the tetrahedral holesin the lattice.
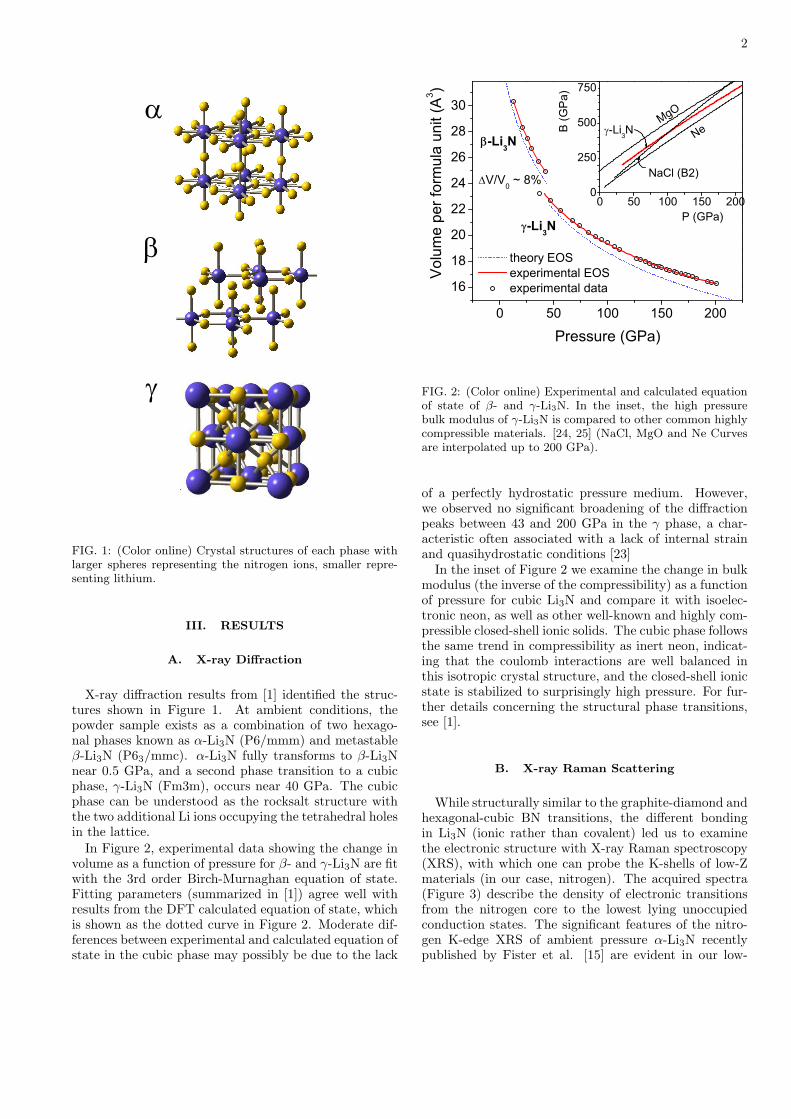
In Figure 2, experimental data showing the change involume as a function of pressure for β- and γ-Li3N are fitwith the 3rd order Birch-Murnaghan equation of state.Fitting parameters (summarized in [1]) agree well withresults from the DFT calculated equation of state, whichis shown as the dotted curve in Figure 2. Moderate dif-ferences between experimental and calculated equation ofstate in the cubic phase may possibly be due to the lack
16
18
20
22
24
26
28
30
0 50 100 150 200
0 50 100 150 2000
250
500
750
V/V0 ~ 8%
-Li3N
-Li3N
Pressure (GPa)
Vol
ume
per f
orm
ula
unit
(A3 )
theory EOS experimental EOS experimental data
NaCl (B2)
B (G
Pa)
P (GPa)
MgO-Li3N Ne
FIG. 2: (Color online) Experimental and calculated equationof state of β- and γ-Li3N. In the inset, the high pressurebulk modulus of γ-Li3N is compared to other common highlycompressible materials. [24, 25] (NaCl, MgO and Ne Curvesare interpolated up to 200 GPa).
of a perfectly hydrostatic pressure medium. However,we observed no significant broadening of the diffractionpeaks between 43 and 200 GPa in the γ phase, a char-acteristic often associated with a lack of internal strainand quasihydrostatic conditions [23]
In the inset of Figure 2 we examine the change in bulkmodulus (the inverse of the compressibility) as a functionof pressure for cubic Li3N and compare it with isoelec-tronic neon, as well as other well-known and highly com-pressible closed-shell ionic solids. The cubic phase followsthe same trend in compressibility as inert neon, indicat-ing that the coulomb interactions are well balanced inthis isotropic crystal structure, and the closed-shell ionicstate is stabilized to surprisingly high pressure. For fur-ther details concerning the structural phase transitions,see [1].
B. X-ray Raman Scattering
While structurally similar to the graphite-diamond andhexagonal-cubic BN transitions, the different bondingin Li3N (ionic rather than covalent) led us to examinethe electronic structure with X-ray Raman spectroscopy(XRS), with which one can probe the K-shells of low-Zmaterials (in our case, nitrogen). The acquired spectra(Figure 3) describe the density of electronic transitionsfrom the nitrogen core to the lowest lying unoccupiedconduction states. The significant features of the nitro-gen K-edge XRS of ambient pressure α-Li3N recentlypublished by Fister et al. [15] are evident in our low-

3
395 400 405 410 415 420 425
XRS
XAStotal N p DOS
-Li 3N
(40
GP
a)-L
i 3N (1
3 G
Pa)
+-L
i 3N (0
GP
a)
N pz
N px,y
Li s
Inte
nsity
(arb
itrar
y un
its)
Energy (eV)
FIG. 3: (Color online) Measured nitrogen k-edge XRS spectrafrom the three phases of Li3N compared with calculated Ni-trogen p and Lithium s projected density of states and withthe calculated X-ray absorption spectrum. The calculatedcurves were offset by 394.2 eV (arbitrary) in every case, forthe sake of qualitative comparison with the experimental re-sults. The vertical dashed line indicates the calculated energyof highest occupied valence states.
pressure spectrum (which, however, represents a mixtureof α- and β- Li3N). In the case of the covalently bondedmaterials, the XRS spectrum is characterized by two dis-tinct features: a sharper peak at lower energy which hasbeen shown to correspond to transitions to π* molecu-lar orbital states, and a broader peak at higher energywhich describes transitions to σ* states [28–30]. Thephase transition from a layered hexagonal structure suchas sp2-bonded graphite to a sp3-bonded cubic structuresuch as diamond is accompanied by loss of the π* bond-ing states. Therefore, one sees the narrower lower energypeak disappear across the hexagonal-cubic transition inthe covalently bonded compounds. The data acquiredfor Li3N (Figure 3) show the same characteristic leadingedge peak in both hexagonal phases and not in the cubicphase.
However, the calculated spectra reveal some importantdifferences. Within the dipole approximation the nitro-gen K-edge XRS should give us a reasonably good ap-proximation of the X-ray absorption spectrum. We there-fore calculated this quantity from the nitrogen p pro-
jected density of states multiplied by the dipole-allowedtransition matrix elements and a transition probability(Figure 3). The calculated spectrum is in good agree-ment with the results of Fister et al. [15] for α-Li3N.The important features in the experimental spectrum arereproduced in the calculated X-ray absorption spectrumand in the nitrogen p projected density of states. Theprojected density of states is shown for the purpose ofdemonstrating that the leading edge peak (which, in thecase of graphite, represents a π* bonding state of almostentirely C pz character [31]) is composed of similar con-tributions from pz and px+py. This indicates that thenitrogen p states in hexagonal Li3N are energetically lessdistinguishable; their distribution is close to sphericallysymmetric, with little directional character. Similar cal-culations of Fister et al. [15] also confirm the absence ofcovalent character in the low-pressure phase. This evi-dence supports a closed-shell ionic state and raises ques-tions about the nature of this leading edge peak. Why isit present in the hexagonal phase and not in the cubic, ifthe p electron states are not significantly affected by thelocal coordination?
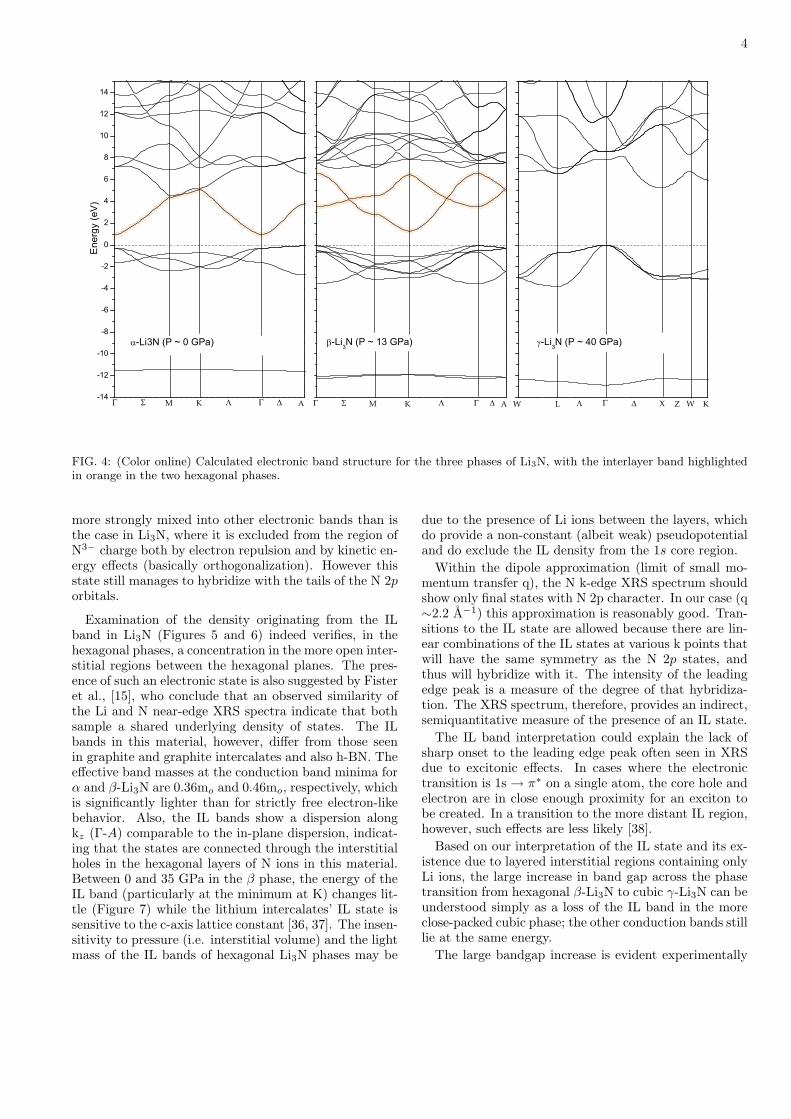
Electronic structure interpretations of ambient Li3Nfrom previous work claim that the electronic bands fromwhich this density arises have Li 2s character [2]. Weplot the band structures for the three phases (Figure 4).In the α phase, the band has a minimum with paraboliccharacter around the Γ point and Γ+
1 (s-like) symmetry.β-Li3N has two formula units per primitive cell, so the(symmetric) Γ+
1 band folds back at the Brillouin zoneboundary, giving rise to a second band with (antisym-metric) Γ+
3 symmetry (notation taken from Robertson[32]). The projected density of states in Figure 3 shows asmall Li s-character that does not support a “Li 2s” char-acterization of this state. Moreover, the density plots inFigs. 5 and 6 clearly show there is no 2s-like densityaround the Li ions that is distinct from the main densityin the interstitial region.
IV. DISCUSSION
We interpret the character of the lowest conductionband in the hexagonal phases (Figure 4) by comparisonwith analogous bands in graphite, graphite intercalatesand hexagonal boron nitride. These latter materials, inaddition to the π* and σ* states in the absorption spec-trum, possess a smaller and weaker peak, the existence ofwhich has been long known but generally ignored becauseof its overlap with the much more dominant sp bands[33–35]. Its character, however, is well understood andin fact very recently it has been suggested to play a vitalrole in the superconductivity of the lithium intercalatedgraphite compounds [36]. This band (of Γ+
1 symmetry)is a free-electron-like interlayer (IL) state, given that itsprobability density peaks in interstitial regions betweenthe hexagonal layers and cannot be assigned to a particu-lar atomic character. The density in these compounds is
4
-14
-12
-10
-8
-6
-4
-2
0
2
4
6
8
10
12
14
-Li3N (P ~ 40 GPa)-Li
3N (P ~ 13 GPa)-Li3N (P ~ 0 GPa)
Ene
rgy
(eV
)
AKM KWZXLW
AKM
FIG. 4: (Color online) Calculated electronic band structure for the three phases of Li3N, with the interlayer band highlightedin orange in the two hexagonal phases.
more strongly mixed into other electronic bands than isthe case in Li3N, where it is excluded from the region ofN3− charge both by electron repulsion and by kinetic en-ergy effects (basically orthogonalization). However thisstate still manages to hybridize with the tails of the N 2porbitals.
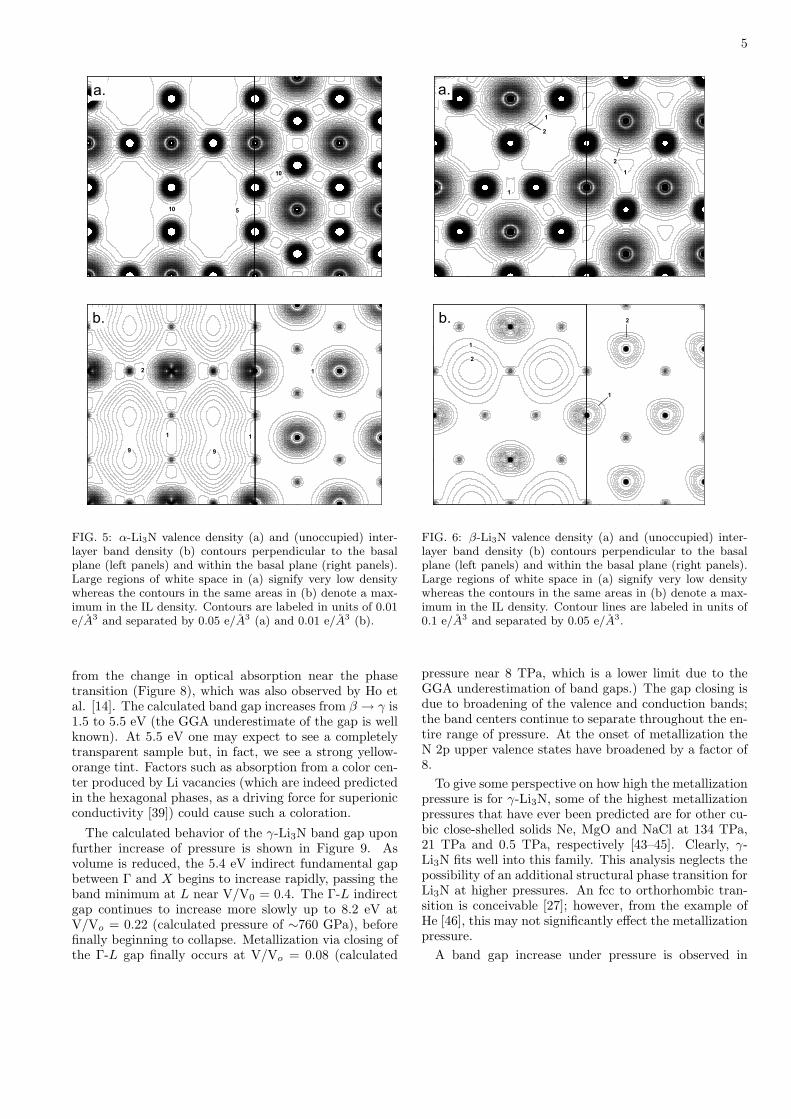
Examination of the density originating from the ILband in Li3N (Figures 5 and 6) indeed verifies, in thehexagonal phases, a concentration in the more open inter-stitial regions between the hexagonal planes. The pres-ence of such an electronic state is also suggested by Fisteret al., [15], who conclude that an observed similarity ofthe Li and N near-edge XRS spectra indicate that bothsample a shared underlying density of states. The ILbands in this material, however, differ from those seenin graphite and graphite intercalates and also h-BN. Theeffective band masses at the conduction band minima forα and β-Li3N are 0.36mo and 0.46mo, respectively, whichis significantly lighter than for strictly free electron-likebehavior. Also, the IL bands show a dispersion alongkz (Γ-A) comparable to the in-plane dispersion, indicat-ing that the states are connected through the interstitialholes in the hexagonal layers of N ions in this material.Between 0 and 35 GPa in the β phase, the energy of theIL band (particularly at the minimum at K) changes lit-tle (Figure 7) while the lithium intercalates’ IL state issensitive to the c-axis lattice constant [36, 37]. The insen-sitivity to pressure (i.e. interstitial volume) and the lightmass of the IL bands of hexagonal Li3N phases may be
due to the presence of Li ions between the layers, whichdo provide a non-constant (albeit weak) pseudopotentialand do exclude the IL density from the 1s core region.
Within the dipole approximation (limit of small mo-mentum transfer q), the N k-edge XRS spectrum shouldshow only final states with N 2p character. In our case (q∼2.2 A−1) this approximation is reasonably good. Tran-sitions to the IL state are allowed because there are lin-ear combinations of the IL states at various k points thatwill have the same symmetry as the N 2p states, andthus will hybridize with it. The intensity of the leadingedge peak is a measure of the degree of that hybridiza-tion. The XRS spectrum, therefore, provides an indirect,semiquantitative measure of the presence of an IL state.
The IL band interpretation could explain the lack ofsharp onset to the leading edge peak often seen in XRSdue to excitonic effects. In cases where the electronictransition is 1s → π∗ on a single atom, the core hole andelectron are in close enough proximity for an exciton tobe created. In a transition to the more distant IL region,however, such effects are less likely [38].
Based on our interpretation of the IL state and its ex-istence due to layered interstitial regions containing onlyLi ions, the large increase in band gap across the phasetransition from hexagonal β-Li3N to cubic γ-Li3N can beunderstood simply as a loss of the IL band in the moreclose-packed cubic phase; the other conduction bands stilllie at the same energy.
The large bandgap increase is evident experimentally
5
1
9
2
11
9
b.
a.
10
10 5
FIG. 5: α-Li3N valence density (a) and (unoccupied) inter-layer band density (b) contours perpendicular to the basalplane (left panels) and within the basal plane (right panels).Large regions of white space in (a) signify very low densitywhereas the contours in the same areas in (b) denote a max-imum in the IL density. Contours are labeled in units of 0.01e/A3 and separated by 0.05 e/A3 (a) and 0.01 e/A3 (b).
from the change in optical absorption near the phasetransition (Figure 8), which was also observed by Ho etal. [14]. The calculated band gap increases from β → γ is1.5 to 5.5 eV (the GGA underestimate of the gap is wellknown). At 5.5 eV one may expect to see a completelytransparent sample but, in fact, we see a strong yellow-orange tint. Factors such as absorption from a color cen-ter produced by Li vacancies (which are indeed predictedin the hexagonal phases, as a driving force for superionicconductivity [39]) could cause such a coloration.
The calculated behavior of the γ-Li3N band gap uponfurther increase of pressure is shown in Figure 9. Asvolume is reduced, the 5.4 eV indirect fundamental gapbetween Γ and X begins to increase rapidly, passing theband minimum at L near V/V0 = 0.4. The Γ-L indirectgap continues to increase more slowly up to 8.2 eV atV/Vo = 0.22 (calculated pressure of ∼760 GPa), beforefinally beginning to collapse. Metallization via closing ofthe Γ-L gap finally occurs at V/Vo = 0.08 (calculated
b.
2
1
2
1
1
a.
2
1
1
2
FIG. 6: β-Li3N valence density (a) and (unoccupied) inter-layer band density (b) contours perpendicular to the basalplane (left panels) and within the basal plane (right panels).Large regions of white space in (a) signify very low densitywhereas the contours in the same areas in (b) denote a max-imum in the IL density. Contour lines are labeled in units of0.1 e/A3 and separated by 0.05 e/A3.
pressure near 8 TPa, which is a lower limit due to theGGA underestimation of band gaps.) The gap closing isdue to broadening of the valence and conduction bands;the band centers continue to separate throughout the en-tire range of pressure. At the onset of metallization theN 2p upper valence states have broadened by a factor of8.
To give some perspective on how high the metallizationpressure is for γ-Li3N, some of the highest metallizationpressures that have ever been predicted are for other cu-bic close-shelled solids Ne, MgO and NaCl at 134 TPa,21 TPa and 0.5 TPa, respectively [43–45]. Clearly, γ-Li3N fits well into this family. This analysis neglects thepossibility of an additional structural phase transition forLi3N at higher pressures. An fcc to orthorhombic tran-sition is conceivable [27]; however, from the example ofHe [46], this may not significantly effect the metallizationpressure.
A band gap increase under pressure is observed in

6
-4 -2 0 2 4 6 8 10 12
0 GPa 13 GPa 21 GPa 35 GPa
Inte
nsity
(arb
. uni
ts)
Energy (eV)
FIG. 7: (Color online) Total density of states of valence andlow-lying conduction bands of β-Li3N between 0 and 35 GPa.
FIG. 8: (Color online) Sample image at ambient pressure (a)and at the β→γ phase transition near 40 GPa (b). The brightspot at 40 GPa is the ruby grain used for pressure calibration.
0.1 0.2 0.3 0.4 0.5
0
5
10
15
20
25
30
0 5 10
fundamental gap - L gap - X gap
Ene
rgy
sepa
ratio
n (e
V)
Volume reduction (V/V0)
Den
sity
of S
tate
s
Energy (eV)
FIG. 9: (Color online) Change in valence band energies rel-ative to bottom of the conduction band in the γ phase fromthe phase transition to metallization. Energy gaps explainedin the density of states plot (inset): open circles give the fun-damental band gap, and the energy separation between thebottom of the conduction band and the center of mass of thevalence band (open triangles) and the bottom of the valenceband (closed triangles) are also shown. V0 is the volume ofα-Li3N at ambient pressure.
0.7 0.8 0.9 1.0
6
8
10
12 Li3N Li2O LiF
Ban
d G
ap (e
V)
V/V0
FIG. 10: Band gap increases as a function of volume reductionfor related close-shelled cubic Li compounds. LiF and Li2Oare cubic at ambient pressure and V0 refers to the ambientpressure volume. Li3N V0 (in this instance alone) is taken asthe volume at the β → γ phase transition.
many other semiconducting materials; particularly thetetrahedrally coordinated zincblende and wurtzite struc-tures such as diamond [47], group III nitrides [48, 50], andothers [49]. Several effects contribute to the gap increasein these cubic semiconductors. Of primary importance isthe presence of d-like states in the lower conduction orupper valence bands. The mechanism for metallization inmost higher-Z ionic, insulating compounds is the strongrelative decrease in energy of the conduction d bands rel-ative to the s and p valence bands, leading to eventualtransfer of electrons from d to s across the Fermi level,or hybridization between these states [51]. The reasonfor the record-breaking metallization pressure predictedfor Ne is that the band overlap does not occur until the3d conduction bands have fallen in energy through allthe 3s and 3p conduction bands, to finally overlap the2p valence bands at an astonishing 34-fold volume com-pression. This is an example of a more general trend;that bands with higher total energy (related to principlequantum number n) will increase in energy with respectto lower bands, and that bands with smaller ` (orbitalcharacter) increase in energy with respect to larger ` [51].Indirect-gap cubic Li3N (as well as neighboring cubic Licompounds for which we also calculated a gap increaseunder pressure in Figure 10, consistent with the findingsof [52, 53]) have completely filled 1s shells on the lithiumions and 2p shells on the anion. The low-lying conduc-tion bands, therefore, consist of entirely Li 2s/2p char-acter and anion 3s/3p character (and negligibly small dcharacter anywhere near the band gap), which can be ex-pected to increase in energy more rapidly than the lower-quantum number valence states, resulting in the observedband gap increase in all three of these cubic compounds.
The fact that the fundamental gap in the hexagonalphases of Li3N does not increase with pressure seems tobe due simply to the more rapid band broadening. Thegap between the conduction and valence states is in factincreasing in the hexagonal phases, as seen in Figure 7,
7
but the rapid broadening of the interlayer bands as aresult of the decrease in interlayer spacing (decreasingc/a ratio) causes an overall decrease in the fundamentalgap.
Larger band broadening in γ-Li3N compared to Ne dueto the presence of Li ions within the fcc N3− lattice resultsin gap closure for Li3N at much lower compression thanfor Ne, long before d bands begin to overlap the valencestates. This, as well as the existence of Li character in theconduction bands which makes the phenomenon more ofan interspecies metallization in Li3N, contribute to thelower metallization pressure than predicted for Ne.
V. CONCLUSION
Ionic solid Li3N is demonstrated to possess large con-centrations of unoccupied charge states in the open in-terlayer regions of the hexagonal phases, which result inlow-lying conduction bands of the variety previously ob-served in layered covalently bonded compounds but notto our knowledge previously seen in ionic materials. Thestrong hybridization between the interlayer state and ni-
trogen p states allows its detection with X-ray Ramanspectroscopy. The large band gap increase across thehexagonal-cubic phase transition is then interpreted as aloss of the interlayer band. Further increase of the bandgap as pressure is increased is related to the rapid up-ward shift of the lower conduction bands relative to thevalence bands, by reason of their higher angular momen-tum character.
VI. ACKNOWLEDGMENTS
We acknowledge A. K. McMahan, B. J. Baer, J. Sei-dler and A. Libal for advice and useful discussions dur-ing this investigation. Use of the HPCAT facility wassupported by DOE-BES, DOE-NNSA (CDAC), NSF,DOD-TACOM, and the W. M. Keck Foundation. Wethank HPCAT beamline scientist M. Somayazulu fortechnical assistance. This work has been supported bythe LDRD(04ERD020) and SEGRF programs at theLLNL, University of California under DOE No. W7405-ENG-48 and by the SSAAP (DE-FG03-03NA00071) andNSF(ITR 031339) at UCD.
[1] A Lazicki, B. Maddox, W. J. Evans, C.-S. Yoo, A. K.McMahan, W. E. Pickett, R. T. Scalettar, M. Y. Hu andP. Chow, Phys. Rev. Lett. 95, 165503 (2005).
[2] G. Kerker, Phys. Rev. B 23, 6312 (1981)[3] R. Dovesi, C. Pisani, F. Ricca, C. Roetti and V. R. Saun-
ders, Phys. Rev. B 30, 972 (1984).[4] E. Zintl and G. Brauer, Z. Elektrochem, 41, 102 (1935).[5] A. Rabenau and H. Schulz, J. Less Common Metals 50,
155 (1976); A. Rabenau, Solid State Ionics 6, 277 (1982).[6] M. L. Wolf, J. Phys. C: Solid State Phys. 17, L285 (1984).[7] J. Sarnthein, K. Schwarz and P. E. Blochl, Phys. Rev. B
53, 9084 (1996).[8] E. Bechtold-Schweickert, M. Mali, J. Roos and D.
Brinkmann, Phys. Rev. B 30, 2891 (1984).[9] P. Chen, Z. Xiong, J. Luo, J. Lin and K. L. Tan, Nature
420, 302 (2002).[10] T. Ichikawa, S. Isobe, N. Hanada and H. J. Fujii, J. Alloys
Compd. 365, 271 (2004).[11] Y. H. Hu and E. Ruckenstein, Ind. Eng. Chem. Res. 44,
1510 (2005).[12] Y. Nakamori, G. Kitahara, K. Miwa, S. Towata and S.
Orimo, Appl. Phys. A: Mat. Sci. Process. 80(1): 1 (2005).[13] Y Xie, Y. T. Qian, W. Z. Wang, S. Y. Zhang and Y. H.
Zhang, Science 272, 1926 (1996).[14] A. C. Ho, M. K. Granger, A. L. Ruoff, P. E. Van Camp
and V. E. Van Doren, Phys. Rev. B 59, 6083 (1999).[15] T. T. Fister, G. T. Seidler, E. L. Shirley, F. D.
Vila, J. J. Rehr, K. P. Nagle, J. C. Linehan and J.O. Cross, J. Chem. Phys., accepted: 30 May 2008,arXiv:0801.1848v1.
[16] A. P. Hammersley, ESRF Internal Report,ESRF97HA02T, “FIT2D: An Introduction andOverview”, (1997).
[17] S. Desgreniers and K. Lagarec, J. Appl. Cryst. 27, 432
(1994).[18] B. H. Toby, J. Appl. Cryst. 34, 210 (2001).[19] P. Blaha et al., WIEN2k, Karlheinz Schwarz, Techn. Uni-
versitat Wien, Wien (2001).[20] K. Koepernik and H. Eschrig, Phys. Rev. B 59, 1743
(1999).[21] J. P. Perdew, K. Burke, and M. Ernzerhof, Phys. Rev.
Lett. 77, 3865 (1996).[22] J. P. Perdew and Y. Wang, Phys. Rev. B 45, 13244
(1992).[23] T. Kenichi, J. Appl. Phys. 89, 662 (2001).[24] N. Sata, G. Shen, M. L. Rivers and S. R. Sutton, Phys.
Rev. B 65, 104114 (2002).[25] R. J. Hemley et al., Phys. Rev. B 39, 11820 (1989).[26] H. J. Beister, S. Haag, R. Kniep, K. Strossner and K.
Syassen, Angew. Chem. Int. Ed. 27, 1101 (1988).[27] J. C. Schon et al., J. Mater. Chem. 11, 69 (2001).[28] Y. Meng, H. Mao, P. J. Eng, T. P. Trainor, M. Newville,
M. Y. Hu, C. Kao, J. Shu, D. Hausermann and R. J.Hemley, Nat. Mater. 3, 111 (2004).
[29] S. K. Lee, P. J. Eng, H. Mao, Y. Meng, M. Newville, M.Y. Hu and J. Shu, Nat. Mater. 4, 851 (2005).
[30] U. Bergmann, O. C. Mullins and S. P. Cramer, Anal.Chem. 72, 2609 (2000).
[31] P. E. Batson, Phys. Rev. B 48, 2608 (1993).[32] J. Robertson, Phys. Rev. B 29, 2131 (1984).[33] A. Catellani, M. Posternak, A. Baldereschi, H. J. F.
Jansen and A. J. Freeman, Phys. Rev. B 32, 6997 (1985).[34] B. Reihl, J. K. Gimzewski, J. M. Nicholls and E. Tosatti,
Phys. Rev. B 33, 5770 (1986).[35] Th. Fauster, F. J. Himpsel, J. E. Fischer and E. W. Plum-
mer, Phys. Rev. Lett. 51, 430 (1983).[36] G. Csanyi, P. B. Littlewood, A. H. Nevidomskyy, C. J.
Pickard and B. D. Simons, Nature Physics 1, 42 (2005).
8
[37] X. Blase, A. Rubio, S. G. Louie and M. L. Cohen, Phys.Rev. B 51, 6868 (1995).
[38] A. Koma, K. Miki, H. Suematsu, T. Ohno and H.Kamimura, Phys. Rev. B 34, 2434 (1986).
[39] H. Schulz and K. H. Thiemann, Acta Cryst. A35, 309(1979).
[40] R. Buczko, G. Duscher, S. J. Pennycook and S. T. Pan-telides, Phys. Rev. Lett. 85, 2168 (2000).
[41] A. Soininen, Academic Dissertation, University ofHelsinki (2001).
[42] E. L. Shirley, Phys. Rev. Lett. 80, 794 (1998); Eric L.Shirley, J. A. Soininen, G. P. Zhang, J. A. Carlisle, T.A. Callcott, D. L. Ederer, L. J. Terminello and R. C. C.Perera, J. of Electron Spectrosc. Relat. Phenom. 114-116, 939 (2001).
[43] J. C. Boettger, Phys. Rev. B 33, 6788 (1986).[44] A. R. Oganov, M. J. Gillan, G. D. Price, J. Chem. Phys.
118, 10174 (2003).[45] J. L. Feldman, B. M. Klein, M. J. Mehl and H. Krakauer,
Phys. Rev. B 42, 2752 (1990).[46] D. A. Young, A. K. McMahan and M. Ross, Phys. Rev.
B 24, 5119 (1981).[47] S. Fahy, K. J. Chang, S. G. Louie and M. L. Cohen, Phys.
Rev. B 35, 5856 (1987).[48] R.M. Wentzcovitch, K. J. Chang and M. L. Cohen, Phys.
Rev. B 34, 1071 (1986).[49] D. L. Camphausen, G. A. N. Connell and W. Paul, Phys.
Rev. Lett. 26, 184 (1971).[50] K. Kim, W. R. L. Lambrecht and B. Segall, Phys. Rev.
B 53, 16310 (1996).[51] A. K. McMahan, Physica B+C, 139-140, 31 (1986); A.
K. McMahan and R. C. Albers, Phys. Rev. Lett. 49, 1198(1982).
[52] J. Clerouin, Y. Laudernet, V. Recoules and S. Mazevet,Phys. Rev. B 72, 155122 (2005).
[53] A. Zunger and A. J. Freeman, Phys. Rev. B 16, 2901(1977).