Embed Size (px)
Citation preview

Press conference: "Funds Outlook for 2012"
Steigenberger Hotel Herrenhof
Vienna, 24 January 2012

Funds Outlook 2012
Your dialogue partners
Heinz BEDNAR Chairman of the Managing Board (CEO)
Harald EGGERHead of the Investment Division (CIO)
Gerhard WINZER Chief economist

Review, update on investment policy
Heinz Bednar,
Chairman of the Managing Board (CEO)

Market review
Almost every asset class delivered positive returns in December
All markets were positive over the last 3 months as well, apart from CEE and eurozone bonds
But the negative trend still prevailed on the equity markets last year
Source: ERSTE-SPARINVEST, Datastream
-3M -12M
-3M -12M
Equities, developed markets 7.90% -5.00%
Equities, emerging markets 4.90% -12.50%
Inflation-indexed bonds -2.30% -1.10%
EUR government bonds -0.60% 3.30%
EUR investment-grade corporate bonds 1.30% 2.00%
EUR high-yield corporate bonds 4.30% -2.50%
USD government bonds 1.00% 10.00%
USD investment-grade corporate bonds 1.70% 8.00%
USD high-yield corporate bonds 6.00% 4.30%
US mortgage-backed securities 0.90% 6.70%
GBP government bonds 5.50% 17.40%
JPY government bonds 0.70% 3.20%
CEE government bonds -1.40% 1.40%
Corporate bonds, emerging markets, hard currency 5.40% 2.40%
Government bonds, emerging markets, hard currency 4.00% 6.80%
Government bonds, emerging markets, local currency 3.80% 1.50%
EUR money market 0.40% 1.30%

"Sustainable" experience
Fund volume based on sustainability criteria currently totals approximately
EUR 630 million
Funds Outlook 2012

"Cluster munitions" removed from portfolios
- Since 1 January 2012 there are no "cluster munitions" in the portfolios managed by ERSTE-SPARINVEST
- This is in line with the UN "Oslo Convention"
- Wolfgang Pinner appointed as "Chief Sustainability Investment Officer"
Hunting for returns with fund investment strategies for 2011 21.01.2011 - Page 6

Sovereign debt crisis: fragile, below-average recovery
Gerhard Winzer,
Chief economist

High sovereign debt
Sovereign debt growing
faster than nominal GDP.
Solutions:
real economic growth nominal economic growth insolvency transfers financial repression
=> stress in financial sector Crisis of confidence
Source: IMF, Bloomberg
Staatsschulden, % BIP
0
25
50
75
100
125
1994 1996 1998 2000 2002 2004 2006 2008 2010 2012 2014 2016
Entwickelte Volkswirtschaften
Zentral- und Osteuropa
Gemeinschaft unabhängiger Staaten
Emerging Asien
Lateinamerika
Renditen von Staatsanleihen, 10 Jahre, %
0
1
2
3
4
5
6
7
8
9
10
11
12
01/99 01/00 01/01 01/02 01/03 01/04 01/05 01/06 01/07 01/08 01/09 01/10 01/11 01/12
UngarnItalienDeutschland

1) Fiscal and transfer union including federal bonds: not yet => Mitigating free-rider problem (moral hazard) => high consolidation pressure so far: expanded growth and stability pact (rules-based) required: ex ante approval of budget
2) Common economic policy: pro-cyclical fiscal policy Imbalances (current account, competition)
3) Provision of emergency liquidity (lender of last resort): ECB: so far only for banks (official) => Countries: EFSF, ESM, IMF
Moving slowly towards fiscal union?The less we see points one and two fulfilled, the more the pressure will mount on the ECB to prevent a collapse of EMU.
Does the euro have a future?

Fragile, below-average recovery Global slowdown in economic activity. Weak growth for 2012. Risks are on the downside.
Eurozone: escalation China: "hard" landing USA: budget consolidation Oil price, geopolitical situation (Iran)
Emerging Markets still have great potential
stable or improving credit ratings appreciating currencies
De-coupling not an option Global imbalances slowly evening out
Source: Erste-Sparinvest, IMF
BIP-Wachstum, %, pro Jahr
-4
-2
0
2
4
6
8
10
2004 2005 2006 2007 2008 2009 2010 2011 2012
Emerging Markets
Entwickelte Volkswirtschaften
BIP pro Kopf, Kaufkraftparitäten, USD
0
10,000
20,000
30,000
40,000
En
twic
kelt
eV
olk
swir
tsch
afte
n
Zen
tral
- u
nd
Ost
euro
pa
Gem
ein
sch
aft
un
abh
äng
iger
Sta
aten
Em
erg
ing
Asi
en
AS
EA
N-5
Lat
ein
amer
ika

Inflation low and falling
Low inflation / deflationary pressure in developed economies: Debt reduction Low utilisation of resources
Inflationary risks in developed economies: Growing supply of money
but demand for money rising too central bank could reduce money supply if
need be.
Emerging markets (sustained currency appreciation and higher prices) Sustained growth in commodity prices Tax hikes, higher regulated prices
Konsumentenpreisinflation, %, pro Jahr
0
2
4
6
8
2004 2005 2006 2007 2008 2009 2010 2011 2012
Emerging Markets
Entwickelte Volkswirtschaften
Source: ERSTE-SPARINVEST

Very loose monetary policy
Zero / low-interest policy Quantitative easing: purchase of assets (government and bank bonds) Provision of emergency liquidity for banks and governments (lender of last resort) Communication: higher transparency
This means the debt problem dominates inflation targets in many developed economies.
Emerging markets: scope for moderate interest cuts exception: countries with risks regarding inflation and currency depreciation
Source: Bloomberg, ECB
EZB, Gesamtvermögen, Euro, Milliarden
0
500
1,000
1,500
2,000
2,500
3,000
01/99 01/00 01/01 01/02 01/03 01/04 01/05 01/06 01/07 01/08 01/09 01/10 01/11 01/12
EWU, Bankensektor, Kredite, Milliarden
0
1000
2000
3000
4000
5000
6000
7000
8000
9000
10000
11000
06/99 06/00 06/01 06/02 06/03 06/04 06/05 06/06 06/07 06/08 06/09 06/10 06/11

Assessment of bond and equity markets
Heinz Bednar,
Chairman of the Management Board (CEO)
Harald Egger,
Chief Investment Officer (CIO)

Asset Allocation 2012
Note: analysis as of January 2012; changes may be made at any timeNote: analysis as of January 2012; changes may be made at any time
unattraktivwenig
attraktiv neutral attraktivsehr
attraktiv
Euro Staatsanleihen AAA-AA mEuro Staatsanleihen AAA-BBB mUS MBS mInvestment Grade Unternehmensanleihen EUR mInvestment Grade Unternehmensanleihen USD mHigh Yield Unternehmensanleihen EUR mHigh Yield Unternehmensanleihen USD mStaatsanleihen EM, Hartwärung mStaatsanleihen CEE mUnternehmensanleihen EM, Hartwährung mAktien, entwickelte Märkte mAktien EM mGold mImmobilien mRohstoffe m

Funds Outlook 2012
Eurozone: Government bonds
- Government debt crisis is pushing yields on top-quality government bonds to extremely low levels
- What is more, the downturn in economic activity, declining inflation and interest-rate cuts are keeping yields persistently low.
Source: Thomson Reuters Datastream
10jährige Rendite Deutschland
2007 2008 2009 2010 2011 20121.5
2.0
2.5
3.0
3.5
4.0
4.5
5.0
1.5
2.0
2.5
3.0
3.5
4.0
4.5
5.0
GERMANY GOVERNMENT BOND 10 YEARPrognose Erste Research

Funds Outlook 2012
Corporate bonds – investment grade
- Stable corporate figures
- Low interest rates, high liquidity
- Low bankruptcy rates
- Increased uncertainty is priced in
- Moderate economic growth in USA
- Mild recession in eurozone
- Corporate bonds: USA more attractive than eurozone
Source: Thomson Reuters Datastream
2007 2008 2009 2010 20113
4
5
6
7
8
3
4
5
6
7
8
2007 2008 2009 2010 201180
100
120
140
80
100
120
140
BOFA ML EMU CORP. (E) - RENDITEBOFA ML EMU CORP. (E) - PERFORMANCE
EUR corporate bonds IG: yield level and performance (-5 years) EUR corporate bonds IG: yield level and performance (-5 years)

Funds Outlook 2012
Emerging market bonds in hard currency
- Sovereign debt as percentage of nominal GDP is far lower than in developed economies on average.
- Chinese economic growth will be somewhat more moderate, but a "hard" landing can be avoided.
- EM credit ratings continue to improve. In the long run this means stable or falling yield spreads on credit risk.
Source: Thomson Reuters Datastream
2007 2008 2009 2010 20110
2
4
6
8
10
12
0
2
4
6
8
10
12
2007 2008 2009 2010 201150
100
150
50
100
150
JPM EMBI GLB.DIVERS COMPOSITE - RENDITEJPM EMBI GLB.DIVERS COMPOSITE - SPREADJPM EMBI GLB.DIVERS COMPOSITE - PERFORMANCE
Emerging market bonds, hard currencies: yield level and performance (-5 years) Emerging market bonds, hard currencies: yield level and performance (-5 years)

Hunting for returns with fund investment strategies for 2012 21.01.2011 - Page 18
Emerging market bonds in local currency
- Emerging markets (EM) still have great potential. This means real effective exchange rates will appreciate in the long run (by means of higher prices and stronger currencies) and average interest rates will also be higher than in the eurozone.
- With some exceptions, economic policies in many countries have greater room for manoeuvre than developed economies to compensate for contracting economic activity
Source: Thomson Reuters Datastream
2007 2008 2009 2010 20116.0
6.5
7.0
7.5
8.0
8.5
9.0
6.0
6.5
7.0
7.5
8.0
8.5
9.0
2007 2008 2009 2010 2011
100
120
140
160
100
120
140
160
JPM GBI-EM GLOBAL DIV in EUR - RENDITEJPM GBI-EM GLOBAL DIV in EUR - PERFORMANCE
Emerging market bonds, local currencies: yield level and performance (-5 years) Emerging market bonds, local currencies: yield level and performance (-5 years)

Funds Outlook 2012
Central and Eastern European bonds
- Economic growth in Central and Eastern Europe (including Turkey and Russia) will slow down considerably this year to roughly 2.4%, while the long-term growth potential sits around 4%.
- The Achilles heels of the CEE region are the high external debt (66% of GDP) and the current account deficit (5.4% of GDP).
- The crucial issue in Hungary is whether an agreement will be reached this year with the IMF on a loan.
Source: Thomson Reuters Datastream
2007 2008 2009 2010 20114.5
5.0
5.5
6.0
6.5
7.0
7.5
8.0
4.5
5.0
5.5
6.0
6.5
7.0
7.5
8.0
2007 2008 2009 2010 201180
100
120
140
80
100
120
140
BOFA ML EMERGING EURO GVT (E) - RENDITEBOFA ML EMERGING EURO GVT (E) - PERFORMANCE
CEE bonds: yield level and performance (-5 years) CEE bonds: yield level and performance (-5 years)

Equities as early indicators
Global equities (MSCI World in EUR)
Source: Bloomberg
The MSCI World Index (€) has made up the losses suffered in the last quarter of 2011 (mainly thanks to the strong dollar).
It is still on an upward trend.
This year we expect to see continued gains in prices, but there is also likely to be greater volatility.
700,00
750,00
800,00
850,00
900,00
950,00
1000,00
1050,00
15.0
1.20
10
15.0
2.20
10
15.0
3.20
10
15.0
4.20
10
15.0
5.20
10
15.0
6.20
10
15.0
7.20
10
15.0
8.20
10
15.0
9.20
10
15.1
0.20
10
15.1
1.20
10
15.1
2.20
10
15.0
1.20
11
15.0
2.20
11
15.0
3.20
11
15.0
4.20
11
15.0
5.20
11
15.0
6.20
11
15.0
7.20
11
15.0
8.20
11
15.0
9.20
11
15.1
0.20
11
15.1
1.20
11
15.1
2.20
11
15.0
1.20
12
Funds Outlook 2012

Markets undervalued – what is priced in?
Fair Value- USA
10
100
1000
10000
-60,0%
-40,0%
-20,0%
0,0%
20,0%
40,0%
60,0%
80,0%Abw. FV
Abw. FV
MSCI USA U$ - PRICE INDEX
FV
MSCI USA U$ - PRICE INDEX
FV
Source: own calculations, Datastream
"Fair value" model for US equities

Businesses are very profitable
Source: ERSTE-SPARINVEST, own calculations, as of end-2010
*) ROE = return on equity
6
8
10
12
14
16
Dez
.91
Dez
.92
Dez
.93
Dez
.94
Dez
.95
Dez
.96
Dez
.97
Dez
.98
Dez
.99
Dez
.00
Dez
.01
Dez
.02
Dez
.03
Dez
.04
Dez
.05
Dez
.06
Dez
.07
Dez
.08
Dez
.09
Dez
.10
Dez
.11
RoE durschn. RoE
Source: own calculations, DatastreamFunds Outlook 2012
Powerful recovery in return on equity in 2011 *)

Markets price in flat profits
-60%
-40%
-20%
0%
20%
40%
60%
80%
100%
120%
Jän
.76
Jän
.78
Jän
.80
Jän
.82
Jän
.84
Jän
.86
Jän
.88
Jän
.90
Jän
.92
Jän
.94
Jän
.96
Jän
.98
Jän
.00
Jän
.02
Jän
.04
Jän
.06
Jän
.08
Jän
.10
EPS Gr 1Y
S&P 1Y
Annual earnings growth (corporate profits) compared to rolling 1-year performance of S&P Index
Source: own calculations, Datastream, January 2012

... priced attractively to "fair"
Indicators of global equity markets
Source: ERSTE-SPARINVEST, Bloomberg, January 2012
P/E Dvd YldS&P 500 13,6 2,07NASDAQ 23,27 1,04BRAZIL BOVESPA 9,83 3,82
Euro Stoxx 50 11,25 4,97FTSE 100 10,08 3,82CAC 40 9,53 4,77DAX 10,61 3,83IBEX 8,99 5,57SMX 14,81 2,49Russian RTS 5,33 2,35Turkey ISE 30 10,36 2,99
NIKKEI 225 10,09 2,21HANG SENG 8,92 3,48
- Equities attractively valued, especially by historical comparison.
- High dividend yield is striking (especially compared to bond yields).
- Equities attractively valued, especially by historical comparison.
- High dividend yield is striking (especially compared to bond yields).
Funds Outlook 2012
25
Source: Thomson Reuters Datastream
0,90
0,95
1,00
1,05
1,10
1,15
1,20
1,25
0,9
1,0
1,1
1,2
1,3
1,4
1,5
0,85
0,90
0,95
1,00
1,05
1,10
0,85
0,90
0,95
1,00
1,05
1,10
1,15
1,20
0,90
0,95
1,00
1,05
1,10
1,15
1,20
1,25
0,7
0,8
0,9
1,0
1,1
1,2
1,3
0,7
0,8
0,9
1,0
1,1
1,2
0,9
1,0
1,1
1,2
1,3
1,4
1,5
2008 2009 2010 20110,9
1,0
1,1
1,2
1,3
2008 2009 2010 20110,6
0,7
0,8
0,9
1,0
1,1
Consumer Discretionary Consumer Staples
Industrials Telecoms
Technology Utilities
Materials Health Care
Energy Financials
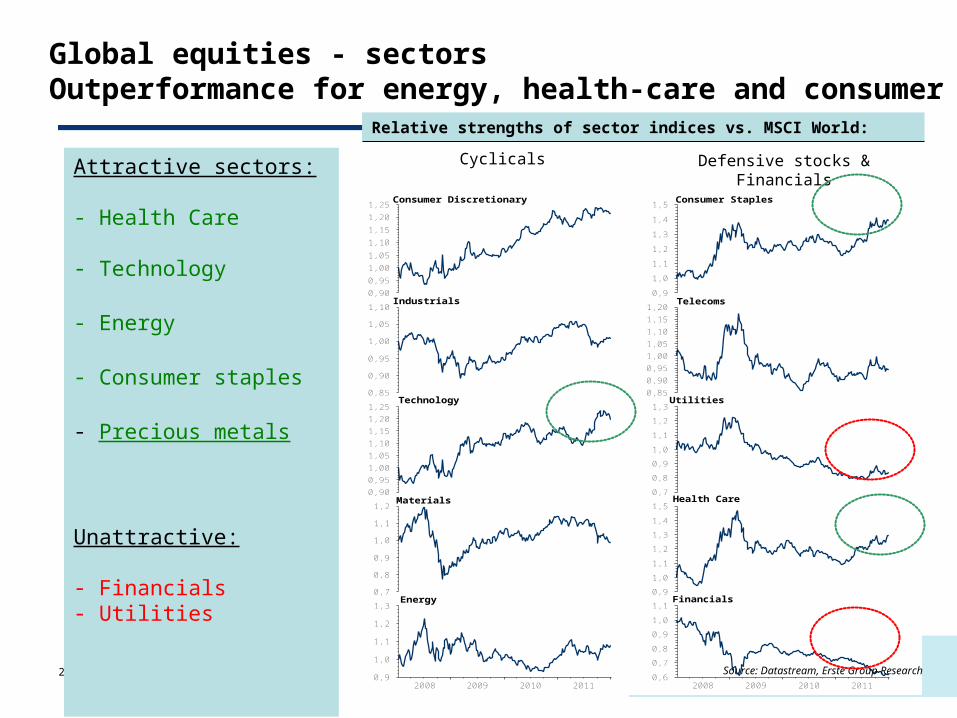
Global equities - sectors Outperformance for energy, health-care and consumer stocks
Source: Datastream, Erste Group Research
Relative strengths of sector indices vs. MSCI World:
Defensive stocks & FinancialsCyclicalsAttractive sectors:
- Health Care - Technology
- Energy
- Consumer staples
- Precious metals
Unattractive:
- Financials- Utilities

Regional allocation
Equity regions Weighting vs. MSCI World in EUR
North America
Western Europe
Japan
Emerging markets
Under Neutral Over
Note: analysis of equity regions as of January 2012; changes may be made at any time
Funds Outlook 2012

Recommendations
Heinz Bednar
Chairman of the Managing Board

Annual assessment - 2012
- Debt problem in developed economies: strong demand for top-quality government bonds that offer no yields
recommendation for emerging market government bonds where credit rating is improving
- To prevent a collapse, central banks in developed economies are creating a lot of liquidity. This is increasing the pressure for EM currency appreciation
local currencies in the emerging markets
- Moderate growth and high liquidity
USA, corporate bonds
- Countries where growth is no longer slowing; high liquidity and attractive valuations
USA, equities
Funds Outlook 2012

Funds in Focus
Asset class Investment fund Comment
Interest-bearing investments; bonds
ESPA BOND RISING MARKETS
Emerging market government bonds
Equities ESPA VINIS STOCK GLOBAL Global sustainable equities, focus on developed stock markets
Funds Outlook 2012

Disclaimer
This is an advertisement. Unless otherwise specified, the data comes from ERSTESPARINVEST KAG. We communicate in German and in English. The prospectus (together with any
amendments) was published in the "Official Gazette of the Wiener Zeitung" according to the provisions of the 1993 Investment Fund Act as amended, and is available free of charge at the head office of
ERSTE-SPARINVEST Kapitalanlagegesellschaft m.b.H. as well as at the head office of Erste Group Bank AG (custodian bank). The exact date of the last publication along with all the other places it can
be uplifted from are listed on the ERSTE-SPARINVEST KAG website (www.sparinvest.com). This document provides additional information for our investors and is based on the knowledge of those
entrusted with compiling the document as of the editorial deadline. Our analyses and conclusions are general in nature and do not take into account the individual requirements of our investors with regard
to return, taxation or risk appetite. Past performance is not a reliable indicator of the future performance of a fund. Please note that alongside the outlined opportunities, investing in securities
also implies risks. Subject to printing errors and mistakes.