Embed Size (px)
Citation preview
James QuinceyPresident and Chief Executive Officer
BEVERAGES FOR LIFE
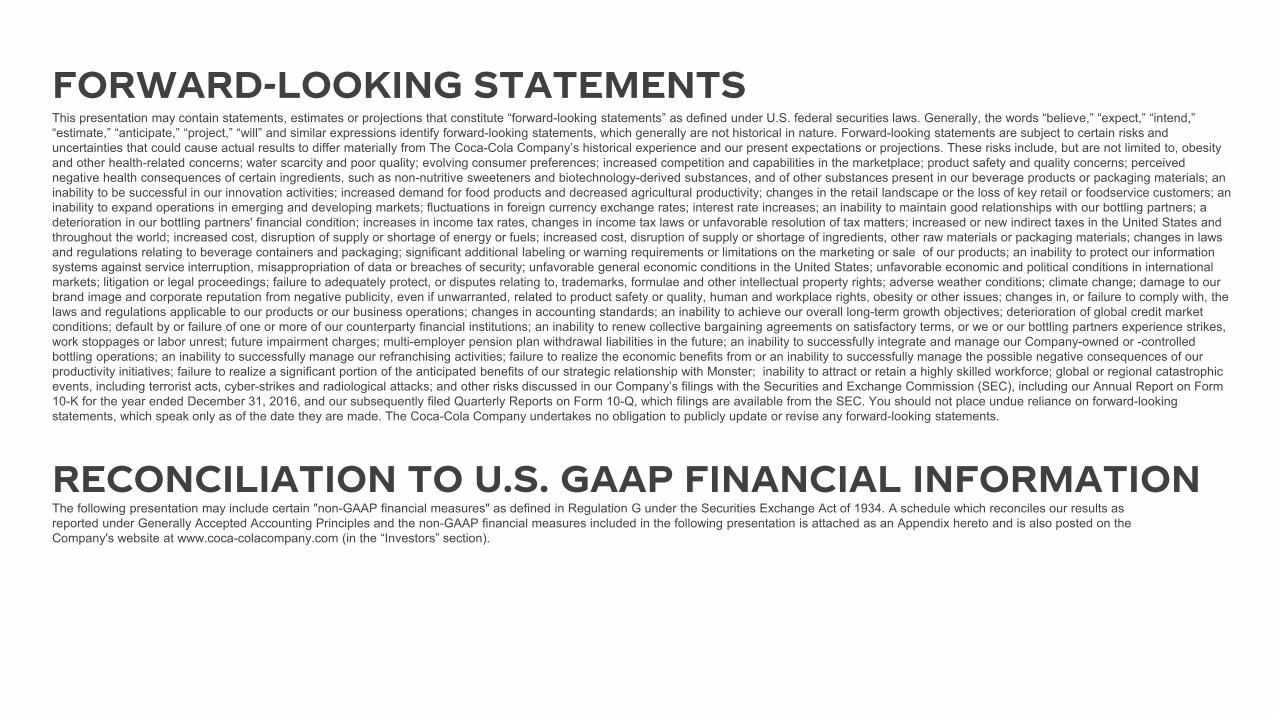
The following presentation may include certain "non-GAAP financial measures" as defined in Regulation G under the Securities Exchange Act of 1934. A schedule which reconciles our results as reported under Generally Accepted Accounting Principles and the non-GAAP financial measures included in the following presentation is attached as an Appendix hereto and is also posted on the Company's website at www.coca-colacompany.com (in the “Investors” section).
This presentation may contain statements, estimates or projections that constitute “forward-looking statements” as defined under U.S. federal securities laws. Generally, the words “believe,” “expect,” “intend,” “estimate,” “anticipate,” “project,” “will” and similar expressions identify forward-looking statements, which generally are not historical in nature. Forward-looking statements are subject to certain risks and uncertainties that could cause actual results to differ materially from The Coca-Cola Company’s historical experience and our present expectations or projections. These risks include, but are not limited to, obesity and other health-related concerns; water scarcity and poor quality; evolving consumer preferences; increased competition and capabilities in the marketplace; product safety and quality concerns; perceived negative health consequences of certain ingredients, such as non-nutritive sweeteners and biotechnology-derived substances, and of other substances present in our beverage products or packaging materials; an inability to be successful in our innovation activities; increased demand for food products and decreased agricultural productivity; changes in the retail landscape or the loss of key retail or foodservice customers; an inability to expand operations in emerging and developing markets; fluctuations in foreign currency exchange rates; interest rate increases; an inability to maintain good relationships with our bottling partners; a deterioration in our bottling partners' financial condition; increases in income tax rates, changes in income tax laws or unfavorable resolution of tax matters; increased or new indirect taxes in the United States and throughout the world; increased cost, disruption of supply or shortage of energy or fuels; increased cost, disruption of supply or shortage of ingredients, other raw materials or packaging materials; changes in laws and regulations relating to beverage containers and packaging; significant additional labeling or warning requirements or limitations on the marketing or sale of our products; an inability to protect our information systems against service interruption, misappropriation of data or breaches of security; unfavorable general economic conditions in the United States; unfavorable economic and political conditions in international markets; litigation or legal proceedings; failure to adequately protect, or disputes relating to, trademarks, formulae and other intellectual property rights; adverse weather conditions; climate change; damage to our brand image and corporate reputation from negative publicity, even if unwarranted, related to product safety or quality, human and workplace rights, obesity or other issues; changes in, or failure to comply with, the laws and regulations applicable to our products or our business operations; changes in accounting standards; an inability to achieve our overall long-term growth objectives; deterioration of global credit market conditions; default by or failure of one or more of our counterparty financial institutions; an inability to renew collective bargaining agreements on satisfactory terms, or we or our bottling partners experience strikes, work stoppages or labor unrest; future impairment charges; multi-employer pension plan withdrawal liabilities in the future; an inability to successfully integrate and manage our Company-owned or -controlled bottling operations; an inability to successfully manage our refranchising activities; failure to realize the economic benefits from or an inability to successfully manage the possible negative consequences of our productivity initiatives; failure to realize a significant portion of the anticipated benefits of our strategic relationship with Monster; inability to attract or retain a highly skilled workforce; global or regional catastrophic events, including terrorist acts, cyber-strikes and radiological attacks; and other risks discussed in our Company’s filings with the Securities and Exchange Commission (SEC), including our Annual Report on Form 10-K for the year ended December 31, 2016, and our subsequently filed Quarterly Reports on Form 10-Q, which filings are available from the SEC. You should not place undue reliance on forward-looking statements, which speak only as of the date they are made. The Coca-Cola Company undertakes no obligation to publicly update or revise any forward-looking statements.
RECONCILIATION TO U.S. GAAP FINANCIAL INFORMATION
FORWARD-LOOKING STATEMENTS

CLEAR DESTINATION
• Accelerating Our Move to a Total Beverage Portfolio
• Returning to a Brand-Focused Organization
• Driving Cultural Change
1
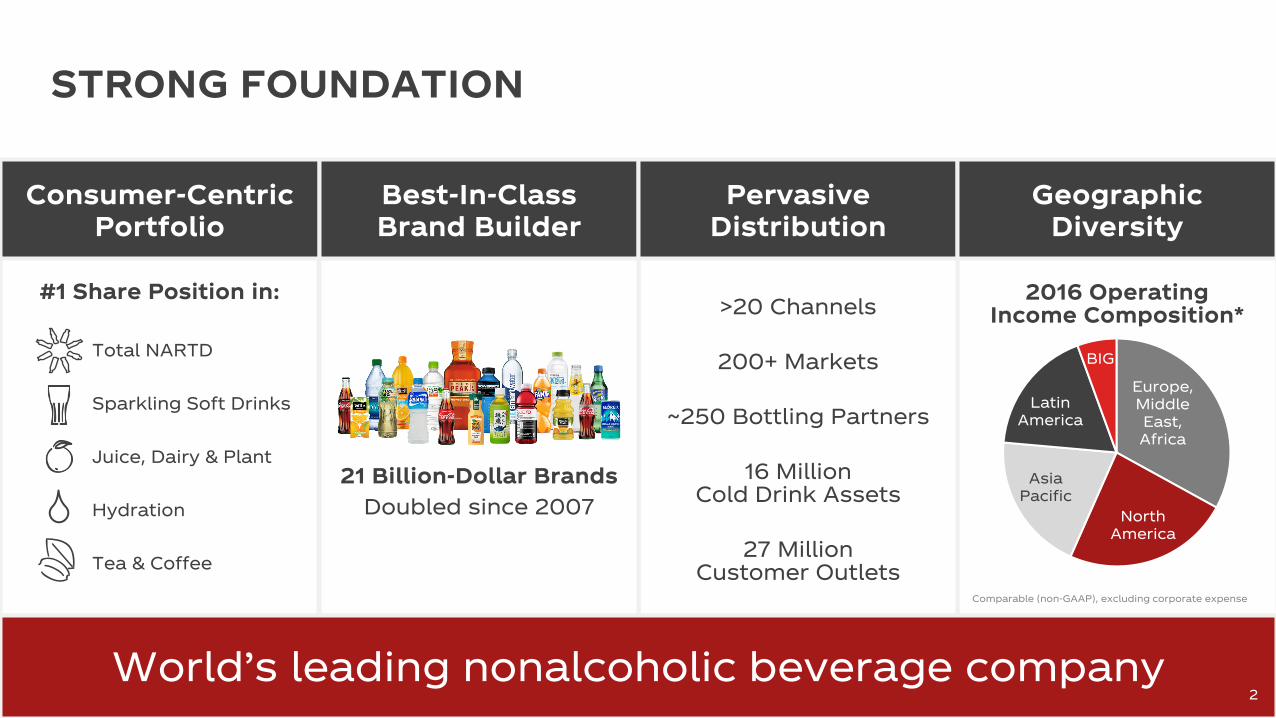
>20 Channels
200+ Markets
~250 Bottling Partners
16 Million Cold Drink Assets
27 Million Customer Outlets
Consumer-Centric Portfolio
Best-In-Class Brand Builder
Pervasive Distribution
Geographic Diversity
STRONG FOUNDATION
World’s leading nonalcoholic beverage company
21 Billion-Dollar BrandsDoubled since 2007
#1 Share Position in:
Total NARTD
Sparkling Soft Drinks
Juice, Dairy & Plant
Hydration
Tea & Coffee
2016 Operating Income Composition*
Europe, Middle East, Africa
North America
Asia Pacific
Latin America
BIG
Comparable (non-GAAP), excluding corporate expense
2
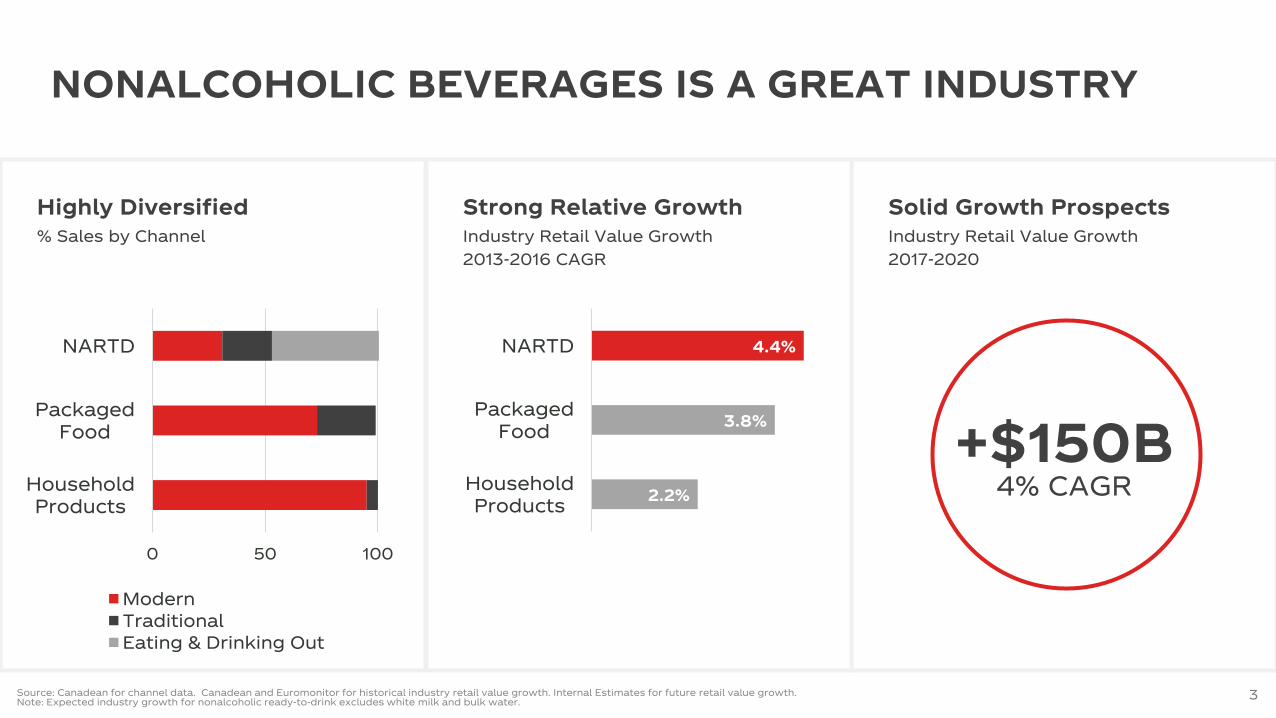
Industry Retail Value Growth2013-2016 CAGR
Industry Retail Value Growth2017-2020
% Sales by Channel
Source: Canadean for channel data. Canadean and Euromonitor for historical industry retail value growth. Internal Estimates for future retail value growth.Note: Expected industry growth for nonalcoholic ready-to-drink excludes white milk and bulk water.
+$150B4% CAGR
0 50 100
HouseholdProducts
PackagedFood
NARTD
ModernTraditionalEating & Drinking Out
Strong Relative Growth Solid Growth ProspectsHighly Diversified
NONALCOHOLIC BEVERAGES IS A GREAT INDUSTRY
2.2%
3.8%
4.4%
HouseholdProducts
PackagedFood
NARTD
3

THE FMCG LANDSCAPE IS UNDERGOING FUNDAMENTAL CHANGES
Consumer Preferences Digital Evolution Regulation / Taxes
4
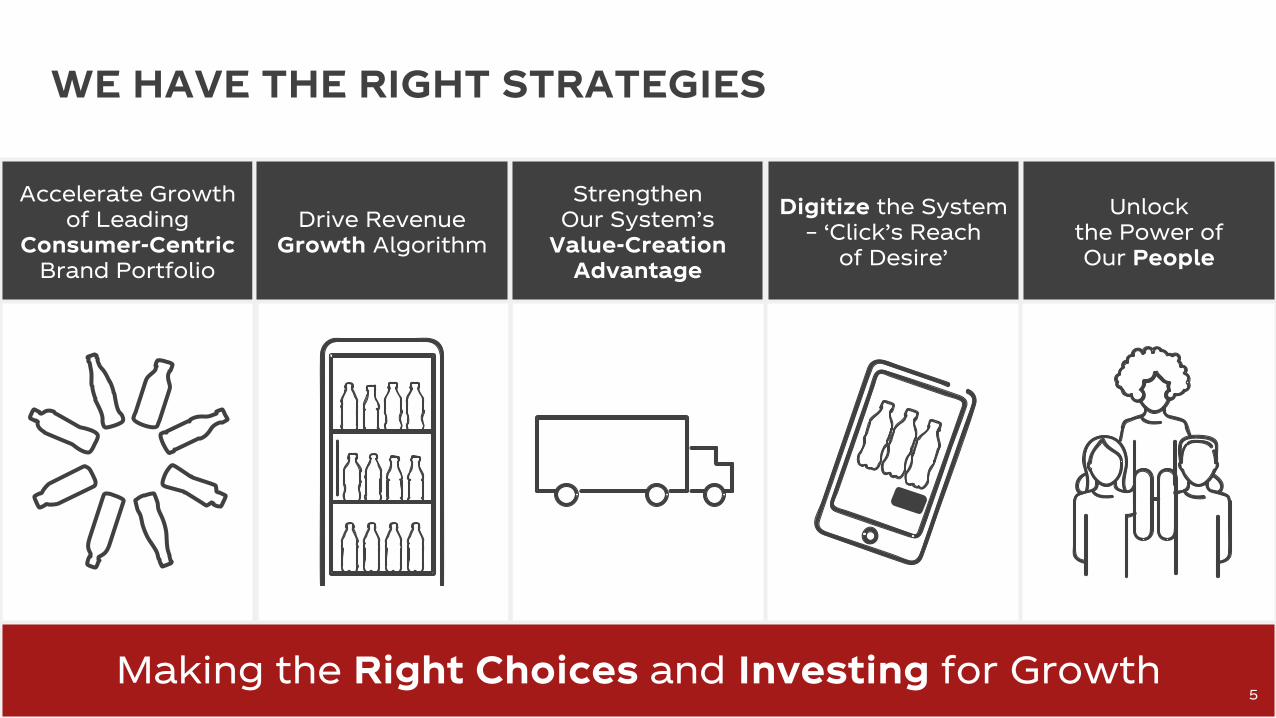
WE HAVE THE RIGHT STRATEGIES
Making the Right Choices and Investing for Growth
Accelerate Growth of Leading
Consumer-Centric Brand Portfolio
Drive Revenue Growth Algorithm
Strengthen Our System’s
Value-Creation Advantage
Digitize the System – ‘Click’s Reach
of Desire’
Unlock the Power ofOur People
5
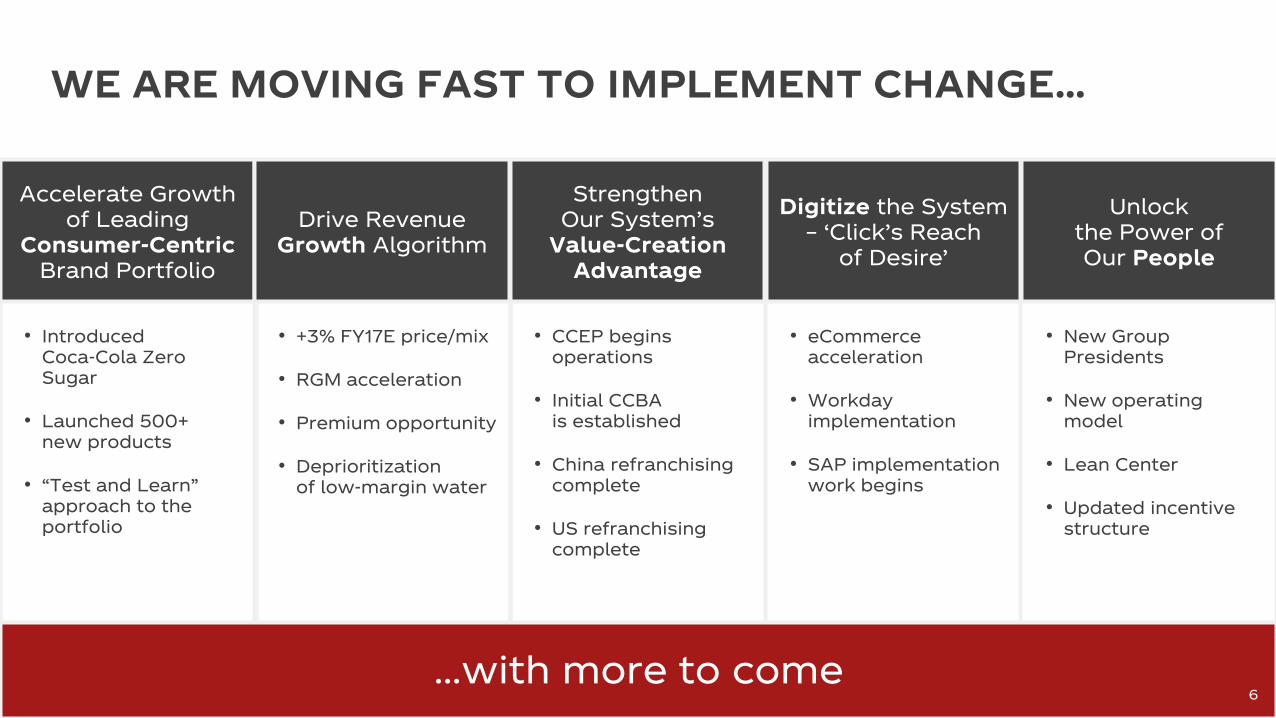
…with more to come
WE ARE MOVING FAST TO IMPLEMENT CHANGE…
• Introduced Coca-Cola Zero Sugar
• Launched 500+ new products
• “Test and Learn” approach to the portfolio
• +3% FY17E price/mix
• RGM acceleration
• Premium opportunity
• Deprioritizationof low-margin water
• CCEP begins operations
• Initial CCBAis established
• China refranchising complete
• US refranchising complete
• eCommerce acceleration
• Workday implementation
• SAP implementation work begins
• New Group Presidents
• New operating model
• Lean Center
• Updated incentive structure
6
Accelerate Growth of Leading
Consumer-Centric Brand Portfolio
Drive Revenue Growth Algorithm
Strengthen Our System’s
Value-Creation Advantage
Digitize the System – ‘Click’s Reach
of Desire’
Unlock the Power ofOur People
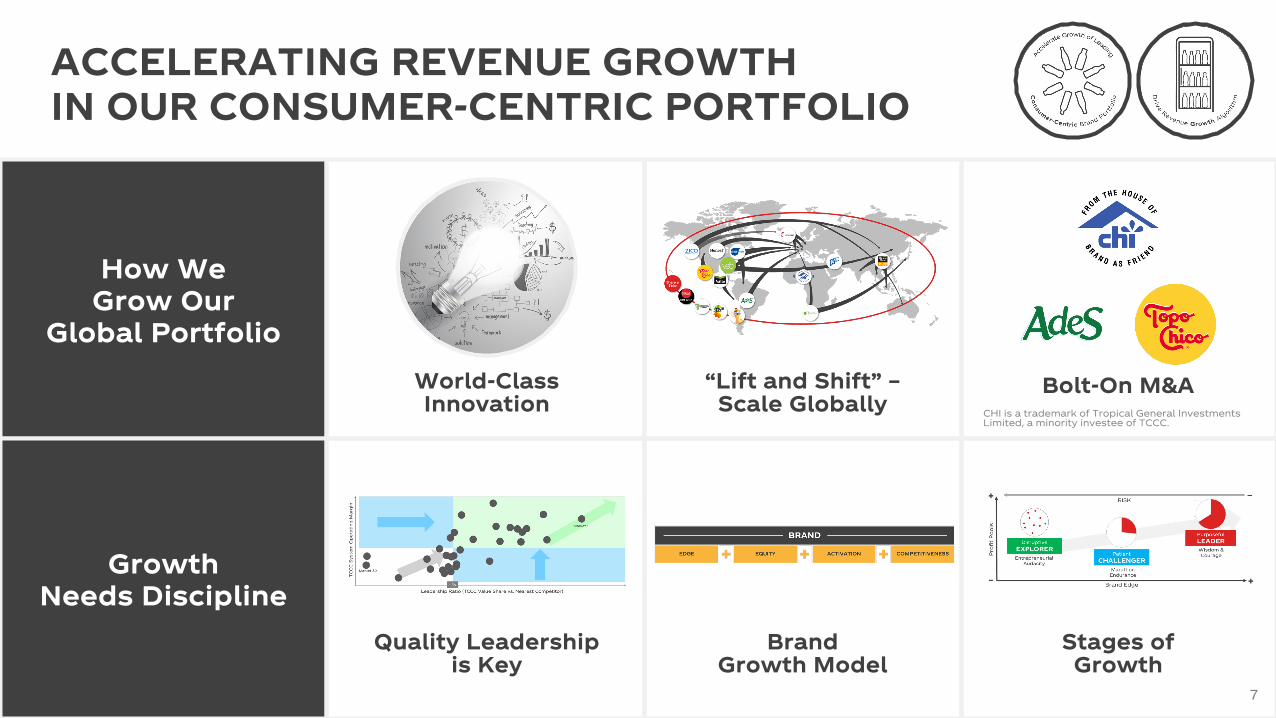
How We Grow Our
Global Portfolio
Growth Needs Discipline
World-Class Innovation
“Lift and Shift” –Scale Globally
Bolt-On M&A
Brand Growth Model
Stages of Growth
Quality Leadership is Key
ACCELERATING REVENUE GROWTHIN OUR CONSUMER-CENTRIC PORTFOLIO
7
CHI is a trademark of Tropical General Investments Limited, a minority investee of TCCC.
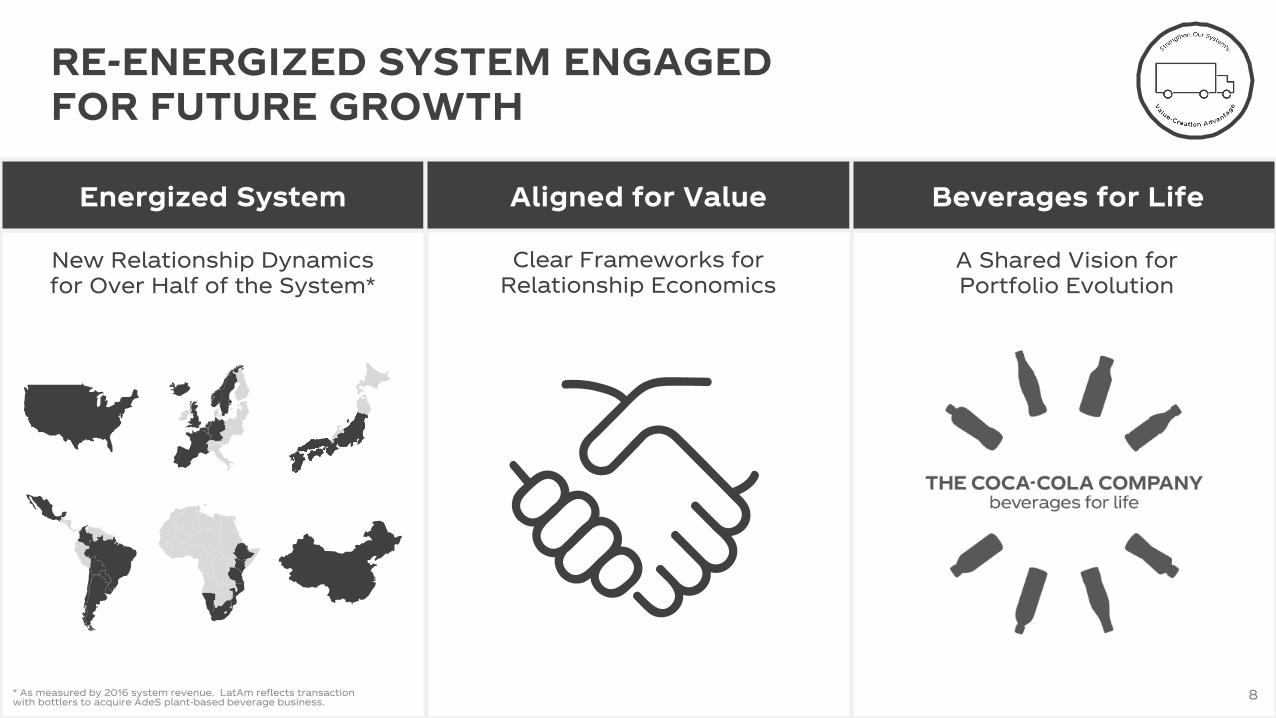
Energized System Aligned for Value Beverages for Life
RE-ENERGIZED SYSTEM ENGAGED FOR FUTURE GROWTH
New Relationship Dynamics for Over Half of the System*
* As measured by 2016 system revenue. LatAm reflects transaction with bottlers to acquire AdeS plant-based beverage business.
A Shared Vision for Portfolio Evolution
Clear Frameworks for Relationship Economics
8
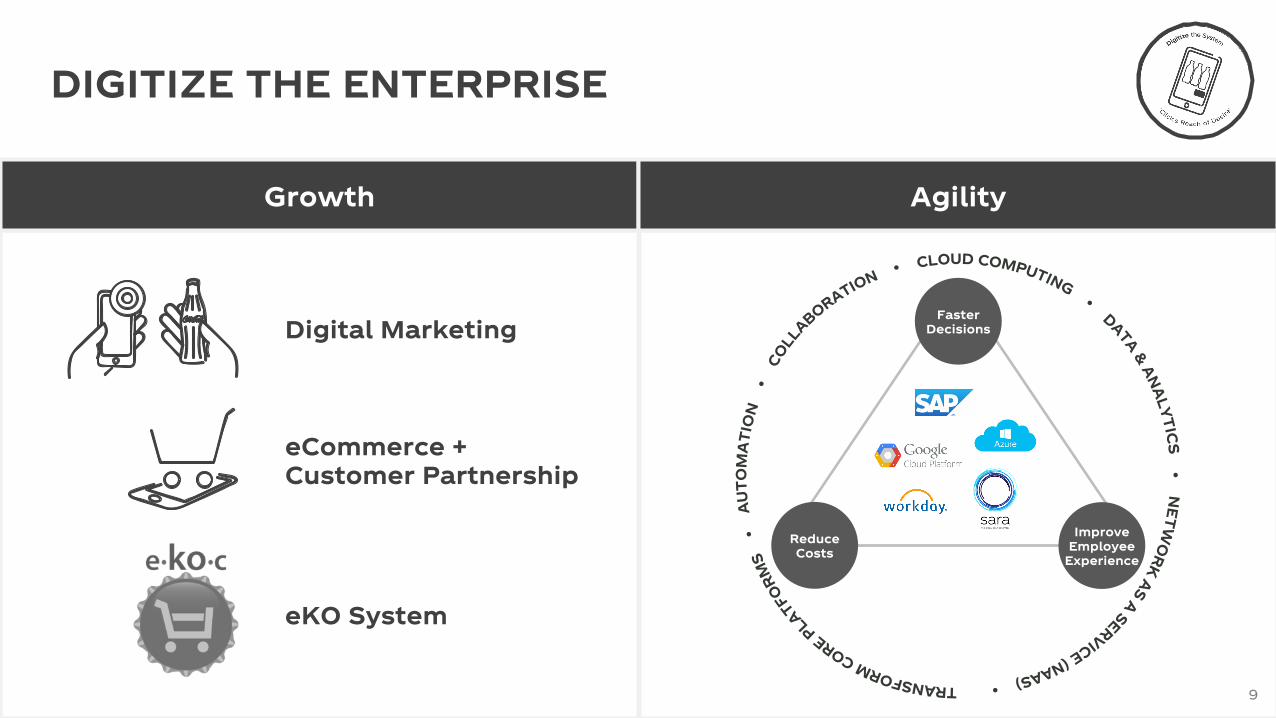
DIGITIZE THE ENTERPRISE
Growth Agility
FasterDecisions
ImproveEmployee
Experience
ReduceCosts
Digital Marketing
eCommerce + Customer Partnership
eKO System
9
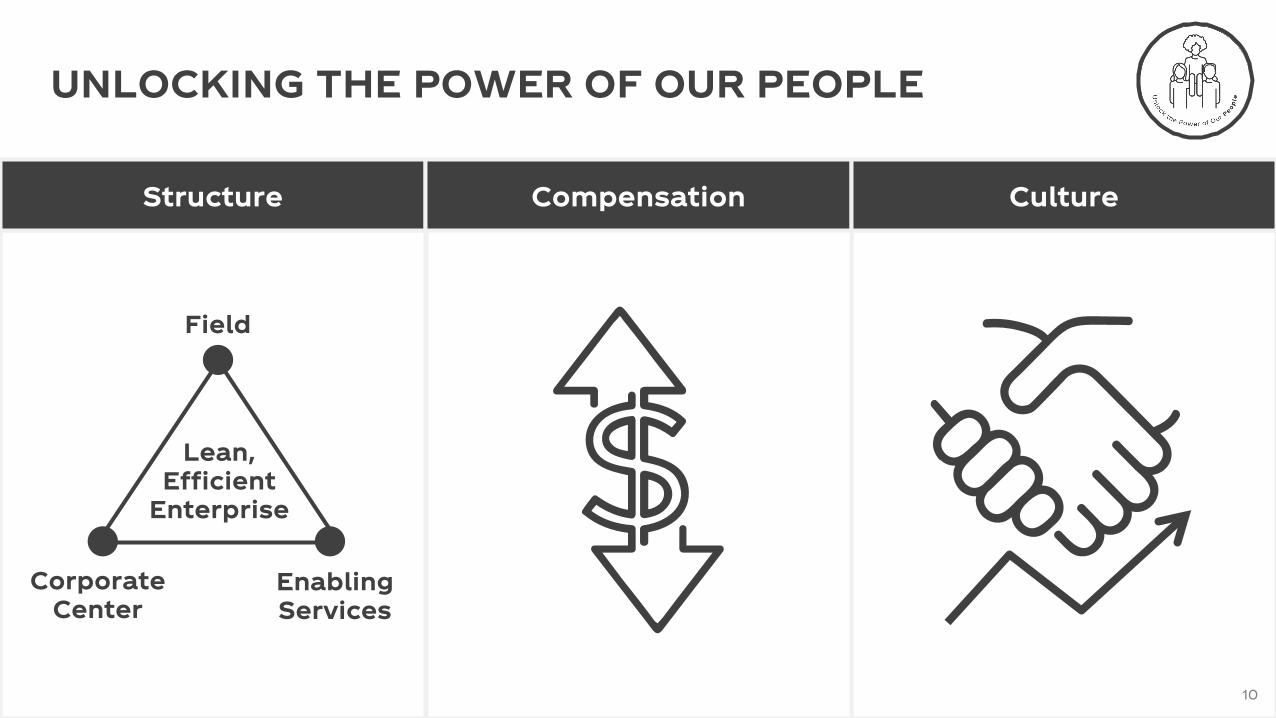
Structure Compensation Culture
UNLOCKING THE POWER OF OUR PEOPLE
10
Lean, Efficient
Enterprise
Corporate Center
EnablingServices
Field
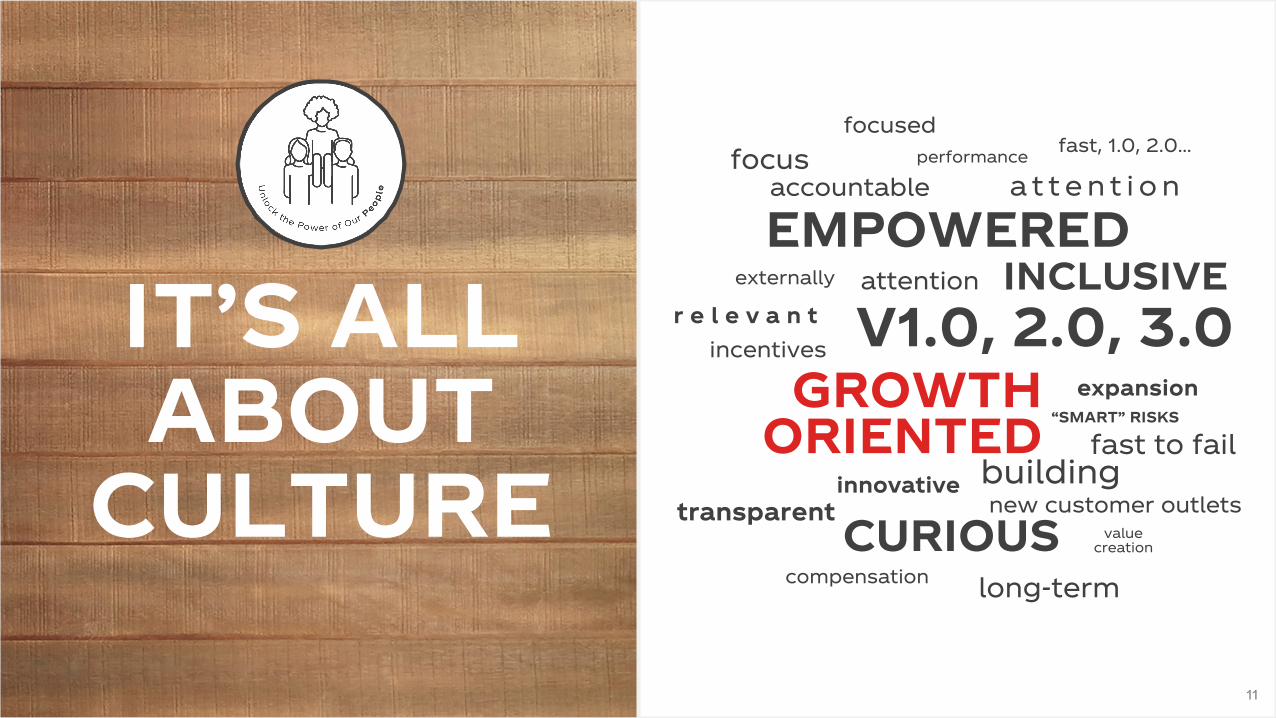
IT’S ALLABOUT
CULTURE
11
r e l e v a n t
GROWTH ORIENTED
V1.0, 2.0, 3.0
accountable
fast, 1.0, 2.0…
transparentvalue
creation
innovative
CURIOUS
INCLUSIVE
fast to fail“SMART” RISKS
EMPOWERED
new customer outlets
incentives
compensation
externally
focusedperformance
long-term
building
a t t e n t i o n
expansion
focus
attention
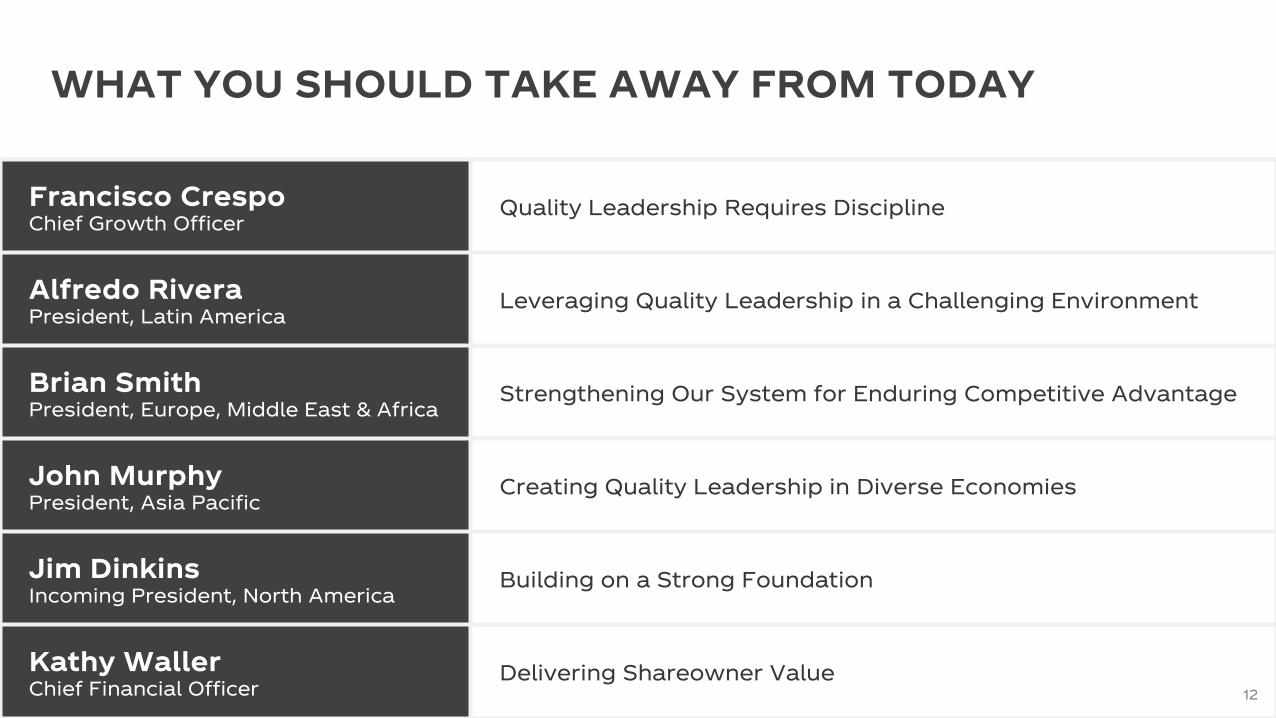
WHAT YOU SHOULD TAKE AWAY FROM TODAY
Francisco CrespoChief Growth Officer
Quality Leadership Requires Discipline
Alfredo RiveraPresident, Latin America
Leveraging Quality Leadership in a Challenging Environment
Brian SmithPresident, Europe, Middle East & Africa
Strengthening Our System for Enduring Competitive Advantage
John MurphyPresident, Asia Pacific
Creating Quality Leadership in Diverse Economies
Jim DinkinsIncoming President, North America
Building on a Strong Foundation
Kathy WallerChief Financial Officer
Delivering Shareowner Value12
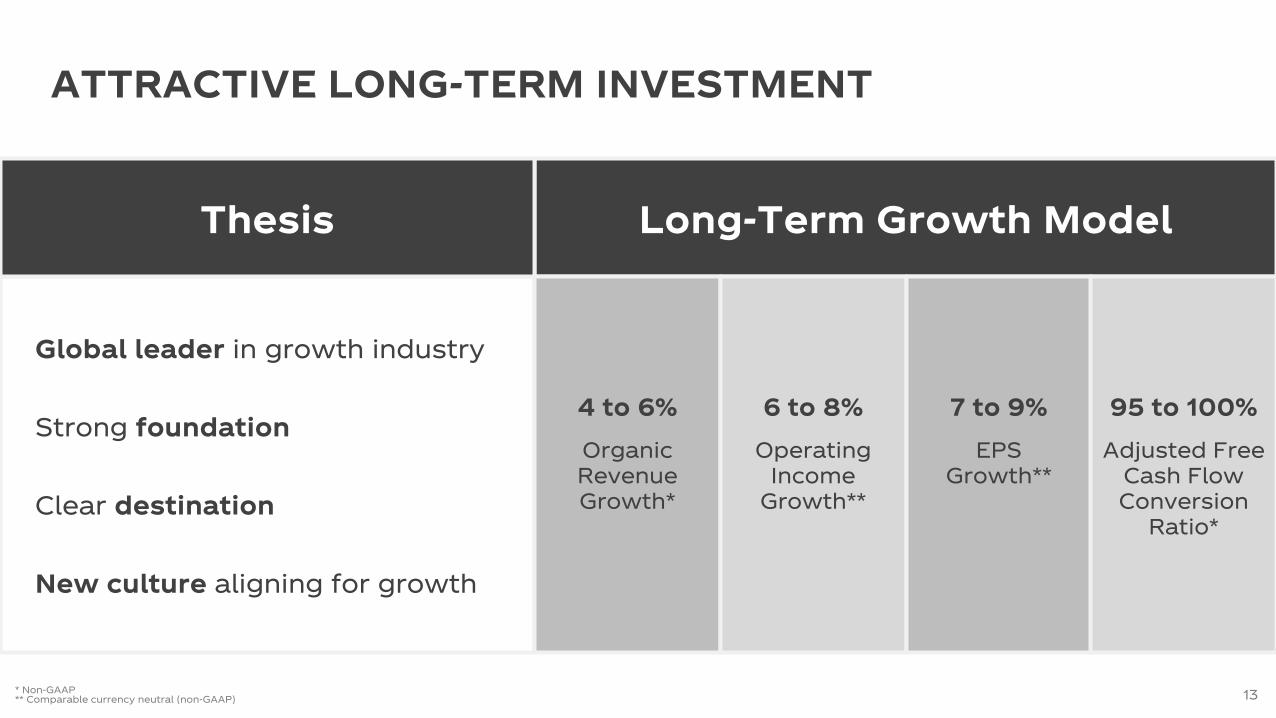
ATTRACTIVE LONG-TERM INVESTMENT
Long-Term Growth Model
Global leader in growth industry
Strong foundation
Clear destination
New culture aligning for growth
Thesis
4 to 6%Organic Revenue Growth*
6 to 8% Operating
IncomeGrowth**
7 to 9%EPS
Growth**
95 to 100%Adjusted Free
Cash Flow Conversion
Ratio*
* Non-GAAP** Comparable currency neutral (non-GAAP) 13
Reconciliations of GAAP and Non-GAAP
Financial Measures
APPENDIX
THE COCA-COLA COMPANY AND SUBSIDIARIESReconciliation of GAAP and Non-GAAP Financial Measures
(UNAUDITED)(In millions except debt leverage)
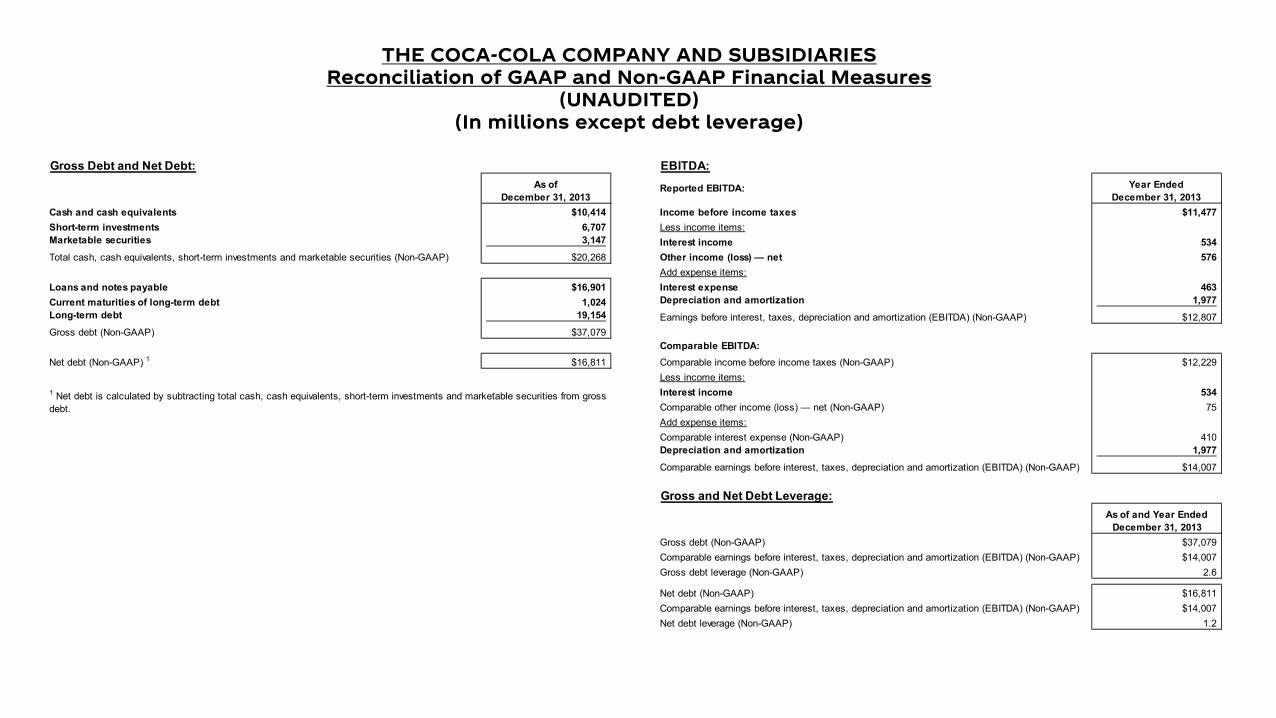
Gross Debt and Net Debt:As of
December 31, 2013Cash and cash equivalents $10,414Short-term investments 6,707Marketable securities 3,147
$20,268 Loans and notes payable $16,901Current maturities of long-term debt 1,024Long-term debt 19,154 Gross debt (Non-GAAP) $37,079
Net debt (Non-GAAP) 1 $16,811
1 Net debt is calculated by subtracting total cash, cash equivalents, short-term investments and marketable securities from gross debt.
Total cash, cash equivalents, short-term investments and marketable securities (Non-GAAP)
EBITDA:
Reported EBITDA: Year EndedDecember 31, 2013
Income before income taxes $11,477Less income items:Interest income 534Other income (loss) — net 576Add expense items:Interest expense 463Depreciation and amortization 1,977
$12,807
Comparable EBITDA:$12,229
Less income items:Interest income 534
75Add expense items:
410Depreciation and amortization 1,977
$14,007
Gross and Net Debt Leverage:As of and Year Ended
December 31, 2013Gross debt (Non-GAAP) $37,079
$14,007Gross debt leverage (Non-GAAP) 2.6
Net debt (Non-GAAP) $16,811$14,007
Net debt leverage (Non-GAAP) 1.2Comparable earnings before interest, taxes, depreciation and amortization (EBITDA) (Non-GAAP)
Earnings before interest, taxes, depreciation and amortization (EBITDA) (Non-GAAP)
Comparable income before income taxes (Non-GAAP)
Comparable other income (loss) — net (Non-GAAP)
Comparable interest expense (Non-GAAP)
Comparable earnings before interest, taxes, depreciation and amortization (EBITDA) (Non-GAAP)
Comparable earnings before interest, taxes, depreciation and amortization (EBITDA) (Non-GAAP)
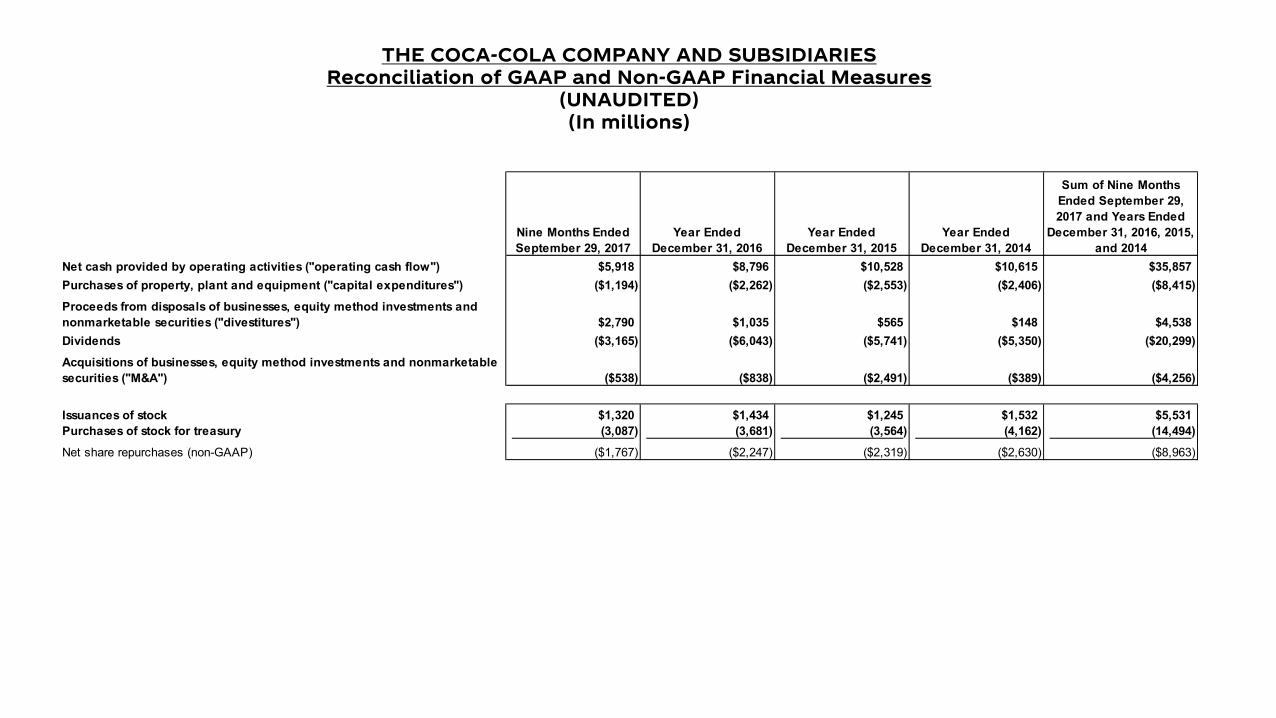
THE COCA-COLA COMPANY AND SUBSIDIARIESReconciliation of GAAP and Non-GAAP Financial Measures
(UNAUDITED)(In millions)
Nine Months EndedSeptember 29, 2017
Year EndedDecember 31, 2016
Year EndedDecember 31, 2015
Year EndedDecember 31, 2014
Sum of Nine Months Ended September 29, 2017 and Years Ended
December 31, 2016, 2015, and 2014
Net cash provided by operating activities ("operating cash flow") $5,918 $8,796 $10,528 $10,615 $35,857Purchases of property, plant and equipment ("capital expenditures") ($1,194) ($2,262) ($2,553) ($2,406) ($8,415)
$2,790 $1,035 $565 $148 $4,538Dividends ($3,165) ($6,043) ($5,741) ($5,350) ($20,299)
($538) ($838) ($2,491) ($389) ($4,256)
Issuances of stock $1,320 $1,434 $1,245 $1,532 $5,531Purchases of stock for treasury (3,087) (3,681) (3,564) (4,162) (14,494) Net share repurchases (non-GAAP) ($1,767) ($2,247) ($2,319) ($2,630) ($8,963)
Proceeds from disposals of businesses, equity method investments and nonmarketable securities ("divestitures")
Acquisitions of businesses, equity method investments and nonmarketable securities ("M&A")
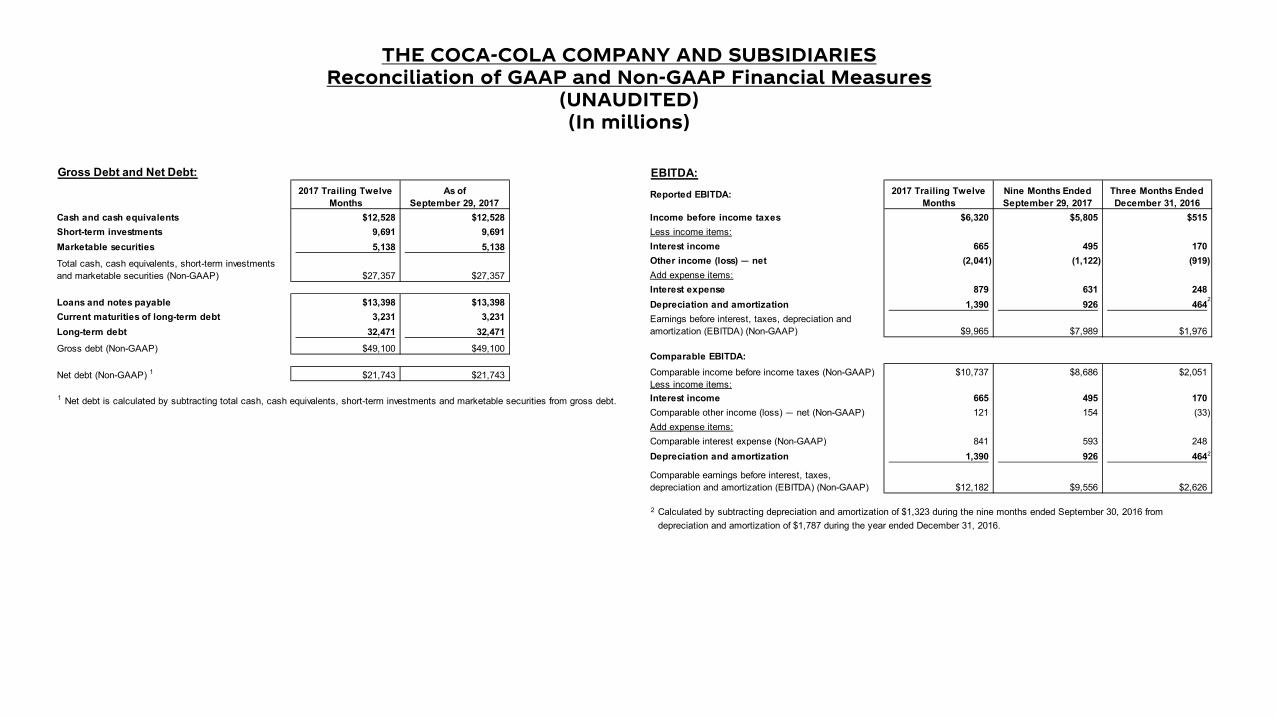
THE COCA-COLA COMPANY AND SUBSIDIARIESReconciliation of GAAP and Non-GAAP Financial Measures
(UNAUDITED)(In millions)
Gross Debt and Net Debt:2017 Trailing Twelve
MonthsAs of
September 29, 2017Cash and cash equivalents $12,528 $12,528Short-term investments 9,691 9,691Marketable securities 5,138 5,138
$27,357 $27,357 Loans and notes payable $13,398 $13,398Current maturities of long-term debt 3,231 3,231Long-term debt 32,471 32,471 Gross debt (Non-GAAP) $49,100 $49,100
Net debt (Non-GAAP) 1 $21,743 $21,743
1 Net debt is calculated by subtracting total cash, cash equivalents, short-term investments and marketable securities from gross debt.
Total cash, cash equivalents, short-term investments and marketable securities (Non-GAAP)
EBITDA:
Reported EBITDA: 2017 Trailing TwelveMonths
Nine Months Ended September 29, 2017
Three Months EndedDecember 31, 2016
Income before income taxes $6,320 $5,805 $515Less income items:Interest income 665 495 170Other income (loss) — net (2,041) (1,122) (919)Add expense items:Interest expense 879 631 248Depreciation and amortization 1,390 926 464
$9,965 $7,989 $1,976
Comparable EBITDA:$10,737 $8,686 $2,051
Less income items:Interest income 665 495 170
121 154 (33)Add expense items:
841 593 248Depreciation and amortization 1,390 926 464
$12,182 $9,556 $2,626
2 Calculated by subtracting depreciation and amortization of $1,323 during the nine months ended September 30, 2016 from depreciation and amortization of $1,787 during the year ended December 31, 2016.
Comparable income before income taxes (Non-GAAP)
Comparable other income (loss) — net (Non-GAAP)
Comparable interest expense (Non-GAAP)
Comparable earnings before interest, taxes, depreciation and amortization (EBITDA) (Non-GAAP)
Earnings before interest, taxes, depreciation and amortization (EBITDA) (Non-GAAP)
2
2

THE COCA-COLA COMPANY AND SUBSIDIARIESReconciliation of GAAP and Non-GAAP Financial Measures
(UNAUDITED)(In millions except debt leverage)
Gross Debt and Net Debt:2017 Trailing Twelve
MonthsCash and cash equivalents $12,528Short-term investments 9,691Marketable securities 5,138
$27,357
Loans and notes payable $13,398Current maturities of long-term debt 3,231Long-term debt 32,471 Gross debt (Non-GAAP) $49,100
Net debt (Non-GAAP) $21,743
1 Net debt is calculated by subtracting total cash, cash equivalents, short-term investments and marketable securities from gross debt.
Total cash, cash equivalents, short-term investments and marketable securities (Non-GAAP)
1
EBITDA:
Reported EBITDA: 2017 Trailing TwelveMonths
Income before income taxes $6,320Less income items:Interest income 665Other income (loss) — net (2,041)Add expense items:Interest expense 879Depreciation and amortization 1,390
$9,965
Comparable EBITDA:$10,737
Less income items:Interest income 665
121Add expense items:
841Depreciation and amortization 1,390
$12,182
Gross and Net Debt Leverage:2017 Trailing Twelve
MonthsGross debt (Non-GAAP) $49,100
$12,182Gross debt leverage (Non-GAAP) 4.0
Net debt (Non-GAAP) $21,743$12,182
Net debt leverage (Non-GAAP) 1.8
Comparable earnings before interest, taxes, depreciation and amortization (EBITDA) (Non-GAAP)
Comparable earnings before interest, taxes, depreciation and amortization (EBITDA) (Non-GAAP)
Earnings before interest, taxes, depreciation and amortization (EBITDA) (Non-GAAP)
Comparable income before income taxes (Non-GAAP)
Comparable other income (loss) — net (Non-GAAP)
Comparable interest expense (Non-GAAP)
Comparable earnings before interest, taxes, depreciation and amortization (EBITDA) (Non-GAAP)
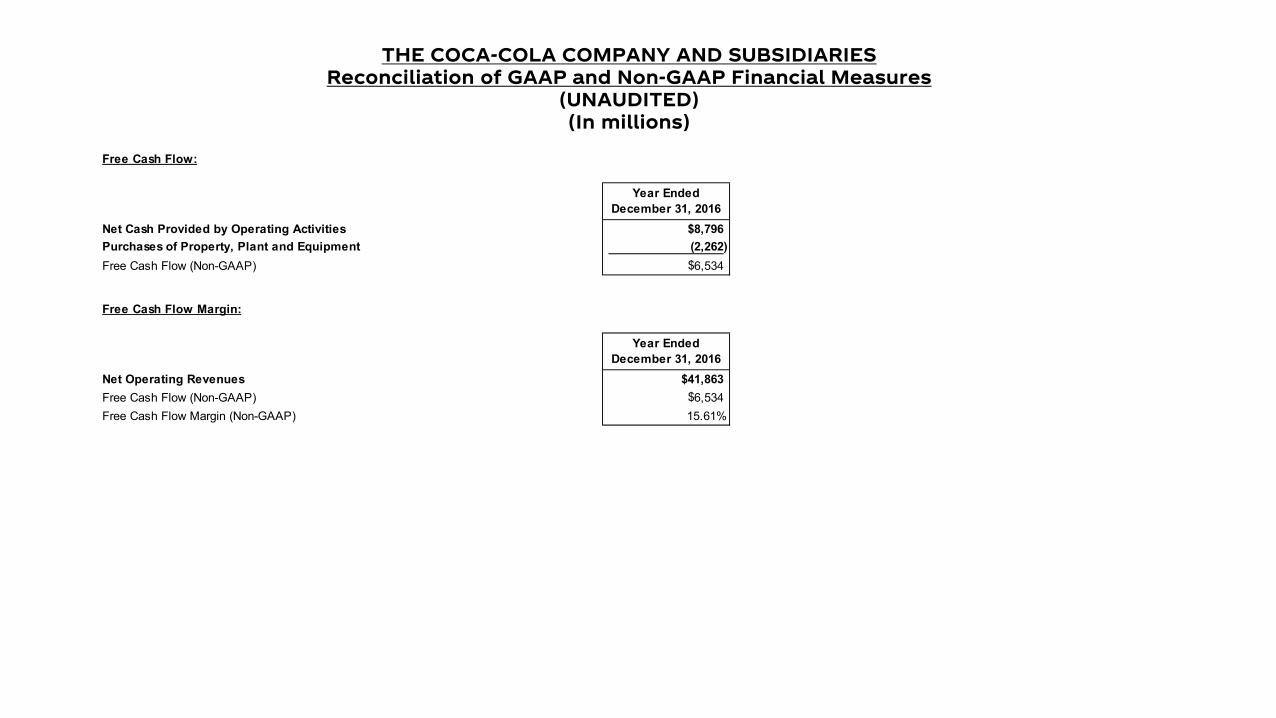
THE COCA-COLA COMPANY AND SUBSIDIARIESReconciliation of GAAP and Non-GAAP Financial Measures
(UNAUDITED)(In millions)
Free Cash Flow:
Year EndedDecember 31, 2016
Net Cash Provided by Operating Activities $8,796Purchases of Property, Plant and Equipment (2,262) Free Cash Flow (Non-GAAP) 6,534
Free Cash Flow Margin:
Year EndedDecember 31, 2016
Net Operating Revenues $41,863Free Cash Flow (Non-GAAP) 6,534 Free Cash Flow Margin (Non-GAAP) 15.61%
$
$
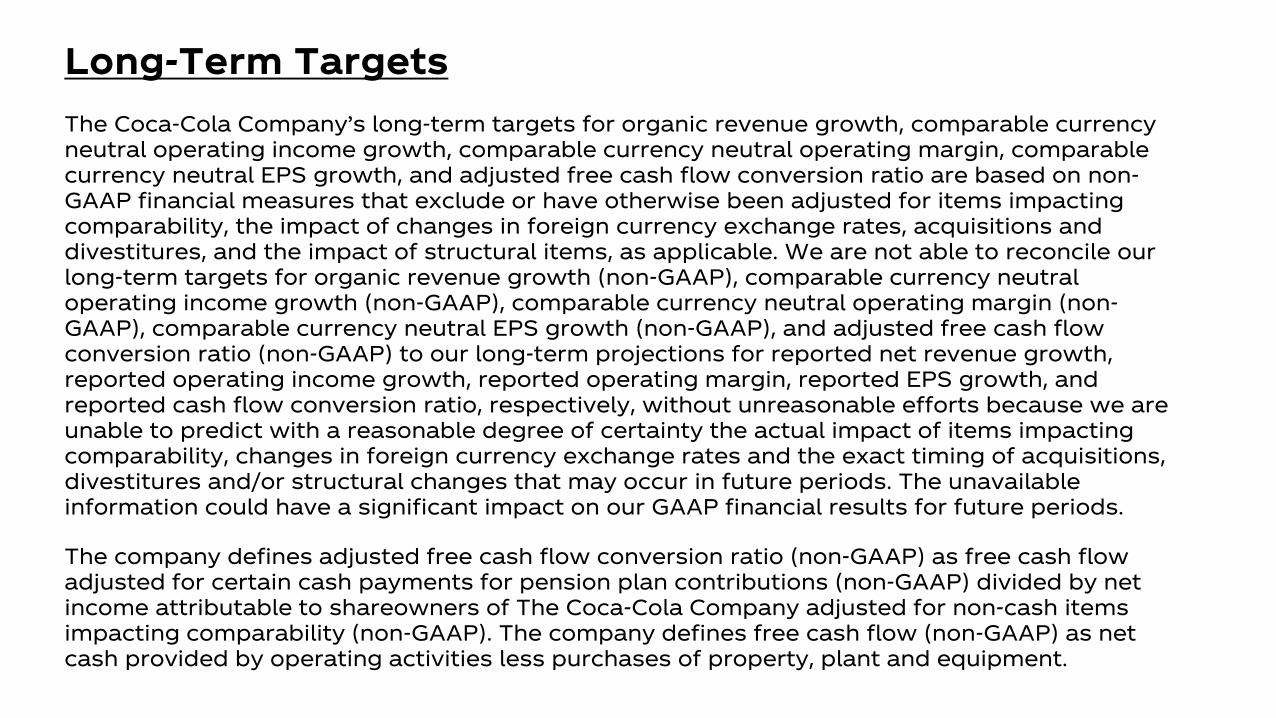
The Coca-Cola Company’s long-term targets for organic revenue growth, comparable currency neutral operating income growth, comparable currency neutral operating margin, comparable currency neutral EPS growth, and adjusted free cash flow conversion ratio are based on non-GAAP financial measures that exclude or have otherwise been adjusted for items impacting comparability, the impact of changes in foreign currency exchange rates, acquisitions and divestitures, and the impact of structural items, as applicable. We are not able to reconcile our long-term targets for organic revenue growth (non-GAAP), comparable currency neutral operating income growth (non-GAAP), comparable currency neutral operating margin (non-GAAP), comparable currency neutral EPS growth (non-GAAP), and adjusted free cash flow conversion ratio (non-GAAP) to our long-term projections for reported net revenue growth, reported operating income growth, reported operating margin, reported EPS growth, and reported cash flow conversion ratio, respectively, without unreasonable efforts because we are unable to predict with a reasonable degree of certainty the actual impact of items impacting comparability, changes in foreign currency exchange rates and the exact timing of acquisitions, divestitures and/or structural changes that may occur in future periods. The unavailable information could have a significant impact on our GAAP financial results for future periods.
The company defines adjusted free cash flow conversion ratio (non-GAAP) as free cash flow adjusted for certain cash payments for pension plan contributions (non-GAAP) divided by net income attributable to shareowners of The Coca-Cola Company adjusted for non-cash items impacting comparability (non-GAAP). The company defines free cash flow (non-GAAP) as net cash provided by operating activities less purchases of property, plant and equipment.
Long-Term Targets


![Welcome! [] · D = Diversity Recruitment ... 82 Marine Officer Selection Office FT, I ... 124 Springfield Pepsi-Cola Bottling Co. FT, PT](https://img.pdfslide.us/doc/110x75/5b14c76f7f8b9a66508bf7f1/welcome-d-diversity-recruitment-82-marine-officer-selection-office.jpg)