Embed Size (px)
Citation preview
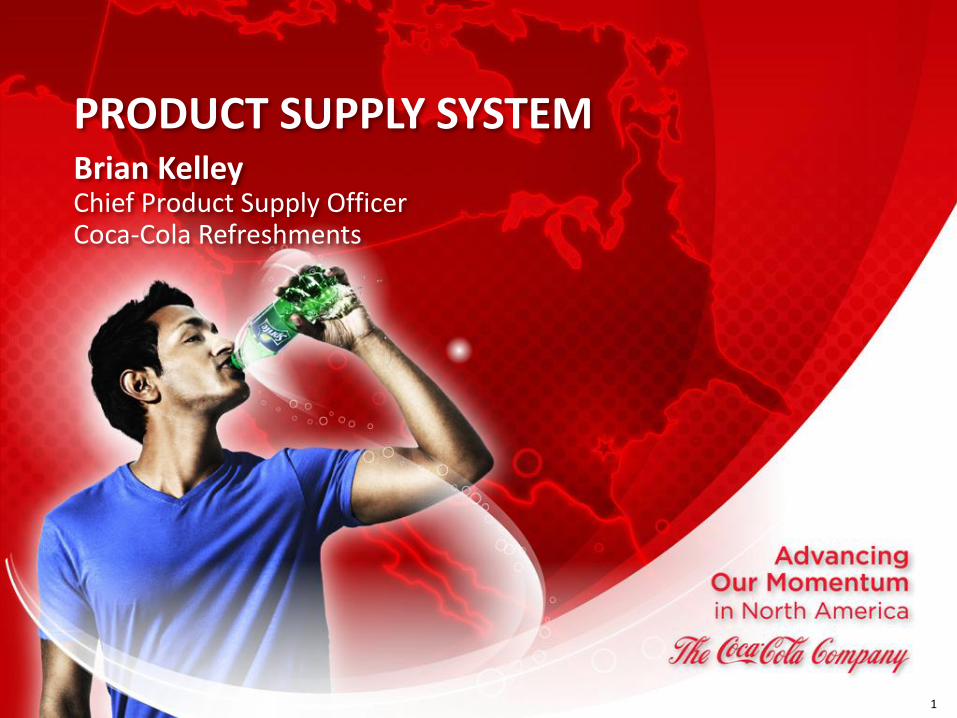
PRODUCT SUPPLY SYSTEM Brian Kelley Chief Product Supply Officer Coca-Cola Refreshments
1
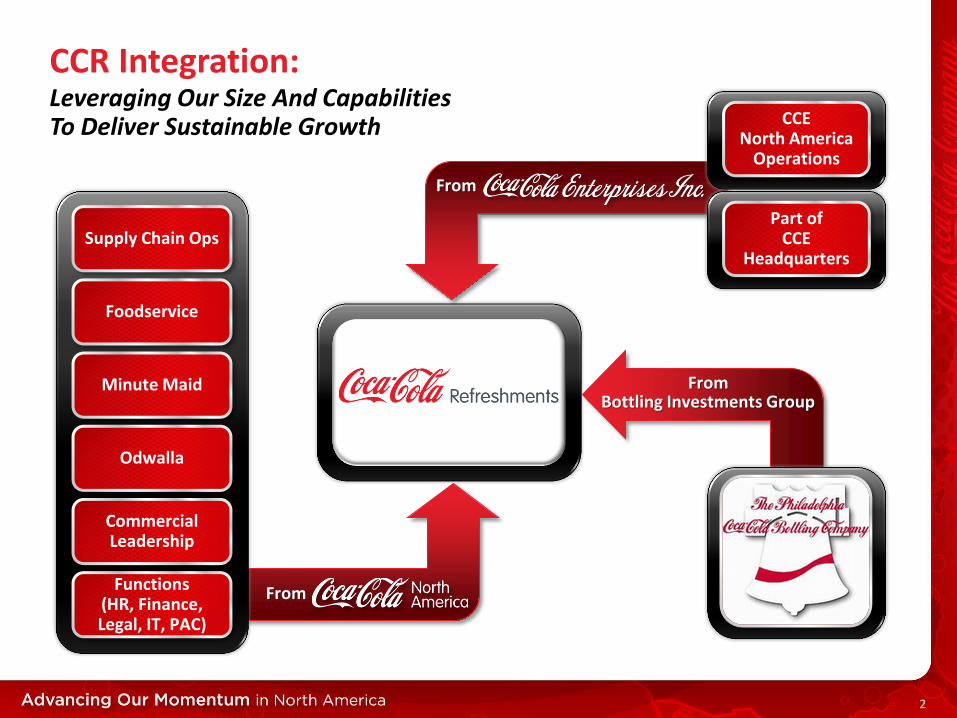
CCR Integration:
2
Leveraging Our Size And Capabilities To Deliver Sustainable Growth
Supply Chain Ops
Foodservice
Minute Maid
Commercial Leadership
Functions (HR, Finance, Legal, IT, PAC)
Odwalla
Use CCE logo
From
CCE North America
Operations
Part of CCE
Headquarters
From
From Bottling Investments Group
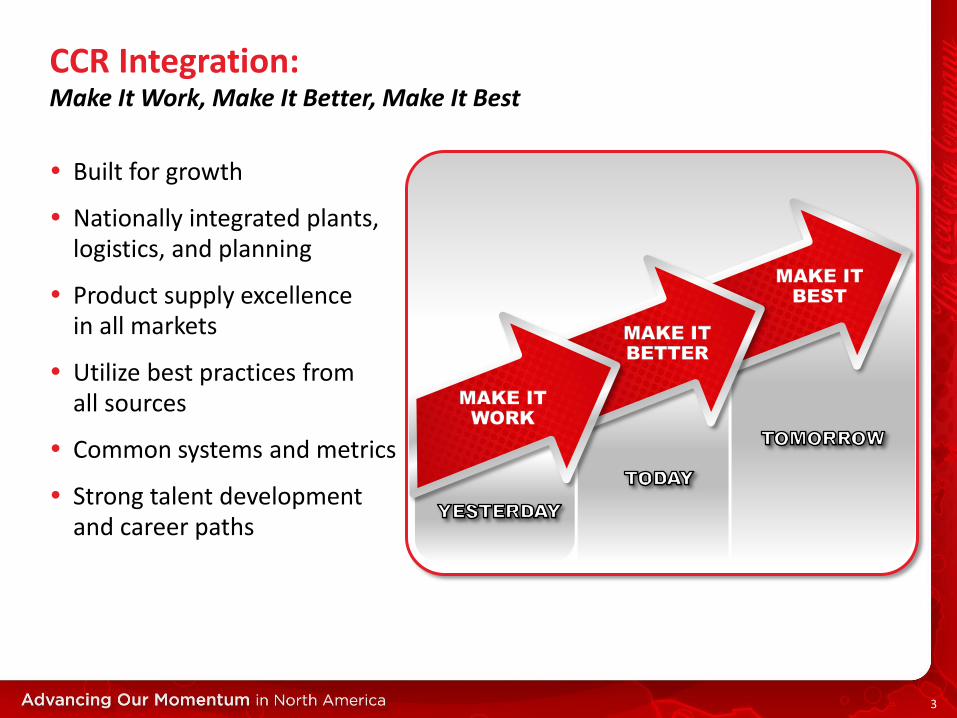
CCR Integration:
Built for growth
Nationally integrated plants, logistics, and planning
Product supply excellence in all markets
Utilize best practices from all sources
Common systems and metrics
Strong talent development and career paths
3
Make It Work, Make It Better, Make It Best
MAKE IT
WORK
MAKE IT
BETTER
MAKE IT
BEST
The CCR Product Supply System
4
Standardize
Zero Defects
Manufacturing Field Operations
Procurement Transportation, Planning and
Commercialization
416 Distribution Centers 5 Billion Cases 33K Fleet – 22MM Deliveries FY 2010
2,000+ SKUs 7 Product Categories 1.6MM Inbound
Deliveries
$13 Billion Buy Coca-Cola Recycling Customer Business Solutions Coca-Cola Bottlers’ Sales
and Services
78 Plants 6 Mfg Processes 290 Lines
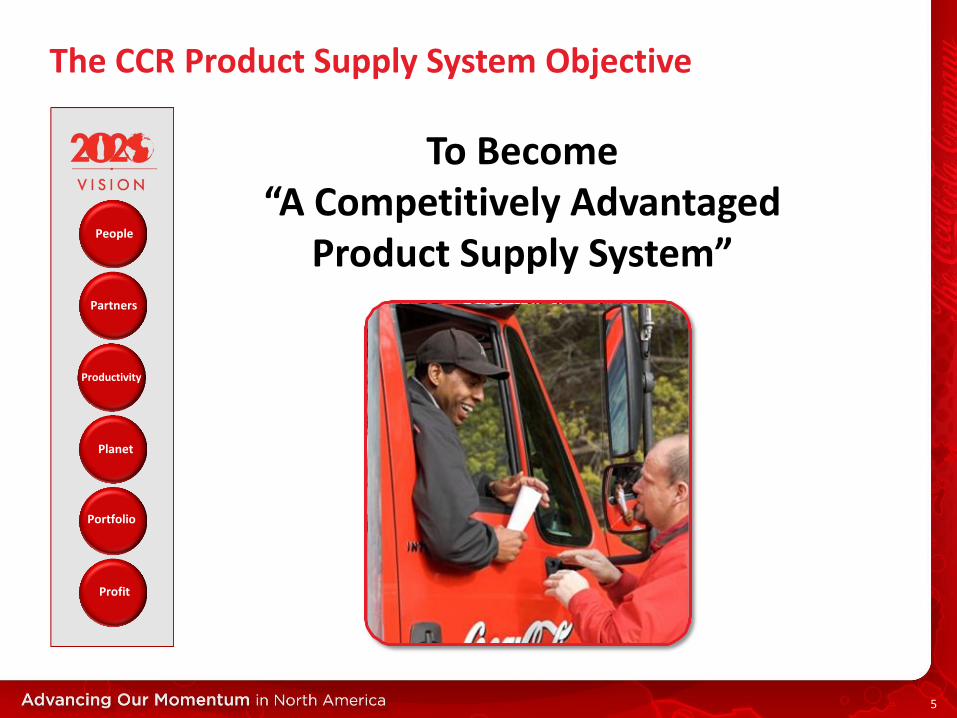
The CCR Product Supply System Objective
5
Profit
Portfolio
Planet
People
Partners
Productivity
To Become “A Competitively Advantaged
Product Supply System”
THREE CULTURAL MANDATES
6
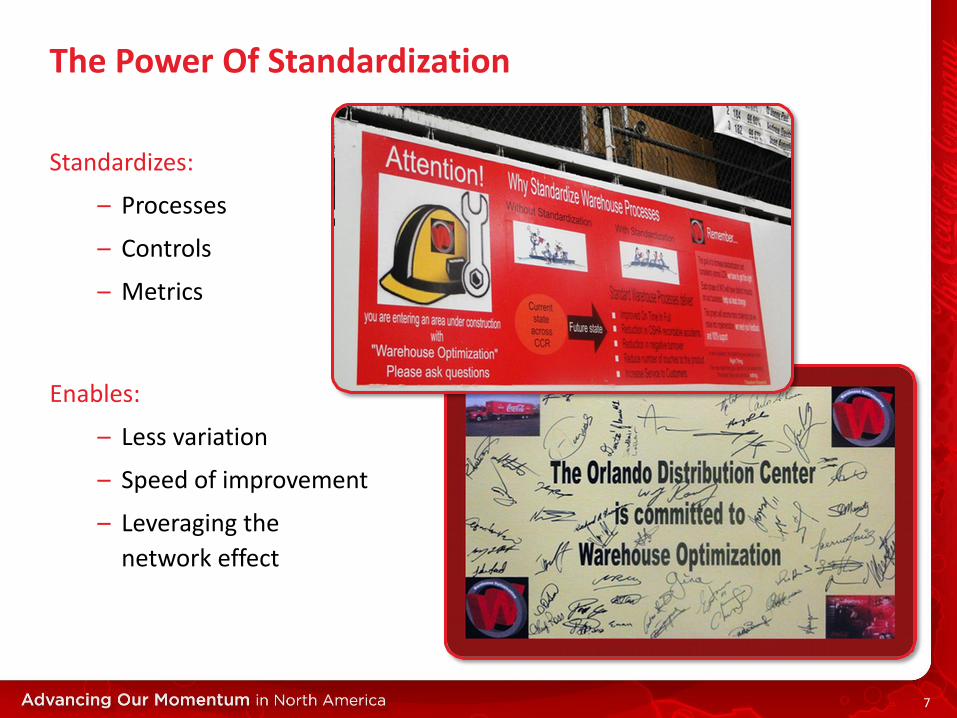
The Power Of Standardization
Standardizes:
– Processes
– Controls
– Metrics
Enables:
– Less variation
– Speed of improvement
– Leveraging the
network effect
7
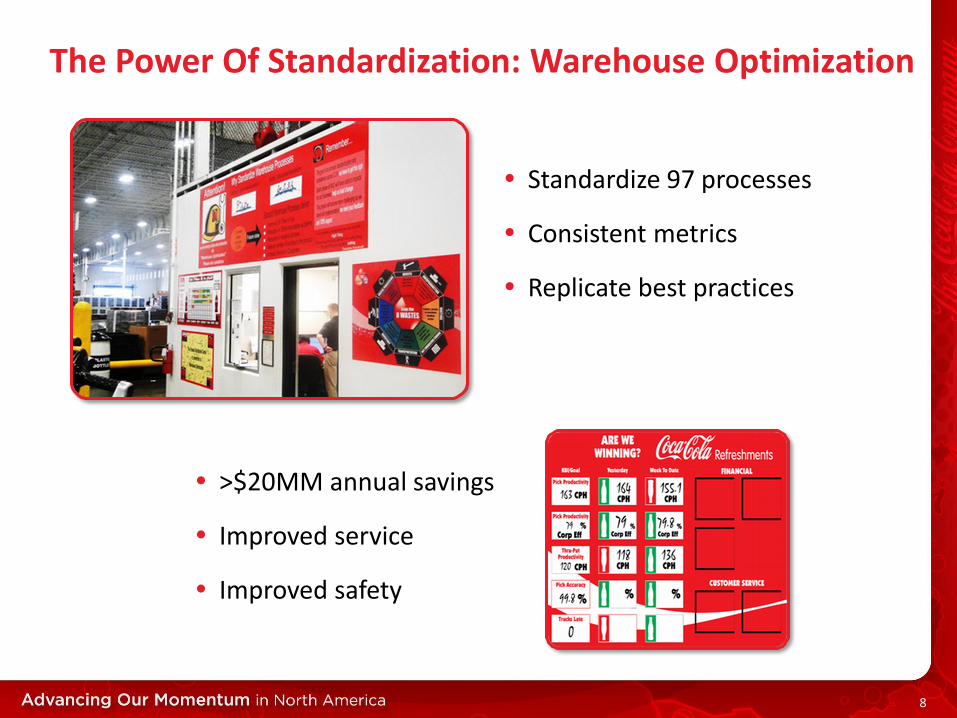
The Power Of Standardization: Warehouse Optimization
Standardize 97 processes
Consistent metrics
Replicate best practices
>$20MM annual savings
Improved service
Improved safety
8
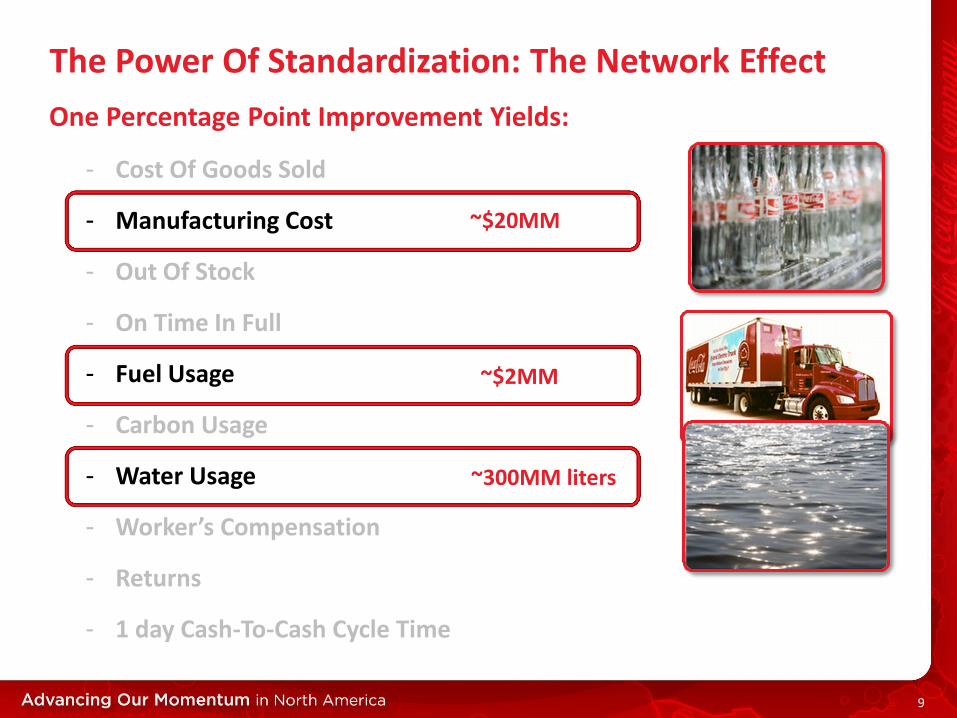
The Power Of Standardization: The Network Effect
One Percentage Point Improvement Yields:
- Cost Of Goods Sold
- Manufacturing Cost
- Out Of Stock
- On Time In Full
- Fuel Usage
- Carbon Usage
- Water Usage
- Worker’s Compensation
- Returns
- 1 day Cash-To-Cash Cycle Time
~$20MM
~$2MM
~300MM liters
9
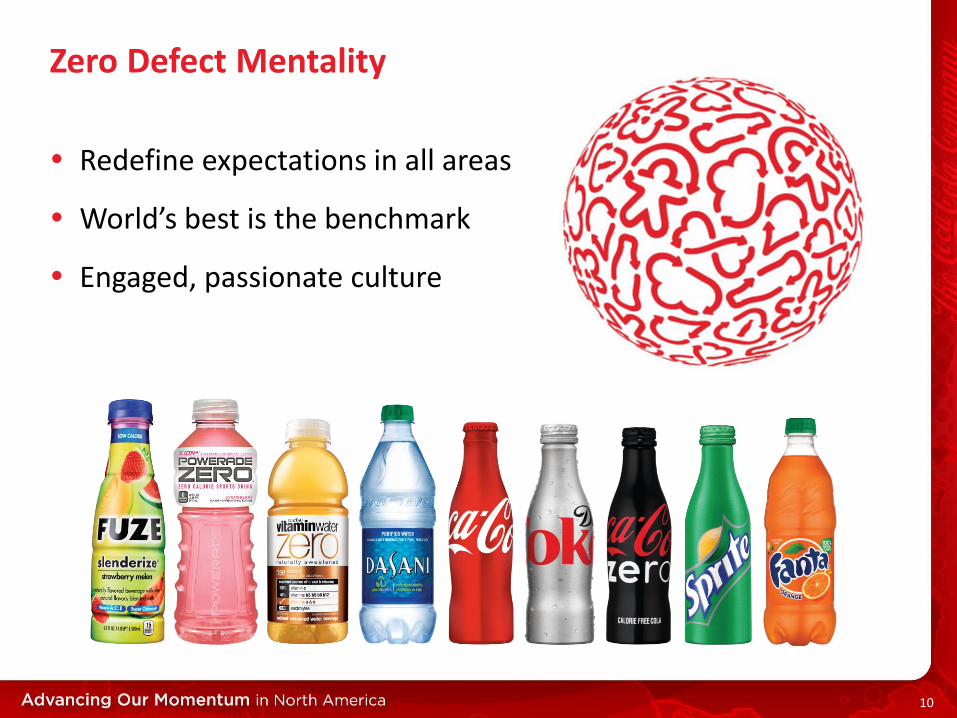
Zero Defect Mentality
Redefine expectations in all areas
World’s best is the benchmark
Engaged, passionate culture
10
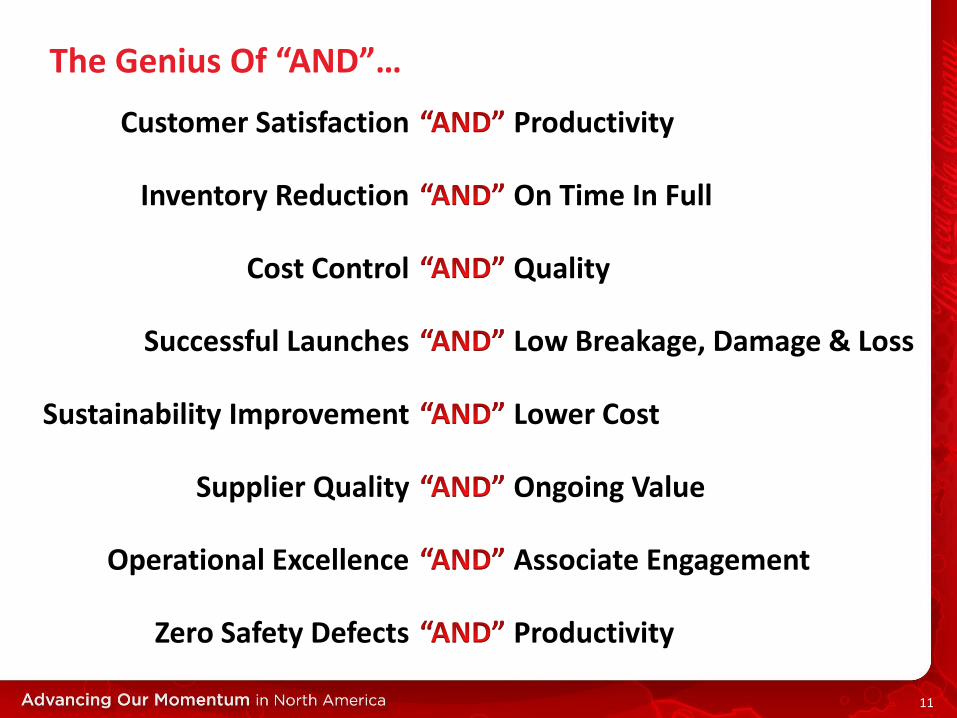
The Genius Of “AND”…
Customer Satisfaction
Inventory Reduction
Cost Control
Successful Launches
Sustainability Improvement
Supplier Quality
Operational Excellence
Zero Safety Defects
Productivity
On Time In Full
Quality
Low Breakage, Damage & Loss
Lower Cost
Ongoing Value
Associate Engagement
Productivity
11
CUSTOMER SERVICE
12
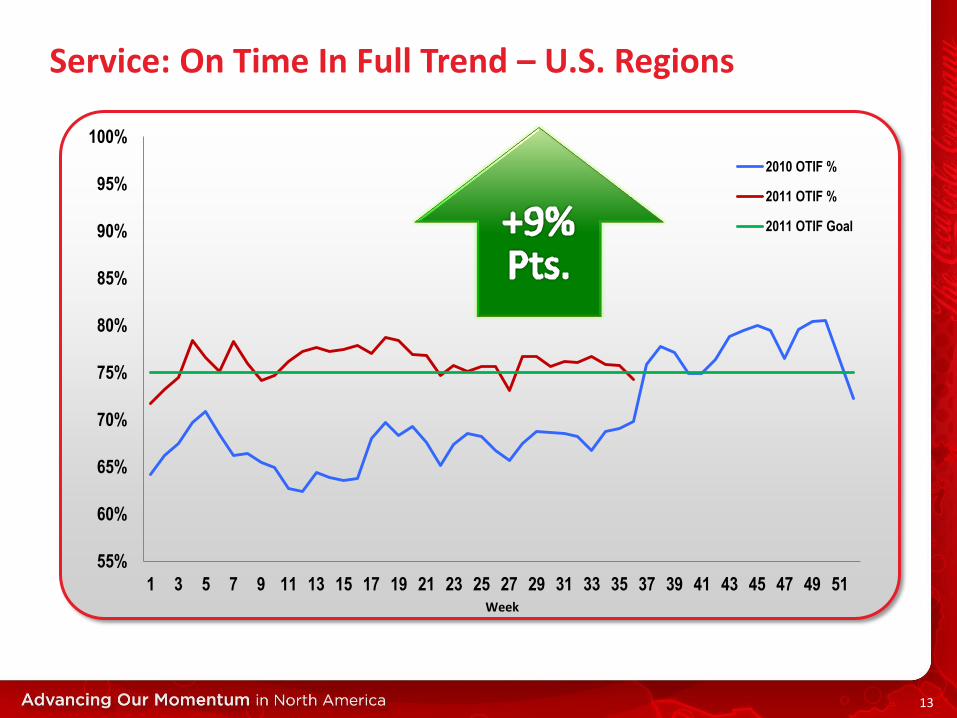
55%
60%
65%
70%
75%
80%
85%
90%
95%
100%
1 3 5 7 9 11 13 15 17 19 21 23 25 27 29 31 33 35 37 39 41 43 45 47 49 51Week
2010 OTIF %
2011 OTIF %
2011 OTIF Goal
Service: On Time In Full Trend – U.S. Regions
13
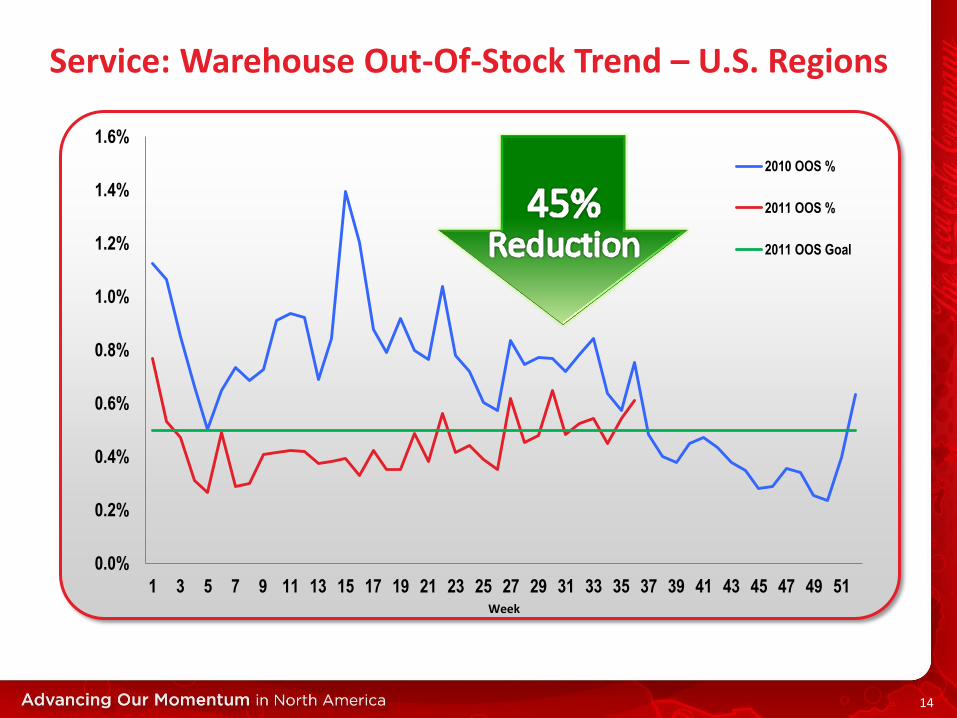
Service: Warehouse Out-Of-Stock Trend – U.S. Regions
0.0%
0.2%
0.4%
0.6%
0.8%
1.0%
1.2%
1.4%
1.6%
1 3 5 7 9 11 13 15 17 19 21 23 25 27 29 31 33 35 37 39 41 43 45 47 49 51Week
2010 OOS %
2011 OOS %
2011 OOS Goal
14
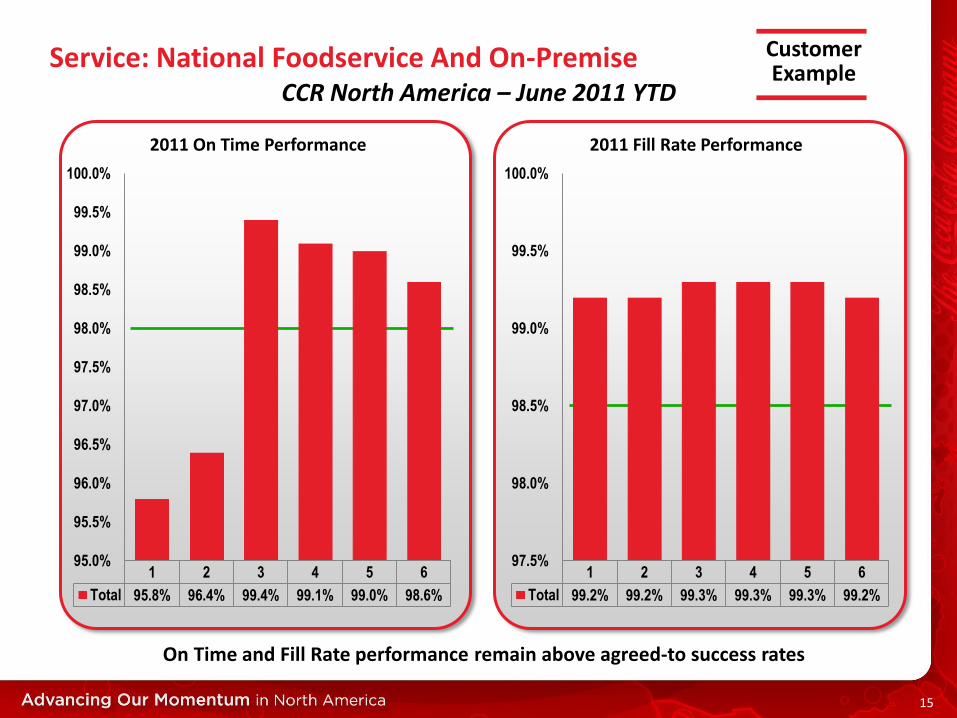
Service: National Foodservice And On-Premise CCR North America – June 2011 YTD
On Time and Fill Rate performance remain above agreed-to success rates
1 2 3 4 5 6
Total 95.8% 96.4% 99.4% 99.1% 99.0% 98.6%
95.0%
95.5%
96.0%
96.5%
97.0%
97.5%
98.0%
98.5%
99.0%
99.5%
100.0%
2011 On Time Performance
1 2 3 4 5 6
Total 99.2% 99.2% 99.3% 99.3% 99.3% 99.2%
97.5%
98.0%
98.5%
99.0%
99.5%
100.0%
2011 Fill Rate Performance
Customer Example
15
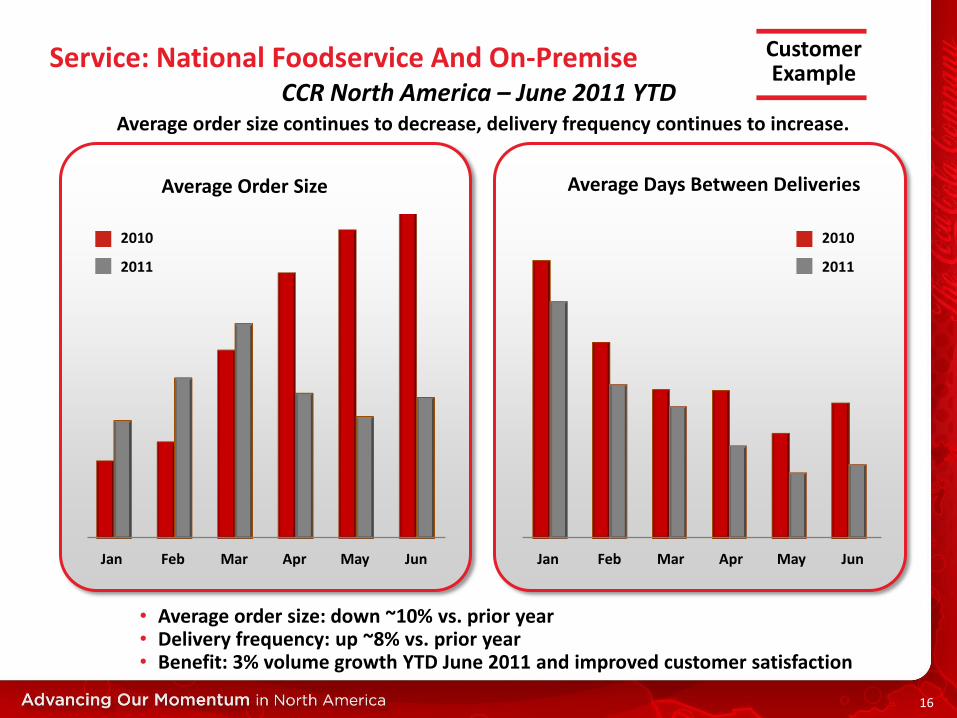
Service: National Foodservice And On-Premise
Average Days Between Deliveries Average Order Size
• Average order size: down ~10% vs. prior year • Delivery frequency: up ~8% vs. prior year • Benefit: 3% volume growth YTD June 2011 and improved customer satisfaction
Average order size continues to decrease, delivery frequency continues to increase.
2010
2011
2010
2011
CCR North America – June 2011 YTD
Customer Example
Jan Feb Mar Apr May Jun Jan Feb Mar Apr May Jun
16
QUALITY
17
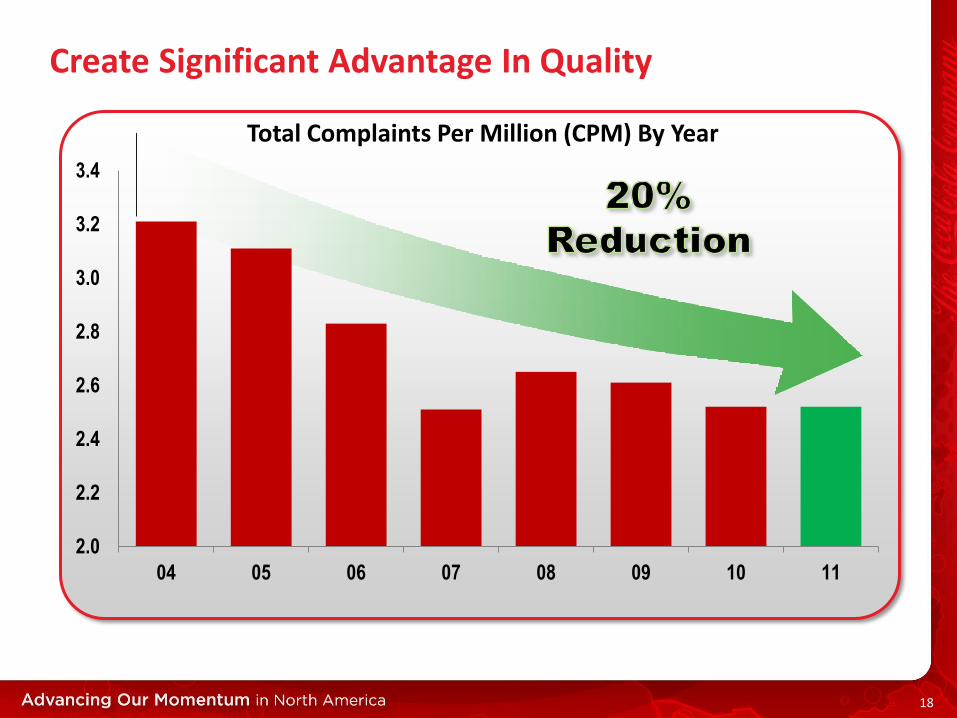
2.0
2.2
2.4
2.6
2.8
3.0
3.2
3.4
04 05 06 07 08 09 10 11
Create Significant Advantage In Quality
Total Complaints Per Million (CPM) By Year
18
SUSTAINABILITY
19
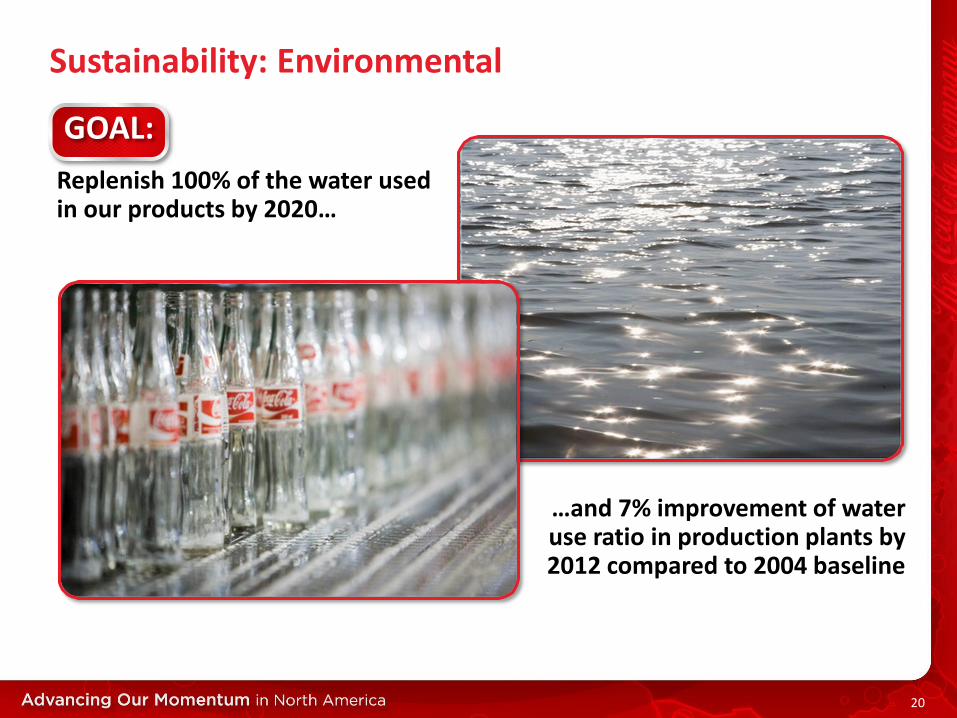
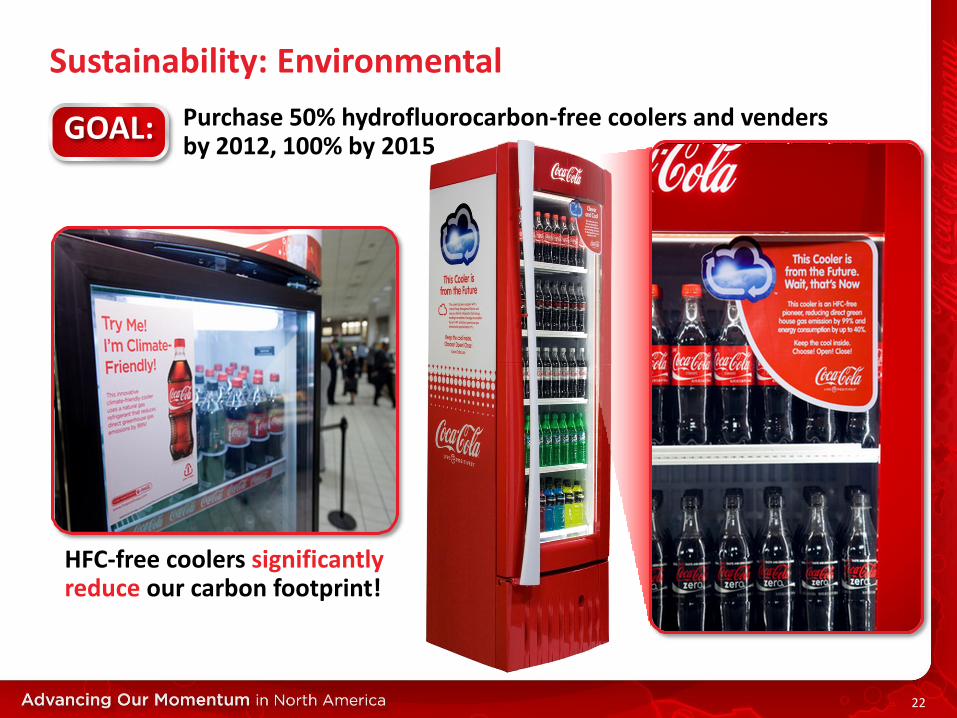
GOAL:
Sustainability: Environmental
Replenish 100% of the water used in our products by 2020…
…and 7% improvement of water use ratio in production plants by 2012 compared to 2004 baseline
20
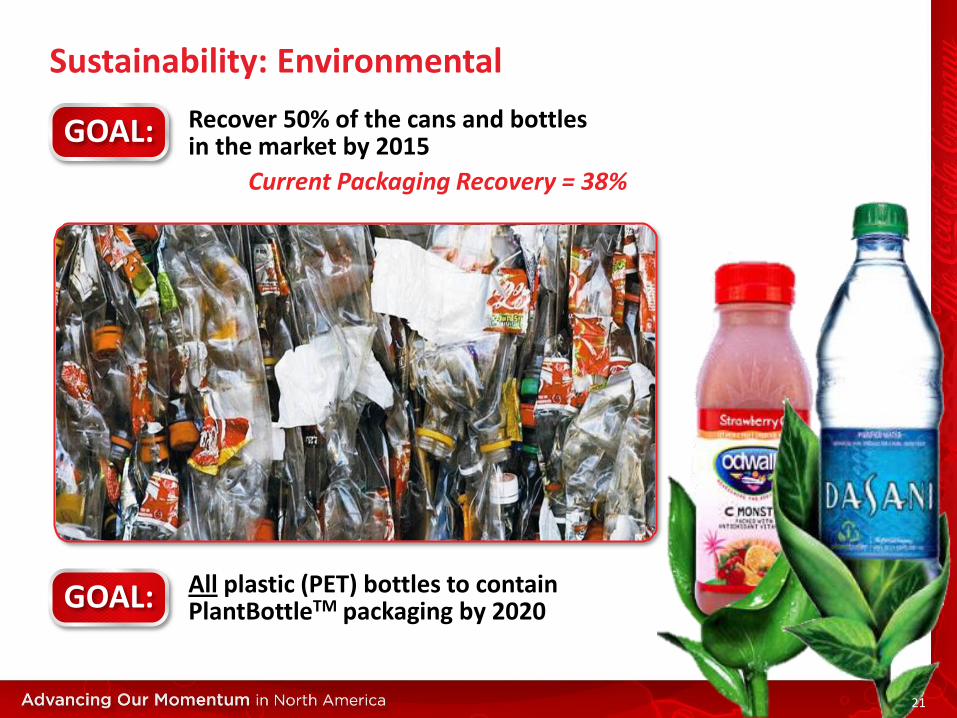
GOAL:
GOAL:
Sustainability: Environmental
Recover 50% of the cans and bottles in the market by 2015
Current Packaging Recovery = 38%
All plastic (PET) bottles to contain PlantBottleTM packaging by 2020
21
GOAL:
Sustainability: Environmental
Purchase 50% hydrofluorocarbon-free coolers and venders by 2012, 100% by 2015
HFC-free coolers significantly reduce our carbon footprint!
22
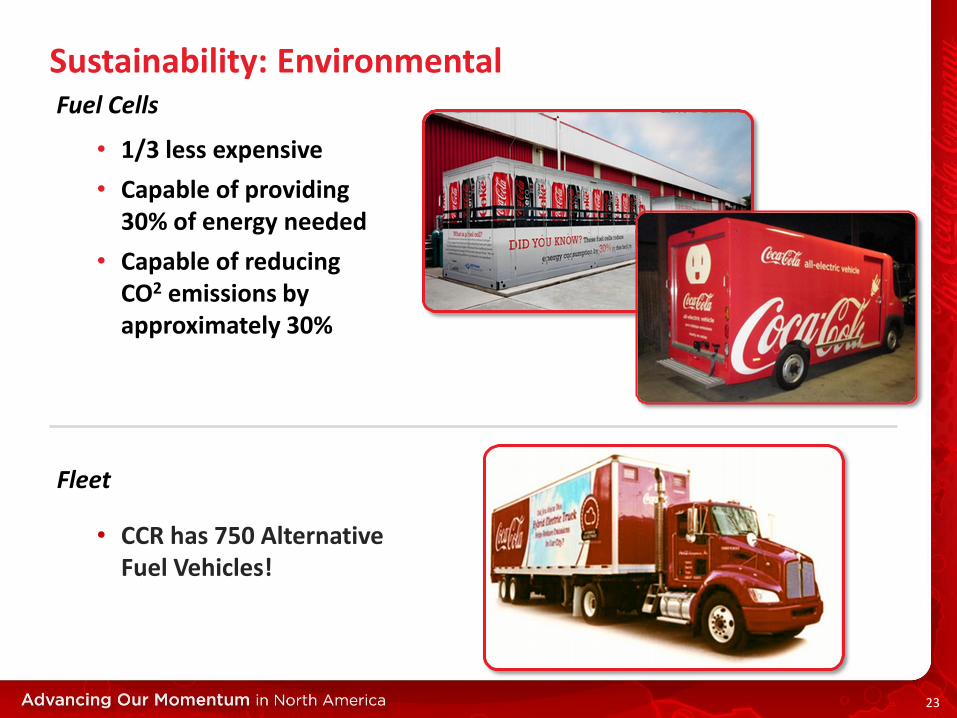
Sustainability: Environmental Fuel Cells
Fleet
• CCR has 750 Alternative Fuel Vehicles!
• 1/3 less expensive
• Capable of providing 30% of energy needed
• Capable of reducing CO2 emissions by approximately 30%
23
PRODUCTIVITY & OPERATIONAL EXCELLENCE
24
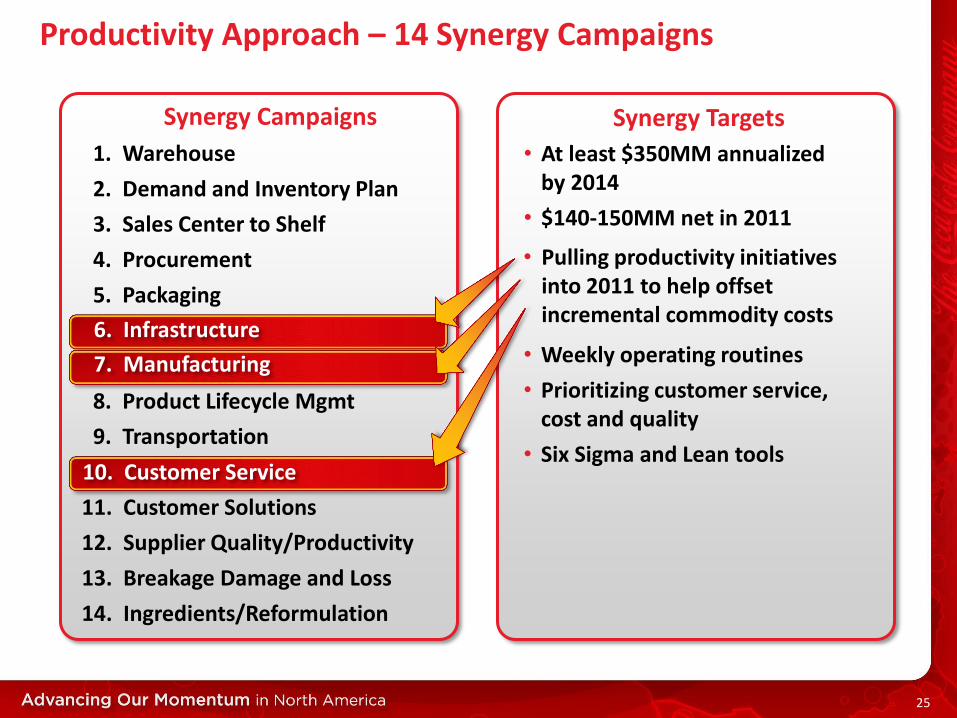
Productivity Approach – 14 Synergy Campaigns
Synergy Campaigns
1. Warehouse
2. Demand and Inventory Plan
3. Sales Center to Shelf
4. Procurement
5. Packaging
6. Infrastructure
7. Manufacturing
8. Product Lifecycle Mgmt
9. Transportation
10. Customer Service
11. Customer Solutions
12. Supplier Quality/Productivity
13. Breakage Damage and Loss
14. Ingredients/Reformulation
• At least $350MM annualized by 2014
• $140-150MM net in 2011
Synergy Targets
6. Infrastructure
10. Customer Service
7. Manufacturing
• Pulling productivity initiatives into 2011 to help offset incremental commodity costs
• Weekly operating routines
• Prioritizing customer service, cost and quality
• Six Sigma and Lean tools
25
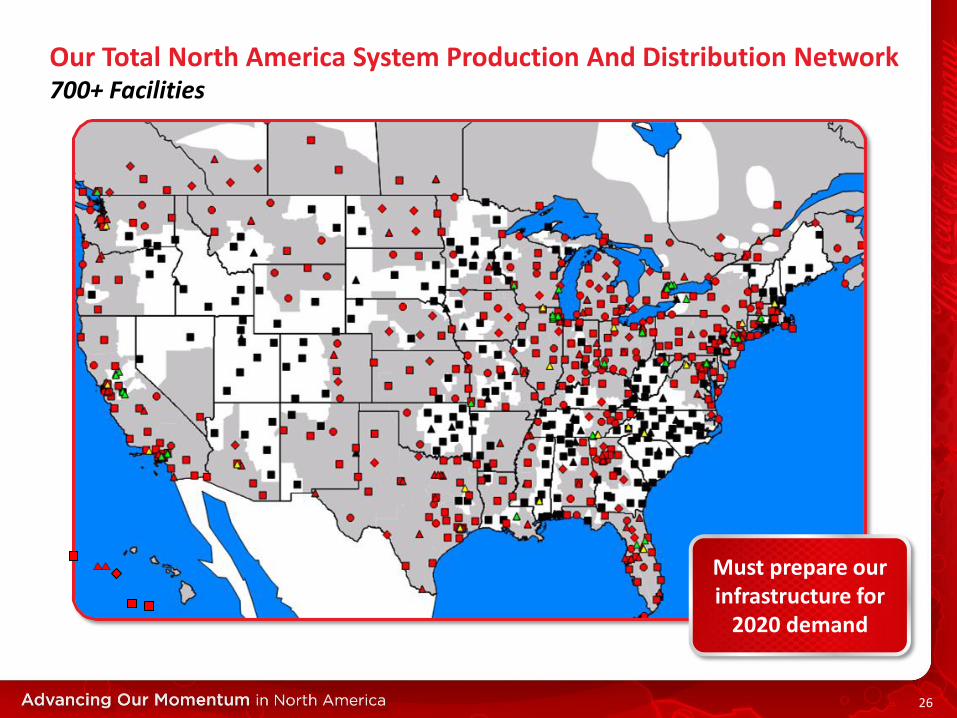
Must prepare our infrastructure for
2020 demand
Our Total North America System Production And Distribution Network 700+ Facilities
26
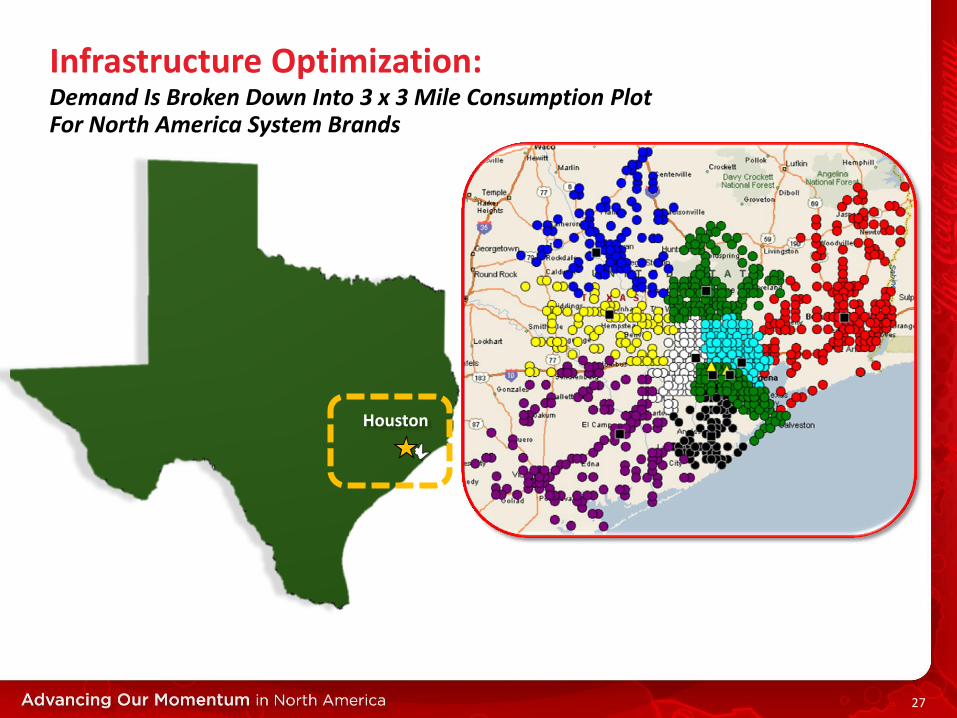
Infrastructure Optimization:
Houston
Demand Is Broken Down Into 3 x 3 Mile Consumption Plot For North America System Brands
27
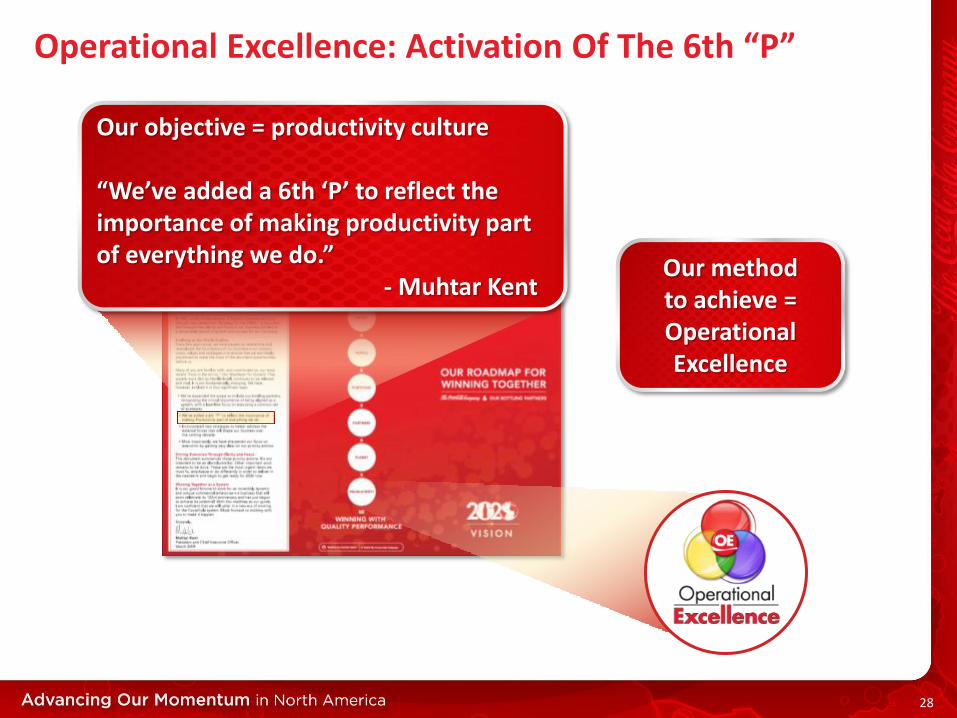
Operational Excellence: Activation Of The 6th “P”
Our method to achieve = Operational Excellence
Our objective = productivity culture “We’ve added a 6th ‘P’ to reflect the importance of making productivity part of everything we do.” - Muhtar Kent
28
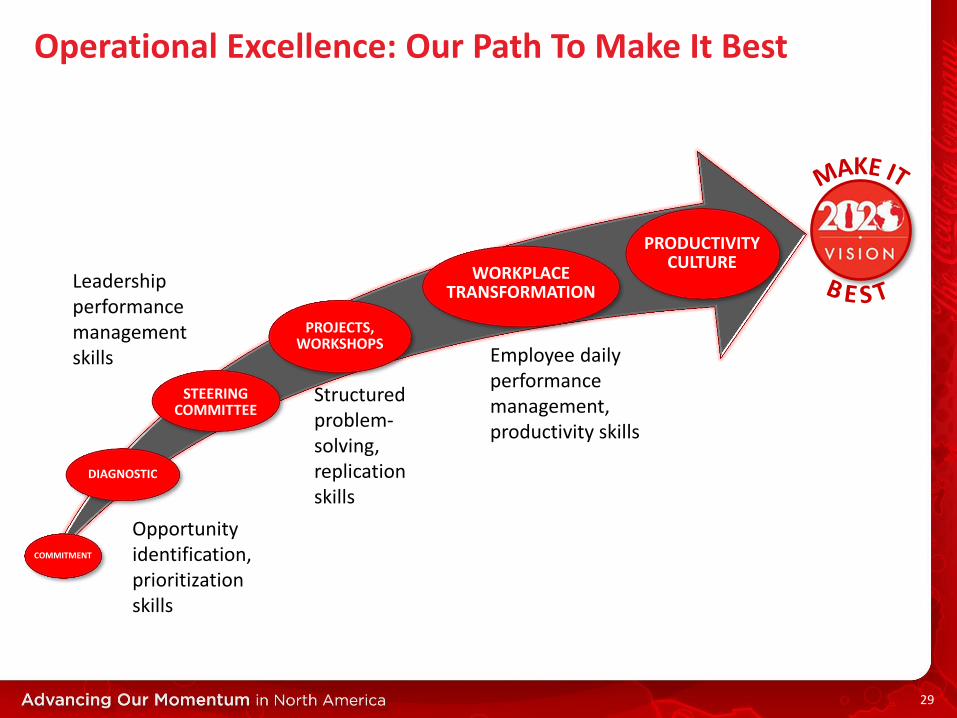
Operational Excellence: Our Path To Make It Best
COMMITMENT
DIAGNOSTIC
STEERING COMMITTEE
PROJECTS, WORKSHOPS
WORKPLACE TRANSFORMATION
PRODUCTIVITY CULTURE
Opportunity identification, prioritization skills
Leadership performance management skills
Structured problem-solving, replication skills
Employee daily performance management, productivity skills
29