Embed Size (px)
DESCRIPTION
Services Nevada. Presents. Statistics and Market Study. How to obtain the “Statistics You Must Know”. Log onto MLXchange to begin your compilations. Total Active Residential Listings. Select Property Subtypes: CON, SFR,TWH Select Status: EA, ER - PowerPoint PPT Presentation
Citation preview

Presents
Statistics and Market Study
Services Nevada
2
How to obtain the “Statistics You Must Know”
Log onto MLXchange to
begin your compilations
3
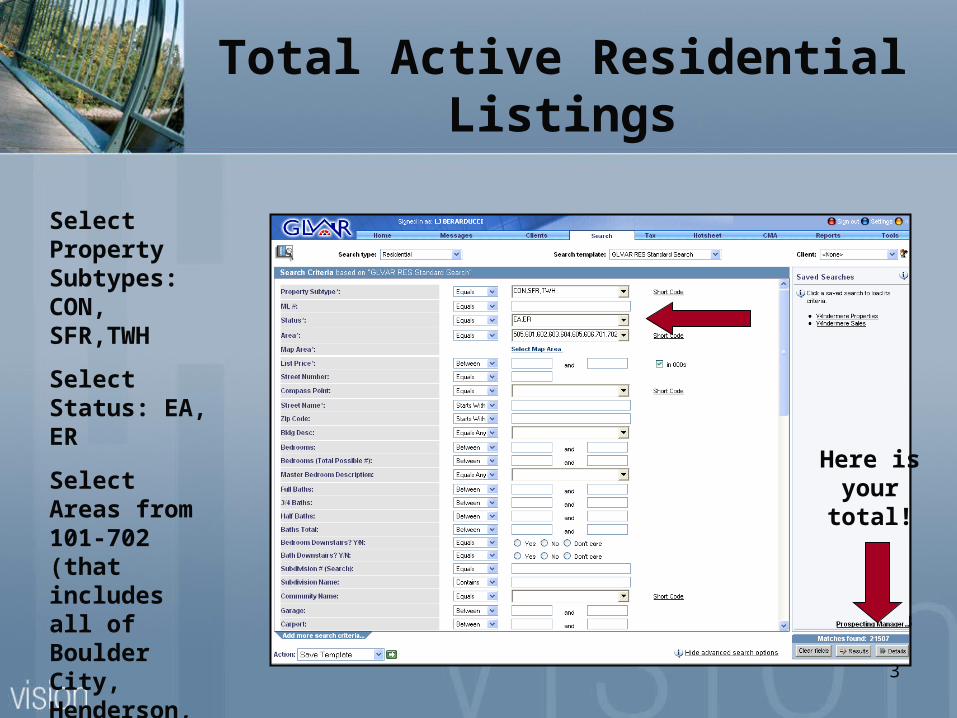
Total Active Residential Listings
Select Property Subtypes: CON, SFR,TWH
Select Status: EA, ER
Select Areas from 101-702 (that includes all of Boulder City, Henderson, North Las Vegas and Las Vegas)
3
Here is your total!

4
To Find Last Year Comparables, go to www.lasvegasrealtor.com and log in
Go to “Sale Stats” and
then “Monthly Stats” for
the information
5
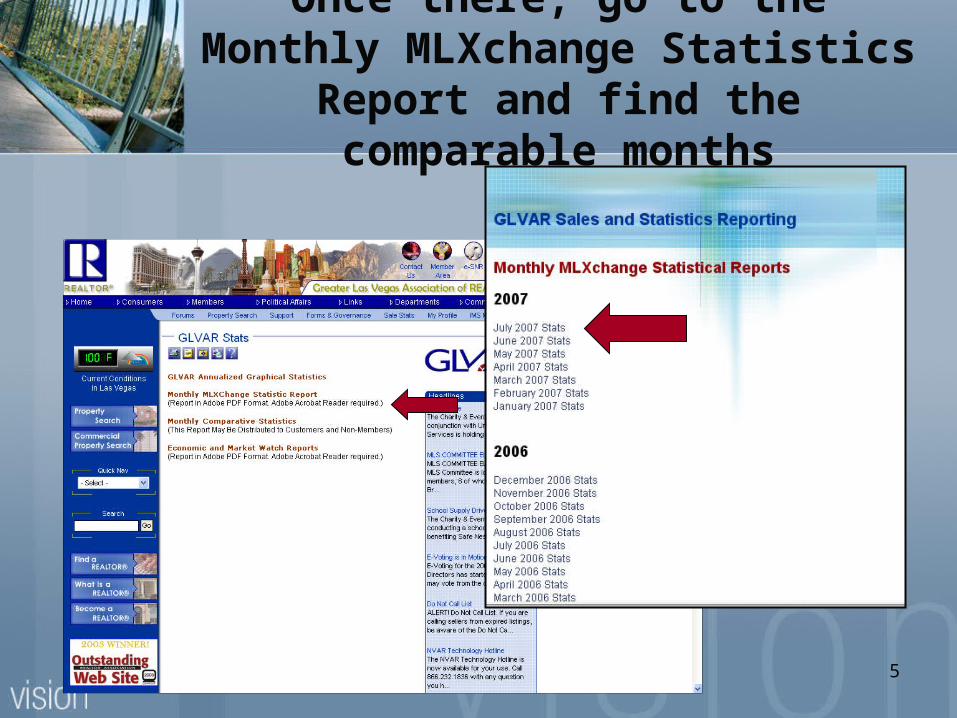
Once there, go to the Monthly MLXchange Statistics Report and find
the comparable months
6
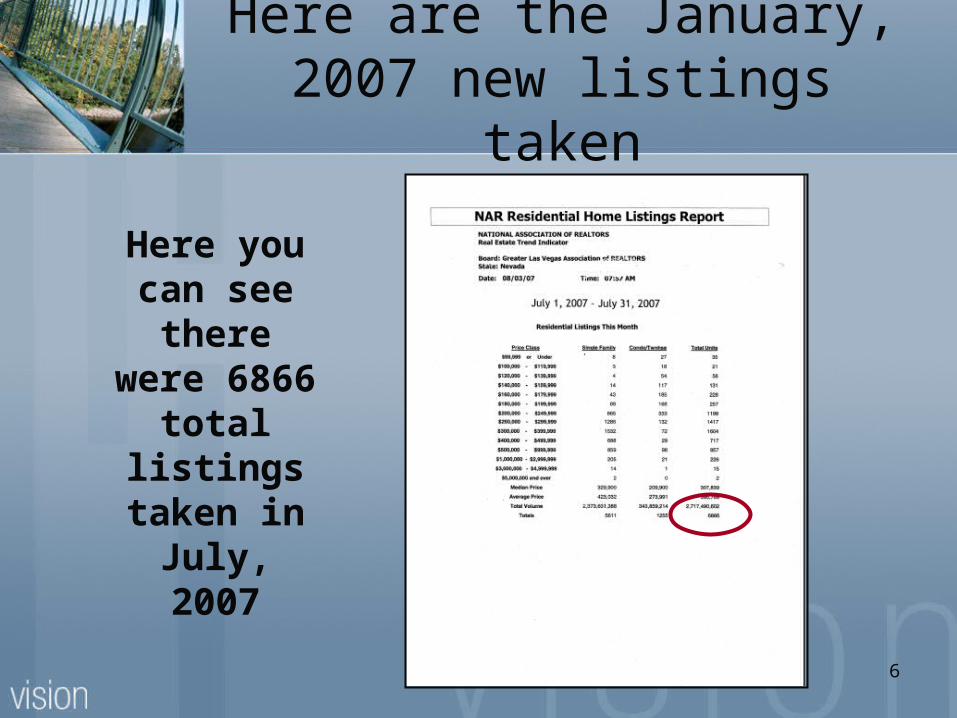
Here are the January, 2007 new listings taken
Here you can see there
were 6866 total listings
taken in July, 2007
7
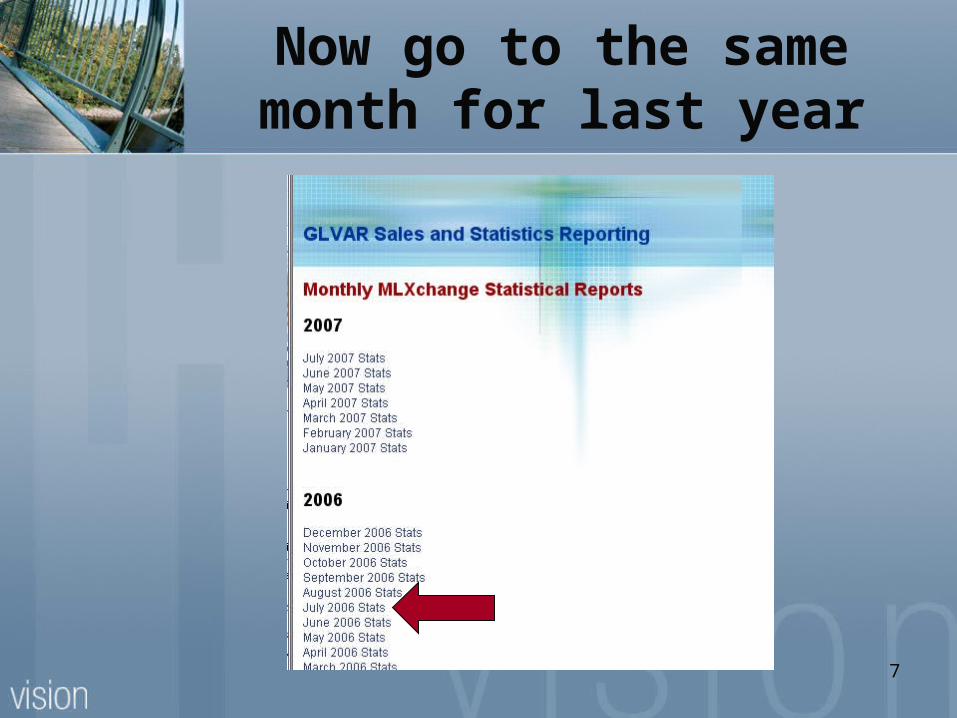
Now go to the same month for last year
8
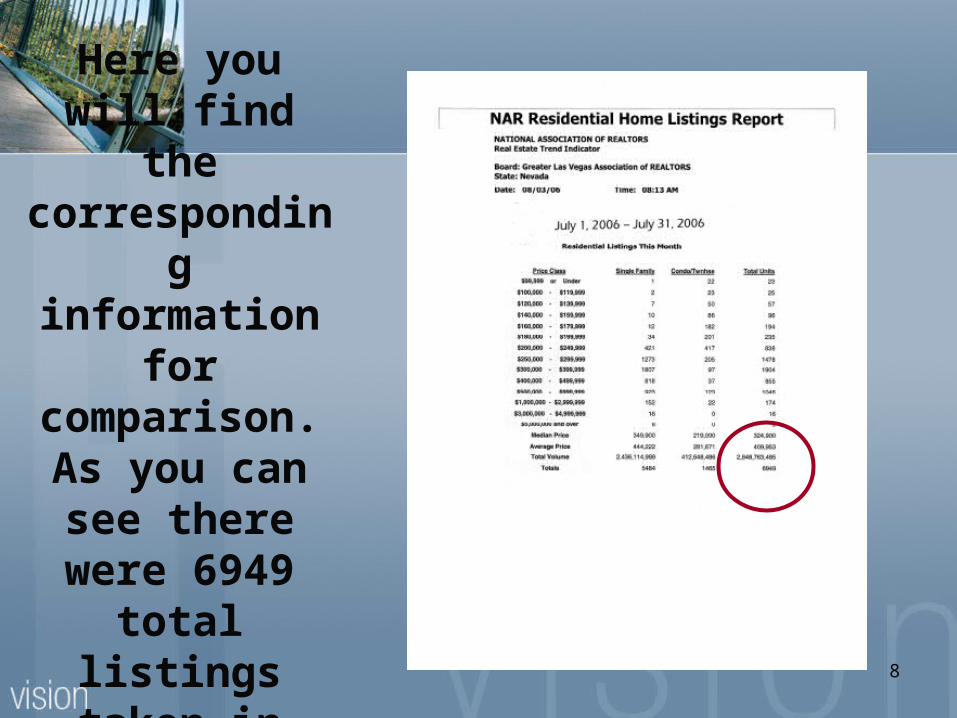
Here you will find the
corresponding information for
comparison.As you can see
there were 6949 total listings
taken in July, 2006
9
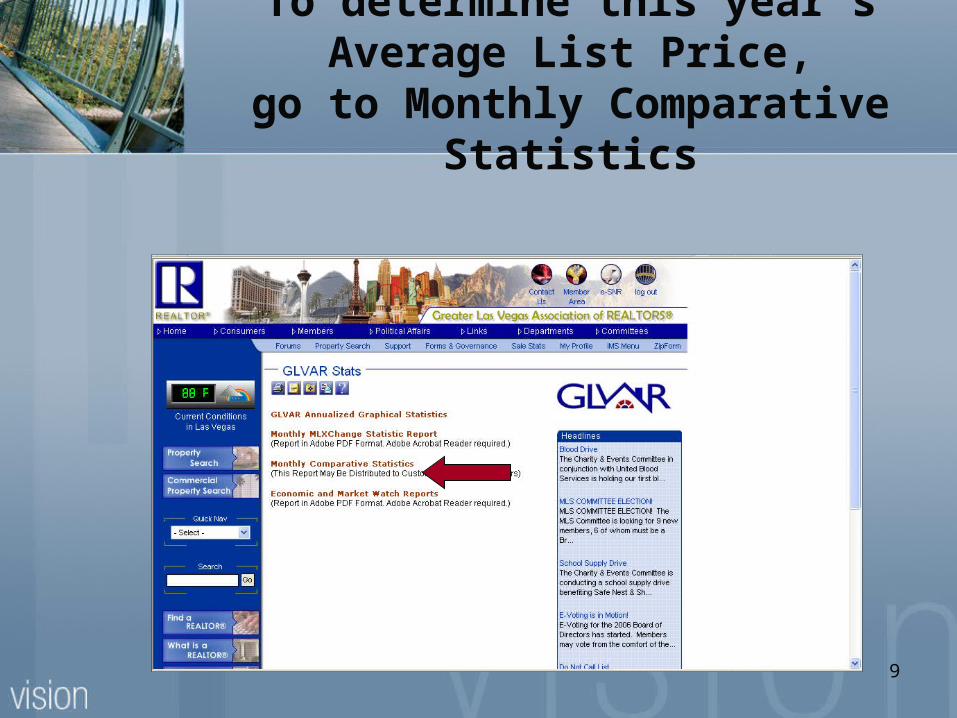
To determine this year’sAverage List Price,
go to Monthly Comparative Statistics
10
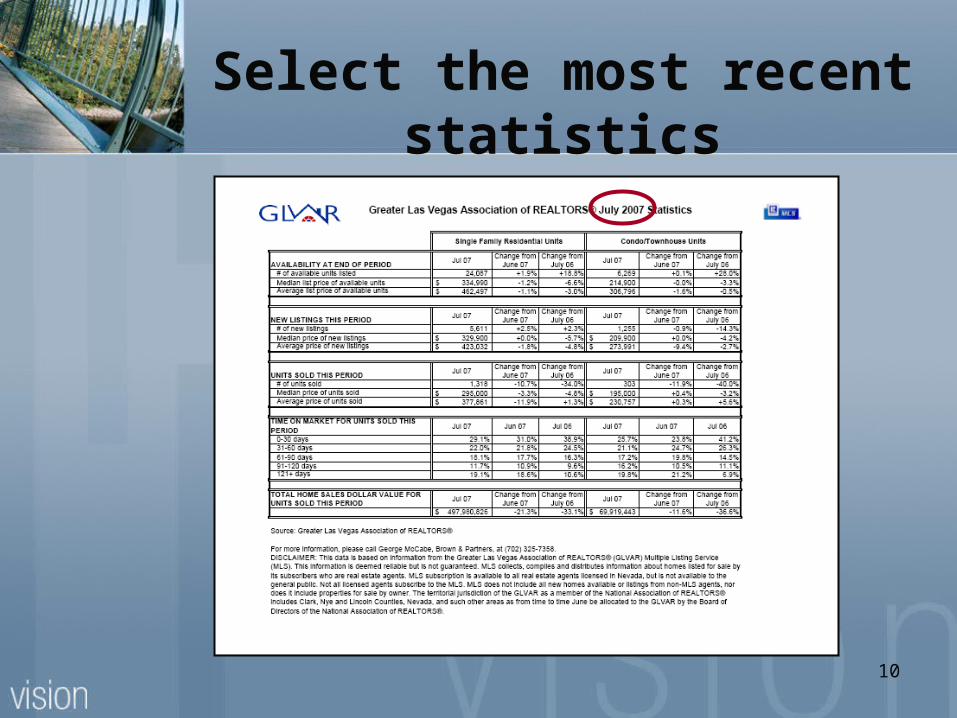
Select the most recent statistics
11
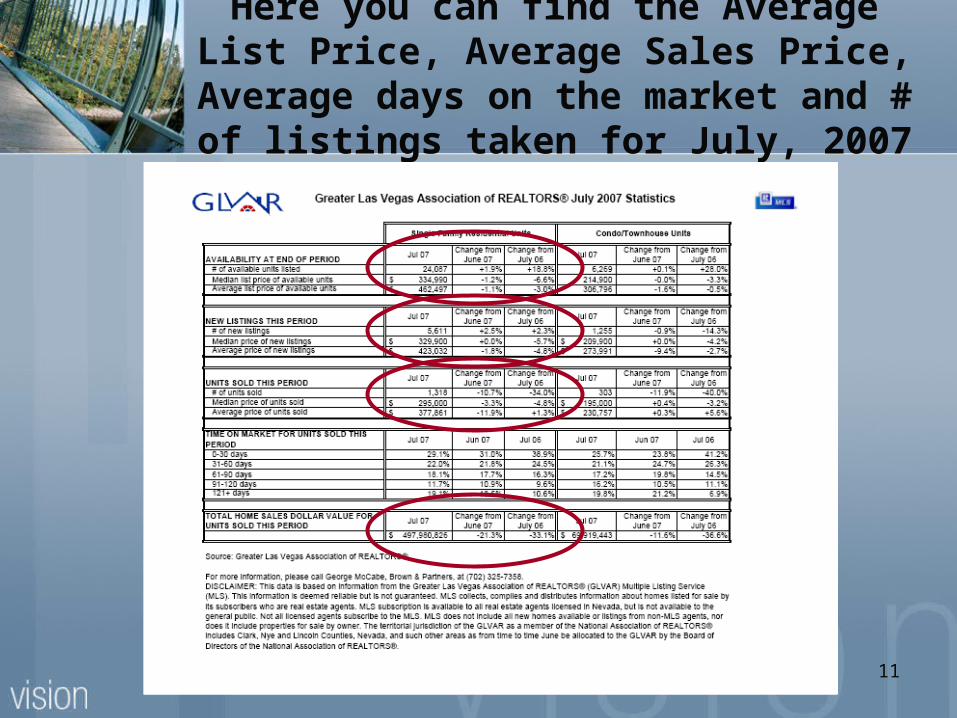
Here you can find the Average List Price, Average Sales Price, Average days on the
market and # of listings taken for July, 2007
12
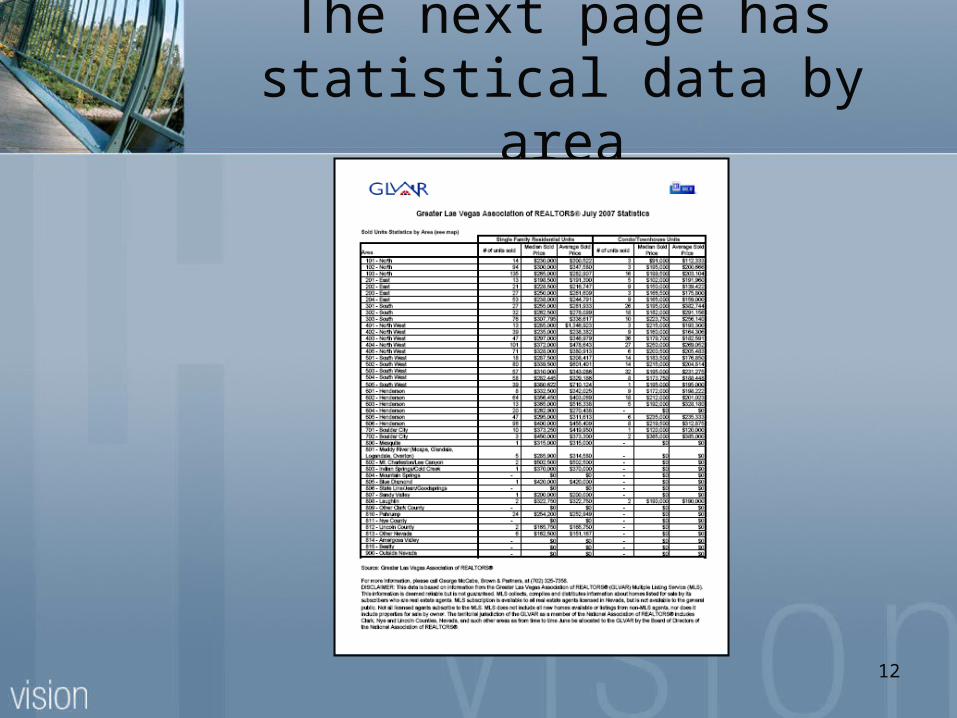
The next page has statistical data by area
13
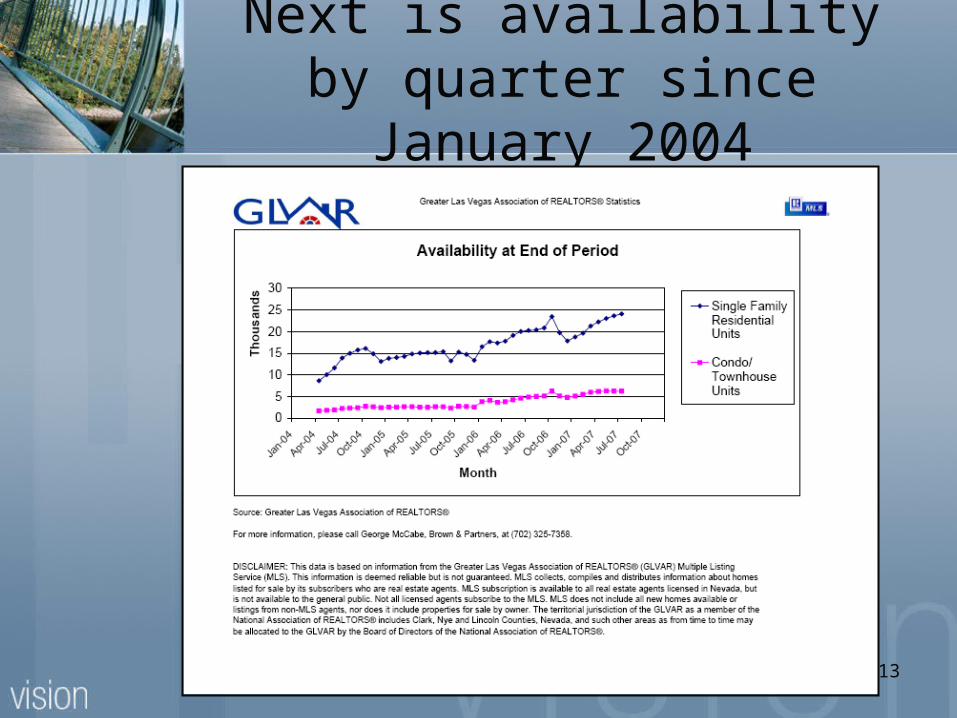
Next is availability by quarter since January 2004
14
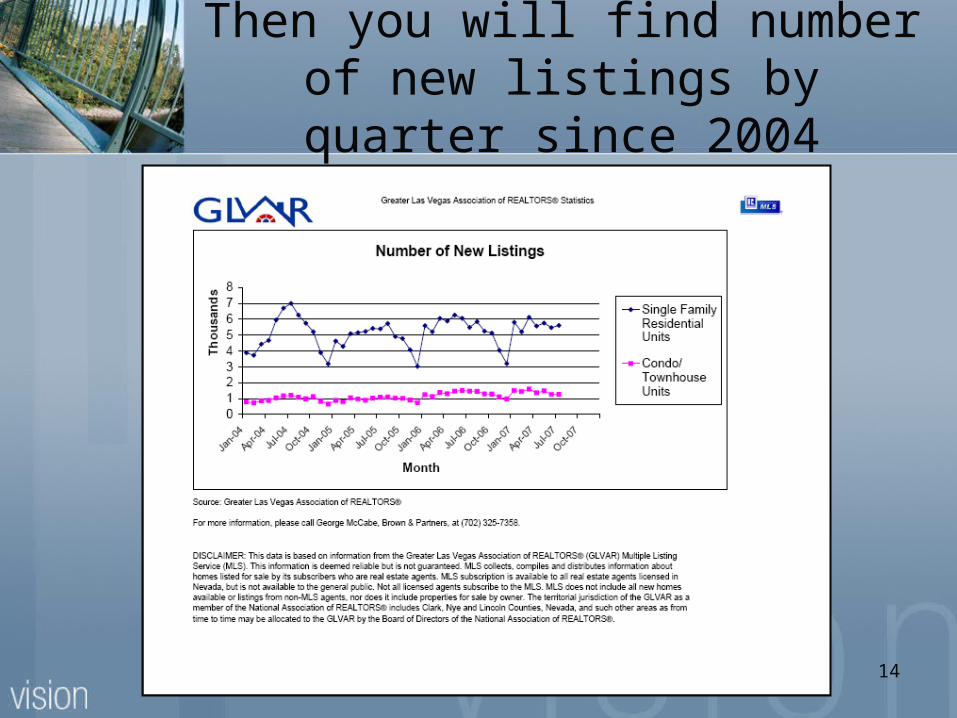
Then you will find number of new listings by quarter since 2004
15
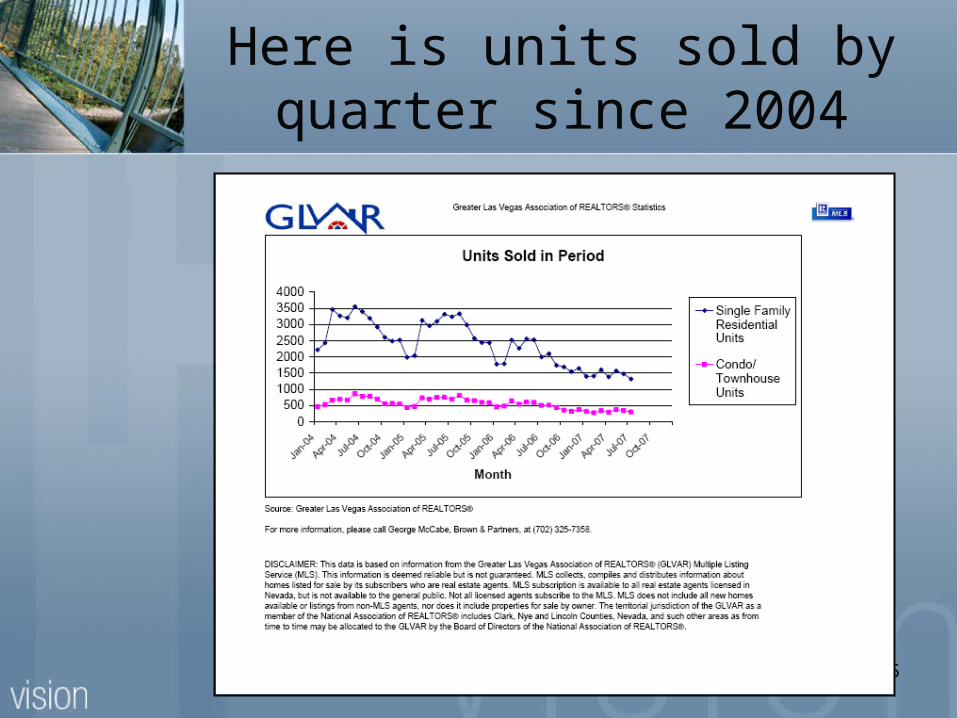
Here is units sold by quarter since 2004
16
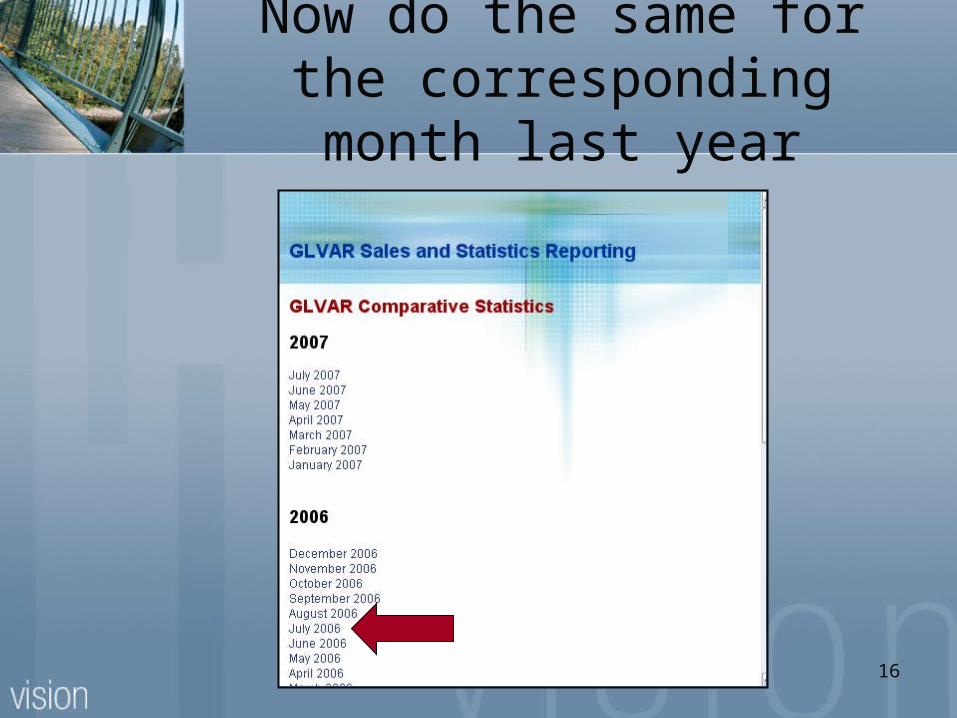
Now do the same for the corresponding month last year
17
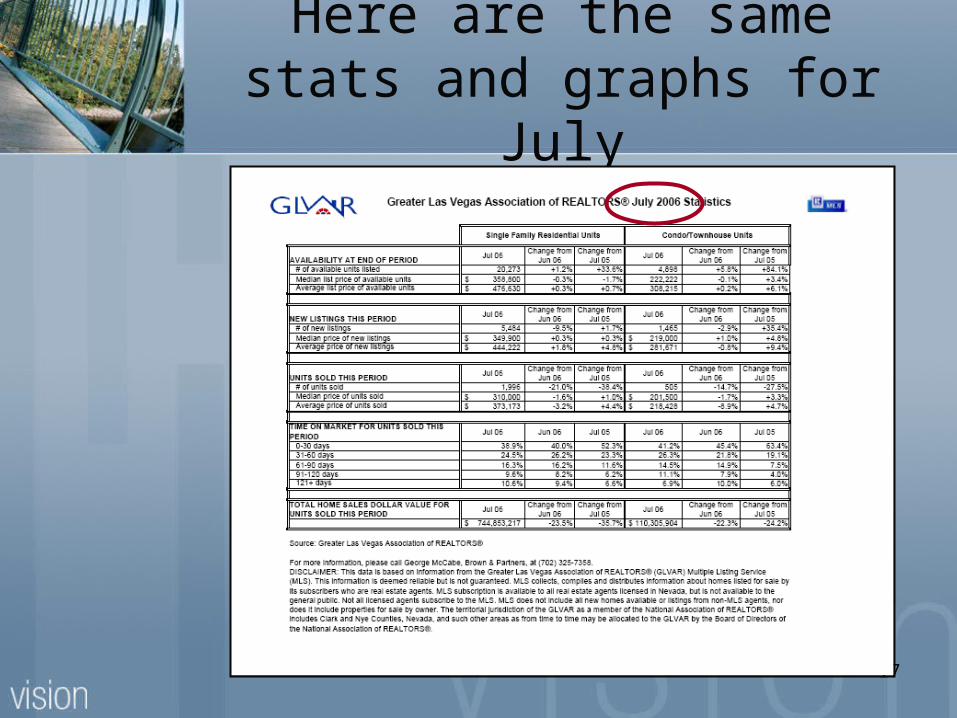
Here are the same stats and graphs for July
18
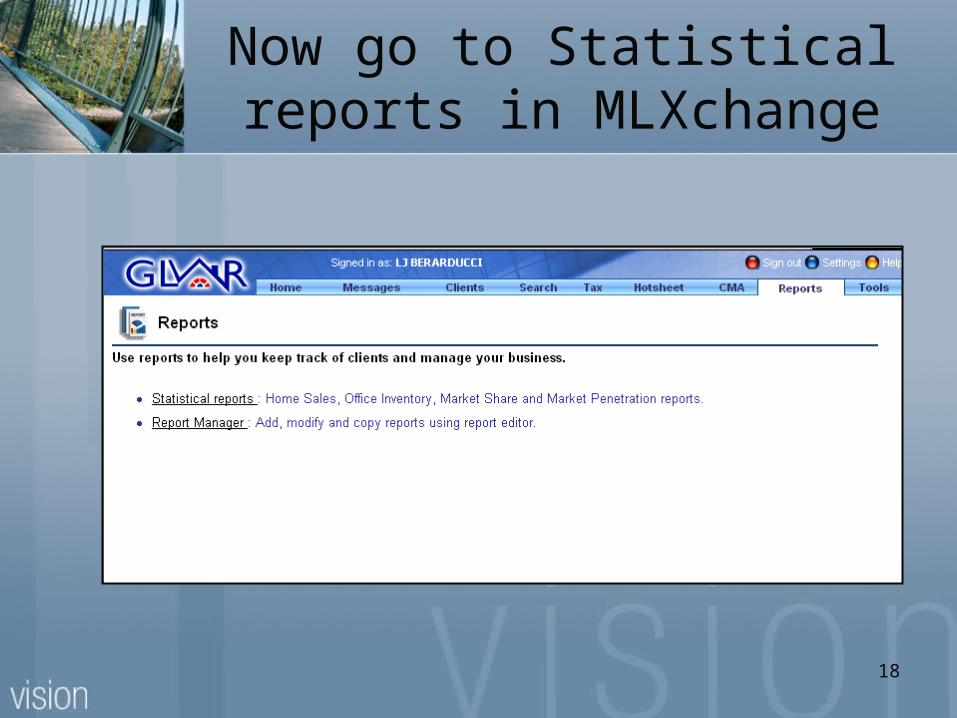
Now go to Statistical reports in MLXchange
19
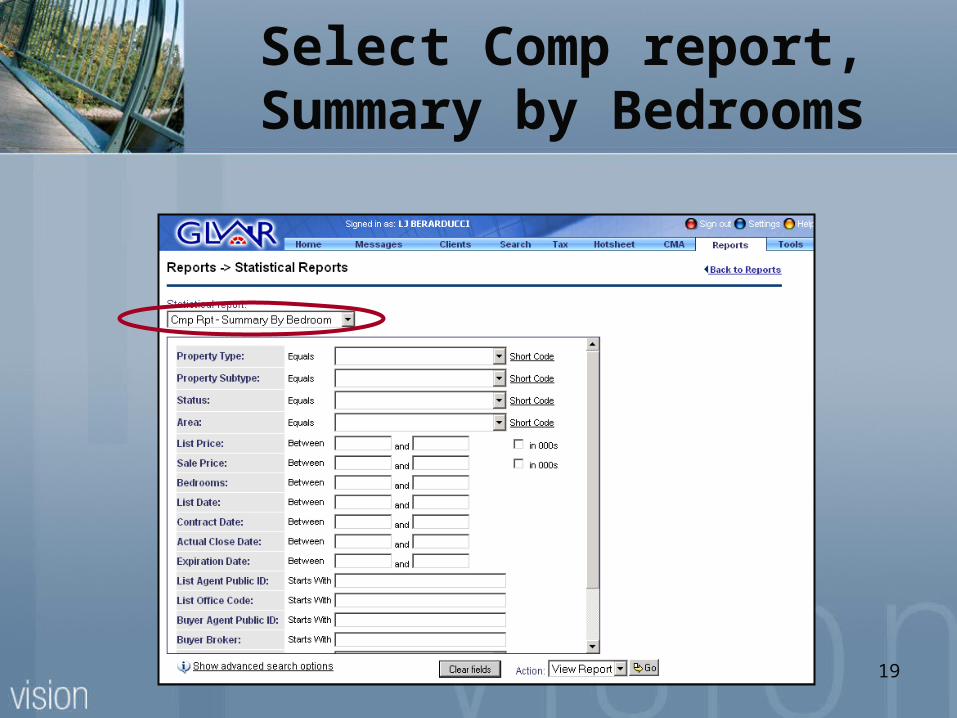
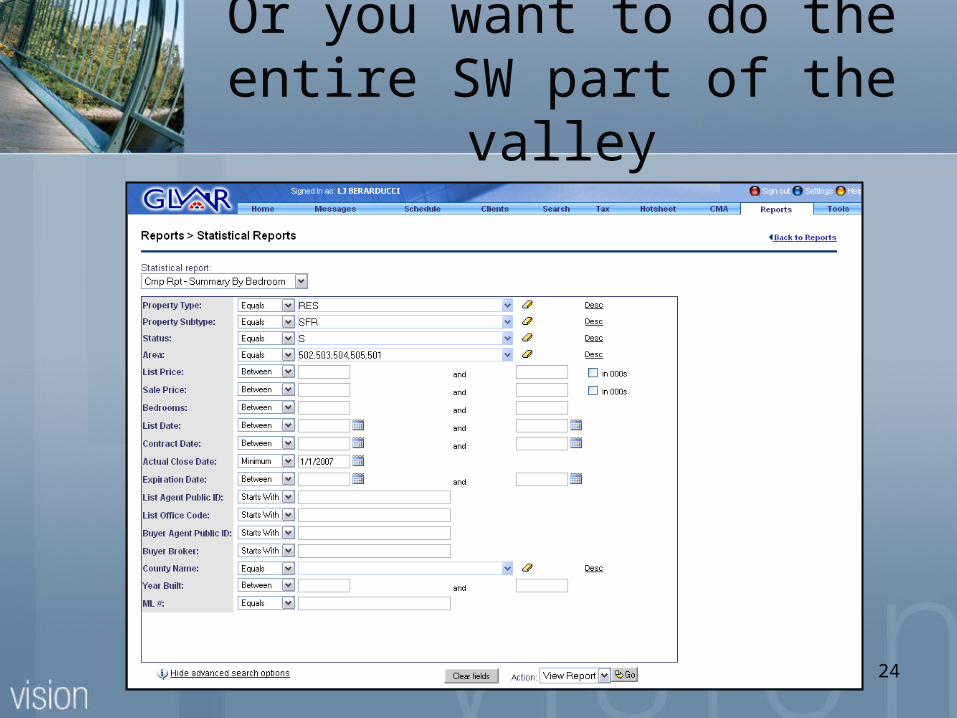
Select Comp report, Summary by Bedrooms
20
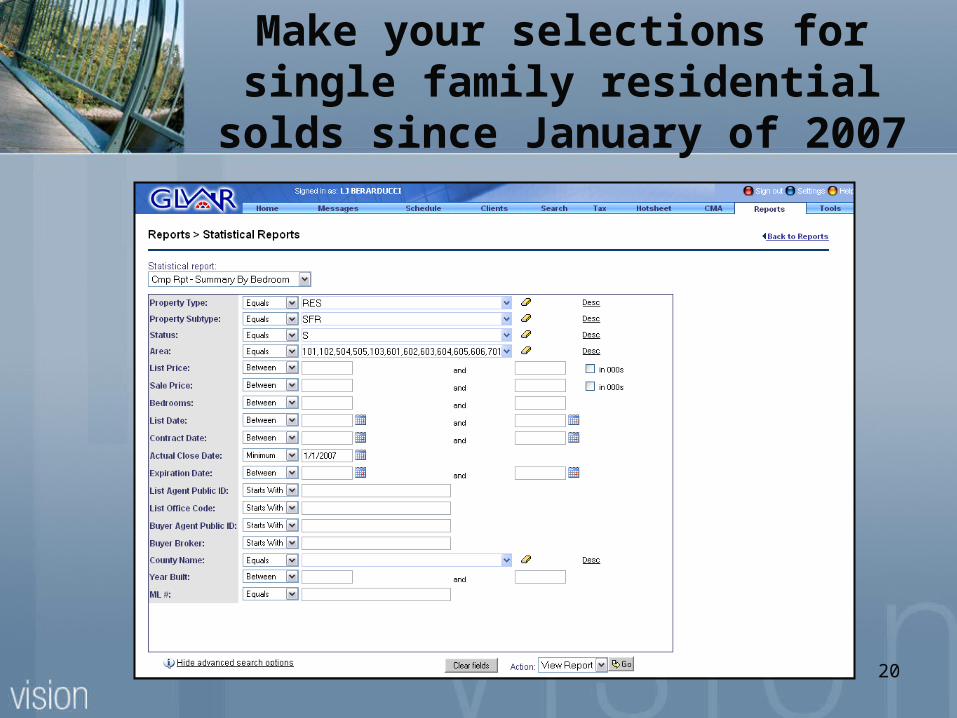
Make your selections for single family residential solds since January of 2007
21
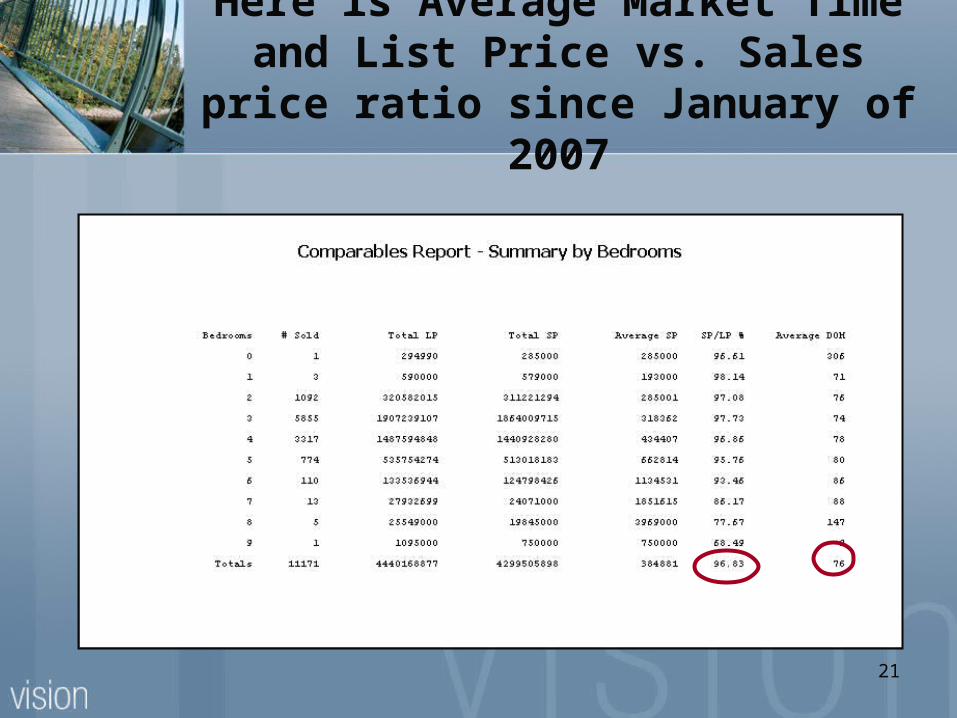
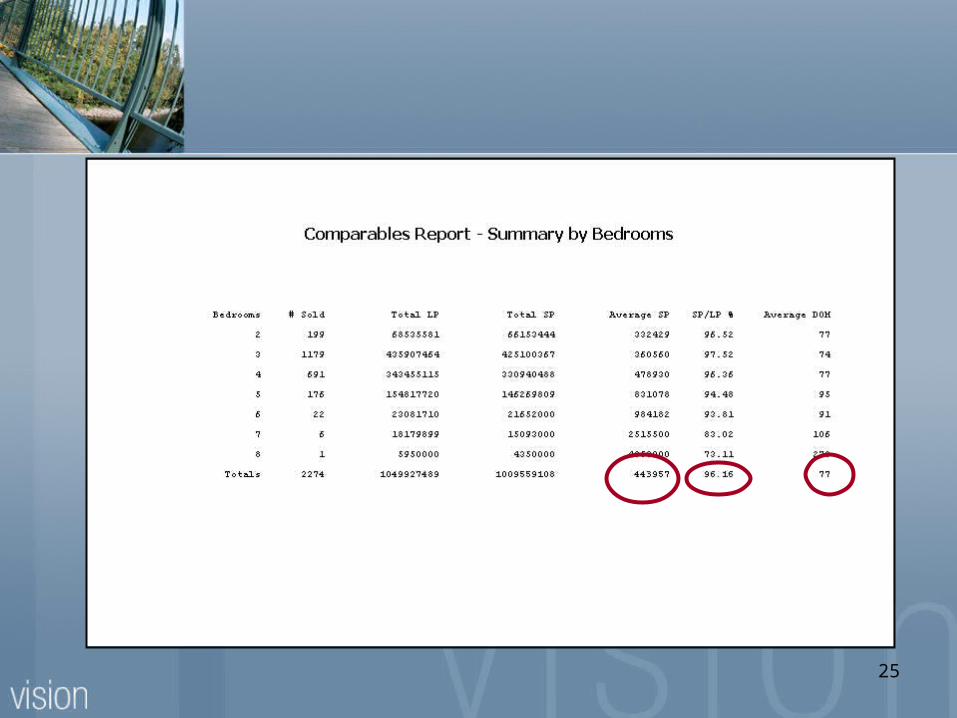
Here is Average Market Time and List Price vs. Sales price ratio since January
of 2007
22
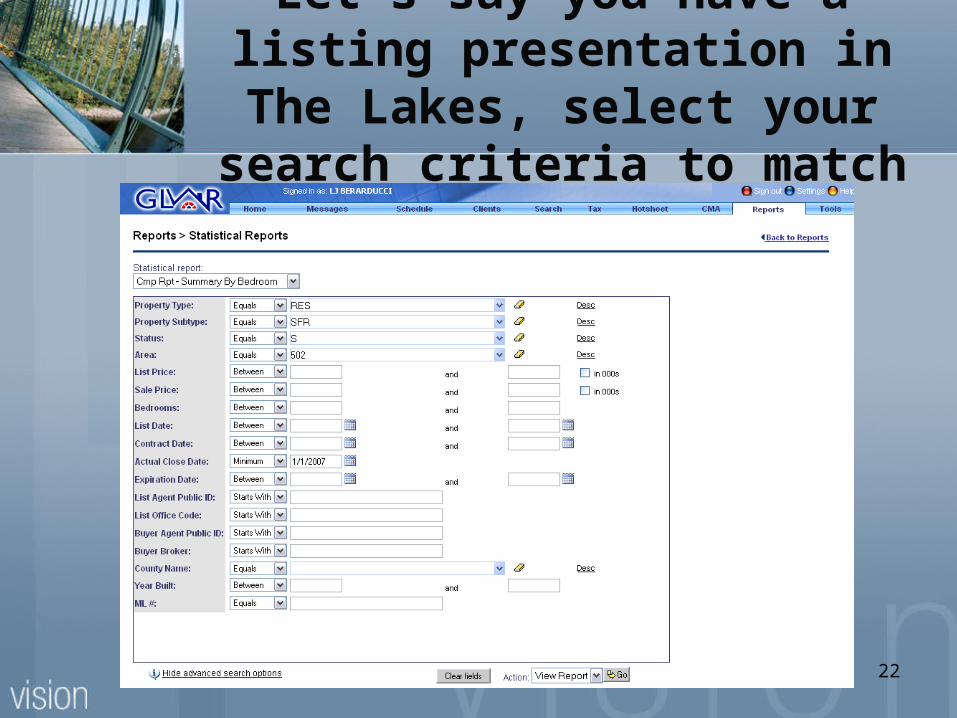
Let’s say you have a listing presentation in The Lakes, select
your search criteria to match
23
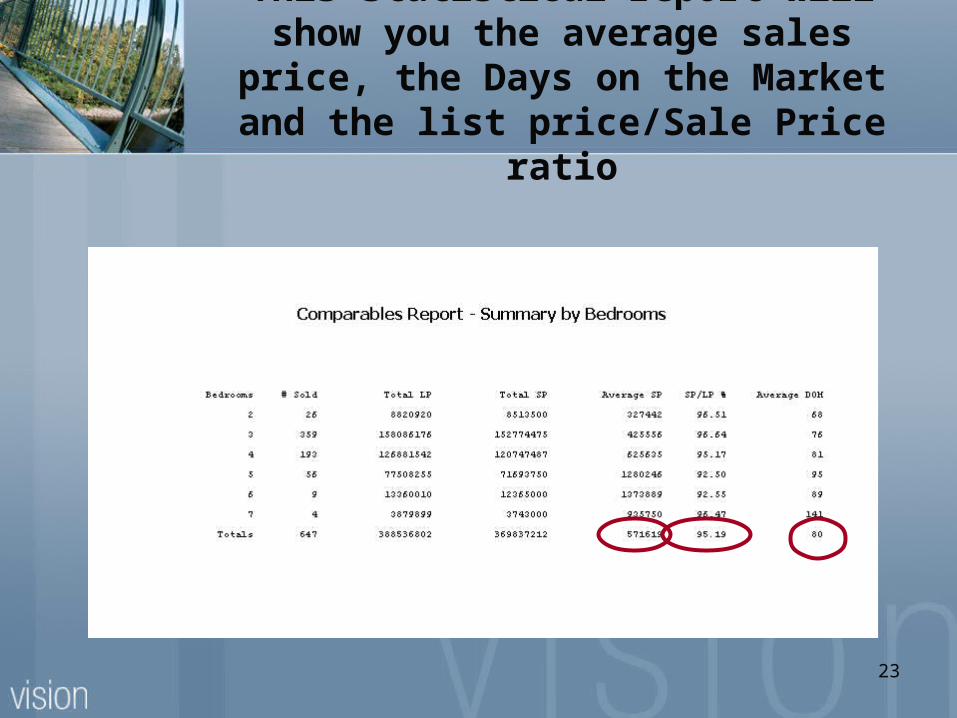
This statistical report will show you the average sales price, the Days on the Market
and the list price/Sale Price ratio
24
Or you want to do the entire SW part of the valley
25
26
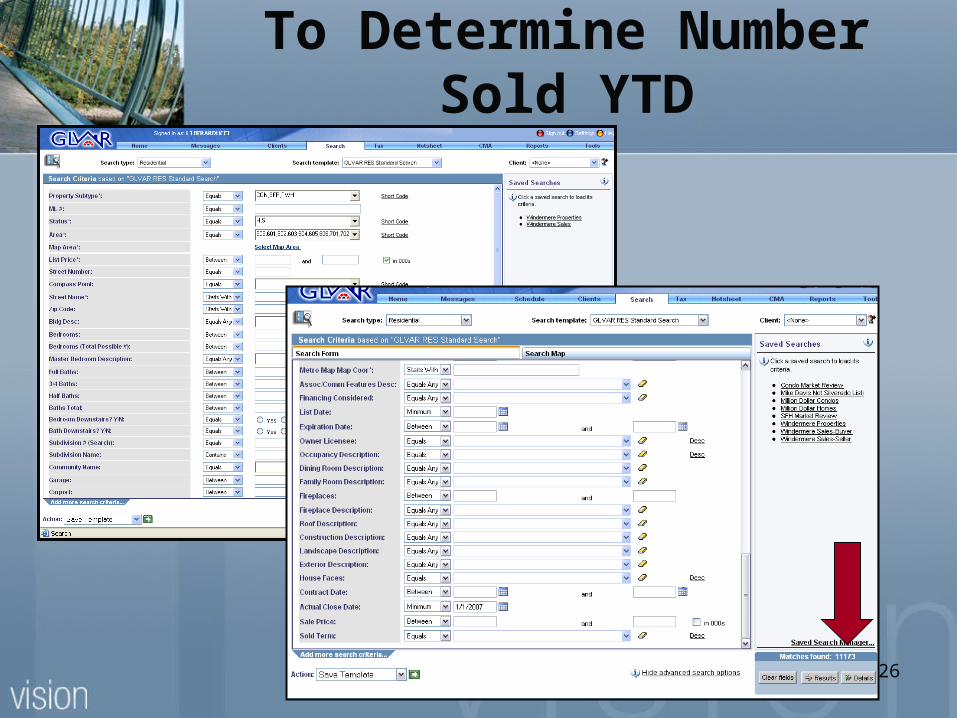
To Determine Number Sold YTD
27
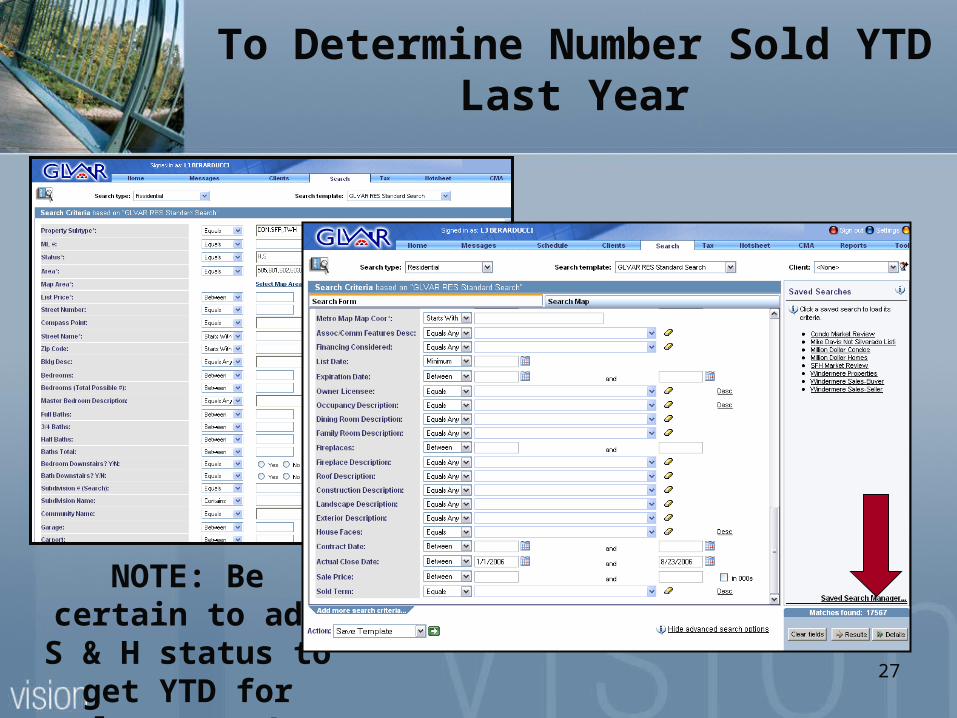
To Determine Number Sold YTDLast Year
NOTE: Be certain to add S & H status to
get YTD for last year!
28
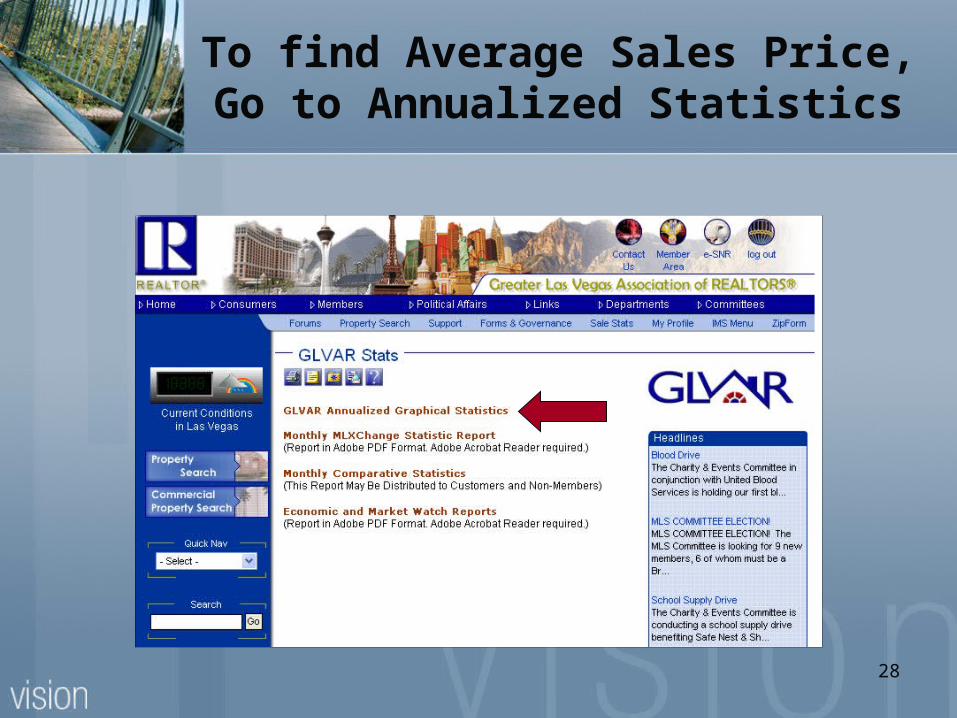
To find Average Sales Price, Go to Annualized Statistics
29
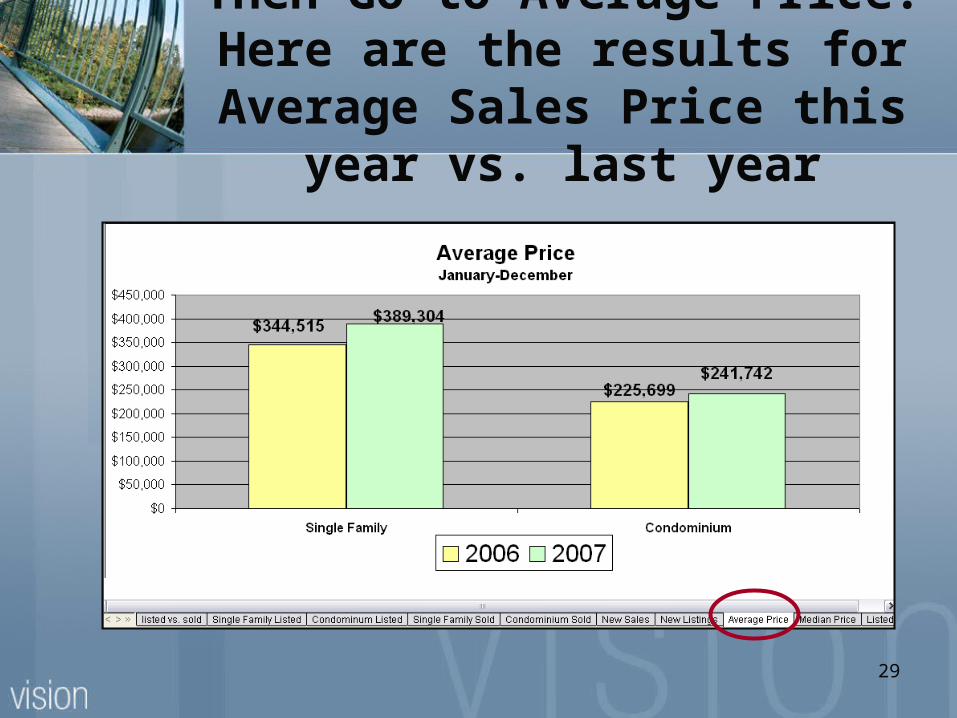
Then Go to Average Price. Here are the results for Average Sales
Price this year vs. last year
30
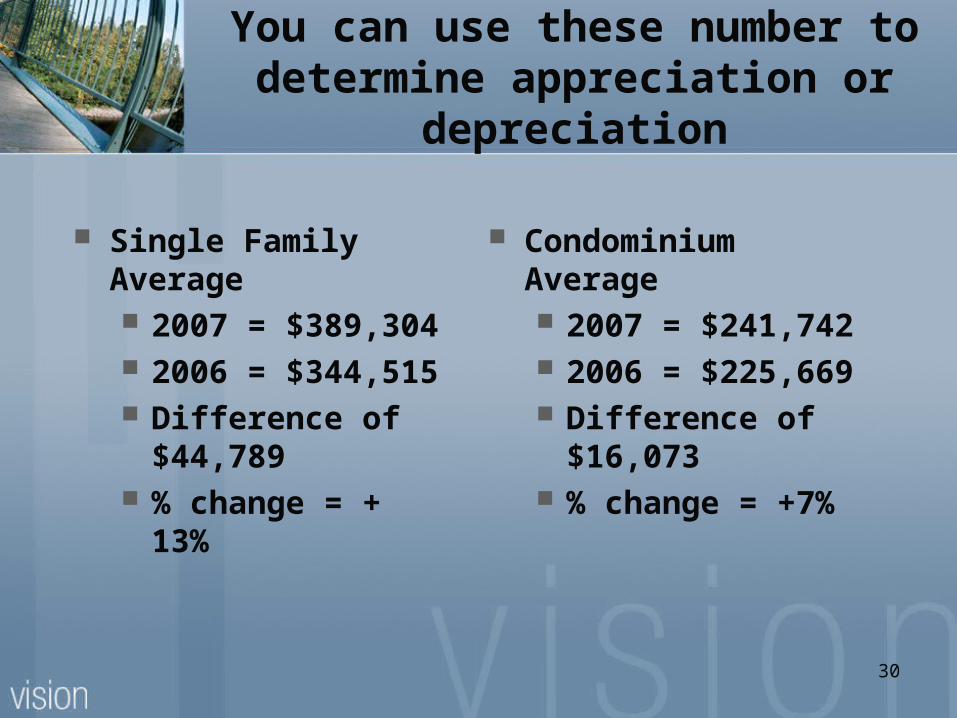
You can use these number to determine appreciation or depreciation
Single Family Average 2007 = $389,304 2006 = $344,515 Difference of $44,789 % change = + 13%
Condominium Average 2007 = $241,742 2006 = $225,669 Difference of $16,073 % change = +7%
31
Market Study of Subdivision
You will first determine the number of homes in the subdivision by going to the tax record in MLXchange
Type in the subdivision name and proceed
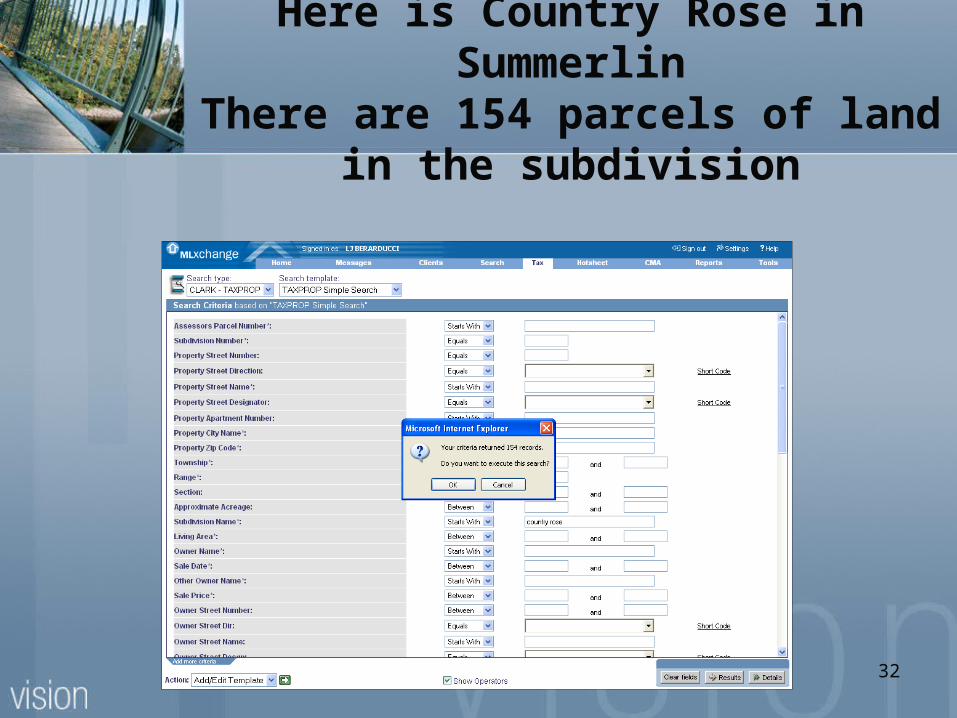
32
Here is Country Rose in SummerlinThere are 154 parcels of land in the
subdivision
33
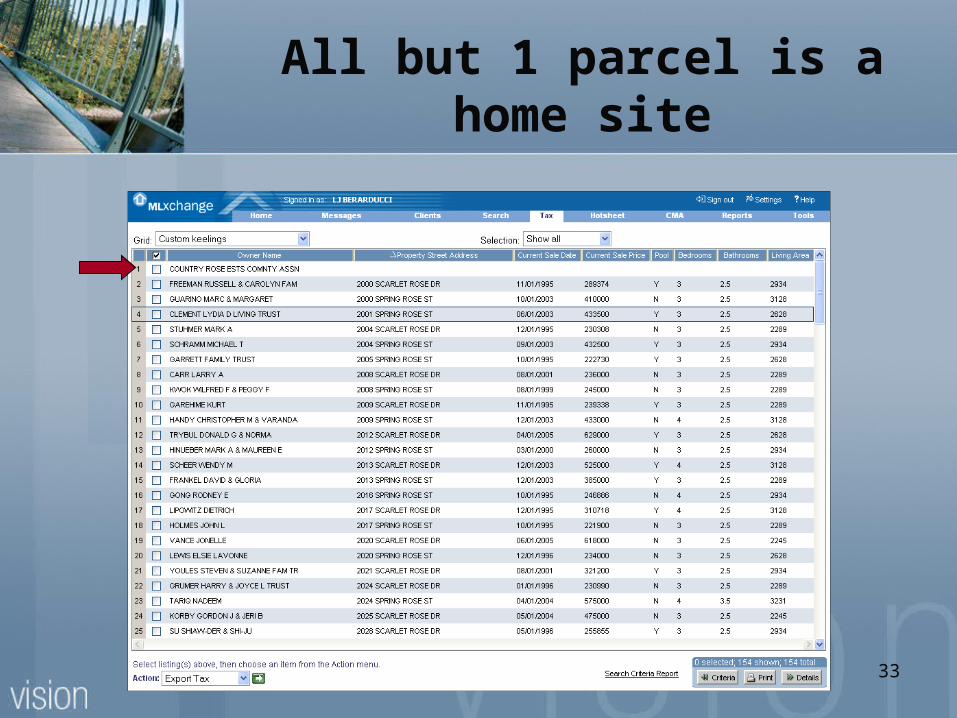
All but 1 parcel is a home site
34
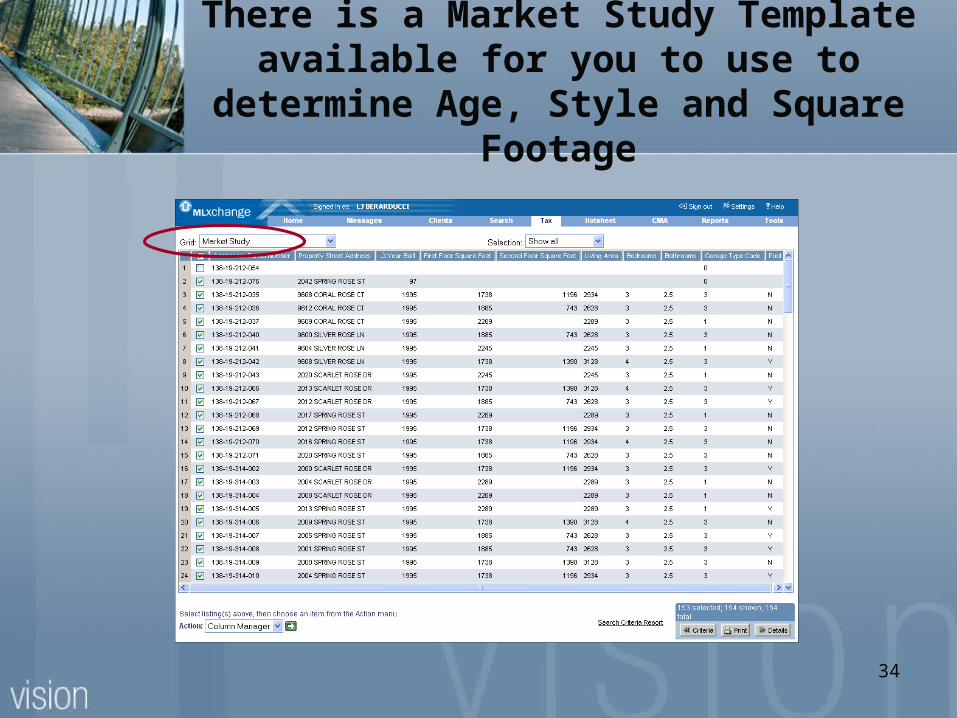
There is a Market Study Template available for you to use to determine Age, Style and
Square Footage
35
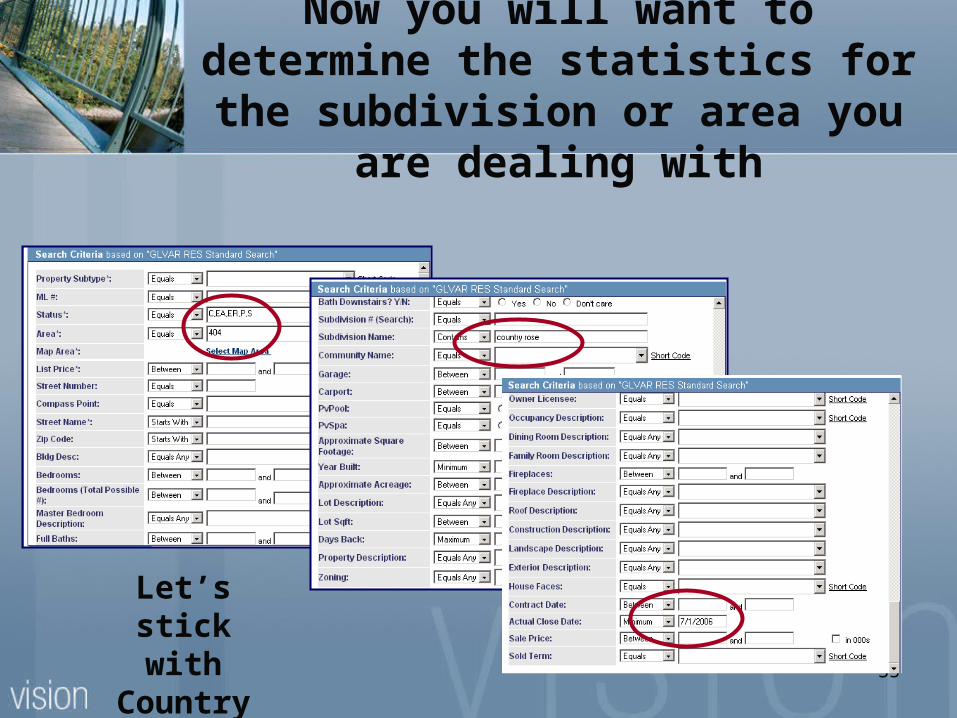
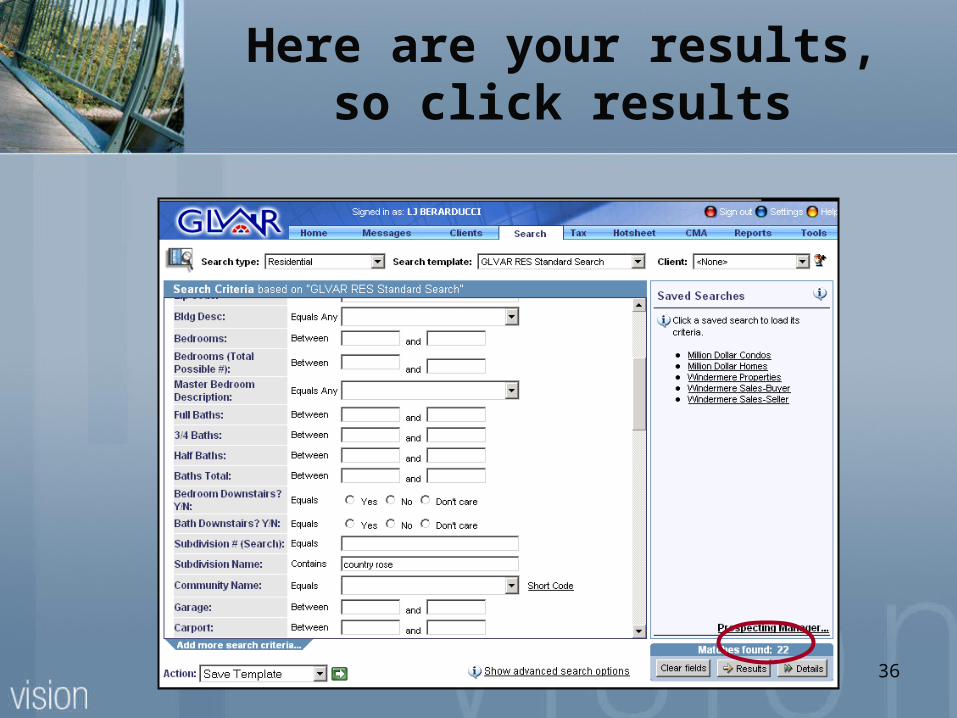
Now you will want to determine the statistics for the subdivision or area
you are dealing with
Let’s stick with Country
Rose
36
Here are your results, so click results
37
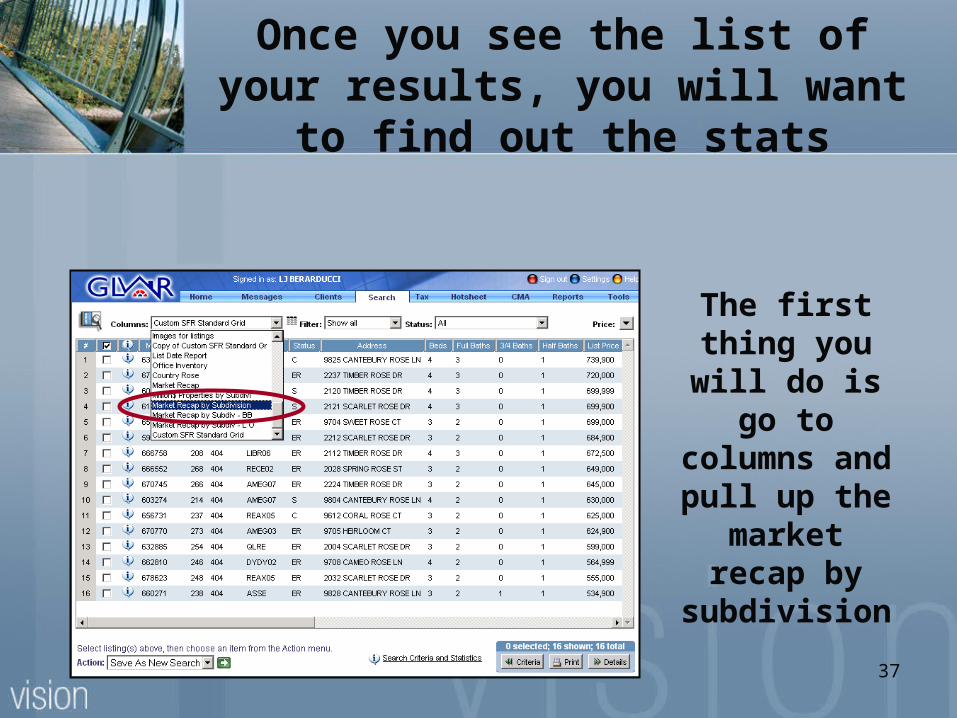
Once you see the list of your results, you will want to find out the stats
The first thing you will do is go to columns
and pull up the market recap by subdivision
38
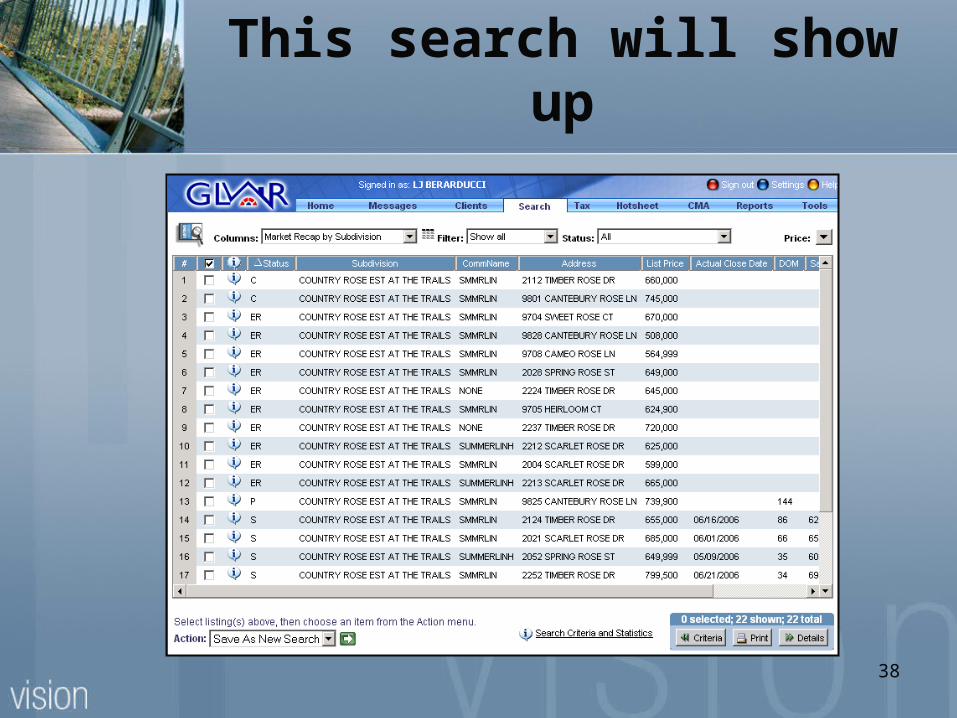
This search will show up
39
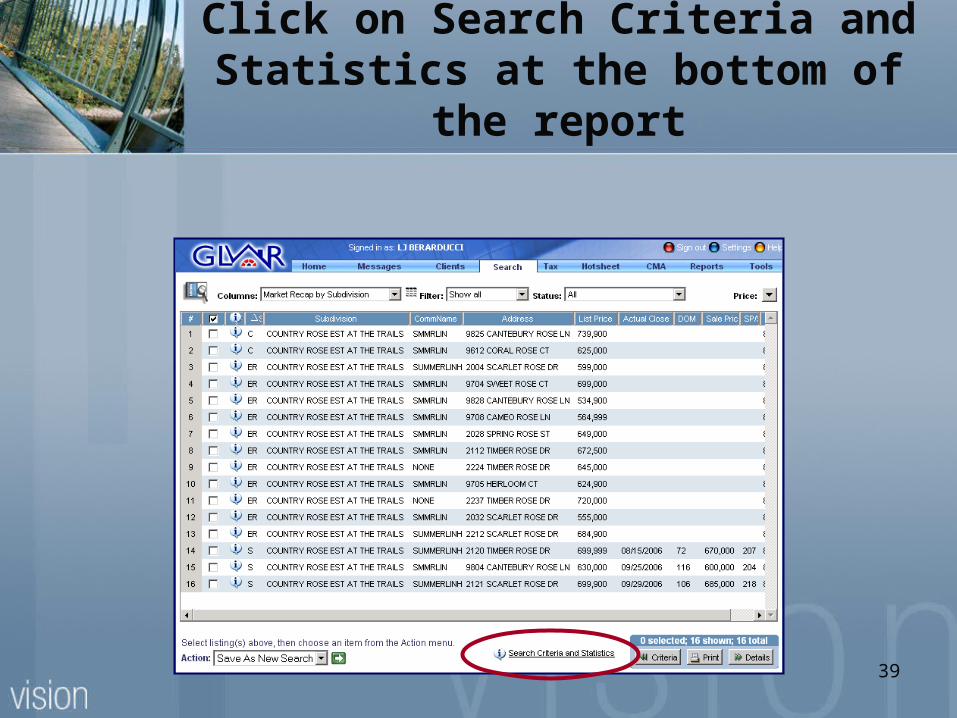
Click on Search Criteria and Statistics at the bottom of the report
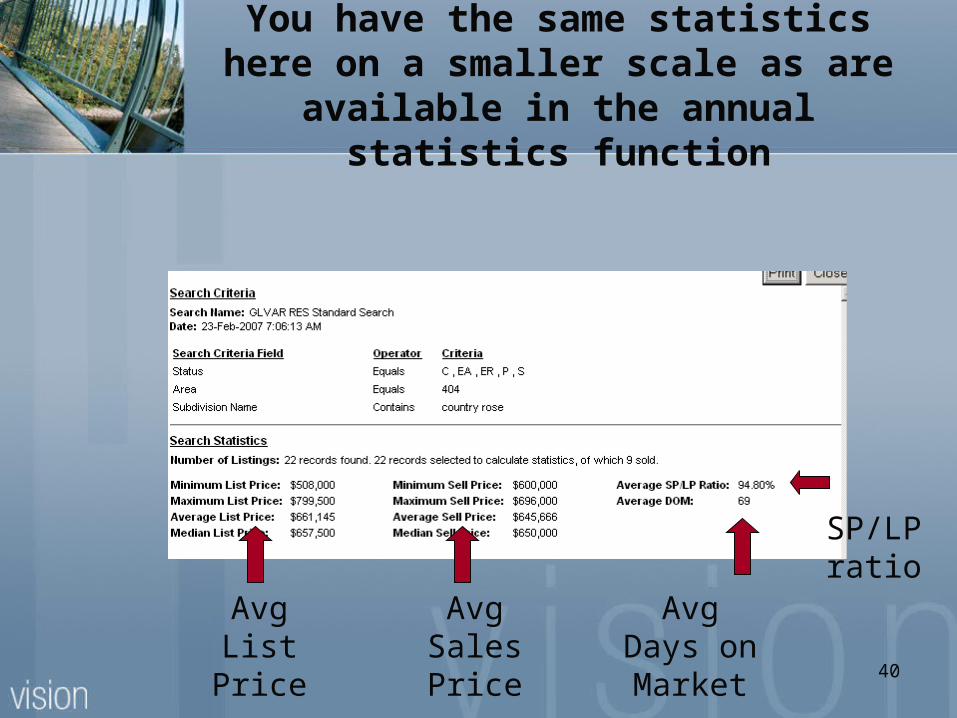
40
You have the same statistics here on a smaller scale as are available in the annual
statistics function
Avg List Price
Avg Sales Price
Avg Days on Market
SP/LP ratio
41
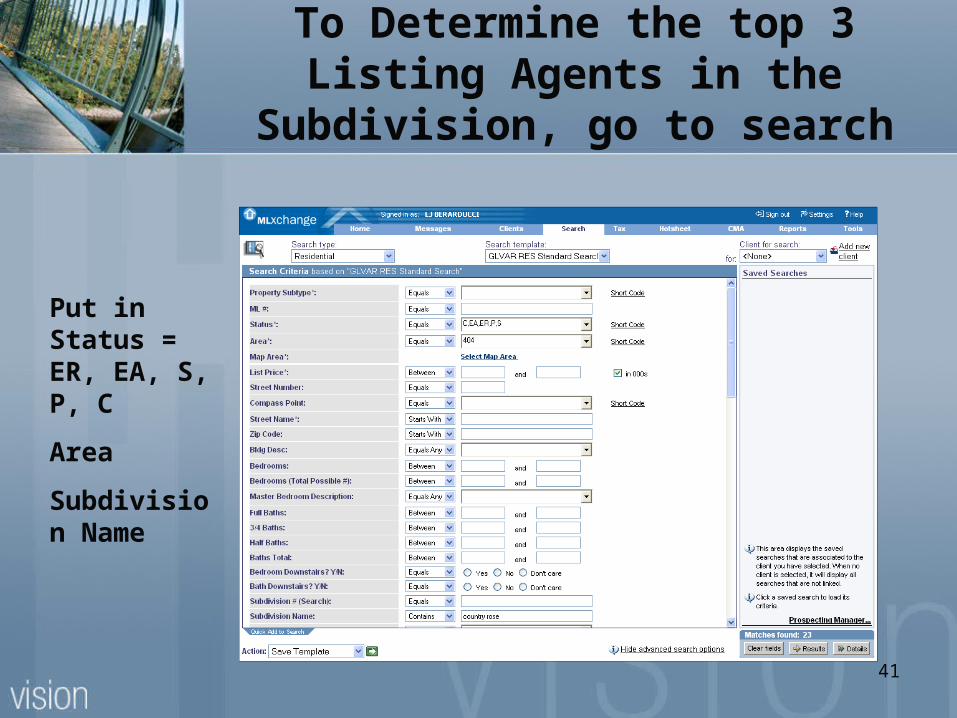
To Determine the top 3 Listing Agents in the Subdivision, go to search
Put in Status = ER, EA, S, P, C
Area
Subdivision Name
42
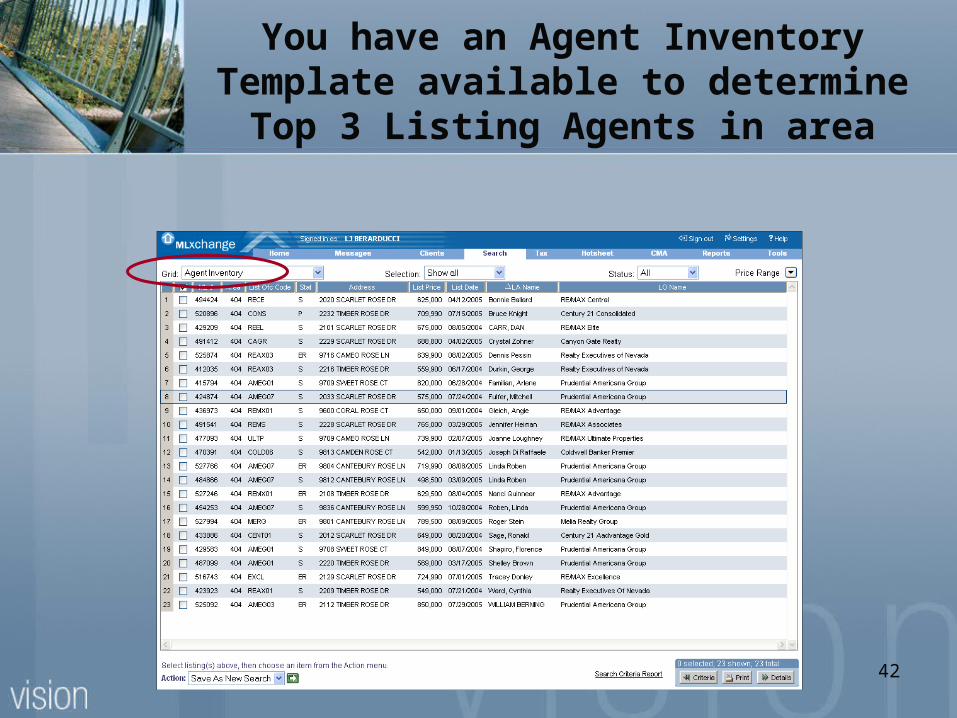
You have an Agent Inventory Template available to determine Top 3 Listing Agents in
area
43
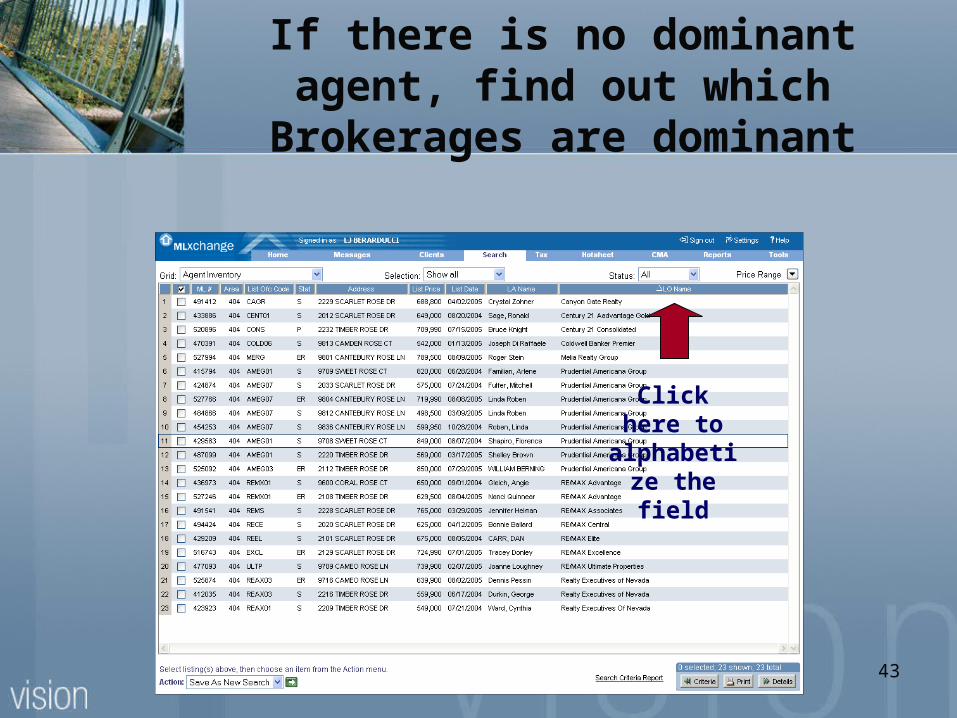
If there is no dominant agent, find out which Brokerages are dominant
Click here to alphabetize
the field

44
Your assignment is to prepare Statistics and a Market Study for
your neighborhood!