Embed Size (px)
Citation preview
Presenting results of CEA
Marcelo Coca Perraillon
University of ColoradoAnschutz Medical Campus
Cost-Effectiveness AnalysisHSMP 6609
2016
1 / 29
Big picture
We have already covered the most important topics
Today we will start reviewing them
Learning about guidelines for presenting results is important because
1 It helps you focus on the important aspects of CEA2 It makes CEA studies easier to compare3 It makes writing a paper a lot easier
Because comparability is so important in CEA, there are plenty ofrecommendations on how to present results
2 / 29
Sources
The Consolidated Health Economic Evaluation Reporting Standards(CHEERS):
“[An] attempt to consolidate and update previous health economicevaluation guidelines efforts into one current, useful reportingguidance.” (Husereau et al, 2013)
Summary of CHEERS in Chapter 10 of Meunning and Bounthavong(2016)
Drummond et al (2005), Chapter 10
The checklist to assess economic evaluations (Chapter 3)
3 / 29
Rationale for CHEERS
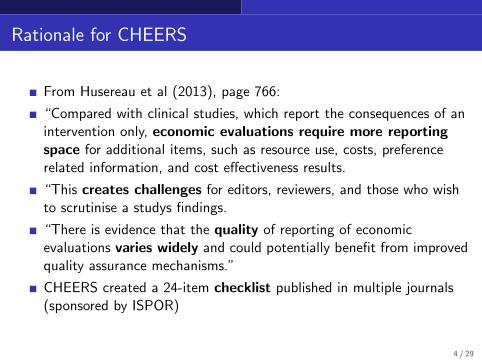
From Husereau et al (2013), page 766:
“Compared with clinical studies, which report the consequences of anintervention only, economic evaluations require more reportingspace for additional items, such as resource use, costs, preferencerelated information, and cost effectiveness results.
“This creates challenges for editors, reviewers, and those who wishto scrutinise a studys findings.
“There is evidence that the quality of reporting of economicevaluations varies widely and could potentially benefit from improvedquality assurance mechanisms.”
CHEERS created a 24-item checklist published in multiple journals(sponsored by ISPOR)
4 / 29
CHEERS
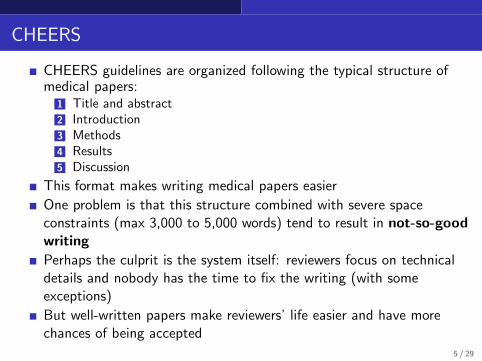
CHEERS guidelines are organized following the typical structure ofmedical papers:
1 Title and abstract2 Introduction3 Methods4 Results5 Discussion
This format makes writing medical papers easier
One problem is that this structure combined with severe spaceconstraints (max 3,000 to 5,000 words) tend to result in not-so-goodwriting
Perhaps the culprit is the system itself: reviewers focus on technicaldetails and nobody has the time to fix the writing (with someexceptions)
But well-written papers make reviewers’ life easier and have morechances of being accepted
5 / 29
Title
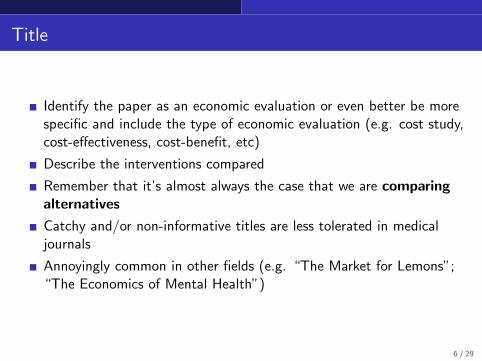
Identify the paper as an economic evaluation or even better be morespecific and include the type of economic evaluation (e.g. cost study,cost-effectiveness, cost-benefit, etc)
Describe the interventions compared
Remember that it’s almost always the case that we are comparingalternatives
Catchy and/or non-informative titles are less tolerated in medicaljournals
Annoyingly common in other fields (e.g. “The Market for Lemons”;“The Economics of Mental Health”)
6 / 29
Abstract
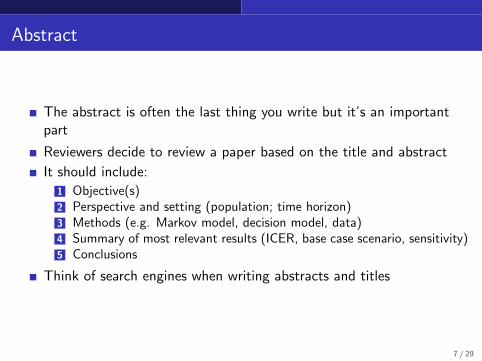
The abstract is often the last thing you write but it’s an importantpart
Reviewers decide to review a paper based on the title and abstract
It should include:
1 Objective(s)2 Perspective and setting (population; time horizon)3 Methods (e.g. Markov model, decision model, data)4 Summary of most relevant results (ICER, base case scenario, sensitivity)5 Conclusions
Think of search engines when writing abstracts and titles
7 / 29
Introduction
In the first and second paragraph you typically provide backgroundand context
It helps frame a paper’s contribution
In the last paragraph of the introduction you typically state theobjective(s) and the methods. Sometimes it includes a preview ofresults
Digression: what constitutes appropriate background and contextdepends on your readers. KNOW YOUR AUDIENCE!
How to organize an introduction feels more an art than science butthere are useful patterns that you can follow
8 / 29
Introduction structure
This is very useful structure for an introduction:
1 Background: all the necessary information to understand the rest,which, of course, depends on your audience
2 Stasis: What is the current state in this area? What do we know aboutthe problem? What is the typical approach to address this problem?
3 Destabilization: Why something that we do not known is importantor what is not right about the current state
4 Resolution: How your paper is going to address the problem
Find a good article and see if it follows this structure
9 / 29
Useful books
Plenty of books on writing scientific papers
A good and concise one is “Writing Science” by Joshua Schimel
“The Craft of Research” by Booth, Colomb and Williams
It has several chapters on crafting an argument, which is essentiallyabout structuring
A great one for a system on writing and managing a large project likea dissertation is “Demystifying Dissertation Writing” by Peg BolyeSingle
10 / 29
More on introductions
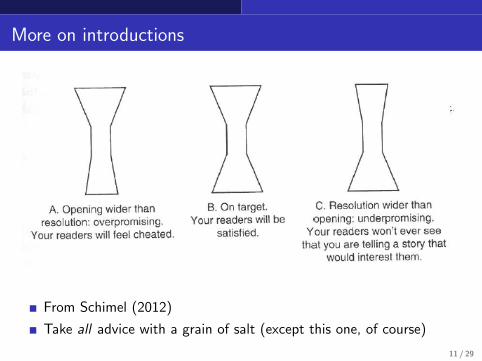
From Schimel (2012)
Take all advice with a grain of salt (except this one, of course)
11 / 29
Methods
The methods section is a key part of CEA papers
This is the place to get technical. But how technical? Of course, itdepends on the audience
If a policy or subject journal (e.g. pediatrics, general medicine), youmay want to explain technical terms in simple ways
If Medical Decision Making or Value in Health, you may want to bemore careful about the clinical side and may assume that readersknow technical terms
Best strategy: get past issues of your target journal and see howmuch detail was included in similar papers
12 / 29
Methods
Need to be clear about the target population and the relevantsubgroups (treatment heterogeneity)
Setting and location: Where was the study conducted? Differentcountry? Hospital? VA system? What details are important?
Need to include
1 Study perspective2 Interventions being compared: Remember Chapter 3: can you tell
who did what to whom, where, and how often?3 Time horizon4 Discount rate
A lot of studies forget to explain what is “usual care”
13 / 29
Methods
Measure of effectiveness: Where does the evidence come from? Ifmeta-analysis, how was it conducted?
What is the measure of benefit?
1 Natural units2 Life years3 Quality-adjusted life years
Note that natural units may need some justification. Why is thatmeasure relevant?
More important, what do we do with the ICER ($/over unit ofbenefit)?
Can we compare it to other studies? Remember, we do not have athreshold for, say, cases detected
14 / 29
Methods
Measurement of valuation of preference-based outcomes
Where does the information on preferences come from? How was itmeasured? What instruments were used?
Disease specific instruments?
Whose preferences were used?
Estimation of resources and costs; quantities and prices
15 / 29
Methods
Choice of model: Why decision analysis? Why Markov? Why nomodel?
If Markov model, present a transition diagram
If decision model, present a decision tree
Do everybody a favor and don’t confuse the two
Be clear about the assumptions of the model. Ideally, readers shouldbe able to replicate the model
Many times researchers and reviewers play a game of hide and seek.Asymmetric information: authors know more about limitations
Sadly, sometimes it does work (reviewers are busy people). But it alsoworks on your favor to be clear (reviewers are also grumpy people)
16 / 29
Results
This is the part where you show findings
Not a place for explaining how you did things (that’s the methodssection)
Interpreting results is fuzzy here (usually you can’t explain too much)
17 / 29
Results
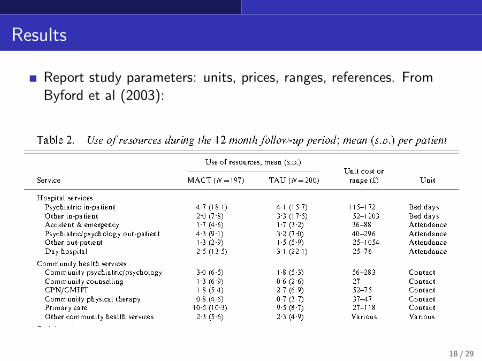
Report study parameters: units, prices, ranges, references. FromByford et al (2003):
18 / 29
Cost-effectiveness table
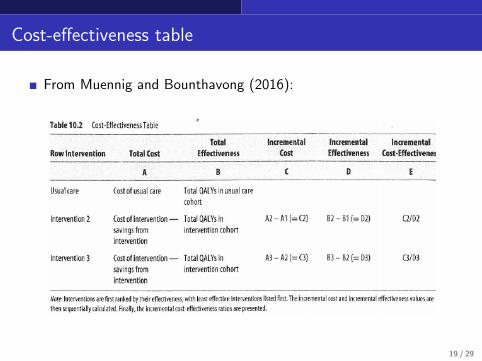
From Muennig and Bounthavong (2016):
19 / 29
Results - sensitivity analyses
For sensitivity analyses, it’s useful to report the range values usedand/or the assumed probability distribution (more on this nextclass)
It is difficult to present all possible sensitivity analyses; a good paperexplains why some are more important than others
Some of them are obvious: if a new medication, the price of themedication is important
If a prevention study, ICER without discounting is important
20 / 29
Results - sensitivity analyses
Some items that should be in the results section:
1 Most influential variables2 How the most influential variables affected the ICER3 Sensitivity analysis of the discount rate (usually, 0%, 3%, and 5%)4 Statistical analyses and case scenarios (next class)
21 / 29
CHEERS is more demanding
“Model-based economic evaluation: Describe the effects on theresults of uncertainty for all input parameters, and uncertaintyrelated to the structure of the model assumptions.”
Difficult to follow. Ideally, we conduct one-way sensitivity analyses forall parameters as a way to check the model but only present the mostimportant results (tornado diagram)
Remember: a cost effectiveness paper without sensitivity analyses isnot a good paper
22 / 29
Discussion
Summarize key findings in general terms; do not present results again(with the exception of ICER)
Summarize results by subgroups
Summarize key elements of the sensitivity analyses (for example, ifthe results are very sensitive to a particular parameter)
At some point, explain limitations
23 / 29
Discussion - other issues
Discussion sections are challenging. By the time you reach thediscussion, you probably have about 500 words left
Medical journals do not like speculation or opinion in discussionsections
In Chapter 3, one item in the checklist was: Do the results apply toother settings?
Hard to include a comprehensive discussion of all settings in adiscussion section
24 / 29
Transferring results to other settings
There are plenty of challenges when transferring results to othersettings
1 Demographic characteristics and disease prevalence2 Variability in clinical practice3 Discount rates4 Incentives/payments5 Prices/costs
Pick the most relevant or unusual aspect of your setting
Again, hard to address all issues in a short paper. And again, knowingyour audience helps
25 / 29
ICER in context
Articles should contrast ICERs to those of other papers in theliterature and thresholds
This can be difficult because of variations in methods and comparisons
An ICER calculated from a societal perspective is not the same as anICER from a payer’s perspective
Comparing a new intervention to “current treatment” is completelydifferent to comparing the new treatment to a “do-nothing”alternative
Ideally, a paper considered all relevant alternatives, but not always thecase
26 / 29
Technical appendix
In some CEA studies, the appendix is longer than the paper
The paper must be self-contained
The appendix should not be needed to understand the paper
The appendix is a good place for details of simulations, graphs, andmore sensitivity analyses
Some journals do not accept more than 3 o 4 graphs in the paper
The appendix could include transition diagrams and trees
27 / 29
Going back to Chapter 3, assessment of economicevaluations
Chapter 3 provided a 10-item checklist to evaluate economicevaluations
It overlaps with guidelines on how to present results
However, when you think about writing a CEA paper, you realize howdifficult it could be to address all the items in the checklist
28 / 29
Summary
Guidelines in presenting results are similar to guidelines on how toassess economic evaluation studies
If you ever need to write a CEA paper, go over the guidelines to makesure that you have covered the most important aspects
Useful to cover guidelines here because it also serves as a review of allthe material we have covered so far
Next class, more about uncertainty in CEA
29 / 29