Embed Size (px)
Citation preview

Presented by
Regional Economic Outlook
Dr. Steven G. Cochrane

Variation in State Job Growth Remains Narrow
0.5
1.0
1.5
2.0
2.5
3.0
75 80 85 90 95 100
Standard deviation of year-to-year state job growth by state
Trend Line Oil Price Shock90-91 Recession
PesoDevaluation
AsiaCrisis
00

Job Growth: Narrow Differences
Above AverageAverageBelow AverageU.S. = 2.3
% change year ago, 3-mo. moving average, July 2000Average is within 1/2 std. dev. of mean state growth rate of 2.0%

Variation in State Income Growth Is Beginning to Widen
0.5
1.0
1.5
2.0
2.5
3.0
75 80 85 90 95 100
Standard deviation of real, year-to-yearnon-farm household income growth by state
Trend Line
00
High Productivity Drives Income Growth in the Northeast
0.0
0.5
1.0
1.5
2.0
2.5
3.0
Northeast Midwest South West
Real Household IncomeEmployment
Annualized Growth, 1994-1999
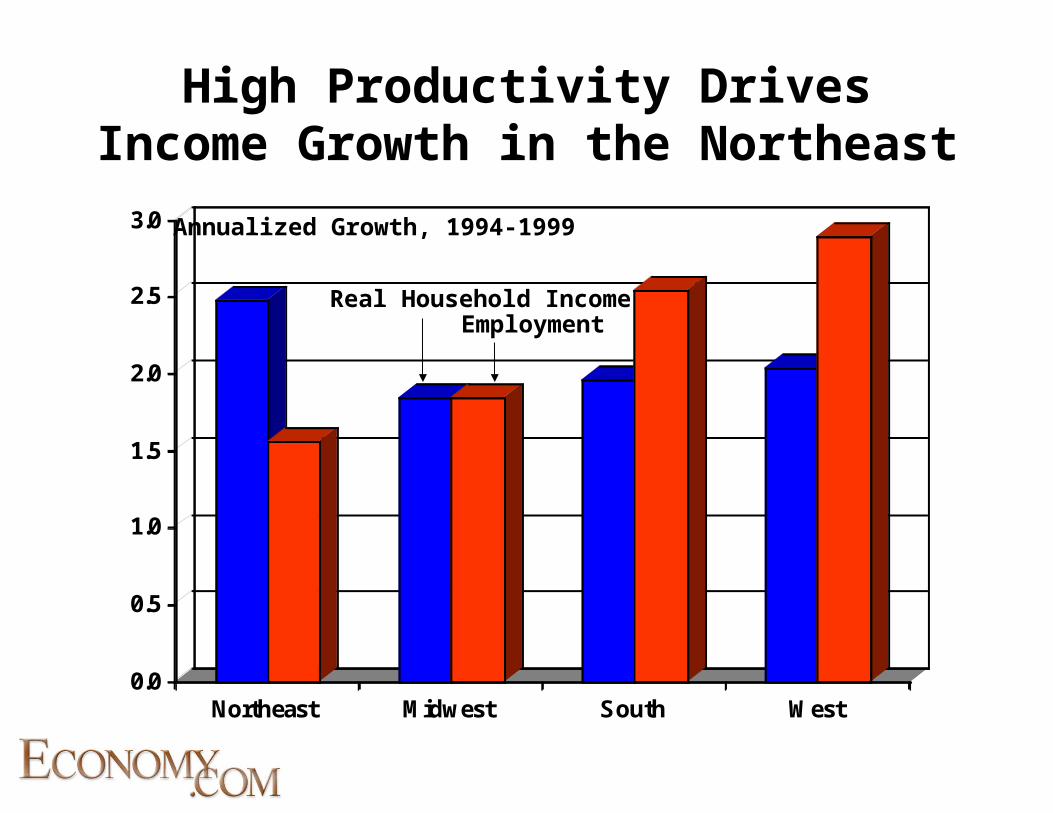
Productivity is Concentrated
U.S. = $70,100
Below AverageAverageAbove Average
Note: Productivity adjusted for industry mix. Output per worker, 1998.

Productivity Growth Fastest on the Coasts
0.0
0.5
1.0
1.5
2.0
2.5
Northeast Midwest South West
Output per worker, annualized growth, 1993-1998Productivity adjusted for industry mix

Income Growth is Accelerating Fastest in Northeast and West
0.0
0.5
1.0
1.5
2.0
2.5
3.0
3.5
15 year 10 year 5 year 1 year
Northeast Midwest South West
Real household incomeAnnualized growth rates (%), 1999
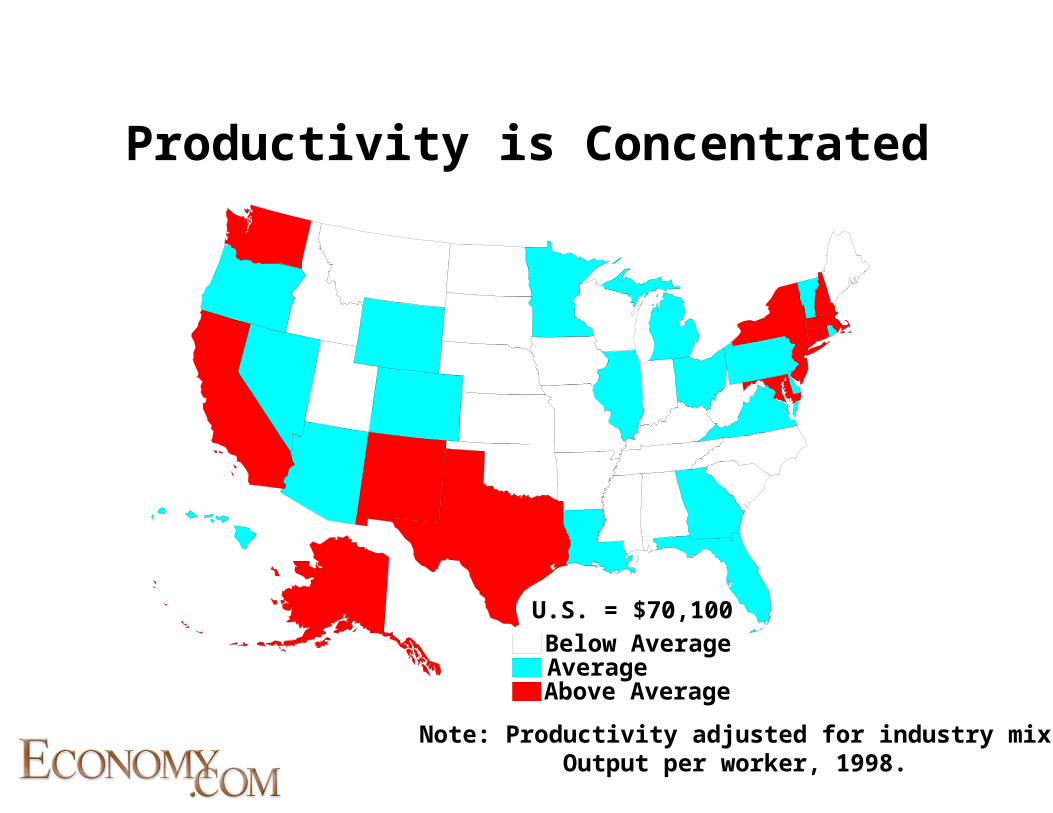
Regional Income Convergence Has Halted
50
60
70
80
90
100
110
120
130
140
150
29 34 39 44 49 54 59 64 69 74 79 84 89 94 99
Per capita income. Index: U.S. = 100
Northeast
South
Midwest
West

Capital Gains as a Share of Income
Below AverageAverageAbove Average
Note: Income is adjusted gross income

Venture Capital Supports the West
$ Bil.

Venture Capital Is ConcentratedV.C. placements as a % share of GDP, 1999
Below AverageAverageAbove Average
U.S. = 0.39%
Source: PricewaterhouseCoopers, BEA, RFA

West Is Home to More Internet Sites
South27%
West36%
Northeast22%
Midwest15%
Location of web site owners, based on approximately 75,000 sitesSource: Alexa Research, 2000
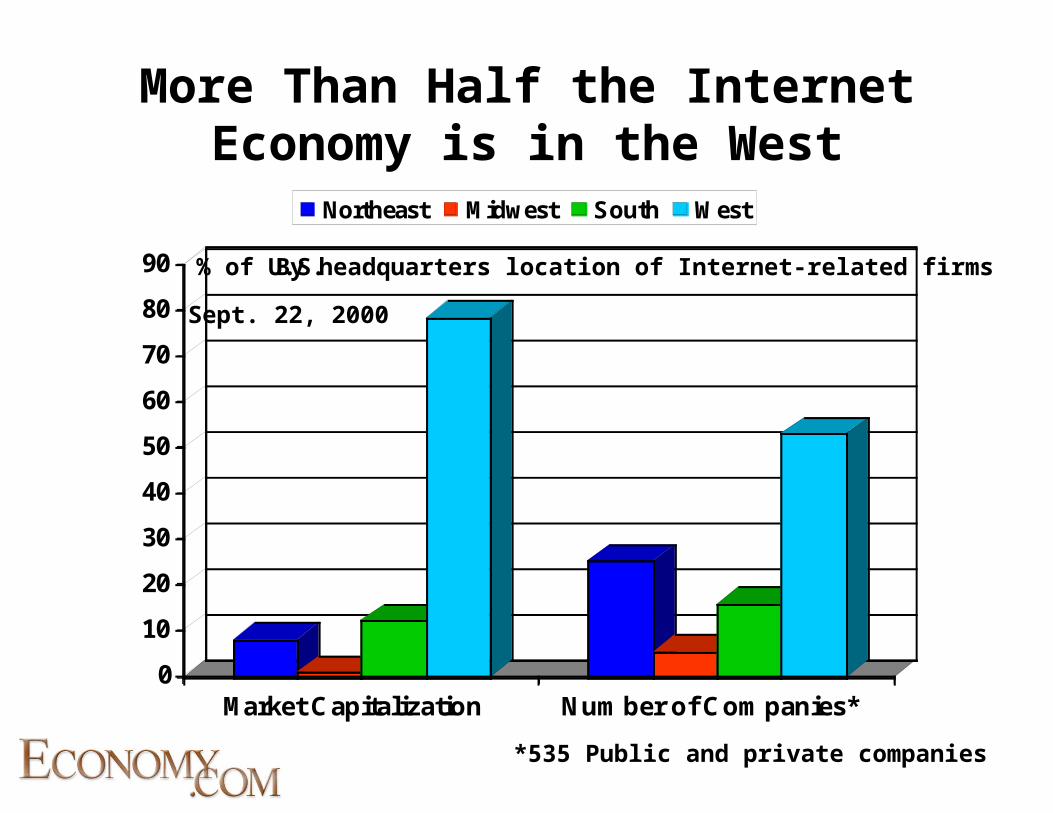
More Than Half the Internet Economy is in the West
0
10
20
30
40
50
60
70
80
90
Market Capitalization Number of Companies*
Northeast Midwest South West
% of U.S.
Sept. 22, 2000
By headquarters location of Internet-related firms
*535 Public and private companies
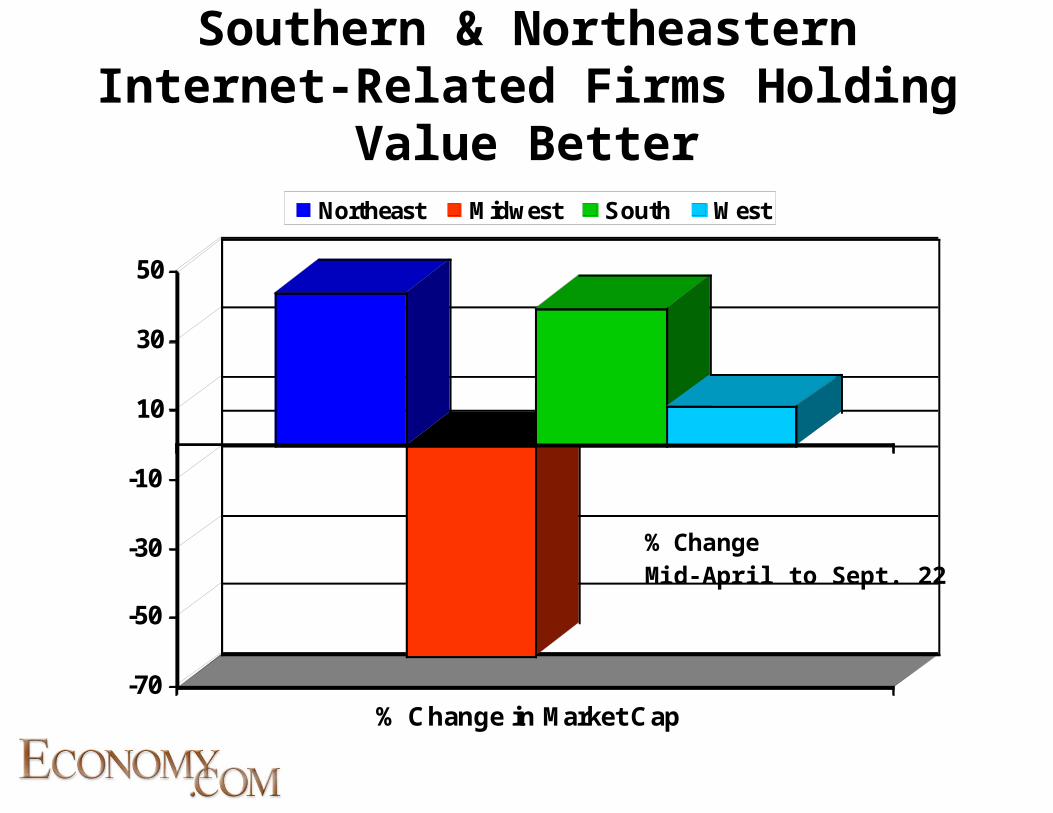
Southern & Northeastern Internet-Related Firms Holding Value Better
-70
-50
-30
-10
10
30
50
% Change in Market Cap
Northeast Midwest South West
% ChangeMid-April to Sept. 22
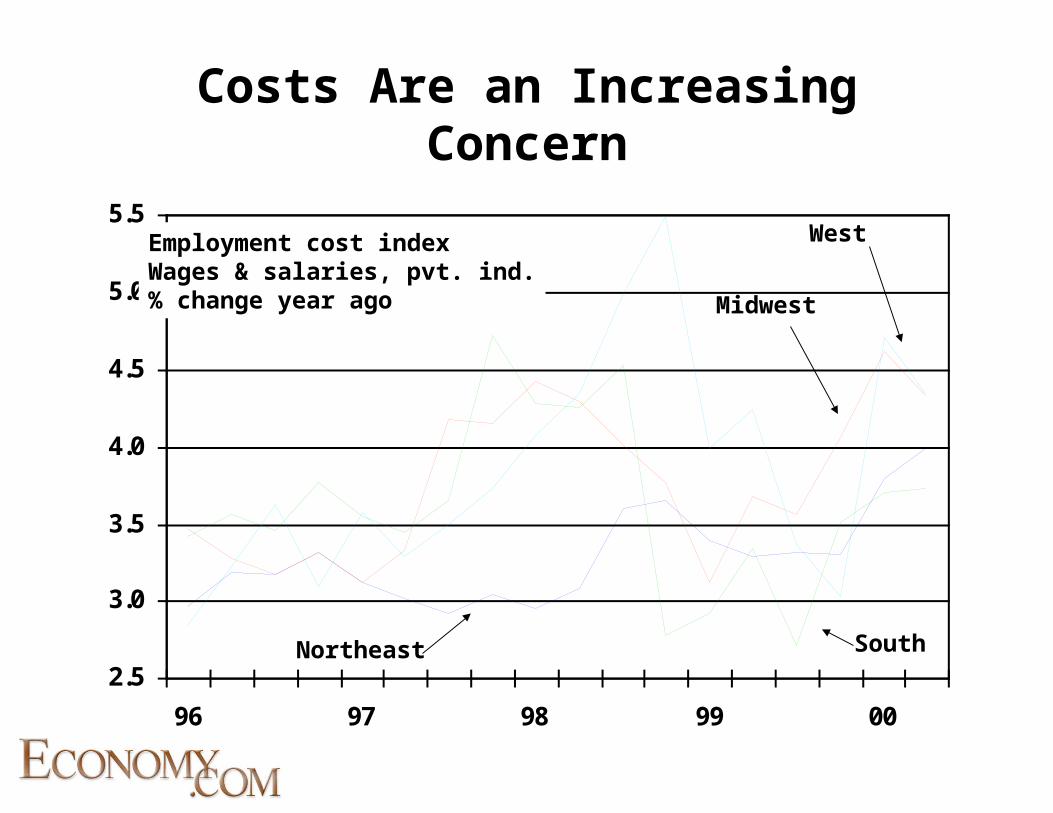
Costs Are an Increasing Concern
2.5
3.0
3.5
4.0
4.5
5.0
5.5
96 97 98 99 00
West
Midwest
SouthNortheast
Employment cost indexWages & salaries, pvt. ind.% change year ago

Cost of Doing Business
Above average
Below averageAverage
Costs include tax burden, unit labor costs and energy costs

Commodity Exports Rebounding
-10
-5
0
5
10
15
20
25
97 98 99 00
West
Northeast
South
Midwest
% change year ago
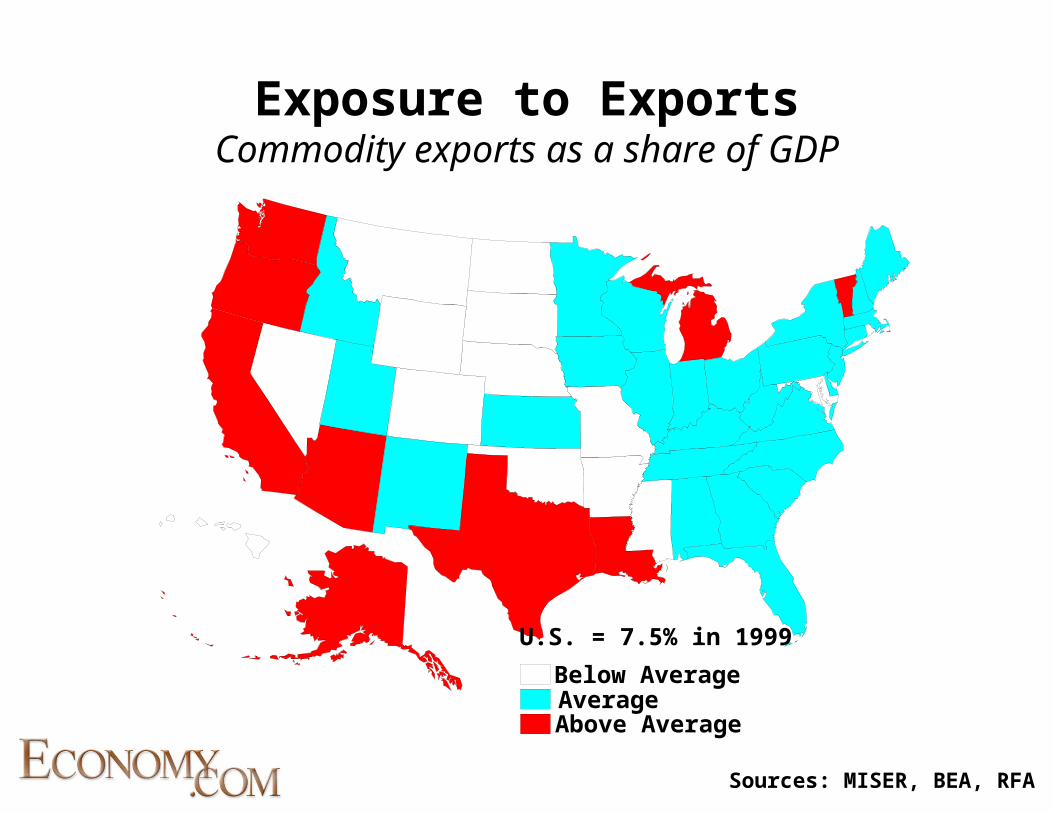
Exposure to ExportsCommodity exports as a share of GDP
Below AverageAverageAbove Average
U.S. = 7.5% in 1999
Sources: MISER, BEA, RFA
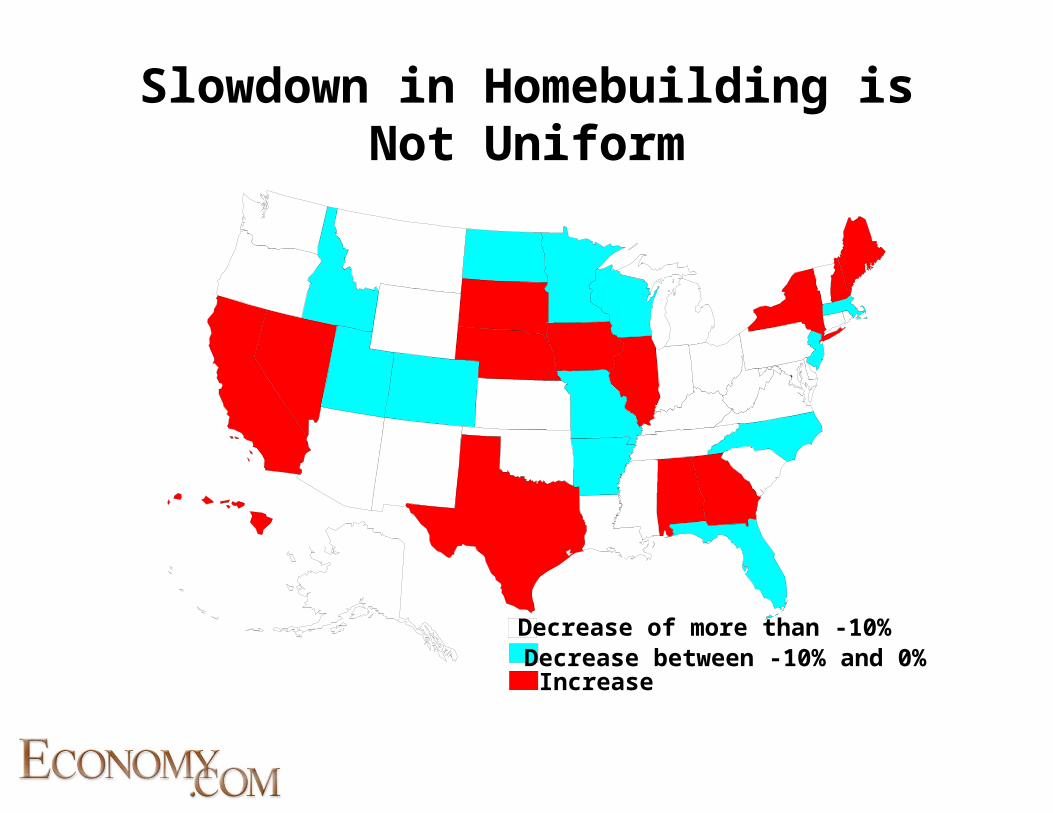
Slowdown in Homebuilding is Not Uniform
IncreaseDecrease between -10% and 0%Decrease of more than -10%

Job Growth Outlook 2000-2003
Above averageAverageBelow Average
U.S. = 1.3%
Note: Annualized growth