Embed Size (px)
Citation preview

© 2005 Prentice Hall Business Publishing© 2005 Prentice Hall Business Publishing Survey of Economics, 2/eSurvey of Economics, 2/e O’Sullivan & SheffrinO’Sullivan & Sheffrin
Prepared by: Jamal Husein
C H A P T E R
22
Supply, Demand,and Market Equilibrium

© 2005 Prentice Hall Business Publishing Survey of Economics, 2/e O’Sullivan & Sheffrin 2
The Model of Supply and DemandThe Model of Supply and DemandThe Model of Supply and DemandThe Model of Supply and Demand
The supply and demand model is used to explain how a perfectly perfectly competitive market operatescompetitive market operates.
The purpose of the model of supply and demand is to predict changes in market quantity and price based on changes in supply and demand conditions.

© 2005 Prentice Hall Business Publishing Survey of Economics, 2/e O’Sullivan & Sheffrin 3
The Demand CurveThe Demand CurveThe Demand CurveThe Demand Curve
Market demand shows how much of a particular product are consumers willing to buy during a particular time period, all else being equal.

© 2005 Prentice Hall Business Publishing Survey of Economics, 2/e O’Sullivan & Sheffrin 4
Variables Affecting DemandVariables Affecting DemandVariables Affecting DemandVariables Affecting Demand
The main determinants of demandThe main determinants of demand includeinclude: The price of the product Consumer income The price of related goods—substitutes and
complements The number of consumers Consumer preferences—tastes and
advertising Consumer expectations about future prices

© 2005 Prentice Hall Business Publishing Survey of Economics, 2/e O’Sullivan & Sheffrin 5
The Individual Demand CurveThe Individual Demand CurveThe Individual Demand CurveThe Individual Demand Curve
The individual demand curve shows the relationship between the price of a good and the quantity that a single consumer is willing to buy, or quantity demanded.

© 2005 Prentice Hall Business Publishing Survey of Economics, 2/e O’Sullivan & Sheffrin 6
The Individual Demand Curve and The Individual Demand Curve and The Law of DemandThe Law of DemandThe Individual Demand Curve and The Individual Demand Curve and The Law of DemandThe Law of Demand
The negative slope of the individual demand curve reflects the law of demand.
Demand scheduleDemand schedule
Individual Demand Curve
Law of Demand:Law of Demand: The higher the price, the smaller the quantity demanded, ceteris paribus.

© 2005 Prentice Hall Business Publishing Survey of Economics, 2/e O’Sullivan & Sheffrin 7
The “Ceteris Paribus” AssumptionThe “Ceteris Paribus” AssumptionThe “Ceteris Paribus” AssumptionThe “Ceteris Paribus” Assumption
To obtain various points on the individual demand curve for pizzas we assume that only the price of pizzas changes, while other determinants of the demand for pizzas (income, tastes and preferences, the price of related goods, etc.) remain constant, or ceteris paribus.

© 2005 Prentice Hall Business Publishing Survey of Economics, 2/e O’Sullivan & Sheffrin 8
A Change in Quantity DemandedA Change in Quantity DemandedA Change in Quantity DemandedA Change in Quantity Demanded
A change in A change in quantity quantity demandeddemanded is caused by a change in the price of the good, which causes a movement along the demand curve.

© 2005 Prentice Hall Business Publishing Survey of Economics, 2/e O’Sullivan & Sheffrin 9
Income and Substitution EffectIncome and Substitution EffectIncome and Substitution EffectIncome and Substitution Effect
The substitution effectsubstitution effect describes a change in consumption resulting from a change in the price of one good relative to the price of other goods.The lower the price of a good, the smaller the sacrifice associated with consumption of a good.
The reason why the slope of the individual demand curve is negativenegative, involves the substitution and income effects.

© 2005 Prentice Hall Business Publishing Survey of Economics, 2/e O’Sullivan & Sheffrin 10
The Income EffectThe Income EffectThe Income EffectThe Income Effect The income effectincome effect describes the
change in consumption resulting from an increase in the consumer’s real incomereal income, or the income in terms of the goods the money can buy.
Real income is the consumer’s income measured in terms of the goods it can buy.
© 2005 Prentice Hall Business Publishing Survey of Economics, 2/e O’Sullivan & Sheffrin 11
From Individual to Market DemandFrom Individual to Market DemandFrom Individual to Market DemandFrom Individual to Market Demand
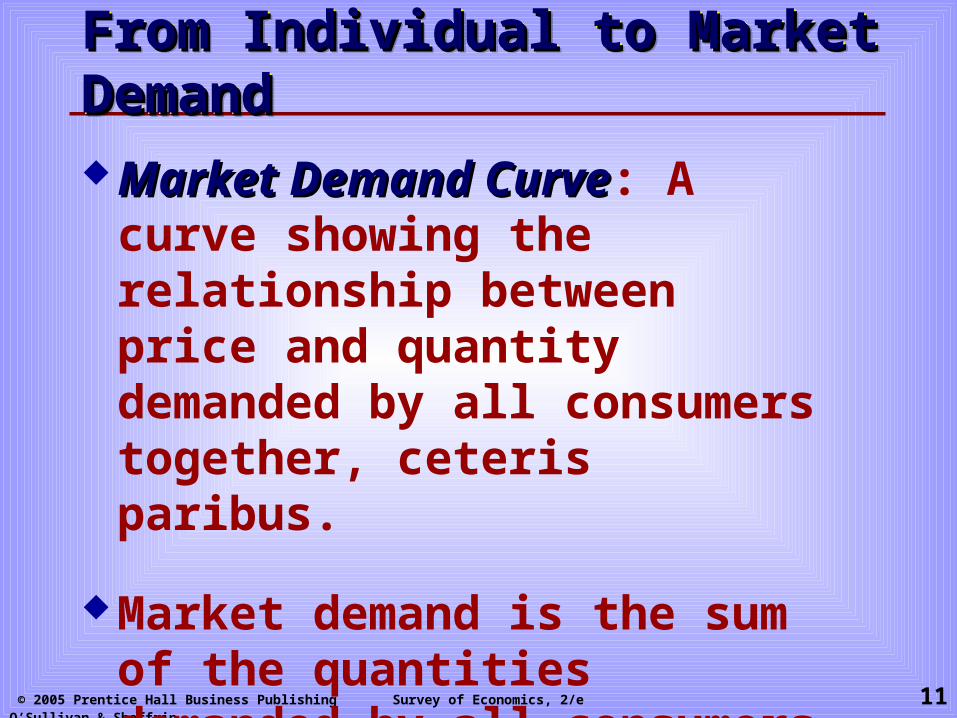
Market Demand CurveMarket Demand Curve: A curve showing the relationship between price and quantity demanded by all consumers together, ceteris paribus.
Market demand is the sum of the quantities demanded by all consumers in the market, or the sum of individual demand curves.

© 2005 Prentice Hall Business Publishing Survey of Economics, 2/e O’Sullivan & Sheffrin 12
From Individual to Market DemandFrom Individual to Market DemandFrom Individual to Market DemandFrom Individual to Market Demand

© 2005 Prentice Hall Business Publishing Survey of Economics, 2/e O’Sullivan & Sheffrin 13
The Market Demand Curve and The The Market Demand Curve and The Law of DemandLaw of DemandThe Market Demand Curve and The The Market Demand Curve and The Law of DemandLaw of Demand
Since the slope of the individual demand curve is negative, it follows that the slope of the market demand curve is also negative, reflecting the law of demand.
Market demand Market demand scheduleschedule
Market Demand

© 2005 Prentice Hall Business Publishing Survey of Economics, 2/e O’Sullivan & Sheffrin 14
Market SupplyMarket SupplyMarket SupplyMarket Supply
The supply curvesupply curve shows the relationship between price and the quantity that producers are willing to sell during a particular time period, all else being equal.

© 2005 Prentice Hall Business Publishing Survey of Economics, 2/e O’Sullivan & Sheffrin 15
Variables Affecting SupplyVariables Affecting SupplyVariables Affecting SupplyVariables Affecting Supply
The main determinants of supply include:
The price of the product
The cost of inputs
The state of production technology
The number of producers
Producer expectations about future prices
Taxes or subsidies from the government

© 2005 Prentice Hall Business Publishing Survey of Economics, 2/e O’Sullivan & Sheffrin 16
The Marginal Principle and the Output The Marginal Principle and the Output DecisionDecisionThe Marginal Principle and the Output The Marginal Principle and the Output DecisionDecision The decision to produce a given quantity
of output is based on the marginal principle.
Marginal Marginal PRINCIPLEPRINCIPLEIncrease the level of an activity if its Increase the level of an activity if its marginal benefit exceeds its marginal cost, marginal benefit exceeds its marginal cost, but reduce the level if the marginal cost but reduce the level if the marginal cost exceeds the marginal benefit. If possible, exceeds the marginal benefit. If possible, pick the level at which the marginal pick the level at which the marginal benefit equals the marginal cost.benefit equals the marginal cost.
Marginal Marginal PRINCIPLEPRINCIPLEIncrease the level of an activity if its Increase the level of an activity if its marginal benefit exceeds its marginal cost, marginal benefit exceeds its marginal cost, but reduce the level if the marginal cost but reduce the level if the marginal cost exceeds the marginal benefit. If possible, exceeds the marginal benefit. If possible, pick the level at which the marginal pick the level at which the marginal benefit equals the marginal cost.benefit equals the marginal cost.

© 2005 Prentice Hall Business Publishing Survey of Economics, 2/e O’Sullivan & Sheffrin 17
The Marginal Principle and the The Marginal Principle and the Output DecisionOutput DecisionThe Marginal Principle and the The Marginal Principle and the Output DecisionOutput Decision
The optimal quantity of output is the one that satisfies the marginal principle—where marginal cost equals marginal benefit.
As price rises, marginal benefit intersects marginal cost at a higher output level.

© 2005 Prentice Hall Business Publishing Survey of Economics, 2/e O’Sullivan & Sheffrin 18
Individual Supply and the Law of SupplyIndividual Supply and the Law of SupplyIndividual Supply and the Law of SupplyIndividual Supply and the Law of Supply
The positive slope of the curve reflects the law of supplylaw of supply.
Supply scheduleSupply schedule is a table of numbers that shows the relationship between price and quantity supplied, ceteris paribus.
The individual supply curveindividual supply curve shows the relationship between the price and the quantity supplied by a single firm, ceteris paribus.

© 2005 Prentice Hall Business Publishing Survey of Economics, 2/e O’Sullivan & Sheffrin 19
Individual Supply and the Law of Individual Supply and the Law of SupplySupplyIndividual Supply and the Law of Individual Supply and the Law of SupplySupply
Law of Supply:Law of Supply: The higher the price, the larger the quantity supplied, ceteris paribus.

© 2005 Prentice Hall Business Publishing Survey of Economics, 2/e O’Sullivan & Sheffrin 20
Individual Supply to Market SupplyIndividual Supply to Market SupplyIndividual Supply to Market SupplyIndividual Supply to Market Supply
The market supplymarket supply curve for a particular good shows the relationship between the price of the good and the quantity that all producers together are willing to sell, ceteris paribus.

© 2005 Prentice Hall Business Publishing Survey of Economics, 2/e O’Sullivan & Sheffrin 21
Individual Supply to Market SupplyIndividual Supply to Market SupplyIndividual Supply to Market SupplyIndividual Supply to Market Supply

© 2005 Prentice Hall Business Publishing Survey of Economics, 2/e O’Sullivan & Sheffrin 22
Market Supply and the Law of SupplyMarket Supply and the Law of SupplyMarket Supply and the Law of SupplyMarket Supply and the Law of Supply
The market supply curve is positively sloped, reflecting the law of supplylaw of supply. The higher the price, the larger the quantity supplied, ceteris paribus.
Supply Supply scheduleschedule
SupplyCurve

© 2005 Prentice Hall Business Publishing Survey of Economics, 2/e O’Sullivan & Sheffrin 23
Market EquilibriumMarket EquilibriumMarket EquilibriumMarket Equilibrium
Market equilibriumMarket equilibrium is a situation in which, at the current market price, quantity supplied equals quantity demanded.
When the market is in equilibrium, there is no tendency for the price to increase or decrease.

© 2005 Prentice Hall Business Publishing Survey of Economics, 2/e O’Sullivan & Sheffrin 24
Shortage: excess quantity demandedShortage: excess quantity demandedShortage: excess quantity demandedShortage: excess quantity demanded
Excess Demand Excess Demand (Shortage) :(Shortage) : A situation in which consumers are willing to buy more than producers are willing to sell. It occurs when market price is lower than equilibrium price.
An increase in the PriceAn increase in the Price eliminates the shortage by changing both quantity demanded and quantity supplied until the original equilibrium is established

© 2005 Prentice Hall Business Publishing Survey of Economics, 2/e O’Sullivan & Sheffrin 25
Surplus: excess quantity suppliedSurplus: excess quantity suppliedSurplus: excess quantity suppliedSurplus: excess quantity supplied
Excess Supply Excess Supply (Surplus):(Surplus): A situation in which producers are willing to sell more than consumers are willing to buy. It occurs when market price is above equilibrium price.
A decrease in the PriceA decrease in the Price eliminates excess supply by changing both quantity demanded and quantity supplied until the original equilibrium is established

© 2005 Prentice Hall Business Publishing Survey of Economics, 2/e O’Sullivan & Sheffrin 26
Equilibrium and DisequilibriaEquilibrium and DisequilibriaEquilibrium and DisequilibriaEquilibrium and Disequilibria

© 2005 Prentice Hall Business Publishing Survey of Economics, 2/e O’Sullivan & Sheffrin 27
A Change in DemandA Change in DemandA Change in DemandA Change in Demand
An increase in increase in demanddemand (rightward shift) results in higher quantity demanded at each price level.
A change in demandA change in demand is a change in the amount of a good demanded resulting from a change in something other than the price of the good, which causes a shift of the entire demand curve.

© 2005 Prentice Hall Business Publishing Survey of Economics, 2/e O’Sullivan & Sheffrin 28
Shifting the Demand CurveShifting the Demand CurveShifting the Demand CurveShifting the Demand Curve
Changes in Changes in determinantsdeterminants of demand other than price cause the demand curve to shift.
A rightwardA rightward shift shows an increase in demand and a leftwardleftward shift a decrease in demand.

© 2005 Prentice Hall Business Publishing Survey of Economics, 2/e O’Sullivan & Sheffrin 29
Causes of an Increase in DemandCauses of an Increase in DemandCauses of an Increase in DemandCauses of an Increase in Demand An increase in
income (normal goods) and a decrease in income (inferior goods)
An increase in the price of a substitute good
A decrease in price of a complementary good
Higher preference for the good in question
Favorable advertising
An increase in the number of consumers (population)
An expectation of higher future prices

© 2005 Prentice Hall Business Publishing Survey of Economics, 2/e O’Sullivan & Sheffrin 30
Market Effects of A Change in DemandMarket Effects of A Change in DemandMarket Effects of A Change in DemandMarket Effects of A Change in Demand
Supply Price
Supply
D2
DD22
DD33
30303030
888
DD33
Thousands of Pizzas per month
Price
An Increase in DemandAn Increase in DemandAn Increase in DemandAn Increase in Demand A Decrease in DemandA Decrease in DemandA Decrease in DemandA Decrease in Demand
10
4040 4848
Thousands of Pizzas per month
1212 2020

© 2005 Prentice Hall Business Publishing Survey of Economics, 2/e O’Sullivan & Sheffrin 31
Causes of a Decrease in DemandCauses of a Decrease in DemandCauses of a Decrease in DemandCauses of a Decrease in Demand A decrease in
income (normal goods) or an increase in income (inferior goods)
A decrease in the price of a substitute good
An increase in the price of a complementary good
Less preference for the good in question
An expectation of lower future prices
A decrease in the number of consumers

© 2005 Prentice Hall Business Publishing Survey of Economics, 2/e O’Sullivan & Sheffrin 32
Normal Versus Inferior GoodsNormal Versus Inferior GoodsNormal Versus Inferior GoodsNormal Versus Inferior Goods
A normal goodnormal good is a good for which the demand increases as real income rises.
An inferior goodinferior good is a good for which demand decreases as real income rises.
For normal goods, the law of demand makes sense because the substitution and income effects reinforce each other. Lower prices result in higher quantity demanded.

© 2005 Prentice Hall Business Publishing Survey of Economics, 2/e O’Sullivan & Sheffrin 33
Normal and Inferior GoodsNormal and Inferior GoodsNormal and Inferior GoodsNormal and Inferior Goods
For inferior goodsinferior goods, the substitution and income effects conflict with each other, blurring the law of demand.
The substitution effectsubstitution effect tends to increase consumption while the income effect tends to decrease it. The law of demand is correct only as long as the substitution effect outweighs the income effect.

© 2005 Prentice Hall Business Publishing Survey of Economics, 2/e O’Sullivan & Sheffrin 34
A Change in Quantity SuppliedA Change in Quantity SuppliedA Change in Quantity SuppliedA Change in Quantity Supplied
A change in quantity suppliedquantity supplied is caused by a change in the price of the good, which causes a movement along the supply curve.

© 2005 Prentice Hall Business Publishing Survey of Economics, 2/e O’Sullivan & Sheffrin 35
A Change in SupplyA Change in SupplyA Change in SupplyA Change in Supply
A change in supplychange in supply is caused by a change in something other than the price of the good, which causes a shift of the entire supply curve.
An increase in supplyincrease in supply results in higher quantity supplied at each price level.

© 2005 Prentice Hall Business Publishing Survey of Economics, 2/e O’Sullivan & Sheffrin 36
Shifting the Supply CurveShifting the Supply CurveShifting the Supply CurveShifting the Supply Curve
Changes in determinants of supply other than price cause the supply curve to shift.
A rightwardrightward shift
shows an increaseincrease in
supply and a leftwardleftward
shift a decreasedecrease in supply.

© 2005 Prentice Hall Business Publishing Survey of Economics, 2/e O’Sullivan & Sheffrin 37
Causes of an Increase in SupplyCauses of an Increase in SupplyCauses of an Increase in SupplyCauses of an Increase in Supply
A decrease in the cost of inputs
A technological improvement that decreases cost of production
Lower future prices than anticipated
Subsidies
An increase in the number of producers (firms)

© 2005 Prentice Hall Business Publishing Survey of Economics, 2/e O’Sullivan & Sheffrin 38
Causes of a Decrease in SupplyCauses of a Decrease in SupplyCauses of a Decrease in SupplyCauses of a Decrease in Supply
An increase in the cost of inputs
A loss of technology
A decrease in the number of producers (firms)
Higher future prices than anticipated
Higher taxes imposed on the producers of the good in question

© 2005 Prentice Hall Business Publishing Survey of Economics, 2/e O’Sullivan & Sheffrin 39
Market Effects of Simultaneous Market Effects of Simultaneous Changes in Supply and DemandChanges in Supply and DemandMarket Effects of Simultaneous Market Effects of Simultaneous Changes in Supply and DemandChanges in Supply and Demand
When the magnitude of an increase in demand is smaller than the magnitude of an increase in supply, equilibrium quantity increases and market price decreases.

© 2005 Prentice Hall Business Publishing Survey of Economics, 2/e O’Sullivan & Sheffrin 40
Market Effects of A Change in SupplyMarket Effects of A Change in SupplyMarket Effects of A Change in SupplyMarket Effects of A Change in Supply
Pri
ce
SS22
DD
S1
303636
88
P*P*
Pri
ce (
$)
An increase in SupplyAn increase in SupplyAn increase in SupplyAn increase in Supply A decrease in SupplyA decrease in SupplyA decrease in SupplyA decrease in Supply
1010
14 23
SS22
DD
30
88
SS33
4545
66
© 2005 Prentice Hall Business Publishing Survey of Economics, 2/e O’Sullivan & Sheffrin 41
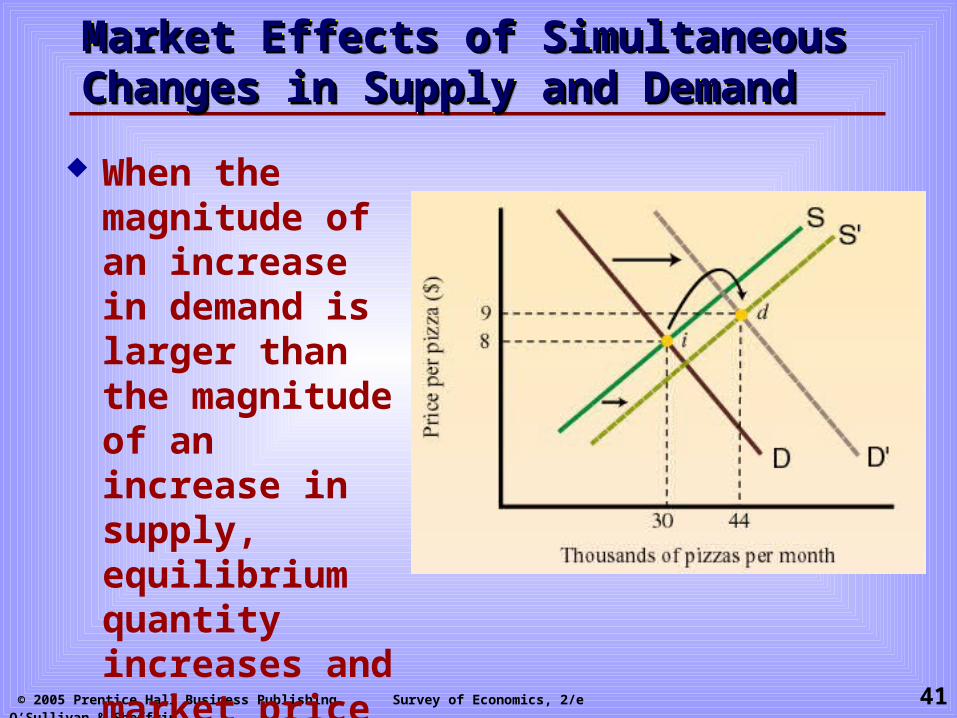
Market Effects of Simultaneous Changes in Market Effects of Simultaneous Changes in Supply and DemandSupply and DemandMarket Effects of Simultaneous Changes in Market Effects of Simultaneous Changes in Supply and DemandSupply and Demand
When the magnitude of an increase in demand is larger than the magnitude of an increase in supply, equilibrium quantity increases and market price increases.

© 2005 Prentice Hall Business Publishing Survey of Economics, 2/e O’Sullivan & Sheffrin 42
Applications of Supply and DemandApplications of Supply and DemandApplications of Supply and DemandApplications of Supply and Demand
Market Effects of an Increase in Demand
An increase in demand causes a shortage at the original price.
To eliminate the shortage, price increases from $0.60 to $0.70.

© 2005 Prentice Hall Business Publishing Survey of Economics, 2/e O’Sullivan & Sheffrin 43
Applications of Supply and DemandApplications of Supply and DemandApplications of Supply and DemandApplications of Supply and Demand
Market Effects of an Antismoking Campaign
A decrease in the demand for cigarettes would result in lower cigarette prices produced and sold, at a lower price.

© 2005 Prentice Hall Business Publishing Survey of Economics, 2/e O’Sullivan & Sheffrin 44
Applications of Supply and DemandApplications of Supply and DemandApplications of Supply and DemandApplications of Supply and Demand
Effects of Technological Innovations on the Market for Personal Computers
Technological innovations decrease production costs, shifting the supply curve to the right.

© 2005 Prentice Hall Business Publishing Survey of Economics, 2/e O’Sullivan & Sheffrin 45
Applications of Supply and DemandApplications of Supply and DemandApplications of Supply and DemandApplications of Supply and Demand
Effects of Bad Weather on the Coffee Market
Bad weather decreases the supply of coffee beans, shifting the supply curve to the left.
Price increases and quantity exchanged decreases.

© 2005 Prentice Hall Business Publishing Survey of Economics, 2/e O’Sullivan & Sheffrin 46
Market Equilibrium, The Invisible Market Equilibrium, The Invisible Hand, and EfficiencyHand, and EfficiencyMarket Equilibrium, The Invisible Market Equilibrium, The Invisible Hand, and EfficiencyHand, and Efficiency
The “invisible hand” describes how the actions of individual buyers and sellers, each acting on their own self interest, leads to a market equilibrium.
But, does this market equilibrium promote the social interest, or could society do better?

© 2005 Prentice Hall Business Publishing Survey of Economics, 2/e O’Sullivan & Sheffrin 47
Market Equilibrium, The Invisible Hand, and Market Equilibrium, The Invisible Hand, and EfficiencyEfficiencyMarket Equilibrium, The Invisible Hand, and Market Equilibrium, The Invisible Hand, and EfficiencyEfficiency
Four conditions must be met in order to promote the social interest:
1. Buyers and sellers must have enough information to make informed decisions.
2. The market must be perfectly competitive.

© 2005 Prentice Hall Business Publishing Survey of Economics, 2/e O’Sullivan & Sheffrin 48
Four conditions must be met in order to promote the social interest:
3. There must be no spillover benefits.
4. There must be no spillover costs.
Market Equilibrium, The Invisible Hand, Market Equilibrium, The Invisible Hand, and Efficiencyand EfficiencyMarket Equilibrium, The Invisible Hand, Market Equilibrium, The Invisible Hand, and Efficiencyand Efficiency