Embed Size (px)
Citation preview

MINISTRY OF FINANCE AND ECONOMIC MANAGEMENT
MINISTRY OF INFRASTRUCTURE AND PUBLIC UTILITIES
THE REPUBLIC OF VANUATU
PREPARATORY STUDY FOR
THE PROJECT ON INTERNATIONAL MULTI MODAL PORT AT STAR WHARF IN
PORT VILA IN
THE REPUBLIC OF VANUATU
(ENVIRONMENTAL STUDY)
FINAL REPORT
JANUARY 2012
JAPAN INTERNATIONAL COOPERATION AGENCY
IDEA CONSULTANTS, INC.
IDES INC.

CURRENCY EQUIVALENTS (AS OF JANUARY 2012)
1 Vanuatu Vatu = 0.84 Japanese Yen

Location of Efate Island, Republic of Vanuatu
Efate Island
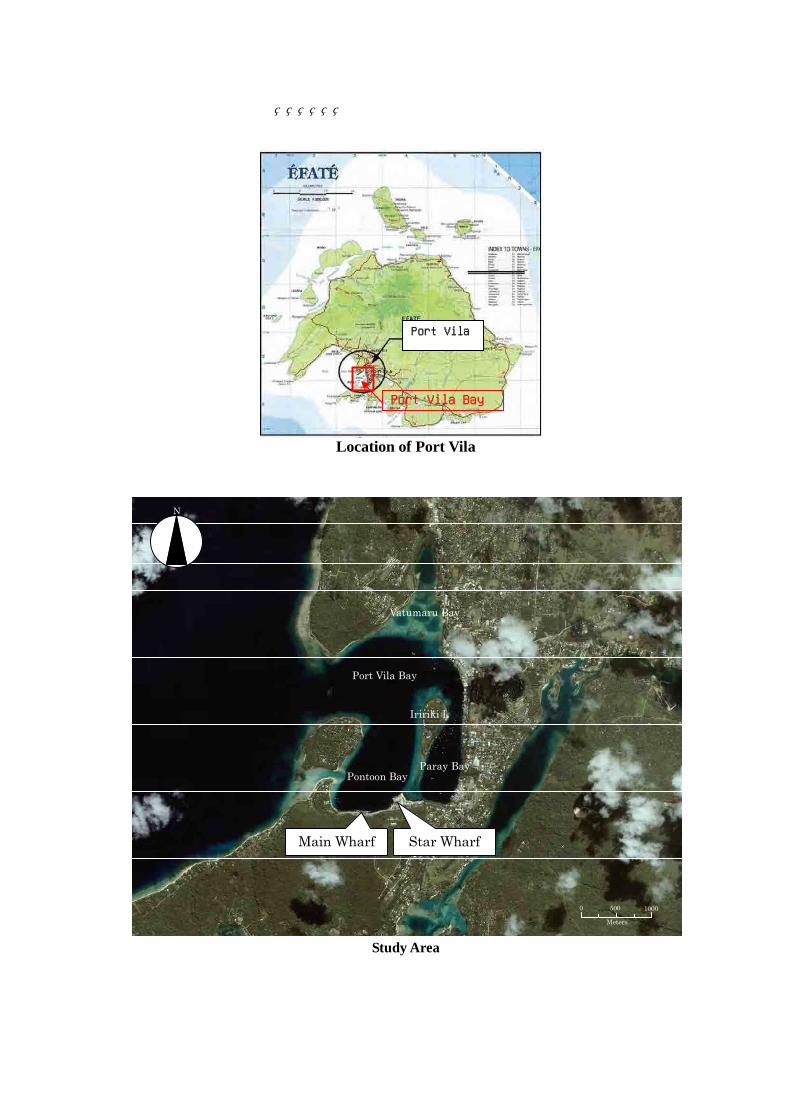
Location of Port Vila
Study Area
0 500 1000
Meters
N
Star Wharf Main Wharf
Iririki I.
Pontoon Bay Paray Bay
Vatumaru Bay
Port Vila Bay
Port Vila Bay
Port Vila

Star Wharf
Overlay of the Chart of Port Vila on IKONOS Satellite Image
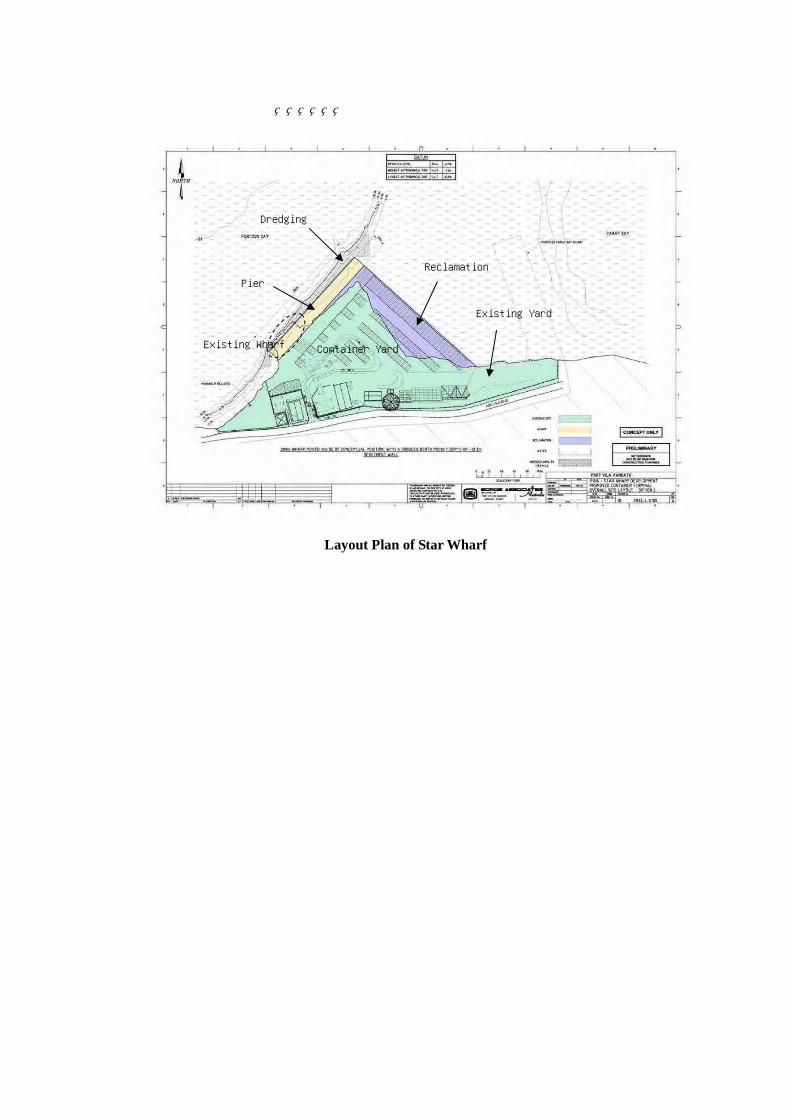
Layout Plan of Star Wharf
Pier
Dredging
Reclamation
Existing Yard
Existing Wharf Container Yard

S-1
Summary
1. OUTLINE OF THE STUDY
1.1 Study Objectives
Although EIA of Star Terminal Development had been prepared in the feasibility study by AusAID and the report had been approved by the Department of Environment of the Ministry of Lands and Natural Resources of the Government of Vanuatu in August 2010, JICA Fact Finding Survey Team, in response to the financing request by Government of Vanuatu, surveyed the project area and concluded that further data collection was needed to upgrade the impact assessment on coral reef ecosystems and water current of Port Vila Bay.
Under those circumstances, this study was conducted aiming to collect supplemental data on coral reef conditions and water current of the bay as well as to develop mitigation measures and monitoring plans after the construction work in order to realize the project with the loan assistance by the Government of Japan.
1.2 Study Area
Star Wharf in Port Vila and its surrounding sea area (Fig. 1)
Fig. 1 Study Area
0 500 1000
Meters
N
Star Wharf Main Wharf
Iririki I.
Pontoon Bay Paray Bay
Vatumaru Bay
Port Vila Bay
S-2
1.3 Study Period
7 October 2011 to 13 January 2012
2. SURVEY OF CORAL REEF
2.1 Coral Reef Mapping
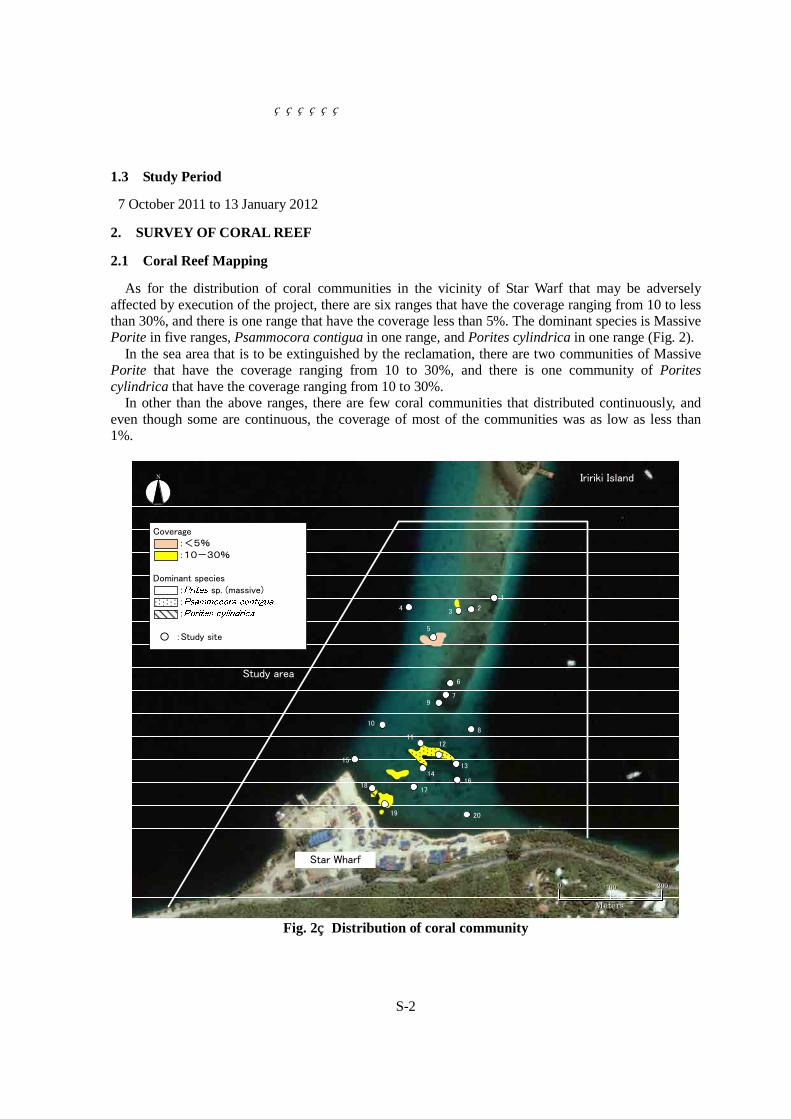
As for the distribution of coral communities in the vicinity of Star Warf that may be adversely affected by execution of the project, there are six ranges that have the coverage ranging from 10 to less than 30%, and there is one range that have the coverage less than 5%. The dominant species is Massive Porite in five ranges, Psammocora contigua in one range, and Porites cylindrica in one range (Fig. 2).
In the sea area that is to be extinguished by the reclamation, there are two communities of Massive Porite that have the coverage ranging from 10 to 30%, and there is one community of Porites cylindrica that have the coverage ranging from 10 to 30%.
In other than the above ranges, there are few coral communities that distributed continuously, and even though some are continuous, the coverage of most of the communities was as low as less than 1%.
1
12
14
11
10
9
8
7
6
5
4 3 2
18
15
17
20
16
13
19
0 200100
Meters
0 200100
Meters
N Iririki Island
Star Wharf
Study area
Coverage :<5% :10-30%
Dominant species : sp. (massive) : :
○ :Study site
Fig. 2 Distribution of coral community

S-3
2.2 Transect Survey
The transect survey sites that form baseline for long term monitoring in Port Vila Bay are divided roughly into those near the mouth of the bay and those located in the head of the bay. In the survey sites near the mouth of the bay, the average coverage of corals was in the range from less than 5% to 33%. In the sites near the head of the bay, the average coverage of corals was at most less than 5%, that is lower when compared with the mouth of the bay. 2.3 Survey of coral habitat environment
The average turbidity during the survey period was low, 0.70 at the mouth of the Bay and 0.67 at the bay head, and no significant difference was found between the locations. The water temperature was from 26.4 to 27.6℃ at the former and from 26.2 to 27.3℃ at the latter. The salinity was around 34.8 at both sites. 2.4 Survey of distribution of corals to be transplanted
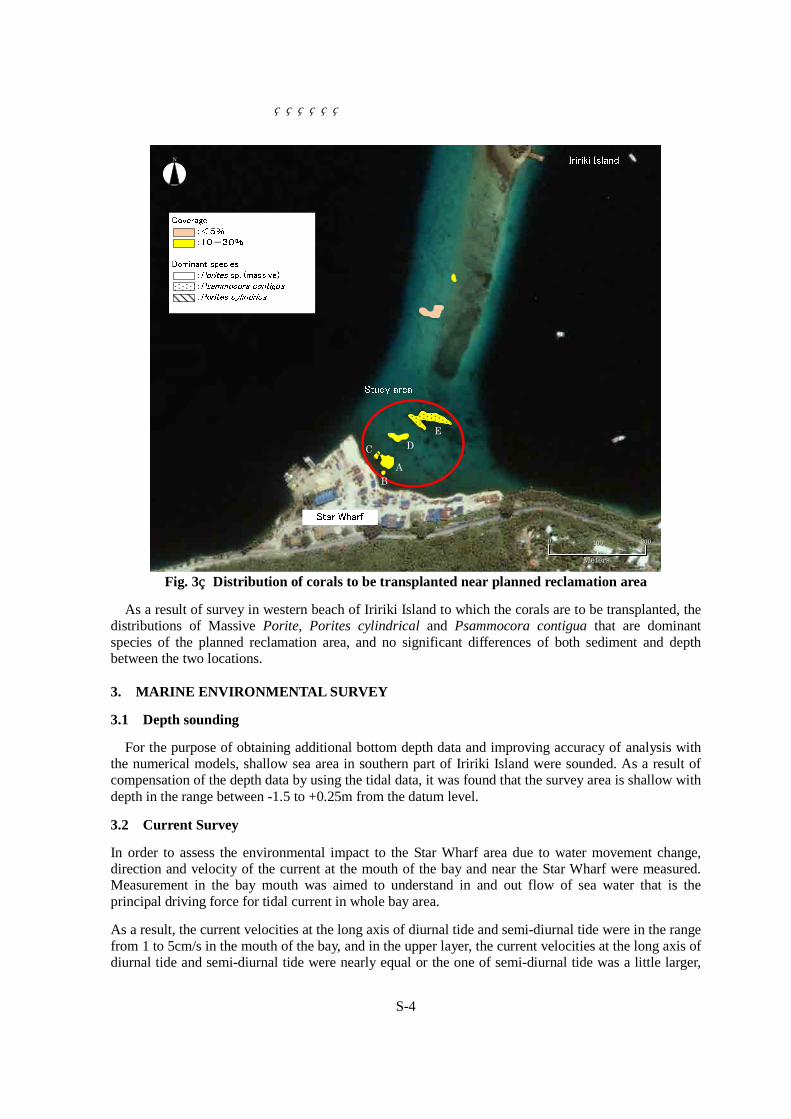
The coral communities near the planned reclamation area that are to be transplanted was split into five groups A to E that exist in the depth range from 1.5 to 2.1m (Fig. 3). For the community of Massive Porite group A, 122 Massive Porite colonies were recognized, of which colonies as large as over 3m were found. For the community of Massive Porite group B, 5 Massive Porite colonies that are in the range from 1m to less than 2m were recognized. For the community of Porites cylindrica group C, five communities of which area is approximately 4 ㎡ was recognized. For the community of Massive Porite group D, 97 colonies of which coral size is less than 3m were recognized. For the community of Psammocora contigua group E, the one with area of approximately 310 ㎡ was recognized.
S-4
0 200 100
Meters
0 200 100
Meters
N
A
E D
B
C
Fig. 3 Distribution of corals to be transplanted near planned reclamation area
As a result of survey in western beach of Iririki Island to which the corals are to be transplanted, the distributions of Massive Porite, Porites cylindrical and Psammocora contigua that are dominant species of the planned reclamation area, and no significant differences of both sediment and depth between the two locations. 3. MARINE ENVIRONMENTAL SURVEY
3.1 Depth sounding
For the purpose of obtaining additional bottom depth data and improving accuracy of analysis with the numerical models, shallow sea area in southern part of Iririki Island were sounded. As a result of compensation of the depth data by using the tidal data, it was found that the survey area is shallow with depth in the range between -1.5 to +0.25m from the datum level.
3.2 Current Survey
In order to assess the environmental impact to the Star Wharf area due to water movement change, direction and velocity of the current at the mouth of the bay and near the Star Wharf were measured. Measurement in the bay mouth was aimed to understand in and out flow of sea water that is the principal driving force for tidal current in whole bay area.
As a result, the current velocities at the long axis of diurnal tide and semi-diurnal tide were in the range from 1 to 5cm/s in the mouth of the bay, and in the upper layer, the current velocities at the long axis of diurnal tide and semi-diurnal tide were nearly equal or the one of semi-diurnal tide was a little larger,

S-5
and in the lower layer, the one of semi-diurnal tide was larger. The ellipse was oblate in nearly east-south-east to west-north-west direction. In the bay head, the current velocities at the long axis of diurnal tide and semi-diurnal tide were in the range from 1 to 3cm/s, and although the tidal component was small, the current velocity of diurnal tide in neap tide period was a little larger.
3.3 Survey of water quality and sediment
Water temperature, salinity and turbidity were measured in the bay mouth and the Paray Bay for the purpose of utilizing the data for predicting and assessing the effect of turbidity by the Star Warf project and for environmental conservation and monitoring. As the result, no significant change of vertical distribution of water temperature was observed at Star Warf , except that a thermo cline was observed at the depth of about 2m during the spring tide. As for the salinity, there was a tendency that the salinity was lower in the surface layer than the bottom layer at the mouth of the bay during the neap tide, which may have been caused by the rainfall. As for the turbidity, there was a tendency that it becomes very high in the bottom layer off the market of Paray Bay during the spring tide.
The sediment of the Star Warf contains much sand, and the rates of silt and clay that contribute to the turbidity of the sea area was small, only several percent.
4. NUMERICAL MODEL
By using the results of current survey, reproducibility of the current model was examined and then effect to the current by proposed layout of the Wharf was forecasted. The range of dispersion and sedimentation of the turbid materials produced by the construction works was predicted by using the silt advection, scattering and deposit model during the construction.
4.1 Changes of current velocity
Change of the current velocity occurs only in the 1st layer near the reclamation of Star Warf with the reduction of 1cm/s. There is a tendency that the range of change of the current velocity becomes wider during the falling tide and at the low tide. The range of changes of current velocity becomes narrower during the rising tide, and the change exceeding ±0.5cm/s cannot be observed at the high tide. For the changes of current velocity of mean current, local reduction of the current velocity of 0.5cm/s was observed near the reclamation area (Fig. 4).
Though a little change of current direction is observed due to existence of the reclaimed land, no situation that changes the current direction under the present condition are seen.

S-6
Distribution of current velocity vector Changes of current velocity
1st l
ayer
(0 to
2m
)
2nd
laye
r(2
to 5
m)
(Black arrow: Result of replication of current state, Red arrow: Result of future prediction)
Fig. 4 Changes of current (mean current, small region, 1st layer and 2nd layer)
4.2 Changes of sea water exchange
As for the changes of sea water exchange of the whole of the Port Vila Bay, out flow occurs in the upper layer and in flow occurs in the lower layer. Although the flow that passes cross-sectional area changes a little, the difference is small.
From the above matter, it is predicted that the sea water exchange of the whole of the Port Vila Bay may be affected little by implementation of the project.
4.3 Silt in-flow, diffusion and deposition model
(1) SS ( Suspended solids) concentration distribution

S-7
According to the results of prediction of SS concentration distribution when pump dredger is used without silt protector, it is seen in the 3rd layer (5 to 10m in deep) that is near the bottom of the dredged area. SS in the range of daily maximum of 2mg/L expands within a radius of about 100m from the place where the load occurs.
According to the results of the prediction when silt protector is used, expansion of SS is limited in a narrower range as compared with the case without silt protector, and the range of daily maximum of 2mg/L expands within a radius of 60m from the place where the load occurs.
According to the results of the prediction when grab (bucket) dredger is used without silt protector, SS concentration distribution is observed in all layers, especially the widest in the 2nd layer(2 to 5m in deep). SS in the range of daily maximum of 2mg/L expands within a radius of about 200m in the 1st layer(0 to 2m in deep) and a radius of about 250m from the place where the load occurs. In the 3rd layer (5 to 10m in deep) and 4th layer (10m and deeper in deep), SS expands within a radius of 200m.
According to the results of the prediction when silt protector is used, expansion of SS is limited in a narrower range as compared with the case without silt protector, and the range of daily maximum of 2mg/L expands within a radius of about 150m to 200m range from the place where the load occurs.
(2) Silt deposition
In case of pump dredger without silt protector, it is predicted that the range where thickness of the deposition is 1mm or more is within a radium of 100m from the place of the work, and thus, result showed the silt deposition can expand easily toward west from the place of the work (Fig. 4). Though the maximum thickness of the deposition of 20mm is predicted here, the actual value may be smaller because the location of the work moves during the construction period.
In case of grab dredger without silt protector, it is predicted that the range where thickness of the deposition is 1mm or more is within a radium of 250m from the place of the work, and thus, a result that the silt can expand easily toward west from the place of the work is obtained (Fig. 5). Though the maximum thickness of the deposition of 40mm is predicted here, the actual value may be smaller because the location of the work moves during the construction period.

S-8
Medium region Small region
Fig. 4 Distribution of SS deposition (Pump dredging)
Medium region Small region
Fig. 5 Distribution of SS deposition (Grab dredging)

S-9
5. EFFECTS TO CORALS AND CURRENT
5.1 Impact assessment to implementation of the project
5.1.1 Extinction of corals by reclamation
It is predicted that a part of area with high coverage of corals where large colonies are grown may be lost by the reclamation (Fig. 6).
0 200 100
Meters
0 200 100
Meters
N Iririki Island
Star Wharf
Coverage :<5% :10-30%
Dominant species : sp. (massive) : :
PROPOSED DEVELOPMENT :Envelope of construcion
(Phase1~5)
Fig. 6 Overlay of construction area to coral communities
5.1.2 Effect from flow change
As shown in Fig. 7, the area of changes of current velocity is found near the Star Warf, and it is predicted that the current velocity may be lower than present state. However, since the change of the current velocity is only about 1 ㎝/s, it is predicted that the effect of changes of current velocity to the corals may be small.

S-10
0 200 100
Meters
0 200 100
Meters
N
Fig.7 Overlay of value of current velocity change to coral communities (falling tide)
5.1.3 Effect from diffusion and deposition of silt
In case of pump dredging, distribution of daily maximum concentration of SS does not reach to coral distribution area, but the one produced by grab dredging reaches the coral habitat (Fig. 8-1). Distribution of deposition of SS produced by both pump dredging and grab dredging do not reach the coral habitat (Fig. 8-2). Therefore, when grab dredging is used, diffusion of silt can give adverse effect on the corals, and thus, it is recommended to select pump dredging. However, even when pump dredging is used, the turbid material occurs and deposits near the coral habitat, and thus, the coral may be affected depending on the flow regime. In case soil, sand or silt that flows out deposits on the corals, photonic synthesis activity of zooxanthella that cohabit with the corals is deteriorated, gives adverse effect on their growth. And at the same time, the corals secrete much mucus for removing the deposits from their surface, possibly debilitating themselves. Moreover, during vulnerable period such as high water temperature period during which bleaching occurs easily, the deposits may give more adverse effect on the corals.

S-11
Pump Dredging Grab Dredging
Coverage :<5% :10-30%Dominant species : sp. (massive) : :
Fig. 8-1 Overlay of SS distribution of daily maximum concentration to coral communities
Pump Dredging Grab Dredging
Coverage :<5% :10-30%Dominant species : sp. (massive) : :
Fig. 8-2 Overlay of distribution of SS deposition to coral communities
5.2 Mitigation measures
5.2.1 Mitigation against extinction by reclamation
Corals distributed in the planned reclamation areas are 127 colonies of Massive Porites and about 20㎡ of Porites cylindrica. Since these corals are distributed in shallow water of 1.5 to 2.1m in deep, it is difficult to use large boat. Therefore, for Massive Porites, only those with size that allows transportation by small boat can be carried. From the size of boat that can be chartered in Port Vila, for Massive Porites, it is suitable to transplant only the colonies with diameter of 2m or less. The corals

S-12
that are to be transplanted are, as shown in Table 1, 121 colonies of Massive Porites and about 20 ㎡ of Porites cylindrica.
Table 1 Corals to be transplaned (yellow cells)
Range A B C
Dominant species
Massive Porites Massive Porites Porites
cylindrica
Item No. of
colonies Area (㎡) No. of
colonies Area (㎡) Size of
community(㎡)
Longer diameter of colonies
<1m 97 19
ca20
1 to 2m 19 34 5 9
2 to 3m 5 25
>3m 1 10
Total 122 122 88 5 9
Total no. of colonies to be transplanted
116 53 5 9 ca20
5.2.2 Mitigation against effect of silt deposition
It is predicted that the turbid materials that are produced by the construction may expand centering around the construction area. The range of the effect depends on the method of dredging, and it is recommended to use pump dredging that effects less on the coral habitat. Even if the pump dredging is employed, it is recommended to install double silt protector to the coral habitat.
When grab dredging is used, since the method allows to expand the turbid material wider as compared with the pump dredging, it is necessary to strengthen the silt protection measures. For instance, installing double silt protector to the coral habitat, and installing silt protection frame on the dredging site are required.
6. ENVIRONMENTAL MANAGEMENT AND MONITORING PLAN
6.1 Construction phase
6.1.1 Total implementation system
The environment management and monitoring is conducted by the Ministry of Infrastructure and Public Utilities and the Ministry of Finance and Economic Management under their responsibilities of the project. Most of the tasks are performed through ordering the tasks to the construction contractors by including them in the consignment. The project management group that mainly consists of the Ifira Port Development Services (IPDS) supports actual jobs. The transplantation and monitoring of corals are performed through cooperation by the Department of Fisheries because these tasks require technical experiences in the field of marine biology.

S-13
6.1.2 Water quality
The turbidity, pH values, water temperature and salinity are measured by using a multifunctional water quality meter for three days immediately before the dredging, and once every day during the dredging period, at eight monitoring points and three background points. The measurements are compared with control values for construction phase, and in case the value is exceeded, the dredging is discontinued until the measurements meet the control. As for the turbidity, whether the turbidity of the sea area is from storm water or the dredging is evaluated by monitoring salinity and through visual observation.
6.1.3 Monitoring of coral reef ecological system
As for the method of monitoring in construction phase, inhabiting situation of the corals observed by spot surveys is compared with control, and in case any of the control is not met, a new countermeasures is taken such as transplanting.
6.1.4 Updating of environment management and monitoring plan in EIA report
Of the environment management and monitoring plan that is proposed in the EIA report prepared in the feasibility study and approved by Department of Environment of Vanuatu, construction and operation phases that can affect ecological systems such as corals and sea current have been discussed with relevant organizations of Vanuatu for the implementation, and the plan was confirmed for the implementation and updated as necessary. 6.2 Operational phase
6.2.1 Total implementation system
The plan is implemented under the responsibility of Ministry of Infrastructure and Public Utilities and Ministry of Finance and Economic Management that conduct the project in the same way as construction phase. As for monitoring of corals and water quality, the results of long term monitoring obtained by Department of Fisheries and Department of Geology, Mine and Water Resources are utilized.
6.2.2 Current
According to the results of prediction of changes of current in Port Vila Bay in operational phase, it is predicted that the effect of implementation of Star Warf project is only a little change of current velocity and it may give no adverse effect on the sea water exchange of Port Vila Bay. Therefore, it is evaluated that there is little need for monitoring of effects of this project.
6.2.3 Water quality
As for geological feature, this area is the most independent from other areas, and thus, it is suitable to monitor water quality of the Paray Bay where loads from city converge. For the measurement, use of unattended observation buoy is effective because the system can provide many continuous data automatically and periodically.
6.2.4 Corals
Monitoring of corals is carried at a frequency of once a year in three sites; location between Star Warf and Iririki Island, north of Ifira Island and mouth of Vatumaru Bay.

S-14
6.2.5 Updating of environment management and monitoring plan in EIA report
Environment management implemented by the terminal owner/operator, the one implemented through the cooperation of the Department of Geology, Mine and Water Resources and Department of Fisheries, and the one that is to be addressed by Vanuatu in the future have been arranged.
7. PROPOSAL
7.1 Establishing coral reef conservation plan
Water quality of Port Vila Harbor will be stable in the time when urban drainage improvement project is implemented. In order to sustain the environment, coral reef conservation plan should be prepared and environmental control should be operated.
Coral creation on bulkhead of reclamation
As a mitigation measures, transplantation using a coral settlement device and recruitment promotion by surface process on bulkhead material should be examined for coral creation on the bulkhead.
7.2 Establishing plans for environmental conservation and development in national level
The port and harbor development in Port Vila Bay may grow in importance in the future. Therefore, discussions may be needed in terms of various subjects including port and harbor development in other areas as well as intensive utilization of only sea area of Port Vila Bay in the future. Thus, we proposed execution of strategic environmental impact assessment through examination of future traffic infrastructure improvement plan as early as possible by bringing tourism development into view.
For implementing the strategic environment assessment, it is needed that comprehensive development plan and infrastructure plan are established based on wide scale study results on natural resources and evaluation results in national and local levels. Coral reef conservation plan should be also established in national level and fruit of monitoring should be activated effectively for conservation plan.
7.3 Formation of framework for sustainable utilization of Port Vila Bay
We proposed establishment of a committee for environment preservation and sustainable utilization of Port Vila Bay for the purpose of discussion, share of information and consensus formation on the issues related to the matter based on the assessment of monitoring data obtained and scientific knowledge.
7.4 Capacity building and enforcement of organizations concerning environmental management and monitoring
It is needed that forming sufficient system such as capacity building and budget obtaining for operating environmental management and monitoring that are planned in this project. Enforcement of organizations and capacity building for administrations that control environmental conservation and monitoring are required. Department of Environmental Protection and Conservation charged of environmental administration and EIA examination is especially needed for performing the matters. Department of Fisheries and Department of Geology, Mine and Water Resources are also required to form the system.

i
PREPARATORY STUDY FOR THE PROJECT ON INTERNATIONAL MULTI MODAL PORT AT STAR WHARF IN PORT VILA IN THE REPUBLIC OF
VANUATU (ENVIRONMENTAL STUDY)
FINAL REPORT Location Maps and Photographs of the Project Area Summary
TABLE OF CONTENTS Page
CHAPTER 1 Overview · · · · · · · · · · · · · · · · · · · · · · · · · · · · · · · · · · · · · · · · · · · · · · · · · · · · · · · · · · · · · · · · · · · · · · · · · · · · · · · · · · · · · 1 1.1 Background ·· · · · · · · · · · · · · · · · · · · · · · · · · · · · · · · · · · · · · · · · · · · · · · · · · · · · · · · · · · · · · · · · · · · · · · · · · · · · · · · · · · · · · · · 1 1.2 Objectives · · · · · · · · · · · · · · · · · · · · · · · · · · · · · · · · · · · · · · · · · · · · · · · · · · · · · · · · · · · · · · · · · · · · · · · · · · · · · · · · · · · · · · · · · · 1
CHAPTER 2 Outline of the Study · · · · · · · · · · · · · · · · · · · · · · · · · · · · · · · · · · · · · · · · · · · · · · · · · · · · · · · · · · · · · · · · · · · · · · · · 2 2.1 Study Area · · · · · · · · · · · · · · · · · · · · · · · · · · · · · · · · · · · · · · · · · · · · · · · · · · · · · · · · · · · · · · · · · · · · · · · · · · · · · · · · · · · · · · · · · 2 2.2 Outline of the Project on International Multi Model Port at Star Wharf in Port Vila · · · · · 2 2.3 Study Contents · · · · · · · · · · · · · · · · · · · · · · · · · · · · · · · · · · · · · · · · · · · · · · · · · · · · · · · · · · · · · · · · · · · · · · · · · · · · · · · · · · · · 3 2.4 Study Period · · · · · · · · · · · · · · · · · · · · · · · · · · · · · · · · · · · · · · · · · · · · · · · · · · · · · · · · · · · · · · · · · · · · · · · · · · · · · · · · · · · · · · · 6 2.5 Counterpart Organization · · · · · · · · · · · · · · · · · · · · · · · · · · · · · · · · · · · · · · · · · · · · · · · · · · · · · · · · · · · · · · · · · · · · · · · · 6
CHAPTER 3 Present Situation on Environmental Conservation in Vanuatu · · · · · · · · · · · · · · · · · · · · 7 3.1 Government Policy on Environmental Conservation, Legal Framework and
Environmental Assessment System in Vanuatu · · · · · · · · · · · · · · · · · · · · · · · · · · · · · · · · · · · · · · · · · · · · · · · 7 3.1.1 Legal Framework Regarding Environment and Development · · · · · · · · · · · · · · · · · · · · · · · · · · 7 3.1.2 Policy for Environmental Conservation · · · · · · · · · · · · · · · · · · · · · · · · · · · · · · · · · · · · · · · · · · · · · · · · · · · · 9
3.2 Movement on Sustainable Utilization of Port Vila Harbour · · · · · · · · · · · · · · · · · · · · · · · · · · · · · · · · · 13 3.2.1 Tourism Policy and Present Situation · · · · · · · · · · · · · · · · · · · · · · · · · · · · · · · · · · · · · · · · · · · · · · · · · · · · · · 13 3.2.2 Present Situation on Utilization of Port Vila Harbour · · · · · · · · · · · · · · · · · · · · · · · · · · · · · · · · · · · · 14
3.3 Present Situation of Coral Reef and Marine Organisms·· · · · · · · · · · · · · · · · · · · · · · · · · · · · · · · · · · · · · 16 3.3.1 Topography · · · · · · · · · · · · · · · · · · · · · · · · · · · · · · · · · · · · · · · · · · · · · · · · · · · · · · · · · · · · · · · · · · · · · · · · · · · · · · · · · · · · 16 3.3.2 Coral Community · · · · · · · · · · · · · · · · · · · · · · · · · · · · · · · · · · · · · · · · · · · · · · · · · · · · · · · · · · · · · · · · · · · · · · · · · · · · · 17 3.3.3 Sea grass bed · · · · · · · · · · · · · · · · · · · · · · · · · · · · · · · · · · · · · · · · · · · · · · · · · · · · · · · · · · · · · · · · · · · · · · · · · · · · · · · · · · 21 3.3.4 Dugong and sea turtle · · · · · · · · · · · · · · · · · · · · · · · · · · · · · · · · · · · · · · · · · · · · · · · · · · · · · · · · · · · · · · · · · · · · · · · · 21 3.3.5 Fisheries Resources · · · · · · · · · · · · · · · · · · · · · · · · · · · · · · · · · · · · · · · · · · · · · · · · · · · · · · · · · · · · · · · · · · · · · · · · · · · 21
3.4 Present Situation of Marine Environment · · · · · · · · · · · · · · · · · · · · · · · · · · · · · · · · · · · · · · · · · · · · · · · · · · · · · 22 3.4.1 Ocean Current · · · · · · · · · · · · · · · · · · · · · · · · · · · · · · · · · · · · · · · · · · · · · · · · · · · · · · · · · · · · · · · · · · · · · · · · · · · · · · · · · 22 3.4.2 Water Quality · · · · · · · · · · · · · · · · · · · · · · · · · · · · · · · · · · · · · · · · · · · · · · · · · · · · · · · · · · · · · · · · · · · · · · · · · · · · · · · · · · 23 3.4.3 Plan for Water Quality Improvement · · · · · · · · · · · · · · · · · · · · · · · · · · · · · · · · · · · · · · · · · · · · · · · · · · · · · · · 25 3.4.4 Impacts by Sea Level Rise · · · · · · · · · · · · · · · · · · · · · · · · · · · · · · · · · · · · · · · · · · · · · · · · · · · · · · · · · · · · · · · · · · · 26
3.5 Conclusion of Present Environmental Conservation in Vanuatu · · · · · · · · · · · · · · · · · · · · · · · · · · · · 26
CHAPTER 4 Scoping · · · · · · · · · · · · · · · · · · · · · · · · · · · · · · · · · · · · · · · · · · · · · · · · · · · · · · · · · · · · · · · · · · · · · · · · · · · · · · · · · · · · · · · 27 4.1 Alternatives · · · · · · · · · · · · · · · · · · · · · · · · · · · · · · · · · · · · · · · · · · · · · · · · · · · · · · · · · · · · · · · · · · · · · · · · · · · · · · · · · · · · · · · · 27 4.2 Scoping for this Study · · · · · · · · · · · · · · · · · · · · · · · · · · · · · · · · · · · · · · · · · · · · · · · · · · · · · · · · · · · · · · · · · · · · · · · · · · · · 32 4.3 Scoping for Impacts on Coral Reef Ecosystem and Water Current · · · · · · · · · · · · · · · · · · · · · · · · · 39
CHAPTER 5 Field Survey · · · · · · · · · · · · · · · · · · · · · · · · · · · · · · · · · · · · · · · · · · · · · · · · · · · · · · · · · · · · · · · · · · · · · · · · · · · · · · · · · 43

ii
5.1 Survey of Coral Reef · · · · · · · · · · · · · · · · · · · · · · · · · · · · · · · · · · · · · · · · · · · · · · · · · · · · · · · · · · · · · · · · · · · · · · · · · · · · · 43 5.1.1 Coral Reef Mapping · · · · · · · · · · · · · · · · · · · · · · · · · · · · · · · · · · · · · · · · · · · · · · · · · · · · · · · · · · · · · · · · · · · · · · · · · · 43 5.1.2 Transect Survey · · · · · · · · · · · · · · · · · · · · · · · · · · · · · · · · · · · · · · · · · · · · · · · · · · · · · · · · · · · · · · · · · · · · · · · · · · · · · · · 60 5.1.3 Survey of Coral Habitat Environment · · · · · · · · · · · · · · · · · · · · · · · · · · · · · · · · · · · · · · · · · · · · · · · · · · · · · · 107 5.1.4 Distribution Survey of Corals to be Relocated · · · · · · · · · · · · · · · · · · · · · · · · · · · · · · · · · · · · · · · · · · · · 110
5.2 Marine Environment Survey · · · · · · · · · · · · · · · · · · · · · · · · · · · · · · · · · · · · · · · · · · · · · · · · · · · · · · · · · · · · · · · · · · · · 116 5.2.1 Depth sounding · · · · · · · · · · · · · · · · · · · · · · · · · · · · · · · · · · · · · · · · · · · · · · · · · · · · · · · · · · · · · · · · · · · · · · · · · · · · · · · 116 5.2.2 Current Survey · · · · · · · · · · · · · · · · · · · · · · · · · · · · · · · · · · · · · · · · · · · · · · · · · · · · · · · · · · · · · · · · · · · · · · · · · · · · · · · · 119 5.2.3 Survey of water quality and sediment · · · · · · · · · · · · · · · · · · · · · · · · · · · · · · · · · · · · · · · · · · · · · · · · · · · · · · 130
5.3 Information Disclosure and Stakeholder Meeting · · · · · · · · · · · · · · · · · · · · · · · · · · · · · · · · · · · · · · · · · · · · 140 5.3.1 Information Disclosure · · · · · · · · · · · · · · · · · · · · · · · · · · · · · · · · · · · · · · · · · · · · · · · · · · · · · · · · · · · · · · · · · · · · · · · 140 5.3.2 The First Stakeholder Meeting · · · · · · · · · · · · · · · · · · · · · · · · · · · · · · · · · · · · · · · · · · · · · · · · · · · · · · · · · · · · · · 140 5.3.3 The Second Stakeholder Meeting · · · · · · · · · · · · · · · · · · · · · · · · · · · · · · · · · · · · · · · · · · · · · · · · · · · · · · · · · · · 143
CHAPTER 6 Numerical simulation · · · · · · · · · · · · · · · · · · · · · · · · · · · · · · · · · · · · · · · · · · · · · · · · · · · · · · · · · · · · · · · · · · · · · · 144
6.1 Study objectives · · · · · · · · · · · · · · · · · · · · · · · · · · · · · · · · · · · · · · · · · · · · · · · · · · · · · · · · · · · · · · · · · · · · · · · · · · · · · · · · · · · 144 6.1.1 Procedures of numerical simulation · · · · · · · · · · · · · · · · · · · · · · · · · · · · · · · · · · · · · · · · · · · · · · · · · · · · · · · · 144 6.1.2 Selection of numerical models · · · · · · · · · · · · · · · · · · · · · · · · · · · · · · · · · · · · · · · · · · · · · · · · · · · · · · · · · · · · · · 145 6.1.3 Construction of models · · · · · · · · · · · · · · · · · · · · · · · · · · · · · · · · · · · · · · · · · · · · · · · · · · · · · · · · · · · · · · · · · · · · · · 146
6.2 Hydrodynamics · · · · · · · · · · · · · · · · · · · · · · · · · · · · · · · · · · · · · · · · · · · · · · · · · · · · · · · · · · · · · · · · · · · · · · · · · · · · · · · · · · · 148 6.2.1 Model description· · · · · · · · · · · · · · · · · · · · · · · · · · · · · · · · · · · · · · · · · · · · · · · · · · · · · · · · · · · · · · · · · · · · · · · · · · · · · 148 6.2.2 Computational conditions · · · · · · · · · · · · · · · · · · · · · · · · · · · · · · · · · · · · · · · · · · · · · · · · · · · · · · · · · · · · · · · · · · · 152 6.2.3 Validation of hydrodynamics model · · · · · · · · · · · · · · · · · · · · · · · · · · · · · · · · · · · · · · · · · · · · · · · · · · · · · · · 168 6.2.4 Future prediction · · · · · · · · · · · · · · · · · · · · · · · · · · · · · · · · · · · · · · · · · · · · · · · · · · · · · · · · · · · · · · · · · · · · · · · · · · · · · · 177
6.3 Silt Diffusion and deposition model · · · · · · · · · · · · · · · · · · · · · · · · · · · · · · · · · · · · · · · · · · · · · · · · · · · · · · · · · · · · 185 6.3.1 Model description· · · · · · · · · · · · · · · · · · · · · · · · · · · · · · · · · · · · · · · · · · · · · · · · · · · · · · · · · · · · · · · · · · · · · · · · · · · · · 185 6.3.2 Computation conditions · · · · · · · · · · · · · · · · · · · · · · · · · · · · · · · · · · · · · · · · · · · · · · · · · · · · · · · · · · · · · · · · · · · · · · 186 6.3.3 Results of prediction · · · · · · · · · · · · · · · · · · · · · · · · · · · · · · · · · · · · · · · · · · · · · · · · · · · · · · · · · · · · · · · · · · · · · · · · · 194
CHAPTER 7 Effects to Corals and Current due to implementation of the project and its mitigation · · · · · · · · · · · · · · · · · · · · · · · · · · · · · · · · · · · · · · · · · · · · · · · · · · · · · · · · · · · · · · · · · · · · · · · · · · · · · · · · · · · · · · · · · · · · · · · · · · · · · · · · 214
7.1 Impact assessment to implementation of the project · · · · · · · · · · · · · · · · · · · · · · · · · · · · · · · · · · · · · · · · · 214 7.1.1 Extinction of corals by reclamation · · · · · · · · · · · · · · · · · · · · · · · · · · · · · · · · · · · · · · · · · · · · · · · · · · · · · · · · 214 7.1.2 Effect from flow change and silt deposition · · · · · · · · · · · · · · · · · · · · · · · · · · · · · · · · · · · · · · · · · · · · · · · 214 7.1.3 Effects on construction to others · · · · · · · · · · · · · · · · · · · · · · · · · · · · · · · · · · · · · · · · · · · · · · · · · · · · · · · · · · · · 222 7.1.4 Effects from human activities activated · · · · · · · · · · · · · · · · · · · · · · · · · · · · · · · · · · · · · · · · · · · · · · · · · · · · 223 7.1.5 Effects from sea water temperature to coral bleaching · · · · · · · · · · · · · · · · · · · · · · · · · · · · · · · · · · · 223 7.1.6 Scoping results for the whole projects · · · · · · · · · · · · · · · · · · · · · · · · · · · · · · · · · · · · · · · · · · · · · · · · · · · · · 224
7.2 Mitigation measures · · · · · · · · · · · · · · · · · · · · · · · · · · · · · · · · · · · · · · · · · · · · · · · · · · · · · · · · · · · · · · · · · · · · · · · · · · · · · · 225 7.2.1 Mitigation against extinction by reclamation · · · · · · · · · · · · · · · · · · · · · · · · · · · · · · · · · · · · · · · · · · · · · · 225 7.2.2 Mitigation against effect of silt deposition · · · · · · · · · · · · · · · · · · · · · · · · · · · · · · · · · · · · · · · · · · · · · · · · 229 7.2.3 Mitigation against effect due to current change · · · · · · · · · · · · · · · · · · · · · · · · · · · · · · · · · · · · · · · · · · · 235 7.2.4 Mitigation against water quality deterioration in Port Vila Bay due to economic
development · · · · · · · · · · · · · · · · · · · · · · · · · · · · · · · · · · · · · · · · · · · · · · · · · · · · · · · · · · · · · · · · · · · · · · · · · · · · · · · · · · · 235 CHAPTER 8 Environmental Management and Monitoring Plan · · · · · · · · · · · · · · · · · · · · · · · · · · · · · · · · · · 236
8.1 Construction Phase · · · · · · · · · · · · · · · · · · · · · · · · · · · · · · · · · · · · · · · · · · · · · · · · · · · · · · · · · · · · · · · · · · · · · · · · · · · · · · · 236 8.1.1 Overall Implementation Framework · · · · · · · · · · · · · · · · · · · · · · · · · · · · · · · · · · · · · · · · · · · · · · · · · · · · · · · 236 8.1.2 Water Quality · · · · · · · · · · · · · · · · · · · · · · · · · · · · · · · · · · · · · · · · · · · · · · · · · · · · · · · · · · · · · · · · · · · · · · · · · · · · · · · · · · 237 8.1.3 Corals · · · · · · · · · · · · · · · · · · · · · · · · · · · · · · · · · · · · · · · · · · · · · · · · · · · · · · · · · · · · · · · · · · · · · · · · · · · · · · · · · · · · · · · · · · 240 8.1.4 Updating EMMP in the EIA Report · · · · · · · · · · · · · · · · · · · · · · · · · · · · · · · · · · · · · · · · · · · · · · · · · · · · · · · · 244
iii
8.2 Operation Phase · · · · · · · · · · · · · · · · · · · · · · · · · · · · · · · · · · · · · · · · · · · · · · · · · · · · · · · · · · · · · · · · · · · · · · · · · · · · · · · · · · · 251 8.2.1 Overall Implementation Framework · · · · · · · · · · · · · · · · · · · · · · · · · · · · · · · · · · · · · · · · · · · · · · · · · · · · · · · 251 8.2.2 Water Current · · · · · · · · · · · · · · · · · · · · · · · · · · · · · · · · · · · · · · · · · · · · · · · · · · · · · · · · · · · · · · · · · · · · · · · · · · · · · · · · · 252 8.2.3 Water Quality · · · · · · · · · · · · · · · · · · · · · · · · · · · · · · · · · · · · · · · · · · · · · · · · · · · · · · · · · · · · · · · · · · · · · · · · · · · · · · · · · · 252 8.2.4 Corals and Marine Lives · · · · · · · · · · · · · · · · · · · · · · · · · · · · · · · · · · · · · · · · · · · · · · · · · · · · · · · · · · · · · · · · · · · · · 255 8.2.5 Updating EMMP in the EIA Report · · · · · · · · · · · · · · · · · · · · · · · · · · · · · · · · · · · · · · · · · · · · · · · · · · · · · · · · 257
CHAPTER 9 Proposal · · · · · · · · · · · · · · · · · · · · · · · · · · · · · · · · · · · · · · · · · · · · · · · · · · · · · · · · · · · · · · · · · · · · · · · · · · · · · · · · · · · · · · 264
9.1 Establishing coral reef conservation plan · · · · · · · · · · · · · · · · · · · · · · · · · · · · · · · · · · · · · · · · · · · · · · · · · · · · · · 264 9.2 Establishing plans for environmental conservation and development in national
level · · · · · · · · · · · · · · · · · · · · · · · · · · · · · · · · · · · · · · · · · · · · · · · · · · · · · · · · · · · · · · · · · · · · · · · · · · · · · · · · · · · · · · · · · · · · · · · · · 265 9.3 Formation of Framework for Sustainable Utilization of Port Vila Harbor · · · · · · · · · · · · · · · · · 265 9.4 Capacity building and enforcement of organizations concerning environmental
management and monitoring · · · · · · · · · · · · · · · · · · · · · · · · · · · · · · · · · · · · · · · · · · · · · · · · · · · · · · · · · · · · · · · · · · · · 267

Preparatory Study for the Project on International Multi Modal Port at Star Wharf in Port Vila (Environmental Study) FINAL REPORT
1
CHAPTER 1 Overview
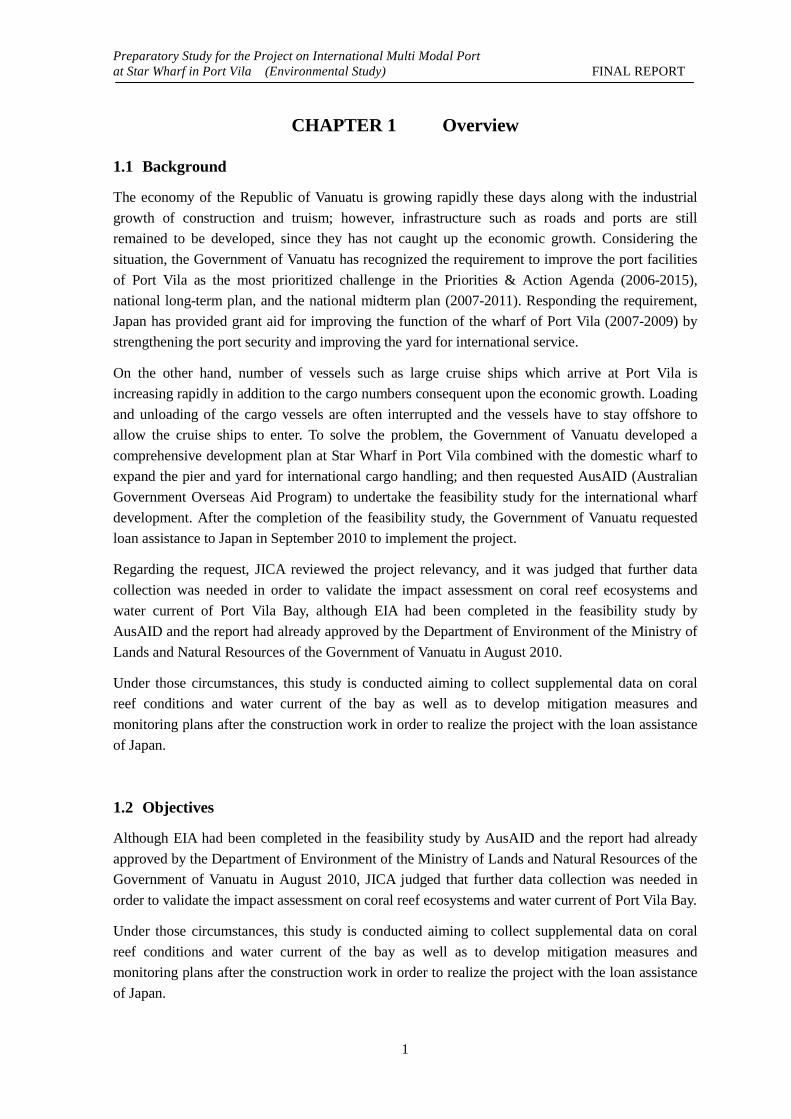
1.1 Background
The economy of the Republic of Vanuatu is growing rapidly these days along with the industrial
growth of construction and truism; however, infrastructure such as roads and ports are still
remained to be developed, since they has not caught up the economic growth. Considering the
situation, the Government of Vanuatu has recognized the requirement to improve the port facilities
of Port Vila as the most prioritized challenge in the Priorities & Action Agenda (2006-2015),
national long-term plan, and the national midterm plan (2007-2011). Responding the requirement,
Japan has provided grant aid for improving the function of the wharf of Port Vila (2007-2009) by
strengthening the port security and improving the yard for international service.
On the other hand, number of vessels such as large cruise ships which arrive at Port Vila is
increasing rapidly in addition to the cargo numbers consequent upon the economic growth. Loading
and unloading of the cargo vessels are often interrupted and the vessels have to stay offshore to
allow the cruise ships to enter. To solve the problem, the Government of Vanuatu developed a
comprehensive development plan at Star Wharf in Port Vila combined with the domestic wharf to
expand the pier and yard for international cargo handling; and then requested AusAID (Australian
Government Overseas Aid Program) to undertake the feasibility study for the international wharf
development. After the completion of the feasibility study, the Government of Vanuatu requested
loan assistance to Japan in September 2010 to implement the project.
Regarding the request, JICA reviewed the project relevancy, and it was judged that further data
collection was needed in order to validate the impact assessment on coral reef ecosystems and
water current of Port Vila Bay, although EIA had been completed in the feasibility study by
AusAID and the report had already approved by the Department of Environment of the Ministry of
Lands and Natural Resources of the Government of Vanuatu in August 2010.
Under those circumstances, this study is conducted aiming to collect supplemental data on coral
reef conditions and water current of the bay as well as to develop mitigation measures and
monitoring plans after the construction work in order to realize the project with the loan assistance
of Japan.
1.2 Objectives
Although EIA had been completed in the feasibility study by AusAID and the report had already
approved by the Department of Environment of the Ministry of Lands and Natural Resources of the
Government of Vanuatu in August 2010, JICA judged that further data collection was needed in
order to validate the impact assessment on coral reef ecosystems and water current of Port Vila Bay.
Under those circumstances, this study is conducted aiming to collect supplemental data on coral
reef conditions and water current of the bay as well as to develop mitigation measures and
monitoring plans after the construction work in order to realize the project with the loan assistance
of Japan.

Preparatory Study for the Project on International Multi Modal Port at Star Wharf in Port Vila (Environmental Study) FINAL REPORT
2
CHAPTER 2 Outline of the Study
2.1 Study Area
Star Wharf in Port Vila and its surrounding sea area
2.2 Outline of the Project on International Multi Model Port at Star Wharf in Port Vila
This project is to upgrade Star Wharf, a domestic cargo handling wharf of Port Vila, into an
international container terminal by improving and expanding the wharf. The project components
are shown below (Fig.2.2-1).
1) Civil Engineering Works:
Construction of a new multipurpose pier for container and the other cargo vessels (L:200m、
B:20m、D:12.3m),
Reclamation for backyard (0.94ha、34,000m3),
Improvement of container yard,
Dredging (berth box and the others: 62,000m3 , water depth: 12m), and the others.
2) Procurement of Equipments:
Movable crane for container handling,
Heavy forklift truck,
Handler for empty containers, and the others
3) Consulting Services: e.g. detailed design, tender assistance

Preparatory Study for the Project on International Multi Modal Port at Star Wharf in Port Vila (Environmental Study) FINAL REPORT
3
Source: Star Terminal Construction Project, Bankable Feasibility Study, Final Report (2010)
Fig. 2.2-1 Project Plan (Star Wharf)
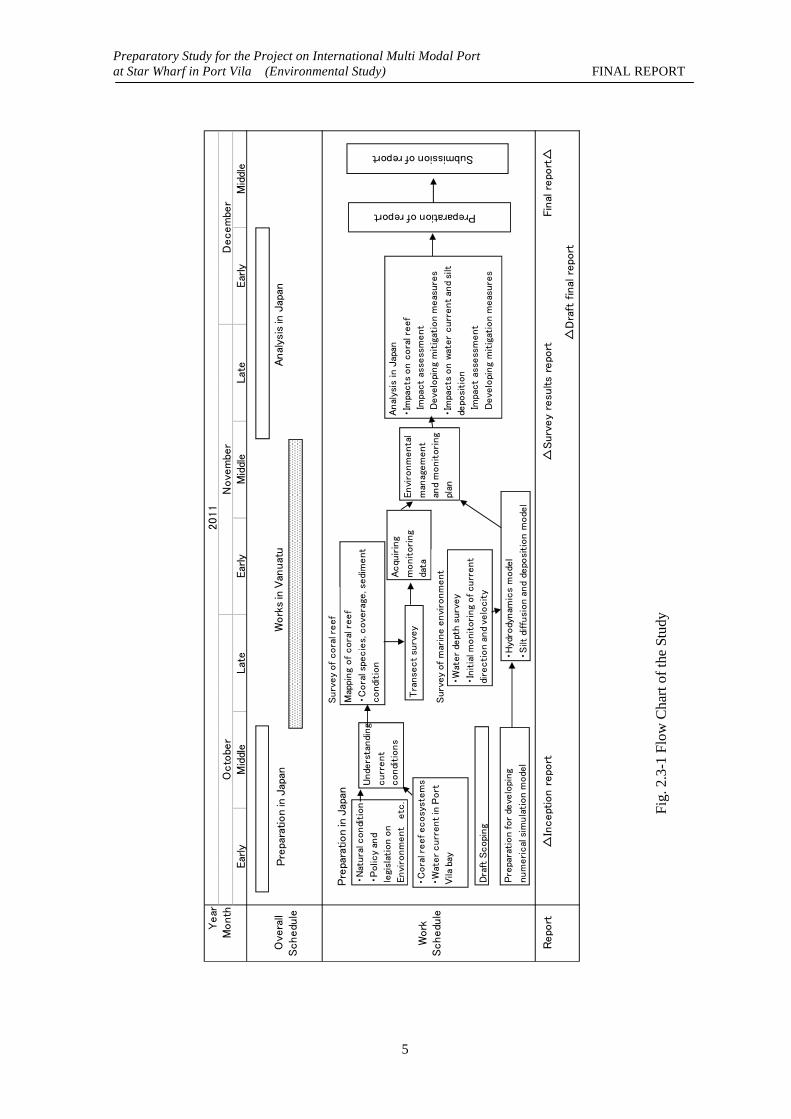
2.3 Study Contents
In order to supplement the EIA report developed in the Feasibility Study conducted by AusAID,
following study will be undertaken in this study. Flow chart of the study is shown in Fig. 2.3-1.
(1) Study on the Coral Reef Ecosystems and Water Current
Coral Reef Ecosystems
To comprehend the coral reef condition including species composition and coverage
as a baseline of the impact assessment and mitigation measures as well as the
monitoring survey.
Water Current of Port Vila Bay
To observe the direction and velocity of the current in the bay in order to understand
the water current condition and estimate the change caused by the project.
To calculate the change using numerical simulation model for quantitative assessment
of the impact of current change, turbidity dispersion and silt deposition caused by the
project.
Pier
Dredging
Reclamation
Existing Yard
Existing Wharf Container Yard

Preparatory Study for the Project on International Multi Modal Port at Star Wharf in Port Vila (Environmental Study) FINAL REPORT
4
(2) Developing Environmental Management and Monitoring Plan
Based on the comprehended condition and the calculation results above, impacts on the coral reef
ecosystems and water current in the bay will be assessed. Furthermore, transplantation plan of the
corals and monitoring plan of corals, water quality and water current will be proposed as mitigation
measures. Those plans need to be feasible; therefore, close discussion with the implementing
agency is indispensable during the process of developing the plans.
(3) Disclosure of EIA Report and Public Consultations
It is required to disclose EIA report and hold stakeholder meetings with local communities in
accordance with the JICA Guidelines for Environmental and Social Considerations. In this study,
(a) disclosure of EIA report and (b) holding a stakeholder meeting, which JICA is moving forward,
will be assisted from the technical viewpoints.
[Draft of Invitee of the Stakeholder Meeting]
- Local residents (e.g. representatives of communities)
- Fishermen (e.g. representatives of fishermen’s cooperatives)
- Tourist agents (e.g. Iririki resort)
Preparatory Study for the Project on International Multi Modal Port at Star Wharf in Port Vila (Environmental Study) FINAL REPORT
5
Year
2011
Month
Octo
ber
Nove
mbe
rD
ecem
ber
Ear
lyM
iddl
eLat
eEar
lyM
iddl
eLat
eEar
lyM
iddl
e
Ove
rall
Schedu
le
Work
Schedu
le
Repo
rt
△In
cept
ion r
epo
rt
△Surv
ey
resu
lts
repo
rtFin
al r
epo
rt△
△D
raft
fin
al r
epo
rt
・N
atura
l condi
tion
・P
olic
y an
d
legi
slat
ion o
n
Envi
ronm
ent
etc
.
・C
ora
l reef ecosy
stem
s
・W
ater curr
ent in
Port
Vila
bay
Pre
para
tion in
Jap
an
Unde
rsta
ndi
ng
curr
ent
condi
tions
Dra
ft S
copi
ng
Pre
para
tion for
deve
lopi
ng
num
erical
sim
ula
tion m
ode
l
Map
ping
of cora
l reef
・C
ora
l spe
cie
s, c
ove
rage
, sedi
ment
condi
tion
Tra
nse
ct su
rvey
Acqu
irin
g
monit
ori
ng
data
Envi
ronm
enta
l
man
agem
ent
and
monit
ori
ng
plan
Surv
ey
of
cora
l reef
Surv
ey
of m
arin
e e
nvi
ronm
ent
・W
ater
dept
h s
urv
ey
・In
itia
l monit
ori
ng
of curr
ent
dire
ction a
nd
velo
cit
y
・H
ydro
dynam
ics
mode
l
・S
ilt d
iffu
sion a
nd
depo
siti
on m
ode
l
Anal
ysis
in J
apan
・Im
pacts
on c
ora
l reef
Impa
ct
asse
ssm
ent
Deve
lopi
ng
mit
igat
ion m
eas
ure
s
・Im
pacts
on w
ater
curr
ent an
d si
lt
depo
siti
on
Impa
ct
asse
ssm
ent
Deve
lopi
ng
mit
igat
ion m
eas
ure
s
Preparation of report
Submission of report
Pre
para
tion in
Jap
anAnal
ysis
in J
apan
Work
s in
Van
uat
u
Fig
. 2.3
-1 F
low
Cha
rt o
f th
e St
udy

Preparatory Study for the Project on International Multi Modal Port at Star Wharf in Port Vila (Environmental Study) FINAL REPORT
6
2.4 Study Period
7 October 2011 to 13 January 2012
2.5 Counterpart Organization
(1) Operating Organizations
-Ministry of Finance and Economic Management of the Republic of Vanuatu
-Ministry of Infrastructure and Public Utilities of the Republic of Vanuatu
(2) Stakeholders
-Department of Environment, Ministry of Lands & Natural Resources
-Department of Fisheries, Ministry of Agriculture
-Department of Geology, Mine and Water Resources

7
CHAPTER 3 Present Situation on Environmental Conservation in Vanuatu
3.1 Government Policy on Environmental Conservation, Legal Framework and Environmental Assessment System in Vanuatu
3.1.1 Legal Framework Regarding Environment and Development
(1) Overview
Legal framework regarding environment and development in Vanuatu and its outline are summarized in Table 3.1.1-1. According to the table, a series of legal framework regarding environmental conservation, coastal development and establishment of protected area has already been managed.
Table 3.1.1-1 Summary of Legal Framework Regarding Environment and Development in Vanuatu
Legal framework Outline
1. Control of Nocturnal Noise Act 1965 Noise including music between 9 p.m. and 5 a.m. is controlled, targeting the area of Port Vila and Luganville in Santo Island.
2. Convention on Biological Diversity (Ratification) Act 1992
Vanuatu has ratified the international treaty on conservation of biodiversity and sustainable utilization.
3. Environmental Protection and Conservation Act
(The name of the act, Environmental Management and Conservation Act 2002, was modified in January 2011.)
Basic law on environmental conservation in Vanuatu, and it states the mandate of the director general of the Department of Environmental Protection and Conservation, procedure of EIA, bio-prospecting and establishment of protected area.
4. Environmental Impact Assessment Regulations 2011
New regulation under the Environmental Protection and Conservation Act. It explains the EIA procedure specifically.
5. Fisheries Act 2005 It stipulates establishment of fisheries management plan, registration of fishing boat, control of fishing method, establishment of fisheries control area, etc.
6. Foreshore Development Act 1975 It regulates the procedure on development of coastal area below mean high water level.
7. Mines & Minerals Act 1986 It regulates mining of minerals. Permission underthis law is necessary upon sea bottom dredging and extracting of reclamation materials.
8. Montreal Protocol on Substances that Deplete the Ozone Layer (Ratification) Act 1984
Vanuatu has ratified the international treaty on reduction of ozone depleting substance.
9. National Parks Act 1993 It stipulates establishment of national park and its

8
management.
10. Physical Planning Act 1986 (Chapter 193) Application procedure on land development is stated. Municipalities have the responsibility for land planning.
11. Preservation of Sites and Artifacts Act 1975 Law on conservation of history, ethnic group, artistic ruin/property
12. Water Resources Management Act 2002 Law on conservation, management and utilization of water resources. Water quality management in a bay must be based on this law.
13. Wild Bird (Protection) Act 1962 Capture or kill and wound are controlled for conservation of wild birds.
(2) Legal Framework on EIA
The procedure on EIA is stipulated by the Environmental Protection and Conservation Act and the EIA for this project has already approved following the Act. The Environmental Impact Assessment Regulations was established in July 2011 under the Act to translate a part of the procedure into reality. Followings are major stipulations which were added.
Implementation of Preliminary Environmental Assessment on whole projects Heretofore definition of project which EIA procedure is necessary was not clear. By the new regulation, however, it is stipulated that Preliminary Environmental Assessment (PEA) shall be conducted for almost whole kinds of project except the construction of individual residence and necessity of full EIA shall be evaluated based on the PEA.
Implementation of public consultation New regulation states the obligation for holding of public consultation such as stakeholder meeting. By this regulation, it is stipulated that the project owner needs to hold consultations about the project and at least one (1) of them must be held at the neighborhood of the project site. Furthermore, the Director General of the Department of Environmental Protection and Conservation can force the project owner to hold the consultations at the stage of preparation of TOR for EIA and the timing of completion of the EIA. The place where a copy of the EIA can be obtained must be clarified and this leads to the obligation of disclosure of the EIA report.
Establishment of Environmental Management and Monitoring Plan While establishment of the Environmental Management and Monitoring Plan was not stated in the previous law, establishment and getting approval of the EMMP as a procedure of EIA report is obligated in the new regulation.
The procedure for the Preliminary Environmental Assessment is not necessary, as EIA has already been conducted on this Project. And two (2) times of public consultations have been held during this survey period, which meets the requirement of the new regulation.
(3) Legal Framework on Protected Area
Legal framework on protected area is summarized below. The target area and its surroundings on this project do not correspond to the protected area or national park, which is stipulated by the legal

9
framework.
Conservation Area by the Environmental Protection and Conservation Act The General Director of the Department of Environmental Protection and Conservation is able to designate an area, which meet with following condition, as a protected area with agreement by the customary land owner(s).
It shall be specific resource genetically, historically, geographically and biologically.
It shall be domestically specific or internationally important sanctuary of wild life.
Protection is necessary under the Convention for the Protection of the World Cultural and Natural Heritage
Nguna-Pele, northern part of the Efate Island, is designated as a marine protected area and coral reef management by local community is being performed.
National Park by National Parks Act The area that meets with following condition can be designated as a national park or a national natural reserve under the National Parks Act.
It shall have specific ecosystem, genetic resource and physical-biological characteristic.
It shall be an important habitat to be conserved for fauna and flora from scientific viewpoint.
It shall have prominent natural landscape.
It shall have archaeological or other scientific and environmental importance.
Designation as a national park/natural reserve is undertaken with recommendation by national park council, which consists of general directors from multiple ministries and tribal chiefs. According to the Department of Environmental Protection and Conservation, no area has been designated at moment.
Marine Reserve by Fisheries Act The minister of the Ministry of Agriculture, Forest, Fisheries and Livestock is able to designate a marine protection area based on the consultation with local municipalities and adjacent land owners. Fishing activities, collecting and breaking of corals, dredging and extraction of sand and earth, over fishing in habitat area and retrieval or demolition of wrecks are prohibited without permission in the protected area.
3.1.2 Policy for Environmental Conservation
(1) Conservation for Coral Ecosystem
Although it does not only focusing coral reef, measures for conservation of ecosystem are being performed through conducting EIA procedure and designation of protected area.
According to the National Report 2006 by the Convention on Biological Diversity, while following monitoring programs regarding ecosystem exit in Vanuatu research study is rarely conducted in general and information regarding ecosystem is limited. And comprehensive study has not been conducted due to lack of technical and financial resources.

10
Monitoring for habitat environment in coastal area is being conducted at several locations around the Efate Island as a baseline to evaluate of environmental transition. (It is not conducted in the Port Vila Harbour.)
Population survey of limited species is being conducted as a monitoring for influence by collecting useful marine species (e.g. food, accessory).
Monitoring of the area for rehabilitation of forest is being conducted.
(2) Management of Resources in the Coastal area
According to the agricultural census conducted from 2006 to 2007, following facts in Vanuatu are realized:
77% of households in rural area depend on self-support.
78% of all households in the area relate to the fisheries.
73% of above mentioned aim self-support.
Thus, fisheries products are one of important protein supply sources for the people in the rural area who depend on self-sufficiency life.
For this reason, appropriate management of fisheries resources is one of priorities for government of Vanuatu and the medium-term plan, Priority and Action Agenda 2006-2015 (hereinafter referred to as PAA), states regarding fisheries sector that ‘Appropriate management and utilization of fisheries resources in coastal area, which almost household in the rural area relate to and depend on not only as financial source but also as self-sufficient nutritional source, is necessary’. Items related to the management of fisheries resources are listed below.
To improve the management of fisheries resources:
Establish an strategy for fisheries sector
Amend legislations related to fisheries
Enhance the organizational capability of the department of fisheries
Enhance the capability of regional government for management of fisheries resources in the coastal area
To improve the sustainable resource management for coastal and reef area
Prompt local residents to participate to manage the fisheries resources in the coastal and reef area
Improve distribution and marketing system of reef fishes
Enhance the participation of parties concerned of fisheries sector
Prompt local residents to participate in installation of FAD (Fish Aggregating Device)
As actual management for fisheries resources in coastal area by central government, control for catchment size and fishing season is being conducted. This is stipulated by the Fisheries Act and penalty, not exceeding 100,000 vatu, will be charged for violation of the ACT. Control of fishing

11
season for coconut club in Sanma State and Torba State is one of examples. This was performed 3 months every year (August to October) for 5 years from 2005. After conducting resource survey in July 2010, 5 years extension of seasonal limitation of fishing was decided and being continued until now.
To achieve assignments listed in the PAA, improvement of fisheries management (structure) is urgent matter. Enhancement of organizational capability in the Department of Agriculture and Rural Development and dissemination sector of the Department of Fisheries of the Ministry of Agriculture, Forestry, Fisheries and Livestock is listed in the short-term strategic framework (2009-2012) as a prioritized strategy (action assignment) for production sector, which will be a drive force for economic growth and employment promotion.
Department of Fisheries of the Ministry of Agriculture, Forestry, Fisheries and Livestock will carry out this political measure. The objective of establishment of the Department of Fisheries is ‘To manage appropriate political measure and conduct sustainable development relation to fisheries resource to secure the maximum benefit for the people in Vanuatu1’.
As organizational structure of the Department of Fisheries, headquarters is in Port Vila and local office, which manages the northern area, is in Luganville of Sanma State. Branch offices are in every state and office staffs are distributed in each office. At the time of November 2011, 52 staffs (34 regular employments, 3 non-regular employments, 2 external assignments to other organizations and 13 vacant posts) are working in the Department of Fisheries. Technical staffs who have high-expertise such as coral reef monitoring are also working, meaning that the department has enough organizational and human resources structure to handle environmental management plan and monitoring plan proposed by this project. Turnover ratio of the staff is very law at moment.
As for financial aspects of the Department of Fisheries, budget for activities was about 42,000,000 Vatu in 2008 and about 78,000,000 Vatu in 2009, which increased to almost double. 77,000,000 Vatu is secured as regular budget in the fiscal year of 2010. Extra 20,000,000 Vatu is also assigned in the fiscal year for promotion of fisheries in rural and solitary islands area. Same amount of budget is expected in the fiscal year of 2011.
On the other hand other than the fisheries control under the national regal framework mentioned above, resource management in the coastal area under the particular rule of each local community exists in Vanuatu and 24 examples are introduced in the previous study2. Although the department does not catch up all activities, it seems that resource managements by local communities in entire area of Vanuatu are being conducted.
In the most cases, the sea area where the community has traditionally used is set as Marine Protected Area (MPA) or fishing-banned area (tabu area). Some examples show the community owns a regulation for fishing gear or sets up the no-fishing period. This kind of resource management by community level is started by two cases: 1) triggered by the approach of NGO or donor, and 2) triggered by the concerns of the local community for the tendency of decrease of resources. In the case of MPA in Uri Island, the approach form a donor was a trigger of the activity and the resource management is still being continued by the community without financial help. Many MPAs prohibit utilization of specific resource or all resource through the year except temporal preferential measures permitted by a chief when the necessity of earning money on special event is realized. As mentioned, management of MPA on community base based on the traditional community structure is getting
1 FISHERIES DEPARTMENT (2008) ANNUAL REPORT
2 S NAKAYA (2004)Participation of local community on the conservation of natural environmental: In case of
marine protected area in the tropical coastal area, Institute for International Cooperation, JICA.

12
common and increasing in Vanuatu.
<Cooperation for capability enhancement and human resource development of the Department of Fisheries by JICA>
‘Rich Foreshore Project’ was carried out from 2007 to 2009 by JICA, aiming capability enhancement of the Department of Fisheries, which shall be a drive force of coastal resource management, and appropriate management of coastal resources by local community. And the ‘Second Phase’ for training of leadership capability of the staffs in the Department of Fisheries is planned, will be started in early part of year 2012 and continued for three (3) years. It expected that sustainable capability of the Department of Fisheries to manage their business by the project. Long-term settlement of capability is expected as turnover ratio of the staff is very low and young generation of the staff will join the project as counterpart.
Request for dispatch of short-term senior volunteer to support fixed-point observation of coral reef was submitted by the government of Vanuatu and recruitment process is underway by JICA before conduction this project. With dispatch of the volunteer, enhancement of capability for environmental monitoring relating to this project is expected.
(3) Water Quality Conservation
Besides the enactment of regulation for water quality standard and water quality conservation by the Water Resources Management Act, National Water Strategy 2008-2018 is also established, mainly by the Department of Geology, Mines and Water Resources considering environmental impact caused by transition of livelihood environment and economic situation, for long term and comprehensive management of national water resources with following objectives:
To clarify the mandate of legal framework and related organizations for transparent management of regulations for water resources.
To enhance organizational capability of the Department of Geology, Mines and Water Resources
To maintain the water related facilities by local communities
To manage and conserve water reservoir
To monitor water quality and maintain the level of water quality standard
To introduce suitable facility for domestic conventional water use and sustainable economic growth
To establish information sharing mechanism between government and stakeholders
Although implementation plan based on the items above is now conducting, even water quality standard is not developed yet.
(4) Waste Management
While no regulation specialized for waste management exits in Vanuatu, the Environmental Protection and Conservation Act handle the part.
According to the Department of Environmental Conservation, following regulations are under preparation specialized for waste management such as waste disposal, management strategy and

13
responsibility including recycle and management of final disposal site.
Waste Operation and Services Act
Ozone Layer Protection Act
Environmental Management and Conservation (Waste and Litter Control) Regulations
National Strategy for Waste Management is also under preparation by the government, which has already been drafted.
As for the situation of activity regarding waste management, collection of disposal waste in the capital city, Port Vila, is undertaken two (2) times a week by the municipality. All garbage is brought to Bouffa disposal site without sorted collection as recycle is not carried out. Bouffa disposal site is managed by Port Vila municipality as a final disposal site and it was improved as semi-aerobic sanitary landfill site by JICA technical cooperation project ‘Bouffa disposal site improvement project, September 2006 – September 2008’. While management of the site is maintained well, capacity of the site is decreasing and improvement of management manual and enhancement of monitoring are expected. Only one (1) private sector manages collection of iron scrap, due to high price of commodity leading higher cost of transportation of collected recycle materials to outside of the countries.
Based on the situation, JICA has been supporting the South Pacific Regional Environment Programme (SPREP), aiming improvement of waste management targeting fourteen (14) Pacific Ocean countries including Vanuatu. Approaches to Vanuatu are as follows:
Capacity building of local staff and workers
Improvement of provision and management of collection and disposal services
Promoting waste recycling
Waste management plan and policy
3.2 Movement on Sustainable Utilization of Port Vila Harbour
3.2.1 Tourism Policy and Present Situation
As major industry, government of Vanuatu is positively promoting tourism development and established Vanuatu Tourism Development Master Plan 2004-2010’. Important factors for sustainable tourism development are as follows:
Securement of accessibility by improvement of transportation network and system
Creation of appropriate tourism facility and service
Appropriate marketing
Sustainable management of tourism resources
Maximization of contribution to social and economic growth
Number of visitors counts from 20,000 to 30,000 a month (Fig. 3.2.1-1), about half of all visitors is from Australia (visitors ratio by country on August 2011: Australia 53%, New Zealand 19%, New Caledonia 10%, Europe 3%, Japan 1%).

14
Source: Vanuatu National Statistic Office
Figure 3.2.1-1 Transition of Visitors to Vanuatu
As fascination of tourism in Vanuatu, abundant nature and traditional culture are listed. According to the Vanuatu Tourism Development Master Plan 2004-2010, lower accessibility and inconvenient transportation results in less visors to islands other than Efate Island despite of rich fascination, and almost visors stay at Port Vila where international airport and seaport exit leading to higher reliability of accessibility and transportation. With better accessibility, large-scale accommodations, commercial facilities and services such as marine sports for tourists are well developed in Port Vila, providing comfortable stay.
3.2.2 Present Situation on Utilization of Port Vila Harbour
Information relating to utilization and ongoing port development plan is summarized in this section for a material to study strategy for conservation and sustainable utilization of the nature in Port Vila Harbour.
(1) Situation of Recreation and Tourism Utilization
Major locations for recreation and tourism utilization in Port Vila Harbour are summarized in
Figure 3.2.2-1. As inside of the harbor is calm, it is utilized by every kind of marine sports. Underwater coral observation activities such as snorkeling and glass boat are operated in the northern area of Iririki Island near to the bay mouth, not in the bay head. Two (2) diving spots for sunken objectives, not for coral, are located in the bay head. According to the local tourism operator, diving tour to the Pontoon Bay (Russian wreck) is operated two (2) times a week, while other diving tour to the Paray Bay is not operated nowadays due to degradation underwater visibility. Those areas are utilized for tourists from foreign countries, while northern coast is used as bathing area for local residents.
With these situations, it is considered that negative impact to tourism industry by the implementation of this project is rarely considered. However, as influence to navigation of leisure boats might be considered, arranging exclusive zone on construction and operation phase is proposed in the Environmental Management Plan.

15
Figure 3.2.2-1 Locations for Recreation and Tourism Utilization in Port Vila Harbour
(2) Development Plan
Construction of a domestic wharf cooperated by ADB and the government of New Zealand is planned at the east of the Star wharf. This plan is to enhance sea transportation between solitary islands in Vanuatu and the wharf will be a jetty with 200m long from shoreline. According to ADB, the permit for IEE has been obtained from the Department of Environmental Protection and Conservation of Vanuatu, with comment that further detailed EIA shall be necessary. Detailed project plan will be established later.
1.5ha of reclamation plan of Vatumaru Bay in northern part is being discussed. EIA procedure is underway and stakeholder meeting as a part of the procedure was held in October 2011. Although detailed plan for utilization of the reclaimed area is not specified in the EIA report and was not clarified in the stakeholder meeting, the objective of the reclamation is to develop a resort, according to newspaper report. Development for resort has been already common in the surrounding area; the other side of the bay has already developed for resort hotels. The proposed reclamation area includes natural beach where local people use for their pleasure such as swimming. The appropriateness of the
This map was produced based on the interview to local tourism operators and observation survey.
Base Map: Supplementary Environmental Impact Assessment of Star Terminal Development (2010)
Diving spot (sea plane)
Diving spot (Russian wreck)
Yacht anchorage
Snorkeling
Glass boat
Parasailing
Jet ski
Bathing by local residents

16
development plan is now being discussed.
Figure 3.2.2-2 Location of Development Plan in Port Vila Harbour
3.3 Present Situation of Coral Reef and Marine Organisms
3.3.1 Topography
Vanuatu, geographically, has been known as the New Hebrides Islands named by Captain James Cook in 1774 and consists of more than 70 volcanic and raised coral reef islands. Efate island locating capitol Port Vila is based on coral limestone and possess raised topography3. Port Vila Harbor is also encircled by raised topography and urban area is formed on the slope or on the plateau.
Port Vila Harbor is natural excellent harbor having deep sea and narrow mouth (17 degree 45’ S, 168 degree 18’ E) to open only westward followed by the Mele bay and zoned by Paray, Pontoon, Vatumaru and main bays topographically. Those bays have more than 40 m depth except for Vatumaru bay. Both Main and Star wharfs locate in the deep head of Pontoon bay. Paray bay that is the calmest area in this area holds more than 50 large yachts for anchoring.
3 The hydrographic Department (1935) Sailing Directions for the western South Pacific Islands, Vol. 1.
This plan is based on the newspaper report and information by ADB.
Base map: Supplementary Environmental Impact Assessment of Star Terminal Development (2010) Domestic wharf
plan
Reclamation plan

17
Coral reef, defined as fringing one, stretched from southernmost of Iririki island to southward makes Paray be independent. Star wharf might be built by reclamation of shallow area on this coral reef.
Vatumaru bay is also closed by shallow coral reef in the bay mouth and supports mangrove in the bay head.
Ifila island and Malapoa point forming the mouth of the bay are also fringed by coral reef.
3.3.2 Coral Community
According to the EIA report by the AusAid issued in April 2010, five coral communities in Port Vila are described as the Most Important Coral Areas (Fig. 3.3.2-1). Those are;
a. Malapoa Reef: Coral reef develops in the mouth of Vatumaru bay, b. Malapoa Point: Fringing reef distributes around the point, c. Fringing reef in Iririki island: Massive corals occur, d. Fringing reef in Ifila island: Massive corals occur, and
e. South reef in Iririki island: High coverage coral patches are dotted, selected by the survey results as followed;
a. benthic organisms appear healthy showing active feeding behavior and spawning and productive, b. evidence of very high settlement and colonization rates on new substrate, c. Coral communities show good balance, in terms of number of colonies of old, slow-growing
boulder corals (Porites spp.) and fast-growing staghorn corals (Acropora spp.) and d. Balanced mix of hard corals (Scleractinia) and soft corals (Alcyonaria) indicates a well developed
and highly resilient system, although it is highly stressed by land-based pollution and over-exploitation.
Because transect survey site was not allocated in the area of northwest of Iririki island, above-mentioned selection might be based on qualitative survey results.

18
Fig. 3.3.2-1 Location of the Most Important Coral Areas
(referred from Supplementary Environmental Impact Assessment, Vol.1)
Transect survey as quantitative baseline for long-term monitoring was carried out in 16 sites chosen from 4 zoned areas in Port Vila as followed (Fig. 3.3.2-2);

19
a. St.1: near Star Wharf (immediate impact site) b. St.2: Ifila island coast (possible impact site) c. St.3: Iririki island south area (possible impact site) d. St.4: mouth of Vatumaru bay (control site)
According to the survey results, coral coverage and bio-diversity was lowest in St.1 and highest in St.3 and St.4. However, predicted reclamation area supported coral patches showing high coverage and diversity index even was included in St.1 (index number was not mentioned). Those patches contained mainly massive Porites suggested to be relocated to the reef of Iririki island.
Although there are few coral and other benthic animals in predicted reclamation area, measure to silt dispersion due to sand bottom dredging was recommended. Fish volume and bio-diversity were both low, especially in large fish due to over fishing. It was mentioned that establishment of marine reserve in Vatumaru bay contribute to sustain fish resources in Port Vila.
There are some sea urchin (most popular species in Port Vila), sea cucumber and sea star in shore of existing reclamation area. Those animals that was possible to relocate easily were recommended to move to near area. Those animals that was impossible to relocate were recommended to conserve habitat by deploying silt protection curtain during construction.

20
Fig. 3.3.2-2 Location of Transect survey sites
(referred from Supplementary Environmental Impact Assessment, Vol.1)

21
3.3.3 Sea grass bed
There is few sea grass bed in Port Vila Harbor due to steep sea bottom and a small meadow in west shallow area in Vatumaru Bay. It is supposed that dugong (estimated 3 individuals) feed in this meadow. Mangrove also occurs in the head of Vatumaru bay and southwest of Ifila island scarcely. Mangrove area in Vanuatu is estimated 2,500 to 3,500 ha and 2,000 ha out of total area is distributed in Malakura island locating north of Efate island4.
3.3.4 Dugong and sea turtle
(1) Dugong
EIA reported that number of estimated individual in Vanuatu Bay was three. According to Mr. Sompert, Senior Marine Biologist of Department of Fisheries, mitigation of 1 to 2 individuals was observed twice in 2011 in Paray Bay. Although scientific study on Dugong has not been carried out so far, dugong has known to distribute all over Vanuatu even small number of individuals according to the report in 19835.
Mr. Sompert informed that main habitat near Port Vila was Mele Bay where sea grass bed expands and some individuals migrate to Vanuatu Bay to feed sea grass. Therefore, it is supposed that effect to migration and habitat of Dugong by this project is negligible.
(2) Sea Turtle
Main sea turtle species in Vanuatu are loggerhead and hawksbill turtles. Most important nesting site for those species locates around Malakura Island and Torres island of northernmost. Epi island of central Vanuatu is also main nesting site. According to Mr. Sompert, turtles used to nest in the head of Pontoon Bay but no longer now due to coastal development. A part of main population based on Mele Bay sometimes migrates to Port Vila Harbor. But Maximum individuals are less than 5. Turtles come to Vatumaru Bay to feed sea grass but do not nest because coastal development has been proceeded. During our field survey, we observed the animals 3 times in only north area of Port Vila Harbor. Therefore, it is supposed that effect to migration and habitat of Sea turtles by this project is negligible.
3.3.5 Fisheries Resources
The fisheries sector makes a relatively small contribution to Vanuatu’s formal economy, contributing an estimated 1% to overall GDP. However, the domestic fishery plays an important role in the rural economy by providing nutrition and income-earning opportunities to some 60% of rural househoplds. The total production from the reef and coastal fishery is estimated to be around 2,400t per year6.
Prior to 1990, trochus and green snail were important export commodity traded as raw material for
4 David G (1985) les mangroves de Vanuatu: 2eme partie, presentation generale. Naika 19:13-16.
5 Crossland J (1983) Vanuatu’s new fishery conservation measures, Naika 12:10-11.
6 Secretariat of the Pacific Community (2008) Vanuatu aquaculture Development Plan 2008-2013.

22
buttons and jewelry but decreased its resources due to overfishing from 1920s7. In order to recover the resources, “the Grace of the Sea in coastal villages” project has been launched by JICA support in 2006 and implemented the mariculture facility for trochus, green snail and giant clam in Department of Fisheries as a part of the project. Presently, 3500 green snails, 4000 trochus and 100,000 giant clams have been produced and released by fishing village annually. Those animals will be harvested when matured. Green snail will be sold as raw materials for souvenir and giant clam will be consumed for food in household.
Fisheries resources such as fish and invertebrates have been decreased seriously due to over exploitation by local fishermen and other causes. Over exploitation has been carried for not only commercial fish but ornamental fish such as coral fish. Ornamental fish exports increased from 20,000 to 70,000 fishes between 2001 to 2003. This tendency is predicted to continue but Department of Fisheries does not grasp details because catching does not operated by traditional fishermen5.
According to Mr. Rudlic, Technical staff of Department of Fisheries, there is few fishing operation in Port Vila Harbor except for small scale gill net for goat fish and rabbit fish in Vatumaru and Paray Bays. Fishermen of Port Vila Harbor where some 20 fishing boats exist operate line fishing offshore and gill net in shallow area out of the Bay.
Fishing activity in Pontoon Bay is allowed only to Ifila tribe who lives near the Star wharf. Fish caught in Port Vila Harbor is not permitted to sell in the market because fish contains ciguatera poison and limited to self-consuming in household. Their catch amount is a very little by small scaled spear fishing. Therefore, fishery and fishery economy in Port Vila City is recognized as small magnitude and suffered scarcely by operation of this project. Fishermen and collectors of marine organisms are also assessed to be suffered negligible by this project.
In general, although imported fish is sold in supermarkets, people intend to buy potatoes as staple food and perishable foods such as vegetable in the central market because those fish are expensive. People also intend to buy fast and canned foods as side food due to cheap price.
There is a pier where Korean tuna fishing boat unloads in next to Department of Fisheries. Unloaded fresh tunas are sent to Japan by air cargo. Freeze tunas are unloaded in Fiji.
3.4 Present Situation of Marine Environment
3.4.1 Ocean Current
Vanuatu is subject to the South Equatorial Current that streams to westward. Around the Efate Island, the current flows to westward at 1/4 to 3/4 kt May to October when the island is subject to the trade wind from south west.
Tidal current in Port Vila Harbor streams from the bay mouth to Paray and Pontoon bays in flood and the counter direction in ebb. Current velocity is influenced by wind so that it is little in no wind8. According to the survey of SPREP/SOPAC9, current velocity in Port Vila Harbor is less than 0.8 m/s
7 Lovell E et al (2004 Status of coral reefs in the south west Pacific: Fiji, New Caledonia, Samoa, Solomon Islands, Tuvalu and Vanuatu: 337-361. Status of Coral Reefs of the World.
8 United Kingdom Hydrographic Office (2006) Admiralty Sailing Directions, Pacific Islands Pilot vol.2.

23
and one around Star Wharf is slight in general.
The EIA report in 200610 described that surface currents were observed during an entire tidal cycle to be between 0.03 to 0.10 m/s and currents at 15m depth were between 0.07 and 0.30 m/s. The surface current was set to the southwest most of the time during the field observation while the bottom current appeared to have a counter currents deeper out into the bay.
The EIA report by AusAid mentioned that current velocity in the immediate Star Wharf area was as slight as 0.25 m/s according to the result of current survey using a locally-sourced hand-held current probe at near spring tide in 12 February 2010.
In this study, divers also felt slight current scarcely to westward in ebb between Iririki Island and Star Wharf.
3.4.2 Water Quality
Although sea water of Port Vila Harbor from view of coast looks clear even bay head area such as Star Wharf, the bay accept many kinds of environmental load such as terrestrial runoff, overflow from septic tank, urban drainage, drainage from many boats moored in the bay.
Water quality survey has been carried out by Department of Geology, Mine and Water resources every three to six months between 1999 and 2004 at 14 sites in the Bay. However the survey stopped after May 2004 when a fire destroyed the Department’s offices and equipment, commenced again in 2009 but has now come to a halt due to lack of operating budget.
EIA surveyed water temperature, salinity, pH, dissolved oxygen, transparency, faecal coliforms, and nitrogen and phosphorus at some sites. Results showed that faecal coliforms indicated increase tendency in Paray Bay and near Star Wharf year by year. This is estimated overflow from septic tank. Transparency showed low value in Vatumaru Bay due to sedimentation and in the sewage discharge of Iririki Island. Since sampling has not been carried out near Star Wharf, it was considered to be negligible from data of south reef of Iririki Island and the Main Wharf.
EIA report mentioned also about water quality of Paray Bay neighboring Star Wharf that dissolved oxygen of the deeper waters became anoxic due to limited mixing with surface waters and accumulating sedimentation, nutrient and contamination materials.
Water quality survey by the Department stopped in 2009 was carried out in collaboration with Australia in Port Vila Harbor in 2010. Results in Paray Bay showed as follows;
NO3-N was 0.04 mg/l in November 2010 and 0.5 mg/l in December 2010. NO2-N was 0.005 to 0.01 mg/l in November 2010. PO4-P was 0.01 to 0.03 mg/l in November 2010 and 0.14 to 0.22 mg/l in December 2010.
Sekisei Lagoon, Ryukyu has similar environment such as semi-closed condition and neighboring urban area with Port Vila Harbor. In Sekisei Lagoon, data usually indicated on NO3-N: <0.01 mg/l, NO2-N:
9 Carter R (1983) Baseline Studies of Port Vila and Eraker Lagoons, Vanuatu. Cruise Report No.82 of PE/VA6/T-1 to 4.
10 Esrom DE (2006) Environmental Impact Assessment for the Star/Ardimanni Wharf Rehabilitation and Improvement Project.

24
<0.005 mg/l, PO4-P: <0.003 mg/l without regard to season. Comparing Paray Bay with Sekisei Lagoon, data of Paray Bay showed as follows;
NO3-N: 50 times and PO4-P: 50 to 70 times in December 2010 and NO3-N: 4 times NO2-N: almost same and PO4-P: 3 to 10 times in November 2010. NO3-N and PO4-P in Paray Bay is extremely high.
Value of pH in the sea usually indicates a little alkaline but data in Paray Bay did neutral. It is suggested that the water quality is influenced by terrestrial water.
Because environment impact from land was extremely high in December 2010, it was considered that one of meteorological factor influenced to water quality. As EIA report pointed out, it was estimated that rainfall in rainy season made environmental load flow into the Bay.
Result of vertical measurement using multiple water quality instrument in the central point of the Bay in 27 October 2011 during this study showed that turbidity tend to increase with depth (Fig. 3.4.2-1). In that opportunity, divers dived to 30m in deep to observe benthos but they saw few corals. There was mud sedimentation around 30m in deep and no benthic animal. It is estimated to be difficult that coral lives there because sunlight reaches scarcely due to turbidity. Because water quality survey in Paray Bay and near Star Wharf by Department of Geology, Mine and Water resources in April 2002 already confirmed anoxic situation in the bay bottom shaped like mortar. Bottom environment probably became worse.
Paray Bay was considered to have embayment environment because turbidity at surface layer off urban area was 0.85 and horizontal transparency was 10m near Star Wharf.
Countermeasure to environmental impact from land is planning through ADB assistance. In order to control water quality of Port Vila Harbor, trace of countermeasure through enforcement of monitoring should be carried out. For realizing that, observation buoy measuring water temperature, salinity, turbidity, Chlorophyll and dissolved oxygen at surface and bottom layers in the central point of Paray Bay should be installed.

25
Temperature (℃)
0
5
10
15
20
25
30
35
40
45
25.5 26 26.5 27
depth
(m)
Salinity
0
5
10
15
20
25
30
35
40
45
34.75 34.8 34.85 34.9 34.95
Turbidity
0
5
10
15
20
25
30
35
40
45
0 0.5 1 1.5 2
Fig. 3.4.2-1 Vertical change of water quality in the central point of Paray Bay
3.4.3 Plan for Water Quality Improvement
The government of Vanuatu is planning the implementation of the ‘Port Vila Urban Development Project (2011 – 2016)’ by the support from ADB, aiming the improvement of sewage system and road water drainage system in Port Vila urban area. Outputs from the project are as follows:
Improvement of road network and water drainage
Promotion of domestic and commercial purification tank (septic tank) and improvement of treatment of sludge (Septic tanks will be utilized by more than 50% of households and 75% of commercial facilities/private sectors till 2016)
Improvement of sanitary facilities such as public toilet
Enhancement of ability of governmental organizations, communities and user’s organizations
Provision of project management service
As water drainage system in Port Vila City at moment does not have enough function, flooding on the road causing traffic jam occur on the storm event as well as causing surface runoff leading to a factor for sedimentation in the harbour. Thus it is expected that improvement of the drainage system by the project lead to less impact to the water quality in the harbour.
A construction plan of treatment plant in the northern part of the city is also included as improvement of sludge treatment from purification tank (septic tank). By this plan, it is expected that maintenance of

26
septic tanks installed in domestic households and commercial facilities would be optimized and more effective water treatment would be operated. As the treatment plant is also planned that it will be function as a sewage water treatment plant when sewage pipe network is installed in the future, this project will be a first step of establishment of sewage system.
Fig. 3.4.3-1 Situation of Flooding on the Road
3.4.4 Impacts by Sea Level Rise
The sea level rise in Port Vila was estimated to be + 3.6 mm/year and it was estimated to be + 2.7 mm/year after deducting land subsidence due to crustal movement according to the EIA report. From this value, the sea level rise is simply calculated to be 135 mm in 50 years which is within the design conditions of the wharf.
3.5 Conclusion of Present Environmental Conservation in Vanuatu
As mentioned above sections, legal framework for environmental conservation and development has already established in Vanuatu and measures to environmental conservation are being carried out, though it is not enough. Regarding administrative structure for environmental conservation, the reality that the government of Vanuatu considers environmental conservation as important factor has been understood as recent budget of the Department of Fisheries, which manages the conservation of coastal resources, is increasing although inadequate human resources and budget is still worried. Government of Japan is supporting in the field of conservation of coastal resources and waste management through ODA business and it is getting achieving the effect on capability enhancement of the government of Vanuatu and human resource development.
It is considered that sustainable utilization of natural resources is high-priority issue for Vanuatu to maintain the sustainable tourism development, which is the drive force of economic growth, and not to deplete the coastal fisheries resources, which is the food source for the residents mainly in rural area. Finally, it is expected that the legal framework and policy measures mentioned above and support by the government of Japan will contribute to the actual sustainable utilization of natural resources.
Source: Initial Environmental Examination, Port Vila Urban Development Project, ADB (2011)
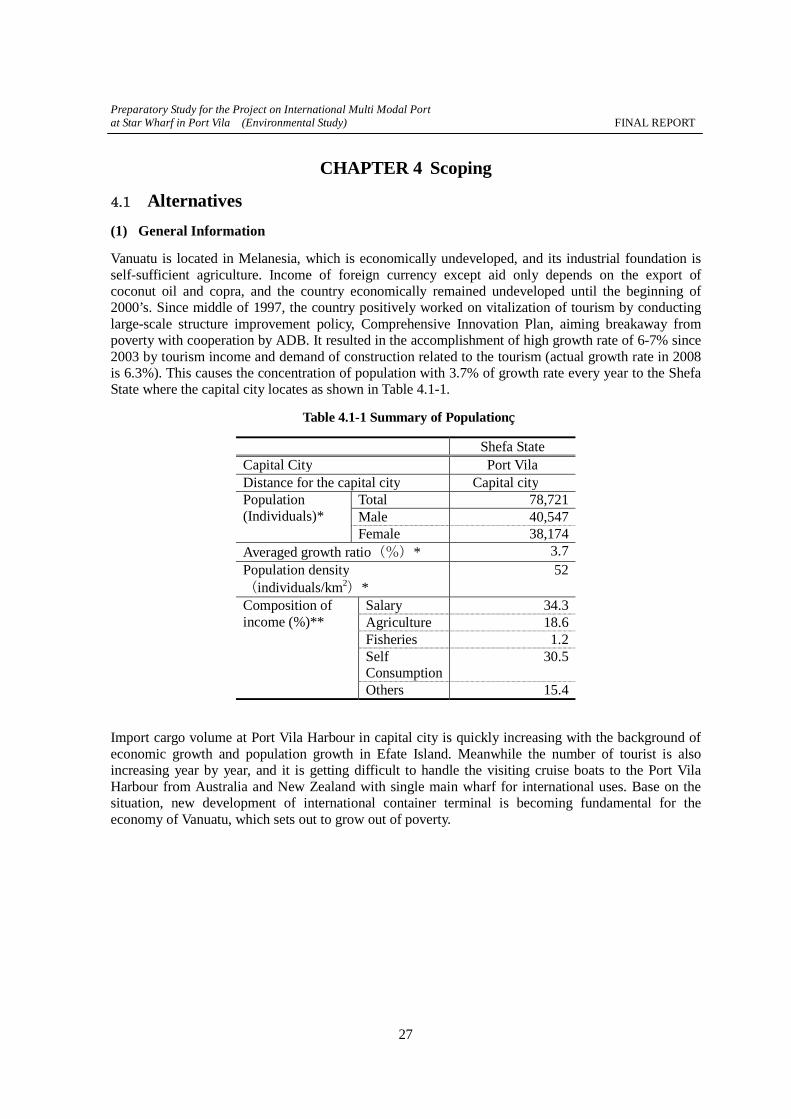
Preparatory Study for the Project on International Multi Modal Port at Star Wharf in Port Vila (Environmental Study) FINAL REPORT
27
CHAPTER 4 Scoping
4.1 Alternatives
(1) General Information
Vanuatu is located in Melanesia, which is economically undeveloped, and its industrial foundation is self-sufficient agriculture. Income of foreign currency except aid only depends on the export of coconut oil and copra, and the country economically remained undeveloped until the beginning of 2000’s. Since middle of 1997, the country positively worked on vitalization of tourism by conducting large-scale structure improvement policy, Comprehensive Innovation Plan, aiming breakaway from poverty with cooperation by ADB. It resulted in the accomplishment of high growth rate of 6-7% since 2003 by tourism income and demand of construction related to the tourism (actual growth rate in 2008 is 6.3%). This causes the concentration of population with 3.7% of growth rate every year to the Shefa State where the capital city locates as shown in Table 4.1-1.
Table 4.1-1 Summary of Population
Shefa StateCapital City Port VilaDistance for the capital city Capital cityPopulation (Individuals)*
Total 78,721 Male 40,547 Female 38,174
Averaged growth ratio(%)* 3.7 Population density(individuals/km2)*
52
Composition of income (%)**
Salary 34.3 Agriculture 18.6 Fisheries 1.2 Self Consumption
30.5
Others 15.4
Import cargo volume at Port Vila Harbour in capital city is quickly increasing with the background of economic growth and population growth in Efate Island. Meanwhile the number of tourist is also increasing year by year, and it is getting difficult to handle the visiting cruise boats to the Port Vila Harbour from Australia and New Zealand with single main wharf for international uses. Base on the situation, new development of international container terminal is becoming fundamental for the economy of Vanuatu, which sets out to grow out of poverty.

Preparatory Study for the Project on International Multi Modal Port at Star Wharf in Port Vila (Environmental Study) FINAL REPORT
28
0
20000
40000
60000
80000
100000
120000
140000
160000
180000
200000
1995 1997 1999 2001 2003 2005 2007
訪問者(クルーズ)
訪問者(航空機)
Figure 4.1-1 Transition of Vistors in Vanuatu
0
20000
40000
60000
80000
100000
120000
2007 '16
'25
'32
'40
'48
コンテナ
Figure 4.1-2 Transition of Container Cargo Volume in Port Vila Harbour (Actual result and prediction)
With fundamental condition that international container terminal is developed, comparison study between the present candidate location, Star Wharf in Port Vila Harbour, existing main wharf, other locations in Port Vila Harbour and other three (3) locations in the Efate Island as alternative candidates was conducted in the EIA study, from the viewpoints such as less risk of negative environmental and social impact, and fulfillment to the demand for new international container terminal.
cruise aviation

Preparatory Study for the Project on International Multi Modal Port at Star Wharf in Port Vila (Environmental Study) FINAL REPORT
29
Source: EIA report
Figure 4.1-3 Locations of Candidates
Out of candidates, the main wharf in Port Vila Harbour is eliminated from the following reasons although it is the only wharf which is able to handle container cargo:
Expansion is very difficult because steep cliff is close behind.
Excursion cruise boats and large-scale tankers are prioritized.
Capability of handling cargo volume is limited from above two reasons.
(2) Study on Two Alternative Candidates
Result of the study is as follows.
(i) Candidates in Port Vila Harbour
Middle point between Star Wharf and Main Wharf
The location is narrow corridor with no flat land. Excavation of the behind cliff is necessary for the development, causing severe environmental impact with geo-technical hazards.
East side of Star Wharf
Although new construction of domestic wharf is already planned at the eastside of the shallow area between Star Wharf and Iririki Island, greater dredging will be necessary to cope with international cargo ships because this area is shallower than the Star Wharf. Besides, as the behind are is also steep cliff as like Star Wharf, the area of reclamation will be greater to secure the necessary area for container yard, that cause greater environmental impact. The jetty will be located at the side of Paray bay which increases the influence to tourism such as danger of accident with leisure boats in the harbour.
Foreshore at east side of Port Vila Harbour (between BP oil terminal and Vatumaru bay)
Port Vila
Undine Bay
Forari Bay
Port Havannah

Preparatory Study for the Project on International Multi Modal Port at Star Wharf in Port Vila (Environmental Study) FINAL REPORT
30
As has already been developed as CBD (Central Business District) and tourism and commercial facilities such as hotels and restaurants exist along the coast, new development of the area will cause the necessity of resettlement of those facilities and result in the severe impacts to tourism and economy. And as the foreshore is not shallow like Star Wharf, greater scale of reclamation is necessary and impact to environment including securement of reclamation materials will be greater.
Vatumaru bay
This area has been traditionally conserved as marine protected area, because shallow and moderate tide flow environment make growth of dense seaweeds and mangroves, leading to important nursery ground for fish. This area is utilized as fishing by local residents and development plan for tourism facilities has already established. Thus new port development in this bay causes negative impact to natural environment such as mangroves, fisheries and existing development plan.
Seashore and hillock at Malapoa Point, northern part of Port Vila Harbour
As fringing reef of coral distribute at the coast of Malapoa Point, bay mouth of Port Vila Harbour, large-scale of reclamation and dredging in this area for port development causes great environmental impact. This area is considered as residential district and development of exclusive residential area has already been started. Although this kind of development as residential district generates development demand in Port Vila Harbour and necessary element, development of terminal specialized for container cargo in this area cause major impact such as noise and dust to the residents.
(ii) Three Candidates in Efate Island
Port facility located in Port Havannah, north coast
With enough depth, topography for a shelter from the open sea and previous port facility which US naval fleet has been using during the World War II, although this area is suitable as a candidate of port development the existing port facility becomes tourism spot as historical place and accommodation facility like bungalow also exists. Scuba diving spots concentrated around the Havannah Harbour, where area surrounded by three islands in Port Havannah, Moso Island, Lelepa Island and Hat Island. If this area is newly developed, utilization of these tourism spots will be greatly limited. As the surrounded area is undeveloped, securement/deforestation of area for container yard and accommodation of labors will be necessary upon new development of international container cargo terminal and that cause larger environmental impact.
Mining project area in Forari Bay
This area is located the opposite side of Port Vila harbor. Small scale of vessels for transportation of manganese mineral used to use the area until it was closed in 1970’s. Enough water depth is secured in front of former facility and the area is suitable for a port. However the existing area is too small to improve container yard that raise the necessity of deforestation of undeveloped area. As households distribute along the former port facility, resettlement of them will be necessary upon development using the former facility.
Undine Bay
This area is considered as a port area by the government of Vanuatu. However no port
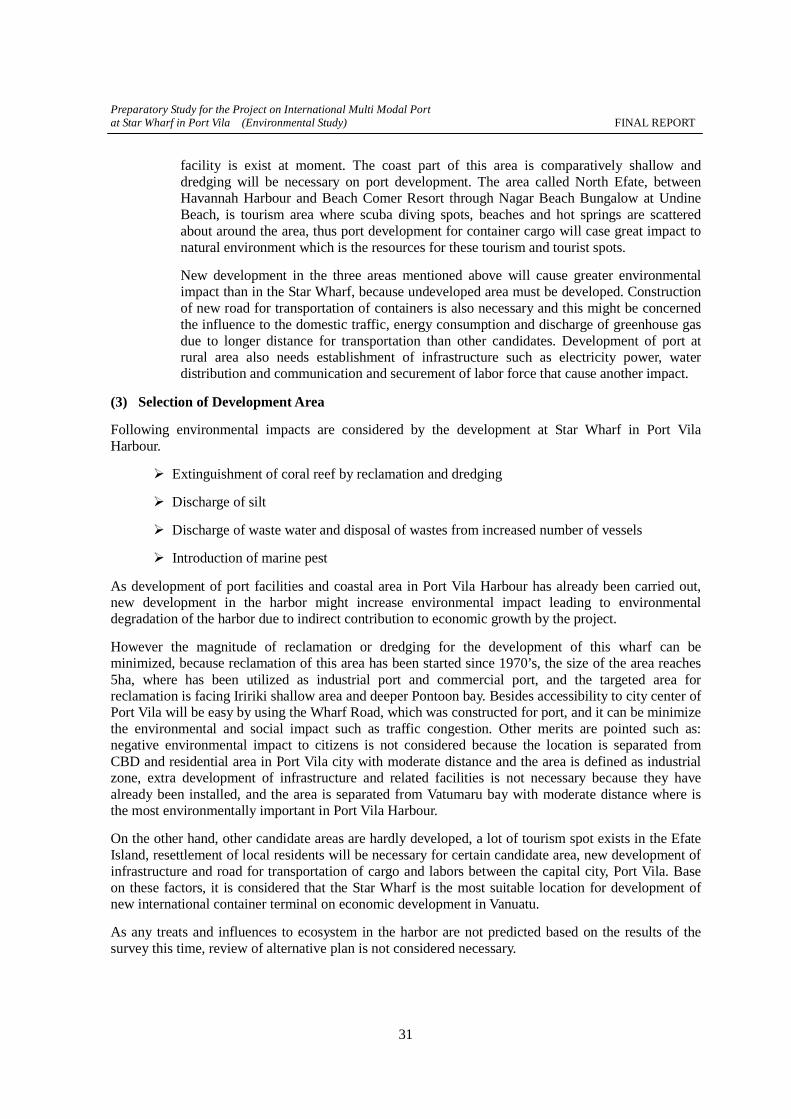
Preparatory Study for the Project on International Multi Modal Port at Star Wharf in Port Vila (Environmental Study) FINAL REPORT
31
facility is exist at moment. The coast part of this area is comparatively shallow and dredging will be necessary on port development. The area called North Efate, between Havannah Harbour and Beach Comer Resort through Nagar Beach Bungalow at Undine Beach, is tourism area where scuba diving spots, beaches and hot springs are scattered about around the area, thus port development for container cargo will case great impact to natural environment which is the resources for these tourism and tourist spots.
New development in the three areas mentioned above will cause greater environmental impact than in the Star Wharf, because undeveloped area must be developed. Construction of new road for transportation of containers is also necessary and this might be concerned the influence to the domestic traffic, energy consumption and discharge of greenhouse gas due to longer distance for transportation than other candidates. Development of port at rural area also needs establishment of infrastructure such as electricity power, water distribution and communication and securement of labor force that cause another impact.
(3) Selection of Development Area
Following environmental impacts are considered by the development at Star Wharf in Port Vila Harbour.
Extinguishment of coral reef by reclamation and dredging
Discharge of silt
Discharge of waste water and disposal of wastes from increased number of vessels
Introduction of marine pest
As development of port facilities and coastal area in Port Vila Harbour has already been carried out, new development in the harbor might increase environmental impact leading to environmental degradation of the harbor due to indirect contribution to economic growth by the project.
However the magnitude of reclamation or dredging for the development of this wharf can be minimized, because reclamation of this area has been started since 1970’s, the size of the area reaches 5ha, where has been utilized as industrial port and commercial port, and the targeted area for reclamation is facing Iririki shallow area and deeper Pontoon bay. Besides accessibility to city center of Port Vila will be easy by using the Wharf Road, which was constructed for port, and it can be minimize the environmental and social impact such as traffic congestion. Other merits are pointed such as: negative environmental impact to citizens is not considered because the location is separated from CBD and residential area in Port Vila city with moderate distance and the area is defined as industrial zone, extra development of infrastructure and related facilities is not necessary because they have already been installed, and the area is separated from Vatumaru bay with moderate distance where is the most environmentally important in Port Vila Harbour.
On the other hand, other candidate areas are hardly developed, a lot of tourism spot exists in the Efate Island, resettlement of local residents will be necessary for certain candidate area, new development of infrastructure and road for transportation of cargo and labors between the capital city, Port Vila. Base on these factors, it is considered that the Star Wharf is the most suitable location for development of new international container terminal on economic development in Vanuatu.
As any treats and influences to ecosystem in the harbor are not predicted based on the results of the survey this time, review of alternative plan is not considered necessary.
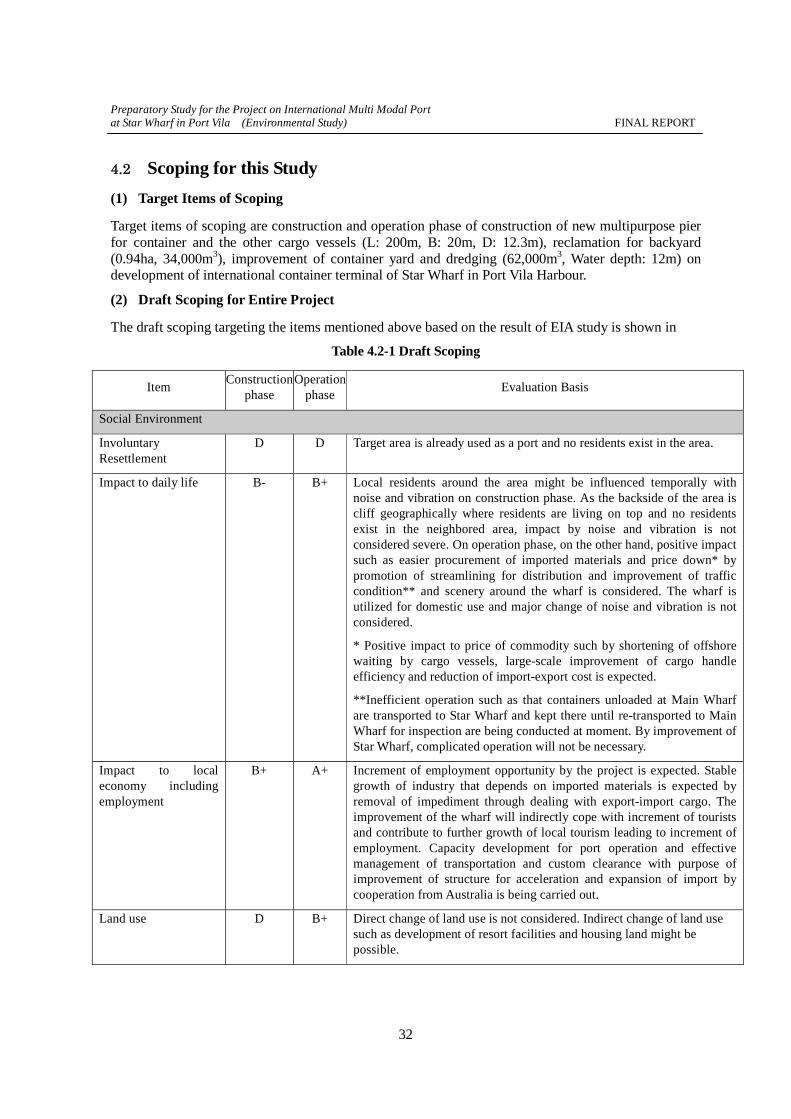
Preparatory Study for the Project on International Multi Modal Port at Star Wharf in Port Vila (Environmental Study) FINAL REPORT
32
4.2 Scoping for this Study
(1) Target Items of Scoping
Target items of scoping are construction and operation phase of construction of new multipurpose pier for container and the other cargo vessels (L: 200m, B: 20m, D: 12.3m), reclamation for backyard (0.94ha, 34,000m3), improvement of container yard and dredging (62,000m3, Water depth: 12m) on development of international container terminal of Star Wharf in Port Vila Harbour.
(2) Draft Scoping for Entire Project
The draft scoping targeting the items mentioned above based on the result of EIA study is shown in
Table 4.2-1 Draft Scoping
Item Construction
phase Operation
phaseEvaluation Basis
Social Environment
Involuntary Resettlement
D D Target area is already used as a port and no residents exist in the area.
Impact to daily life B- B+ Local residents around the area might be influenced temporally with noise and vibration on construction phase. As the backside of the area is cliff geographically where residents are living on top and no residents exist in the neighbored area, impact by noise and vibration is not considered severe. On operation phase, on the other hand, positive impact such as easier procurement of imported materials and price down* by promotion of streamlining for distribution and improvement of traffic condition** and scenery around the wharf is considered. The wharf is utilized for domestic use and major change of noise and vibration is not considered.
* Positive impact to price of commodity such by shortening of offshore waiting by cargo vessels, large-scale improvement of cargo handle efficiency and reduction of import-export cost is expected.
**Inefficient operation such as that containers unloaded at Main Wharf are transported to Star Wharf and kept there until re-transported to Main Wharf for inspection are being conducted at moment. By improvement of Star Wharf, complicated operation will not be necessary.
Impact to local economy including employment
B+ A+ Increment of employment opportunity by the project is expected. Stable growth of industry that depends on imported materials is expected by removal of impediment through dealing with export-import cargo. The improvement of the wharf will indirectly cope with increment of tourists and contribute to further growth of local tourism leading to increment of employment. Capacity development for port operation and effective management of transportation and custom clearance with purpose of improvement of structure for acceleration and expansion of import by cooperation from Australia is being carried out.
Land use D B+ Direct change of land use is not considered. Indirect change of land use such as development of resort facilities and housing land might be possible.

Preparatory Study for the Project on International Multi Modal Port at Star Wharf in Port Vila (Environmental Study) FINAL REPORT
33
Item Construction
phase Operation
phaseEvaluation Basis
Fragmentation of community
D D Fragmentation of community by the project is not considered.
Existing social infrastructure and service
D B+ As the function of handling domestic cargo by Star Wharf is to be transferred to the new domestic wharf which is planned to be constructed by the cooperation of ADB and New Zealand and, no interference in the current service is considered. No change in other social infrastructures and services in not considered.
In operation phase, function as new social infrastructure will improve the current distribution service (especially drastic reduction of time for distribution of import cargo), improve the complicated operation of port loading and unloading and result in the improvement of traffic. Increase of track to the city by increment of cargo distribution may be worried, but the road to the city is specialized for the transportation from the wharf, and no major impact is considered.
Poverty, indigenous people and minority
B+ B+ Employment for construction in the construction phase and stabilization of port management by local community in the operation phase will increase the income of socially vulnerable people. Promotion of industry trough the project will indirectly contribute to the reduction of poverty. No community of indigenous people an minority exits in the surrounded area.
Inequitable sharing of profit and loss
D D Profit such as downslide of price of commodity by efficiency improvement of distribution can be shared with the people.
Conflict and dispute in the community
D D Conflict and dispute in the community is not considered.
Water use and its right D A+ Major change in water use and water right itself is not considered. Water use will be improved by measures for ground water pollution by pesticide chemicals such as new installment of waste water treatment system.
Public health B- D Impact to public health in local community by construction of accommodation for labors in the construction phase may be predicted, but it will be temporary and limited in the phase.
Disease B- B- Danger of disease by increase of labors may be considered, but it will be limited and prevented by education. Impact by introduction of alien species by construction vessels in the construction phase and cargo vessels and containers in the operation phase is considered.
Cultural asset D D Although several ethnic cultural assets exist, major impact is not considered.
Natural Environment
Topography, Geology B- B- Topography will be changed by dredging (34,000m3) in front of the new wharf and reclamation (60,000m3) for expansion of container yard. Impact, however, is not considered so great because: existing wharf (5ha), was also constructed with reclamation, new area for reclamation is shallow with elevated coral reef (water depth: 2m) and steep at the area

Preparatory Study for the Project on International Multi Modal Port at Star Wharf in Port Vila (Environmental Study) FINAL REPORT
34
Item Construction
phase Operation
phaseEvaluation Basis
for new pier.
Soil erosion B- B+ Effusion of silt is considered in construction phase. Possibility of effusion of silt will be reduced by pavement of container yard and revetment work in operation phase.
Ground water D D No impact to groundwater is considered.
Hydrology D C- There is minor possibility of change of flow regime at the area by reclamation.
Coastal environment B- B- Impact to coastal environment such as dismantlement of coral reef, diffusion of turbidity and sedimentation of silt by construction of new pier, dredging and reclamation is considered.
Fauna, flora and ecosystem
B- B- About 60 planted-species trees will be transplanted, which does not cause major impact. Although fruits of the trees are being used as food or medical purpose by local community, the number of transplanted tree is limited and impact to livelihood of the people is minor.
Fauna originally living in the project area does not exist. Although wild birds and bats are using the project area as habitat, impact is considered minor because the habitat is not limited to the project area.
Two (2) species of bat, Pteropus anetianus (Vanuatu flying fox) and Notopteris macdonaldi (Fijian blossom bat) which are categorized as VU (Vulnerable) by IUCN red list, are living in Efate Island. As their feeding area is forest or orchard, impact by this project is not considered.
As for bird species, Charmosyna palmarum (Palm Lorikeet), Erythrura regia (Royal Parrotfinch), Megapodius layardi (Vanuatu Megapode) categorized as VU and Esacus giganteus (Beach Thick-knee) categorized as NT (Near threatened), are living in Efate Island. M. layardi and E. giganteus are endemic species. As their habitat is mainly mountain area or mangrove and estuary, impact by this project is not considered.
In the coastal area, marine benthic organisms living in coral habitat will be affected by 1.6ha of reclamation. 78 species of coral are categorized as VU in Vanuatu and detailed study is necessary to reduce the impact to the habitat.
Climate D D Major change of local climate by the project is not considered.
Landscape/Scenery D B+ Present scenery of disordered storage of containers will be improved. Change of landscape with several dozen meter expansion of land to offshore by reclamation and expansion of pier is not considered major.
Global warming B- B- Temporal increase of greenhouse gas by traffic of construction vehicles, usage of heavy machinery and traffic congestion is considered in construction phase. Possibility of increase of greenhouse gas by increment of transportation track to the city due to increase of cargo handling is considered in operation phase.
3.6mm/year of sea level rise and 2.7mm/year with consideration of ground subsidence by crustal change at Port Vila is predicted. It comes

Preparatory Study for the Project on International Multi Modal Port at Star Wharf in Port Vila (Environmental Study) FINAL REPORT
35
Item Construction
phase Operation
phaseEvaluation Basis
135mm/50 years of sea level rise with simple calculation and the value is within the range of design assumption for the wharf.
Pollution measure
Air pollution B- B- Temporal impact to air pollution by heavy machinery and traffic congestion is considered in construction phase. Possibility of increase of air pollution by increment of transportation track to the city due to increase of cargo handling is considered in operation phase.
Water pollution B- B- Possibility of temporal water pollution in surrounded sea area by diffusion of silt due to dredging and reclamation works is considered in construction phase. Water pollution by discharged water and wasted oil from increased vessels is considered in operation phase.
Activation of human activities in land area due to improvement of port facility may cause impact to enclosed water area, Port Vila Harbour, by organic pollution and eutrophication.
Soil pollution D D Soil pollution by the project is not considered. Pollution risk will be improved by conducting of this project, such as pavement of container yard, establishment of water treatment facility and installment of warehouse for waste oil, fuel and chemicals.
Wastes B- B- Generation of construction waste and domestic wastes is considered in construction phase. Increase of wastes disposed from increased vessels in operation phase is considered.
Noise and vibration B- D Noise and vibration by construction machinery and generation of dust is considered in construction phase. Mitigation measures such as limitation construction duration time and installment of prevention tank for dust is recommended in EIA. Change of noise and vibration comparing to the condition before operation is not considered in operation phase.
Ground subsidence D D Possibility of ground subsidence is not considered because the project area will be constructed on hard ground consisted of elevated coral.
Odor D D Generation of odor caused by the project is not considered.
Sediment C- D Possibility of diffusion of silt due to dredging is envisaged.
Accident B- D Accident in construction work and operation of construction vehicles is considered.
Remarks Evaluation criteria A-: Serious negative impact is considered. A+: Great positive impact is considered. B-: Certain negative impact is considered. B+: Certain positive impact is considered. C-: Additional verification is necessary as impact level is not clear. D: Impact is not considered or extremely minor. Additional verification study is not necessary.
(3) Narrow down of scope for this additional study
‘Disease’ in the scoping matrix shown above is the only considerable negative impact in ‘Social

Preparatory Study for the Project on International Multi Modal Port at Star Wharf in Port Vila (Environmental Study) FINAL REPORT
36
Environment’, except temporal impact in construction phase. And ‘Air pollution’, ‘Water pollution’, ‘Wastes’, and ‘Sediment’ are considered as negative impact in ‘Pollution Measures’. Out of them, ‘Water pollution’, ‘Wastes’ and ‘Disease’ are considered caused by vessels entered. For these, measures such as establishment of domestic legislation to comply with global convention for vessels entered, strengthen of control, capability enhancement of related organization and other prevention measures are recommended in the EIA introduced below. Measures for waste water and solid waste from Star Wharf are also planned as mentioned below. With these measures, it is considered that impacts to ‘Water pollution’ and ‘Wastes’ in Port Vila Harbour by implementation of this project are greatly mitigated. These mitigation measures are described as the environmental management and monitoring plan in Chapter 8 of this report. As for discharge of silt in construction phase listed in ‘Sediment’, additional validation needs to be considered due to its uncertainty of impacts although prevention of damage by turbid water with installment of silt curtain/protector is mentioned in the project plan.
Table 4.2-2 Considered impacts by vessels entered and summary of mitigation measures recommended in the EIA
Item Considerable impact Mitigation measuresImpact by construction vessels in construction phase
Oil pollution
Fuel, Diesel oil for generator and machinery, lubricant and hydraulic oil
Possibility of oil spill by marine accident is considered, though the amount of spill from construction vessel will be limited.
It is possible to deal with oil spill from marine accident by facilities already installed in the 2 oil terminals.
Invasion of alien species
Periphyton at vessel’s bottom Study at departure port, confirmation at departure, conducting of cleaning, Inspection of vessel bottom, cleaning at outside of Mele Bay, etc.
Impact by vessels in operation phase
Oil pollution
Fuel, Diesel oil for generator and machinery, lubricant and hydraulic oil
Oil pollution mostly occurs at shipment of oil cargo from tanker or at fuel servicing. As these activities are not carried out at Star Wharf, possibility of oil spill is very few. Oil spill by marine accident Strengthen of marine safety measures
(e.g. installation of navigation aids) (Tug boat has been provided by grant aid)
Discharge of oil contaminated bilge, waste oil
Discharge to the sea Compliance with MARPOL convention(prohibition of discharge), establishment of domestic legislations (Bio Security Bill has been passed the congress), ratification of IMO related treaties
Invasion of alien species (marine pest)
Discharge of ballast water Prohibition of discharge in the port, compliance of IMO related treaty (exchange of ballast water at open seas), establishment of domestic legislations (Bio Security Bill has been passed the congress), long-term and wide-area

Preparatory Study for the Project on International Multi Modal Port at Star Wharf in Port Vila (Environmental Study) FINAL REPORT
37
study based on the intensive study for periphyton at Star Wharf
Utilization of anti-adherence paint (But TBT causes chemical contamination.)
Compliance of IMO related treaty, prohibition of TBT paint and usage of low-toxicity paint, ratification AFS treaty, establishment of domestic legislations
Wastes from vessels Treatment inside of vessels Execution of obligation of MARPOL convention (installation of treatment facility), repair of existing hi-performance incineration facility and maintenance, collection and recycle of waste oil at oil terminal (JICA is conducting technical cooperation for waste management)
Waste water from vessels Although the amount of wastewater by crews of cargo vessels is limited, possibility of invasion of pathogenic bacteria such as cholera and typhoid can be considered.
Accedence and ratification of MARPOL convention (Annex 4: prohibition of discharge of untreated wastewater), establishment of domestic legislations and strengthen of control
Hazardous materials (oil, chemical substances)
Installation of fuel tank with safety device at the wharf
<Impact on Water Quality during Operation Phase>
Water discharge from the wharf consists of storm water, container washing water and waste water from the office (toilet etc.); those water qualities will be improved by upgrading facilities through the project (Table 4.2-3). Therefore, it can be said that the project itself will cause positive impact to the water quality in the Harbor.
On the other hand, port development may increase pollutant load from Port Vila as it will activate economic activities indirectly. To address this issue, long-term monitoring is indispensable for identifying the pollution source and developing necessary measures to reduce the pollutant load.
Table 4.2-3 Current and Future Plan (Operation Phase) of Discharge from the Wharf
Type of Discharge Current Condition Future Plan
1. Storm Water Water flows into the sea washing unpaved soil surface of the terminal.
Silt contamination into the storm water will be reduced as the terminal will be paved. Storm water will flow into five traps through collecting channels and discharged to the sea after removing debris in the traps.
2. Container Washing Water
Washing water soaks into underground or flow into the sea through unpaved soil surface.
Use of pesticide for quarantine’s
Washing water will flow into a trap through collecting channels and discharged to the sea after removing silt and oil.

Preparatory Study for the Project on International Multi Modal Port at Star Wharf in Port Vila (Environmental Study) FINAL REPORT
38
requirement is now suspended due to lack of the management systems.
In the case of quarantine’srequirement, minimal pesticide will be sprayed on the surface after washing to avoid contamination of the discharge water.
3. Office Toilet Treated by septic tank as usual in Port Vila.
Septic tank will be designed to reduce pollutant load considering sewage improvement project by ADB.
Source: Supplementary Environmental Impact Assessment (2010)
Figure 4.2-1 Facility Layout of the New Wharf (Location of Discharge)
<Waste Management during Operation Phase>
At the time of EIA study, solid waste had been burned at the terminal and it was reported that it had caused smoke problem. Currently, the waste management has been improved: the waste is brought to proper disposal site weekly.
Contaminated waste from international ships needs to be incinerated not to be dumped at disposal site in case of the quarantine’s requirement. The incinerator in Port Vila had not worked at the time of EIA study, but after that it was recovered and is working well.
During operation phase, solid waste will be managed properly as same as the current condition. In addition, wastes generated by demolishing the existing structures will be reused for this project.

Preparatory Study for the Project on International Multi Modal Port at Star Wharf in Port Vila (Environmental Study) FINAL REPORT
39
Although large-sized solid waste such as vehicles had been dumped for reclamation in the past, such case is not expected for this project as dredged sea-bottom sediments will be used for the reclamation.
On the other hand, it has been reported that rubbish likely dumped by local residents is scattered at the sea bottom around the wharf. It may be caused by insufficiency of local garbage collecting system as well as lack of awareness of the people. To address this issue, the government of Vanuatu is tackling as described in Chapter 3.1.2 and JICA is supporting as well.
Considering the impacts on the natural environment, construction of the new pier, dredging and reclamation planned for this project will cause topographic and geological change at the project site and it may affect coastal environment, marine ecosystems such as corals and water current. However, the existing EIA report has not clarified how large the impact will be and how the corals need to be conserved practically although mitigation plans were proposed. Therefore, this study aims to collect more detailed data on “impacts on coral reef ecosystems” and “impacts on water current of Port Vila Harbor” studied in the EIA of the F/S conducted by AusAID as it was judged that those subjects need to be studied more to deepen the impact assessment and the mitigation measures.
4.3 Scoping for Impacts on Coral Reef Ecosystem and Water Current
This study is to acquire detailed data on “coral reef ecosystems” and “water current of Port Vila Harbor” to supplement the EIA report developed in the feasibility study conducted by AusAID (hereinafter referred to as “the existing EIA”).
On each of the coral reef ecosystems and the water current of the bay, potential impacts and required mitigation measures are listed in Table 4.3-1 together with the outline of the relevant study in the existing EIA report. In light of the study outline in the existing EIA, the implementation policy of this study is identified as shown in
Table 4.3-2.
Table 4.3-1 Possible Impacts, Assumed Mitigation Measures and Relevant Study Outline in the Existing EIA
Items
Pha
se Potential
Impacts Assumed
Mitigation Measures
Required Study in EIA Outline of Relevant Study in the Existing EIA
Coral Reef Ecosystems
Con
stru
ctio
n Disappearance of the corals living in the reclamation area (See supplemental explanation No.1)
To transplant the corals living in the reclamation area.
To assess the corals living in the reclamation area based on the detailed distribution map including species information and the coverage.
Detailed distribution map of the corals that includes species information and the coverage has not been developed. (A)
To discuss the method of transplanting.
Transplantation plan has not been developed specifically. (B)

Preparatory Study for the Project on International Multi Modal Port at Star Wharf in Port Vila (Environmental Study) FINAL REPORT
40
Turbidity dispersion and silt deposition caused by the construction works
To transplant the corals living in the area where turbidity dispersion and deposition are projected. To prevent occurrence and dispersion of turbidity. (To introduce silt curtain, closed grab and others.)
To assess the impacts based on the projection of turbidity dispersion and deposition as well as coral distribution.
Potential area of the turbidity dispersion and deposition has not been projected quantitatively. (C ) Detailed distribution map of the corals has not been developed.
To monitor the turbidity.
To develop monitoring plan (e.g. monitoring sites, frequency and survey items) based on the impact projection.
Specific monitoring plan that includes site, frequency and items has not been developed. (D)
Ope
ratio
n
Change of habitat condition caused by current change
To transplant corals living in the affected area.
To assess the impacts based on the projection of current change caused by the topographic change as well as coral distribution.
Current change has not been projected. (E) Detailed distribution map of the corals has not been developed.
To monitor the corals.
To develop a monitoring plan based on the impact projection. (e.g. monitoring site, frequency and survey items)
Specific monitoring plan that includes site, frequency and items has not been developed. (F)
Waste water, oil spill and solid waste from vessels
To treat and manage waste water and solid waste To prevent oil spill To preserve relevant convention.
To analyze the existing measures and legislation (contracted international conventions and consistency with the national legislation) to recommend required further measures.
Some recommendations have been made: to establish national legislation that is consistent with international convention as well as to develop the capacity of relevant organizations based on the analysis described in the left column.
Impact on water quality (organic water pollution and eutrophication in the bay indirectly caused by the port development through acceleration of various
To monitor long-term water quality and ecosystems change
To regulate discharge and set up water quality criteria
To comprehend current water quality and develop long-term monitoring plan.
Specific monitoring plan has not been developed although long-term monitoring plan has been proposed. (G)
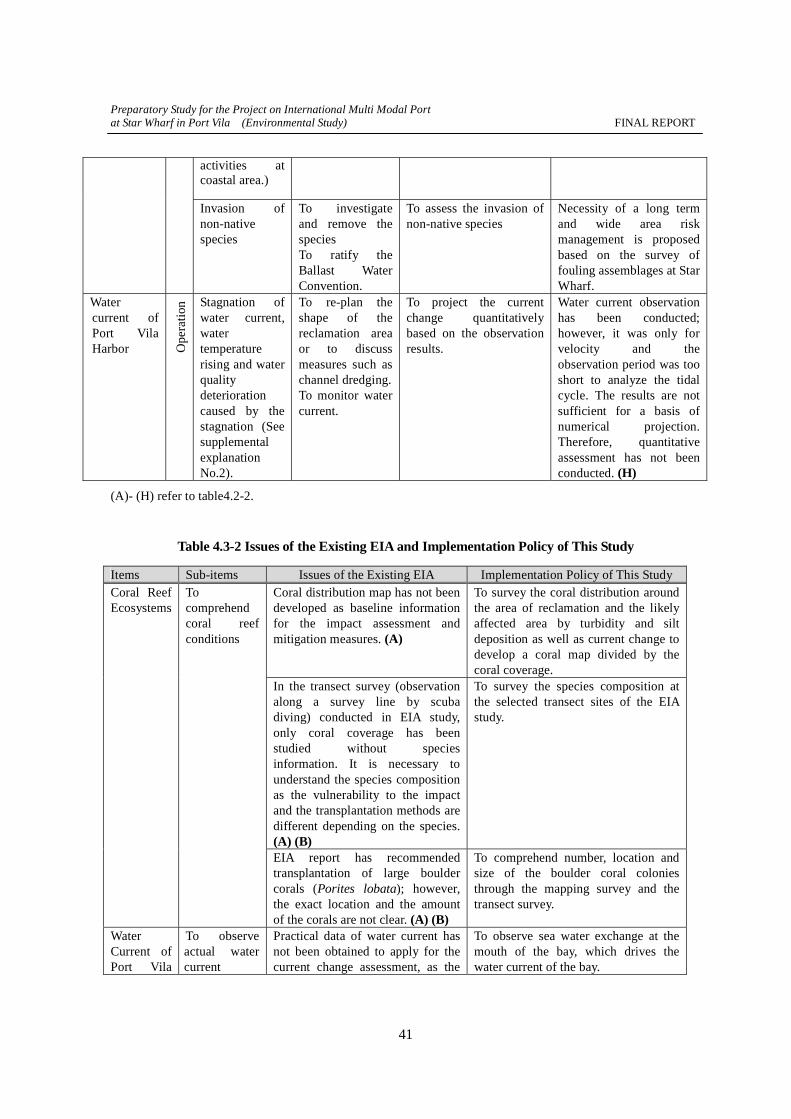
Preparatory Study for the Project on International Multi Modal Port at Star Wharf in Port Vila (Environmental Study) FINAL REPORT
41
activities at coastal area.)
Invasion of non-native species
To investigate and remove the species To ratify the Ballast Water Convention.
To assess the invasion of non-native species
Necessity of a long term and wide area risk management is proposed based on the survey of fouling assemblages at Star Wharf.
Water current of Port Vila Harbor O
pera
tion
Stagnation of water current, water temperature rising and water quality deterioration caused by the stagnation (See supplemental explanation No.2).
To re-plan the shape of the reclamation area or to discuss measures such as channel dredging.To monitor water current.
To project the current change quantitatively based on the observation results.
Water current observation has been conducted; however, it was only for velocity and the observation period was too short to analyze the tidal cycle. The results are not sufficient for a basis of numerical projection. Therefore, quantitative assessment has not been conducted. (H)
(A)- (H) refer to table4.2-2.
Table 4.3-2 Issues of the Existing EIA and Implementation Policy of This Study
Items Sub-items Issues of the Existing EIA Implementation Policy of This StudyCoral Reef Ecosystems
To comprehend coral reef conditions
Coral distribution map has not been developed as baseline information for the impact assessment and mitigation measures. (A)
To survey the coral distribution around the area of reclamation and the likely affected area by turbidity and silt deposition as well as current change to develop a coral map divided by the coral coverage.
In the transect survey (observation along a survey line by scuba diving) conducted in EIA study, only coral coverage has been studied without species information. It is necessary to understand the species composition as the vulnerability to the impact and the transplantation methods are different depending on the species. (A) (B)
To survey the species composition at the selected transect sites of the EIA study.
EIA report has recommended transplantation of large boulder corals (Porites lobata); however, the exact location and the amount of the corals are not clear. (A) (B)
To comprehend number, location and size of the boulder coral colonies through the mapping survey and the transect survey.
Water Current of Port Vila
To observe actual water current
Practical data of water current has not been obtained to apply for the current change assessment, as the
To observe sea water exchange at the mouth of the bay, which drives the water current of the bay.

Preparatory Study for the Project on International Multi Modal Port at Star Wharf in Port Vila (Environmental Study) FINAL REPORT
42
Harbor observation period was shorter than the tidal cycle and only velocity was observed without information of current direction, as well as the limitation of the observation sites located only around Star Wharf. (H)
To observe velocity and current direction for enough period covering entire tidal cycle at the mouth of the bay and around Star Wharf.
To project current change, turbidity and silt deposition quantitatively.
Current change and movement of silt with the current (advection, dispersion and deposition) has not been estimated quantitatively. (C ) (E)
To assess the impact to the water current by hydrodynamic simulation model considering the topographic change; the model will be developed verifying the reproducibility of the observed actual current direction and velocity. Numerical simulation model is able to express horizontal distribution of the current based on the spot observation following a physical law. To examine quantitatively if the turbidity dispersion during construction reaches to the coral area using the advection-dispersion-deposition model of the silt loaded by the construction works developed upon the hydrodynamic model.
Environmental Management and Monitoring Plan
Transplantation plan of the corals as mitigation measure and monitoring plan have not been specified. (B) (D) (F) (G)
To develop specific plan for coral transplanting and monitoring (corals, water quality and water current) based on the surveys above and the results of the impact assessment.
(A)- (H) refer to table4.2-1.

43
CHAPTER 5 Field Survey
5.1. Survey of Coral Reef Aim, methods and survey sites of each coral reef survey are shown table 5.1-1.
Table 5.1-1 Outline of Coral Reef Survey
Items Aim Survey Sites Methods
Mapping of Coral Reef
To evaluate Environmental impact to the project, coral distribution was surveyed as baseline information
20 points near Star Wharf
1. Coral reef habitats are classified using satellite images.
2. About 20 survey points are pre-determined based on the each habitat
3. At each point, substratum, coral, sea plant and coral-eating animal are observed.
4. Coral distribution map is generated based on above-mentioned survey results.
Transect survey To establish long-term monitoring as baseline
9 transect lines (3 in Vatumaru Bay, 2 in Ifila Island, 4 near Star Wharf
1. 40m measure line is laid on the sea bottom and stake is piled at both the beginning and the end of the line respectively.
2. 0.5m by 0.5m quadrat is deployed every 5m along the line. At each quadrat, substratum, coral, sea plant and coral-eating animal are observed and photos are taken.
Monitoring of water quality
To collect baseline data for establishing long-term monitoring
2 sites (Vatumaru Bay and near Star Wharf)
Self-contained data loggers for water temperature, salinity and turbidity are deployed to understand the habitat environment for coral.
Survey of coral distribution on transplantation
To grasp coral distribution in predicted reclamation area and proposal transplanting area.
2 sites (near Star Wharf and west off Iririki Island)
1. Size, species, number of colonies and location of corals are surveyed.
2. Species, coverage and environmental condition of coral in proposal site are surveyed.
5.1.1. Coral Reef Mapping (1) Objective Field survey was conducted to evaluate the corals and other marine organisms in the area that will be lost by landfill or affected by turbid sea water from the project. The survey focused on determining the coral distribution in the subject water area (around the Star Wharf, particularly on the east side, which may potentially be affected by the implementation of the project), creating distribution maps demarking coral types and coverage, and calculation of coral diversity for quantitative evaluation of the coral reef.
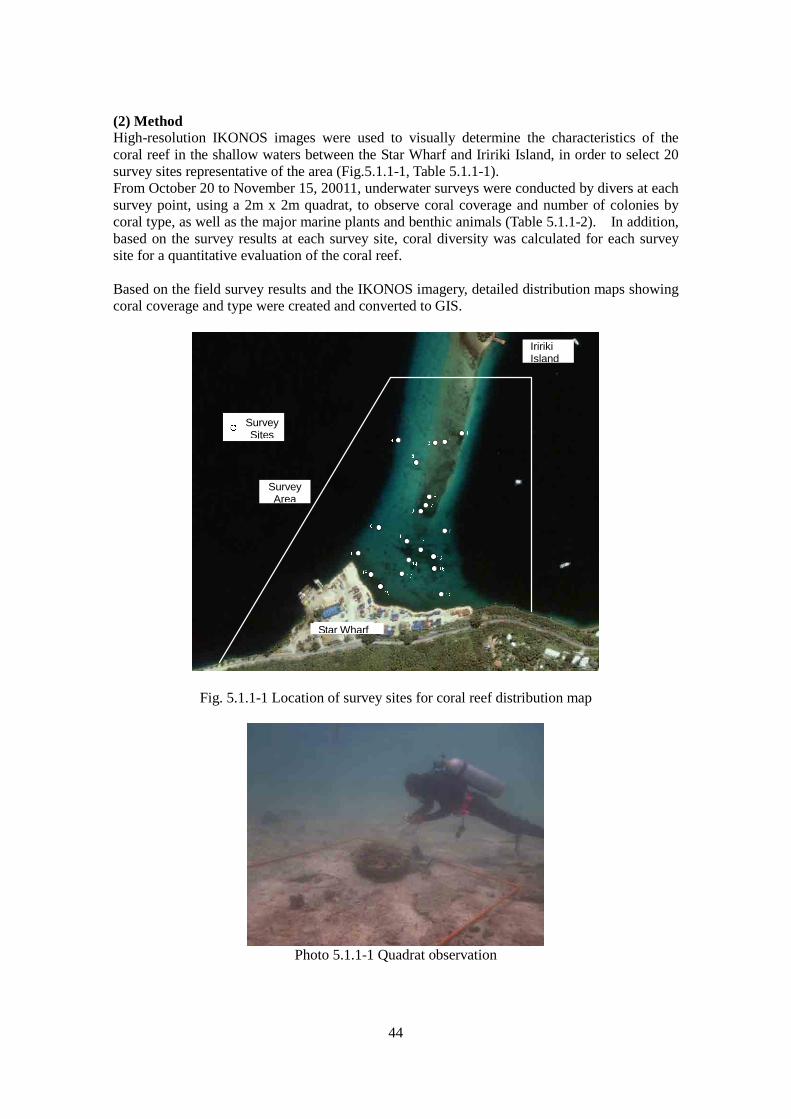
44
(2) Method High-resolution IKONOS images were used to visually determine the characteristics of the coral reef in the shallow waters between the Star Wharf and Iririki Island, in order to select 20 survey sites representative of the area (Fig.5.1.1-1, Table 5.1.1-1). From October 20 to November 15, 20011, underwater surveys were conducted by divers at each survey point, using a 2m x 2m quadrat, to observe coral coverage and number of colonies by coral type, as well as the major marine plants and benthic animals (Table 5.1.1-2). In addition, based on the survey results at each survey site, coral diversity was calculated for each survey site for a quantitative evaluation of the coral reef. Based on the field survey results and the IKONOS imagery, detailed distribution maps showing coral coverage and type were created and converted to GIS.
Fig. 5.1.1-1 Location of survey sites for coral reef distribution map
Photo 5.1.1-1 Quadrat observation
Iririki Island
Survey Area
Survey Sites
Star Wharf

45
Table 5.1.1-1 Coordinate of survey sites for coral reef distribution map
Surveysite
Latitude Longitude
1 S 17°45′04.9″ E 168°18′27.9″2 S 17°45′05.7″ E 168°18′26.3″3 S 17°45′05.6″ E 168°18′25.5″4 S 17°45′05.6″ E 168°18′22.3″5 S 17°45′07.5″ E 168°18′23.9″6 S 17°45′10.4″ E 168°18′25.0″7 S 17°45′11.2″ E 168°18′24.7″8 S 17°45′13.4″ E 168°18′26.4″9 S 17°45′11.7″ E 168°18′24.2″10 S 17°45′13.1″ E 168°18′20.4″11 S 17°45′14.5″ E 168°18′23.1″12 S 17°45′15.0″ E 168°18′24.2″13 S 17°45′15.5″ E 168°18′25.3″14 S 17°45′15.9″ E 168°18′23.2″15 S 17°45′15.3″ E 168°18′18.7″16 S 17°45′16.7″ E 168°18′25.4″17 S 17°45′17.1″ E 168°18′22.6″18 S 17°45′17.2″ E 168°18′19.8″19 S 17°45′18.3″ E 168°18′20.7″20 S 17°45′19.0″ E 168°18′26.1″
Table 5.1.1-2 Observations Conducted within the Quadrat No Survey Item Description 1 Water Depth Record water depth using an underwater depth gauge 2 Underwater
Photography Photograph the view with a plate identifying the survey location
3 Substrate Record the dominant substrate (see Note 1). If red soil sedimentation is observed, record the condition of the deposit (see Note 2).
4 Corals, Marine Plants, and other Animals
For corals, record the total coverage, coverage by species, and number of colonies. Record dead coral coverage. Record major marine plants and other animals observed.
5 Stages of Bleaching Record the stages of bleaching using the scale developed by Hill Jos and C Wilkinson (2004)1 (see Note 3).
6 Inhabitation of Crown of Thorns Starfish and other creatures that cause feeding damage
Record the number of Crown-of-Thorns starfish whenever observed.
Note 1) Substrate classification: Rock, Stones, Gravel, Sand, Mud, Manmade Structure Note 2) Sedimentation grades (Sekisei Lagoon Monitoring Standards, Ministry of the
Environment):
1 Hill Jos and C Wilkinson (2004) Methods for Ecological Monitoring of Coral Reefs

46
When the Sea bottom is struck by hand, 0: No turbidity; I: Very little turbidity; II: Becomes turbid; III: Mud sedimetation is visible; IV: The sea bottom is covered with mud.
Note 3) Bleaching grades: 0 (No Bleaching): < 1% (No bleaching observed, or only very occasional, scattered bleached colonies – 1 or 2 per dive) I (Low or mild bleaching): 1-10% (Bleached colonies seen occasionally and conspicuous; vast majority of colonies not bleached) II (Moderate bleaching): 10-50% (Bleached colony frequent but less than half of all colonies) III (High bleaching): 50-90% (Bleaching very frequent and conspicuous, most corals bleached) IV (Extreme bleaching): > 90% (Bleaching dominates the landscape, unbleached colonies not common. The whole reef looks white)
(3) Results
(a) Topography, Substrate and Sedimentation
At all survey sites, the substrate consisted of sand and rock. Water depth ranged from 0.4 to 5.9 m. There was some variance in the degree of sedimentation: when the sea bottom was struck, some areas showed very little turbidity, while others became turbid (Table 5.1.1-3).
Table 5.1.1-3 Depth, Substratum and Sedimentation in Survey sites
Survey site 1 2 3 4 5 6 7 8 9 10Depth(m) 0.5 0.5 0.4 5.9 1.0 0.5 1.0 3.5 1.2 2.6
Substratum Rock Rock Rock Sand Sand Rock Rock Sand Rock Sand
Sedimentation degree 2 2 1 2 2 1 1 1 1 1
Survey site 11 12 13 14 15 16 17 18 19 20Depth(m) 1.8 2.1 2.3 2.1 2.5 2.3 1.7 1.7 1.7 1.9
Substratum Sand Sand Sand Sand Sand Sand Sand Sand Sand Sand
Sedimentatio degree 2 2 1 1 1 2 2 2 2 2
(b) Coral Distribution
Continuous coral distribution was observed at seven sites within the survey area (Fig. 5.1.1-2). As for coral colony coverage, six sites fell within the range of 10% to < 30%. Only one site was < 5% (Fig. 5.1.1-3.). The dominant species observed was Genus Porites (massive type)at five locations, Psammocora contigua at one location, and Porites cylindrica at one location. Many locations showed distribution of Genus Porites (massive type). The coral diversity index was highest at St. 20 at 1.946. Only one species was observed at St. 9, 11, 15, and 17, respectively, which resulted in a low diversity index of 0 (Fig. 5.1.1-4). Of the 25 species of corals observed, the species whose population was 10 were: Pocillopora damicornis, Porites lutea, Porites australiensis, Psammocora contigua, and

47
Porites cylindrica. Except for Pocillopora damicornis, all of these species were also found to be the dominant species in terms of distribution. Outside the distribution area listed above, the coral colony distribution was not continuous, or where they were continuous, only had coverage of <1%. In the area around the Star Wharf, the proposed project site, there were no sizable coral colonies on the west side of the wharf where dredging is planned. On the east side of the wharf where landfill is planned, there was some distribution of Genus Porites (massive type) and Porites cylindrica.
1
12
14
11
10
9
8
7
6
5
4 3 2
18
15
17
20
16
13
19
0 200100
Meters
0 200100
Meters
N Iririki Island
Star Wharf
Study area
Coverage :<5% :10-30%
Dominant species : sp. (massive) : :
○ :Study site
Fig. 5.1.1-2 Distribution of coral community

48
0
5
10
15
20
25
30
35
40
1 2 3 4 5 6 7 8 9 10 11 12 13 14 15 16 17 18 19 20
Study site
Coverage of coral (%)
Fig. 5.1.1-3 Coral coverage in study sites
0
0.5
1
1.5
2
2.5
1 2 3 4 5 6 7 8 9 10 11 12 13 14 15 16 17 18 19 20
Study site
Diversitiy index
Fig. 5.1.1-4 Diversity Index in study sites
(c) Disturbances
The observation results at each survey site revealed no bleaching or effects of coral-eating animals; no significant disturbances were observed. As for water quality, sea water was clear when observed from land. Considering that the area is located far inside a small, pouch-shaped bay with minimal sea water movement, this indicates that there is no undue water pollution from land.
(d) Major Algae and Benthic Animals
Thirteen species of major algae were observed. The most prevalent were: Dichotomaria sp., Peyssoneliaceae, Ceratodictyon spongiosum, and Bacillariophyceae. The number of major algae species observed at each survey site ranged from 1 to 4. The species with coverage of 5% were: Dichotomaria sp., Hypnea panossa, Ceratodictyon spongiosum, Rhodophyceae, Bacillariophyceae, Padina minor (Fig. 5.1.1-5). Sixteen species of benthic animals were observed. The most prevalent were: Diadema
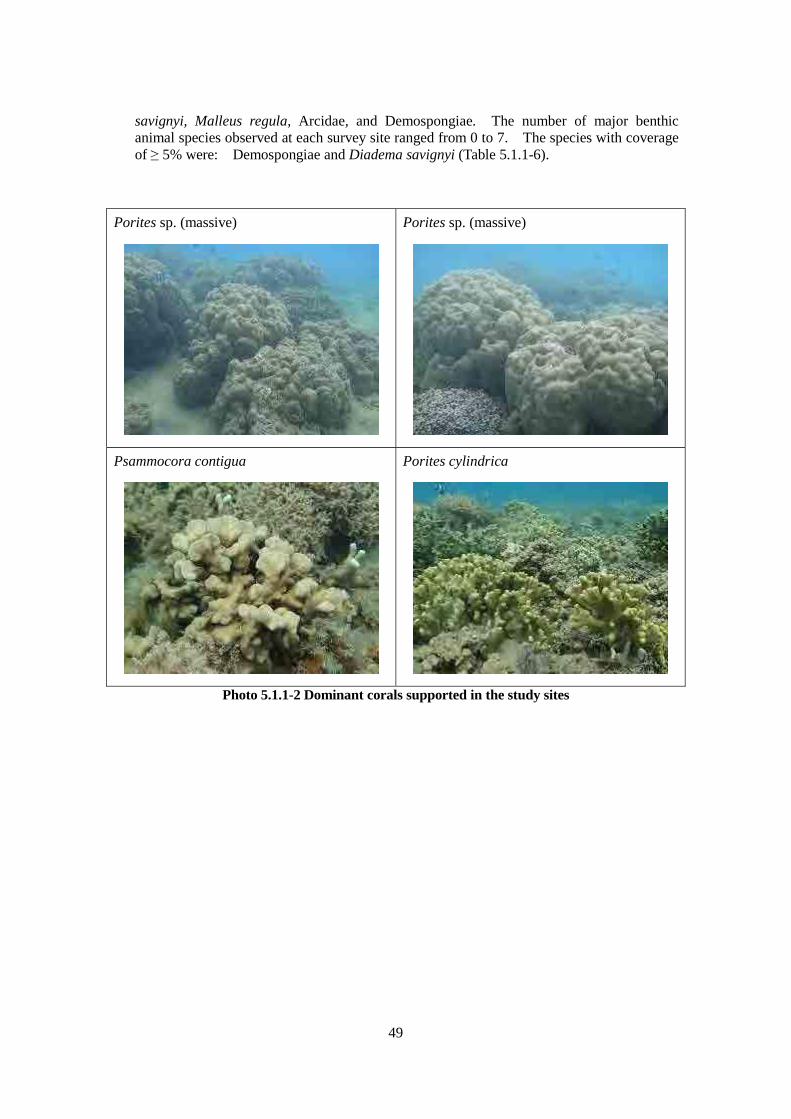
49
savignyi, Malleus regula, Arcidae, and Demospongiae. The number of major benthic animal species observed at each survey site ranged from 0 to 7. The species with coverage of 5% were: Demospongiae and Diadema savignyi (Table 5.1.1-6).
Porites sp. (massive)
Porites sp. (massive)
Psammocora contigua
Porites cylindrica
Photo 5.1.1-2 Dominant corals supported in the study sites

50
Table 5.1.1-4 (1) corals in study site
Study site
Coverage of Coral (lives)
Coverage of Coral (dead)
Bleaching
Disturbance
№ Species coveragenumber of
coloniescoverage
number of
coloniescoverage
number of
coloniescoverage
number of
coloniescoverage
number of
colonies
1 Stylocoeniella guentheri r 1
2 Pocillopora damicornis r 11 r 1
3 Montipora sp.(arborescent)
4 Acropora formosa r 1
5 Acropora microphthalma
6 Acropora aspera r 3
7 Acropora millepora r 1
8 Acropora selago r 3
9 Acropora nasuta r 1 r 1
10 Acropora carduus
11 Acropora florida r 4
12 Acropora sp.(arborescent)
13 Astreopora myriophthalma
14 Astreopora gracilis
15 Porites australiensis 10% 14
16 Porites lutea r 11 r 5 5% 8 r 1 10% 2
17 Porites cylindrica
18 Psammocora contigua r 2 r 2
19 Psammocora profundacella
20 Pavona varians
21 Pavona venosa
22 Herpolitha limax
23 Lobophyllia hemprichii r 3
24 Leptastrea pruinosa
25 Cyphastrea serailia
Number of Species 6 2 4 6 1
Diversity index 1.792 0.693 0.874 1.792 0
notes +:<5%、r:<1%
<Bleaching>
0:<1%(not observed or rare) 3:50-90%(all of colnies are bleached)
1:1-10%(rare, but remarkable) 4:>90%(healthy coloneis are rare. all over the reef is looks whitish.)
2:10-50%(bleachied is average.)
not observed not observed not observed not observed not observed
not observed not observed not observed not observed not observed
0% 0% r 0% 0%
r r 15% + 10%
1 2 3 4 5

51
Table 5.1.1-4 (2) corals in study site
Study site
Coverage of Coral (lives)
Coverage of Coral (dead)
Bleaching
Disturbance
№ Species coveragenumber of
coloniescoverage
number of
coloniescoverage
number of
coloniescoverage
number of
coloniescoverage
number of
colonies
1 Stylocoeniella guentheri
2 Pocillopora damicornis
3 Montipora sp.(arborescent)
4 Acropora formosa
5 Acropora microphthalma
6 Acropora aspera
7 Acropora millepora
8 Acropora selago
9 Acropora nasuta
10 Acropora carduus
11 Acropora florida
12 Acropora sp.(arborescent)
13 Astreopora myriophthalma
14 Astreopora gracilis
15 Porites australiensis r 2
16 Porites lutea r 1 r 6 r 3
17 Porites cylindrica
18 Psammocora contigua r 2
19 Psammocora profundacella
20 Pavona varians r 1 r 1
21 Pavona venosa
22 Herpolitha limax
23 Lobophyllia hemprichii r 3 r 2
24 Leptastrea pruinosa r 1
25 Cyphastrea serailia
Number of Species 0 0 4 1 5
Diversity index 1.386 0 1.609
notes +:<5%、r:<1%
<Bleaching>
0:<1%(not observed or rare) 3:50-90%(all of colnies are bleached)
1:1-10%(rare, but remarkable) 4:>90%(healthy coloneis are rare. all over the reef is looks whitish.)
2:10-50%(bleachied is average.)
not observed not observed not observed not observed
not observed not observed not observed not observed
not observed
0% 0% 0% 0%
not observed
0% r r r
0%
7 8 9 10
0%
6

52
Table 5.1.1-4 (3) corals in study site
Study site
Coverage of Coral (lives)
Coverage of Coral (dead)
Bleaching
Disturbance
№ Species coveragenumber of
coloniescoverage
number of
coloniescoverage
number of
coloniescoverage
number of
coloniescoverage
number of
colonies
1 Stylocoeniella guentheri
2 Pocillopora damicornis
3 Montipora sp.(arborescent)
4 Acropora formosa
5 Acropora microphthalma
6 Acropora aspera
7 Acropora millepora
8 Acropora selago r 1
9 Acropora nasuta
10 Acropora carduus
11 Acropora florida
12 Acropora sp.(arborescent)
13 Astreopora myriophthalma r 1
14 Astreopora gracilis r 1
15 Porites australiensis + 3
16 Porites lutea r 3 r 1 + 1
17 Porites cylindrica r 1
18 Psammocora contigua 25% >100 25% >100 r 4 15% >100
19 Psammocora profundacella r 1
20 Pavona varians
21 Pavona venosa
22 Herpolitha limax + 3
23 Lobophyllia hemprichii r 1
24 Leptastrea pruinosa
25 Cyphastrea serailia
Number of Species 1 4 7 2 1
Diversity index 0 0.503 1.589 0.143 0
notes +:<5%、r:<1%
<Bleaching>
0:<1%(not observed or rare) 3:50-90%(all of colnies are bleached)
1:1-10%(rare, but remarkable) 4:>90%(healthy coloneis are rare. all over the reef is looks whitish.)
2:10-50%(bleachied is average.)
not observed not observed not observednot observed not observed
not observednot observed not observed not observed not observed
0% 0% 0%r r
+25% 25% + 15%
13 14 1511 12

53
Table 5.1.1-4 (4) corals in study site
Study site
Coverage of Coral (lives)
Coverage of Coral (dead)
Bleaching
Disturbance
№ Species coveragenumber of
coloniescoverage
number of
coloniescoverage
number of
coloniescoverage
number of
coloniescoverage
number of
colonies
1 Stylocoeniella guentheri
2 Pocillopora damicornis r 1 r 3
3 Montipora sp.(arborescent) r 1
4 Acropora formosa + 1 r 1
5 Acropora microphthalma + 5 r 3
6 Acropora aspera
7 Acropora millepora r 1 r 2
8 Acropora selago r 1 r 1
9 Acropora nasuta
10 Acropora carduus r 1 r 1 r 1
11 Acropora florida
12 Acropora sp.(arborescent) r 3
13 Astreopora myriophthalma
14 Astreopora gracilis
15 Porites australiensis r 4 r 1 10% 20 r 1
16 Porites lutea r 2
17 Porites cylindrica 25% 15
18 Psammocora contigua r 1 5% 16 + 6
19 Psammocora profundacella
20 Pavona varians
21 Pavona venosa r 1 r 1
22 Herpolitha limax r 1 r 1
23 Lobophyllia hemprichii + 5 r 1
24 Leptastrea pruinosa
25 Cyphastrea serailia r 1
Number of Species 7 1 9 7 7
Diversity index 1.589 0 1.091 1.322 1.946
notes +:<5%、r:<1%
<Bleaching>
0:<1%(not observed or rare) 3:50-90%(all of colnies are bleached)
1:1-10%(rare, but remarkable) 4:>90%(healthy coloneis are rare. all over the reef is looks whitish.)
2:10-50%(bleachied is average.)
not observed not observed not observed not observed
not observed not observed not observed not observed
not observed
r 0% 0% 0%
not observed
r 35% 15% +
0%
17 18 19 20
+
16
Pavona venosa is evaluated as VU: vulnerable in the IUCN Red List.

54
Stu
dy s
ite
12
34
56
78
910
11
12
13
14
15
16
17
18
19
20
Covera
ge o
f A
rgae
rr
+20%
50%
5%
5%
15%
20%
30%
25%
20%
25%
10%
10%
10%
+15%
25%
20%
№Spec
ies
1D
ichoto
mar
ia s
p.
r15%
+5%
15%
20%
10%
15%
r+
+
2A
mphir
oa
frag
iliss
ima
+
3Ja
nia
sp.
++
4M
EL
OB
ESIO
IDE
AE
rr
++
5H
ypnea
pan
nosa
++
10%
5%
6PE
YSSO
NN
EL
IAC
EA
Er
++
++
++
++
7C
erat
odic
tyon s
pongi
osu
mr
++
+15%
8G
elid
iopsi
s s
p.
++
r+
9R
HO
DO
PH
YC
EA
E+
+r
+15%
10
BA
CIL
LA
RIO
PH
YC
EA
E+
++
10%
+5%
11
Pad
ina
min
or
++
r20%
12
Dic
tyosp
hae
ria
vers
luys
iir
13
Hal
imed
a s
p.
++
Num
ber
of Spec
ies
21
33
32
33
43
43
43
34
23
41
not
es +
:<5%
、r:
<1%
Tab
le 5
.1.1
-5 A
lgae
in s
tudy
sit
es

55
Stud
y s
ite
12
34
56
78
910
11
12
13
14
15
16
17
18
19
20
Cove
rage
of Ben
thos
r40%
+0%
0%
r10%
+r
r+
++
+0%
+5%
++
+
№Spec
ies
1D
EM
OSPO
NG
IAE
rr
rr
r5%
2C
ON
IDA
Er
3A
RC
IDA
Er
rr
rr
4M
alle
us
regu
lar
rr
rr
rr
rr
r
5C
HA
MID
AE
rr
r
6Lunulic
ardia
hem
icar
diu
mr
7Tri
dac
na
croce
ar
8A
NO
MU
RA
rr
r9
Dia
dem
a sa
vign
yi40%
+10%
rr
+r
+r
rr
+10
Ech
inoth
rix
cala
mar
isr
11
Par
asal
ena
grat
iosa
var
. bonin
ensis
r12
Holo
thuria
(Hal
odei
ma)
atra
rr
13
Holo
thuria
(Hal
odei
ma)
edulis
r14
Sti
chopus
her
man
ni
r15
ASC
IDIA
CEA
(colo
ny)
rr
16
ASC
IDIA
CEA
rr
Num
ber
of Spec
ies
12
50
02
14
13
23
52
07
33
44
not
es
+:<
5%、
r:<1%
Tab
le 5
.1.1
-6 B
enth
ic a
nim
als
in s
tud
y si
tes

56
St.1
St.2
St.3
St.4
St.5
St.6
Photo 5.1.1-3 (1) Quadrat in study sites
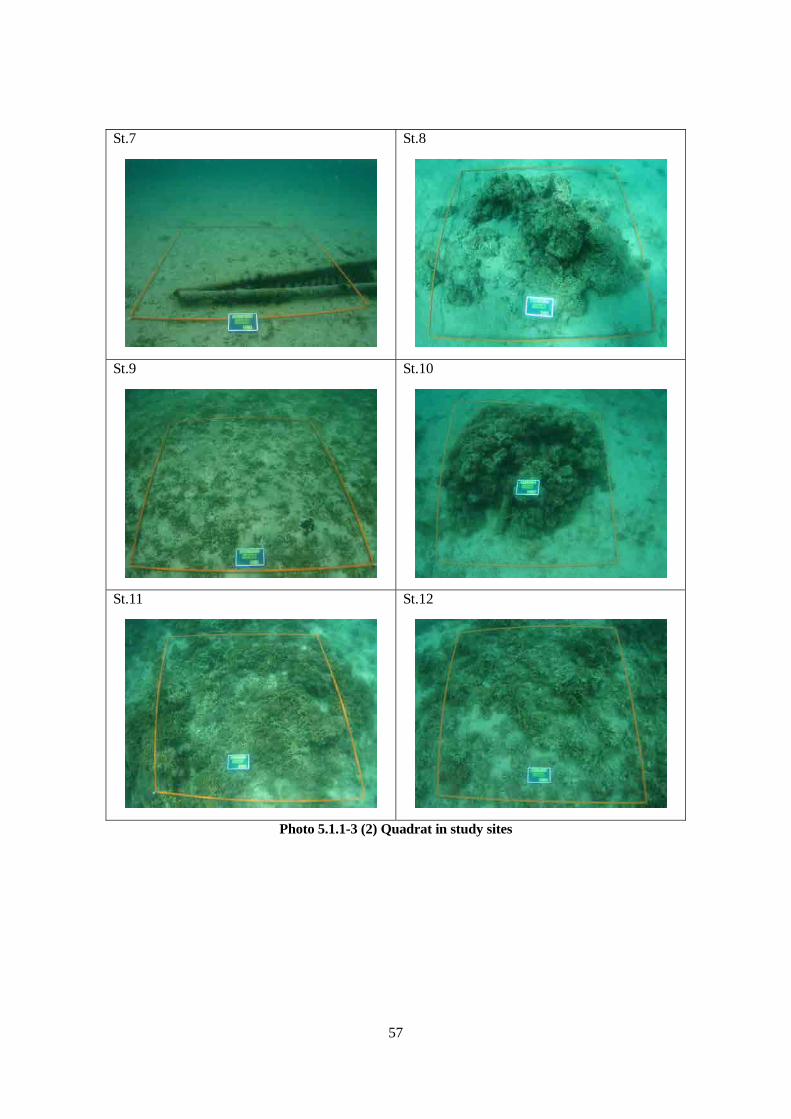
57
St.7
St.8
St.9
St.10
St.11
St.12
Photo 5.1.1-3 (2) Quadrat in study sites

58
St.13
St.14
St.15
St.16
St.17
St.18
Photo 5.1.1-3 (3) Quadrat in study sites

59
St.19
St.20
Photo 5.1.1-3 (4) Quadrat in study sites

60
5.1.2. Transect Survey (1) Objective Species composition survey was conducted to determine the diversity of species in order to evaluate the level of impact on the corals in the subject water area, as well as to study the necessary mitigation measures and to develop a long-term monitoring plan. Sites were selected from the 16 existing transects used in the EIA. (2) Method Of the transect survey locations used in the EIA by AusAID, 9 sites representative of the area were selected for this survey (Fig. 5.1.2-1, Table 5.1.2-1). The survey was conducted from October 20 to November 15, 2011. Rather than relying solely on GPS information, iron stakes were placed wherever possible at the start and end points of the transect so that the same accurate points can be used throughout the long term monitoring. Following the method used in the EIA, 0.5 m x 0.5 m quadrats were placed at 5 m intervals along 40 m transects identified at each survey site. Observations were conducted on corals, major marine plants and benthic animals. Videos were taken to include a 0.5 m area around both ends of the transect. Based on the survey results at each survey site, coral diversity was calculated for each survey site for a quantitative evaluation of the coral reef.
S4T4S4T3 S4T2
S2T1
S2T3 S3T3
S3T2
S3T1
S1T4
N
0 500 250
Meters
0 500
Meters
250
Fig. 5.1.2-1 Location of Transect Survey Sites
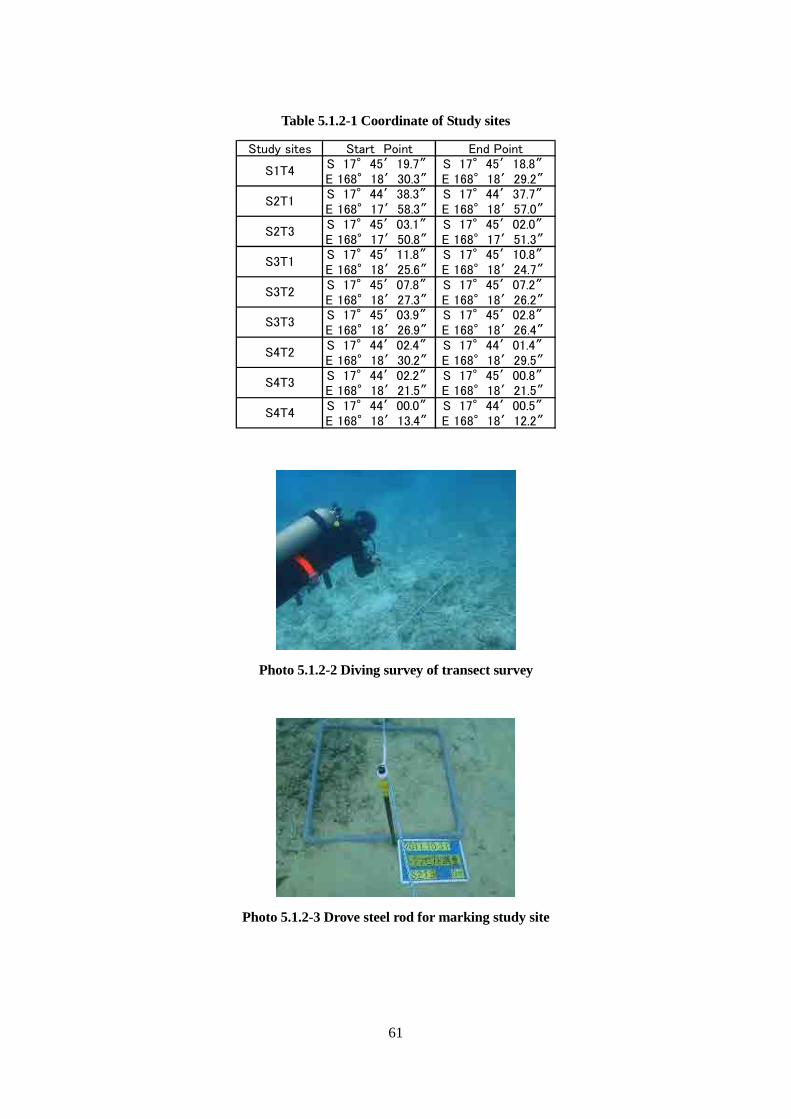
61
Table 5.1.2-1 Coordinate of Study sites
Study sites Start Point End PointS 17°45′19.7″ S 17°45′18.8″E 168°18′30.3″ E 168°18′29.2″S 17°44′38.3″ S 17°44′37.7″E 168°17′58.3″ E 168°18′57.0″S 17°45′03.1″ S 17°45′02.0″E 168°17′50.8″ E 168°17′51.3″S 17°45′11.8″ S 17°45′10.8″E 168°18′25.6″ E 168°18′24.7″S 17°45′07.8″ S 17°45′07.2″E 168°18′27.3″ E 168°18′26.2″S 17°45′03.9″ S 17°45′02.8″E 168°18′26.9″ E 168°18′26.4″S 17°44′02.4″ S 17°44′01.4″E 168°18′30.2″ E 168°18′29.5″S 17°44′02.2″ S 17°45′00.8″E 168°18′21.5″ E 168°18′21.5″S 17°44′00.0″ S 17°44′00.5″E 168°18′13.4″ E 168°18′12.2″
S4T2
S4T3
S4T4
S1T4
S2T1
S2T3
S3T1
S3T2
S3T3
Photo 5.1.2-2 Diving survey of transect survey
Photo 5.1.2-3 Drove steel rod for marking study site

62
(3) Results (a) Situation at Each Transect
S1T4 Water depth was between 3.0 and 7.2 m, with the terrain declining gradually from the 0 m point towards the 40 m point. The substrate consisted mainly of sand. The condition of sedimentation was such that there were many spots where the water became turbid when the sea bottom was struck by hand. Corals: Average coverage was < 1%. Two species were observed, with 1 or 2 colonies observed at each site. Diversity index was 0.412. Psammocora contigua and Porites lutea were observed. No dead corals were observed. Major algae: Average coverage was < 5%. Five species were observed. Melobesioideae coralline algae and Gelidiopsis sp. were the dominant species. Major benthic animals: Average coverage was < 1%. One species, Diadema savignyi, was observed. No disturbance by coral-eating animals was observed. S2T1 Water depth was between 3.9 and7.7 m. The substrate consisted mainly of sand, gravel and bedrock. The condition of floating mud deposits was such that there were many spots where the water became turbid when the sea bottom was struck by hand. Corals: Average coverage was < 5%. Twelve species were observed, with 1to 4 colonies of each species observed at each site. Diversity index was 2.074. Porites lutea and Astreopora gracilis were dominant. No dead corals were observed. Major algae: Average coverage was 7%. Three species were observed. The dominant species were Melobesioideae coralline algae and Peyssoneliaceae. Major benthic animals: Average coverage was < 1%. One species, Demospongiae, was observed. No disturbance by coral-eating animals was observed. S2T3 Water depth was between 2.5 and 3.0 m. The substrate consisted mainly of sand. The condition of floating mud deposits was such that the water became turbid when the sea bottom was struck by hand. Corals: Average coverage was < 1%. Two species were observed, with 1to 3 colonies of each species observed at each site. Diversity index was 0.637, with Porites lutea and Astreopora gracilis observed. No dead corals were observed. Major algae: Average coverage was < 1%. Five species were observed. The dominant species were Bacillariophyceae and Melobesioideae coralline algae. Major benthic animals: No benthic animals were observed. No disturbance by coral-eating animals was observed at this site.

63
S3T1 Water depth was between 1.7 and 2.8 m. The substrate consisted mainly of bedrock, sand and gravel. The condition of floating mud deposits was such that the water showed little turbidity when the sea bottom was struck by hand. Corals: No corals were observed. No dead corals were observed. Major algae: Average coverage was < 5%. Four species were observed. The dominant species were Hypnea panossa and Bacillariophyceae. Major benthic animals: Average coverage was < 1%. Two species, Demospongiae and Ophiuroidea, was observed. No disturbance by coral-eating animals was observed. S3T2 Water depth was 1.5~1.7 m. The substrate consisted mainly of bedrock. The condition of floating mud deposits was such that the water showed little turbidity when the sea bottom was struck by hand. No dead corals were observed. Corals: Average coverage was < 5%. Four species were observed, with 1 to 2 colonies of each species observed at each site. Diversity index was 1.306, with Pocillopora damicornis being the dominant species. Major algae: Average coverage was < 5%. Two species were observed: Melobesioideae coralline algae and Ceratodictyon spongiosum. Major benthic animals: Average coverage was 9%. Four species were observed. The dominant species were Diadema savignyi and Demospongiae. No disturbance by coral-eating animals was observed.
S3T3 Water depth was between 1.5 and 1.7 m. The substrate consisted mainly of bedrock. The condition of floating mud deposits was such that the water showed little turbidity when the sea bottom was struck by hand. Corals: Average coverage was < 5%. Four species were observed, with 1 to 2 colonies of each species observed at each site. Diversity index was 0.869, with Porites lutea being the dominant species. No dead corals were observed. Major algae: Average coverage was < 5%. Two species were observed: Ceratodictyon spongiosum and Melobesioideae coralline algae. Major benthic animals: Average coverage was < 1%. Four species were observed. The dominant species were Demospongiae and Tridacna crocea. No disturbance by coral-eating animals was observed.
S4T2 Water depth was between 0.9 and 1.7 m. The substrate consisted mainly of gravel, bedrock and sand. The condition of floating mud deposits was such that the water showed little

64
turbidity when the sea bottom was struck by hand. Corals: Average coverage was 31%. Sixteen species were observed, with 1 to 33 colonies of each species observed at each site. Diversity index was 2.070, with Porites lutea and Genus Montipora (branching type) being the dominant species. Coverage by dead corals was < 5%. Major algae: Average coverage was 23%. Seven species were observed. The dominant species was Ceramiaceae. Major benthic animals: Average coverage was < 5%. Nine species were observed. The dominant species were Drupella cornus and Tridacna crocea. Drupella cornus is a coral-eating conch, and some feeding damage was observed at this site. S4T3 Water depth was between 1.3 and 2.4 m. The substrate consisted mainly of gravel, bedrock and sand. The condition of floating mud deposits was such that the water showed little or no turbidity when the sea bottom was struck by hand. Corals: Average coverage was 33%. Nine species were observed, with 1 to 9 colonies of each species observed at each site. Diversity index was 0.592, with Porites rus being the dominant species. Coverage by dead corals was < 5%. Major algae: Average coverage was 19%. Six species were observed. The dominant species were Melobesioideae coralline algae and Ceramiaceae. Major benthic animals: Average coverage was < 5%. Seven species were observed. The dominant species were Entacmaea actinostoloides sensu and Drupella cornus. Drupella cornus is a coral-eating conch, and some feeding damage was observed at this site.
S4T4 Water depth was between 1.5 and 2.0 m. The substrate consisted mainly of sand and gravel. The condition of floating mud deposits at most spots was such that the water showed no turbidity when the ocean floor was struck by hand. Corals: Average coverage was 13%. Five species were observed, with 1 or 2 colonies of each species observed at each site. Diversity index was 0.386, with Genus Porites (digitated type) and Porites australiensis being the dominant species. No dead corals were observed. Major algae: Average coverage was < 5%. Four species were observed, such as Melobesioideae coralline algae and Ceramiaceae. Major benthic animals: Average coverage was 15%. Nine species were observed. The dominant species were Sarcophyton sp. and Diadema savignyi. No disturbance by coral-eating animals was observed.
(b) Conclusion
The transect survey sites were categorized into two general groups: (1) S2T1 on the north side of Ifira Island at the mouth of Port Vila Harbor, and S4T2, S4T3, S4T4 to the south of Vatumaru Bay; and (2) S1T4, S2T3, S3T1, S3T2, and S3T3l which are located in the head of

65
Pontoon and Paray Bays. At survey sites near the mouth of Port Vila Harbor, the average coral coverage ranged from < 5% to 33%. In particular, the three sites to the south of Vatumaru Bay showed high average coverage of > 10%. Five to 16 species of corals were observed at these sites, with the dominant species being Porites lutea of Genus Porites, Genus Porites (digitaed type), Porites rus, Porites australiensis, and Genus Montipora (branching type). For each species, 1 to 33 colonies were observed along each survey line. The diversity index for the coral colonies ranged from 0.386 to 2.074. In particular, S2T1 and S4T2 had the highest diversity index of >2. The average coverage of major marine plants ranged from < 5% to 23%. Melobesioideae coralline algae and Ceramiaceae were prevalent. The average coverage of the major benthic animals ranged from < 1% to 15%. Drupella cornus, Tridacna crocea, Entacmaea actinostoloides sensu, and Diadema savignyi were observed. Drupella cornus is a coral-eating gastropod. The corals at S4T2 and S4T3 in the south side of Vatumaru Bay showed partial feeding damage and some dead corals. At survey sites located in the inner parts of the bay, the average coral coverage along each survey line ranged from < 1% to 5%. No coral was observed at S3T1. At all other sites, 2 to 4 species of corals were observed. The dominant species were Porites lutea, Psammocora contigua, Astreopora gracilis, and Pocillopora damicornis. For each species, 1 to 3 colonies were observed along each survey line. The coral diversity index ranged from 0.412 to 1.306; there were no sites with a diversity index of > 2 like S2T1 and S4T2 at the mouth of the bay. The average coverage of major marine plants ranged from < 1% to < 5%. Melobesioideae coralline algae, Ceratodictyon spongiosum, and Bacillariophyceae were prevalent. The average coverage of major benthic animals ranged from < 1% to 9%, with none observed at S2T3. At all other sites, the dominant species were Demospongiae, Diadema savignyi, Tridacna crocea, and Ophiuroidea. A comparison of the survey results between the mouth of the bay and the head of the bay showed that there were more corals as well as higher diversity of corals at the mouth of the bay.
Photo 5.1.2-3 Predating damage due to the coral-eating gastropod Drupella cornus

66
Porites lutea
Porites sp. (digitated)
Porites rus
Montipora sp.(arborescent)
Psammocora contigua
Pocillopora damicornis
Photo 5.1.2-4 Dominant coral species in the study sites

67
Table 5.1.2-2 Outline of Transect Survey
Survey line S1T4 ●S2T1 S2T3Coral Average of coverage r + r
Number of species 2 12 2Diversity index 0.412 2.074 0.637Dominant species Psammocora contigua Porites lutea Porites lutea
Porites lutea Porites cylindrica Astreopora gracilisDead coral Average of coverage 0% 0% 0%Dominant Algae Average of coverage + 7% r
Number of species 5 3 5Dominant species MELOBESIOIDEAE MELOBESIOIDEAE BACILLARIOPHYCEAE
Gelidiopsis sp. PEYSSONNELIACEAE MELOBESIOIDEAEDominant Benthos Average of coverage r r 0%
Number of species 1 1 0Dominant species Diadema savignyi DEMOSPONGIAE
Survey line S3T1 S3T2 S3T3Coral Average of coverage 0% + 5%
Number of species 0 4 4Diversity index 1.306 0.869Dominant species Pocillopora damicornis Porites lutea
Dead coral Average of coverage 0% 0% 0%Dominant Algae Average of coverage + + +
Number of species 4 2 2Dominant species Hypnea pannosa MELOBESIOIDEAE Ceratodictyon spongiosum
BACILLARIOPHYCEAE Ceratodictyon spongiosum MELOBESIOIDEAEDominant Benthos Average of coverage r 9% r
Number of species 2 4 4Dominant species DEMOSPONGIAE Diadema savignyi DEMOSPONGIAE
OPHIUROIDEA DEMOSPONGIAE Tridacna crocea
Survey line ●S4T2 ●S4T3 ●S4T4Coral Average of coverage 31% 33% 13%
Number of species 16 9 5Diversity index 2.070 0.592 0.386Dominant species Porites lutea Porites rus Porites sp. (digitated)
Montipora sp.(arborescent) Porites australiensisDead coral Average of coverage + + 0%Dominant Algae Average of coverage 23% 19% +
Number of species 7 6 4Dominant species CERAMIACEAE MELOBESIOIDEAE MELOBESIOIDEAE
CERAMIACEAE CERAMIACEAEDominant Benthos Average of coverage + + 15%
Number of species 9 7 9Dominant species Drupella conus Entacmaea actinostoloides sensu Sarcophyton sp.
Tridacna crocea Drupella conus Diadema savignyinotes +:<5%,r:<1%
Dominant species show two species having the highest and second coverage.●:The sites near bay mouth area

68
0
5
10
15
20
25
30
35
Survey line
Average of coverage(%)
Number of species
●: Survey line at the mouth of the bay.
Fig. 5.1.2-2 Coral coverage in transects
0.000
0.500
1.000
1.500
2.000
2.500
S1T4
●S2
T1
S2T3
S3T1
S3T2
S3T3
●S4
T2
●S4
T3
●S4
T4
Survey line
Diversity index
●: Survey line at the mouth of the bay.
Fig. 5.1.2-3 Diversity index of coral community in transects

69
+ r1 11 20
10
20
30
40
50
60
70
80
90
100
0 5 10 15 20 25 30 35 40
:coverge (%)
:number of species
:number of colonies
-8.00
-6.00
-4.00
-2.00
0.00
2.00
0 5 10 15 20 25 30 35 40
dep
th (m
)
distance (m)
S1T4:sand
:gravel
:rock
Fig. 5.1.2-4 Profile of depth and substratum and coverage, species and colonies of coral (S1T4)
r r r r r r + + r2 2 5 4 3 16 3 12 2 6 5 5 2
94 2
0
10
20
30
40
50
60
70
80
90
100
0 5 10 15 20 25 30 35 40
:coverge (%)
:number of species
:number of colonies
-8.00
-6.00
-4.00
-2.00
0.00
2.00
0 5 10 15 20 25 30 35 40
dept
h (m
)
distance (m)
S2T1:sand
:gravel
:rock
Fig. 5.1.2-5 Profile of depth and substratum and coverage, species and colonies of coral (S2T1)
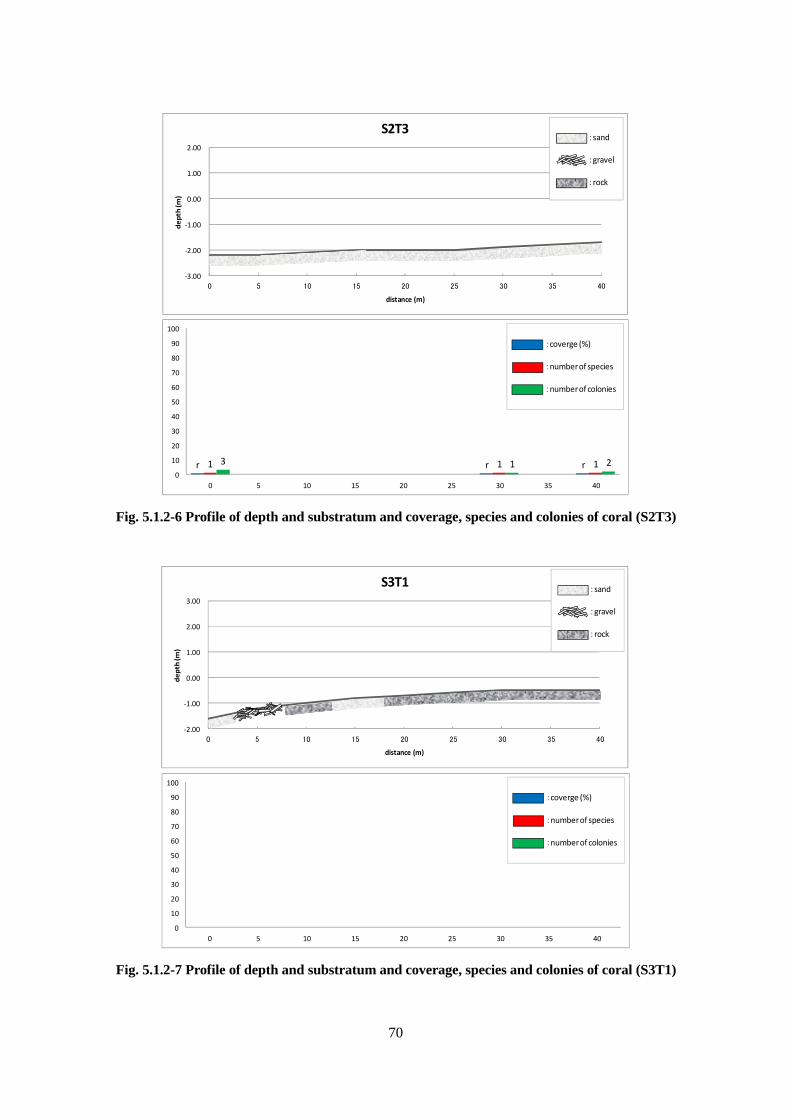
70
r r r1 1 13 1 20
10
20
30
40
50
60
70
80
90
100
0 5 10 15 20 25 30 35 40
:coverge (%)
:number of species
:number of colonies
-3.00
-2.00
-1.00
0.00
1.00
2.00
0 5 10 15 20 25 30 35 40
de
pth
(m)
distance (m)
S2T3:sand
:gravel
:rock
Fig. 5.1.2-6 Profile of depth and substratum and coverage, species and colonies of coral (S2T3)
0
10
20
30
40
50
60
70
80
90
100
0 5 10 15 20 25 30 35 40
:coverge (%)
:number of species
:number of colonies
-2.00
-1.00
0.00
1.00
2.00
3.00
0 5 10 15 20 25 30 35 40
dep
th (m
)
distance (m)
S3T1:sand
:gravel
:rock
Fig. 5.1.2-7 Profile of depth and substratum and coverage, species and colonies of coral (S3T1)
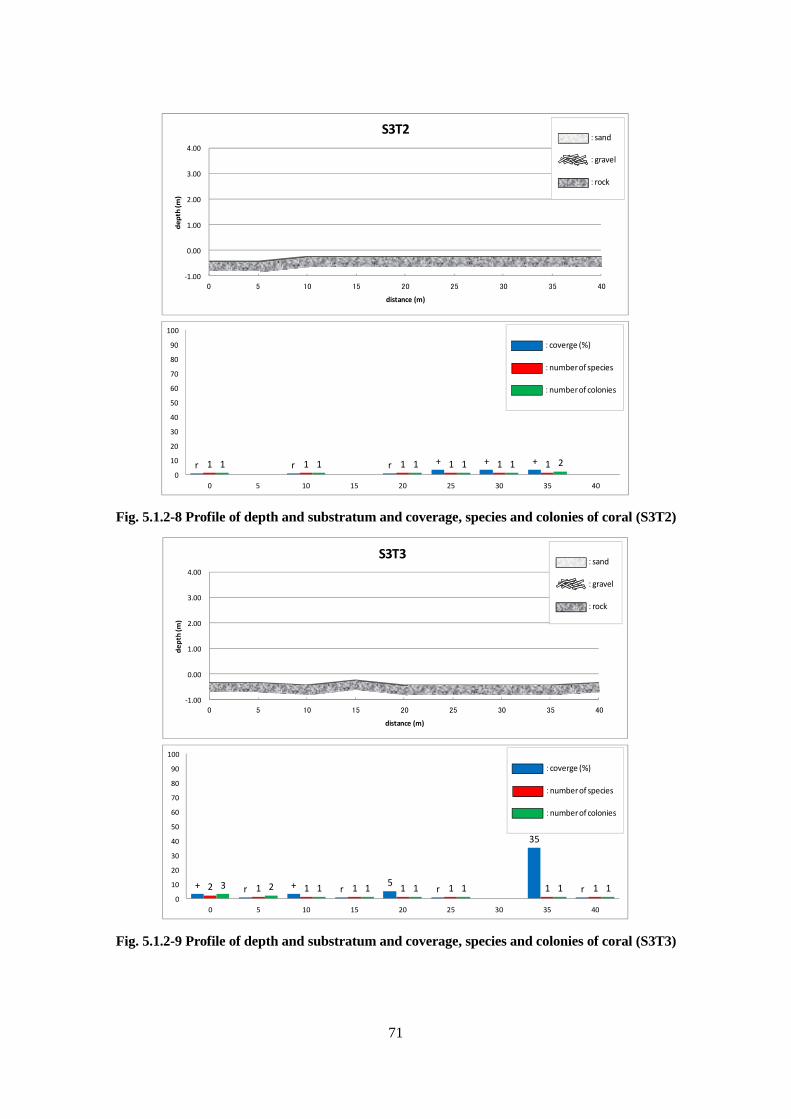
71
r r r + + +1 1 1 1 1 11 1 1 1 1 20
10
20
30
40
50
60
70
80
90
100
0 5 10 15 20 25 30 35 40
:coverge (%)
:number of species
:number of colonies
-1.00
0.00
1.00
2.00
3.00
4.00
0 5 10 15 20 25 30 35 40
dep
th (m
)
distance (m)
S3T2:sand
:gravel
:rock
Fig. 5.1.2-8 Profile of depth and substratum and coverage, species and colonies of coral (S3T2)
+ r + r5
r
35
r2 1 1 1 1 1 1 13 2 1 1 1 1 1 10
10
20
30
40
50
60
70
80
90
100
0 5 10 15 20 25 30 35 40
:coverge (%)
:number of species
:number of colonies
-1.00
0.00
1.00
2.00
3.00
4.00
0 5 10 15 20 25 30 35 40
dep
th (m
)
distance (m)
S3T3:sand
:gravel
:rock
Fig. 5.1.2-9 Profile of depth and substratum and coverage, species and colonies of coral (S3T3)

72
+
20
+
20
50 5045
70
20
3 2 5 5 6 4 4 4 35
34
6
1813
46
26 27
13
0
10
20
30
40
50
60
70
80
90
100
0 5 10 15 20 25 30 35 40
:coverge (%)
:number of species
:number of colonies
-1.00
0.00
1.00
2.00
3.00
4.00
0 5 10 15 20 25 30 35 40
de
pth
(m)
distance (m)
S4T2:sand
:gravel
:rock
Fig. 5.1.2-10 Profile of depth and substratum and coverage, species and colonies of coral (S4T2)
+ 5 5
90
40 4045
5
65
1 3 3 2 2 1 2 3 32 4 6 410 6 4 3 4
0
10
20
30
40
50
60
70
80
90
100
0 5 10 15 20 25 30 35 40
:coverge (%)
:number of species
:number of colonies
-2.00
-1.00
0.00
1.00
2.00
3.00
0 5 10 15 20 25 30 35 40
de
pth
(m)
distance (m)
S4T3:sand
:gravel
:rock
Fig. 5.1.2-11 Profile of depth and substratum and coverage, species and colonies of coral (S4T3)
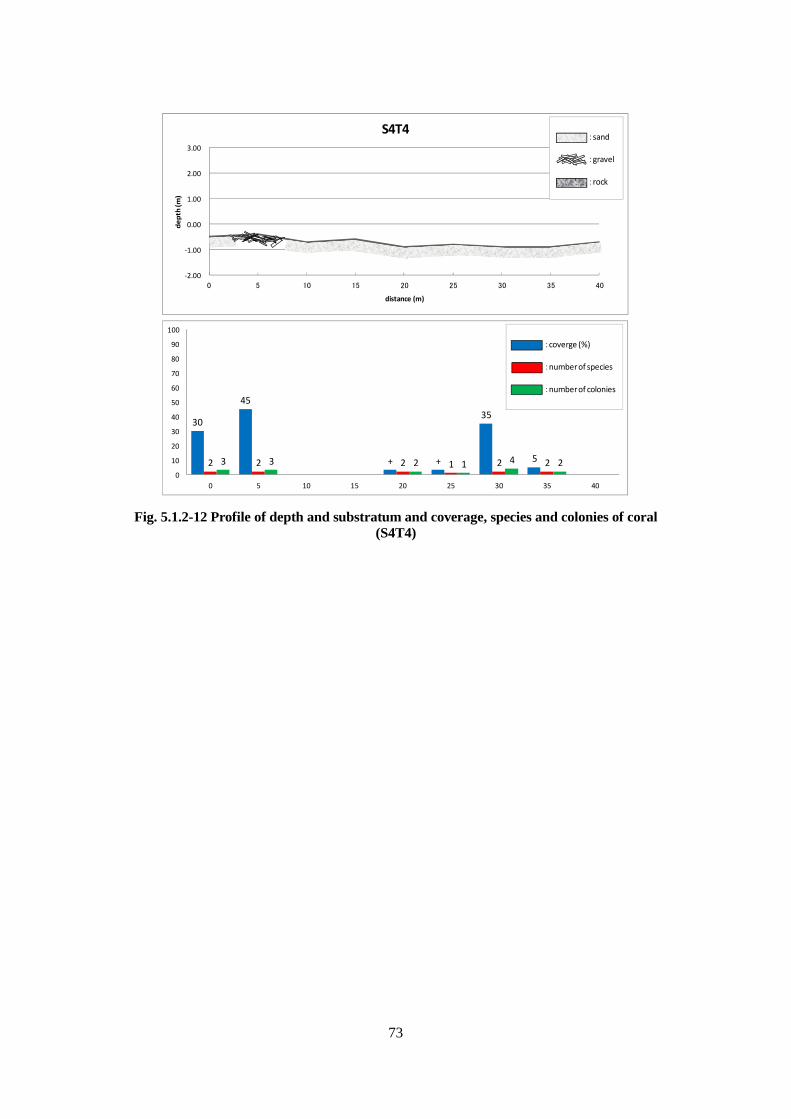
73
30
45
+ +
35
52 2 2 1 2 23 3 2 1 4 20
10
20
30
40
50
60
70
80
90
100
0 5 10 15 20 25 30 35 40
:coverge (%)
:number of species
:number of colonies
-2.00
-1.00
0.00
1.00
2.00
3.00
0 5 10 15 20 25 30 35 40
dep
th (m
)
distance (m)
S4T4:sand
:gravel
:rock
Fig. 5.1.2-12 Profile of depth and substratum and coverage, species and colonies of coral (S4T4)

74
Cor
alD
ista
nce
on t
he s
urve
y li
ne (
m)
Cov
erag
e of
Cor
al (
lives
)
Cov
erag
e of
Cor
al (
dead
)
Ble
achi
ng
Dis
turb
ance
№Sp
ecie
sC
over
age
Num
ber
ofco
loni
esC
over
age
Num
ber
ofco
loni
esC
over
age
Num
ber
ofco
loni
esC
over
age
Num
ber
ofco
loni
esC
over
age
Num
ber
ofco
loni
esC
over
age
Num
ber
ofco
loni
esC
over
age
Num
ber
ofco
loni
esC
over
age
Num
ber
ofco
loni
esC
over
age
Num
ber
ofco
loni
es
1P
orit
es lu
tea
r2
2P
sam
moc
ora
cont
igua
+1
Num
ber o
f Spe
cies
01
00
00
00
0
note
s +
:<5 %
, r:<
1 %
<B
leac
hing
>
0 :<
1 %(no
t ob
serv
ed o
r ra
re)
1 :1-
10%
(ra
re, b
ut r
emar
kabl
e)2 :
10-5
0 %(bl
each
ied
is a
vera
ge. )
3 :50
-90 %
(al
l of
coln
ies
are
blea
ched
)
4 :>
90%
(hea
lthy
col
onei
s ar
e ra
re. a
ll ov
er t
he r
eef
is lo
oks
whi
tish
. )
Dom
inan
t Arg
aeD
ista
nce
on t
he s
urbe
y li
ne (
m)
№Sp
ecie
s \C
over
age
of A
rgae
1D
icho
tom
aria
sp.
2M
ELO
BES
IOID
EAE
3PE
YSS
ON
NEL
IAC
EAE
4G
elid
iops
is s
p.
5B
AC
ILLA
RIO
PHY
CEA
E
Num
ber o
f Spe
cies
00
12
10
03
2
note
s +
:<5 %
, r:<
1 %
Dom
inan
t Ben
thos
Dis
tanc
e on
the
sur
bey
line
(m
)
№Sp
ecie
s \C
over
age
of B
enth
os
1D
iade
ma
savi
gnyi
Num
ber o
f Spe
cies
01
00
00
00
0
note
s +
:<5 %
, r:<
1 %
Dep
th,S
ubst
ratu
m
SN:S
and,
RK
:Roc
k, S
T:S
tone
, G:G
rave
l
SNSN
,GSN
,G
4.80
5.40
6.10
Subs
trat
umSN
,ST
SN,S
TSN
,GSN
,GSN
,GSN
,G
3035
40D
epth
(m
)1.
902.
402.
803.
503.
904.
20
0%0%
r
Dis
tanc
e on
the
sur
bey
line
(m
)0
510
1520
25
3035
40
0%0%
r0%
0%0%
0%
r+
r
r
05
1015
2025
+
r
r+
+
+
3540
0%0%
+r
r0%
0%10
%
not
obse
rved
not
obse
rved
not
obse
rved
05
1015
2025
30
not
obse
rved
not
obse
rved
not
obse
rved
not
obse
rved
not
obse
rved
not
obse
rved
0%
not
obse
rved
not
obse
rved
not
obse
rved
not
obse
rved
not
obse
rved
not
obse
rved
not
obse
rved
not
obse
rved
not
obse
rved
0%0%
0%0%
0%0%
0%0%
0%0%
3035
40
0%+
0%r
0%0%
0%
05
1015
2025
Tab
le 5
.1.2
-3 R
esu
lt o
f tr
anse
ct s
urv
ey (
S1T
4)

75
Cor
alD
ista
nce
on t
he s
urve
y li
ne (
m)
Cov
erag
e of
Cor
al (
lives
)
Cov
erag
e of
Cor
al (
dead
)
Ble
achi
ng
Dis
turb
ance
№Sp
ecie
sC
over
age
Num
ber
ofco
loni
esC
over
age
Num
ber
ofco
loni
esC
over
age
Num
ber
ofco
loni
esC
over
age
Num
ber
ofco
loni
esC
over
age
Num
ber
ofco
loni
esC
over
age
Num
ber
ofco
loni
esC
over
age
Num
ber
ofco
loni
esC
over
age
Num
ber
ofco
loni
esC
over
age
Num
ber
ofco
loni
es
1St
yloc
oeni
ella
gue
nthe
rir
1
2M
onti
pora
info
rmis
r1
r1
3M
onti
pora
sp.
(enc
rust
ing)
r1
r1
4A
crop
ora
card
uus
r2
5A
stre
opor
a s
p.r
1
6P
orit
es a
ustr
alie
nsis
r1
7P
orit
es lu
tea
r1
r1
r2
r1
+1
8P
orit
es c
ylin
dric
ar
1r
1r
3r
2r
4r
2r
2
9P
sam
moc
ora
cont
igua
r1
r1
r1
10P
sam
moc
ora
prof
unda
cell
ar
1
11P
avon
a va
rian
sr
1r
1
12G
onia
stre
a ed
war
dsi
r1
Num
ber o
f Spe
cies
note
s +
:<5 %
, r:<
1 %
<B
leac
hing
>
0 :<
1 %(n
ot o
bser
ved
or r
are)
1 :1-
10%
(rar
e, b
ut r
emar
kabl
e)2 :
10-5
0 %(
blea
chie
d is
ave
rage
. )3 :
50-9
0 %(
all o
f co
lnie
s ar
e bl
each
ed)
4 :>
90%
(he
alth
y c
olon
eis
are
rare
. all
over
the
ree
f is
look
s w
hiti
sh. )
31
not
obse
rved
not
obse
rved
not
obse
rved
22
54
31
6
not
obse
rved
not
obse
rved
not
obse
rved
not
obse
rved
not
obse
rved
not
obse
rved
0%
not
obse
rved
not
obse
rved
not
obse
rved
not
obse
rved
not
obse
rved
not
obse
rved
not
obse
rved
not
obse
rved
not
obse
rved
+r
0%0%
0%0%
0%0%
0%0%
3035
40
rr
rr
rr
+
05
1015
2025
Tab
le 5
.1.2
-4 (
1) R
esu
lt o
f tr
anse
ct s
urv
ey (
S2T
1)

76
Dom
inan
t Arg
aeD
ista
nce
on t
he s
urbe
y li
ne (
m)
№Sp
ecie
s \C
over
age
of A
rgae
1M
ELO
BES
IOID
EAE
2PE
YSS
ON
NEL
IAC
EAE
3C
ERA
MIA
CEA
E
Num
ber o
f Spe
cies
note
s +
:<5 %
, r:<
1 %
Dom
inan
t Ben
thos
Dis
tanc
e on
the
sur
bey
line
(m
)
№Sp
ecie
s \C
over
age
of B
enth
os
1D
EMO
SPO
NG
IAE
Num
ber o
f Spe
cies
note
s +
:<5 %
, r:<
1 %
Dep
th,S
ubst
ratu
m
SN:
Sand
, RK
:Roc
k, S
T:S
tone
, G:G
rave
l
G,S
NR
K,G
G,S
NSN
,G
3.85
2.95
5.45
6.75
Subs
trat
umR
K,G
SN,G
SN,G
RK
,GG
2530
3540
Dep
th(m
)3.
454.
354.
854.
054.
15
Dis
tanc
e on
the
sur
bey
line
(m
)0
510
1520
10
00
00
11
0
r0%
rr
r
3035
40
r0%
0%0%
0%0%
r
05
1015
2025
12
23
22
12
2
++
+
rr
+r
r+
+r
10%
++
10%
10%
+
40
++
+20
%10
%+
10%
5%+
05
1015
2025
3035
Tab
le 5
.1.2
-4 (
2) R
esu
lt o
f tr
anse
ct s
urv
ey (
S2T
1)
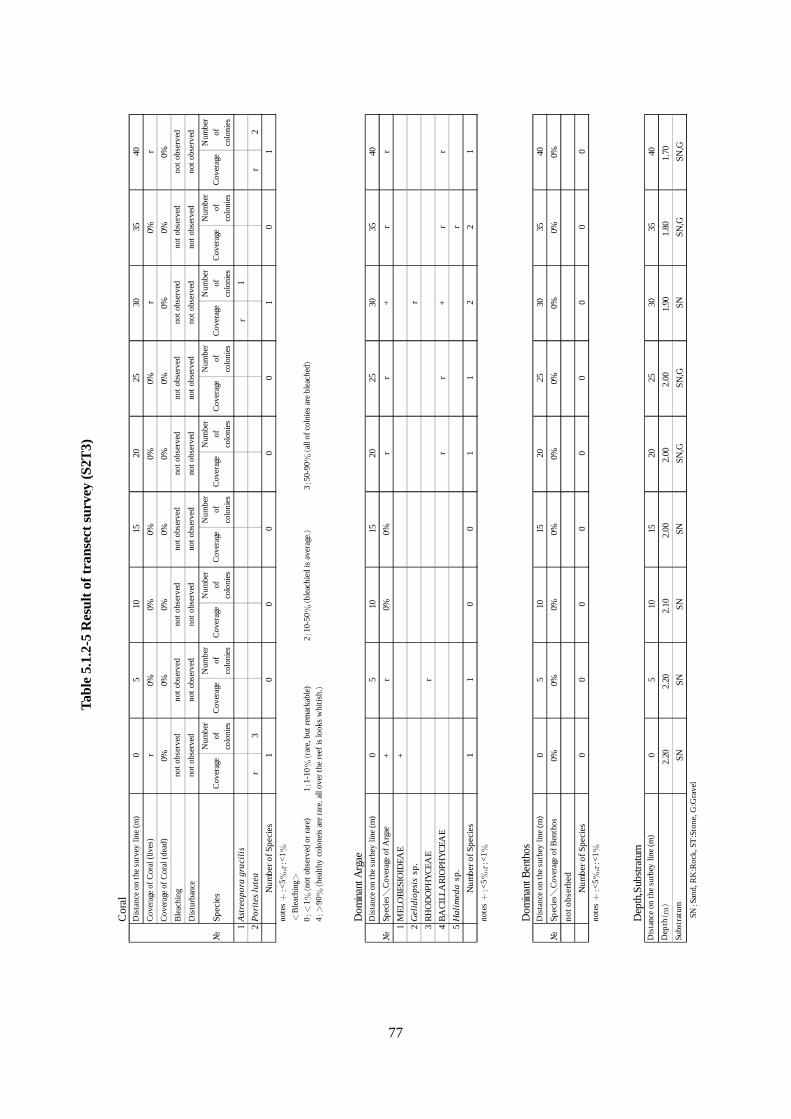
77
Cor
alD
ista
nce
on t
he s
urve
y li
ne (
m)
Cov
erag
e of
Cor
al (
lives
)
Cov
erag
e of
Cor
al (
dead
)
Ble
achi
ng
Dis
turb
ance
№Sp
ecie
sC
over
age
Num
ber
ofco
loni
esC
over
age
Num
ber
ofco
loni
esC
over
age
Num
ber
ofco
loni
esC
over
age
Num
ber
ofco
loni
esC
over
age
Num
ber
ofco
loni
esC
over
age
Num
ber
ofco
loni
esC
over
age
Num
ber
ofco
loni
esC
over
age
Num
ber
ofco
loni
esC
over
age
Num
ber
ofco
loni
es
1A
stre
opor
a gr
acil
isr
1
2P
orit
es lu
tea
r3
r2
Num
ber o
f Spe
cies
note
s +
:<5 %
, r:<
1 %
<B
leac
hing
>
0 :<
1 %(n
ot o
bser
ved
or r
are)
1 :1-
10%
(rar
e, b
ut r
emar
kabl
e)2 :
10-5
0 %(b
leac
hied
is a
vera
ge. )
3 :50
-90 %
(all
of c
olni
es a
re b
leac
hed )
4 :>
90%
(he
alth
y c
olon
eis
are
rare
. all
over
the
ree
f is
look
s w
hiti
sh. )
Dom
inan
t Arg
aeD
ista
nce
on t
he s
urbe
y li
ne (
m)
№Sp
ecie
s \C
over
age
of A
rgae
1M
ELO
BES
IOID
EAE
2G
elid
iops
is s
p.
3R
HO
DO
PHY
CEA
E
4B
AC
ILLA
RIO
PHY
CEA
E
5H
alim
eda
sp.
Num
ber o
f Spe
cies
note
s +
:<5 %
, r:<
1 %
Dom
inan
t Ben
thos
Dis
tanc
e on
the
sur
bey
line
(m
)
№Sp
ecie
s \C
over
age
of B
enth
os
not o
bser
bed
Num
ber o
f Spe
cies
note
s +
:<5 %
, r:<
1 %
Dep
th,S
ubst
ratu
m
SN:S
and,
RK
:Roc
k, S
T:S
tone
, G:G
rave
l
SN,G
SN,G
1.80
1.70
Subs
trat
umSN
SNSN
SNSN
,GSN
,GSN
3540
Dep
th(m
)2.
202.
202.
102.
002.
002.
001.
90
00
Dis
tanc
e on
the
sur
bey
line
(m
)0
510
1520
2530
00
00
00
0
40
0%0%
0%0%
0%0%
0%0%
0%
21
05
1015
2025
3035r
11
00
11
2
rr
+r
r
r
r
+
40
+r
0%0%
rr
+r
r
01
05
1015
2025
3035
not
obse
rved
not
obse
rved
not
obse
rved
10
00
00
1
not
obse
rved
not
obse
rved
not
obse
rved
not
obse
rved
not
obse
rved
not
obse
rved
0%
not
obse
rved
not
obse
rved
not
obse
rved
not
obse
rved
not
obse
rved
not
obse
rved
not
obse
rved
not
obse
rved
not
obse
rved
0%r
0%0%
0%0%
0%0%
0%0%
3035
40
r0%
0%0%
0%0%
r
05
1015
2025
Tab
le 5
.1.2
-5 R
esu
lt o
f tr
anse
ct s
urv
ey (
S2T
3)

78
Cor
alD
ista
nce
on t
he s
urve
y li
ne (
m)
Cov
erag
e of
Cor
al (
lives
)
Cov
erag
e of
Cor
al (
dead
)
Ble
achi
ng
Dis
turb
ance
№Sp
ecie
sC
over
age
Num
ber
ofco
loni
esC
over
age
Num
ber
ofco
loni
esC
over
age
Num
ber
ofco
loni
esC
over
age
Num
ber
ofco
loni
esC
over
age
Num
ber
ofco
loni
esC
over
age
Num
ber
ofco
loni
esC
over
age
Num
ber
ofco
loni
esC
over
age
Num
ber
ofco
loni
esC
over
age
Num
ber
ofco
loni
es
not o
bser
bed
Num
ber o
f Spe
cies
note
s +
:<
5 %, r
:<
1 %
<B
leac
hing
>
0 :<
1 %(n
ot o
bser
ved
or r
are)
1 :1-
10%
(ra
re, b
ut r
emar
kabl
e)2 :
10-5
0 %(b
leac
hied
is a
vera
ge. )
3 :50
-90 %
(al
l of
coln
ies
are
blea
ched
)
4 :>
90%
(hea
lthy
col
onei
s ar
e ra
re. a
ll ov
er t
he r
eef
is lo
oks
whi
tish
. )
Dom
inan
t Arg
aeD
ista
nce
on t
he s
urbe
y li
ne (
m)
№Sp
ecie
s \C
over
age
of A
rgae
1H
ypne
a pa
nnos
a
2C
erat
odic
tyon
spo
ngio
sum
3B
AC
ILLA
RIO
PHY
CEA
E
4P
adin
a m
inor
Num
ber o
f Spe
cies
note
s +
:<
5 %, r
:<
1 %
Dom
inan
t Ben
thos
Dis
tanc
e on
the
sur
bey
line
(m
)
№Sp
ecie
s \C
over
age
of B
enth
os
1D
EMO
SPO
NG
IAE
2O
PHIU
RO
IDEA
Num
ber o
f Spe
cies
note
s +
:<
5 %, r
:<
1 %
Dep
th,S
ubst
ratu
m
SN:
Sand
, RK
:Roc
k, S
T:S
tone
, G:G
rave
l
RK
RK
0.50
0.50
Subs
trat
umSN
GR
KSN
RK
RK
RK
3540
Dep
th(m
)1.
601.
201.
000.
800.
700.
600.
50
01
Dis
tanc
e on
the
sur
bey
line
(m
)0
510
1520
2530
r
00
00
01
0
r
r
3540
0%0%
0%0%
0%r
0%0%
11
3
05
1015
2025
30
12
11
11
rr
10%
r
10%
rr
+r
rr
r
40
r+
+10
%r
rr
r10
%
00
05
1015
2025
3035
not
obse
rved
not
obse
rved
not
obse
rved
00
00
00
0
not
obse
rved
not
obse
rved
not
obse
rved
not
obse
rved
not
obse
rved
not
obse
rved
0%
not
obse
rved
not
obse
rved
not
obse
rved
not
obse
rved
not
obse
rved
not
obse
rved
not
obse
rved
not
obse
rved
not
obse
rved
0%0%
0%0%
0%0%
0%0%
0%0%
3035
40
0%0%
0%0%
0%0%
0%
05
1015
2025
Tab
le 5
.1.2
-6 R
esu
lt o
f tr
anse
ct s
urv
ey (
S3T
1)

79
Cor
alD
ista
nce
on t
he s
urve
y li
ne (
m)
Cov
erag
e of
Cor
al (
lives
)
Cov
erag
e of
Cor
al (
dead
)
Ble
achi
ng
Dis
turb
ance
№Sp
ecie
sC
over
age
Num
ber
ofco
loni
esC
over
age
Num
ber
ofco
loni
esC
over
age
Num
ber
ofco
loni
esC
over
age
Num
ber
ofco
loni
esC
over
age
Num
ber
ofco
loni
esC
over
age
Num
ber
ofco
loni
esC
over
age
Num
ber
ofco
loni
esC
over
age
Num
ber
ofco
loni
esC
over
age
Num
ber
ofco
loni
es
1P
ocil
lopo
ra d
amic
orni
sr
1+
1
2A
crop
ora
hum
ilis
+
3P
orit
es lu
tea
+2
4P
orit
es c
ylin
dric
ar
1r
1
Num
ber o
f Spe
cies
note
s +
:<
5 %, r
:<
1 %
<B
leac
hing
>
0 :<
1 %(no
t ob
serv
ed o
r ra
re)
1 :1-
10%
(ra
re, b
ut r
emar
kabl
e)2 :
10-5
0 %(bl
each
ied
is a
vera
ge. )
3 :50
-90 %
(al
l of
coln
ies
are
blea
ched
)
4 :>
90%
(he
alth
y c
olon
eis
are
rare
. all
over
the
ree
f is
look
s w
hiti
sh. )
Dom
inan
t Arg
aeD
ista
nce
on t
he s
urbe
y li
ne (
m)
№Sp
ecie
s \C
over
age
of A
rgae
1M
ELO
BES
IOID
EAE
2C
erat
odic
tyon
spo
ngio
sum
Num
ber o
f Spe
cies
note
s +
:<
5 %, r
:<
1 %
05
1015
2025
3035
40
r0%
r0%
r+
++
0%
0%0%
0%0%
0%0%
0%0%
0%
not
obse
rved
not
obse
rved
not
obse
rved
not
obse
rved
not
obse
rved
not
obse
rved
not
obse
rved
not
obse
rved
not
obse
rved
not
obse
rved
not
obse
rved
not
obse
rved
not
obse
rved
not
obse
rved
not
obse
rved
not
obse
rved
not
obse
rved
not
obse
rved
10
10
11
11
0
05
1015
2025
3035
40
++
+r
+r
++
+
++
+r
+
r+
++
11
11
11
11
1
Tab
le 5
.1.2
-7 (
1) R
esu
lt o
f tr
anse
ct s
urv
ey (
S3T
2)

80
Dom
inan
t Ben
thos
Dis
tanc
e on
the
sur
bey
line
(m
)
№Sp
ecie
s \C
over
age
of B
enth
os
1D
EMO
SPO
NG
IAE
2O
PHIU
RO
IDEA
3D
iad
ema
sa
vig
nyi
4H
olo
thur
ia (
Hal
odei
ma
) at
ra
Nu
mbe
r of S
pec
ies
note
s +
:<
5 %, r
:<
1 %
Dep
th,S
ubst
ratu
m
SN:
Sand
, RK
:Roc
k, S
T:S
tone
, G:G
rave
l
05
1015
2025
3035
40
rr
+0%
0%60
%15
%+
r
rr
10%
+r
r
60% 1
2
+
2530+
11
10
0
0.25
0.25
21
Dis
tanc
e on
the
sur
bey
line
(m
)0
510
1520
RK
RK
3540
Dep
th(m
)0.
450.
450.
250.
250.
25
RK
RK
0.25
0.25
Subs
trat
umR
KR
KR
KR
KR
K
Tab
le 5
.1.2
-7 (
2) R
esu
lt o
f tr
anse
ct s
urv
ey (
S3T
2)

81
Cor
alD
ista
nce
on t
he s
urve
y li
ne (
m)
Cov
erag
e of
Cor
al (
lives
)
Cov
erag
e of
Cor
al (
dead
)
Ble
achi
ng
Dis
turb
ance
№Sp
ecie
sC
over
age
Num
ber
ofco
loni
esC
over
age
Num
ber
ofco
loni
esC
over
age
Num
ber
ofco
loni
esC
over
age
Num
ber
ofco
loni
esC
over
age
Num
ber
ofco
loni
esC
over
age
Num
ber
ofco
loni
esC
over
age
Num
ber
ofco
loni
esC
over
age
Num
ber
ofco
loni
esC
over
age
Num
ber
ofco
loni
es
1P
ocil
lopo
ra d
amic
orni
sr
2r
2+
1r
1r
1
2A
crop
ora
form
osa
+1
3P
orit
es a
ustr
alie
nsis
5%1
4P
orit
es lu
tea
35%
1r
1
Num
ber o
f Spe
cies
note
s +
:<5 %
, r:<
1 %
<B
leac
hing
>
0 :<
1 %(n
ot o
bser
ved
or r
are)
1 :1-
10%
(ra
re, b
ut r
emar
kabl
e)2 :
10-5
0 %(
blea
chie
d is
ave
rage
. )3 :
50-9
0 %(
all o
f co
lnie
s ar
e bl
each
ed)
4 :>
90%
(he
alth
y c
olon
eis
are
rare
. all
over
the
ree
f is
look
s w
hiti
sh. )
Dom
inan
t Arg
aeD
ista
nce
on t
he s
urbe
y li
ne (
m)
№Sp
ecie
s \C
over
age
of A
rgae
1M
ELO
BES
IOID
EAE
2C
erat
odic
tyon
spo
ngio
sum
Num
ber o
f Spe
cies
note
s +
:<5 %
, r:<
1 %
05
1015
2025
3035
40
+r
+r
5%r
0%35
%r
0%0%
0%0%
0%0%
0%0%
0%
not
obse
rved
not
obse
rved
not
obse
rved
not
obse
rved
not
obse
rved
not
obse
rved
not
obse
rved
not
obse
rved
not
obse
rved
not
obse
rved
not
obse
rved
not
obse
rved
not
obse
rved
not
obse
rved
not
obse
rved
not
obse
rved
not
obse
rved
not
obse
rved
21
11
11
01
1
05
1015
2025
3035
40
+r
5%+
5%r
rr
r
r
+r
5%+
5%r
rr
11
11
11
11
1
Tab
le 5
.1.2
-8 (
1) R
esu
lt o
f tr
anse
ct s
urv
ey (
S3T
3)

82
Dom
inan
t Ben
thos
Dis
tanc
e on
the
sur
bey
line
(m
)
№Sp
ecie
s \C
over
age
of B
enth
os
1D
EMO
SPO
NG
IAE
2Tr
idac
na c
roce
a
3O
PHIU
RO
IDEA
4P
aras
alen
a gr
atio
sa v
ar. b
onin
ensi
s
Num
ber o
f Spe
cies
note
s +
:<5 %
, r:<
1 %
Dep
th,S
ubst
ratu
m
SN:S
and,
RK
:Roc
k, S
T:S
tone
, G:G
rave
l
05
1015
2025
3035
40
r0%
r0%
0%+
0%+
r
r+
r
r+
r
rr
20
r
2530
20
20
0
0.45
0.45
21
Dis
tanc
e on
the
sur
bey
line
(m
)0
510
1520
RK
RK
3540
Dep
th(m
)0.
350.
350.
450.
250.
45
RK
RK
0.45
0.35
Subs
trat
umR
KR
KR
KR
KR
K
Tab
le 5
.1.2
-8 (
2) R
esu
lt o
f tr
anse
ct s
urv
ey (
S3T
3)

83
Cor
alD
ista
nce
on th
e su
rvey
line
(m
)
Cov
erag
e of
Cor
al (
live
s)
Cov
erag
e of
Cor
al (
dead
)
Ble
achi
ng
Dis
turb
ance
№Sp
ecie
sC
over
age
Num
ber
ofco
loni
esC
over
age
Num
ber
ofco
loni
esC
over
age
Num
ber
ofco
loni
esC
over
age
Num
ber
ofco
loni
esC
over
age
Num
ber
ofco
loni
esC
over
age
Num
ber
ofco
loni
esC
over
age
Num
ber
ofco
loni
esC
over
age
Num
ber
ofco
loni
esC
over
age
Num
ber
ofco
loni
es1
Poc
illo
pora
dam
icor
nis
5%1
2P
ocil
lopo
ra m
eand
rina
15%
13
Styl
opho
ra p
isti
llat
ar
14
Mon
tipo
ra s
p.(a
rbor
esce
nt)
+1
5%3
r1
20%
1230
%11
5M
onti
pora
sp.
(enc
rust
ing)
+2
5%8
6A
crop
ora
form
osa
5%1
10%
87
Acr
opor
a ac
umin
ata
r2
8A
crop
ora
pulc
hra
+5
9A
crop
ora
else
yi10
%5
10A
crop
ora
sp.
(arb
ores
cent
)+
2+
95%
210
%22
+1
r4
10%
411
Por
ites
aus
tral
iens
is15
%1
25%
1512
Por
ites
lute
ar
215
%33
+1
+1
20%
1230
%10
r1
13P
orit
es r
usr
114
Psa
mm
ocor
a co
ntig
ua5%
1r
115
Pav
ona
veno
sa+
216
Lept
astr
ea p
urpu
rea
r1
Num
ber
of S
peci
esno
tes
+:
<5%
,r:
<1%
<B
leac
hing
>
0:<
1%(
not o
bser
ved
or r
are)
1:1-
10%
(ra
re, b
ut r
emar
kabl
e)2:
10-5
0%(
blea
chie
d is
ave
rage
.)3:
50-9
0%(
all
of c
olni
es a
re b
leac
hed)
4:>
90%
(he
alth
y co
lone
is a
re r
are.
all
ove
r th
e re
ef is
look
s w
hiti
sh.)
<C
oral
pre
dati
on b
y D
rupe
lla
spp
.>0:
not o
bsev
ed f
eed
mar
k1:
feed
mar
k ob
serv
ed b
ut s
trik
ingl
y2:
feed
mar
k ob
serv
ed h
ere
and
ther
e3:
feed
mar
k ob
serv
ed s
trik
ingl
y4:
dead
cor
al c
olon
y ob
serv
ed s
trik
ingl
y. D
rupe
lla
are
her
e an
d th
ere.
not
obse
rved
32
55
64
44
3
Pre
dati
ng d
amag
eP
reda
ting
dam
age
Pre
dati
ng d
amag
eP
reda
ting
dam
age
not
obse
rved
not
obse
rved
not
obse
rved
Pre
dati
ng d
amag
e
0%no
t ob
serv
edno
t ob
serv
edno
t ob
serv
edno
t ob
serv
edno
t ob
serv
edno
t ob
serv
edno
t ob
serv
edno
t ob
serv
edno
t ob
serv
ed
rr
r+
0%0%
0%5%
40+
20%
+20
%50
%50
%45
%70
%20
%20
2530
350
510
15
Tab
le 5
.1.2
-9 (
1) R
esu
lt o
f tr
anse
ct s
urv
ey (
S4T
2)

84
Dom
inan
t Arg
aeD
ista
nce
on t
he s
urbe
y li
ne (
m)
№Sp
ecie
s \C
over
age
of A
rgae
1M
ELO
BES
IOID
EAE
2H
ypne
a pa
nnos
a
3PE
YSS
ON
NEL
IAC
EAE
4C
ERA
MIA
CEA
E
5R
HO
DO
PHY
CEA
E
6Tu
rbin
aria
orn
ata
7H
alim
eda
sp. Num
ber o
f Spe
cies
note
s +
:<5 %
, r:
<1 %
Maj
or B
enth
osD
ista
nce
on t
he s
urbe
y li
ne (
m)
№Sp
ecie
s \C
over
age
of B
enth
os
1D
rupe
lla
conu
s
2M
alle
us r
egul
a
3Tr
idac
na c
roce
a
4A
NO
MU
RA
5O
PHIU
RO
IDEA
6D
iade
ma
savi
gnyi
7E
chin
omet
ra m
atha
ei
8P
aras
alen
a gr
atio
sa v
ar. b
onin
ensi
s
9A
SCID
IAC
EA Num
ber o
f Spe
cies
note
s +
:<5 %
, r:
<1 %
Dep
th,S
ubst
ratu
m
SN:
Sand
, RK
:Roc
k, S
T:S
tone
, G:G
rave
l
05
1015
2025
3035
40
10%
25%
15%
30%
20%
35%
20%
15%
40%
10%
20%
10%
25%
15%
30%
20%
15%
35%
++
++
+5%
+
+
+
12
33
22
21
2
05
1015
2025
3035
40
+r
r+
+r
rr
r
+r
rr
r
rr
r
+r
rr r
rr
r r
rr
r
31
13
42
22
2
Dis
tanc
e on
the
sur
bey
line
(m
)0
510
1520
2530
3540
Dep
th(m
)0.
500.
000.
300.
100.
00
Subs
trat
umSN
,GR
KR
K,G
GG
GG
GG
0.10
0.00
0.00
0.00
Tab
le 5
.1.2
-9 (
2) R
esu
lt o
f tr
anse
ct s
urv
ey (
S4T
2)
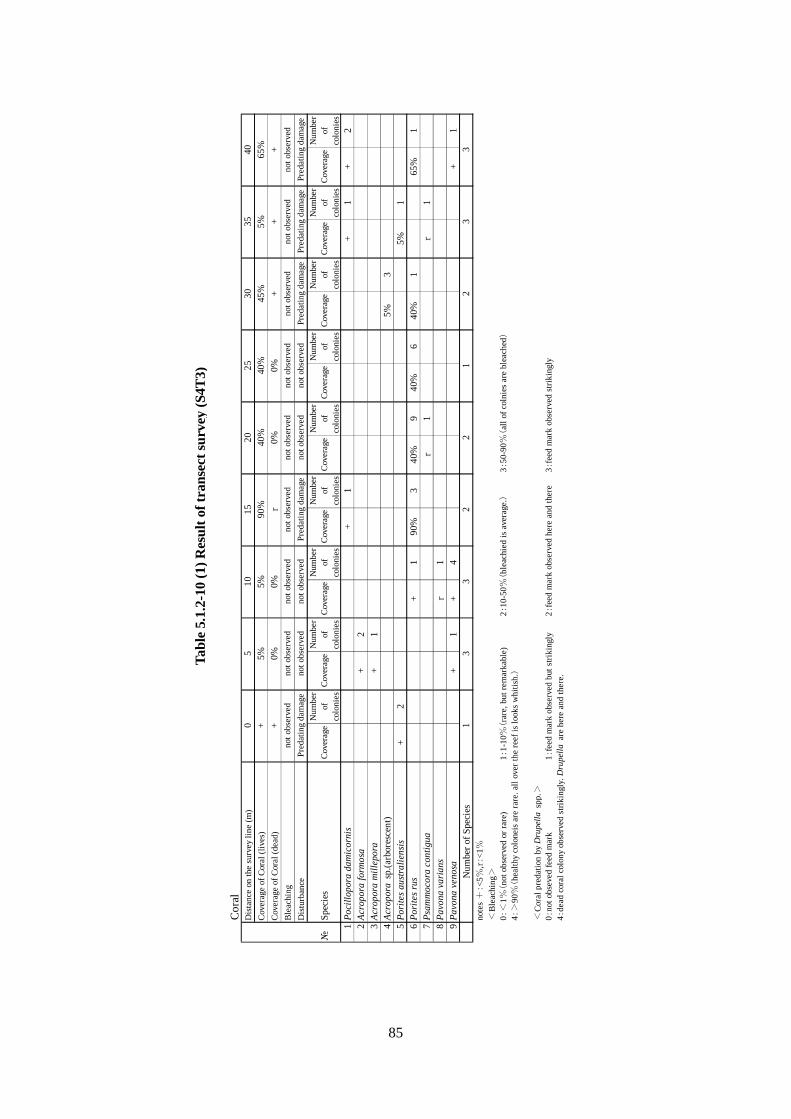
85
Cor
alD
ista
nce
on th
e su
rvey
line
(m
)
Cov
erag
e of
Cor
al (
live
s)
Cov
erag
e of
Cor
al (
dead
)
Ble
achi
ng
Dis
turb
ance
№S
peci
esC
over
age
Num
ber
ofco
loni
esC
over
age
Num
ber
ofco
loni
esC
over
age
Num
ber
ofco
loni
esC
over
age
Num
ber
ofco
loni
esC
over
age
Num
ber
ofco
loni
esC
over
age
Num
ber
ofco
loni
esC
over
age
Num
ber
ofco
loni
esC
over
age
Num
ber
ofco
loni
esC
over
age
Num
ber
ofco
loni
es1
Poc
illo
pora
dam
icor
nis
+1
+1
+2
2A
crop
ora
form
osa
+2
3A
crop
ora
mil
lepo
ra+
14
Acr
opor
a s
p.(a
rbor
esce
nt)
5%3
5P
orit
es a
ustr
alie
nsis
+2
5%1
6P
orit
es r
us+
190
%3
40%
940
%6
40%
165
%1
7P
sam
moc
ora
cont
igua
r1
r1
8P
avon
a va
rian
sr
19
Pav
ona
veno
sa+
1+
4+
1N
umbe
r of
Spe
cies
note
s +
:<5
%,r
:<1%
<B
leac
hing
>
0:<
1%(n
ot o
bser
ved
or r
are)
1:1-
10%
(ra
re, b
ut r
emar
kabl
e)2:
10-5
0%(b
leac
hied
is
aver
age.
)3:
50-9
0%(
all
of c
olni
es a
re b
leac
hed)
4:>
90%
(he
alth
y co
lone
is a
re r
are.
all
ove
r th
e re
ef i
s lo
oks
whi
tish
.)
<C
oral
pre
dati
on b
y D
rupe
lla
spp
.>0 :
not o
bsev
ed f
eed
mar
k1 :
feed
mar
k ob
serv
ed b
ut s
trik
ingl
y2 :
feed
mar
k ob
serv
ed h
ere
and
ther
e3 :
feed
mar
k ob
serv
ed s
trik
ingl
y4 :
dead
cor
al c
olon
y ob
serv
ed s
trik
ingl
y. D
rupe
lla
are
her
e an
d th
ere.
Pred
atin
g da
mag
e
13
32
21
23
3
not o
bser
ved
not o
bser
ved
Pred
atin
g da
mag
ePr
edat
ing
dam
age
Pre
dati
ng d
amag
eno
t obs
erve
dno
t obs
erve
dP
reda
ting
dam
age
+no
t ob
serv
edno
t obs
erve
dno
t obs
erve
dno
t obs
erve
dno
t obs
erve
dno
t obs
erve
dno
t obs
erve
dno
t obs
erve
dno
t ob
serv
ed
0%0%
++
+0%
0%r
40+
5%5%
90%
40%
40%
45%
5%65
%20
2530
350
510
15
Tab
le 5
.1.2
-10
(1)
Res
ult
of
tran
sect
su
rvey
(S4
T3)

86
Dom
inan
t Arg
aeD
ista
nce
on t
he s
urbe
y li
ne (
m)
№Sp
ecie
s \C
over
age
of A
rgae
1M
ELO
BES
IOID
EAE
2H
ypne
a pa
nno
sa
3PE
YSS
ON
NEL
IAC
EAE
4G
elid
iops
is s
p.
5C
ERA
MIA
CEA
E
6B
oodl
ea c
oac
ta Num
ber o
f Spe
cies
note
s +
:<
5 %, r
:<
1 %
Dom
inan
t Ben
thos
Dis
tanc
e on
the
sur
bey
line
(m
)
№Sp
ecie
s \C
over
age
of B
enth
os
1Sa
rcop
hyto
n s
p.
2E
ntac
mae
a ac
tino
stol
oid
es s
ensu
3D
rup
ella
con
us
4M
alle
us
regu
la
5A
NO
MU
RA
6P
aras
ale
na g
rati
osa
var.
bo
nin
ensi
s
7A
SC
IDIA
CEA
Num
ber o
f Spe
cies
note
s +
:<
5 %, r
:<
1 %
Dep
th,S
ubst
ratu
m
SN:
Sand
, RK
:Roc
k, S
T:S
tone
, G:G
rave
l
05
1015
2025
3035
40
+40
%20
%5%
20%
30%
+25
%25
%
+20
%+
15%
+20
%+
5%
++
++
+
35%
25%
25%
12
22
22
12
2
05
1015
2025
3035
40
0%r
0%r
0%r
++
10%
r
10%
r+
+
r
r r
r
25
01
01
01
0.75
32
1
Dis
tanc
e on
the
sur
bey
line
(m
)0
510
1520
G,S
N
3035
40
Dep
th(m
)1.
150.
650.
350.
250.
75
Subs
trat
umSN
,GR
K,G
RK
,GG
RK
,GG
,SN
G,S
NG
0.55
0.45
0.05
Tab
le 5
.1.2
-10
(2)
Res
ult
of
tran
sect
su
rvey
(S4
T3)

87
Cor
alD
ista
nce
on t
he s
urve
y li
ne (
m)
Cov
erag
e of
Cor
al (
lives
)
Cov
erag
e of
Cor
al (
dead
)
Ble
achi
ng
Dis
turb
ance
№Sp
ecie
sC
over
age
Num
ber
ofco
loni
esC
over
age
Num
ber
ofco
loni
esC
over
age
Num
ber
ofco
loni
esC
over
age
Num
ber
ofco
loni
esC
over
age
Num
ber
ofco
loni
esC
over
age
Num
ber
ofco
loni
esC
over
age
Num
ber
ofco
loni
esC
over
age
Num
ber
ofco
loni
esC
over
age
Num
ber
ofco
loni
es
1P
ocil
lopo
ra d
amic
orni
sr
1
2M
onti
pora
info
rmis
r1
3P
orit
es a
ustr
alie
nsis
+1
+1
+1
+2
4P
orit
es s
p. (d
igi ta
ted
)30
%2
45%
235
%2
5%1
5P
sam
moc
ora
cont
igua
r1
Num
ber o
f Spe
cies
note
s +
:<
5 %, r
:<
1 %
<B
leac
hing
>
0 :<
1 %(no
t ob
serv
ed o
r ra
re)
1 :1-
10%
(ra
re, b
ut r
emar
kabl
e)2 :
10-5
0 %(b
leac
hied
is a
vera
ge. )
3 :50
-90 %
(al
l of
coln
ies
are
blea
ched
)
4 :>
90%
(he
alth
y c
olon
eis
are
rare
. all
over
the
ree
f is
look
s w
hiti
sh. )
Dom
inan
t Arg
aeD
ista
nce
on t
he s
urbe
y li
ne (
m)
№Sp
ecie
s \C
over
age
of A
rgae
1M
ELO
BES
IOID
EAE
2PE
YSS
ON
NEL
IAC
EAE
3C
ERA
MIA
CEA
E
4R
HO
DO
PHY
CEA
E
Num
ber o
f Spe
cies
note
s +
:<
5 %, r
:<
1 %
05
1015
2025
3035
40
30%
45%
0%0%
++
35%
5%0%
0%0%
0%0%
0%0%
0%0%
0%
not
obse
rved
not
obse
rved
not
obse
rved
not
obse
rved
not
obse
rved
not
obse
rved
not
obse
rved
not
obse
rved
not
obse
rved
not
obse
rved
not
obse
rved
not
obse
rved
not
obse
rved
not
obse
rved
not
obse
rved
not
obse
rved
not
obse
rved
not
obse
rved
22
00
21
22
0
05
1015
2025
3035
40
++
+r
rr
10%
r+
r+
+
++
++
r
rr
r
21
11
11
21
1
Tab
le 5
.1.2
-11
(1)
Res
ult
of
tran
sect
su
rvey
(S4
T4)

88
Dom
inan
t Ben
thos
Dis
tanc
e on
the
sur
bey
line
(m
)
№Sp
ecie
s \C
over
age
of B
enth
os
1Sa
rcop
hyto
n s
p.
2C
hic
oreu
s sp
.
3A
RC
IDA
E
4M
alle
us r
egul
a
5O
STR
EID
AE
6A
NO
MU
RA
7D
iade
ma
savi
gnyi
8A
SCID
IAC
EA(C
OLO
NY
)
9So
ftco
ral N
umbe
r of S
peci
es
note
s +
:<
5 %, r
:<
1 %
Dep
th,S
ubst
ratu
m
SN:S
and,
RK
:Roc
k, S
T:S
tone
, G:G
rave
l
05
1015
2025
3035
40
10%
20%
0%95
%r
0%+
+0%
95%
r r
r
r
r
20%
+
r
10%
25
21
01
10
0.80
32
0
Dis
tanc
e on
the
sur
bey
line
(m
)0
510
1520
SN,G
3035
40D
epth
(m
)0.
500.
400.
700.
600.
90
Subs
trat
umSN
,GG
,SN
SN,G
SN,G
SN,G
SN,G
SN,G
SN,G
0.90
0.90
0.70
Tab
le 5
.1.2
-11
(2)
Res
ult
of
tran
sect
su
rvey
(S4
T4)

89
0m
5m
10m
15m
20m
25m
Photo. 5.1.2-5 (1) Quadrats on Transect S1T4

90
30m
35m
40m
Photo 5.1.2-5 (2) Quadrats on Transect S1T4

91
0m
5m
10m
15m
20m
25m
Photo 5.1.2-6 (1) Quadrats on Transect S2T1

92
30m
35m
40m
Photo 5.1.2-6 (2) Quadrats on Transect S2T1
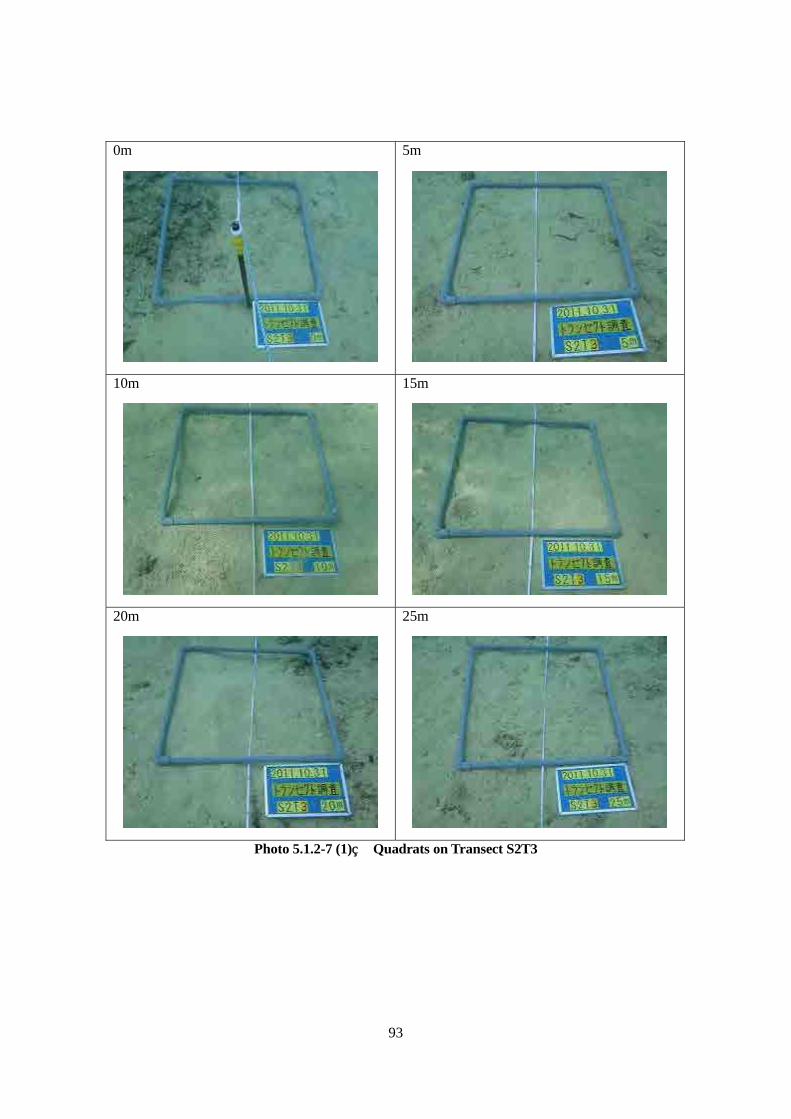
93
0m
5m
10m
15m
20m
25m
Photo 5.1.2-7 (1) Quadrats on Transect S2T3

94
30m
35m
40m
Photo 5.1.2-7 (2) Quadrats on Transect S2T3

95
0m
5m
10m
15m
20m
25m
Photo 5.1.2-8 (1) Quadrats on Transect S3T1

96
30m
35m
40m
Photo 5.1.2-8 (2) Quadrats on Transect S3T1
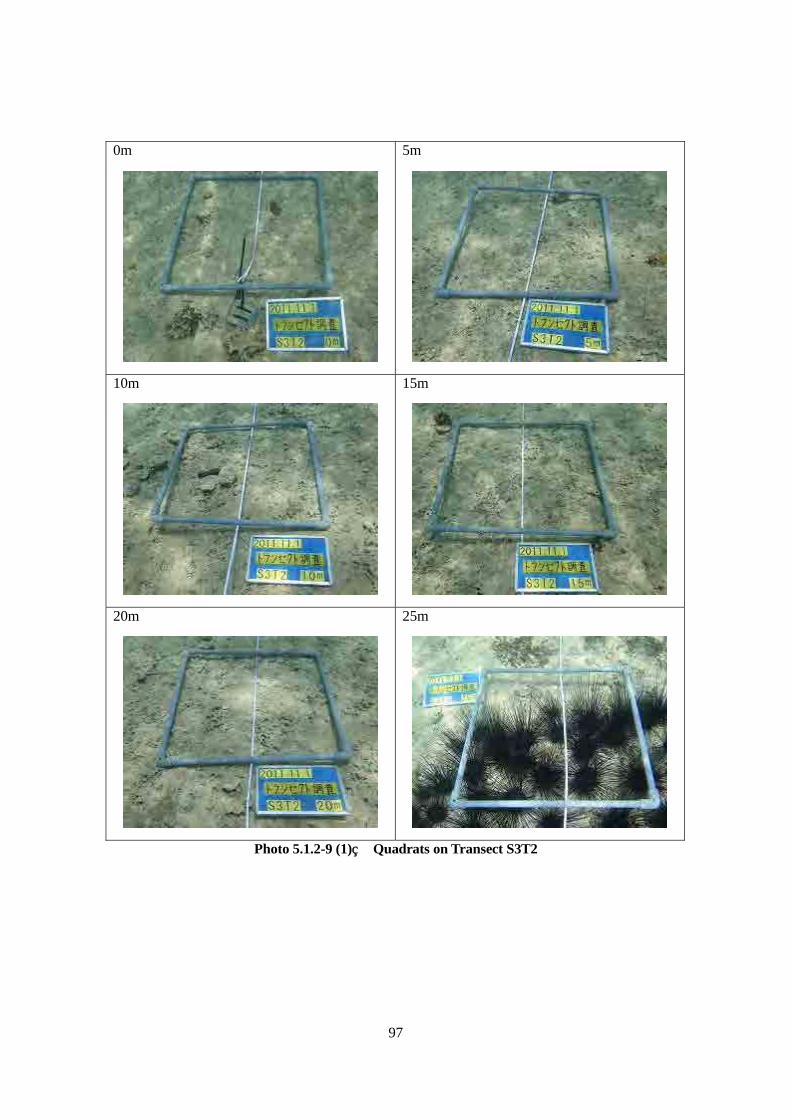
97
0m
5m
10m
15m
20m
25m
Photo 5.1.2-9 (1) Quadrats on Transect S3T2

98
30m
35m
40m
Photo 5.1.2-9 (2) Quadrats on Transect S3T2
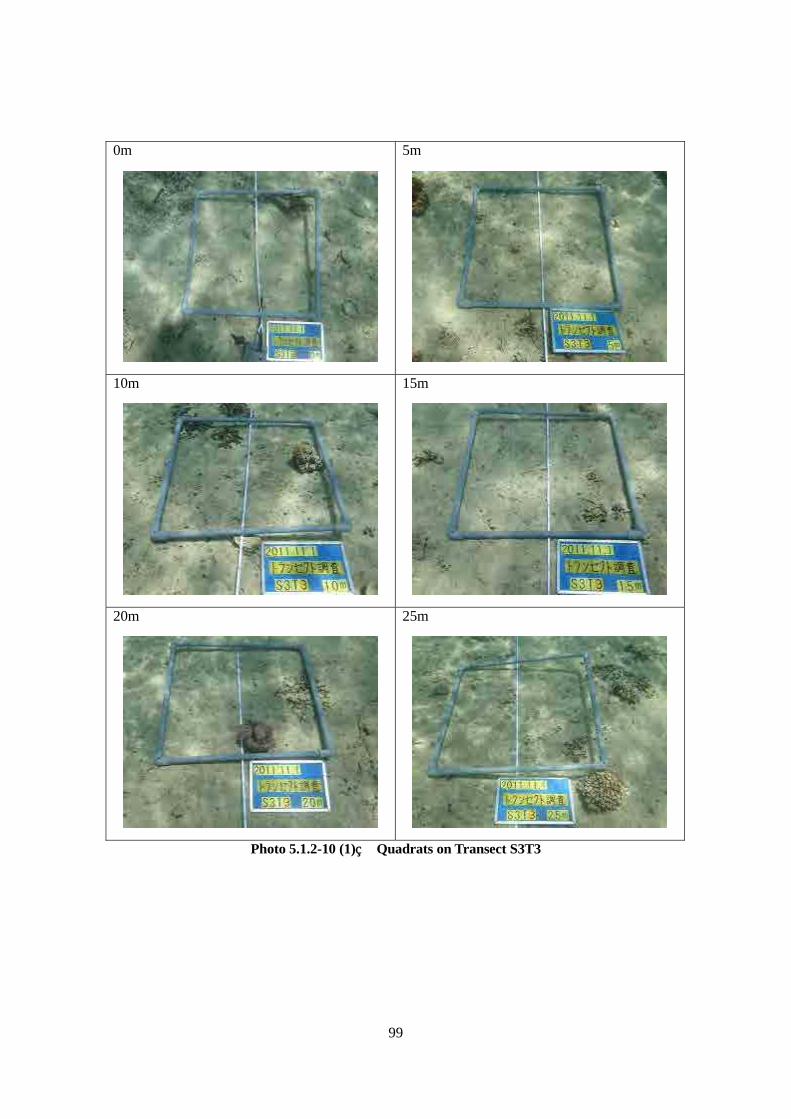
99
0m
5m
10m
15m
20m
25m
Photo 5.1.2-10 (1) Quadrats on Transect S3T3

100
30m
35m
40m
Photo 5.1.2-10 (2) Quadrats on Transect S3T3

101
0m
5m
10m
15m
20m
25m
Photo 5.1.2-11 (1) Quadrats on Transect S4T2

102
30m
35m
40m
Photo 5.1.2-11 (2) Quadrats on Transect S4T2

103
0m
5m
10m
15m
20m
25m
Photo 5.1.2-12 (1) Quadrats on Transect S4T3

104
30m
35m
40m
Photo 5.1.2-12 (2) Quadrats on Transect S4T3

105
0m
5m
10m
15m
20m
25m
Photo 5.1.2-13 (1) Quadrats on Transect S4T4

106
30m
35m
40m
Photo 5.1.2-13 (2) Quadrats on Transect S4T4

107
5.1.3. Survey of Coral Habitat Environment (1) Objective In order to develop a long-term monitoring plan, environmental conditions such as water temperature, salinity and turbidity in the coral distribution area within Port Vila Harbor were surveyed to obtain baseline data for monitoring.
(2) Method Survey points were established within two coral habitats near the Star Wharf and at the mouth of the bay (Figure 5.1.3-1, Table 5.1.3-1). From October 20 to November 15, 2011, data loggers (manufactured by JFE Advantech Co.) were installed on the ocean floor at each survey point (Photo 5.1.3-2) to record turbidity every hour, and temperature and salinity every 10 minutes.
St.Q1
St.Q2
N
0 500250
Meters
0 500
Meters
250
Fig. 5.1.3-1 Location of Survey Points on Coral Habitat Environment

108
Table 5.1.3-1 coordinate of Study sites
StudysitesSt.Q1 S 17°44′02.1″ E 168°18′03.8″St.Q2 S 17°45′08.9″ E 168°18′22.1″
Latitude/Longitude
Photo 5.1.3-1 Installing data loggers
St.Q1
St.Q2
Photo 5.1.3-2 Data loggers in study sites

109
(3) Results Turbidity, water temperature and salinity data between October 26 and November 12, 2011 are shown in Figure 5.1.3-2. During the survey period, the average turbidity was 0.72 at St. Q1 and 0.60 at St. Q2: both were low with no significant difference between the two survey points. Average water temperature was 26.9 at St. Q1 and 26.8 degree Celsius. Salinity was 34.8 at both St. Q1 and Q2.
【St. Q1】
24
28
32
36
0
5
10
15
20
25
30
35
10/26 10/27 10/28 10/29 10/30 10/31 11/1 11/2 11/3
水温
・塩
分
濁度
濁度(ppm) 水温(℃) 塩分
24
28
32
36
0
5
10
15
20
25
30
35
11/3 11/4 11/5 11/6 11/7 11/8 11/9 11/10 11/11 11/12 11/13
Wat
er te
mpe
ratu
re ・
Salin
ity
Turb
idit
y
Turbidity (ppm) Water temperature (℃) Salinity
【St. Q2】
24
28
32
36
0
5
10
15
20
25
30
35
10/26 10/27 10/28 10/29 10/30 10/31 11/1 11/2 11/3
水温
・塩
分
濁度
濁度(ppm) 水温(℃) 塩分
24
28
32
36
0
5
10
15
20
25
30
35
11/3 11/4 11/5 11/6 11/7 11/8 11/9 11/10 11/11 11/12 11/13
Wat
er te
mpe
ratu
re ・
Salin
ity
Turb
idit
y
Turbidity (ppm) Water temperature (℃) Salinity
Figure 5.1.3-2 Turbidity, Water Temperature and Salinity Data
(October 26 – November 12, 2011)
Turbidity (ppm)
Water Temp (C)
Salinity
Tur
bidi
ty
Wat
er T
empe
ratu
re
Sal
inity
Turbidity (ppm)
Water Temp (C)
Salinity
Tur
bidi
ty
Wat
er T
empe
ratu
re
Sal
inity

110
5.1.4 Distribution Survey of Corals to be Relocated (1) Objective Some large colonies of massive type Porites and Porites cylindrica distribute in the proposed landfill area. Especially, high coverage colony of the latter coral presents as rare one in the Port Vila Bay where shallow bottom that the one prefers is limited. Therefore, both valuable corals should be relocated to adequate place. Suitable relocation of those corals will keep their growth, reproduction and habitat and contribute reef conservation in the Port Vila Bay. To study the distribution of massive type Porites and other corals that are planned to be relocated as a measure to mitigate the impacts of the landfill project, detailed surveys were conducted on the conditions in the corals in the proposed project area and its surrounding coral habitats. Surveys were also conducted to understand the environmental conditions at a candidate relocation site in the water area west of Iririki Island, which is in close to the project site in both proximity and in environmental conditions. The senior marine biologist at the Vanuatu’s Department of Fisheries was also of the same opinion concerning the suitability of the area west of Iririki Island as a candidate relocation site. (2) Method From October 20 to November 15, 2011, survey was conducted at the proposed project site and the surrounding coral habitat subject to relocation (Fig. 5.1.4-1), as well as at the candidate relocation site on the west side of Iririki Island (Fig. 5.1.4-2). At the current coral habitat, the major coral species were observed for population, colony size, and their locations, based on the results of the coral reef distribution map survey conducted at the proposed project site and the surrounding areas. Habitat water depth and substrate were also surveyed. At the candidate relocation site, 20-minute diving surveys were conducted to observe the coral species and coverage, coral-eating animals and diseases that affect corals. Habitat water depth and substrate were also surveyed.

111
0 200100
Meters
0 200100
Meters
N
Fig. 5.1.4-1 Study area of coral distribution on relocation
N
0 500 250
Meters
0 500
Meters
250
Fig. 5.1.4-2 Candidate site of coral relocation

112
Photo 5.1.4-1 Survey of coral distribution on relocation
(3) Results
(a) Survey of the Current Habitat
The coral colonies at the current habitat were grouped into the following five areas, A-E, inhabiting water depths of between 1.5 and 2.1 m (Tables 5.1.4-1, Table5.1.4-2, Fig. 5.1.4-3). A: Genus Porites (massive type) community. One colony of 3m, 5 colonies of 2 m to
< 3 m, 19 colonies of 1 m to < 2 m, and 97 colonies of < 1 m were observed. B: Genus Porites (massive type) community. Five colonies of 1 m to < 2 m were
observed. C: Porites cylindrica community. Five coral colonies of approximately 4 m2 were
observed. D: Genus Porites (massive type) community. Three colonies of 2 m to < 3 m, 9 colonies
of 1 m to < 2 m, and 85 colonies of < 1m were observed. E: Psammocora contigua community. A colony of some 310 ㎡ was observed. The substrate in this area consisted mainly of sand and rock. Many of the corals were not attached to the base. No coral-eating animals or coral diseases were observed in this area. (b) Survey of the Candidate Relocation Site
The dominant species observed in the current habitat, Genus Porites (massive type), Porites cylindrica and Psammocora contigua, were also found at the candidate relocation site (Table 5.1.4-3). Other conditions are also similar to the current habitat: the substrate is primarily bedrock and sand, and water depth is 2.0 m. There were no coral-eating animals or coral diseases in the surrounding waters.
It is considered that there is no risk of genetic disturbance, because the site is inside a pouch-shaped bay, and is only 1 km away from the current habitat.

113
Porites sp. (massive)
Porites sp. (massive)
Porites cylindrica
Psammocora contigua
Photo 5.1.4-2 Dominant coral species in the predicted reclamation and its adjacent area
Table 5.1.4-1 Number of colony in the communities dominated by Porites sp.
Distribution area A B D
Dominant speciesPorites sp.(massive)
Porites sp.(massive)
Porites sp.(massive)
Colony size <1m 97 85
1~2m 19 5 9
2~3m 5 3
>3m 1
Number of colonies 122 5 97
Table 5.1.4-2 Number of colony in the communities dominated by other than Porites sp.
Distribution area C E
Dominant speciesPorites
cylindricaPsammocora
contigua
Community size About 20㎡ About 310㎡

114
0 200100
Meters
0 200100
Meters
N
A
E D
B
C
Fig. 5.1.4-3 Coral communities in the predicted reclamation and its adjacent area
Table 5.1.4-3 Corals occurred in candidate site for relocation
№ Coverage of Corals +1 Acropora gemmifera r2 Acropora nasuta r3 Astreopora gracilis r4 Porites australiensis +5 Porites lutea +6 Porites cylindrica r7 Psammocora contigua r8 Herpolitha limax r9 Lobophyllia hemprichii r
Number of Species 9notes +:<5%、r:<1%

115
Porites sp. (massive)
Porites sp. (massive)
Porites cylindrica
Psammocora contigua
Photo 5.1.4-3 Dominant coral species in candidate site for relocation

Preparatory Study for the Project on International Multi Modal Port at Star Wharf in Port Vila (Environmental Study) FINAL REPORT
116
5.2 Marine Environment Survey
5.2.1 Depth sounding
(1) Objective
For the purpose of obtaining additional bottom depth data and improving accuracy of analysis with the numerical models, shallow sea area in southern part of Iririki Island were sounded.
(2)Method
Survey was carried out at 30 points from October 21 to November 15, 2011 using line and lead (Fig.5.2.1-1, Table 5.2.1-1). Data was compensated by tidal data and depth from datum level was calculated (Fig.5.2.1-2).
N
0 500250
Meters
0 500
Meters
250
123
4
567
8
9
1011
12
13
1415
161718
19
202122
23
2425
26
2728
2930
:調査地点
0 10050
Meters
0 10050
Meters
:Study site
Fig. 5.2.1-1 Study sites for sounding

Preparatory Study for the Project on International Multi Modal Port at Star Wharf in Port Vila (Environmental Study) FINAL REPORT
117
Table 5.2.1-1 Coordinate of Study sites
Studysites
1 S 17°45′00.0″ E 168°18′29.0″2 S 17°45′00.0″ E 168°18′28.0″3 S 17°45′00.0″ E 168°18′27.0″4 S 17°44′59.0″ E 168°18′26.0″5 S 17°45′02.4″ E 168°18′29.1″6 S 17°45′02.5″ E 168°18′28.1″7 S 17°45′02.1″ E 168°18′27.1″8 S 17°45′01.8″ E 168°18′26.1″9 S 17°45′04.5″ E 168°18′28.2″
10 S 17°45′03.6″ E 168°18′27.1″11 S 17°45′02.6″ E 168°18′26.1″12 S 17°45′02.2″ E 168°18′25.6″13 S 17°45′06.0″ E 168°18′28.1″14 S 17°45′05.0″ E 168°18′27.1″15 S 17°45′04.5″ E 168°18′26.0″16 S 17°45′08.5″ E 168°18′27.3″17 S 17°45′08.3″ E 168°18′26.3″18 S 17°45′08.0″ E 168°18′25.3″19 S 17°45′07.7″ E 168°18′24.3″20 S 17°45′11.1″ E 168°18′26.1″21 S 17°45′11.1″ E 168°18′25.1″22 S 17°45′10.7″ E 168°18′24.1″23 S 17°45′09.4″ E 168°18′26.8″24 S 17°45′08.6″ E 168°18′25.8″25 S 17°45′08.2″ E 168°18′24.8″26 S 17°45′07.1″ E 168°18′27.2″27 S 17°45′06.3″ E 168°18′26.0″28 S 17°45′05.8″ E 168°18′25.0″29 S 17°45′11.5″ E 168°18′25.6″30 S 17°45′11.3″ E 168°18′24.0″
Latitude/Longitude
Fig. 5.2.1-2 Measurement of water depth

Preparatory Study for the Project on International Multi Modal Port at Star Wharf in Port Vila (Environmental Study) FINAL REPORT
118
(3) Result
Surveyed area was as shallow as -1.5 to 0.25m from datum level showing in Table 5.2.1-2.
Table 5.2.1-2 Water depth at study sites
Studysites
Height fromtide datum
(m)1 S 17°45′00.0″ E 168°18′29.0″ +0.252 S 17°45′00.0″ E 168°18′28.0″ +0.153 S 17°45′00.0″ E 168°18′27.0″ -0.054 S 17°44′59.0″ E 168°18′26.0″ -1.005 S 17°45′02.4″ E 168°18′29.1″ -0.606 S 17°45′02.5″ E 168°18′28.1″ +0.057 S 17°45′02.1″ E 168°18′27.1″ -0.108 S 17°45′01.8″ E 168°18′26.1″ -0.459 S 17°45′04.5″ E 168°18′28.2″ -0.25
10 S 17°45′03.6″ E 168°18′27.1″ -0.1511 S 17°45′02.6″ E 168°18′26.1″ -0.2512 S 17°45′02.2″ E 168°18′25.6″ -0.9513 S 17°45′06.0″ E 168°18′28.1″ -1.3014 S 17°45′05.0″ E 168°18′27.1″ -0.0515 S 17°45′04.5″ E 168°18′26.0″ -0.4016 S 17°45′08.5″ E 168°18′27.3″ -1.0517 S 17°45′08.3″ E 168°18′26.3″ -0.2018 S 17°45′08.0″ E 168°18′25.3″ -0.3519 S 17°45′07.7″ E 168°18′24.3″ -0.9020 S 17°45′11.1″ E 168°18′26.1″ -1.5021 S 17°45′11.1″ E 168°18′25.1″ -0.6022 S 17°45′10.7″ E 168°18′24.1″ -0.9523 S 17°45′09.4″ E 168°18′26.8″ -0.4524 S 17°45′08.6″ E 168°18′25.8″ -0.2025 S 17°45′08.2″ E 168°18′24.8″ -0.5526 S 17°45′07.1″ E 168°18′27.2″ -0.3027 S 17°45′06.3″ E 168°18′26.0″ -0.2028 S 17°45′05.8″ E 168°18′25.0″ -1.1029 S 17°45′11.5″ E 168°18′25.6″ -1.1530 S 17°45′11.3″ E 168°18′24.0″ -1.20
Latitude/Longitude

Preparatory Study for the Project on International Multi Modal Port at Star Wharf in Port Vila (Environmental Study) FINAL REPORT
119
5.2.2 Current Survey
(1) Objective
In order to assess the environmental impact to the Star Wharf area due to water movement change, direction and velocity of the current at the mouth of the bay and near the Star Wharf were measured. Measurement in the bay mouth was aimed to understand in and out flow of sea water that is the principal driving force for tidal current in whole bay area.
(2) Method
Self-contained electro-magnetic current meter were deployed in both the bay mouth and head in spring tide (October 26 to 28, 2011), intermediate tide (November 5 to 7, 2011) and neap tide (October 31 to November 2, 2011), respectively for measuring current direction and velocity every ten minutes (Fig. 5.2.2-1, Table 5.2.2-1).
In the bay mouth, the loggers deployed at upper (3.1m in ddep) and bottom layers (19.9m in deep) using underwater buoyancy buoy (Fig. 5.2.2-2). In the bay head, logger was done in bottom layer only because of shallow (2.2m in deep). The logger in the bay head was fixed by a stainless stake (Fig. 5.2.2-2).
St.C1
St.C2
N
0 500250
Meters
0 500
Meters
250
Fig. 5.2.2-1 Location of current survey sites

Preparatory Study for the Project on International Multi Modal Port at Star Wharf in Port Vila (Environmental Study) FINAL REPORT
120
Table 5.2.2-1 Coordinate of survey sites
StudysitesSt.C1 S 17°44′34.5″ E 168°17′33.6″St.C2 S 17°45′12.6″ E 168°18′20.8″
Latitude/Longitude
Fig. 5.2.2-2 (1) Setting up the current meter
Fig. 5.2.2-2 (2) Current meter at St.C1(left: upper layer, right: bottom layer)
Fig. 5.2.2-2 (3) Current meter at St.C2

Preparatory Study for the Project on International Multi Modal Port at Star Wharf in Port Vila (Environmental Study) FINAL REPORT
121
(3) Results
(a) Time series of current velocity
Measured data of current velocities as well as predicted tide of Port Villa Port are plotted as time series.
Figure 5.2.2-3 shows the results in a spring tide period. In the upper layer of St.1 located near the bay mouth, there appears a high frequency that water flows south-westward from the bay to outside. In the lower layer of St.1 on the other hand, eastward currents into the bay can be observed. In St.2 which is located north-east of Star wharf, there are back and forth currents passing through the area between Star wharf and the coral reef stretching southward from Iririki Island.
Figure 5.2.2-4 shows the results in a neap tide period. In the upper layer of St.1, eastward currents flowing into the bay and southward currents of small velocities along the bay mouth can be observed. In the lower layer of St.1, east-west component of the current velocity is larger than north-south component, and the east-west component changes its direction almost every 6 hours. It can be seen that currents in St.2 reverse their direction almost every 12 hours.
Figure 5.2.2-5 shows the results in the intermediate period between the spring and neap tide. In the upper layer of St.1, an event of relatively large velocities of currents toward south-east is observed during a period of 00:00 to 04:00 on November 6th. During the other periods, current velocities at that point are almost small. In the lower layer of St.1, large velocities as seen in the upper layer are not observed and eastward currents into the bay prevail and their velocities are larger in the later part of observation period than the early part. South-eastward currents dominate in St.2 throughout the period.

Preparatory Study for the Project on International Multi Modal Port at Star Wharf in Port Vila (Environmental Study) FINAL REPORT
122
Figure 5.2.2-3 Time series of current vector and predicted tide (spring tide)

Preparatory Study for the Project on International Multi Modal Port at Star Wharf in Port Vila (Environmental Study) FINAL REPORT
123
Figure 5.2.2-4 Time series of current vector and predicted tide (neap tide)

Preparatory Study for the Project on International Multi Modal Port at Star Wharf in Port Vila (Environmental Study) FINAL REPORT
124
Figure 5.2.2-5 Time series of current vector and predicted tide (intermediate tide)

Preparatory Study for the Project on International Multi Modal Port at Star Wharf in Port Vila (Environmental Study) FINAL REPORT
125
(b) One day harmonic analysis of currents
To investigate tidal components of currents, one day harmonic analysis for currents are performed. In the one day harmonic analysis, three components of harmonic constants, namely diurnal (M1), semi-diurnal (M2) and 1/4 diurnal (M4) components are decomposed. Each component is represented by its magnitude and phase. Angular velocities of each component are 15 degree/hour for diurnal, 30 degree/hour for semi-diurnal, and 60 degree/hour for 1/4 diurnal component. North and east components of currents are represented by the following equation.
V(t)=U0+V1cos(σ15t-K1)+V2cos(σ30t-K2) +V4cos(σ60t-K4)
V(t) :velocity at time t(cm/s)
U0 :constant component(cm/s)
V1,2,4 :1,2,and 4 component amplitude of velocity(cm/s)
K1,2,4 :1,2,and 4 component phase of velocity(degree)
Subscripts 1,2,4 dictate M1, M2 and M4 components
σ15 :15 degree/hour
σ30 :30 degree/hour
σ60 :60 degree/hour
t :time (hours)
There are three periods of analysis for the spring, neap and intermediate tides, and they are presented in Table 5.2.2-2. The current data of strong velocities seen in the upper layer at St.C1 during the intermediate tide are excluded from the analysis because they are considered due to an exceptional event.
Table 5.2.2-2 Durations of harmonic analysis
Tide Durations of analysis
Spring 2011/10/27/00:00~10/28/00:00
Neap 2011/11/ 1/00:00~11/ 2/00:00
Intermediate 2011/11/ 6/06:00~11/7/06:00
East and north components of each harmonic constant are converted to tidal current ellipses and they are tabulated in Table 5.2.2-3~Table 5.2.2-5. The current ellipse graphs are shown in Figure 5.2.2-6~Figure 5.2.2-8.
In St.C1 located at the bay mouth, long axis velocities of diurnal and semi-diurnal tides range in 1-5 cm/s. Velocities of semi-diurnal tide are almost same with or slightly larger than those of diurnal tide in the upper layer. On the other hand, velocities of semi-diurnal tide are clearly larger

Preparatory Study for the Project on International Multi Modal Port at Star Wharf in Port Vila (Environmental Study) FINAL REPORT
126
than those of diurnal tide in the lower layer. The directions of long axis of both tides are almost in ENE-SWS. In St.C2, long axis velocities of diurnal and semi-diurnal tides are typically small and range in 1-3 cm/s.
Table 5.2.2-3 Harmonic constants of tidal currents, spring tide
Obs. Date:2011 10/27 00:00 to 2011 10/28 00:00
Station Layer Axis Diurnal Current Semi-Diurnal Current Quarter Diurnal Current Mean Flow
Dir. Vel. Lag Dir. Vel. Lag Dir. Vel. Lag Dir. Vel.
(°) (cm/s) (°) (°) (cm/s) (°) (°) (cm/s) (°) (°) (cm/s)
L 59.4 3.07 244.2 79.0 3.69 135.0 52.8 1.35 205.1
S 149.4 0.02 334.2 169.0 0.82 45.0 142.8 0.11 295.1
L 304.8 1.23 218.0 77.5 4.77 85.5 272.7 0.72 72.2
S 34.8 0.27 308.0 167.5 0.28 175.5 2.7 0.25 342.2
L 298.2 1.38 195.8 294.7 2.28 271.6 274.2 0.62 301.2
S 28.2 0.33 105.8 24.7 0.36 1.6 4.2 0.15 31.2
247.2 2.75
61.1 2.41
151.1 0.62
St.C1
St.C1
St.C2
3.1m
19.9m
2.2m
Table 5.2.2-4 Harmonic constants of tidal currents, neap tide
Obs. Date:2011 11/01 00:00 to 2011 11/02 00:00
Station Layer Axis Diurnal Current Semi-Diurnal Current Quarter Diurnal Current Mean Flow
Dir. Vel. Lag Dir. Vel. Lag Dir. Vel. Lag Dir. Vel.
(°) (cm/s) (°) (°) (cm/s) (°) (°) (cm/s) (°) (°) (cm/s)
L 285.6 1.82 114.4 293.4 3.74 330.1 38.4 0.62 185.3
S 15.6 0.85 24.4 23.4 0.34 240.1 128.4 0.46 275.3
L 72.1 0.83 140.6 77.2 3.06 353.1 275.3 1.44 304.0
S 162.1 0.15 50.6 167.2 0.05 263.1 5.3 0.13 34.0
L 317.0 3.27 119.1 273.1 1.59 311.2 311.8 0.92 201.4
S 47.0 0.57 209.1 3.1 0.45 221.2 41.8 0.55 111.4St.C2 2.2m 38.3 0.26
St.C1 3.1m 119.8 3.64
St.C1 19.9m 47.8 0.13
Table 5.2.2-5 Harmonic constants of tidal currents, intermediate tide
Obs. Date:2011 11/06 06:00 to 2011 11/07 06:00
Station Layer Axis Diurnal Current Semi-Diurnal Current Quarter Diurnal Current Mean Flow
Dir. Vel. Lag Dir. Vel. Lag Dir. Vel. Lag Dir. Vel.
(°) (cm/s) (°) (°) (cm/s) (°) (°) (cm/s) (°) (°) (cm/s)
L 84.8 4.14 166.6 73.5 3.01 108.9 296.4 0.39 87.1
S 174.8 0.63 256.6 163.5 0.13 198.9 26.4 0.19 177.1
L 54.6 0.82 28.3 75.3 4.32 157.9 277.4 1.08 217.9
S 144.6 0.52 298.3 165.3 0.69 247.9 7.4 0.26 307.9
L 313.4 1.42 104.2 311.4 0.92 307.5 331.3 0.20 148.7
S 43.4 0.33 194.2 41.4 0.01 37.5 61.3 0.18 58.7St.C2 2.2m 116.4 3.34
St.C1 3.1m 256.8 2.57
St.C1 19.9m 72.6 5.16
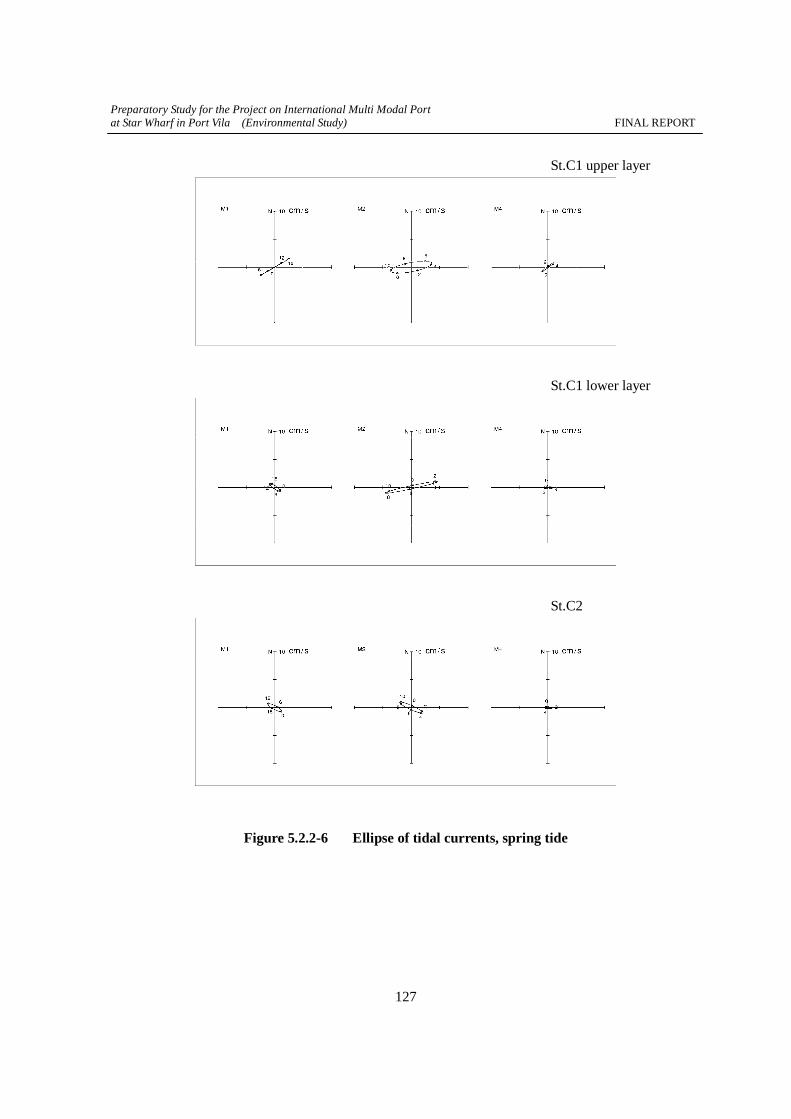
Preparatory Study for the Project on International Multi Modal Port at Star Wharf in Port Vila (Environmental Study) FINAL REPORT
127
St.C1 upper layer
St.C1 lower layer
St.C2
Figure 5.2.2-6 Ellipse of tidal currents, spring tide

Preparatory Study for the Project on International Multi Modal Port at Star Wharf in Port Vila (Environmental Study) FINAL REPORT
128
St.C1 upper layer
St.C1 lower layer
St.C2
Figure 5.2.2-7 Ellipse of tidal currents, neap tide

Preparatory Study for the Project on International Multi Modal Port at Star Wharf in Port Vila (Environmental Study) FINAL REPORT
129
St.C1 upper layer
St.C1 lower layer
St.C2
Figure 5.2.2-8 Ellipse of tidal currents, intermediate tide

Preparatory Study for the Project on International Multi Modal Port at Star Wharf in Port Vila (Environmental Study) FINAL REPORT
130
5.2.3 Survey of water quality and sediment
(1) Objective
In order to utilize the data for predicting and assessing the effect of turbidity by the Star wharf project
and for environmental conservation and monitoring, water temperature, salinity and turbidity were
measured in coral habitat.
(2) Method
Data sampling on water temperature, salinity and turbidity was carried out in 3 sites of the mouth and
head of bays using multi-parameter water quality meter vertically between October 20 and November
15, 2011 (Fig. 5.2.3-1, Table 5.2.3-1). Water sampling was also done simultaneously for analyzing SS
at laboratory.
Sediment samples were collected in 3 sites near Star Wharf for analyzing grain size at laboratory.
Sediment sample in St.S2 mixed with sea water was measured for turbidity and analyzed for SS.
N
0 500250
Meters
0 500
Meters
250
St.W1
St.S1
St.S2
St.S3
St.W2
:Survey of water quality
:Sediment Survey
Fig. 5.2.3-1 Location of current survey
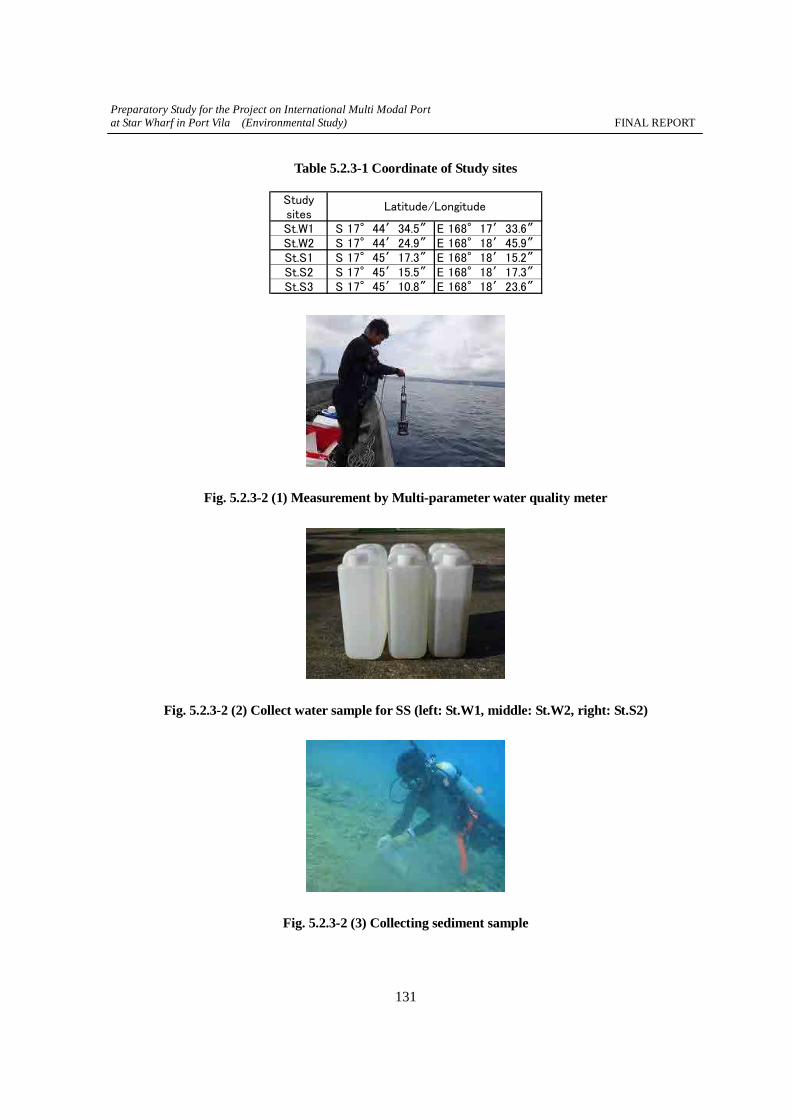
Preparatory Study for the Project on International Multi Modal Port at Star Wharf in Port Vila (Environmental Study) FINAL REPORT
131
Table 5.2.3-1 Coordinate of Study sites
StudysitesSt.W1 S 17°44′34.5″ E 168°17′33.6″St.W2 S 17°44′24.9″ E 168°18′45.9″St.S1 S 17°45′17.3″ E 168°18′15.2″St.S2 S 17°45′15.5″ E 168°18′17.3″St.S3 S 17°45′10.8″ E 168°18′23.6″
Latitude/Longitude
Fig. 5.2.3-2 (1) Measurement by Multi-parameter water quality meter
Fig. 5.2.3-2 (2) Collect water sample for SS (left: St.W1, middle: St.W2, right: St.S2)
Fig. 5.2.3-2 (3) Collecting sediment sample
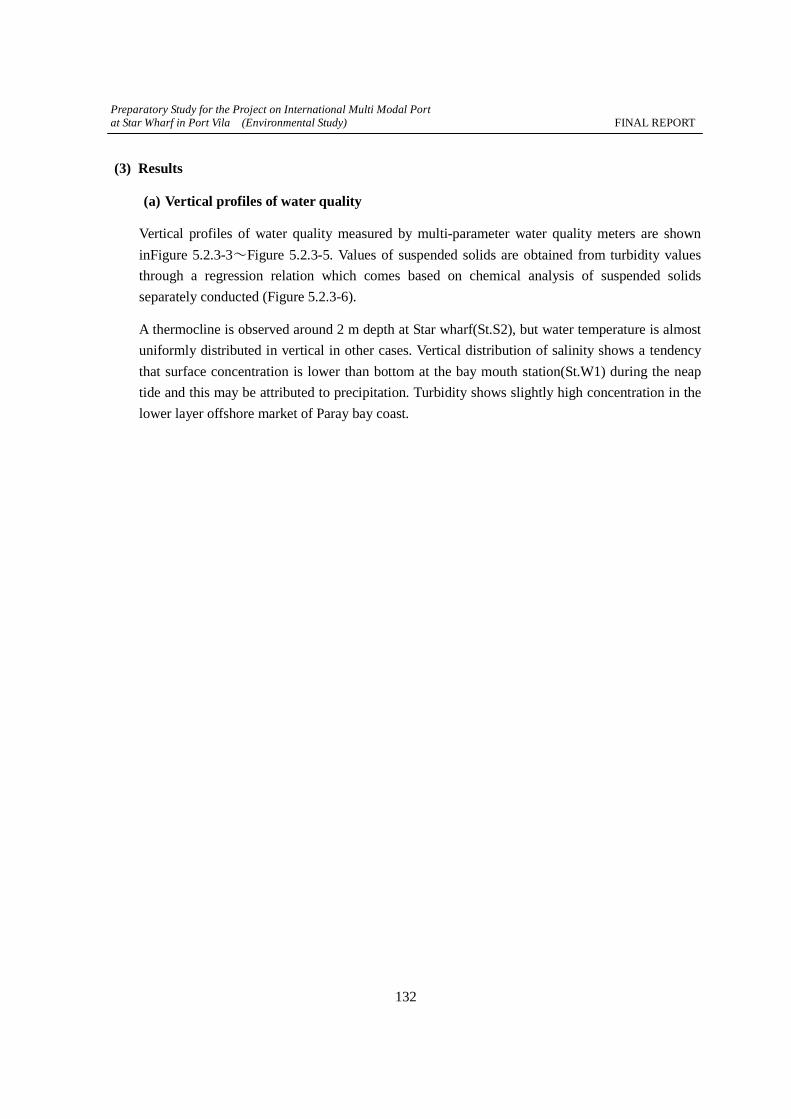
Preparatory Study for the Project on International Multi Modal Port at Star Wharf in Port Vila (Environmental Study) FINAL REPORT
132
(3) Results
(a) Vertical profiles of water quality
Vertical profiles of water quality measured by multi-parameter water quality meters are shown
inFigure 5.2.3-3~Figure 5.2.3-5. Values of suspended solids are obtained from turbidity values
through a regression relation which comes based on chemical analysis of suspended solids
separately conducted (Figure 5.2.3-6).
A thermocline is observed around 2 m depth at Star wharf(St.S2), but water temperature is almost
uniformly distributed in vertical in other cases. Vertical distribution of salinity shows a tendency
that surface concentration is lower than bottom at the bay mouth station(St.W1) during the neap
tide and this may be attributed to precipitation. Turbidity shows slightly high concentration in the
lower layer offshore market of Paray bay coast.

Preparatory Study for the Project on International Multi Modal Port at Star Wharf in Port Vila (Environmental Study) FINAL REPORT
133
0
10
20
30
40
50
20 22 24 26 28 30 32 34 36
Dep
th [m
]
Temperature, Salinity,σt
25 Oct. 2011 St.S2
0
10
20
30
40
50
20 22 24 26 28 30 32 34 36
Dep
th [m
]
Temperature, Salinity,σt
25 Oct. 2011 St.W1
0
10
20
30
40
50
20 22 24 26 28 30 32 34 36
Dep
th [m
]
Temperature, Salinity,σt
25 Oct. 2011 St.W2
0
10
20
30
40
50
20 22 24 26 28 30 32 34 36
Dep
th [m
]
Temperature, Salinity,σt
27 Oct. 2011 St.W1
0
10
20
30
40
50
20 22 24 26 28 30 32 34 36
Dep
th [m
]
Temperature, Salinity,σt
27 Oct. 2011 St.W3
0
10
20
30
40
50
20 22 24 26 28 30 32 34 36
Dep
th [m
]
Temperature, Salinity,σt
28 Oct. 2011 St.W1
Temperature[℃]Salinity [psu]σt
Figure 5.2.3-3 (1) Vertical profiles of Water temperature, salinity andσt spring tide

Preparatory Study for the Project on International Multi Modal Port at Star Wharf in Port Vila (Environmental Study) FINAL REPORT
134
0
10
20
30
40
50
0 2 4 6 8 10
Dep
th [m
]
Turbidity , SS
25 Oct. 2011 St.W1
0
10
20
30
40
50
0 2 4 6 8 10
Dep
th [m
]
Turbidity , SS
25 Oct. 2011 St.W2
0
10
20
30
40
50
0 2 4 6 8 10
Dep
th [m
]
Turbidity , SS
25 Oct. 2011 St.S2
0
10
20
30
40
50
0 2 4 6 8 10
Dep
th [m
]
Turbidity , SS
27 Oct. 2011 St.W1
0
10
20
30
40
50
0 2 4 6 8 10
Dep
th [m
]
Turbidity , SS
27 Oct. 2011 St.W3
0
10
20
30
40
50
0 2 4 6 8 10
Dep
th [m
]
Turbidity , SS
28 Oct. 2011 St.W1
Turbidity [ppm]
SS [mg/L]
Figure 5.2.3-2(2) Vertical profiles of Water turbidity and suspended solids spring tide
suspended solids is calculated through a regression

Preparatory Study for the Project on International Multi Modal Port at Star Wharf in Port Vila (Environmental Study) FINAL REPORT
135
0
10
20
30
40
50
20 22 24 26 28 30 32 34 36
Dep
th [m
]
Temperature, Salinity,σt
31 Oct. 2011 St.W1
0
10
20
30
40
50
20 22 24 26 28 30 32 34 36
Dep
th [m
]
Temperature, Salinity,σt
1 Nov. 2011 St.W1
0
10
20
30
40
50
20 22 24 26 28 30 32 34 36
Dep
th [m
]
Temperature, Salinity,σt
2 Nov. 2011 St.W1
Temperature[℃]Salinity [psu]
σt
Figure 5.2.3-4 (1) Vertical profiles of Water temperature, salinity andσt neap tide
0
10
20
30
40
50
0 2 4 6 8 10
Dep
th [m
]
Turbidity , SS
31 Oct. 2011 St.W1
0
10
20
30
40
50
0 2 4 6 8 10
Dep
th [m
]
Turbidity , SS
1 Nov. 2011 St.W1
0
10
20
30
40
50
0 2 4 6 8 10
Dep
th [m
]
Turbidity , SS
2 Nov. 2011 St.W1
Turbidity [ppm]
SS [mg/L]
Figure 5.2.3-4(2) Vertical profiles of Water turbidity and suspended solids neap tide
suspended solids is calculated through a regression

Preparatory Study for the Project on International Multi Modal Port at Star Wharf in Port Vila (Environmental Study) FINAL REPORT
136
0
10
20
30
40
50
20 22 24 26 28 30 32 34 36D
epth
[m]
Temperature, Salinity,σt
5 Nov. 2011 St.W1
0
10
20
30
40
50
20 22 24 26 28 30 32 34 36
Dep
th [m
]
Temperature, Salinity,σt
7 Nov. 2011 St.W1
Temperature[℃]Salinity [psu]σt
Figure 5.2.3-5 (1) Vertical profiles of Water temperature, salinity andσt intermediate tide
0
10
20
30
40
50
0 2 4 6 8 10
Dep
th [m
]
Turbidity , SS
5 Nov. 2011 St.W1
0
10
20
30
40
50
0 2 4 6 8 10
Dep
th [m
]
Turbidity , SS
7 Nov. 2011 St.W1
Turbidity [ppm]
SS [mg/L]
Figure 5.2.3-5(2) Vertical profiles of Water turbidity and suspended solids intermediate tide
suspended solids is calculated through a regression

Preparatory Study for the Project on International Multi Modal Port at Star Wharf in Port Vila (Environmental Study) FINAL REPORT
137
(b) Chemical analysis of suspended solids
Results of chemical analysis of suspended solids are tabulated in Table 5.2.3-2. Turbidities are
measured in the field at the same time of sea water sampling and the relation between turbidity
and suspended solids is investigated and plotted in Figure 5.2.3-6.
Table 5.2.3-2 Chemical analysis of suspended solids
Station Sample Results [mg/L]
St.W1 Sea water < 1
St.W2 Sea water < 1
St.S2 Mixture of sediment sample and
sea water 479
y = 1.1451x
0
100
200
300
400
500
0 100 200 300 400 500
SS(m
g/L)
Turbidity(ppm)
Figure 5.2.3-6 relation between turbidity and suspended solids

Preparatory Study for the Project on International Multi Modal Port at Star Wharf in Port Vila (Environmental Study) FINAL REPORT
138
(c) Particle size of sediment
Particle size composition of sediment is tabulated in Table 5.2.3-3 and particle size distributions of sediment samples are plotted in Figure 5.2.3-7. Weight compositions of sand are large for all three stations and approach 90% in St.S1 and St.S3. Weight compositions of silt and clay, which are occasionally contributed to turbidity generation, are small in general and range in 1-5%.
Table 5.2.3-3 Particle size composition of sediment
Class (Size range) Weight composition [%]
St.S1 St.S2 St.S3
Gravel (2mm < ) 6.6 34.8 9.4
Sand (0.075mm-2mm) 89.3 62.2 88.8
Silt and clay ( < 0.075mm) 4.1 3.0 1.8
0.0
10.0
20.0
30.0
40.0
50.0
60.0
70.0
80.0
90.0
100.0
0.001 0.01 0.1 1 10 100
Cum
ulat
ive
Fin
er V
olum
e P
erc
ent
(%
)
Particle size (mm)
Figure 5.2.3-7 (1) Particle size distribution St.S1

Preparatory Study for the Project on International Multi Modal Port at Star Wharf in Port Vila (Environmental Study) FINAL REPORT
139
0.0
10.0
20.0
30.0
40.0
50.0
60.0
70.0
80.0
90.0
100.0
0.001 0.01 0.1 1 10 100
Cum
ula
tive F
iner
Volu
me P
erce
nt
(%
)
Particle size (mm)
Figure 5.2.3-7(2) Particle size distribution St.S2
0.0
10.0
20.0
30.0
40.0
50.0
60.0
70.0
80.0
90.0
100.0
0.001 0.01 0.1 1 10 100
Cum
ulat
ive
Fin
er V
olum
e P
erc
ent
(%
)
Particle size (mm)
Figure 5.2.3-7(3) Particle size distribution St.S3

Preparatory Study for the Project on International Multi Modal Port at Star Wharf in Port Vila (Environmental Study) FINAL REPORT
140
5.3 Information Disclosure and Stakeholder Meeting
5.3.1 Information Disclosure
Department of Environmental Protection and Conservation (DEPC) has disclosed the EIA report, which was developed in the Feasibility Study and had not disclosed, at the same time of the stakeholder meeting. The method is as follows:
- It was noted in the newspaper advertisement that copies of the EIA report can be obtained from DEPC.
- Copies of the EIA report were provided to participants if they want in the stakeholder meeting.
5.3.2 The First Stakeholder Meeting
A stakeholder meeting was held on the 24th October, 2011 for public consultation on the EIA report developed as a part of the Feasibility Study.
Prior to the meeting, public announcement was made through a newspaper advertisement to invite any public as well as informing separately to relevant government agencies, province, municipality, chiefs, shipping agencies, water area users (fisheries, oil company, resort, hotel and tourism) and NGO.
In total, 33 people attended the meeting excluding the organizer, presenter, JICA and its study team. The breakdown is shown in the Table 5.3.2-1. ‘The others’ included agents working for another development project in Vatumaru bay, market mamas around the wharf and local radio station.
After a presentation of the project outline by Mr. Jotham Napat, the former Acting Director of Ministry of Infrastructure and Public Utility, Mr. Steve Raaymakers made presentation about the contents of EIA study. After that, questions were answered by Mr. Napat and Mr. Raaymakers as well as Mr. Bo Samuelson, the General Manager of IPDS which operate the terminal. Outline of the question and answer is overviewed as follows. Broad questions were made especially for asking further explanation on the project and the EIA study. Number of the questions was many as shown below. Major questions were about impacts to life environment by the project (impacts to social environment, marine pest incursions, impacts to villages by dredging, oil pollution, infectious disease etc.). They were actively discussed. No questions were raised on impacts to natural environment (corals, conservation of ecosystem etc.). As a result of the discussion, all of the participants seemed to consent and no serious concerns were raised.
There was an opinion that current survey should be conducted which was not done in EIA. To this opinion, it was answered that the current survey would be conducted in this JICA study. Major opinions and answers on environmental impacts or mitigation measures are shown in Table 5.3.2-2.
As a result of this meeting, contents of the project plan and EIA, which were not officially explained to the public so far, were explained. The meeting promoted the understanding by residents and stakeholders through wide range of questions and answers.
(Contents of questions and answers) Q: How is the segregation of services planned between the existing wharf and the new wharf?
A: International cargo ships will mainly use the new terminal at Star Wharf, while the cruise ships will use Main Wharf. Q: Have you consulted with the local community about the project before?
A: Many consultations have been made with Ifira people who may be affected directly by the
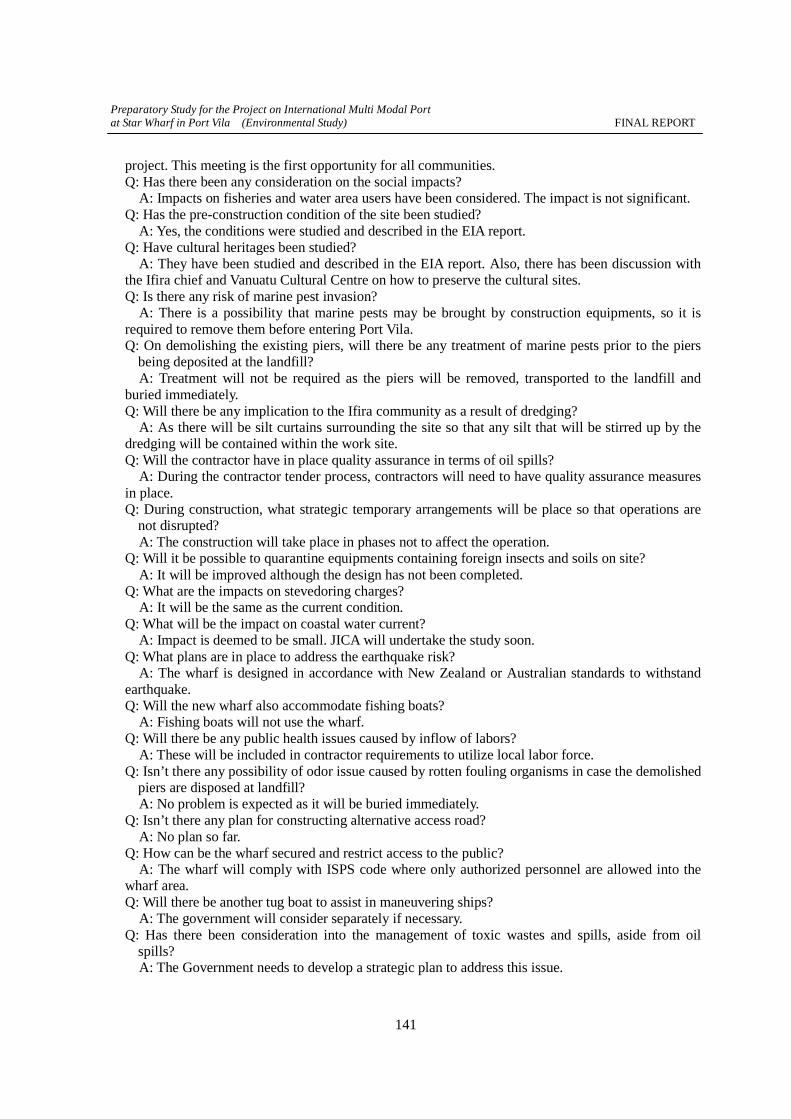
Preparatory Study for the Project on International Multi Modal Port at Star Wharf in Port Vila (Environmental Study) FINAL REPORT
141
project. This meeting is the first opportunity for all communities. Q: Has there been any consideration on the social impacts?
A: Impacts on fisheries and water area users have been considered. The impact is not significant. Q: Has the pre-construction condition of the site been studied?
A: Yes, the conditions were studied and described in the EIA report. Q: Have cultural heritages been studied?
A: They have been studied and described in the EIA report. Also, there has been discussion with the Ifira chief and Vanuatu Cultural Centre on how to preserve the cultural sites. Q: Is there any risk of marine pest invasion?
A: There is a possibility that marine pests may be brought by construction equipments, so it is required to remove them before entering Port Vila. Q: On demolishing the existing piers, will there be any treatment of marine pests prior to the piers
being deposited at the landfill? A: Treatment will not be required as the piers will be removed, transported to the landfill and
buried immediately. Q: Will there be any implication to the Ifira community as a result of dredging?
A: As there will be silt curtains surrounding the site so that any silt that will be stirred up by the dredging will be contained within the work site. Q: Will the contractor have in place quality assurance in terms of oil spills?
A: During the contractor tender process, contractors will need to have quality assurance measures in place. Q: During construction, what strategic temporary arrangements will be place so that operations are
not disrupted? A: The construction will take place in phases not to affect the operation.
Q: Will it be possible to quarantine equipments containing foreign insects and soils on site? A: It will be improved although the design has not been completed.
Q: What are the impacts on stevedoring charges? A: It will be the same as the current condition.
Q: What will be the impact on coastal water current? A: Impact is deemed to be small. JICA will undertake the study soon.
Q: What plans are in place to address the earthquake risk? A: The wharf is designed in accordance with New Zealand or Australian standards to withstand
earthquake. Q: Will the new wharf also accommodate fishing boats?
A: Fishing boats will not use the wharf. Q: Will there be any public health issues caused by inflow of labors?
A: These will be included in contractor requirements to utilize local labor force. Q: Isn’t there any possibility of odor issue caused by rotten fouling organisms in case the demolished
piers are disposed at landfill? A: No problem is expected as it will be buried immediately.
Q: Isn’t there any plan for constructing alternative access road? A: No plan so far.
Q: How can be the wharf secured and restrict access to the public? A: The wharf will comply with ISPS code where only authorized personnel are allowed into the
wharf area. Q: Will there be another tug boat to assist in maneuvering ships?
A: The government will consider separately if necessary. Q: Has there been consideration into the management of toxic wastes and spills, aside from oil
spills? A: The Government needs to develop a strategic plan to address this issue.

Preparatory Study for the Project on International Multi Modal Port at Star Wharf in Port Vila (Environmental Study) FINAL REPORT
142
Q: 23. What safety measures will be in place for market mamas? A: Information will be disseminated prior to the construction.
Most of the questions were to ask about the project plan and the study results of EIA; any concerns on significant environmental impacts were not raised from the participants. However, it was pointed that hydrodynamic study was needed as it was not covered by the EIA study. It was answered that JICA would be undertaking the study and present the results in the next chance. Any voices were not raised on conservation of corals or ecosystems. The other major concerns (questions) on environmental impacts and mitigation measures were tabulated in Table 5.3.2-2 together with the answers.
The meeting is deemed to be fruitful as it facilitated the people and the relevant agencies to understand the project plan and the EIA study, which had not explained to the public officially, through wide range questions and answers.
Table 5.3.2-1 Participants of the First Stakeholder Meeting
Category Number of Participants
Government agencies 10Shefa Province and Port Vila Municipality 3Chief 1Shipping agencies 4Hotel and tourism agencies 2NGO 2Donors 1The others 10
Total 33Excluding organizer, presenter and JICA and the study team.
Table 5.3.2-2 Major Concerns on Environmental Impacts and Mitigation Measures
Concerns (Questions) Answers Possible impacts on local communities by dredging.
Silt curtain will be deployed to prevent the impacts.
Appropriateness of disposing the demolished piles to landfill as a measure for preventing spread of marine pests: possibility of another impact such as odor when they are rotten.
Piles will be treated properly at the landfill site (buried under the soil immediately).
Management measures of oil spills and toxic wastes.
For the construction phase, contractor will be required to have quality assurance for preventing oil spills. For the operation phase, the condition will be the same as the current condition. If improvement is required, the Government needs to develop a strategic plan to address the issue.
Possibility of public health issue due to inflow of labors.
Contractor will be required to use local work force.
Safety measures for surrounding people such as market mamas.
Widespread consultation will be made before the project commencement.

Preparatory Study for the Project on International Multi Modal Port at Star Wharf in Port Vila (Environmental Study) FINAL REPORT
143
5.3.3 The Second Stakeholder Meeting
The second stakeholder meeting was held on the 6th December, 2011 for public consultation on the results of this study at the time of drafting the final report.
As same as the first meeting, public announcement was made through a newspaper and radio to invite any public as well as informing separately to relevant agencies.
18 numbers of people attended the meeting excluding presenter, JICA and the study team.
As same as the first meeting, a presentation of the project outline was made by Mr. Jotham Napat, the former Acting Director of Ministry of Infrastructure and Public Utility; and then, JICA Study Team explained the outline of the draft final report (impact assessment on corals, prediction of water current change, turbidity dispersion, mitigation measures and environmental monitoring and management plan). Ifira group company asked a question on impacts to environmental pollution by construction. Media workers expressed their agreement to organize a committee for conservation and sustainable use of Port Vila bay. After that, questions were answered by Mr. Jotham Napat. Outline of each question and answer is described below.
Q Has there been any risk assessment on natural disasters that may impact on the project? (National Disaster Management Office)
A: The engineering design of the wharf has accommodated for natural disasters in that it is designed to withstand earthquakes of magnitude of 8 Richter scale and climate change and sea level rise as per IPCC report.
Q: Will coral transplanting be done before construction? (Customs Department) A: Yes, it will.
Q: Will the materials and waste carried by current not affect Ifira? (Ifira group company) A: As the current velocity is low, little possibility is predicted. It has been recommended that the
pump dredging with silt curtains is preferable to prevent turbidity dispersion. Q: It is agreed to establish the Committee for Environmental Conservation and Sustainable Use of
Port Vila Harbor. (News paper) A: It should be realized under cooperation of the relevant agencies.
Although the number of participants are smaller comparing with the first meeting, newspaper
(Vanuatu Daily Post) introduce the study results of the draft final report next day with praise of the study quality.
Table 5.3.3-1 Participants of the Second Stakeholder Meeting
Category Number of Participants
Government agencies 6Shipping agencies 1Ifira group company 8Others (broadcasting) 3
計 18Excluding presenter and JICA and the study team.