Embed Size (px)
Citation preview

mmmll
Preparatory study on lighting
systems 'Lot 6'
Specific contract N° ENER/C3/2012-418 Lot 1/06/SI2.668525
Implementing framework contract ENER/C3/2012-418 Lot 1
Paul Van Tichelen, Wai Chung Lam, Paul Waide, René Kemna, Lieven Vanhooydonck,
Leo Wierda
Contact VITO: Paul Van Tichelen
Preparatory study on lighting systems
Month Year I 2
Table of Contents
CHAPTER 0 INTRODUCTION ...................................................................................................... 16
0.1 METHODOLOGY FOR ECODESIGN OF ENERGY-RELATED PRODUCTS (MEERP) ......................... 16 0.2 EXISTING ECODESIGN AND ENERGY LABELLING LEGISLATION ON LIGHTING PRODUCTS .......... 18 0.3 LIGHTING SYSTEMS ........................................................................................................................ 18 0.4 KEY CHARACTERISTICS OF LIGHTING SYSTEMS............................................................................ 20
0.4.1 Luminous flux of a light source ................................................................................... 20 0.4.2 Luminous intensity ........................................................................................................... 20 0.4.3 Illuminance .......................................................................................................................... 21 0.4.4 Luminance ........................................................................................................................... 21 0.4.5 Perceived colour ................................................................................................................ 21 0.4.6 Glare ...................................................................................................................................... 22 0.4.7 Important technical characteristics of the luminaires used .............................. 22
CHAPTER 1 MEERP TASKS 1 & 0 REPORT – SCOPE WITH QUICK SCAN ............... 23
1.1 OBJECTIVE ...................................................................................................................................... 23 1.2 SUMMARY OF TASKS 1 AND 0 ....................................................................................................... 24 1.3 PRODUCT/SYSTEM SCOPE .............................................................................................................. 25
1.3.1 Definition of the lighting System scope of this study and context ................ 26 1.3.2 Categorisation of lighting systems ............................................................................. 32
1.3.2.1 Lighting systems at design and installation level: ........................................................... 33 1.3.2.2 Luminaires as part of the system ........................................................................................... 34 1.3.2.3 Lighting control system .............................................................................................................. 34
1.3.2.3.1 For indoor lighting (offices, indoor work places, sports halls etc.) some control systems are: ................................................................................................................................. 34 1.3.2.3.2 For outdoor lighting (street lighting, outdoor work places, outdoor sports fields etc.) ..................................................................................................................................................... 38
1.3.2.4 Lighting system design and calculation software ............................................................. 38 1.3.2.5 Lighting control communication systems ............................................................................ 41 1.3.2.6 Retrofittable components for luminaires .............................................................................. 41 1.3.2.7 Summary of proposed lighting system categories based on technology levels within a lighting system ............................................................................................................................... 41 1.3.2.8 Categorization of lighting systems according to EN 12464 Task Area's or EN 13201 Road Classes ...................................................................................................................................... 41
1.3.3 Definition of the performance parameters for lighting systems ..................... 42 1.3.3.1 Primary performance parameter (functional unit) ........................................................... 42 1.3.3.2 The secondary performance parameters used to calculate the primary performance parameter are (see EN 12665) ....................................................................................... 44
1.4 OVERVIEW AND DESCRIPTION OF TEST STANDARDS ................................................................... 52 1.4.1 Background information on European and International standardization
bodies 52 1.4.2 Description of different standards .............................................................................. 55
1.4.2.1 The few specific standards for lighting system guidelines ............................................ 56 1.4.2.2 European standards defining energy performance of lighting installations or systems 59 1.4.2.3 Examples of local standards in EU28 member states that are an alternative to EN 15193 for defining lighting energy calculations in their local EPBD implementation ........... 68 1.4.2.4 The most important standards on lighting requirements .............................................. 69 1.4.2.5 Some examples of performance standards on parts of the system .......................... 78 1.4.2.6 Examples of safety standards on parts of the system .................................................... 80
1.4.3 US standards and building codes ................................................................................ 82 1.4.3.1 Indoor lighting controls requirements .................................................................................. 82
1.4.3.1.1 Lighting Power Reduction Controls .................................................................................. 82 1.4.3.2 Outdoor lighting control requirements ................................................................................. 83
Preparatory study on lighting systems
Month Year I 3
1.4.3.3 Interior Lighting Power Density Limits ................................................................................. 83 1.4.3.4 The 2013 ASHRAE 90.1 national energy reference standard....................................... 84 1.4.3.5 Status of adoption by US State ............................................................................................... 85
1.4.4 Analysis and reporting on new test standards, problems and differences
covering the same subject ............................................................................................................ 86 1.4.5 Ongoing standardisation mandates from the European commission ............ 87
1.4.5.1 Introduction to mandates from the European Commission .......................................... 87 1.4.5.2 Mandate M/480 - EPBD .............................................................................................................. 87 1.4.5.3 Mandate M/495 – Ecodesign horizontal mandate............................................................. 87 1.4.5.4 M/485 Mandate in the field of fluorescent lamps, high-intensity discharge lamps, ballasts and luminaires able to operate such lamps ......................................................................... 87
1.4.6 Conclusions and summary of standards .................................................................. 88 1.4.6.1 What are the relevant new and updated standards and is there a missing standard or overlap? ..................................................................................................................................... 88 1.4.6.2 Are there possible problems with standards for later policy measures? ................. 89 1.4.6.3 Are there draft outlines for possible European Mandates to ESOs? .......................... 89
1.5 OVERVIEW AND DESCRIPTION OF LEGISLATION ........................................................................... 89 1.5.1 EU legislation ...................................................................................................................... 89
1.5.1.1 Introduction and overview of EU Directives related to energy efficiency of lighting 89 1.5.1.2 Ecodesign requirements for non-directional household lamps .................................... 93 1.5.1.3 Ecodesign requirements for fluorescent lamps without integrated ballast, for high intensity discharge lamps and for ballast and luminaires able to operate such lamps ........ 94 1.5.1.4 Ecodesign requirements for directional lamps, for light emitting diode lamps and related equipment .......................................................................................................................................... 96 1.5.1.5 Energy labelling of electrical lamps and luminaires: Commission Regulation (EC) No 847/2012 .................................................................................................................................................... 96 1.5.1.6 Energy performance of buildings Directive ......................................................................... 96 1.5.1.7 Energy Efficiency Directive (EED) ......................................................................................... 104 1.5.1.8 RoHS 2 – Directive on the Restrictions of Hazardous Substances in Electrical and Electronic Equipment .................................................................................................................................. 105 1.5.1.9 Ecolabel Regulation .................................................................................................................... 105 1.5.1.10 REACH ........................................................................................................................................ 106 1.5.1.11 Green Public Procurement (GPP) ...................................................................................... 106 1.5.1.12 Construction products (CPD/CPR) Directive ................................................................. 108
1.5.2 Member State legislation and other initiatives .................................................... 110 1.5.2.1 Member state implementation of EPBD .............................................................................. 110 1.5.2.2 Examples of Street lighting design regulation ................................................................. 110 1.5.2.3 Examples of local luminaire labelling initiatives .............................................................. 110 1.5.2.4 Sustainable building certification schemes that include lighting .............................. 111
1.5.3 Examples of similar legislation outside Europe ................................................... 112 1.5.3.1 Australia ......................................................................................................................................... 112 1.5.3.2 Canada ............................................................................................................................................ 115 1.5.3.3 China ............................................................................................................................................... 116 1.5.3.4 India ................................................................................................................................................ 116 1.5.3.5 Switzerland ................................................................................................................................... 116
1.6 QUICK SCAN ................................................................................................................................. 118 1.6.1 Data sources used .......................................................................................................... 119 1.6.2 Lighting Installation stock data rough estimate .................................................. 120 1.6.3 Reference Total energy consumption of the lighting stock in 2007 (rough
estimate) (TWh) .............................................................................................................................. 121 1.6.4 Link between reference energy consumption and installation stock ........... 122 1.6.5 Lighting system related improvement options .................................................... 124
1.6.5.1 Introduction to lighting system improvement options.................................................. 124 1.6.5.2 Redesign the building/room or street improvement option ........................................ 124 1.6.5.3 Change the luminaire and the external lighting control system improvement option 125

Preparatory study on lighting systems
Month Year I 4
1.6.5.4 Change the luminaire but not an external lighting control system improvement option 125 1.6.5.5 Retrofit lamp, ballast and optic improvement option .................................................... 125 1.6.5.6 Retrofit lamp and ballast improvement option ................................................................ 125 1.6.5.7 More frequent operation and maintenance of the lighting system according to the design 125 1.6.5.8 Reference Worst Case (WC) 2020 compared to BAT 2020 for street lighting (outdoor) ......................................................................................................................................................... 126 1.6.5.9 Reference Worst Case (WC) 2020 compared to BAT 2020 for office lighting (indoor) 127 1.6.5.10 Reference Worst Case (WC) 2020 compared to BAT 2020 related to changing domestic luminaire design (indoor) ....................................................................................................... 128 1.6.5.11 Reference Worst Case (WC) 2020 compared to BAT 2020 for the building energy balance related to lighting ......................................................................................................... 128
1.6.6 Input received from field experience of lighting designers on target
application area's ............................................................................................................................ 129 1.6.7 Conclusions on scope .................................................................................................... 129
CHAPTER 2 MARKETS .................................................................................................................. 131
2.1 MODEL FOR EUROPEAN LIGHT SOURCES ANALYSIS (MELISA) .............................................. 132 2.1.1 Introduction to the MELISA model ........................................................................... 132 2.1.2 MELISA details relevant for the Lighting Systems study ................................. 135
2.1.2.1 Sales and stock volumes and sales factor ‘Fsales’ ......................................................... 135 2.1.2.2 Power, capacity, operating hours and factors Fphi and Fhour .................................. 137 2.1.2.3 Cost information limitations .................................................................................................... 139
2.1.3 Determination of MELISA’s system parameters .................................................. 140 2.2 GENERIC ECONOMIC DATA ........................................................................................................... 141
2.2.1 Introduction ...................................................................................................................... 141 2.2.2 Sales and stock of light sources ................................................................................ 142 2.2.3 Sales of ballasts and control gears .......................................................................... 142 2.2.4 Sales of luminaires ......................................................................................................... 144 2.2.5 Sales of sensors ............................................................................................................... 145 2.2.6 Sales and stock of dimmers and other control devices .................................... 146 2.2.7 Sales of communication devices for lighting systems ...................................... 147 2.2.8 Sales and stock of wiring for lighting systems .................................................... 147 2.2.9 Quantity, size and types of non-residential buildings and indoor spaces . 147 2.2.10 Quantity, size and types of residential buildings and indoor spaces .......... 155 2.2.11 Quantity, length and types of roads ........................................................................ 156 2.2.12 Generic economic and MELISA model data conclusion .................................... 158 2.2.13 Additional market and stock data for indoor lighting ........................................ 160
2.2.13.1 2007 installed base lighting control (lot 8) .................................................................. 160 2.2.13.2 Cellular versus open plan offices ...................................................................................... 162 2.2.13.3 Direct lighting versus indirect lighting luminaires in offices................................... 162
2.2.14 Additional market and stock data for road lighting ........................................... 163 2.2.14.1 Other market data sources from road lighting ............................................................ 163 2.2.14.2 Share of lit roads .................................................................................................................... 165 2.2.14.3 Cross check with MELISA on light sources sales for road lighting ....................... 165 2.2.14.4 Conclusion on Market and stock data in road lighting ............................................ 165
2.3 MARKET TRENDS ........................................................................................................................... 166 2.3.1 Market production structures ..................................................................................... 166
2.3.1.1 Luminaires and other components for lighting systems .............................................. 166 2.3.1.2 Green public procurement ....................................................................................................... 166
2.3.1.2.1 Implementation status of GPP criteria ......................................................................... 168 2.3.1.2.2 Impacts of GPP on lighting systems .............................................................................. 169
2.3.1.3 Concept of Total cost of ownership (TCO) or Life cycle cost(LCC) used in lighting systems 169

Preparatory study on lighting systems
Month Year I 5
2.3.2 General trends in product design and product features; feedback from
consumer associations .................................................................................................................. 172 2.4 CONSUMER EXPENDITURE DATA ................................................................................................. 172
2.4.1 Design, installation and repair cost ......................................................................... 172 2.4.2 Disposal and dismantling cost .................................................................................... 174 2.4.3 Electricity prices .............................................................................................................. 174 2.4.4 Financial rates .................................................................................................................. 174
2.5 RECOMMENDATIONS ..................................................................................................................... 174 2.5.1 Refined product scope ................................................................................................... 174 2.5.2 Barriers and opportunities from the economical/commercial perspective 175
CHAPTER 3 USERS ........................................................................................................................ 176
3.1 HOW TO DEFINE MEERP SYSTEM ASPECTS OF LIGHTING SYSTEMS ......................................... 176 3.1.1 MEErP system aspects of lighting systems and lighting products ................ 176 3.1.2 Reference lighting system designs and lighting schemes for use in this
study 178 3.1.2.1 Cellular office with ceiling mounted luminaires ............................................................... 178 3.1.2.2 Cellular office with suspended luminaires ......................................................................... 179 3.1.2.3 Open plan office with ceiling mounted luminaires .......................................................... 180 3.1.2.4 Open plan office with suspended luminaires .................................................................... 181 3.1.2.5 Motorized road traffic class M3 .............................................................................................. 181 3.1.2.6 Conflict road traffic class C3 ................................................................................................... 182 3.1.2.7 Pedestrian road traffic class P3 ............................................................................................. 183
3.2 DIRECT IMPACT OF THE LIGHTING SYSTEM ON THE USE PHASE ................................................ 183 3.2.1 Energy consumption of indoor lighting systems in the use phase according
to EN 15193 ...................................................................................................................................... 183 3.2.1.1 Energy of indoor lighting systems according to EN 15193 ......................................... 183 3.2.1.2 Use parameters influencing lighting system control ..................................................... 184
3.2.1.2.1 Day time, night time and occupied period .................................................................. 184 3.2.1.2.2 Occupancy Dependency Factor (Fo) ............................................................................. 184 3.2.1.2.3 Daylight Dependency Factor (Fd) .................................................................................. 186 3.2.1.2.4 Constant illuminance Factor (Fc) ................................................................................... 190
3.2.1.3 Influence of maintenance factors (FLM, FLLM, FRSM) .................................................. 191 3.2.1.4 Use parameters influencing the lighting system utilance ............................................ 193 3.2.1.5 Luminaire installation and matching of the minimum lighting design requirements for the task area ............................................................................................................... 195 3.2.1.6 Luminaire and lamp efficacy parameters........................................................................... 196
3.2.2 Energy consumption of indoor lighting system in the use phase not yet
covered in prEN 15193 ................................................................................................................. 196 3.2.3 Energy consumption of road lighting in the use phase according to EN
13201-5 .............................................................................................................................................. 198 3.2.3.1 Energy of road lighting systems according to EN 13201 ............................................. 198 3.2.3.2 Use parameters influencing lighting system control ..................................................... 198
3.2.3.2.1 Day time, night time and road traffic dimming ........................................................ 198 3.2.3.2.2 Constant illumination control (Fclo) .............................................................................. 199
3.2.3.3 Influence of maintenance factors (FLM, FLLM, FRSM) .................................................. 200 3.2.3.4 Use parameters influencing the lighting system utilance ............................................ 200 3.2.3.5 Luminaire and lamp efficacy parameters........................................................................... 203
3.2.4 Energy consumption of road lighting in the use phase that is not yet
covered EN 13201-5 ...................................................................................................................... 203 3.3 INDIRECT IMPACT OF THE USE PHASE ON ENERGY CONSUMPTION ........................................... 205
3.3.1 Heat replacement effect in buildings ....................................................................... 205 3.3.2 Impact on the cooling loads in buildings ............................................................... 205 3.3.3 Conclusion on indirect impact on heating and cooling in buildings ............. 206
3.4 END-OF-LIFE BEHAVIOUR ............................................................................................................ 206

Preparatory study on lighting systems
Month Year I 6
3.4.1 Economic Lifetime of the lighting installation ...................................................... 206 3.4.1.1 Economic Lifetime of indoor lighting installations .......................................................... 206 3.4.1.2 Economic Lifetime of road lighting installations .............................................................. 206
3.4.2 Typical maintenance time for indoor lighting systems ..................................... 207 3.4.3 Typical maintenance time of road lighting systems .......................................... 207 3.4.4 Frequency of maintenance cycle and repair or re-lamping of installations 208 3.4.5 Recycling and disposal of the luminaire ................................................................. 210
3.5 LOCAL INFRA-STRUCTURE............................................................................................................ 210 3.5.1 Opportunities for lighting system design and the follow up process .......... 210 3.5.2 'Lock-in effect' for new products due to limitations imposed by existing in
road lighting ...................................................................................................................................... 211 3.5.3 Lack of interest by authorities ................................................................................... 213 3.5.4 Lack of interest by the office building owner ....................................................... 213 3.5.5 Lack of knowledge or skilled subcontractors ........................................................ 214 3.5.6 Lack of user acceptance for automatic control systems .................................. 214 3.5.7 Limitations imposed by local light colour preferences ...................................... 214 3.5.8 Lack of skilled work force ............................................................................................ 215 3.5.9 Light pollution and sky glow ....................................................................................... 215 3.5.10 Selection of the task area according to EN 12464 and impact on the light
levels 217 3.5.11 Selection of the road classes according to EN 13201 and impact on light
levels 217 3.5.12 Indoor light installed for non visual aspects of lighting contributing to
energy consumption ...................................................................................................................... 218 3.6 RECOMMENDATIONS ..................................................................................................................... 218
3.6.1 Refined product scope ................................................................................................... 218 3.6.2 Barriers and opportunities ........................................................................................... 218
CHAPTER 4 TECHNOLOGIES (PRODUCT SUPPLY SIDE, INCLUDES BOTH BAT
AND BNAT) ....................................................................................................................................... 219
4.1 TECHNICAL PRODUCT DESCRIPTION OF LIGHTING SYSTEMS ..................................................... 220 4.1.1 Worst case (WC) or high energy using lighting indoor systems ................... 221
4.1.1.1 The WC control system level indoor .................................................................................... 221 4.1.1.2 WC control gear or ballast indoor ......................................................................................... 221 4.1.1.3 WC luminaire and lamp efficacy indoor .............................................................................. 221 4.1.1.4 WC Installation indoor .............................................................................................................. 222
4.1.2 Mainstream or medium energy using lighting indoor systems ...................... 223 4.1.2.1 The MAINSTREAM control system level indoor ................................................................ 223 4.1.2.2 MAINSTREAM control gear or ballast indoor .................................................................... 223 4.1.2.3 MAINSTREAM luminaire and lamp efficacy indoor ......................................................... 223 4.1.2.4 MAINSTREAM Installation indoor .......................................................................................... 224
4.1.3 BAT or low energy using lighting indoor systems .............................................. 224 4.1.3.1 The BATref control system level indoor ............................................................................. 224 4.1.3.2 BATref control gear or ballast indoor .................................................................................. 225 4.1.3.3 BATref luminaire and lamp efficacy indoor ....................................................................... 225 4.1.3.4 BATref Installation indoor ........................................................................................................ 226 4.1.3.5 Other BAT options at installation level indoor ................................................................. 226
4.1.4 BNAT or low energy using indoor lighting systems ........................................... 227 4.1.5 Worst case or high energy using road lighting systems .................................. 227
4.1.5.1 The WC control system and control gear level outdoor ............................................... 227 4.1.5.2 WC luminaire and lamp efficacy outdoor ........................................................................... 228 4.1.5.3 WC Installation outdoor ........................................................................................................... 228
4.1.6 Mainstream or average energy using road lighting systems ......................... 229 4.1.6.1 The MAINSTREAM control system and control gear level outdoor ........................... 229
Preparatory study on lighting systems
Month Year I 7
4.1.6.2 MAINSTREAM luminaire and lamp efficacy outdoor ....................................................... 229 4.1.6.3 MAINSTREAM Installation outdoor ....................................................................................... 230
4.1.7 BAT or low energy using road lighting systems .................................................. 230 4.1.7.1 The BATref control system and control gear level outdoor......................................... 231 4.1.7.2 BATref luminaire and lamp efficacy outdoor .................................................................... 231 4.1.7.3 BATref installation outdoor ..................................................................................................... 232 4.1.7.4 BAT other installation ................................................................................................................ 232 4.1.7.5 BNAT outdoor installation ........................................................................................................ 232
4.2 PRODUCTION, DISTRIBUTION AND END OF LIFE ....................................................................... 232 4.3 SUMMARY OF LIGHTING SYSTEM TECHNICAL SOLUTIONS AND TECHNICAL IMPROVEMENT
OPTIONS .................................................................................................................................................... 233 4.4 RECOMMENDATIONS ..................................................................................................................... 235

Preparatory study on lighting systems
Month Year I 8
List of figures
Figure 0-1: MEErP structure ................................................................................ 17 Figure 0-2: Luminous flux ................................................................................... 20 Figure 0-3: Luminous intensity ............................................................................ 21 Figure 0-4: Illuminance ...................................................................................... 21 Figure 0-5: Luminance ....................................................................................... 21 Figure 1-1: Components of a lighting system and the most relevant performance
parameters related to energy efficiency .............................................. 27 Figure 1-2: Context of public outdoor lighting systems with related standards and
methods ......................................................................................... 29 Figure 1-3: Context of indoor lighting systems for work places with related standards
and methods ................................................................................... 30 Figure 1-4 Specific minimum lighting requirements for Offices in EN 12464. ............. 42 Figure 1-5: The CIE 1931 x,y chromaticity space, also showing the chromaticities of
black-body light sources of various colour temperatures (Tc), and lines of
constant correlated colour temperature (Tcp). ..................................... 47 Figure 1-6: Zones for the calculation of accumulated luminous fluxes according to the
CEN flux-code. ................................................................................ 48 Figure 1-7: Example of a polar intensity curve ...................................................... 49 Figure 1-8: Example of a Cartesian light distribution diagram .................................. 49 Figure 1-9: Example of an Illuminance Cone Diagram ............................................ 50 Figure 1-10: Flow chart illustrating alternative routes to determine energy use in prEN
15193-1 ......................................................................................... 60 Figure 1-11: Fragment of benchmark values contained in AnnexF of standard EN
15193(2007) ................................................................................... 61 Figure 1-12: Table 1 on lighting controls defined in EN 15232 ................................. 63 Figure 1-13: Table 10 on BAC/TBM efficiency factors in EN 15232 ........................... 64 Figure 1-14: Example of Annex A for Road and two sidewalks in both sides .............. 66 Figure 1-15: Typical power density (DP) and energy consumption (DE) values in
prEN13201-5 ................................................................................... 66 Figure 1-16: Possible different methods to obtain the installed, electric power .......... 69 Figure 1-17: Example of lighting requirements from EN 12464-1 for traffic zones
inside buildings ................................................................................ 73 Figure 1-18: Relationship of illuminances on immediate surroundings to the
illuminance on the task area ............................................................. 73 Figure 1-19: The status of building energy codes adopted for commercial buildings in
US states ........................................................................................ 86 Figure 1-20: Actual situation in many EU Member States regarding how they use the
EPBD standards ............................................................................... 87 Figure 1-21: Reference values in kWh/y.m² for lighting in various applications (source:
IWU TEK Tool). .............................................................................. 111 Figure 2-1 Market share (1997-2008) and expected market share (2009-2010) of the
ballast sales development in Europe based on operated linear fluorescent
lamps (blue=magnetic ballast; yellow=electronic ballast;
orange=tolerance band) (Source: 21) ............................................... 144 Figure 2-2 Market share (1997-2010) of the ballast sales development in Europe
based on operated high-intensity discharge lamps (orange=magnetic
ballast; green=electronic ballast) (Source: 21) ................................... 144 Figure 7: Influence of use and End of Life costs on the total costs (Source: EC, GPP
training toolkit, module 1 ‘managing GPP implementation – LCC
factsheet’, 2008) ........................................................................... 170 Figure 8: Environmental LCC structure (Source: European Commission Life cycle
costing web page, consulted on 25 November 2015) .......................... 171

Preparatory study on lighting systems
Month Year I 9
Figure 3-1: Three groups of ErP, distinguished by their impact (source: MEErP 2011
Methodology Part 1). ...................................................................... 177 Figure 3-2: Cellular office with ceiling mounted luminaires reference design ........... 178 Figure 3-3: Cellular office with suspended luminaires reference design ................... 179 Figure 3-4: Open plan office with ceiling mounted luminaires reference design ........ 180 Figure 3-5: Reference design ............................................................................ 182 Figure 3-6 Formulas for modelling energy consumption in indoor lighting ............... 184 Figure 3-7 Formulas for modelling energy consumption in indoor lighting ............... 198 Figure 3-8: More than half of the light is directed to the sky or sea and is wasted .... 201 Figure 3-9: Street lighting luminaire attached to cables(left) and to electricity
distribution (right) ......................................................................... 212 Figure 3-10: Street lighting luminaires attached to poles(left) and to a house (right) 212 Figure 3-11: Examples of light pollution: sky glow (left) and glare (right) ............... 216
Preparatory study on lighting systems
Month Year I 10
List of tables
Table 1-1: Comparison of different functional units used in the preparatory studies on
lighting ........................................................................................... 43 Table 1-2: Summary of current EU policy instruments as they are and could be applied
to lighting systems (LS) and building automation and control systems
(BACS) ........................................................................................... 91 Table 1-3: systems continued ........................................................................... 101 Table 1-4: Recommended minimum lighting efficacy with controls in new and existing
non domestic buildings, UK Building regulations, Part L ...................... 103 Table 1-5: Recommended maximum LENI (kWh/m2/year) in new and existing non
domestic buildings, UK Building regulations, Part L ............................ 103 Table 1-6: Recommended minimum standards for metering of general and display
lighting in new and existing non domestic buildings, UK Building
regulations, Part L.......................................................................... 103 Table 1-7: List of tables extracted from Australian Building codes .......................... 112 Table 1-8: Maximum permitted LENI and LPD values for different space types in Swiss
building codes, Norme SIA 380/4:2009 ............................................ 117 Table 1-9: Relative indoor lighting power consumption per sector .......................... 120 Table 1-10: Estimated share in outdoor lighting power consumption per sector ....... 121 Table 1-11: Rough estimate of Electrical Energy Consumption of the EU27 lighting
stock based on the data of the Impact Assessment reports associated
with the Regulations regarding the Ecodesign measures. .................... 122 Table 1-12: Estimated share of lamp technology per sector indoor ........................ 123 Table 1-13: Estimated annual power consumption of indoor lighting stock per sector
(2007) .......................................................................................... 123 Table 1-14: Estimated annual power consumption of outdoor lighting stock per sector
(2007) .......................................................................................... 124 Table 1-15: Worst Case with existing legislation compared to BAT 2020 at system
level for street lighting ................................................................... 126 Table 1-16: Worst Case with existing legislation compared to BAT 2020 at system
level for office lighting .................................................................... 127 Table 1-17: Annual indoor lighting energy consumption per sector and maximum
savings identified ........................................................................... 130 Table 1-18: Annual outdoor lighting energy consumption per sector and maximum
savings identified ........................................................................... 130 Table 2-1 Light source base cases distinguished in the MELISA model (left hand side)
and improvement options used in scenarios (right hand side) .............. 134 Table 2-2 MELISA input data and calculated intermediate and final results (for every
base case, for the residential and the non-residential sector)*. ............ 135 Table 2-3 Example (for sales related to LFL T8t in 2015) of the application in MELISA
of the sales factor Fsales to account for the effect of the reduction of the
number of light sources due to improvements in lighting system design.136 Table 2-4 Summary per building type of non-residential lighted building areas (in
million square meters, M m2) and comparison with data used previously in
Task 0 based on Waide(2014), table 1-2 108Error! Bookmark not defined.) ....... 149 Table 2-5 Summary per room type of EU-28 total non-residential lighted building
areas (million m2) .......................................................................... 150 Table 2-6 EU28-2010 RESIDENTIAL SECTOR BUILDINGS numbers and geometry
(Source: VHK 2014 105) .................................................................. 155 Table 2-7 Breakdown of floor area for a reference dwelling in Germany 2013
(Extract from 114) ........................................................................... 155 Table 2-8 Reference useful areas for the lighting of rooms in residential buildings
(Source: table B.3.3.8 of prEN 15193-1:2014(E)) .............................. 156

Preparatory study on lighting systems
Month Year I 11
Table 2-9 Penetration rate of different lighting control techniques in office lighting .. 161 Table 2-10 Penetration rate of different lighting control techniques in office lighting in
Belgium and Spain (Source: Expert inquiry) ...................................... 161 Table 2-11 Use of lighting technology in percentage for the public and private office
buildings (Source: DEFU, 2001) ....................................................... 163 Table 2-12 Market data on installed base of street lighting luminaires in EU-25 (Source
: data from literature and expert inquiry completed with CELMA market
data estimations for missing Member States) (Source: lot 9, VITO, 2007)163 Table 2-13 EU28 annual road lighting luminaire stock and sales estimate ............... 166 Table 2-14 hourly rates in EU-28 ....................................................................... 173 Table 2-15 Generic energy rates in EU-27 (1.1.2011) .......................................... 174 Table 2-16 Generic financial rates in EU-27 ......................................................... 174 Table 3-1: Typical occupancy dependency factors (Foc) (source: EN15193-1) ......... 186 Table 3-2: Frequency of inclusion of cleaning of luminaries during maintenance ...... 192 Table 3-3: Reflectance values used in this study .................................................. 194 Table 3-4: Average luminance coefficient (Q0): parameter values applied in this study202 Table 3-5: Expert inquiry results ....................................................................... 203 Table 3-6: Luminaire life time: parameter values applied in this study ................... 207 Table 3-7: Estimation of maintenance and installation cost related parameters used for
LCC calculations in this study .......................................................... 207 Table 3-8: Estimation of maintenance and installation time parameters .................. 208 Table 3-9: FLLM and FLS data for selected lamps ................................................ 209 Table 3-10: Compromising motivating factors that may influence the selection and
design of lighting systems' .............................................................. 214 Table 3-11 Relationship of illuminances on immediate surrounding to the illuminance
on the task area ............................................................................ 217 Table 3-12 General areas inside buildings – Storage rack areas ............................. 217 Table 3-13 Example of EN 13201-2 road classes lighting requirements ................... 218 Table 4-1 Annual Lighting Energy consumption and installation efficacy calculated for a
cellular office with ceiling mounted luminaires in Worst Case(WC),
mainstream and BAT lighting designs ............................................... 234 Table 4-2 Annual Energy Consumption Indicator and installation efficacy calculated for
a motorized road with lighting class M3 ............................................ 235

Preparatory study on lighting systems
Month Year I 12
LIST OF ACRONYMS
AECI Annual Energy Consumption Indicator
BACS Building Automation Control Systems
BAT Best Available Technology
BAU Business as Usual
BGF Ballast Gain Factor
BNAT Best Not Yet Available Technology
BPIE Buildings Performance Institute Europe
BR Ballast Reliabilty
By LED luminaire gradual failure fraction
cd candela
CECAPI European Committee of Electrical Installation Equipment Manufacturers
CEN European Committee for Normalisation
CENELEC European Committee for Electro technical Standardization
CFL Compact Fluorescent Lamp
CIBSE British Chartered Institution of Building Service Engineers
CIE International Commission on Illumination
CL Correction factor for over-lighting
CLO Constant Light Output
CSES Centre for Strategy & Evaluation Services
Cz LED luminaire catastrophic failure rate
DALI Digital Adressable LIghting
DFF Downward light Flux Fraction
DLOR Downward Light Output Ratio
DLS Directional Light Sources
DMX Digital Multiplexing
DoE Department of Energy
DP Lighting power density indictor
EC European Commission
EED Energy Efficiency Directive
EEE Electrical and Electronic Equipment
Em Maintained Illuminance
EN European Norm
EPBD Energy Performance of Buildings Directive
ErP Energy-related Products
ETS Emission Trading System
ETSI European Telecommunications Standards Institute
EU European Union
EuP Energy-using Products
FBM Ballast maintenance factor
FCL Correction factor for over-lighting
Fhour MELISA model light source hour factor
FLLM Lamp Lumen Maintenance Factor
FLM Luminaire maintenance factor
FLS Lamp Survival Factor
Fphi MELISA model light source luminous flux factor
FRSM Room surface maintenance factor
Fsales MELISA model Sales factor
FU Utilization factor
Fy LED module failure fraction
G Giga, 109
GLS General Lighting Service
GPP Green Public Procurement

Preparatory study on lighting systems
Month Year I 13
hEN Harmonized European Product Standard
HID High Intensity Discharge
Hz Hertz
h/a Hour per annum or year
I luminous intensity
IEC International Electrotechnical Commission
IES Illuminating Engineering Society of North America
IP Ingress protection
ISO International Organization for Standardization
k Kilo, 10³
kred power reduction coefficient for reduced level illumination
L luminance
LE LightingEurope
LED Light Emitting Diode
LENI Lighting Energy Numeric Indicator
LER Luminaire Efficacy Rating
LERc Luminaire Efficacy Rating Corrected
LFL Linear Fluorescent Lamp
LLMF Lamp Luminance Maintenance Factor
Lm Maintained luminance
lm lumen
LMF Luminaire Maintenance Factor
LOR Light Output Ratio
LPF Lamp Power Factor
LSF Lamp Survival Factor
lx Lux
Lx LED module rated life
M Mega, 106
MEErP Methodology for Ecodesign of Energy-related Products
MEEuP Methodology for Ecodesign of Energy-using Products
MS Member States
NDLS Non-Directional Light Sources
NEEAP National Energy Efficiency Action Plan
NEMA National Electrical Manufacturers Association
NGO Non Governmental Organisation
NRE Non Residential
NZEB Nearly Zero energy building
OLED Organic Light Emitting Diode
P Peta, 1015
PDI Lighting power density indictor
PE Annual Energy Consumption Indicator
Pf, inv MELISA model share of total EU-28 installed capacity (lm) involved in flux
reduction
Pf, rem MELISA model share of involved luminous flux remaining after system
optimization
Ph, inv MELISA model share of total EU-28 operating hours (fpe h/a) involved in
hour reduction
Ph, rem MELISA model share of involved operating hours remaining after system
optimization
Pl Maximum luminaire power
Pr Rated lamp power
PRODCOM Community Production
Ps,inv MELISA model : share of total EU-28 sales of light sources involved in sales
reduction

Preparatory study on lighting systems
Month Year I 14
Ps,rem MELISA model share of involved sales remaining after system optimization
Q0 Average luminance coefficient
Ra Colour rendering index
REACH Registration, Evaluation, Authorisation and Restriction of Chemical
substances.
RES Renewable Energy Sources
RLO light output ratio
RLOW light output ratio working
RoHS Restricitons of Hazardous Substances
RSMF Room Surface Maintenance Factor
SDCM Standard Deviation Colour Matching
SME Small and Medium Enterprise
sr steradian
SSL Solid State Lighting
T Tera, 1012
TBC To be confirmed (only in draft versions)
TBD To be defined (only in draft versions)
TBM Technical Building Management
TC Technical Committee
Tc Colour Temperature
Tcp Correlated Colour Temperature
tfull annual operating hours of the full level illumination
TI Threshold Increment
TOR Terms of Reference
TR Technical Report
tred annual operating time of the reduced level illumination
U Utilance
U0 Illuminance uniformity
UF Utilization Factor
UFF Upward Light Flux Fraction
UGR Unified Glare Rating
ULOR Upward Light Output Ratio
UU Useful Utilance
VITO Flemish Institute for Technological Research
Wlamp Nominal lamp power
y year
XML Extensible Markup Language
ηinst Installation luminous efficacy
ηls Luminous efficacy of a light source
ηp Power efficiency of luminaires
Фn Nominal luminous flux
Фr Rated luminous flux
Use of text background colours:
Blue: draft text
Yellow: text requires attention to be commented

Preparatory study on lighting systems
Month Year I 15
Executive summary
Comment: This report is currently a work in progress, as some parts of the study have
not yet received the benefit of comments and data from stakeholders, therefore it
should also not be viewed as a draft final report.
For a summary please consult the summaries of the current draft tasks at the
beginning of each section.

Preparatory study on lighting systems
Month Year I 16
CHAPTER 0 Introduction
According to Article 16(1) of the Ecodesign Directive, the Commission adopted on 7
December 2012 a Working Plan for the period 2012-2014, setting out an indicative list
of energy-related products which will be considered for the adoption of implementing
measures for the following three years. The Commission established an indicative list
of twelve broad product groups to be considered between 2012 and 2014 for the
adoption of implementing measures. According to the principle of better regulation,
preparatory studies will collect evidence, explore all policy options and recommend the
best policy mix (Ecodesign and/or labelling and/or EPBD and/or self-regulation
measures), if any, to be deployed on the basis of the evidence and stakeholder input.
For some of the identified product groups, there is the possibility that overlaps exist
with a number of on-going preparatory studies and regulations due for review. This is
the reason why the list of product groups to be considered was split into a priority list
and a conditional list.
Lighting systems are on the list of conditional product groups, where launching a
preparatory study is dependent on the outcome of on-going regulatory processes
and/or reviews. The scope of this study is to carry out a limited preparatory study on
lighting systems for the exploration of the feasibility of Ecodesign, energy labelling,
and/or energy performance of building requirements. The options of where to go next
include a basic idea on how to implement possible measures, without going into detail.
The energy saving potential of the options is considered, but not the political
feasibility. The options can be further addressed in a possible full preparatory study.
This study follows the methodology for Ecodesign of energy-related products (MEErP)
Tasks 0, 1-4 and partly 7.
The study builds upon existing Ecodesign and energy labelling legislation on lighting
products (see 0.2).
0.1 Methodology for Ecodesign of Energy-related Products (MEErP)
Over the past 5 years MEEuP 2005 (Methodology for Energy-using Products version
2005) has been proven to be an effective methodology for Ecodesign preparatory
studies. The MEErP 2011 Methodology Report therefore was intended to maintain the
qualities of the former MEEuP methodology, extending the scope from energy-using
products to energy-related products and providing more guidance to analysts and
stakeholders involved in the Ecodesign preparatory studies.
The design of the methodology in the former MEEuP 2005 was enshrined in the
Directive 2005/32/EC on Ecodesign of Energy-using Products. For the new
Methodology for the Ecodesign of Energy-related Products (MEErP)1 in 2011 it was
proposed to follow the same route with the recast Directive 2009/125/EC on
Ecodesign of Energy-related Products (hereafter ‘Ecodesign directive’).
The MEErP was thus developed in 2011 to contribute to the creation of a methodology
allowing to evaluate whether and to what extent various energy-related products fulfil
certain criteria that make them eligible for implementing measures under the
Ecodesign Directive 2005/32/EC.
1 http://www.meerp.eu/ VHK BV, Netherlands and COOWI, Belgium: Methodology Study Ecodesign of Energy-related Products, MEErP Methodology Report, under specific contract SI2.581529, Technical Assistance for the update of the Methodology for the Ecodesign of Energy-using products (MEEuP), within the framework service contract TREN/R1/350-2008 Lot 3, Final Report: 28/11/2011

Preparatory study on lighting systems
Month Year I 17
More specifically, the MEErP tasks entail:
Task 1 – Scope (definitions, standards and legislation);
Task 2 – Markets (volumes and prices);
Task 3 – Users (product demand side);
Task 4 – Technologies (product supply side, includes both BAT and BNAT);
Task 5 – Environment & Economics (Base case LCA & LCC);
Task 6 – Design options;
Task 7 – Scenarios (Policy, scenario, impact and sensitivity analysis).
Tasks 1 to 4 can be performed in parallel, whereas 5, 6 and 7 are sequential (see
Figure 0-1).
Figure 0-1: MEErP structure
The MEErP structure makes a clear split between:
Tasks 1 to 4 (product definitions, standards and legislation; economic and
market analysis; consumer behaviour and local infrastructure; technical
analysis) that have a clear focus on data retrieval and initial analysis;
Tasks 5 (assessment of base case), 6 (improvement potential) and 7 (policy,
scenario, impact and sensitivity analysis) with a clear focus on modelling.
This study is conducted according to tasks 0, 1-4 and partly 7 specified in the tender
specifications, including a meeting with relevant stakeholders.
Preparatory study on lighting systems
Month Year I 18
0.2 Existing ecodesign and energy labelling legislation on lighting products
Three principal ecodesign regulations and two amendments related to lighting are in
place today, all having a different specific scope:
Commission Regulation (EC) No 244/2009 of 18 March 2009
implementing Directive 2005/32/EC of the European Parliament and of the
Council with regard to ecodesign requirements for non-directional household
lamps.
Commission Regulation (EC) No 859/2009 of 18 September 2009
amending Regulation (EC) No 244/2009 as regards the ecodesign requirements
on ultraviolet radiation of non-directional household lamps.
Commission Regulation (EC) No 245/2009 of 18 March 2009
implementing Directive 2005/32/EC of the European Parliament and of the
Council with regard to ecodesign requirements for fluorescent lamps without
integrated ballast, for high intensity discharge lamps, and for ballasts and
luminaires able to operate such lamps, and repealing Directive 2000/55/EC of
the European Parliament and of the Council.
Commission Regulation (EU) No 347/2010 of 21 April 2010 amending
Commission Regulation (EC) No 245/2009 as regards the ecodesign
requirements for fluorescent lamps without integrated ballast, for high intensity
discharge lamps, and for ballasts and luminaires able to operate such lamps.
Commission Regulation (EC) No 1194/2012 of 12 December 2012
implementing Directive 2005/32/EC of the European Parliament and of the
Council with regard to ecodesign requirements for directional lamps, for light
emitting diode lamps and related equipment.
Also an energy labelling regulation regarding lighting is in place:
Commission Delegated Regulation (EU) No 874/2012 of 12 July 2012
supplementing Directive 2010/30/EU of European Parliament and of the Council
with regard to energy labelling of electrical lamps and luminaires.
This study examines if the scope should be opened to lighting systems, if there are
any issues left uncovered and if there are loopholes in the existing legislation. Both
residential and non-residential lighting will be considered.
0.3 Lighting systems
Today the legislation only looks at light sources, luminaires and ballasts as a product.
In this study it is the intention to also look at the application level. We want to adopt
an extended product approach, looking at the lighting system as a holistic system
comprising: light sources, ballasts, luminaires, or multiple luminaires in a system with
sensors and controls and also the design and installation of the system.
In this context, lighting system means any energy-related device or system of devices
used for the production of artificial lighting from the power supply in residential and
non-residential lighting applications. A lighting system can therefore range from
simple luminaires to large scale installations with multiple luminaires and intelligent
controls such as in intelligent street lighting. Lighting systems can be placed on the
market either with built-in lamps that are designed to be changed by the end-user,
such as fixed LED modules, or with exchangeable lamps/without lamps. According to
the EN 12655 standard a lighting system is defined as ‘lighting equipment or lighting
solution (lamps, ballast, luminaire and controls) required for the lighting scheme, its
installation and operation during the life of the scheme’;

Preparatory study on lighting systems
Month Year I 19
Lighting schemes are the theoretical planning of a lighting system and allow for the
evaluation of these systems at early stages. ‘Smart’ lighting systems are also included
in this study. Lighting scheme design is a design process in which the lighting designer
selects the lighting criteria for the place of interest, chooses the lighting solution,
makes lighting calculations, configures the layouts, produces drawings of the lighting
scheme and specifies the operating functions of the lighting system.
Some common descriptions of system components are2,3:
Lamp
A light source made in order to produce optical radiation, usually visible;
Light source
surface or object emitting light produced by a transformation of energy
LED light source
electric light source based upon LED technology;
LED Lamp
technology LED light source incorporating one or more LED package(s) or LED
module(s) and provided with one or more cap(s)4. Furthermore EN 62504:2014
requires that ‘A LED lamp is designed so that it can be replaced by an ordinary
person as defined in IEC 600500-826, 826.18.03’;
Lamp cap
that part of a lamp which provides connection to the electrical supply by means
of a lamp holder or lamp connector and, in most cases, also serves to retain the
lamp in the lamp holder;
Lamp holder/ socket
A device which holds the lamp in position, usually by having the cap inserted in
it, in which case it also provides the means of connecting the lamp to the
electricity supply;
Ballast
a device connected between the electricity supply and one or more discharge
lamps which serves mainly to limit the current of the lamp(s) to the required
value;
LED control gear
unit inserted between the electrical supply system and one or more LED
package(s) or LED module(s) which serves to supply the LED package(s) or
LED module(s) with its (their) rated voltage or rated current;
Luminaire
An apparatus which distributes, filters or transforms the light transmitted from
one or more lamps and which includes, except the lamps themselves, all parts
necessary for fixing and protecting the lamps and, where necessary, circuit
auxiliaries together with the means for connecting the lamps to the electric
supply;
Dimmer
A device in the electric circuit for varying the luminous flux from lamps in a
lighting installation;
Electrical switch
In general, a device for changing the electric connections among its terminals.
In a lighting installation it can be a device that switches off the electrical
supply, it can be electronic or mechanical;
Movement/presence detection sensor
A device that measures the light (light sensor) or that detects the
movement/presence of persons (presence detection sensor);
2 http://www.electropedia.org 3 EN 12665 (2011) 4 CIE DIS 024/E: 2015

Preparatory study on lighting systems
Month Year I 20
Control and management unit
A unit that processes the received signals from switches and sensors and that
manages the lighting in the installation by dimming or switching on and off;
Lighting communication network
A network throughout the building between lighting fixture and controls
components, such as sensors and switches, which have bidirectional
communication;
0.4 Key characteristics of lighting systems
Quality of light & lighting are of primary importance in many applications. Therefore
lighting system design is usually based on minimum quality parameters as described
in European standards such as EN 12464 Lighting of work places, EN 12193 Sports
lighting and EN 13201 for Road lighting. Important parameters for specifying the
lighting and the lighting system are briefly introduced in the next section. Terminology
is defined in EN 12665.
0.4.1 Luminous flux of a light source
The primary performance parameter for a non-directional light source is luminous flux.
Luminous flux is the measure of the perceived power of light. It indicates the
particular light output of a lamp or lighting system and is measured in lumens (lm).
One lumen is the luminous flux of light produced by a light source that emits one
candela of luminous intensity over a solid angle of one steradion. It is defined3 as
‘quantity derived from radiant flux Φe by evaluating the radiation according to its
action upon the CIE standard photometric observer (unit: lm)’.
Unit: 1 lm = 1cd*1sr
Figure 0-2: Luminous flux
0.4.2 Luminous intensity
The primary performance parameter for a directional light source is luminous
intensity.
Luminous Intensity (I) of a source in a given direction is the quotient of the luminous
flux dΦ leaving the source and propagated in the element of solid angle dΩ, the
corresponding unit is a candela [cd].
Unit:

Preparatory study on lighting systems
Month Year I 21
Figure 0-3: Luminous intensity
0.4.3 Illuminance
A primary performance parameter for providing light in an installation is illuminance.
More details on a framework for the specification of lighting requirements is included
in EN 12665.
Illuminance is the total luminous flux incident on a surface, per unit area. The SI unit
for illuminance is lux (lx). One lux equals one lumen per square metre.
Unit:
Figure 0-4: Illuminance
0.4.4 Luminance
The primary performance parameter for light emitted or reflected by an object is
luminance. More details on a framework for the specification of lighting requirements
is included in EN 12665.
Luminance is a photometric measure of the luminous intensity per unit area of light
travelling in a given direction. It describes the amount of light that passes through or
is emitted from a particular area, and falls within a given solid angle. The SI unit for
luminance is candela per square metre [cd/m²].
Figure 0-5: Luminance
0.4.5 Perceived colour
Setting lighting requirements on perceived colour is an important secondary
performance parameter.

Preparatory study on lighting systems
Month Year I 22
Perceived colour is defined3 as an attribute of visual perception consisting of any
combination of chromatic and achromatic content. This attribute can be described by
chromatic colour names such as yellow, orange, brown, red, pink, green, blue, purple,
etc., or by achromatic colour names such as white, grey, black, etc., and qualified by
bright, dim, light, dark, etc., or by combinations of such names.
Primary parameters for specifying perceived colour requirements3 are general colour
rendering index (CRI, see 1.3.3), correlated colour temperature (CCT, see 1.3.3) and
chromacity tolerances (see 1.3.3).
0.4.6 Glare
Setting requirements to prevent glare is also common practice and can provide
important secondary performance parameters.
Glare is defined2 as a condition of vision in which there is discomfort or a reduction in
the ability to see details or objects, caused by an unsuitable distribution or range of
luminance, or to extreme contrasts.
Disability glare may be expressed in a number of different ways, for example by
values of threshold increment (TI) as defined in standard CIE 31. Discomfort glare
may be expressed by means of a 'psychometric scale' derived from psychophysical
experiments, for example by using the unified glare rating (UGR) as defined in
standard CIE 117.
0.4.7 Important technical characteristics of the luminaires used
With reference to IEC 62722-2-1 on ‘Luminaire performance’ important technical
characteristics of the luminaire are:
Photometric code
Rated input luminaire power (W)
Rated Luminaire Luminous Flux (lm)
LED Luminaire Luminous Efficacy (lm/W)
Correlated Colour Temperature, CCT (K)
Colour Rendering Index, CRI (Ra 8) - initial/maintained
Chromaticity tolerance (CDCM) - within steps of MacAdam ellipses -
initial/maintained
Rated life (h) and the related lumen maintenance factor (Lx)
Failure fraction (By) corresponding to rated life
Useful Nominal lifetime (Lx.By/hours)
Rated ambient temperature (ta)
Luminous Intensity Distribution (cd/1000lm).
(see 1.3.3 for more information on these parameters).

Preparatory study on lighting systems
Month Year I 23
CHAPTER 1 MEErP Tasks 1 & 0 Report – Scope with quick SCan
1.1 Objective
The objective of Task 1 is to define the product category and the system boundaries of
the ‘playing field’ for ecodesign applicable to lighting systems, and to formulate this
from a functional, technical and environmental point of view.
Lighting provides a significant contribution to the human experience of buildings and
the outdoor environment such as street lighting at night. Buildings, the users within
them and, the type of activity they are conducting, influences the lighting
requirements that are appropriate for the conditions. The activity that is connected to
the so-called “task area” is an especially important driver for lighting requirements. As
well as needing to satisfy the basic requirements to enable the fulfilment of tasks,
general lighting of buildings provides visibility, orientation and wayfinding. Current
research shows that lighting has specific non–visual effects that influence mood,
attention and wakefulness. The quality of light & lighting are of primary importance in
many applications. Lighting system design is in many applications based on minimum
maintained quality parameters as described in European standards such as EN 12464
Lighting of work places, EN 12193 Sports lighting and EN 13201 for Road lighting.
Therefore previous EN standards define different sets of lighting requirements related
to the activity in the task area, e.g. office work.
Building users require a certain comfort level in the building. This comfort level mainly
consists of thermal and visual comfort and depends on the activities that take place in
the building. The amount of energy needed to provide this depends on many factors.
The energy needed for heating/cooling depends on the building envelope. The glazing
surface, its characteristics and orientation, determine the amount of solar gains but
also affect the average U-value of the building envelope and the amount of daylight
that enters the building. Internal heat gains also need to be taken into account for the
energy balance of the building and depend, amongst other factors, on gains from
electrical energy conversion to heat within lighting equipment. Artificial lighting, in
conjunction with natural daylight through windows, should meet requirements for
visual comfort. While lighting systems need to provide a sufficient amount of light,
they also need to avoid the risk of glare. Therefore, for example, blinds can be used
for glare protection, but also restrict solar gains. This may be a good thing if it
prevents overheating and thus reduces cooling demand but could be a negative if it
were to reduce solar gains that would otherwise have offset heating demand. Control
systems, for heating, cooling, ventilation, artificial lighting and blinds, can help
increase the energy efficiency of a building. This study focuses on the lighting system
but will also take into account its interaction with other building energy systems and
flows.
This is a parallel study to another Ecodesign study on Light Sources5, this resulted
mainly in policy recommendations to increase the initial(@100h) lamp efficacy. In this
study we will focus on many other improvement options to lower impact and energy
consumptions of installed lighting systems, such as controls, wall reflectance, optics, ..
Visual comfort is that main factor to take into account for outdoor lighting
applications, but also light wastage (such as light pollution) has to be avoided. The
part of the light that does not illuminate the targeted area is considered to be un-
5 http://ecodesign-lightsources.eu/

Preparatory study on lighting systems
Month Year I 24
useful and wasted, especially upwards light that causes sky glow and the obtrusive
light that bothers people
Task 1 is important as it provides:
an inventory of what measures already exist in the EU (with possible
regulatory failures);
an analysis of the legislation in EU Member States,;
an indication –also in view of global competitiveness and hinting at
feasible target levels—of what measures have been taken in the rest of
the world outside the EU.
The “MEErP Task 0” analysis is included in section 1.6 at the end of this chapter. This
is an optional task in addition to task 1 to be used in the case of large or
inhomogeneous product groups, where it is recommended to carry out a first product
screening considering the environmental impact and potential for improvement of the
products as referred to in Article 15 of the Ecodesign Directive. The objective is to re-
group or narrow the product scope, as appropriate from an ecodesign point of view,
for the subsequent analysis in tasks 1-7.”
1.2 Summary of Tasks 1 and 0
Note, this text has been written during a preparatory phase of this study and the
summary will be updated in the final version taking into account input that might arise
from further Tasks and/or relevant updates on standards as they might impact
proposals within the future Task 7.
This is a reviewed draft version of Task 1. In a multi stakeholder consultation, a
number of groups and experts provided comments on a preliminary draft of this
report. The report was then revised, benefiting from stakeholder perspectives and
input. All written stakeholder comments and answers are available in a separate
Annex to Task 1 that is available on the project website6. The views expressed in the
report remain those of the authors, and do not necessarily reflect the views of the
European Commission or the individuals and organisations that participated in the
consultation.
The proposed scope of the study is: the investigation of lighting systems that provide
illumination to make objects, persons and scenes visible wherein the system design
based on minimum quality parameters as described in European standards such as EN
12464 Lighting of work places and EN 13201 for Road lighting. The primary relevant
parameter is: the functional or useful luminous flux per square meter equal to the
minimum required maintained average illumination as calculated with secondary
performance parameters as defined in standards in 1 hour of operation. Aside from
this several other important lighting system parameters are defined and discussed.
The text also explains how the lighting system can be decomposed into subsystems
such as: installation, luminaire, LED module, LED control gear, etc. which is necessary
to help analyse how different aspects of the system contribute to its overall
performance and to its Ecodesign impacts.
Non-residential lighting design, as defined in the standards series EN 12464 for indoor
lighting and EN 13201 for road lighting, uses the concept of maintained minimum
lighting requirements. As a consequence, maintenance schemes and factors such as
lumen depreciation need to be taken into account although this adds additional
complexity in lighting system design. As mentioned above, this section also explains
6 http://ecodesign-lightingsystems.eu/introduction

Preparatory study on lighting systems
Month Year I 25
how the system can be decomposed into subsystems and introduces the main
parameters specified within the European and international standards to do this. This
decomposition and the relation of the system’s elements to their respective standards
on energy efficiency are graphically represented in Figure 1-1, Figure 1-2 and Figure
1-3. It is important to understand this decomposition when reading the various tasks
within the preparatory study. Much of these subsystem parameters will be
documented and discussed in Task 3 on Users impact and Task 4 on Technology.
For lighting systems there is not a direct PRODCOM category. PRODCOM is not
relevant in the context of lighting ‘systems’, because they are not recognized as
unique products and there is also not a direct PRODCOM category for lighting systems.
As a consequence of this alternative product categories were defined that are useful
for later Tasks 2, 3 and 4.
Setting out the relevant standards, definitions, regulations, voluntary and commercial
agreements on EU, MS and 3rd country level are a key aspect of this task report. For
the energy performance of lighting systems the standard prEN 15193 plays an
important role for indoor lighting, as does prEN 13201-5 for road lighting. These
provisions within these draft standards are respected to the extent possible within this
study.
As a complementary component of this Task a first screening of design factors was
performed to give a provisional indication of the relevant improvement potential, but
these figures will be updated in later Tasks.
The first screening in Task 0 showed that savings at system level can be very
significant and can reach up to 90% when comparing the worst case implementation
permitted according to the existing legislation after 2017 with the best available
techniques. Therefore the proposed scope will be investigated and calculated in more
detail in later Tasks.
1.3 Product/System scope
Objective:
According to the MEErP approach the classification and definition of the products
within this Task should be based, primarily, on the following categorizations:
• the product categories used in Eurostat’s Prodcom database;
• product categories defined within EN- or ISO-standard(s);
• Other ‘product’-specific categories (e.g. labelling, sector-specific categories), if
not defined by the above.
In principle Prodcom should be the first basis for defining the product categorisation,
since Prodcom allows for precise and reliable calculation of trade and sales volumes
(Task 2). However for lighting systems this is not evident as they concern installations
and do not correspond to the product categories defined by Eurostat, nevertheless in
Task 2 we will look at building statistics (permits, floor area) and road statistics from
Eurostat and other data sources.
The product categorizations set out above are a starting point for classifying and
defining the products and can be completed or refined using other relevant criteria
that address: the functionality of the product, its environmental characteristics and
the structure of the market where it is placed. In particular, the classification and
definition of the products should be linked to the assessment of the primary product
performance parameter (the "functional unit") that will be defined in section 1.3.3.1. If

Preparatory study on lighting systems
Month Year I 26
necessary, a further segmentation can be applied on the basis of the secondary
product performance parameters, defined in section 1.3.3.2. In that case, the
segmentation would be based on functional performance characteristics and not on
technology.
Where relevant, a description of the energy systems affected by the energy-related
products will be included, as this may influence the definition of the proposed product
scope.
The resulting ‘product’ classification and definition should be confirmed by a first
screening of the volume of sales and trade, environmental impact and potential for
improvement of the products as referred to in Article 15 of the Ecodesign Directive.
It should also be confirmed by a first screening of the volume of sales and trade,
environmental impact and potential for improvement of the products as referred to in
Article 15 of the Ecodesign Directive.
In this study a lighting ‘system’ will be considered to be a ‘product’ for the purposes of
further elaboration of the study. Lighting systems are technical systems installed in
buildings, roads or other external applications and are usually not considered as single
products brought on the market, but rather as a composition of products installed by
an installer often in accordance to the design of a lighting designer. The reason for this
is now explained. Lighting installations are elements or components of a building and
are not currently treated as distinct ‘products’ in other parts of European legislation.
As a consequence, buildings and/or their installed lighting do not presently carry a CE
label for the installation. Thus far, none of the EU harmonised Directives have
considered whether installers are involved in the “manufacture” or making of the
products they install and in consequence there are no CE marking criteria specified
under the terms of EC Decision (768/2008/EC) on a common framework for the
marketing of products in the EEA. Therefore ‘installers’ are not presently seen to be
‘lighting system manufacturers’ in any legal sense and hence have no administrative
requirements imposed on them as a result of the provisions in Article R2 or Annex II
of Decision (768/2008/EC), which specify the obligations related to technical
documentation and conformity assessment. It should also be noted that as buildings
and their lighting installations ostensibly cannot be moved or relocated the ‘free
movement of goods’ is also an irrelevant issue in this context. The consequence of this
and the potential impact on further policy options will be discussed in Task 7.
1.3.1 Definition of the lighting System scope of this study and context
The scope of this study is the lighting system considered as a holistic system
including: light source, control gear, luminaires, multiple luminaires in a system, with
sensors, controls and installation schemes (Figure 1-1). In this Figure 1-1 each system
level element has its own colour code that will be followed in the remainder of this
study. The colour coding applied is: Electrical efficiency (dark green), installation (dark
blue), luminaire (sky blue), lamp (orange), control system (light green), control gear
(red), and design process (yellow). This demarcation is done to help delineate the
various aspects of a lighting system and to enable their contribution to the overall eco-
efficiency of the system to be analysed and determined. Non-residential lighting as
defined in standard series EN 12464 on indoor lighting and EN 13201 on road lighting
use the concept of maintained minimum lighting requirements and as a consequence
maintenance schemes and factors such as lumen depreciation over life time need to
be taken into account. This creates additional complexity in the design of lighting
systems. For those who are not familiar with this concept they can consult freely

Preparatory study on lighting systems
Month Year I 27
available literature for indoor lighting requirements according to EN 124647. Road
lighting EN 13201 uses a similar approach but the precise minimum requirements may
have different specifications among the Member States, see TR/EN 13201-1 in section
1.4.2. On road lighting there is also freely available literature explaining how this
standard and its approaches are applied8. The most relevant performance parameters
used in European and international standards are defined in section 1.3.3. They will be
further documented and discussed in Task 3 which addresses the Users and Task 4
which concerns Technology. Therefore, for the further reading of the subsequent task
reports it is important to understand the decomposition presented in the figures below
and all its defined parameters, as it will be followed throughout the entire study.
Figure 1-1: Components of a lighting system and the most relevant performance
parameters related to energy efficiency
The improvement options which can be applied at light source level, such as control
gear and lamp efficacy, were already extensively studied in the eco-design study on
light sources16 thus this study will make use of this complementary information but
will not reassess it. A new aspect is that the improvement options at the installation
level and control systems level will be studied in Task 4 and beyond. In addition,
installation energy performance will be calculated according to the new standards EN
15193 and EN 13201-5.
An intention of this study is to examine the application level of lighting. In this
context, lighting system means any energy-related device or system of devices used
for the production of artificial lighting from the power supply in household lighting or
non-domestic lighting. A lighting system can therefore range from simple luminaires to
7 www.licht.de : Guide to DIN EN 12464-1 Lighting of work places –Part 1: Indoor work places, ISBN: 978-3-926193-89-6 8 www.licht.de : Guide No. 03, ‘Roads, Paths and Squares, ISBN 978-3-926193-93-3

Preparatory study on lighting systems
Month Year I 28
large scale installations with multiple luminaires and intelligent controls such as those
used in intelligent street lighting. Lighting systems can be placed on the market either
with built-in lamps that are not designed to be changed by the end-user, such as fixed
LED modules, or with exchangeable lamps/without lamps. Lighting schemes are plans
for a lighting system and allow assessment of the system at the early design stage.
‘Smart’ lighting systems based on advanced control systems are also considered in
this study.
In past Ecodesign preparatory studies of non-residential lighting the primary function
was defined as ‘provided illuminance in one hour operation’, or in particular cases of
street lighting the ‘provided luminance in one hour operation’. Other secondary
functional design parameters are for example glare reduction, uniformity, colour
rendering, and colour temperature. In non-residential lighting, system design is often
based on minimum performance levels sourced from standards. This results in lighting
system design wherein several standards and methods are involved. This is illustrated
in Figure 1-2 for public outdoor lighting and in Figure 1-3 for indoor lighting of work
places. The standards and their relevant parameters are explained in section 1.4.
For indoor lighting minimum requirements are defined in EN 12464-1 and are mainly
based on the following parameters (see also 1.3.3): maintained illuminance (Em),
UGR limits for rating glare (UGR), Uniformity (U0) and colour rendering index (Ra).
For street lighting similar requirements are defined in EN 13201 standards series.

Preparatory study on lighting systems
Month Year I 29
[lx.m²/W]
[lm/W]
prEN 13201-5’ηins=‘installation efficacy’
Installation Efficacy
prEN13201-6 proposed energy indicators:
DP[W/(lx.m²)] = CL/ηinst =Power density Indicator (PDI))
DE[kWh/(m²y)] = Em/ηins x (tfull + tred x kred) =Annual Energy consumption indicator(AECI)
= Ʃ(Pj x tj)/A
tfull = annual operating hours of the full level illumination
tred = annual operating time of the reduced level illumination
kred = power reduction coefficient for reduced level illumination
Pj = operating power of jth period
tj = duration of jth period over year in hour
Note: prEN13201-5 proposes te exclude lumens to satisfy Edge Illumination requirements,
e.g. to have light in surrounding areas
Installation design
EN 13201-2Minimum Illumination
requirements
> via simulation software
Periodic reductions
Photometric data,
Eulumdat, EN 13032,
..
Zoning, areas, ..
Road geometry,
Road surface reflection, ..
IEC TR62746-2:
story 23 lighting
Smart grid use
cases
Impact at peak
load
Electric
Power(W)
Smart city&
Control system
design
Fclo = Power correction factor for constant light output(in prEN13201 included in ηp)
control gearLuminaire
ηp (ratio <1)
= power efficiency of
luminaire
= Pls/P
Pls= power of lamps
P = system power
ηls (lumen/Watt)
= lamp efficacy in standard
conditions (= 100 h)
FLLM (ratio)=
Lamp Lumen Maintenance
Factor (CIE 154 or 97)
RLO = LOR= optical efficiency
of luminaires (standard
conditions!)
fM = Luminaire Maintenance
Factor integrated
luminaire Lamp efficacyinstallation
U = Utilance
Note for luminance
requirements:
CL = efficiency for fitting
minimum requirements and
luminance conversion
ηinst = Fclo * ( CL * U) * (FM * RLO) * ηls * ηP
FM = FLM*FLLM (e.g. LED luminaire)
FU = U * RLO = utilization factor
Control system
-1
Figure 1-2: Context of public outdoor lighting systems with related standards and
methods
On the other hand, this approach is not applied in domestic or residential lighting and
some other similar application areas. In this case lighting system design is not based
on predefined minimum performance standards but is done empirically based on the
experience of the designer, installer and/or user, user need, user preference and the
overall environmental appearance.

Preparatory study on lighting systems
Month Year I 30
Fc = Constant illimunation factor
ηp (ratio <1)
= power efficiency of
luminaire
= Pls/P
Pls= power of lamps
P = system power
ηls [lumen/Watt]
= lamp efficacy in standard
conditions (= 100 h) excl gear
FLMM=
Lamp Lumen Maintenance
Factor (CIE 154 or 97)
Assumed: LSF = 1 (spot
replacement)
RLO = Light Out Ratio
(standard conditions!)
FLM = Luminaire
Maintenance Factor
luminaire lamp control gearinstallation
U = Utilance
FCL= Em,min/Em
FRSM =room surface
maintenance factor
ηL = ηLB x ηls x ηpLuminaire luminous efficacy [lm/W],Note: ηls and ηp are not defined in EN 15193, see EN 13201-5 for definition
FU = U * RLO = utilization factor
Luminaire
Power, Pl
(W)
= Pj[lx.m²/W]
[lm/W]
Efficacy
installation
Photometric data file, Eulumdat, EN 13032
Room index(k), reflection coefficients,Position, geometry, windows, glazing ..
Zoning of task areas & surroundings
EN 15193-2
Expenditure for
lightingWnd (compare to
benchmark)
Constant
illumination
Factor, Fc
EN15193
Daylight
depedency
Factor, Fd
EN15193
Occupancy
dependency
factor, Fo
EN15193
User comfort
Factor, Fcu
EN15603
Overall building
performance and
energy balance
Relocation
flexibility
Factor, Fre
EN15232: Impact of
Building AutomationTable 1 — Function list
and assignment to BAC
efficiency classes
LENI
= Ʃ( PlxFcxFo(tdxFd+tn) +Ppcx(ts-td-tn))+Pemxte )/1000/A [kWh/(m²ts)] td =daylight time(h), tn=daylight absence time(h), ts= time step (e.g. month/year),
te =battery charge time(h), A=area
= Eavg/ηinstxFo(tdxFd+tn) +Ppcx(ts-td-tn))+Pemxte )/1000
Luminaire
emergency
standby power,
Pem (W)
Luminaire control
standby power,
Ppc (W)
LENI
heating
time period
LENI
cooling
time period
prEN 15193-1: Energy requirements for lighting, Lighting Energy Numerical Indicator:
IEC TR62746-2:
story 23 lighting
Smart grid use cases
Impact at peak load
prIEC 60364-8-1:
Low voltage electrical
installation -: Energy
efficiency
EN15251: Indoor
environmental input
parameters
(.. Operating hours ..)
LENI=
[kWh/(m²ts)]
prEN 15203Reporting information
regarding energy
consumption, indoor
conditions and possibilities
for improvement
-1
Control
system
Installation design EN 12464-1:
minimum illumination comfort
requirements, Etask, Esur [lx]:
>Via simulation software
>Via flux code EN 13032
ηinst = Fc * (FCL*FRSM*U) * (FLM* RLO) * (FLLM * ηls) * ηP
Figure 1-3: Context of indoor lighting systems for work places with related standards
and methods
Preparatory study on lighting systems
Month Year I 31
In summary the primary scope of this study is the investigation of lighting
systems that provide illumination to make objects, persons and scenes visible
wherein the system design based on minimum quality parameters as
described in European standards EN 12464-1 on lighting of indoor work
places and EN 13201 for Road lighting.
In other words, the scope is a lighting system or installation that is designed to fulfil
the minimum requirements that are included in standard EN 12464-1 or EN 13201.
This includes the design, installation, use and decommissioning of such a system.
Such a system can for example include several luminaires and sensors. The focus in
this study is on lighting ‘systems’, therefore light sources and single components such
as lamps will not be discussed in detail. These are being addressed in a separate
ongoing study concerning light sources and components (Lot 8/9/19 - Preparatory
Study on Light Sources for Ecodesign and/or Energy Labelling Requirements). Some
road or building infrastructure components do have an important impact on the
performance of a lighting system but are, however, in a strict sense not part of that
lighting system itself, for example: occupants, floor, wall, ceiling surface, power
cables, control cables, road surface, lighting poles, windows, solar blinds, etc. These
parts are often installed for other building functions and/or are connected to the
general building technical infrastructure. Cable losses fom lighting circuits were
already studied in the ‘Preparatory Studies for Product Group in the Ecodesign
Working Plan 2012-2014: Lot 8 - Power Cables’9. These building parts will be taken
into account in this study Task 3 being the system environment of the lighting system,
see Task 3.
The following types of lighting system are therefore excluded from the scope:
Lighting systems designed for other purposes than providing illumination, for
example:
o Lighting systems designed to make themselves visible for purposes of
signage or displays (e.g. advertising lights, traffic lights, television sets,
tablets, Christmas lighting chains, light art works, light art installations,
etc.).
o Lighting systems designed to make themselves visible for purposes of
signage or displays including works of art that are self-illuminating or rely
on specific illumination to achieve the artists required outcome are
therefore excluded. They are excluded from most tasks of this study
because they would lead to an inconsistent study needing separate analysis
(sales, energy consumption, life, usage characteristics, and availability of
standards, scenario analysis, policy options, and impacts).
Emergency lighting installations is also excluded because such
equipment is already covered with other regulation, has low operating
hours and was therefore excluded10 from previous eco-design
legislation.
In residential systems the standards EN 12464 and EN 13201 are not
applicable and as a consequence they are excluded.
Please note that emergency lighting equipment when integrated with
general illumination (e.g. in the UK) is proposed to be within the scope
for parts related to general illumination, see also approach in prEN
15193. If it is not integrated it is out of the scope.
9 http://erp4cables.net/ 10 http://ec.europa.eu/energy/en/topics/energy-efficient-products/lighting
Preparatory study on lighting systems
Month Year I 32
Rationale and considerations concerning the scope:
The scope indicated above is a clear definition connected to the well-established
standards in the field: EN12464 for indoor lighting and the EN 13201 series for road
lighting. Therefore lighting systems can be clearly defined, which is useful for any
further legislative purpose, and also their performance parameters can be sourced
from standards as will be documented later in section 1.4. In the Task 2 study on
markets, the Task 0 study on screening and the Task 4 on technologies the scope may
be further reduced depending on which lighting systems are relevant and where
technology is available for improvement.
Are installed lighting systems in buildings or in road lighting products covered in the
meaning of the Ecodesign of Energy Related Products Directive (2009/125/EC)?
As summarised earlier, the consequence of the scope selected for this lighting system
study is that it targets the specification, design and installation of an entire system
composed of multiple products such as luminaires, lamps, sensors, etc. This is
different from many other preparatory studies carried out to prepare implementing
measures under the Ecodesign of Energy Related Products Directive (2009/125/EC),
which have tended to be confined to factory finished products.
Up to now no EU harmonised Directive has treated installed lighting systems as
specific products by setting marking requirements for them and in consequence
installed power circuits are not currently required to carry a CE label, although
individual components within them generally are. As a result installed lighting systems
are not currently mentioned within the existing product categories of the CE product
marking Directive (93/68/EEC). The Ecodesign of Energy Related Products Directive
(2009/125/EC) defines an ‘Energy-related product’ or a ‘product’ as being 'any good
that has an impact on energy consumption during use which is placed on the market
and/or put into service, and includes parts intended to be incorporated into energy-
related products covered by this Directive which are placed on the market and/or put
into service as individual parts for end-users and of which the environmental
performance can be assessed independently'. Therefore and as a conclusion nothing
has been found to preclude the possibility of considering ‘installed lighting systems’ as
'products' and installers and designers as their 'manufacturers'. It remains a policy
option to be decided by the EC. This issue and potential policy options will be further
discussed in Task 7. In the remaining Tasks this study will therefore follow the MEErP
methodology, see 0.1, to the extent this is possible. An overview and discussion of
related legislation is given in section 1.5 of this Task report.
1.3.2 Categorisation of lighting systems
Objective:
PRODCOM is not relevant in the context of lighting ‘systems’, because lighting systems
are not recognized as unique products and therefore not included in European product
statistics. Therefore, the scope of this investigation will follow the decomposition
proposed in the context in Figure 1-1, Figure 1-2 and Figure 1-3 into so-called system
levels. Each of the levels will be discussed briefly including the main categories that
are defined in European or international standards and/or sector specific methods. The
standards are explained later in section 1.4. This categorization based on 'levels'
within the system is mainly used for the technical analysis in Task 4 that considers
improvement options. The sections hereafter are brief and generic discussion, because
in lighting system many potential products and combinations thereof are possible
which would lead us to far without contributing to the study.
It is also possible to categorise lighting systems according to the type of task area's
defined within the standard EN 12464 on indoor lighting and the EN 13201 standards
series. This approach will be briefly introduced and applied in Task 2 concerning

Preparatory study on lighting systems
Month Year I 33
market data and Task 3 concerning user requirements, including for the definition of
reference lighting system user applications. This categorisation will be introduced in a
separate section and more details described in a later section addressing these
standards and in the parts of Tasks 2 and 3 where they are relevant.
1.3.2.1 Lighting systems at design and installation level:
The lighting system at the design and installation level is denoted by the dark blue in
Figure 1-1.
This lighting system level spans the whole system approach and takes into account:
the surroundings (building, room, workplace, street, parking place, park etc.)
the means used to mount or suspend the luminaires (ceiling, wall, pole etc.)
the lighting calculation in accordance with the appropriate standard including
optimisation for energy consumption
the choice of a lighting management system including sensors, controls and
communication network
the choice of the luminaire including light source, ballast and optic
the choice of an emergency escape lighting system
and finally also the installation and commissioning of the whole system.
Depending on the application area lighting systems will be simple, more complicated
or very sophisticated. The application areas can be categorized as:
Indoor residential
Indoor non-residential, specific lighting requirements are defined in EN 12464
for task areas related to:
o Education
o Hotels & restaurants
o Hospitals and healthcare facilities
o Retail
o Offices
o Sports & recreation
o Industry
o Agriculture
o other
Outdoor public lighting
o Road lighting defined as ‘Traffic route lighting’ where motorized traffic is
predominantly motorized, typically associated with class M from prEN
13201-1:2014.
o Road lighting defined as lighting ‘Street lighting’ where traffic is
significantly mixed or predominantly non-motorized, typically associated
with class P from prEN 13201-1:2014.
o Traffic signals
o Tunnel lighting (which is not part of EN 13201, see section1.4.2)
o Monument lighting
o Other
Outdoor non-public lighting
o Service & recreational sector
o Industry, with lighting requirements as defined in EN 12464-2
o Households
o Other
Lighting standards do not exist for all categories of application area.

Preparatory study on lighting systems
Month Year I 34
The European standards EN 12464-1: ‘Light and Lighting – Lighting of indoor
workplaces’ and EN 12464-2: ‘Light and lighting – Lighting of outdoor workplaces’
impose minimum lighting and comfort levels for different task areas. They are
applicable in offices, industry halls, education buildings, outdoor workplaces, hospitals
and outdoor park places.
Only EN 50172: ‘Emergency escape lighting systems’ is applicable for use in all indoor
lighting area categories. EN 50172 does not cover private residential premises but its
provisions are applicable to common access routes within multi-storey dwellings.
For street lighting, the performance parameters can be found in EN 13201-2: ‘Road
lighting - Part 2: Performance requirements.’
EN 12193: ‘Light and lighting - Sports lighting’ does not only propose minimum levels
for lighting and comfort but also maximum values to minimise obtrusive light.
EN 13201 series covers road lighting but does not include tunnels. Tunnels are part of
national standards.
1.3.2.2 Luminaires as part of the system
The luminaire level of the lighting system is denoted by light blue in Figure 1-1.
A ”luminaire” is defined in EN 12655 as an “apparatus which distributes, filters or
transforms the light transmitted from one or more light sources. A luminaire with
integral non-replaceable lamps is regarded as a luminaire, except that the tests are
not applied to the integral lamp or integral self-ballasted lamp.
A luminaire can contain several parts wherein (see also section 0.4), for example:
A ‘LED Lamp’ meaning a technology LED light source incorporating one
or more LED package(s) or LED module(s) and provided with one or
more cap(s) as defined in CIE DIS 024/E:2015. Furthermore EN
62504:2014 requires that ‘A LED lamp is designed so that it can be
replaced by an ordinary person as defined in IEC 600500-826,
826.18.03’;
A ‘Ballast’ meaning (EN a device connected between the supply and one
or more discharge lamps which serves mainly to limit the current of the
lamp(s) to the required value;
‘LED control gear’ meaning a unit inserted between the electrical supply
system and one or more LED package(s) or LED module(s) which serves
to supply the LED package(s) or LED module(s) with its (their) rated
voltage or rated current;
Light sources and control gear are being analysed as a product group in a separate
Ecodesign study (Lot 8/9/19) as explained previously. Red is the colour coding
indicating elements applying to control gear.
1.3.2.3 Lighting control system
The lighting control system level is denoted by light green in Figure 1-1.
Lighting controls are available for almost all lighting applications and some examples
are listed below.
1.3.2.3.1 For indoor lighting (offices, indoor work places, sports halls etc.)
some control systems are:
Daylight dependent lighting control
It regulates and shuts down the artificial light output in accordance with
the level of natural light.
Preparatory study on lighting systems
Month Year I 35
It results in energy savings when daylight is available.
In some cases it can control the light individually with imperceptible
automatic dimming
It uses daylight responsive sensors, i.e. clicked onto the lamp,
integrated into the housing, etc.
Most often the daylight sensor will control a standard dimming
electronic ballast or LED-driver, typically the daylight sensor controls an
1-10V analogue input or a DALI-digital input of the control gear.
Sometimes the daylight sensor can work with proprietary control gear
using a digital signal, e.g. wireless Zigbee11.
Movement dependent lighting control
uses a sensor to switch the luminaire on or off depending on whether
any people are present in the room.
For previous systems with automatic presence and/or absence detection the
following four situations are valid according to EN 15193
'Auto On / Dimmed': the control system automatically switches the
luminaire(s) on whenever there is presence in the illuminated area, and
automatically switches them to a state with reduced light output (of no
more than 20 % of the normal 'on state') no later than 15 minutes after
the last presence in the illuminated area. In addition, no later than 15
minutes after the last presence in the room as a whole is detected, the
luminaire(s) are automatically and fully switched off.
'Auto On / Auto Off': the control system automatically switches the
luminaire(s) on whenever there is presence in the illuminated area, and
automatically switches them entirely off no later than 15 minutes after
the last presence is detected in the illuminated area.
'Manual On / Dimmed': the luminaire(s) can only be switched on by
means of a manual switch in (or very close to) the area illuminated by
the luminaire(s), and, if not switched off manually, is/are automatically
switched to a state with reduced light output (of no more than 20 % of
the normal 'on state') by the automatic control system no later than 15
minutes after the last presence in the illuminated area. In addition, no
later than 15 minutes after the last presence in the room as a whole is
detected, the luminaire(s) are automatically and fully switched off.
'Manual On / Auto Off': the luminaire(s) can only be switched on by
means of a manual switch in (or very close to) the area illuminated by
the luminaire(s), and, if not switched off manually, is automatically and
entirely switched off by the automatic control system no later than 15
minutes after the last presence is detected in the illuminated area.
Users can also manually perform presence detection with simple switches
and EN 15193 defined therefore the following two situations
manual on/ Auto Off switch.
manual On/ Off Switch + additional automatic sweeping extinction
signal.
Note: the impact in EN 15193 will depend on the control area such that often the
smaller the area the more energy savings are achieved.
The different types of daylight-responsive control systems defined in EN
15193 are:
“Manual control” (Type I), means the users controls the on:off switch.
11 http://www.zigbee.org/

Preparatory study on lighting systems
Month Year I 36
“Automatic On/off”(Type II), means the electric lighting is automatically
switched off when the maintained illuminance is achieved by daylight at
the point where the illuminance is measured. The electric lighting is
switched on again automatically when the maintained illuminance is no
longer achieved by daylight.
“On/off in stages” (Type III), means the electric lighting is switched off
in stages until the maintained illuminance is achieved by daylight at the
point where the illuminance is measured. The electric lighting is
switched on again automatically in stages when the maintained
illuminance is no longer achieved by daylight.
“Daylight responsive off” (Type IV), means the electric lighting is
switched off when the maintained illuminance is achieved by daylight at
the point where the illuminance is measured. The electric lighting has to
be turned on again manually.
“Stand-by losses, switch-on, dimmed” (Type V), means the electric
lighting is dimmed to the lowest level during usage periods (periods with
adequate daylight) without being switched off (i.e. it uses electrical
power (“stand-by losses”)). The electric lighting system is turned on
again automatically.
“No stand-by losses, switch-on, dimmed” (Type VI), means the electric
lighting is switched off and turned on again (“dimmed, no stand-by
losses, switch-on”). The electric lighting is dimmed to the lowest level
during usage periods (periods with adequate daylight) and switched off
(i.e. no electrical power is used). The electric lighting system is turned
on again automatically.
“Stand-by losses, no switch-on, dimmed” (Type VI), means as system
V, except that the electric lighting system is not turned on again
automatically.
“No stand-by losses, no switch-on, dimmed” (Type VII), means as
system VI, except that the electric lighting system is not turned on
again automatically.
Constant illumination control (EN 15193 and/or EN 13201-5)
A sensor measures the real illumination on the task area and fits it to
the required minimum value (EN 15103).
This allows for illumination level compensation to occur for changes in
the lumen maintenance of the light source, luminaire optics pollution,
line voltage changes and reflections from the environment on the
illumination level.
A constant illumination level also adapts to the levels of daylight by
dimming or switching off the lighting when sufficient daylight is
available.
Constant illumination control can also allow fine tuning to the exact
required minimum illuminances in cases where over illumination has
resulted from the selection of luminaires with higher lumen outputs
compared to the minimum required. Because constant illumination
controls monitor the light on the task they cannot differentiate between
the source of the light, e.g. artificial or natural light.
Such control is also defined in EN 15193 as “illuminance control”. Such
schemes are known as “controlled constant illuminance" schemes for
installations where a dimmable lighting system is provided and it is
possible to automatically control and reduce the initial luminaire output
to just provide the required maintained illuminance. Therefore EN 15193
also defines the constant illumination factor (Fc).

Preparatory study on lighting systems
Month Year I 37
For road lighting a similar control system is defined in EN 13201-5 as
‘constant light output CLO (of a road lighting installation)’ for ‘regulation
of the road lighting installation aiming at providing a constant light
output from the light sources’.
Combined systems
Daylight and movement sensors can be combined in one system.
These multi-sensors are very suitable for movement detection in open
plan or group offices, possibly in combination with a daylight linking
system. In these applications people usually prefer that the light is not
switched off but only dimmed in empty rooms. The office is still bright
enough for the users sitting elsewhere. The lights are only switched off
when the last person has left the office.
This system is also very useful in other indoor lighting systems e.g. in
sports halls.
Simple local lighting control for dimming or colour control
Daylight and movement sensors are combined in one system.
The lighting can be tailored to personal needs via a manual control, e.g.
with dimmers using push-buttons, rotary switch or any other personal
user interface such as smart phone.
Dynamic lighting
Dynamic lighting is the application of dynamics in the intensity, colour and distribution
of (artificial) light. Recent scientific research has proved that light dynamics have an
important biological effect and this forms the basis of new applications such as:
improving the health of people who have little or no daylight at their
workplace;
medical applications, e.g. synchronising the biological clock;
creating stimulating effects by varying light colours.
Luminaires for dynamic light can vary the intensity, colour and distribution of light.
That is why they are fitted with several lamps of different colours and connected to a
digital switch start control gear (DALI).
Building management system
Light and energy controls are integrated at the building level via building management
systems.
An example is a system that can simultaneously apply six different energy
management strategies in order to save as much power in a building as possible,
comprising:
intelligent time control
daylight dependent system
adaptation to the task environment
movement detection
individual control
limitation of the peak output.
Fixed dimming
Most lamp types, especially LEDs, lose efficacy over time and dimming systems can
compensate for this. Dimming also allows the illumination level to be fine-tuned
exactly to the minimum required, e.g. to compensate for cases when the exact lamp
wattage required was unavailable (e.g. 60 W= 0.85 * 70W).

Preparatory study on lighting systems
Month Year I 38
1.3.2.3.2 For outdoor lighting (street lighting, outdoor work places, outdoor
sports fields etc.)
Simple daylight and time responsive on/off switching system
In this system a photocell, that measures daylight levels, is combined with an
internal astronomical clock and comprises:
a photocell for daylight responsive switching per luminaire or series of
luminaires.
an embedded astronomical clock to switch off the lamp in a low traffic
night time period, e.g. from midnight until 6 AM. This astronomical clock
is adjusted based on measurements of sunset and sundown. Such a
system can detect photocell failures and continue to run on the internal
clock when a failure is detected.
optionally, a communication network (powerline or wireless) can be
installed, primarily for maintenance functions to detect lamp
malfunctioning or to change the night time switching schemes (e.g. in
weekend regime with no switch off after midnight).
Management system with dimming
Street lighting is designed to meet the requirements for a road category as defined in
the standards depending on traffic density. But this density can decrease during night
time and road categorization can change. So dimming based on a nightly time
schedule can be installed. Moreover street lights, especially LEDs, lose efficacy over
time and dimming systems can compensate for this. Dimming allows also to fine-tune
the illumination level exactly to the minimum required, e.g. to compensate when the
exact lamp required wattage was unavailable (e.g. 60 W= 0.85 * 70W).
Management system with dimming and presence detection
This system has additional sensors that react on the presence of persons or vehicles to
dim or switch on or off parts of the installation.
Management system with dimming, presence detection and speed detection
In an installation that is dimmed or switched off, speed detection could be used to dim
up or down the installation pole per pole to anticipate the road lighting level for a
vehicle that drives on that road.
Constant illumination control (EN 15193 and/or EN 13201-5)
(see indoor lighting in 1.3.2.3.1)
Note: Every application (offices, hallways, warehouses, streets, etc.) demands a
specific light control strategy. This is possible per luminaire or alternatively sensors
can be integrated in a master-slave mode and used to control luminaires as a group.
1.3.2.4 Lighting system design and calculation software
The lighting system design level is denoted by the yellow colour in Figure 1-1.
Lighting calculation software depends on three important components to produce
accurate calculations: the skill of the designer with awareness on standard
requirements (and procedures), the selected light sources, and the surfaces within the
model.

Preparatory study on lighting systems
Month Year I 39
The selected light sources are characterized by their photometric data. For the
presentation of this data, different file formats are used of which a selection of open
source file standards are as follows:
EULUMDAT (frequently used) is also a data file format used for specification of
photometric data from light sources such as lamps and luminaries. The file extension
is .ldt. The format was proposed by Axel Stockmar (Light Consult Inc., Berlin) in 1990.
The format is an equivalent to the CEN file format.
IES file format (frequently used) was developed by the Illuminating Engineering
Society of North America (IES) especially for the Electronic Transfer of Photometric
Data. All ANSI/IESNA LM-63-2002 filenames end with the file extension .ies or .IES.
CIBSE file format was developed by the British Chartered Institution of Building
Service Engineers (CIBSE) and is the most commonly used format in the UK.
CEN file format (never widely adopted) is the format as specified in the European
standard EN 13032-1 (2004) : ‘Light and lighting — Measurement and presentation
of photometric data of lamps and luminaires — Part 1: Measurement and file format.’
Even 10 years after the adoption of this standard, many manufacturers still use other
file formats for specifying their lamps or luminaires.
XML (OXL) format (used in Litestar 4D) is a relative new public open file format12
and follows with the modern technology of XML type13 files which are today widely
used in many other applications.
All available lighting software options use one of two methods of calculation: radiosity
or raytracing. To better understand how lighting software accurately calculates lighting
levels, radiosity and raytracing must be differentiated.
Radiosity Vs. Raytracing14
Radiosity is a calculation method that divides each surface into small pieces, called
patches. Each patch is calculated individually for the amount of light that enters or
leaves that surface. The program then solves the system of equations in the model by
determining the quantity of light on each patch as a result of the total sum of all the
patches. This method works well for all matte model surfaces since radiosity is based
on Lambertian reflectance calculations. Lambertian reflectance refers to surfaces that
have reflected light scattered in such a way that the apparent brightness of the
surface is the same regardless of the observer's angle of view. Because of the surface
dependency of the calculation, the radiosity method can calculate a model once and
produce any desired view. A disadvantage to the radiosity method is that it applies to
matte and diffuse surfaces only, so contributions from translucent, transparent, and
specular (shiny) surfaces are not included in the calculation.
Raytracing, on the other hand, is a point-specific lighting calculation process.
Calculation rays are sent outward from a particular viewpoint and the program follows
each ray as it hits and reflects off different surfaces and divides into more rays. This
method works for all object types including transparent, translucent, and specular
surfaces. Raytracing creates beautiful renderings and presentation-quality images by
visually representing light on all surfaces, including the sparkle and highlights on
specular materials. Unlike radiosity, raytracing is view dependent, meaning renderings
12 http://www.oxytech.it/Files/Doc/Manuals/LTS4D_OXL-UK.pdf 13 http://www.w3.org/TR/REC-xml/ 14 http://www.archlighting.com/find-articles.aspx?byline=Jen%20Bickford

Preparatory study on lighting systems
Month Year I 40
must be recalculated from each new angle. Additionally, raytracing can be a slow
process, especially if the model contains a large quantity of surfaces.
All lighting software uses one or both of these two options to calculate the illuminance
and luminance of surfaces and also provisions to export lighting calculation data.
The most commonly used programmes, free of charge, in Europe are DIALux and
RELUX.
DIALux:
created in 1994, is a free of charge lighting calculation software. A group of
more than 90 international luminaire manufacturers funded the development of
DIALux and pay to have their luminaires included with the software package.
Updated and maintained by an independent company, DIAL GmbH, DIALux is
frequently modified and refined to the requirements of designers. Because the
software includes so many different manufacturer fixture libraries, the program
retains a type of neutrality. The current release can be downloaded at
dialux.com and is available in 26 languages. It is widely used in Europe. Dialux
already calculate lighting energy consumption according to EN 15193, but not
in interaction with the other energy consuming equipment within the building.
RELUX:
is also free of charge lighting calculation software with a large amount of
current product data from luminaire, lamp and sensor manufacturers. It also
offers sophisticated program add-ons for the professional tasks involved in
lighting planning; these are not free of charge.
LITESTAR 4D:
This Italian software from OxyTech is not free of charge, is mainly used in Italy
and has also an extended library of luminaires, and now comes with OXL (xml)
file format.
Also many luminaire manufacturers have their own lighting calculation tools but only
for their own luminaires.
As all the preceding programs use a library of luminaires, it is not easy to calculate
luminaires that are not represented in their libraries. An exception to this rule is the
street lighting calculation software Ulysse, developed by Schréder. This user-friendly
software can calculate the necessary luminance and illuminance levels as well as
several other parameters in order to provide the optimum solution for various lighting
applications. It also allows the introduction of other luminaires and can use different
file formats for luminaire data such as EULUMDAT, IES, CIBSE and CEN. So this
software minimises barriers due to file format and optimisation needs.
A guideline is available to evaluate the accuracy of lighting design software, see CIE
171 discussed in section 1.4.2.
Three main gaps can be observed for lighting calculation software:
At the moment, different file formats for luminaire data are used, but
most of the programmes cannot calculate with all formats.
Many programmes only calculate an installation without optimising to
the most energy efficient solution.
Although universities in Germany have done research on calculation
software and CIE 171 provides a guideline on the method for indoor
lighting, there are few calculation programmes that are certified by an
independent authority.
There is also a software program called DAYSIM. This is a RADIANCE-based
daylighting analysis software that models the annual amount of daylight in and around

Preparatory study on lighting systems
Month Year I 41
buildings. DAYSIM allows users to model dynamic facades systems ranging from
standard venetian blinds to state-of-the-art light redirecting elements, switchable
glazing and combinations thereof. Users may further specify complex electric lighting
systems and controls including manual light switches, occupancy sensors and
photocell controlled dimming.
Simulation outputs range from climate-based daylighting metrics such as daylight
autonomy and useful daylight illuminance to annual glare and electric lighting energy
use. DAYSIM also generates hourly schedules for occupancy, electric lighting loads and
shading device status which can be directly coupled with thermal simulation engines
such as EnergyPlus, eQuest and TRNSYS.
1.3.2.5 Lighting control communication systems
This is a relative new area wherein also often new technologies and standards are
introduced to the market.
Examples of wired lighting communication systems are:
DALI15 (following standard IEC 62386)
DMX512: Is a method for linking controllers (such as a lighting console)
to dimmers and special effects devices. DMX has also expanded to uses
in non-theatrical interior and architectural lighting.
Examples of a wireless lighting communication system are:
ZigBee Light Link Standard.
Bluetooth operated smart lamps.
An example of a power line lighting control system is:
LEDOTRON: is a digital dimming method using the powerline for data
transmission and uses therefore the existing wiring.
1.3.2.6 Retrofittable components for luminaires
See preparatory study on light sources16 and the Omnibus review.
1.3.2.7 Summary of proposed lighting system categories based on technology
levels within a lighting system
Lighting system categories have been proposed that follow the decomposition the
system into 'system design or installation level' itself and its subsystems 'luminaires',
'control system', 'lighting system design software' and 'Lighting Control
Communication Systems'. This follows the structure introduced in the previous section
1.3.1 and can be aligned with the parameters and approaches defined in existing
standards as will be illustrated in the following sections.
1.3.2.8 Categorization of lighting systems according to EN 12464 Task Area's
or EN 13201 Road Classes
The standard EN 12464 defines the zoning of work places and their illumination
requirements. This comprises the following areas:
Task area as the area within which the visual task is carried out.
The area surrounding the task area within the visual field
15 http://www.dali-ag.org/discover-dali/dali-standard.html 16 http://ecodesign-lightsources.eu/

Preparatory study on lighting systems
Month Year I 42
The area adjacent to the immediate surroundings.
For each type of area specific minimum requirements are formulated depending on the
application, see Figure 1-4. The technical parameters within these are explained in
section 1.3.3.2 and the standard is discussed in section 1.4.2.
Hence it is possible to categorise lighting systems as combinations of the Task Area’s
defined in EN 12464. This might be useful in Tasks 2 and 3. Such specific Task Areas
can be linked to building statistics, for example office buildings.
Figure 1-4 Specific minimum lighting requirements for Offices in EN 12464.
The same can be done for road or street lighting. Eurostat provides data on road
categories and they can be linked to typical lighting requirements formulated in EN
13201-2.
Eurostat also provides road transport infrastructure statistics, which contain the
following road categories:
- Motorways, which belong typically to EN 13201-2(2016) or CIE 115 ‘road class
M’ (Motorized traffic).
- E-roads: which also belong typically to EN 13201-2(2016) or CIE 115 ‘road
class M’ (Motorized traffic).
- State, province and communal roads, which belong typically to EN 13201-
2(2016) or CIE 115 ‘road class C’ (Conflict area traffic).
In each EN 13201-2(2016) road class (M, C, P), e.g. M, several subclasses exists, e.g.
M1 to M6 with M6 having the highest light levels.
- Other roads inside or outside built up areas: which also belong typically to EN
13201-2(2016) oe CIE 115 ‘road class P’ (Pedestrian Area traffic).
For more information on the EN13201-2(2016) standard series see section 1.4.2. Such
a subdivision can be useful in in Tasks 2 and 3 to analyse market data and to define
typical applications.
1.3.3 Definition of the performance parameters for lighting systems
1.3.3.1 Primary performance parameter (functional unit)
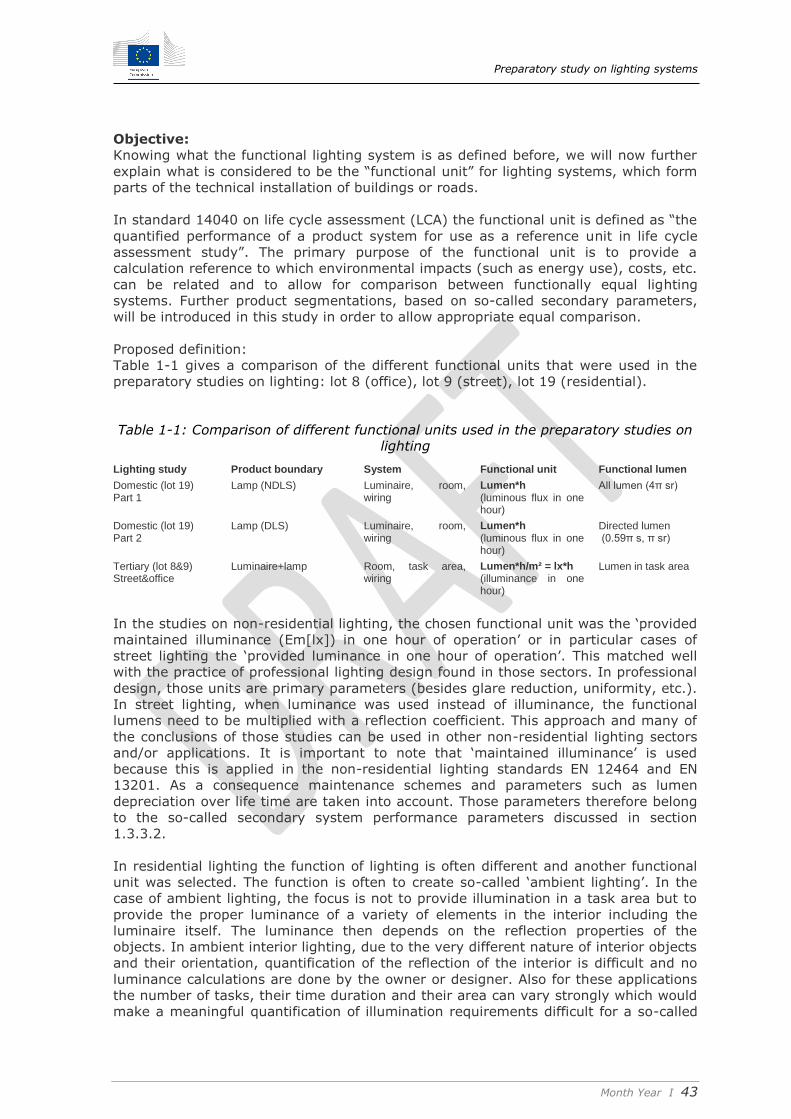
Preparatory study on lighting systems
Month Year I 43
Objective:
Knowing what the functional lighting system is as defined before, we will now further
explain what is considered to be the “functional unit” for lighting systems, which form
parts of the technical installation of buildings or roads.
In standard 14040 on life cycle assessment (LCA) the functional unit is defined as “the
quantified performance of a product system for use as a reference unit in life cycle
assessment study”. The primary purpose of the functional unit is to provide a
calculation reference to which environmental impacts (such as energy use), costs, etc.
can be related and to allow for comparison between functionally equal lighting
systems. Further product segmentations, based on so-called secondary parameters,
will be introduced in this study in order to allow appropriate equal comparison.
Proposed definition:
Table 1-1 gives a comparison of the different functional units that were used in the
preparatory studies on lighting: lot 8 (office), lot 9 (street), lot 19 (residential).
Table 1-1: Comparison of different functional units used in the preparatory studies on
lighting
Lighting study Product boundary System Functional unit Functional lumen
Domestic (lot 19) Part 1
Lamp (NDLS) Luminaire, room, wiring
Lumen*h (luminous flux in one hour)
All lumen (4π sr)
Domestic (lot 19) Part 2
Lamp (DLS) Luminaire, room, wiring
Lumen*h (luminous flux in one hour)
Directed lumen (0.59π s, π sr)
Tertiary (lot 8&9) Street&office
Luminaire+lamp Room, task area, wiring
Lumen*h/m² = lx*h (illuminance in one hour)
Lumen in task area
In the studies on non-residential lighting, the chosen functional unit was the ‘provided
maintained illuminance (Em[lx]) in one hour of operation’ or in particular cases of
street lighting the ‘provided luminance in one hour of operation’. This matched well
with the practice of professional lighting design found in those sectors. In professional
design, those units are primary parameters (besides glare reduction, uniformity, etc.).
In street lighting, when luminance was used instead of illuminance, the functional
lumens need to be multiplied with a reflection coefficient. This approach and many of
the conclusions of those studies can be used in other non-residential lighting sectors
and/or applications. It is important to note that ‘maintained illuminance’ is used
because this is applied in the non-residential lighting standards EN 12464 and EN
13201. As a consequence maintenance schemes and parameters such as lumen
depreciation over life time are taken into account. Those parameters therefore belong
to the so-called secondary system performance parameters discussed in section
1.3.3.2.
In residential lighting the function of lighting is often different and another functional
unit was selected. The function is often to create so-called ‘ambient lighting’. In the
case of ambient lighting, the focus is not to provide illumination in a task area but to
provide the proper luminance of a variety of elements in the interior including the
luminaire itself. The luminance then depends on the reflection properties of the
objects. In ambient interior lighting, due to the very different nature of interior objects
and their orientation, quantification of the reflection of the interior is difficult and no
luminance calculations are done by the owner or designer. Also for these applications
the number of tasks, their time duration and their area can vary strongly which would
make a meaningful quantification of illumination requirements difficult for a so-called

Preparatory study on lighting systems
Month Year I 44
task area. Finally, in residential applications part of the light generated within a
luminaire is often used to provide luminance on the decorative ornaments of the
luminaire itself and the usefulness and/or function is hard to quantify.
The relevant primary parameter is:
The functional or useful luminous flux (Ф [lm]) per square meter(Ai[m²])
equal to the minimum required maintained average illumination (Em,min
[lx]) as calculated with secondary performance parameters as defined in
standards in 1 hour of operation [1 lx/h = 1 lm/(m².h)]
Notes:
The unit 1 lumen per square meter is equivalent to 1 lux, hence
illuminance (Em);
Em, min in indoor lighting is the minimum average maintained
illuminance (Em) specified for the task area in EN 12464-1.
For road lighting where luminance(Lm) is used instead of illuminance
(Em), the following conversion formula can be used(see also EN 13201-
5), assuming a reference asphalt reflection coefficient:
Em,min = Lm,min/0.07
For road lighting where hemispherical illuminance(Ehs) is used instead
of illuminance(E), the following conversion formula can be used(see also
in EN 13201-5):
Em,min = Lm,min/0.65
where:
Em,min is the minimum average maintained illuminance of the functional
unit
Lm,min is the minimum average maintained luminance (cd/m²)
Ehs, min is the minimum average maintained hemispherical illuminance
(lx)
1.3.3.2 The secondary performance parameters used to calculate the primary
performance parameter are (see EN 12665)17
Objective:
This section lists the secondary parameters are listed that are sourced from the
relevant European and international standards. Details from the standards and
potential gaps are discussed in section 1.4. The decomposition proposed in Figure 1-1
in section 1.3.1 is abided by and this structure or ‘categorization’ will also be applied
in later Tasks, e.g. in Task 3 on Users and Task 4 on Technology. Those tasks will also
give more background and data compared to the simple listing presented below. At
this stage in Task 1 it is important to conclude/evaluate whether all necessary
parameters required to define the performance of the lighting system can or cannot be
sourced from available standards.
The principal design parameters which shall be considered when determining the
lighting requirements are:
17 The definitions of ‘nominal’ and ‘rated’ value are not mentioned in EN 12665(2002), but in several other standards such as EN 60081 and EN 50294. A ‘rated value’ is the value of a quantity used for specification purposes, established for a specified set of operating conditions of a product. Unless stated otherwise, all requirements are set in rated values; a ‘nominal value’ is the value of a quantity used to designate and identify a product
Preparatory study on lighting systems
Month Year I 45
Maintained illuminance, Em [1 lx = 1 lm/m²]
value below which the average illuminance on the specified area should
not fall, for example as specified in EN 12464 or EN 13201;
Maintained luminance, Lm [1 Cd/m²]
Is the minimum average luminance or value below which the average
luminance on the specified area should not fall, for example as specified
in EN 13201;
Illuminance uniformity, U0
Ratio of minimum illuminance to average illuminance on a surface, for
example as specified in EN 12464 or 13201.
Unified Glare Rating, UGR
The degree of discomfort glare caused by a lighting system according to
standard CIE 190.
Threshold Increment, TI
The measure of disability glare expressed as the percentage increase in
contrast required between an object and its background for it to be seen
equally well with a source of glare present (standard CIE 150).
The colour related parameters are discussed with the light
sources
Others can be defined in task 3.
Important energy performance parameters are:
Lighting Energy Numeric Indicator, LENI [kWh/m²year]
The estimated annual power consumption of the indoor lighting system
according to EN 15193.
Annual Energy Consumption Indicator, AECI or PE
[kWh/m²year]
The estimated annual power consumption of the road lighting system
according to prEN 13201-5.
Installation luminous efficacy , ηinst [lm/W]
The quotient of the functional lumen needed to satisfy the minimum
illumination requirements versus the input power(Annex B, prEN 13201-
5, as defined for this study).
Lighting power density indictor, PDI or DP[W/(lx.m²) = W/lm]
value of the system power divided by the value of the product of the
surface area to be lit and the calculated maintained average illuminance
value on this area according to EN 13201-3 (unit: W.lx-1.m2 or W/lm).
Note this is and the reverse value of installation luminous efficacy (Dp =
=CL/ηinst).
Important secondary control gear parameters are:
Maximum luminaire power, Pl [W]
The luminaire power Pi shall be the declared circuit power of the
luminaire when operating at maximum power. The value of Pi shall
include the power supplied to operate all lamp(s), ballast(s) and other
component(s) when operating at maximum power(EN 15193);
Rated lamp power, Pr [W]
Quantity value of the power consumed by the lamp for specified
operating conditions. The value and conditions are specified in the
relevant standard;
Nominal lamp power, Wlamp [W]
Approximate wattage used to designate or identify the lamp;

Preparatory study on lighting systems
Month Year I 46
Power efficiency of luminaires ηp
ratio between power of lamp(s) and the maximum luminaire power
(Annex B, prEN13201-5);
Ballast maintenance factor, FBM (defined in previous preparatory
studies)
the ratio of the worst ballast efficiency at a given time in its life to the
initial ballast efficiency in standard conditions;
Ballast Reliabilty, BR
The percentage of failed ballast per 1000h @70°C operating
temperature (defined in lot 8&9). Note: for LED luminaires new but
similar failure parameters are defined with luminaires;
Ballast gain factor, BGF (defined in previous preparatory
studies)
Because the energy savings by dimming are related to a feature in the
ballast type, a correction factor ‘Ballast Gain Factor’ can be introduced.
As Pdim = Pnormal / FBG
and Pdim < Pnormal
it is obvious that FBG > 1 for dimmable ballasts. For non-dimmable ballasts FBG
= 1.
Important lamp/light source parameters are:
Luminous efficacy of a light source used in the installation, ηls
[lm/W]
Quotient luminous flux emitted by the power consumed by the light
source excluding energy consumed by the gear and any other electrical
devices(Annex B, prEN 13201-5);
Rated luminous flux, Фr [lm]
value of the initial luminous flux of a given type of lamp declared by the
manufacturer or the responsible vendor, the lamp being operated under
specified conditions;
Nominal luminous flux, Фn [lm]
A suitable approximate quantity value of the initial luminous flux of the
lamp,
Lamp Lumen Maintenance Factor, FLLM
Ratio of the luminous flux emitted by the lamp at a given time in its life
to the initial luminous flux;
LED module rated life, Lx (IEC 62717)
length of time during which a LED module provides more than claimed
percentage x of the initial luminous flux, under standard conditions;
Lamp Survival Factor, FLS
Fraction of the total number of lamps which continue to operate at a
given time under defined conditions and switching frequency;
LED module failure fraction, Fy (IEC 62717)
percentage y of a number of LED modules of the same type that at their
rated life designates the percentage (fraction) of failures;
CIE general colour rendering index, CRI [Ra]
Mean of the CIE special colour rendering indices for a specific set of a
test colour samples. ‘a’ indicates the number of colour samples the
colour rendering index is based on: e.g. R8 or R20.);
Chromaticity coordinates
Coordinates which characterise a colour stimulus (e.g. a lamp) by a

Preparatory study on lighting systems
Month Year I 47
ratio of each set of tristimulus values18 to their sum.
The CIE defines different colour spaces with its own coordinates, for
light sources the most common system is 'CIE xy' also known as 'CIE
1931 colour space'. The gamut of all visible chromaticities on the CIE
plot is tongue-shaped or horseshoe-shaped shown in colour in Figure
1-5. Light with a flat energy spectrum (white) corresponds to the point
(x,y) = (0.33 ,0.33);
Figure 1-5: The CIE 1931 x,y chromaticity space, also showing the chromaticities of
black-body light sources of various colour temperatures (Tc), and lines of constant
correlated colour temperature (Tcp).
Colour temperature, Tc[K]
Temperature of a Planckian radiator whose radiation has the same
chromaticity as that of a given stimulus;
Correlated colour temperature, Tcp[K]
Temperature of a Planckian (black body) radiator whose perceived
colour most closely resembles that of a given stimulus at the same
brightness and under specified viewing conditions. The recommended
method for calculation is included in CIE publication 1519;
Standard Deviation Colour Matching, SDCM (IEC 62717)
SDCM has the same meaning as a MacAdam ellipse. A 1-step MacAdam
ellipse defines a zone in the CIE 1931 2 deg (xy) colour space within
which the human eye cannot discern colour difference;
Lamp gain factor, LGF (defined in previous preparatory studies)
a correction factor for lamp efficacy to take into account the higher
apparent luminance of white light sources in mesopic view (see the
study on Public Street Lighting ).
Important Luminaire parameters are:
Luminous Intensity, I, of a source in a given direction, [cd]
Quotient of the luminous flux dΦ leaving the source and propagated in
the element of solid angle dΩ
18 Tristimulus values means the amounts of the three reference colour stimuli required to match the colour of the stimulus considered (e.g. a lamp). As the sum of three chromaticity coordinates equals 1, two of them are sufficient to define a chromaticity. 19 CIE 15: 2004 Colorimetry, 3rd ed.
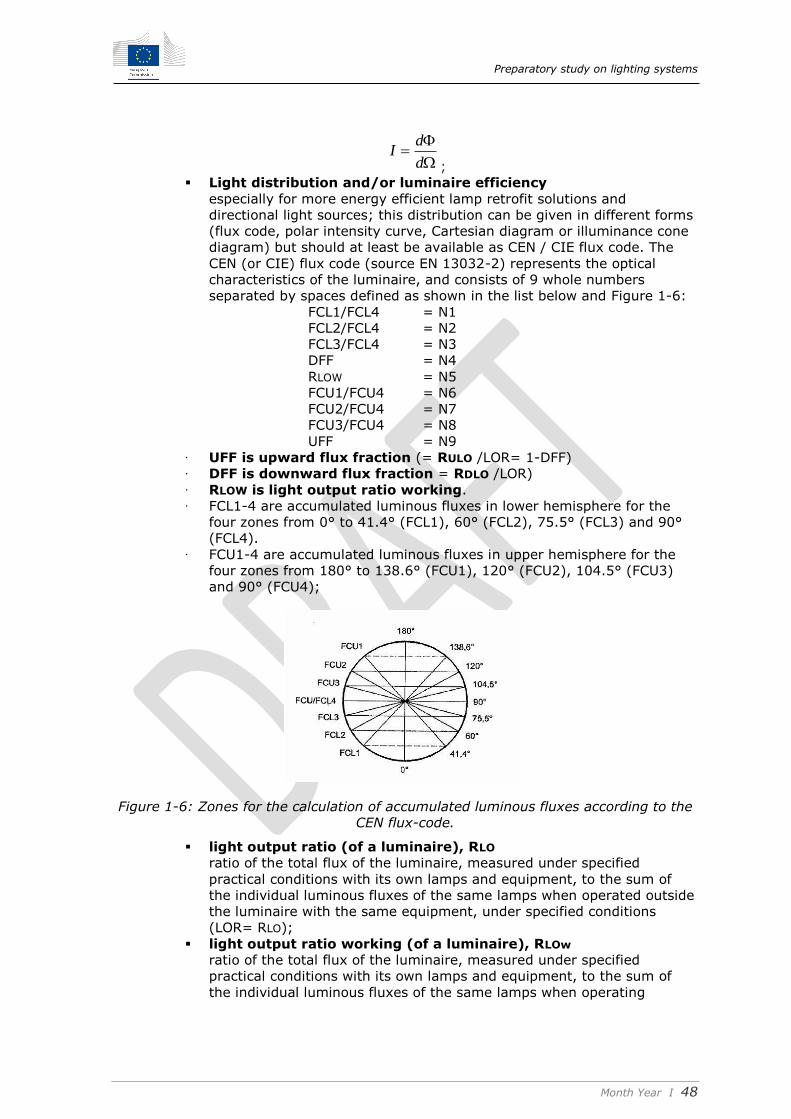
Preparatory study on lighting systems
Month Year I 48
d
dI
;
Light distribution and/or luminaire efficiency
especially for more energy efficient lamp retrofit solutions and
directional light sources; this distribution can be given in different forms
(flux code, polar intensity curve, Cartesian diagram or illuminance cone
diagram) but should at least be available as CEN / CIE flux code. The
CEN (or CIE) flux code (source EN 13032-2) represents the optical
characteristics of the luminaire, and consists of 9 whole numbers
separated by spaces defined as shown in the list below and Figure 1-6:
FCL1/FCL4 = N1
FCL2/FCL4 = N2
FCL3/FCL4 = N3
DFF = N4
RLOW = N5
FCU1/FCU4 = N6
FCU2/FCU4 = N7
FCU3/FCU4 = N8
UFF = N9
· UFF is upward flux fraction (= RULO /LOR= 1-DFF)
· DFF is downward flux fraction = RDLO /LOR)
· RLOW is light output ratio working.
· FCL1-4 are accumulated luminous fluxes in lower hemisphere for the
four zones from 0° to 41.4° (FCL1), 60° (FCL2), 75.5° (FCL3) and 90°
(FCL4).
· FCU1-4 are accumulated luminous fluxes in upper hemisphere for the
four zones from 180° to 138.6° (FCU1), 120° (FCU2), 104.5° (FCU3)
and 90° (FCU4);
Figure 1-6: Zones for the calculation of accumulated luminous fluxes according to the
CEN flux-code.
light output ratio (of a luminaire), RLO
ratio of the total flux of the luminaire, measured under specified
practical conditions with its own lamps and equipment, to the sum of
the individual luminous fluxes of the same lamps when operated outside
the luminaire with the same equipment, under specified conditions
(LOR= RLO);
light output ratio working (of a luminaire), RLOw
ratio of the total flux of the luminaire, measured under specified
practical conditions with its own lamps and equipment, to the sum of
the individual luminous fluxes of the same lamps when operating
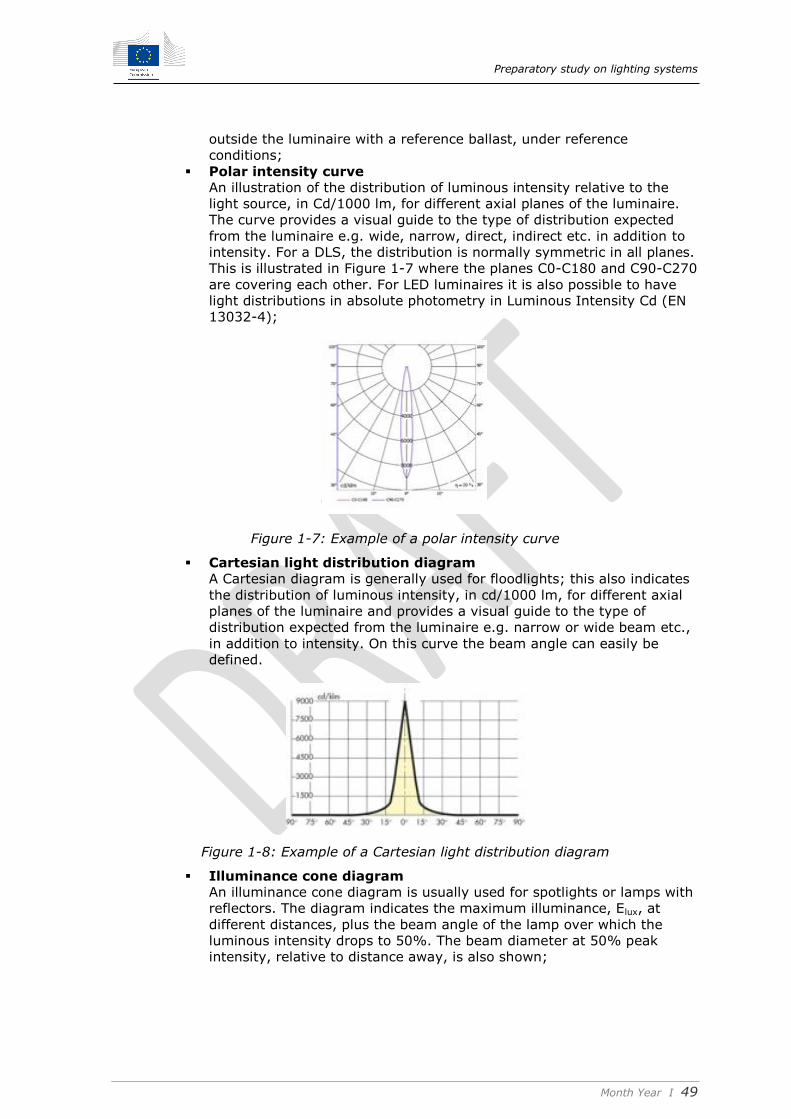
Preparatory study on lighting systems
Month Year I 49
outside the luminaire with a reference ballast, under reference
conditions;
Polar intensity curve
An illustration of the distribution of luminous intensity relative to the
light source, in Cd/1000 lm, for different axial planes of the luminaire.
The curve provides a visual guide to the type of distribution expected
from the luminaire e.g. wide, narrow, direct, indirect etc. in addition to
intensity. For a DLS, the distribution is normally symmetric in all planes.
This is illustrated in Figure 1-7 where the planes C0-C180 and C90-C270
are covering each other. For LED luminaires it is also possible to have
light distributions in absolute photometry in Luminous Intensity Cd (EN
13032-4);
Figure 1-7: Example of a polar intensity curve
Cartesian light distribution diagram
A Cartesian diagram is generally used for floodlights; this also indicates
the distribution of luminous intensity, in cd/1000 lm, for different axial
planes of the luminaire and provides a visual guide to the type of
distribution expected from the luminaire e.g. narrow or wide beam etc.,
in addition to intensity. On this curve the beam angle can easily be
defined.
Figure 1-8: Example of a Cartesian light distribution diagram
Illuminance cone diagram
An illuminance cone diagram is usually used for spotlights or lamps with
reflectors. The diagram indicates the maximum illuminance, Elux, at
different distances, plus the beam angle of the lamp over which the
luminous intensity drops to 50%. The beam diameter at 50% peak
intensity, relative to distance away, is also shown;

Preparatory study on lighting systems
Month Year I 50
Figure 1-9: Example of an Illuminance Cone Diagram
Beam angle
The angle between those points on opposite sides of the beam axis
where the intensity drops to 50% of the maximum, mostly specified on
the Cartesian light distribution diagram.
The beam can also be defined by a solid angle; the mathematical
relationship between the solid angle (Ω) of the beam and the beam
angle (θ) in ° is:
Ω [sr] = 2π * (1 – cos θ/2)
Peak intensity, [cd]
The maximum luminous intensity (normally in the centre of the beam
angle), see standard EN 61341;
Ingress protection code IP X1 X2
X1 indicates the degree that equipment is protected against solid foreign
bodies intruding into an enclosure,
X2 indicates the degree of protection of the equipment inside the
enclosure against the harmful entry of various forms of moisture;
Luminaire maintenance factor, FLM
defined as the ratio of the light output ratio of a luminaire at a given
time to the initial light output ratio;
LED luminaire rated life, Lx
length of time during which a LED module provides more than claimed
percentage x of the initial luminous flux, under standard conditions
(ZVEI definition);
LED luminaire failure fraction, Fy (IEC 62717)
at their rated life designates the percentage (fraction) of failures;
LED luminaire gradual failure fraction, By (IEC 62717)
The percentage of LED luminaires that fall below the target luminous
flux of x percent (see x of Lx) at the end of their designated life;
LED luminaire catastrophic failure rate, Cz (IEC 62717)
The percentage of LED luminaires that have failed completely by the
end of rated life 'Lx'is expressed by 'Cz';
rated ambient temperature performance, tp (°C) (IEC 62717)
highest ambient temperature around the luminaire related to a rated
performance of the luminaire under normal operating conditions, both
as declared by the manufacturer or responsible vendor. Note: where a
rated ambient performance temperature tp other than 25 °C is advised
by the manufacturer a correction factor will need to be established to
correct the measured luminous flux value at 25 °C to the luminous flux

Preparatory study on lighting systems
Month Year I 51
value at the declared ambient. This shall be done using relative
photometry in a temperature controlled cabinet.
Important Installation parameters are:
Utilization factor, FU
ratio of the luminous flux received by the reference surface to the sum
of the individual total fluxes of the lamps of the installation. Note that
the UF is not only dependent on the luminaire itself but also on the
accordance between the light distribution and the geometry of the
surface to be lit and especially on the exact installation of the luminaire
(putting into service);
Utilance of an installation for a reference surface, U
ratio of the luminous flux received by the reference surface to the sum
of the individual total fluxes of the luminaires of the installation (IEC
50/CIE 17.4). It can be calculated analytically from the geometry and
light distribution such as in EN 13201-2 or with lighting design software;
Useful Utilance for a reference surface, UU (prEN13201-6)
ratio of the minimum luminous flux received by the reference surface to
the sum of the individual total fluxes of the luminaires of the installation
to achieve the minimum required illumination/luminance;
Correction factor for over-lighting, CL (prEN13201-5) or FCL (this
study)
ratio of the luminous flux just sufficient to comply with the lighting
requirements received by the reference surface to the (actual) luminous
flux received by the reference surface. The luminous flux sufficient to
comply with the lighting requirements (=Em,min/Em),
where:
Em,min is the required minimum average illuminance.
For road lighting requirements based on luminance:
Em,min=Lmin⁄0,07
For requirements based on hemispherical illuminance:
Em,min=Ehs⁄0,65
Correction and conversion factor for over lighting and for luminance or
hemispherical illuminance based lighting designs CL;
Room surface maintenance factor, FRSM
is a factor that takes into account the decrease of the reflectance of the
walls and ceilings during the use phase;
Other important installation parameters such as reflection
coefficients of surfaces and geometry are defined in Task 3.
The generic formula to calculate the functional unit from the secondary
lighting system performance parameters is included in Figure 1-1. Figure 1-2
contains the formulas for road lighting and Figure 1-3 for indoor lighting.
Examples of other important performance parameters are:
Operational lifetime
A combination of LSF and LLMF newly introduced in some draft
standards (EN 62612)
Length of time during which a lamp provides more than xx% of the
original, rated luminous flux (e.g. LLMF ≥ 0.70 or ≥ 0.50 indicated as
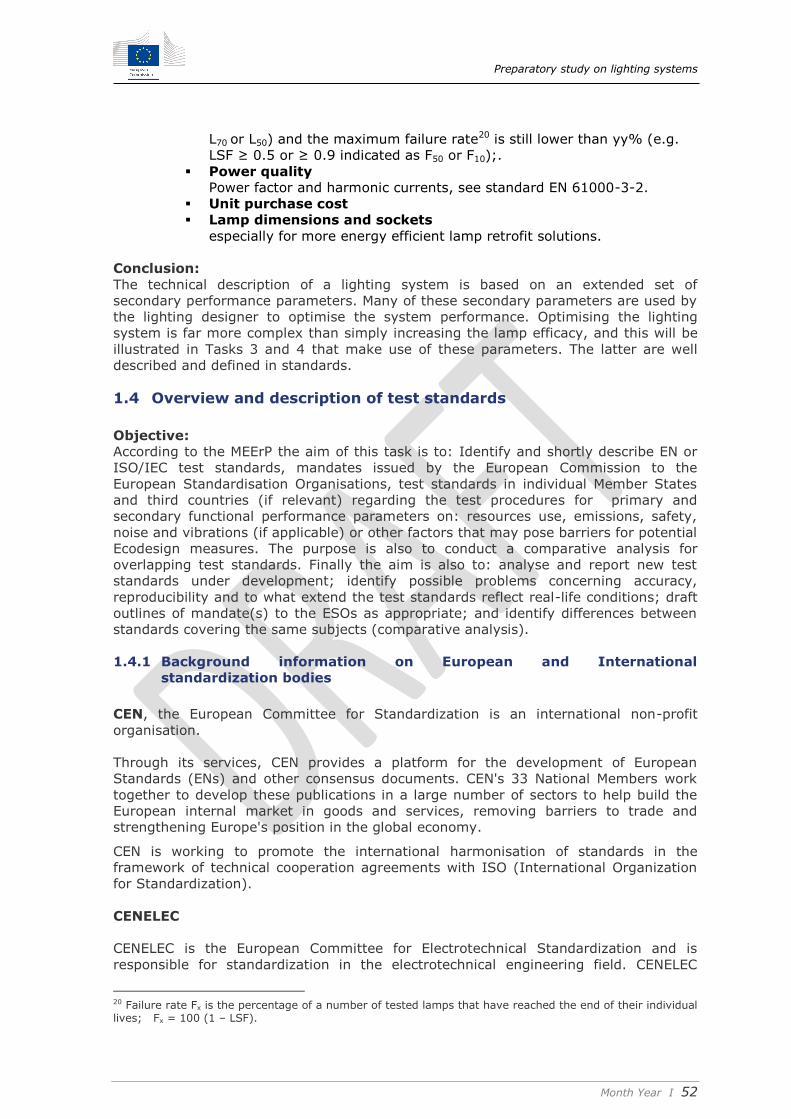
Preparatory study on lighting systems
Month Year I 52
L70 or L50) and the maximum failure rate20 is still lower than yy% (e.g.
LSF ≥ 0.5 or ≥ 0.9 indicated as F50 or F10);.
Power quality
Power factor and harmonic currents, see standard EN 61000-3-2.
Unit purchase cost
Lamp dimensions and sockets
especially for more energy efficient lamp retrofit solutions.
Conclusion:
The technical description of a lighting system is based on an extended set of
secondary performance parameters. Many of these secondary parameters are used by
the lighting designer to optimise the system performance. Optimising the lighting
system is far more complex than simply increasing the lamp efficacy, and this will be
illustrated in Tasks 3 and 4 that make use of these parameters. The latter are well
described and defined in standards.
1.4 Overview and description of test standards
Objective:
According to the MEErP the aim of this task is to: Identify and shortly describe EN or
ISO/IEC test standards, mandates issued by the European Commission to the
European Standardisation Organisations, test standards in individual Member States
and third countries (if relevant) regarding the test procedures for primary and
secondary functional performance parameters on: resources use, emissions, safety,
noise and vibrations (if applicable) or other factors that may pose barriers for potential
Ecodesign measures. The purpose is also to conduct a comparative analysis for
overlapping test standards. Finally the aim is also to: analyse and report new test
standards under development; identify possible problems concerning accuracy,
reproducibility and to what extend the test standards reflect real-life conditions; draft
outlines of mandate(s) to the ESOs as appropriate; and identify differences between
standards covering the same subjects (comparative analysis).
1.4.1 Background information on European and International
standardization bodies
CEN, the European Committee for Standardization is an international non-profit
organisation.
Through its services, CEN provides a platform for the development of European
Standards (ENs) and other consensus documents. CEN's 33 National Members work
together to develop these publications in a large number of sectors to help build the
European internal market in goods and services, removing barriers to trade and
strengthening Europe's position in the global economy.
CEN is working to promote the international harmonisation of standards in the
framework of technical cooperation agreements with ISO (International Organization
for Standardization).
CENELEC
CENELEC is the European Committee for Electrotechnical Standardization and is
responsible for standardization in the electrotechnical engineering field. CENELEC
20 Failure rate Fx is the percentage of a number of tested lamps that have reached the end of their individual lives; Fx = 100 (1 – LSF).

Preparatory study on lighting systems
Month Year I 53
prepares voluntary standards, which help facilitate trade between countries, create
new markets, cut compliance costs and support the development of a Single European
Market.
CENELEC creates market access at European level but also at international level,
adopting international standards wherever possible, through its close collaboration
with the International Electrotechnical Commission (IEC).
CEN and CENELEC work in a decentralized way. Its members – the National
Standardization Bodies (NSBs) of the EU and EFTA countries – operate the technical
groups that draw up the standards; the CEN-CENELEC Management Centre (CCMC) in
Brussels manages and coordinates this system.
Designated as European Standards Organizations by the European Commission, CEN
and CENELEC are non-profit technical organizations.
European Standards (EN)
A standard is a publication that provides rules, guidelines or characteristics for
activities or their results, for common and repeated use. Standards are created by
bringing together all interested parties including manufacturers, users, consumers and
regulators of a particular material, product, process or service. Everyone benefits
from standardisation through increased product safety and quality as well as lower
transaction costs and prices.
A European Standard (EN) is a standard that has been adopted by one of the three
recognized European Standardisation Organisations (ESOs): CEN, CENELEC or ETSI. It
is produced by all interested parties through a transparent, open and consensus based
process.
European Standards are a key component of the Single European Market. Although
rather technical and often unknown to the public and media, they represent one of the
most important issues for businesses. Often perceived as boring and not particularly
relevant to some organisations, they are actually crucial in facilitating trade and hence
have high visibility among manufacturers inside and outside Europe. A standard
represents a model specification, a technical solution against which a market can
trade. It codifies best practice and is usually state of the art.
In essence, European Standards relate to products, services or systems. Today,
however, standards are no longer created solely for technical reasons but have also
become platforms to enable greater social inclusiveness and engagement with
technology, as well as convergence and interoperability within growing markets across
industries.
Developing a European Standard
The development of an EN is governed by the principles of consensus, openness,
transparency, national commitment and technical coherence (more information is
given in the BOSS - Business Operation Support System - Production processes) and
follows several steps:
Publication of the EN
After its publication, a European Standard must be given the status of national
standard in all CEN member countries, which also have the obligation to withdraw any
national standards that would conflict with it. This guarantees that a manufacturer has
easier access to the market of all these European countries when applying European
Standards and applies whether the manufacturer is based in the CEN territory or not.
Preparatory study on lighting systems
Month Year I 54
Review of the EN
To ensure that a European Standard is still current, it is reviewed at least within five
years from its publication.
This review results in the confirmation, modification, revision or withdrawal of the EN.
The concept of Harmonised Standards
The European Standards Organisations (ESOs) CEN, CENELEC and ETSI are involved
in a successful partnership with the European Commission and the European Free
Trade Association. The ESOs support European legislation in helping the
implementation of the European Commission directives, particularly those developed
under the New Approach.
To support its policies and legislation, the European Commission requests the ESOs to
develop and adopt European Standards, by means of 'standardisation mandates'.
Those European Standards developed in response to a mandate are called
'Harmonised Standards'. A list of Harmonized Standards supporting EU Directives and
Regulations is available in a dedicated area on the European Commission website.
Local standards in EU28 members states (DIN, ÖNORM, NBN, NF, ..)
Members21 of the CEN and CENELEC can also have local standards. This is in Europe
still common practice for installation standards, because they do not conflict with the
free movement of goods within the EU and are fitted to the local situation. For
example some member states implement their EPBD directive (see1.5.1) calculation
method in a local standard (DIN 18599 part 4, ÖNORM H 5059, ..) (see section 1.4.2).
Beyond Europe
European Standards are drafted in a global perspective. CEN has signed the 'Vienna
Agreement' with the International Organization for Standardization (ISO), through
which European and international standards can be developed in parallel. About 30 %
of the ENs in the CEN collection are identical to ISO standards. These EN ISO
standards have the dual benefits of automatic and identical implementation in all CEN
Member countries, and global applicability.
The International Electrotechnical Commission (IEC), founded in 1906, is the
world’s leading organization that prepares and publishes International Standards for
all electrical, electronic and related technologies.
Over 10 000 experts from industry, commerce, government, test and research labs,
academia and consumer groups participate in IEC Standardization work.
These are known collectively as “electrotechnology”.
IEC provides a platform to companies, industries and governments for meeting,
discussing and developing the International Standards they require.
All IEC International Standards are fully consensus-based and represent the needs of
key stakeholders of every nation participating in IEC work. Every member country, no
matter how large or small, has one vote and a say in what goes into an IEC
International Standard.
Over 10 000 experts from industry, commerce, government, test and research labs,
academia and consumer groups participate in IEC Standardization work.
The IEC is one of three global sister organizations (IEC, ISO, ITU) that develop
International Standards for the world.
When appropriate, IEC cooperates with ISO (International Organization for
Standardization) or ITU (International Telecommunication Union) to ensure that
21 http://standards.cen.eu/dyn/www/f?p=CENWEB:5
Preparatory study on lighting systems
Month Year I 55
International Standards fit together seamlessly and complement each other. Joint
committees ensure that International Standards combine all relevant knowledge of
experts working in related areas.
ISO (International Organization for Standardization) is the world’s largest
developer of voluntary International Standards. International Standards give state of
the art specifications for products, services and good practice, helping to make
industry more efficient and effective. Developed through global consensus, ISO helps
to break down barriers to international trade.
ISO develops International Standards. It was founded in 1947, and since then ISO has
published more than 19 500 International Standards covering almost all aspects of
technology and business. From food safety to computers, and agriculture to
healthcare.
Today ISO has members from 164 countries and 3 368 technical bodies to take care of
standard development. More than 150 people work full time for ISO’s Central
Secretariat in Geneva, Switzerland. ISO/TC 274 focuses on ‘Light and lighting’ and
does standardization in the field of application of lighting in specific cases
complementary to the work items of the International Commission on Illumination
(CIE) and the coordination of drafts from the CIE, concerning vision, photometry and
colorimetry, involving natural and man-made radiation over the UV, the visible and
the IR regions of the spectrum, and application subjects covering all usage of light,
indoors and outdoors, energy performance, including environmental, non-visual
biological and health effects.
The International Commission on Illumination - also known as the CIE from its
French title, the Commission Internationale de l’Eclairage - is devoted to worldwide
cooperation and the exchange of information on all matters relating to the science and
art of light and lighting, colour and vision, photobiology and image technology.
With strong technical, scientific and cultural foundations, the CIE is an independent,
non-profit organization that serves member countries on a voluntary basis. Since its
inception in 1913, the CIE has become a professional organization and has been
accepted as representing the best authority on the subject and as such is recognized
by ISO as an international standardization body.
Many CIE standards become European Standards (EN) with no or only few
modifications.
ETSI, the European Telecommunications Standards Institute, produces globally-
applicable standards for Information and Communications Technologies (ICT),
including fixed, mobile, radio, converged, broadcast and internet technologies.
1.4.2 Description of different standards
Approach:
In this section a limited list of standards are described that are most relevant for the
study. The full list of standards is given in Annex A.
First of all it must be stated that currently there are almost no standards for lighting
‘systems’; there are mainly standards for parts of the systems.
These standards can be classified into the following categories:
safety (electrical, photo-biological, etc.)
performance (electrical, energy, lighting , dimensions, etc.)
lighting requirements.

Preparatory study on lighting systems
Month Year I 56
1.4.2.1 The few specific standards for lighting system guidelines
CIE 97(2005): Guide on the maintenance of indoor electric lighting systems
Scope:
During the life of a lighting installation, the light available for the task
progressively decreases due to accumulation of dirt on surface and aging of
equipment. The rate of reduction is influenced by the equipment choice and the
environmental and operating conditions. In lighting scheme design we must
take account of this fall by the use of a maintenance factor and plan suitable
maintenance schedules to limit the decay. Lighting standard "ISO 8995/CIE S
008-2001 Lighting of Indoor Workplaces" in Section 4.8, recommends a
minimum maintenance factor. It states that "The lighting scheme should be
designed with overall maintenance factor calculated for the selected lighting
equipment, space environment and specified maintenance schedule". A high
maintenance factor together with an effective maintenance programme
promotes energy efficient design of lighting schemes and limits the installed
lighting power requirements.
This revision of the guide describes the parameters influencing the depreciation
process and develops the procedure for estimating the maintenance factor for
indoor electric lighting systems. It provides information on the selection of
equipment estimation of economic maintenance cycles and gives advice on
servicing techniques. It shows some examples of data but for accurate data it
recommends that data should be obtained from the manufacturers.
Important definitions and data from this guide:
It defines the maintenance factor (MF) as a multiple of factors:
MF = LLMF x LSF x LMF x RSMF
Where,
LLMF is the lamp lumen maintenance factor;
LSF is the lamp survival factor (used only for group replacement
programmes);
LMF is the luminaire maintenance factor;
RSMF is the room surface maintenance factor
Noted: The examples of luminaire maintenance factors (LMF) in Table 3.4 are
high, e.g. an open top housing luminaire cleaned every two year would have
an LMF of 0.80.
Identified gap:
The example values included are conservative, which results in over
dimensioning lighting systems.
Updates might be needed for LED luminaires which were not detailed in this
guideline (2005)
ZVEI has a ‘Guide to Reliable Planning with LED Lighting Terminology,
Definitions and Measurement Methods: Bases for Comparison’22 where also the
Lamp Survival Factor (LSF) is taken into account for lighting systems using
multiple LED sources. This could be included in an update.
Input received from IALD23:
22 http://www.zvei.org/Publikationen/Guide%20to%20Reliable%20Planning%20LED%20Lighting%202013-11.pdf 23 http://www.iald.org/
Preparatory study on lighting systems
Month Year I 57
“Calculation of Maintenance Factors remains an area where the experience of
the lighting designer could provide a more comprehensive solution. The values
stated are not necessarily conservative. In use the majority of lighting
installations do not receive adequate maintenance and cleaning. Current
marketing trends suggesting that LED luminaires require little or no
maintenance could potentially contribute to worsening the situation. Currently
recommended lighting levels are based on the end of life performance of a
lighting system. This results in over dimensioning when the lifetime of the
system is expected to be very long.”
Note: CIE 97:2005 is on the list of CIE division 3 as required an update but
there is currently no work in progress. Revision is also foreseen in ISO/TC-274.
CIE 154(2003): ‘The maintenance of outdoor lighting systems’
Scope:
During the life of a lighting installation, the light available progressively
decreases. The reduction rates are a function of environmental, operating and
age conditions. In lighting design we must take account of this fall by the use
of a maintenance factor and plan suitable maintenance schedules to limit the
decay. This guide provides information on suggested maintenance factors and
the selection of suitable equipment. It describes the parameters influencing the
depreciation process and develops the procedure for estimating the economic
maintenance cycles for outdoor electric lighting installations and gives advice
on servicing techniques
Important definitions and data from this guide:
Luminaire Maintenance Factor (LMF) is defined as the ratio of the light output
ratio of a luminaire at a given time to the initial light output ratio.
It depends strongly on environmental pollution and the quality of the optical
system, especially on the protection class (IP-rating) of the optical
compartment. The IP-ratings are defined in standard EN 60529: ‘Degrees of
protection provided by enclosures (IP Code)’. So an important segmentation
will be made by distinction of the IP-rating.
Identified gap:
Updates might be needed for LED luminaires which were not detailed in this
guideline (2007). ZVEI has a ‘Guide to Reliable Planning with LED Lighting
Terminology, Definitions and Measurement Methods: Bases for Comparison’24
where also the Lamp Survival Factor (LSF) is taken into account for lighting
systems using multiple LED sources. This could be included in an update.
Input received from IALD (see also CIE 97):
“Calculation of Maintenance Factors remains an area where the experience of
the lighting designer could provide a more comprehensive solution. The values
stated are not necessarily conservative. In use the majority of lighting
installations do not receive adequate maintenance and cleaning. Current
marketing trends suggesting that LED luminaires require little or no
maintenance could potentially contribute to worsening the situation. Currently
24 http://www.zvei.org/Publikationen/Guide%20to%20Reliable%20Planning%20LED%20Lighting%202013-11.pdf

Preparatory study on lighting systems
Month Year I 58
recommended lighting levels are based on the end of life performance of a
lighting system. This results in over dimensioning when the lifetime of the
system is expected to be very long.”
Note: CIE 97:2005 is on the list of CIE division 3 as requiring an update but
there is currently no work in progress. Revision is also foreseen in ISO/TC-274.
EN 50172: ‘Emergency escape lighting systems.’
Scope:
This Standard specifies the provision of illumination of escape routes and
safety signs in the event of failure of the normal supply, and specifies the
minimum provision of such emergency lighting based on the size, type and
usage of the premises. This standard relates to the provision of electric
emergency escape lighting in all work places and premises open to the public.
This Standard does not cover private residential premises but its provisions
are applicable to common access routes within multi-storey dwellings. This
Standard is also applicable to standby lighting used as emergency escape
lighting. There are emerging way guidance techniques that, when applied to
escape routes in addition to conventional emergency lighting luminaires, can
enhance its effectiveness in an emergency.
This standard covers a variety of topics, including emergency escape lighting,
the design of emergency lighting, as well as the required system records and
log book. It also give best practice recommendation on the servicing and
testing of emergency lighting systems.
The preceding standard is related to:
EN 50171: ‘Central power supply systems.’
Scope:
This European Standard specifies the general requirements for central power
supply systems for an independent energy supply to essential safety
equipment. This standard covers systems permanently connected to AC.
supply voltages not exceeding 1 000 V and that use batteries as the
alternative power source. The central power supplies are intended to energise
emergency escape lighting in the case of failure of the normal supply, and
maybe suitable for energising other essential safety equipment for example: -
electrical circuits of automatic fire extinguishing installations, - paging systems
and signalling safety installations, - smoke extraction equipment, - carbon
monoxide warning systems, - specific safety installations related to specific
buildings e.g. high-risk areas. Schematic representations of typical central
power supply equipment are depicted in clause 4. When a UPS system is used
to feed these essential safety systems, it must comply with EN 50091-1 and its
relevant parts, and the additional requirements of this standard. The power
supply system for fire alarms covered by EN 54 are excluded.
Preparatory study on lighting systems
Month Year I 59
1.4.2.2 European standards defining energy performance of lighting
installations or systems
EN 15193 (2007): ‘Energy performance of buildings – Energy requirements
for lighting’
Important Notice: This standard is currently under revision, this section will be
updated in the course of this study. The new version will contain two parts.
Scope:
This European Standard specifies the calculation methodology for the
evaluation of the amount of energy used for indoor lighting inside the building
and provides a numeric indicator for lighting energy requirements used for
certification purposes. It can be used for existing buildings and for the design
of new or renovated buildings. It also provides reference schemes to base the
targets for energy allocated for lighting usage. The standard also provides a
methodology for the calculation of instantaneous lighting energy use for the
estimation of the total energy performance of the building. Parasitic powers not
included in the luminaire are excluded.
In this standard buildings are classified in the following categories: offices,
education buildings, hospitals, hotels, restaurants, sports facilities, wholesale
and retail services and manufacturing factories.
In some locations outside lighting may be fed with power from the building.
This lighting may be used for illumination of the façade, open-air car park
lighting, security lighting, garden lighting etc. These lighting systems may
consume significant energy and if they are fed from the building, this load will
not be included in the Lighting Energy Numeric Indicator (LENI) or into the
values used for heating and cooling load estimate. If metering of the lighting
load is employed, these loads may be included in the measured lighting
energy.
Note according to IALD23:
“Lighting control system development is currently outpacing the ability of
standards to keep up with the potential. Mandating adherence to standards
such as these risks inhibiting new developments and consequent energy
savings. Using a measure such as LENI allows for a technologically blind
assessment of energy used.”
Important definitions from this standard:
The general context of this standard and its relations to other standards is
included in Figure 1-3.
The most relevant output parameter Lighting Energy Numerical Indicator
(LENI) [kWh/(m².time period)]. Therefore it provides methods to calculate a
Constant illumination Factor (Fc), a Daylight depedency Factor (Fd) and an
Occupancy dependency factor (Fo). Operational hours are derived from EN
15251.
From the lighting design and/or luminaire factor input data on Luminaire Power
(Pl), Luminaire emergency standby power (Pem), Luminaire control standby
power (Ppc).
The standard defines three methods as illustrated in Figure 1-10. The luminaire
power is the power needed to have a lighting system compliant with minimum

Preparatory study on lighting systems
Month Year I 60
illumination requirements obtained from EN 12464, this can be done with
lighting design software or from formulas in standard EN 13032.
Figure 1-10: Flow chart illustrating alternative routes to determine energy use in prEN
15193-1
The updated version includes a method based on so-called expenditure factors
that disaggregates data into systems levels similar to this study and compares
it to reference values. To be updated at the end of the study.
In Annex G (draft 2014) on Constant Illuminance, the MF is defined as the
ratio between maintained illuminance and initial illuminance. The MF is made
up of multiple factors such as LLMF, LSF, LMF, and RSMF. Full details of the
derivation of the MF can be found in CIE 97.
Annex F of the 2007 version contained benchmark values, Figure 1-11. The
proposal is to include them in Annex K of prEN 15193-2 (version 2014).

Preparatory study on lighting systems
Month Year I 61
Figure 1-11: Fragment of benchmark values contained in AnnexF of standard EN
15193(2007)
In the version of 2007 Annex F contained benchmark values
Identified gaps25(2007 version):
The European Commission initiated the CENSE-project to improve acceptance
and use of the CEN standards, which were developed to analyse the energy
performance of buildings, including lighting, according to the EPBD. The project’s
goal is to identify problems concerning the standards’ contents and their
implementation via questionnaires and workshops and to formulate
recommendations for improvement.
Within the framework of the CENSE-project the standard EN 15193, covering the
energy requirements for lighting, was investigated. The questionnaire’s
evaluation shows that though lighting requirements have been defined in most
European countries, only few countries did actually put the CEN standard into
force; also, awareness of practitioners is still low. In general, the standard is
regarded as a useful umbrella document and its methods are considered to be
applicable and helpful. Nevertheless, parts of the standard are rated being not
easy to understand. Although many essential parameters in the determination of
lighting energy needs are covered, some additional aspects should be addressed
in a revised version. Providing, for instance, methods to rate lighting controls in
more detail, to determine the installed power of new lighting installations and to
rate the impact of sun-shading devices on the lighting energy demand might
help to further improve the standard’s quality and acceptance. A simple means
to raise acceptance, formulated in the CENSE project, is to l review the standard
focusing on structure and editing in order to clarify and simplify parts of the
document. Particularly the presentation of equations should be reorganized, for
instance by adding a list of the variables used to each equation and by
describing connections to other equations, making them more understandable.
An example of technical aspects still to be addressed is artificial lighting, which is
only taken care of in existing buildings in the current version of the standard.
Consequently, an additional approach covering the lighting design in new
buildings needs to be developed, and a simplified method should be included.
Also the effect of lighting controls should be considered in the calculation method
25 Report on the Application of CEN Standard EN 15193 EN 15193: Energy Performance of Buildings - Energy Requirements for Lighting, Anna Staudt, Jan de Boer and Hans Erhorn

Preparatory study on lighting systems
Month Year I 62
as well as the impact of glare and sun-shading protection on lighting energy
demand. By providing extra material with simplified explanations and
background information, the readers' ability to understand and apply the
standard could be further enhanced as well as their awareness of the methods
underlying available computer software.
Potential gaps in prEN15293-1&2(2014):
Links with other standards are not fully documented. There is no direct cross
reference to EN 15232 on building automation. There is also no reference
included to any specific standard in shading devices. Cross checking, updating
and aligning acronyms with EN 12665. This could allow that similar acronyms
and parameters are used in similar standards (e.g. EN 13201-5).
The impact of shading devices is included in Table F.7: all venetian blinds are
treaded equal and horizontal versus vertical blinds are not discriminated.
It does not specify the optical calculation method and/or software to obtain the
required Power to satisfy EN 12464 illumination requirements.
It does not cover all innovative control systems defined in section 1.3.2.3.1.
Therefore some extra factors could be added for other innovations, e.g. a user
comfort setting factor (Fcu) and relocation flexibility factor (Fre).
There is a measurement method defined for the LENI but it does not take into
account that occupancy is variable and can have a big impact. It is therefore
recommended that occupancy is measured and quantified separately and taken
into account properly. This method could be included in EN 15232 on building
automation and cross references could be added.
Should member states vote positively for this standard it is unclear whether
they would also fully support implementing it into their EPBD legislation (it was
not in the previous version). There could be a request for more simple methods
that grant full benefits to systems composed of the best light sources and
control systems without going into building design and user assumption details.
Reference is made to CIE 97 in relation to the Maintenance Factor, these values
are too pessimistic and might be too high compared to current practices.
In the draft version prEN 15193-2 (draft 2014)
The effect of colour filtering by the glazing is not included.
This standard also refers to EN 12464 for method 1 and therefore the gaps
identified in this standard are also valid.
EN 15232: ‘Energy performance of buildings - Impact of Building
Automation, Controls and Building Management.’
Scope:
This European Standard specifies:
a structured list of Building Automation and Control System (BACS) and
Technical Building Management (TBM) functions which have an impact on the
energy performance of buildings;
a method to define minimum requirements regarding BACS and TBM functions
to be implemented in buildings of different complexities;
a factor based method to get a first estimation of the impact of these functions
on typical buildings;

Preparatory study on lighting systems
Month Year I 63
detailed methods to assess the impact of these functions on a given building.
These methods enable the impact of these functions in the calculations of
energy performance ratings and indicators calculated by the relevant standards
to be introduced.
Important definitions and data from this standard:
The standard primarily defines four classes that poses specific requirements on
control systems including lighting. This types of control system match with EN
15232. It contains a calculation procedures based on BAC efficiency factors, for
lighting reference is made to EN 15193.
The 4 classes of Building Automation Systems are:
Class A: High energy performance building automation and control
system (BACS) and technical building management (TBM);
Class B: Advanced BACS and TBM;
Class C: Standard BACS;
Class D: Non energy efficient BACS;
For each class minimum control system requirements are defined, see Figure 1-12.
Figure 1-12: Table 1 on lighting controls defined in EN 15232
Afterwards the standard defines relations between building energy systems and so-
called BAC efficiency factors for different types of energy use, including lighting, see
Figure 1-13. These factors enable savings to be estimated.
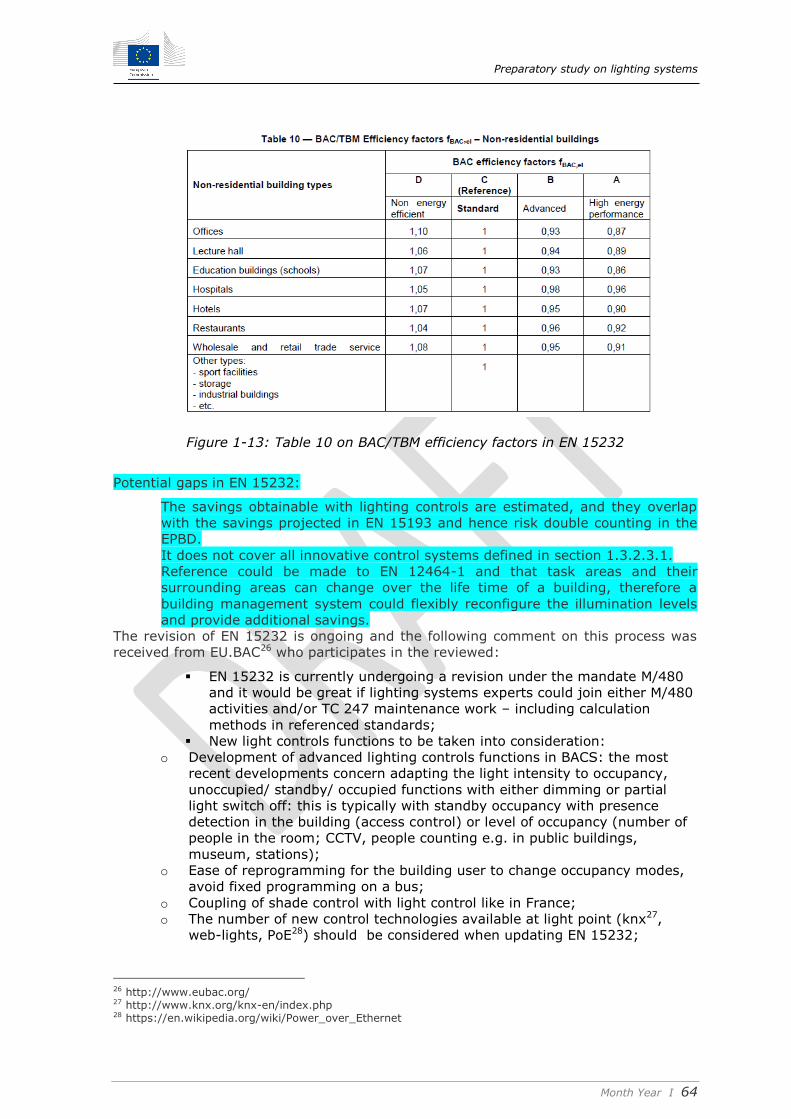
Preparatory study on lighting systems
Month Year I 64
Figure 1-13: Table 10 on BAC/TBM efficiency factors in EN 15232
Potential gaps in EN 15232:
The savings obtainable with lighting controls are estimated, and they overlap
with the savings projected in EN 15193 and hence risk double counting in the
EPBD.
It does not cover all innovative control systems defined in section 1.3.2.3.1.
Reference could be made to EN 12464-1 and that task areas and their
surrounding areas can change over the life time of a building, therefore a
building management system could flexibly reconfigure the illumination levels
and provide additional savings.
The revision of EN 15232 is ongoing and the following comment on this process was
received from EU.BAC26 who participates in the reviewed:
EN 15232 is currently undergoing a revision under the mandate M/480
and it would be great if lighting systems experts could join either M/480
activities and/or TC 247 maintenance work – including calculation
methods in referenced standards;
New light controls functions to be taken into consideration:
o Development of advanced lighting controls functions in BACS: the most
recent developments concern adapting the light intensity to occupancy,
unoccupied/ standby/ occupied functions with either dimming or partial
light switch off: this is typically with standby occupancy with presence
detection in the building (access control) or level of occupancy (number of
people in the room; CCTV, people counting e.g. in public buildings,
museum, stations);
o Ease of reprogramming for the building user to change occupancy modes,
avoid fixed programming on a bus;
o Coupling of shade control with light control like in France;
o The number of new control technologies available at light point (knx27,
web-lights, PoE28) should be considered when updating EN 15232;
26 http://www.eubac.org/ 27 http://www.knx.org/knx-en/index.php 28 https://en.wikipedia.org/wiki/Power_over_Ethernet
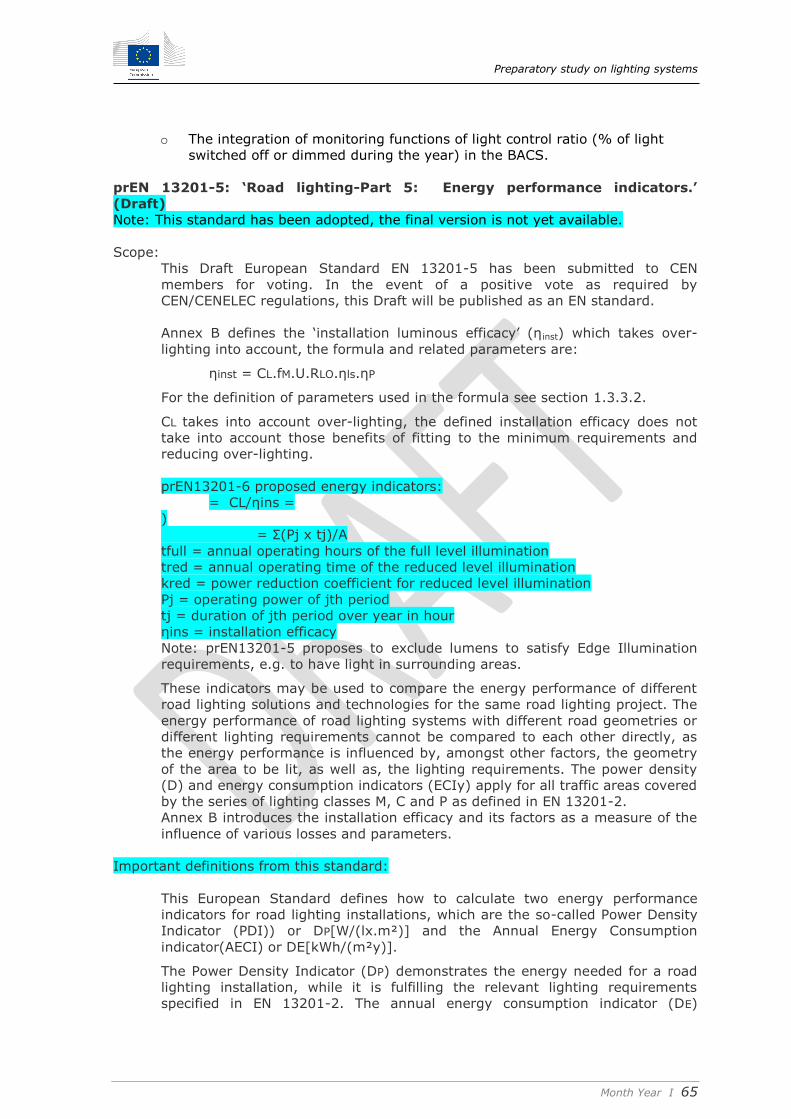
Preparatory study on lighting systems
Month Year I 65
o The integration of monitoring functions of light control ratio (% of light
switched off or dimmed during the year) in the BACS.
prEN 13201-5: ‘Road lighting-Part 5: Energy performance indicators.’
(Draft)
Note: This standard has been adopted, the final version is not yet available.
Scope:
This Draft European Standard EN 13201-5 has been submitted to CEN
members for voting. In the event of a positive vote as required by
CEN/CENELEC regulations, this Draft will be published as an EN standard.
Annex B defines the ‘installation luminous efficacy’ (ηinst) which takes over-
lighting into account, the formula and related parameters are:
ηinst = CL.fM.U.RLO.ηls.ηP
For the definition of parameters used in the formula see section 1.3.3.2.
CL takes into account over-lighting, the defined installation efficacy does not
take into account those benefits of fitting to the minimum requirements and
reducing over-lighting.
prEN13201-6 proposed energy indicators:
= CL/ηins =
) = Ʃ(Pj x tj)/A
tfull = annual operating hours of the full level illumination
tred = annual operating time of the reduced level illumination
kred = power reduction coefficient for reduced level illumination
Pj = operating power of jth period
tj = duration of jth period over year in hour
ηins = installation efficacy
Note: prEN13201-5 proposes to exclude lumens to satisfy Edge Illumination
requirements, e.g. to have light in surrounding areas.
These indicators may be used to compare the energy performance of different
road lighting solutions and technologies for the same road lighting project. The
energy performance of road lighting systems with different road geometries or
different lighting requirements cannot be compared to each other directly, as
the energy performance is influenced by, amongst other factors, the geometry
of the area to be lit, as well as, the lighting requirements. The power density
(D) and energy consumption indicators (ECIy) apply for all traffic areas covered
by the series of lighting classes M, C and P as defined in EN 13201-2.
Annex B introduces the installation efficacy and its factors as a measure of the
influence of various losses and parameters.
Important definitions from this standard:
This European Standard defines how to calculate two energy performance
indicators for road lighting installations, which are the so-called Power Density
Indicator (PDI)) or DP[W/(lx.m²)] and the Annual Energy Consumption
indicator(AECI) or DE[kWh/(m²y)].
The Power Density Indicator (DP) demonstrates the energy needed for a road
lighting installation, while it is fulfilling the relevant lighting requirements
specified in EN 13201-2. The annual energy consumption indicator (DE)
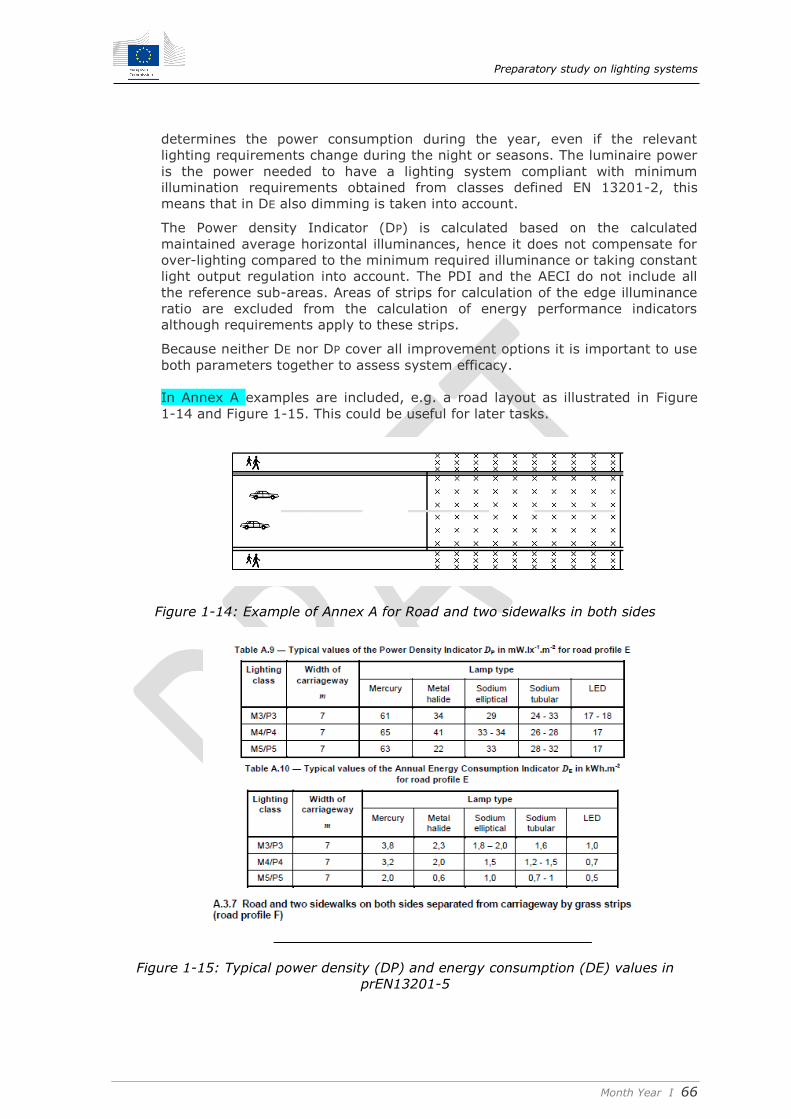
Preparatory study on lighting systems
Month Year I 66
determines the power consumption during the year, even if the relevant
lighting requirements change during the night or seasons. The luminaire power
is the power needed to have a lighting system compliant with minimum
illumination requirements obtained from classes defined EN 13201-2, this
means that in DE also dimming is taken into account.
The Power density Indicator (DP) is calculated based on the calculated
maintained average horizontal illuminances, hence it does not compensate for
over-lighting compared to the minimum required illuminance or taking constant
light output regulation into account. The PDI and the AECI do not include all
the reference sub-areas. Areas of strips for calculation of the edge illuminance
ratio are excluded from the calculation of energy performance indicators
although requirements apply to these strips.
Because neither DE nor DP cover all improvement options it is important to use
both parameters together to assess system efficacy.
In Annex A examples are included, e.g. a road layout as illustrated in Figure
1-14 and Figure 1-15. This could be useful for later tasks.
Figure 1-14: Example of Annex A for Road and two sidewalks in both sides
Figure 1-15: Typical power density (DP) and energy consumption (DE) values in
prEN13201-5

Preparatory study on lighting systems
Month Year I 67
Annex B of this standard describes a method for analysing and disaggregating
the installation losses into installation efficiency, light source efficacy, periodic
reduction factor and power (gear) efficiency. This method (see Figure 1-2) is
identical to the system component defined in this study (see Figure 1-1).
Therefore Annex B defines the ‘installation luminous efficacy’ (ηinst) which takes
over-lighting into account, the formula and related parameters are:
ηinst = CL.fM.U.RLO.ηls.ηP
For definitions of the parameters in the formula see section 1.3.3.2.
CL takes into account over-lighting. The benefits of constant output regulation
(CLO, see also 1.3.2.3.2) are not taken into account.
Potential gaps in EN 13201-5:
A potential weakness is that the decomposition is in Annex B which defines
installation efficacy related to subsystems and that Constant Lighting Output
regulation is not taken into account.
The PDI and the AECI do not include all the reference sub-areas, which could
complicate comparison different street layouts. These issues could be
addressed in a newly proposed prEN 13201-6.
prEN 13201-6:2015 Road Lighting - Part 6: Tables of the most energy
efficient useful utilance, utilance and utilization factor
Scope:
This standard is being developed under the Commission mandate M/485
including also a preparatory study 2014-2015. The standard facilitates a
requirement for product information in the Commission Regulation 245/2009
ANNEX VII (on Street Lighting), 3. LUMINAIRE BENCHMARKS, clause 3.2:
“(b) Utilisation Factor values for standard road conditions in tabular form for
the defined road class. The table contains the most energy efficient UF values
for different road widths, different pole heights, maximum pole distances,
luminaire overhang and inclination, as appropriate for the given road class and
luminaire design; (c)…“
EN 50285: ‘Energy efficiency of electric lamps for household use -
Measurement methods.’
Scope:
This European Standard has been produced under Standardisation Mandate
M/202 in response to the European Commission Directive implementing
Council Directive 92/75/EEC with regard to energy labelling of household
lamps. A method of classification of lamps according to energy efficiency is
given in the Directive and is not a part of this standard. This standard specifies
the test conditions and method of measurement of luminous flux, lamp
wattage and lamp life as given on a label on the lamp packaging, together with
a procedure for verification of the declared values. Only those parameters that
are specific to the above mentioned Directive are included in this standard. All
other parameters are included in the relevant lamp performance standards.
Lamps covered by this standard are: mains voltage tungsten filament lamps;

Preparatory study on lighting systems
Month Year I 68
mains voltage tungsten halogen lamps; self-ballasted lamps; double-capped
fluorescent lamps; single-capped fluorescent lamps.
1.4.2.3 Examples of local standards in EU28 member states that are an
alternative to EN 15193 for defining lighting energy calculations in
their local EPBD implementation
DIN V 18599 - 4: ‘Energy efficiency of buildings - Calculation of the net, final
and primary energy demand for heating, cooling, ventilation,
domestic hot water and lighting - Part 4: Net and final energy
demand for lighting.’
Country: Germany (Nutz- und Endenergiebedarf für Beleuchtung) and also Luxemburg
adopted this standard in their EPBD implementation. This standard is the basis for the
German EnEV (Energieeinsparverordnung). The EnEV was established by the
government and sets allowable power consumption levels for the entire building
including energy consumption for lighting.
Scope:
DIN V 18599-4 specifies the approved method of verifying the monthly and
annual energy use for lighting in non-residential buildings. The method includes
the division of a building into zones as required for lighting technology
purposes, determination of the specific "electrical evaluation power" of the
artificial lighting system, as well as considerations on the way in which daylight
is utilized and the effects of presence detection systems. To achieve lighting
energy efficiency, suitable lighting and lighting control systems shall be
employed and the available daylight shall be utilized to the best possible
extent. The method described here only deals with the lighting systems needed
to achieve minimum lighting requirements. According to the provisions of DIN
EN 12464-1, a lighting system shall be designed in such a way that the lighting
requirements of a specific space are met without needlessly increasing energy
use. At the same time, energy use shall not be reduced to the detriment of the
quality of the lighting conditions. DIN V 18599-4 has been approved by NA
005-56-20 GA "Gemeinschaftsarbeitsausschuss NABau/FNL/NHRS:
Energetische Bewertung von Gebäuden" ("Joint Working Committee
NABau/FNL/NHRS: Energy performance of buildings") and published as a
prestandard.
’The German standardization process (DIN 18599) refined the European approach (EN
15193) in some aspects.
According to this standard the installed, electrical power of the artificial lighting
system can be determined with a simple tabular method, a simplified utilization
factor approach or of course a detailed lighting design. Which method to apply
depends on the design phase (i.e. availability of data) and the level of effort
expended. As depicted in Figure 3 the methods are designed such that
accuracy will increase with growing effort.
Please note that the Lot 8 preparatory study on office lighting used and compared the
utilization factor method and the lighting design with a simulation approach.
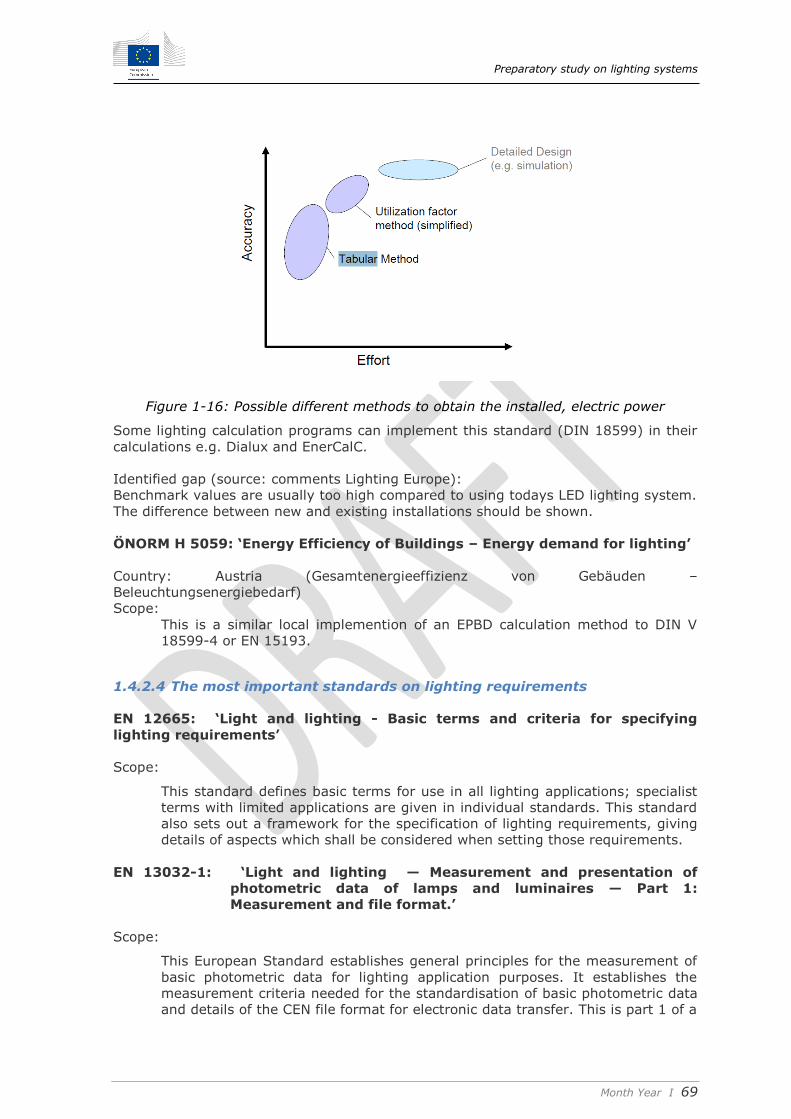
Preparatory study on lighting systems
Month Year I 69
Figure 1-16: Possible different methods to obtain the installed, electric power
Some lighting calculation programs can implement this standard (DIN 18599) in their
calculations e.g. Dialux and EnerCalC.
Identified gap (source: comments Lighting Europe):
Benchmark values are usually too high compared to using todays LED lighting system.
The difference between new and existing installations should be shown.
ÖNORM H 5059: ‘Energy Efficiency of Buildings – Energy demand for lighting’
Country: Austria (Gesamtenergieeffizienz von Gebäuden –
Beleuchtungsenergiebedarf)
Scope:
This is a similar local implemention of an EPBD calculation method to DIN V
18599-4 or EN 15193.
1.4.2.4 The most important standards on lighting requirements
EN 12665: ‘Light and lighting - Basic terms and criteria for specifying
lighting requirements’
Scope:
This standard defines basic terms for use in all lighting applications; specialist
terms with limited applications are given in individual standards. This standard
also sets out a framework for the specification of lighting requirements, giving
details of aspects which shall be considered when setting those requirements.
EN 13032-1: ‘Light and lighting — Measurement and presentation of
photometric data of lamps and luminaires — Part 1:
Measurement and file format.’
Scope:
This European Standard establishes general principles for the measurement of
basic photometric data for lighting application purposes. It establishes the
measurement criteria needed for the standardisation of basic photometric data
and details of the CEN file format for electronic data transfer. This is part 1 of a

Preparatory study on lighting systems
Month Year I 70
multi-part standard. Part 1 deals with the basic photometric measurement and
file format. Other parts deal with lamps and luminaires data depending on the
applications.
Identified gaps:
Despite of this European standard being adopted, the sector often uses another
similar file format (EULUMDAT, IES, CIBSE, etc.) in practice, see section
1.3.2.4.
A photometry file reduces a luminaire to a point source which can be inaccurate
when modelling a distributed light source such as a large LED panel luminaire
(e.g. OLED), therefore more sophisticated file formats are being developed
(e.g. IES TM-25-13).
Some programs use specific file formats to overcome this. Dialux (ULD files)
and Relux (ROLF files) allow the photometry to be attached to a model of the
luminaire, ensuring the correct position of the luminous emitting areas within
the luminaire geometry.
For basic photometric file formats the photometry is spread over the luminous
area specified within the file, centred upon the centre of the luminaire
dimensions. So, for example, a street lantern with the light source positioned
at the end of a body containing control gear, spigot mounting mouldings, etc.
would have the luminous aperture positioned central to the full body which
would be somewhere over the gear compartment. This is because the
photometric file conveys the size of the luminaire and the size of the luminous
aperture but not any geometric relationship between the two.
EN 13032-2: ‘Light and lighting - Measurement and presentation of
photometric data of lamps and luminaires - Part 2:
Presentation of data for indoor and outdoor work places.’
Scope:
This document specifies the required data for lamps and luminaires for the
verification of conformity to the requirements of EN 12464-1 and prEN 12464-
2. It also specifies data that are commonly used for lighting of indoor and
outdoor work places. When these data are provided, they should conform to
this document
When the room parameters, the luminaire data (according to EN 13032-
1(2004)) are known this method allows the defined functional unit based on
the Utilisation Factor (UF) method to be calculated.
Note:
This standard is derived from the international standard CIE 115. It is worth
noting that CIE 115 also includes a total cost of ownership model and a
reference calculation.

Preparatory study on lighting systems
Month Year I 71
EN 13032-3: ‘Light and lighting - Measurement and presentation of
photometric data of lamps and luminaires - Part 3:
Presentation of data for emergency lighting of work places.’
Scope:
This standard specifies the required data for lamps and luminaires to verify
conformity with EN 1838. This standard does not define the data requirements
for signage, as these can be found in EN 1838.
prEN 13032-4: ‘Light and lighting - Measurement and presentation of
photometric data of lamps and luminaires - Part 4:
Presentation of data for LED lamps, modules and
luminaires.’
Scope:
This project for a European Standard specifies the requirements for
measurement of electrical, photometric, and colorimetric quantities of LED
lamps, modules, light engines and luminaires, for operation with AC or DC
supply voltages, possibly with associated control gear. Photometric and
colorimetric quantities covered in this standard include total luminous flux,
luminous efficacy, partial luminous flux, luminous intensity distribution, centre-
beam intensities, luminance and luminance distribution, chromaticity
coordinates, correlated colour temperature (CCT), Colour Rendering Index
(CRI), and spatial uniformity of chromaticity. This standard does not cover LED
packages and products based on OLEDs (organic LEDs).
IES TM-25-13 ‘Ray File Format for the Description of the Emission Property
of Light Sources.’
Scope:
This guideline provides recommendations for a standard ray file format to
describe the emission properties of light sources. The ray file format contains
information necessary to interface between ray tracing or other optical design,
simulation, analysis and metrology software used in lighting applications.
Identified gaps:
It is a guideline and not yet a standard.

Preparatory study on lighting systems
Month Year I 72
EN 1838(2013): ‘Lighting applications. Emergency lighting’
Scope:
This is a European Standard that specifies the luminous requirements for
emergency escape lighting and standby lighting systems installed in premises
or locations where such systems are required. It is principally applicable to
locations where the public or workers have access.
EN 12464-1: ‘Light and Lighting-Part 1: Lighting of indoor work places.’
Scope:
This European standard specifies lighting requirements for indoor work places,
which meet the needs for visual comfort and performance. All usual visual
tasks are considered, including Display Screen Equipment (DSE).
This European standard does not specify lighting requirements with respect to
the safety and health of workers at work and has not been prepared in the field
of application of Article 137 of the EC treaty, although the lighting
requirements, as specified in this standard, usually fulfil safety needs. Lighting
requirements with respect to the safety and health of workers at work may be
contained in Directives based on Article 137 of the EC treaty, in the national
legislation of member states implementing these Directives or in other national
legislation of member states.
This standard neither provides specific solutions, nor restricts the designers’
freedom from exploring new techniques nor restricts the use of innovative
equipment.
This standard is not applicable for the lighting of outdoor work places and
underground mining.
Important definitions and data from this standard:
This standard defines the zoning of work places and their illumination
requirements.
It defines therefore amongst others the following areas:
Task area as the area within which the visual task is carried out.
The surrounding area band surrounding the task area within the visual
field
The area adjacent to the immediate surroundings.
More information on the selection of these zones can be found in a user guide
on this standard available at Licht.de29.
For the task areas within this standard minimum lighting requirements are
defined in Figure 1-17.
29 http://en.licht.de/fileadmin/shop-downloads/Guide-DIN-EN-12464-1.pdf

Preparatory study on lighting systems
Month Year I 73
Figure 1-17: Example of lighting requirements from EN 12464-1 for traffic zones
inside buildings
The illuminance of the immediate surrounding area shall be related to the
illuminance of the task area and should provide a well-balanced luminance
distribution in the visual field. The immediate surrounding area should be a
band with a width of at least 0.5 m around the task area within the visual field.
The minimum illumination requirements for this area are lower (Figure 1-18).
Figure 1-18: Relationship of illuminances on immediate surroundings to the
illuminance on the task area
Illuminance on the background area, it should be a border at least 3 m wide
adjacent to the immediate surrounding area within the limits of the space and
shall be illuminated with a maintained illuminance of 1/3 of the value of the
immediate surrounding area.
Section ‘4.2.2 Reflectance of surfaces’ specifies that the recommended
reflectances for the major interior diffuse surfaces are:

Preparatory study on lighting systems
Month Year I 74
ceiling: 0.7 to 0.9;
walls: 0.5 to 0.8;
floor: 0.2 to 0.4.
Note: the reflectance of major objects (like furniture, machinery, etc.) should
be in the range of 0.2 to 0.7.
Note: the revision process of this standard has recently started. Gaps will be
communicated directly to the convenor and the section hereafter will be
updated accordingly.
Potential gaps in EN 12464-1:
Reference could be made to EN 15232 and that task areas and their
surrounding areas can change over the life time of a building, therefore
a building management system could flexibly reconfigure the
illumination levels and provide additional savings. It is unclear if and
how these savings are modelled. Areas where frequent changes can be
expected over the building life time could be identified (e.g. open plan
office) and recommendations for building management systems could
be included.
No specific ‘short measurement’ verification method is included. Section
4.4 defines the illumination grid that is used for calculation, but this
would require a large number of measurements per room.
In relation to the previous gaps the following comment from the lighting
designers association IALD23 is relevant based on their experience from
applying this standard in the field:
o All illuminances are a result of calculations based on recommended
reflectances (section 4.2.2).
o Architects and interior designers are not required to meet these
requirements. The effect of lighting measured in illuminance will
vary therefore according to the reflectances of surfaces with the
result that the illuminances in the standard can be either too low
or too high to meet the visual requirements of the workplace or
other space.
o In respect of good design practice, reconfigurable spaces should be
designed with fixed lighting that meets the requirements for the
background area or immediately surrounding area depending on
the size and nature of the space with task lighting provided
separately related to furnishing. This would reduce the practice of
over lighting entire floor plates to task level and result in very
considerable energy savings.
EN 12464-2: ‘Light and Lighting-Part 2: Lighting of outdoor work places.’
Scope:
EN 12464-2 focuses on the recommendations for outdoor work places that are
used at night. It includes important recommendations on how obtrusive light
can be limited, to keep our night sky free of light pollution.
This European Standard does not specify lighting requirements with respect to
the safety and health of workers at work and has not been prepared in the field
of application of Article 153 of the EC treaty, although the lighting
requirements, as specified in this standard, usually fulfil safety needs. Lighting
requirements with respect to the safety and health of workers at work may be

Preparatory study on lighting systems
Month Year I 75
contained in Directives based on Article 153 of the EC treaty, in national
legislation of member states implementing these directives or in other national
member state legislation.
To enable people to perform outdoor visual tasks efficiently and accurately,
especially at night, adequate and appropriate lighting has to be provided. The
degree of visibility and comfort required in a wide range of outdoor work places
is governed by the type and duration of activity.
This part 2 of EN 12464 provides the lighting design criteria for 15 installation
task groups and 97 task activities in terms of quantity and quality of
illumination. It also defines the maintenance, energy efficiency and system
verification procedures.
In addition recommendations are given for good lighting practice.
This European Standard neither provides specific solutions, nor restricts the
designer’s freedom from exploring new techniques nor restricts the use of
innovative equipment.
CEN/TR 13201-1: ‘Road lighting - Part 1: Selection of lighting classes.’
Scope:
This technical report specifies the lighting classes set out in EN 13201-2 and
gives guidelines on the application of these classes. To do this, it includes a
system to define an outdoor public traffic area in terms of parameters relevant
to lighting. To assist in the application of classes, it suggests a practical
relationship between the various series of lighting classes, in terms of
comparable or alternative classes. It also gives guidelines on the selection of
the relevant area to which the lighting classes from EN 13201-2 and the
calculation grids and procedure from EN 13201-3 should be applied.
It is important to mention that this document is only a technical report, not a
standard.
EN 13201-2: ‘Road lighting - Part 2: Performance requirements.’
Scope:
This part of the European Standard defines, according to photometric
requirements, lighting classes for road lighting aiming at the visual needs of
road users, and it considers environmental aspects of road lighting.
Installed intensity classes for the restriction of disability glare and control of
obtrusive light and installed glare index classes for the restriction of
discomfort glare are defined in annex A.
EN 13201-3: ‘Road lighting - Part 3: Calculation of performance.’
Scope:
This European Standard defines and describes the conventions and
mathematical procedures to be adopted in calculating the photometric
performance of road lighting installations designed in accordance with EN
13201-2.
The calculation methods described in EN 13201-3 enable road lighting quality
characteristics to be calculated by agreed procedures so that results obtained
from different sources will have a uniform basis.
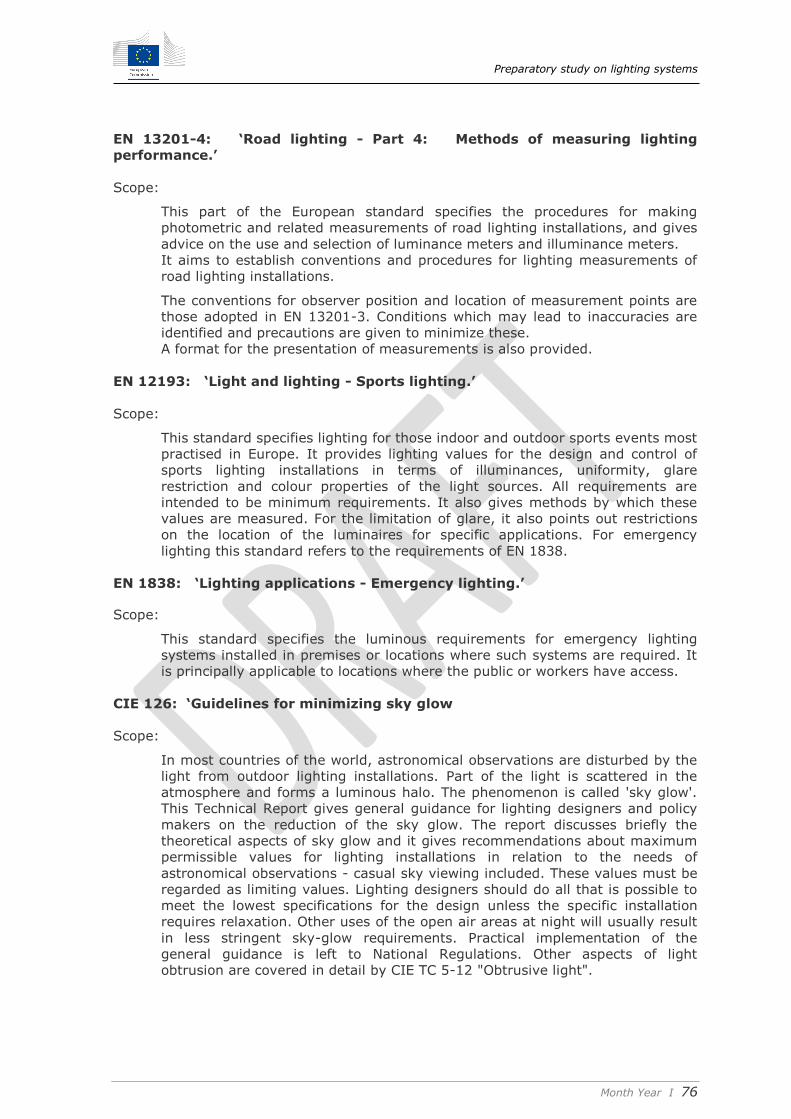
Preparatory study on lighting systems
Month Year I 76
EN 13201-4: ‘Road lighting - Part 4: Methods of measuring lighting
performance.’
Scope:
This part of the European standard specifies the procedures for making
photometric and related measurements of road lighting installations, and gives
advice on the use and selection of luminance meters and illuminance meters.
It aims to establish conventions and procedures for lighting measurements of
road lighting installations.
The conventions for observer position and location of measurement points are
those adopted in EN 13201-3. Conditions which may lead to inaccuracies are
identified and precautions are given to minimize these.
A format for the presentation of measurements is also provided.
EN 12193: ‘Light and lighting - Sports lighting.’
Scope:
This standard specifies lighting for those indoor and outdoor sports events most
practised in Europe. It provides lighting values for the design and control of
sports lighting installations in terms of illuminances, uniformity, glare
restriction and colour properties of the light sources. All requirements are
intended to be minimum requirements. It also gives methods by which these
values are measured. For the limitation of glare, it also points out restrictions
on the location of the luminaires for specific applications. For emergency
lighting this standard refers to the requirements of EN 1838.
EN 1838: ‘Lighting applications - Emergency lighting.’
Scope:
This standard specifies the luminous requirements for emergency lighting
systems installed in premises or locations where such systems are required. It
is principally applicable to locations where the public or workers have access.
CIE 126: ‘Guidelines for minimizing sky glow
Scope:
In most countries of the world, astronomical observations are disturbed by the
light from outdoor lighting installations. Part of the light is scattered in the
atmosphere and forms a luminous halo. The phenomenon is called 'sky glow'.
This Technical Report gives general guidance for lighting designers and policy
makers on the reduction of the sky glow. The report discusses briefly the
theoretical aspects of sky glow and it gives recommendations about maximum
permissible values for lighting installations in relation to the needs of
astronomical observations - casual sky viewing included. These values must be
regarded as limiting values. Lighting designers should do all that is possible to
meet the lowest specifications for the design unless the specific installation
requires relaxation. Other uses of the open air areas at night will usually result
in less stringent sky-glow requirements. Practical implementation of the
general guidance is left to National Regulations. Other aspects of light
obtrusion are covered in detail by CIE TC 5-12 "Obtrusive light".

Preparatory study on lighting systems
Month Year I 77
CIE 150: ‘Guide on the Limitation of the Effects of Obtrusive Light from
Outdoor Lighting Installations.’
Scope:
The purpose of this Guide is to help formulate guidelines for assessing the
environmental impacts of outdoor lighting and to give recommended limits for
relevant lighting parameters to contain the obtrusive effects of outdoor lighting
within tolerable levels. As the obtrusive effects of outdoor lighting are best
controlled initially by appropriate design, the guidance given is primarily
applicable to new installations; however, some advice is also provided on
remedial measures which may be taken for existing installations.
This Guide refers to the potentially adverse effects of outdoor lighting on both
natural and man-made environments for people in most aspects of daily life,
from residents, sightseers, transport users to environmentalists and
astronomers. (Astronomers should also see CIE 126-1997)
The daytime appearance of the lighting installation is important. The size and
nature of the lighting support structures may be intrusive by day although this
subject is not addressed in this Guide.
Status:
This standard is currently under revision in CIE TC 5-28.
CIE 171 (2006): ‘Test Cases for Assessment of Accuracy of Lighting
Computer Programs’
Scope:
The objective of this report is to help lighting program users and developers
assess the accuracy of lighting computer programs and to identify their
weaknesses. A validation approach is therefore presented based on the concept
of separately testing the different aspects of light propagation. To apply this
approach, a suite of test cases has been designed where each test case
highlights a given aspect of the lighting simulation domain and is associated
with the related reference data.
Two types of reference data are used: data based on analytical calculation and
data based on experimental measurements. The first is associated with
theoretical scenarios that avoid uncertainties in the reference values. The
second type is obtained through experimental measurements, where the
scenario and the protocol are defined in a manner that minimises the
uncertainties associated with the measurements.
A set of recommendations is also presented in order to achieve reliable
experimental data for validation purposes. These recommendations address the
choice and description of the scenarios, to the experimental protocol
precautions, to the estimation of the error sources and to the presentation of
the reference data.
The report is written in English, with a short summary in French and German.
It consists of 97 pages with 27 figures and 65 tables.

Preparatory study on lighting systems
Month Year I 78
Notes:
This standard provides test cases but sets no limits on accuracy. It is left to the
member states to determine whether they will allow the use of these
calculations in their EPBD implementation. For example, Belgium uses the
standard test cases and specifies accuracy limits in order to use lighting design
software calculations to be included in EPBD30.
1.4.2.5 Some examples of performance standards on parts of the system
IEC 62386-101: ‘Digital addressable lighting interface - Part 101: General
requirements – System.’
Scope:
IEC 62386-101:2009 specifies a protocol for control by digital signals of
electronic lighting equipment using AC or DC power supplies. Part 101 is
intended to be used in conjunction with Part 102, which contains general
requirements for the relevant product type (control gear), and containing
clauses to supplement or modify the corresponding clauses in Parts 101 and
102 in order to provide the relevant requirements for each type of product.
This International Standard, together with IEC 62386-102 and IEC 62386-201,
replaces Clause E.4, "Control by digital signals", and Annex G, "Test
procedures".
EN 62386-209: ‘Digital addressable lighting interface - Part 209: Particular
requirements for control gear - Colour control (device type
8).’
Scope:
IEC 62386-209:2011 specifies a protocol and test procedures for the control by
digital signals of electronic control gear that can change light colour. This
publication contains .pdf files, which reproduce the test sequences illustrated in
Figures 5 to 127. These files are intended to be used as a complement and do
not form an integral part of the publication. This publication is to be read in
conjunction with IEC 62386-101:2009 and IEC 62386-102:2009.
EN 60927: ‘Auxiliaries for lamps - Starting devices (other than glow
starters) - Performance requirements.’
Scope:
This International Standard specifies performance requirements for starting
devices (starters and ignitors) for tubular fluorescent and other discharge
lamps for use on AC power supplies up to 1 000 V at 50 Hz or 60 Hz, which
produce starting pulses not greater than 5 kV. This standard is used in
conjunction with IEC 61347-1 and IEC 61347-2-1.
EN 60923: ‘Auxiliaries for lamps. Ballasts for discharge lamps (excluding
tubular fluorescent lamps). Performance requirements.’
Scope:
This International Standard specifies performance requirements for ballasts,
for discharge lamps such as high-pressure mercury vapour, low-pressure
30 http://www.epbd.be/index.cfm?n01=light&n02=procedure_of_recognition&lang=fr
Preparatory study on lighting systems
Month Year I 79
sodium vapour, high-pressure sodium vapour and metal halide lamps. Clauses
12 through 15 each detail specific requirements for a particular type of ballast.
This standard covers inductive type ballasts for use with AC power supplies up
to 1 000 V at 50 Hz to 60 Hz associated with discharge lamps, having rated
wattage, dimensions and characteristics as specified in the relevant IEC lamp
standards.
EN 60927: ‘Auxiliaries for lamps - Starting devices (other than glow
starters) - Performance requirements.’
Scope:
This International Standard specifies performance requirements for starting
devices (starters and ignitors) for tubular fluorescent and other discharge
lamps for use with AC power supplies up to 1 000 V at 50 Hz or 60 Hz, which
produce starting pulses not greater than 5 kV. This standard is used in
conjunction with IEC 61347-1 and IEC 61347-2-1.
EN 60929: ‘AC-supplied electronic ballasts for tubular fluorescent lamps –
Performance requirements’.
Scope:
This International Standard specifies performance requirements for electronic
ballasts for use with AC power supplies up to 1 000 V at 50 Hz or 60 Hz with
operating frequencies deviating from the supply frequency, associated with
tubular fluorescent lamps as specified in IEC 60081 and IEC 60901 and other
tubular fluorescent lamps for high frequency operation. (It only applies to
electronic ballasts; ferromagnetic ballasts are covered under IEC60921.)
EN 61167: ‘Metal halide lamps - Performance specifications.’
Scope:
This standard specifies the performance requirements for metal halide lamps
for general lighting purposes.
EN 62639: ‘Fluorescent induction lamps - Performance specifications.’
Scope:
This standard specifies the performance requirements for fluorescent induction
lamps for general lighting purposes. In this standard, the term 'lamp' stands
for 'induction lamp'. It may be expected that lamps which comply with this
standard will start and operate satisfactorily at voltages between 92% and
106% of rated supply voltage and at an ambient air temperature between 10
°C and 50 °C, when operated with ballasts complying with IEC 60929 and IEC
61347-2-3, as far as applicable, and in a luminaire complying with IEC 60598-
1.
EN 60081: ‘Double-capped fluorescent lamps - Performance specifications.’
Scope:
Gives technical requirements for tubular fluorescent lamps with preheated
cathodes for general lighting service, operated with or without a starter from
AC mains. It also describes tests for lamps with non-preheated cathodes
Preparatory study on lighting systems
Month Year I 80
operated without the use of a starter. It gives testing methods to be used for
checking quality and interchangeability for type testing, for individual lamp
batches or for a manufacturer's entire production. It consists of a series of
standard data sheets, each giving the characteristics of a specific lamp type.
Lastly, it introduces new co-ordinates for the standard colours together with a
new standard 'white' colour.
EN 50294: ‘Measurement Method of Total Input Power of Ballast-Lamp
Circuits’.
Scope:
This Standard gives the measurement method of the total input power for
ballast-lamp circuits when operating with their associated fluorescent lamp(s).
This standard applies to electrical ballast-lamp circuits comprised solely of the
ballast and of the lamp(s). Note: requirements for testing individual ballasts
during production are not included. It specifies the measurement method for
the total input power for all ballasts sold for residential and normal commercial
purposes operating with the following fluorescent lamps: linear lamps with
power equal to or greater than 15 W; single ended (compact) lamps with
power equal to or greater than 18 W; and other general purpose lamps. This
standard does not apply to: ballasts which form an integral part of the lamp;
ballast-lamp circuits with capacitors connected in series; controllable wire-
wound magnetic ballasts; luminaires which rely on additional optical
performance aspects.
1.4.2.6 Examples of safety standards on parts of the system
EN 62471: ‘Photobiological safety of lamps and lamp systems’
Scope:
This standard gives guidance for evaluating the photobiological safety of lamps
and lamp systems including luminaires. Specifically it specifies the exposure
limits, reference measurement technique and classification scheme for the
evaluation and control of photobiological hazards from all electrically powered
incoherent broadband sources of optical radiation, including LEDs but
excluding lasers, in the wavelength range from 200 nm through 3000 nm. This
standard was prepared as Standard CIE S 009:2002 by the International
Commission on Illumination.
IEC/TR 62778: Application of IEC/EN 62471 for the assessment of blue light
hazard to light sources and luminaires (Technical report)
Scope:
IEC/TR 62778:2012 brings clarification and guidance concerning the
assessment of blue light hazard of all lighting products which have their main
emission in the visible spectrum (380 nm to 780 nm). By optical and spectral
calculations, it is shown what the photobiological safety measurements as
described in IEC/EN 62471 tell us about the product and, if this product is
intended to be a component in a higher level lighting product, how this
information can be transferred from the component product (e.g. the LED
package, the LED module, or the lamp) to the higher level lighting product
(e.g., the luminaire).

Preparatory study on lighting systems
Month Year I 81
EN 62035: ‘Discharge Lamps (Excluding Fluorescent Lamps) - Safety
Specifications’.
Scope:
Specifies the safety requirements for discharge lamps (excluding fluorescent
lamps) for general lighting purposes.
This International Standard is applicable to low-pressure sodium vapour lamps
and to high-intensity discharge (HID) lamps, i.e. high-pressure mercury
vapour lamps (including blended lamps), high-pressure sodium vapour lamps
and metal halide lamps. It applies to single- and double-capped lamps.
EN 60968: ‘Self-ballasted lamps for general lighting services - Safety
requirements.’
Scope:
This International Standard specifies the safety and interchangeability
requirements, together with the test methods and conditions, required to show
compliance of tubular fluorescent and other gas-discharge lamps with
integrated means for controlling starting and stable operation (self-ballasted
lamps), intended for domestic and similar general lighting purposes, having: -
a rated wattage up to 60 W; - a rated voltage of 100 V to 250 V; - Edison
screw or bayonet caps. The requirements of this standard relate only to type
testing. Recommendations for whole product testing or batch testing are under
consideration. This part of the standard covers photobiological safety according
to IEC 62471 and IEC/TR 62471-2.
EN 62035: ‘Discharge lamps (excluding fluorescent lamps) - Safety
specifications.’
Scope:
Specifies the safety requirements for discharge lamps (excluding fluorescent
lamps) for general lighting purposes. This International Standard is applicable
to low-pressure sodium vapour lamps and to high-intensity discharge (HID)
lamps, i.e. high-pressure mercury vapour lamps (including blended lamps),
high-pressure sodium vapour lamps and metal halide lamps. It applies to
single- and double-capped lamps.
EN 62532: ‘Fluorescent induction lamps - Safety specifications.’
Scope:
This standard specifies the safety requirements for fluorescent induction lamps
for general lighting purposes. It also specifies the method a manufacturer
should use to show compliance with the requirements of this standard on the
basis of whole production appraisal in association with his test records on
finished products. This method can also be applied for certification purposes.
Details of a batch test procedure, which can be used to make limited
assessment of batches, are also given in this standard.
Besides these European and CEI or ISO standards, countries can have own standards
and/or legislation.
E.g. on the ergonomic aspects on the workplace, the Netherlands have a standard
‘NEN 3087 Ergonomie’ that discusses visual ergonomics in relation to lighting and

Preparatory study on lighting systems
Month Year I 82
Belgium has a law ‘Codex for well-being on the workplace’ that also threats
ergonomics and lighting.
A full list of European standards is in Annex A.
1.4.3 US standards and building codes31
Building energy performance codes in the USA are mostly adopted at state level.
There are different codes in place in different states as indicated in Figure 1-15.
Essentially the codes adopted are aligned with different generations of the ASHRAE
90.1 or IECC32 model building codes.
1.4.3.1 Indoor lighting controls requirements
The ASHRAE Standard 90.1 requires the use of automatic daylight responsive controls
but only when the daylight area from side-lighting is more than 250 ft2. It also
requires other criteria to be met before daylighting controls are required. One such
requirement is that of effective aperture. Effective aperture is a term used to
characterise the relationship between the window area, its location on the perimeter
wall, and its ability to daylight a space. Here again, the definition of effective aperture
varies from one standard to the other.
Under the ASHRAE Standard 90.1, daylighting controls are only required in those
spaces where the effective aperture is greater than 0.1 (10%). Furthermore for spaces
smaller than 10,000 ft2 (929 W/m2), one manual control device is required for every
2,500 ft2 (232 W/m2). For spaces larger than 10,000 ft2, one manual control device is
required for every 10,000 ft2.
In the ASHRAE Standard 90.1, the occupant must be able to reduce the lighting power
to between 30% and 70% of full power using the manual control device. Spaces such
as corridors, stairways, electrical/mechanical rooms, public lobbies, restrooms, storage
rooms are exempted. Also exempted are spaces with only one luminaire with a rated
power of less than 100 W and spaces with a lighting power density allowance of less
than 0.6 W/ft2 (6.5 W/m2).
Energy codes require that all building spaces be controlled by an automatic control
device that shuts off general lighting. This control device must turn off lights in
response to a time-based operation schedule, occupancy sensors that detect the
absence of occupants, or a signal from the building’s energy management system or
some other system that indicates that the space is empty. Display, accent, and case
lighting must be controlled using separate control devices.
1.4.3.1.1 Lighting Power Reduction Controls
Under the ASHRAE Standard 90.1, certain exterior lighting categories must reduce,
and in some cases completely turn off, lighting in response to an operation schedule
or actual occupancy.
31 Sources for this section include: DOE Updates National Reference Standard for Commercial Buildings to 90.1-2013, Lighting Controls Association, November 3, 2014 and What’s New in ASHRAE/IES 90.1-2013,
DiLouie C., September 22, 2014 both at http://lightingcontrolsassociation.org/lca/topics/energy-codes/ And Lighting Development, Adoption, and Compliance Guide, Building Technologies Program, September 2012, Prepared for the U.S. Department of Energy under Contract DE-AC05-76RL01830 | PNNL-SA-90653 32 E.g. ANSI/ASHRAE/IES 90.1-2010. 2010 Energy Conservation in New Buildings Except Low Rise and Residential Buildings. American Society of Heating, Refrigerating and Air-Conditioning Engineers, Atlanta, Georgia, and IECC. 2012. International Energy Conservation Code. International Code Council, Washington D.C
Preparatory study on lighting systems
Month Year I 83
The following controls are required by the ASHRAE Standard 90.1:
Building façade and landscape lighting is required to be shut off between
midnight or business closing, whichever is later, and 6 a.m. or business
opening, whichever is earlier.
All other lighting must be reduced by at least 30% of full power using
either occupancy sensors to turn lights off within 15 minutes of sensing
zero occupancy, or from midnight or one hour from close of business,
whichever is later, until 6 a.m. or business opening, whichever is earlier.
Exterior lighting provided for security, safety, or eye adaptation, such as covered
parking lot or building entrances and exits, is exempted from lighting reduction control
requirements.
As a complement to the ASHRAE 90.1 and IECC codes the Illuminating Engineering
Society of North America and the US Lighting Controls Association have published the
LEM-7 Guide to Energy-Saving Lighting Controls33. This is a detailed guide to energy-
saving lighting controls and is intended to help designers, users, commissioning
agents and other interested parties understand energy-saving strategies, design
considerations, equipment, the variety of communication protocols and the importance
of commissioning for lighting control systems installed in both interior and exterior
applications in all types of buildings.
1.4.3.2 Outdoor lighting control requirements
The ASHRAE/IES 90.1-2010, standard, requires all outdoor lighting be controlled by a
photo-sensor. Building façade and landscape lighting must be controlled by a time
switch that turns the lights off at some point during the night.
The energy standard also requires all outdoor lighting power—other than building
façade and landscape lighting, but including advertising signage—to be reduced by at
least 30% after normal business operations based on a schedule or occupancy.
Parking garage lighting power must be reduced by at least 30% based on occupancy,
with control zones limited to 3,600 ft2 (335m2). Daylight harvesting and separate
control for daylight transition areas (i.e. entrances and exits) must be implemented.
1.4.3.3 Interior Lighting Power Density Limits
The interior lighting power density (LPD) limits are presented by the ASHRAE or IECC
energy codes as either whole building (building area) or space-by-space requirements,
or both. For whole-building compliance, the total lighting power designed for the
building must be no greater than the allowed LPD for the building type. For space-by-
space, the total power designed for the building must be no greater than the sum of
the individual space allowances multiplied by the area of that space type in the
building.
The LPD limits are based on a set of space-type lighting models that mimic quality
energy efficient design for that space type. These models incorporate all primary
elements involved in design, including current product lamp efficacy, luminaire
efficiency, light loss factors, and common design practice. Values are developed for
most expected types of building space such that reasonably efficient designs can be
accomplished. It is recognised that in some applications, the configuration of an
individual space or specific lighting needs may make it difficult to meet the allowance
for that space. Therefore, most interior space-by-space LPD compliance is based on a
33 See http://lightingcontrolsassociation.org/lca/topics/energy-codes/
Preparatory study on lighting systems
Month Year I 84
total building trade-off principle. This means that the summed allowance for the entire
building can be used anywhere in the building.
1.4.3.4 The 2013 ASHRAE 90.1 national energy reference standard
The latest version of the ASHRAE 90.1 code is the ASHRAE/IES 90.1-2013 standard.
On September 26, 2014, the U.S. Department of Energy (DOE) named the
ASHRAE/IES 90.1-2013 energy standard as the new national energy reference
standard, superseding the 2010 version in effect until then. As a result within two
years, all states in the United States must put into effect a commercial building energy
code at least as stringent as the 2013 version of 90.1, or justify why they cannot
comply.
The ASHRAE/IES Standard 90.1 provides a model commercial building energy code
that can be adopted by states and other jurisdictions. The standard, which applies to
new construction and major renovations (including requirements for lamp-ballast
retrofits), is updated every three years. The lighting section of ASHRAE/IES 90.1 has
become increasingly sophisticated over the past 14 years, particularly in regard to
lighting controls. The 2013 standard attempts to go even further while simplifying
understanding and application.
The major changes to ASHRAE/IES 90.1 2013’s Section 9 on lighting include:
adjustments to the maximum permitted lighting power densities (LPD)
more stringent lighting control requirements
a new table format for determining lighting power and control
requirements in individual spaces
There are two routes by which LPD values are specified: the space by space method or
the building area method. The Building Area Method specifies maximum permitted LPD
values for the whole building depending on the building type, while the space by space
method specifies maximum permitted LPD values for specific types of building space
e.g. offices, corridors, toilet blocks etc. Compliance with the code allows either
approach to be used as long as a decision is made to use one or the other for the
whole site in question.
The latest LPD values derived using the “Building Area Method” can be summarised as
follows:
hospitals - 1.05 W/ft2 (11.3 W/m²)
offices - 1.01 W/ft2 (10.9 W/m²)
retail - 0.9 W/ft2 (9.7 W/m²)
schools/universities - 1.05 W/ft2 (11.3 W/m²)
warehouse buildings – 1.01 W/ft2 (10.9 W/m²)
These adjustments save power where possible according to new light level
recommendations published by the Illuminating Engineering Society (IES) of North
America.
The primary change in ASHRAE/IES 90.1-2013 is a new table (Table 9.6.1) format for
determining the LPD allowances using the space by space method and minimum
mandatory control requirements using either the space by space method or building
area method. The table was developed to simplify reading and reference of LPD and
control requirements in each space, but, at first glance, it may appear confusing. One
must read the accompanying text as separate requirements and options applicable to
the table, not a consecutive list of actual requirements. Otherwise, proper use of the
table is in the fine print. For example, two tables actually list space types, but the first

Preparatory study on lighting systems
Month Year I 85
represents space types commonly found in multiple building types, while the second
covers space types typically found in a single building type.
For open offices, the LPD is 0.98 W/ft2 if using the space by space method. The room
cavity ratio (RCR) threshold is 4, meaning an additional lighting power allowance of 20
percent is available if the actual RCR (2.5 × room cavity height × room perimeter
length ÷ room area) exceeds the threshold. Various controls are then required, and
some choices are available. For example, in open offices, space controls are required
to give users control over their lighting. All lighting must be capable of bi-level control.
If daylight is present, lighting in the daylight zones must be separately and
automatically controlled. The lights may be manual-on or partial-automatic-on, and
they must be turned off automatically based on occupancy or a schedule. The
requirements for lighting controls in the 2013 version of the ASHRAE standard include
that:
Occupancy sensors must be set to turn the lights off within 20 minutes (instead
of 30 minutes) after a space is vacated.
Automatic independent control should be installed in secondary side-lit daylight
zones (covering additional luminaires farther from the windows) rather than
just receiving an incentive via a control credit.
Daylight harvesting step-dimming control now requires two control points
between off and full-on—one dim level between 50–70 percent of design power
and one between 20–40 percent—to provide greater flexibility.
A second automatic lighting shutoff option is required for certain occupancy
sensor installations—partial-off to 50 percent of design power within 20
minutes of the space being vacated—spaces where the lights are periodically
not needed but must remain on.
More detailed functional testing requirements are imposed.
1.4.3.5 Status of adoption by US State
The generations of codes adopted at state level as of August 2014 can be classified as
being one of the following:
No state level code adopted
ASHRAE 90.1-2001 or IECC 2003 equivalent or more energy efficient
ASHRAE 90.1-2004 or IECC 2006 equivalent or more energy efficient
ASHRAE 90.1-2007 or IECC 2009 equivalent or more energy efficient
ASHRAE 90.1-2010 or IECC 2012 equivalent or more energy efficient
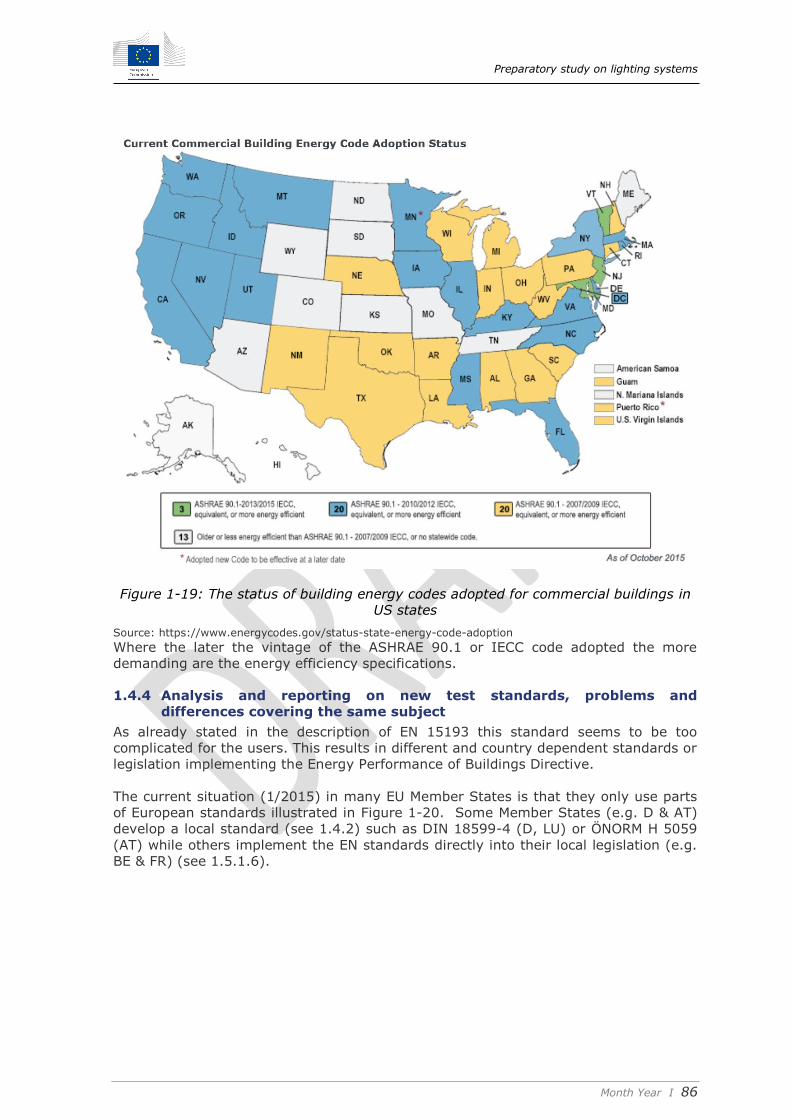
Preparatory study on lighting systems
Month Year I 86
Figure 1-19: The status of building energy codes adopted for commercial buildings in
US states
Source: https://www.energycodes.gov/status-state-energy-code-adoption
Where the later the vintage of the ASHRAE 90.1 or IECC code adopted the more
demanding are the energy efficiency specifications.
1.4.4 Analysis and reporting on new test standards, problems and
differences covering the same subject
As already stated in the description of EN 15193 this standard seems to be too
complicated for the users. This results in different and country dependent standards or
legislation implementing the Energy Performance of Buildings Directive.
The current situation (1/2015) in many EU Member States is that they only use parts
of European standards illustrated in Figure 1-20. Some Member States (e.g. D & AT)
develop a local standard (see 1.4.2) such as DIN 18599-4 (D, LU) or ÖNORM H 5059
(AT) while others implement the EN standards directly into their local legislation (e.g.
BE & FR) (see 1.5.1.6).

Preparatory study on lighting systems
Month Year I 87
Figure 1-20: Actual situation in many EU Member States regarding how they use the
EPBD standards34
1.4.5 Ongoing standardisation mandates from the European commission
1.4.5.1 Introduction to mandates from the European Commission
Mandates are the mechanism by which the European Commission (EC) and the
secretariat of the European Free Trade Association (EFTA) request the European
Standardization Organizations (ESOs) to develop and adopt European standards in
support of European policies and legislation.
1.4.5.2 Mandate M/480 - EPBD
M/480 Mandate to CEN, CENELEC and ETSI for the elaboration and adoption of
standards for a methodology calculating the integrated energy performance of
buildings and promoting the energy efficiency of buildings, in accordance with the
terms set in the recast of the Directive on the energy performance of buildings
(2010/31/EU)35.
1.4.5.3 Mandate M/495 – Ecodesign horizontal mandate
The request from the Commission (EC mandate M/495) is a horizontal mandate
covering more than 25 different types of products that use energy or have an impact
on the use of energy. Types of products covered by this mandate include: air
conditioning and ventilation systems, boilers, coffee machines, refrigeration units,
ovens, hobs and grills, lamps and luminaries, tumble dryers, heating products,
computers and monitors, washing machines, dryers and dishwashers, sound and
imaging equipment, water heaters, etc.
Standardisation needs defined in its annexes related to tertiary and office lighting
were:
standby and off mode power
luminaire efficiency
FL ballast efficiency (amend EN 50294)
HID ballast efficiency measurement method
Technical Committee(s) concerned with M/495 include: CIE, IEC TC34 and SCs, CLC
TC 34Z /IEC TC 34C.
1.4.5.4 M/485 Mandate in the field of fluorescent lamps, high-intensity
discharge lamps, ballasts and luminaires able to operate such lamps
This specific mandate is related to M/495, which is the horizontal mandate.
34 Source: CENSE project workshop presentation ‘Standardisation work on EPBD CEN- standards towards better energy performance of buildings and their further development in CEN & ISO’ (23/3/201). 35 https://www.cen.eu/work/supportLegislation/Mandates/Pages/default.aspx
Preparatory study on lighting systems
Month Year I 88
The mandate requires the development of procedures and methods of measuring the
following product parameters:
For fluorescent and high-intensity discharge lamps, the spectral
radiation, the luminous flux, the power consumption, the lamp lumen
maintenance factor, the lamp survival factor, the chromaticity, the
correlated colour temperature, the colour rendering, the specific
effective radiant ultraviolet power, the lamp caps and the total mercury
content;
For ballasts able to operate fluorescent and high-intensity discharge
lamps, the input power of the lamp-ballast circuit, including when the
operated lamps do not emit any light in normal operating conditions;
For luminaires able to operate fluorescent and high-intensity discharge
lamps, the power consumption when the operated lamps do not emit
any light in normal operating conditions, the ingress protection grading,
the CEN flux code and the photometric file;
For luminaires for office lighting, the luminaire maintenance factor;
For luminaires for street lighting, the luminaire maintenance factor, the
utilisation factor and the Upward Light Output Ratio.
Text in italic is of particular interest to the lighting system study.
1.4.6 Conclusions and summary of standards
1.4.6.1 What are the relevant new and updated standards and is there a
missing standard or overlap?
First, it is important to conclude that for all the primary and secondary lighting system
functional parameters described in 1.3.3 that standards are available to define and
measure them. Therefore, there are no clearly missing standardisation needs at the
moment. The deficiencies which have been identified in the standards are mainly
concerned with the need to improve accuracy, increase user acceptance and/or
provide better coverage of new technologies such as LEDs or controls.
The standards do not overlap in principle apart from EN 15193 that is implemented
differently across the Member States, as explained below. It should be noted that
within standardisation some acronyms and terminology has changed over time. For
example Lumen Maintenance Factor is denoted as LMF in CIE 97(2007) yet is denoted
as FLM in EN 12665(2011), but these are problems that will be solved in the normal
standardisation update and revision cycles. It is also worth noting that LED light
sources have various other life time and lumen maintenance parameters (LxFy) that
need to be converted36 into the maintenance factor(FM) and lamp survival factor (FLS)
as used for fluorescent and high intensity lamps and their luminaires. At the moment a
guideline36 is available to address this but it is also expected that this will be included
in a European Standard. Hence, for this reason it is not recognised as a missing item
within this study.
The European standard for indoor lighting EN 15193 (2007): ‘Energy performance of
buildings – Energy requirements for lighting’ has had limited acceptance so-far within
the Member States, see 1.4.2.2, and as a result the standard has only been
implemented partially or subject to local variants (e.g. DIN 18599, see 1.4.2.3).
However this standard is currently under review and will hopefully have broader
acceptance in the future. The current draft proposal now also includes a means of
decomposing the system based on so-called expenditure factors that are very similar
to the system decomposition expressed in Figure 1-3 within this study. The main
36 ZVEI (2013): ‘Guide to Reliable Planning with LED Lighting Terminology, Definitions and Measurement Methods: Bases for Comparison’

Preparatory study on lighting systems
Month Year I 89
purpose is to give the user better insight in which system elements are most likely to
provide efficiency gains.
A similar standard for road lighting is under development, prEN 13201-5: ‘Road
lighting-Part 5: Energy performance indicators’. This standard is similar to EN15193
on indoor lighting but uses other acronyms and terminology. The study follows also
this draft standard in the extend possible, see
1.4.6.2 Are there possible problems with standards for later policy measures?
Yes, verifying the minimum maintained illuminance and surface reflection coefficients
could be a complicated task as reported in EN 12464 in section 1.4.2.4 and the
discussion on potential gaps herein.
It has also been reported that the ceiling/wall/floor reflectance has an important
impact on the outcomes.
1.4.6.3 Are there draft outlines for possible European Mandates to ESOs?
As no missing standards were identified in 1.4.6.1, at this stage the only
recommendations are to update CIE 97 and CIE 151 (see 1.4.2) with respect to the
Luminaire Maintenance Factor (FLM); however, it has been reported that a review is
already planned for this standard. This statement can be reviewed in later Task 7
when discussing the policy measures.
1.5 Overview and description of legislation
Scope:
According to the MEErP the aim of this task is to identify and shortly describe the
relevance for the product scope of:
EU legislation (legislation on resources use and environmental impact, EU
voluntary agreements, labels)
Member State legislation (as above, but for legislation indicated as relevant by
Member States), including a comparative analysis)
Third country legislation (as above, but for third country legislation), including
a comparative analysis
1.5.1 EU legislation
1.5.1.1 Introduction and overview of EU Directives related to energy
efficiency of lighting
There are four EU Directives that could influence the energy efficiency of lighting
systems:
The Energy related Products Directive (ErP)
The Energy Labelling Directive (ELD)
The Energy Performance in Buildings Directive (EPBD)
The Energy Efficiency Directive (EED)
Implementing regulations within the ErP and ELD are currently applied to light
sources, ballasts and luminaires. They are not currently applied to controls and do not
address daylight harvesting directly. Furthermore the existing regulations only
partially addresses luminaire efficiency in that they are not applied to all types and
only specify information requirements.
Note: In parallel with this study a study specifically on light sources which
should be consulted for more product related information, see
http://ecodesign-lightsources.eu/

Preparatory study on lighting systems
Month Year I 90
The EPBD theoretically applies to lighting systems as lighting energy performance is
one of the measures that needs to be included when assessing compliance with
building energy codes and when applying the cost optimal methodology to determine
the cost-optimal requirements for a building energy code. Most MS simply include
lighting within the overall building energy performance assessment and associated
requirements, i.e. they do not set out specific performance provisions for lighting.
Only a few MS set specific energy performance requirements for lighting systems in
addition to setting whole building energy performance requirements. Lighting is
treated within building Energy Performance Certificates (EPCs) in a similar way – i.e.
its energy performance contributes to the overall rating but there are no specific
requirements for or ratings of the lighting system.
If lighting is already incorporated within the whole building energy requirement why
does it matter if there are no specific additional requirements? Lighting is the domain
of the electrical contractors and/or lighting designers (for higher-end installations). In
the absence of specific lighting energy requirements within the codes, the building
project manager would need to be fully aware of the contribution that lighting makes
to the whole building project’s energy rating and of the potential to reduce it through
efficient designs if they are to successfully manage the sub-contractors that will design
and install the lighting system. It can be argued that having additional and specific
minimum legal requirements for lighting system energy performance provides extra
assurance that the energy performance of this system will be acceptable even in cases
where the overall project procurers and managers are unaware of the opportunities it
can make to the whole project performance.
The Energy Efficiency Directive (EED) also has numerous articles which could
theoretically be implemented in a manner that would support lighting system
efficiency, however, none of them explicitly mention lighting. Thus unless MS’s decide
to make dedicated provisions for lighting efficiency in their implementation of the
provisions there is unlikely to be anything more than indirect support to lighting
system efficiency improvement.
Articles within the EED that could provide indirect support to lighting system efficiency
include:
Article 4 – Building Renovations
Article 7. Utility energy efficiency obligations
Article 8 – Energy Audits
Article 16 – Availability of qualification, accreditation and certification
schemes
Article 19 MS shall evaluate and remove barriers to EE
Article 20. Energy Efficiency National Funds
Table 1-2 gives a summary of current EU policy instruments as they are and could be
applied to lighting systems (LS) and building automated control systems (BACS).

Preparatory study on lighting systems
Month Year I 91
Table 1-2: Summary of current EU policy instruments as they are and could be applied to lighting systems (LS) and building
automation and control systems (BACS)
Directive Measure
EPBD Building Energy Performance Codes EPCs Incentives (Article 10(2))
Scope New build Existing buildings Residential Non-residential
Cost optimal assessment (Article 5)
Residential Non-residential All buildings
Status In most MS codes the LS is not treated in a prescriptive manner but only indirectly. BACS mostly not treated explicitly.
In most MS codes the LS is not treated in a prescriptive manner but only indirectly. Mixed, BACS mostly not treated explicitly.
In most MS codes the LS is not treated in a prescriptive manner but only indirectly. Mixed, BACS mostly not treated explicitly.
In most MS codes the LS is not treated in a prescriptive manner but only indirectly. Mixed, BACS mostly not treated explicitly.
LS are included. BACS are mostly not assessed explicitly, if at all.
LS are part of whole building rating. No evidence any MS has considered applying this article to BACS explicitly.
LS are part of whole building rating. No evidence any MS has considered applying this article to BACS explicitly.
No evidence any MS has considered applying this article to LS or BACS explicitly.
ECODESIGN/LABELLING MEPS Classification/ Labelling
Other requirements
Status LS being considered in Lot 37. Household lamps in regulations 244/2009, 859/2009 and 874/2012. Directional lighting in regulations 1194/2012 and 874/2012 Tertiary sector lamps and ballasts in regulation 245/2009 and 347/2010
LS being considered in Lot 37. Household lamps in regulations 244/2009, 859/2009 and 874/2012. Directional lighting in regulations 1194/2012 and 874/2012 Tertiary sector lamps and ballasts in regulation 245/2009 and 347/2010 Light sources being considered in Lot
LS in Lot 37, BACS under consideration for possible inclusion in work plan

Preparatory study on lighting systems
Month Year I 92
Light sources being considered in Lot 8/9/19. BACS under consideration for possible inclusion in work plan
8/9/19. BACS under consideration for possible inclusion in work plan
EED Article 7. Utility energy efficiency obligations
Article 20. Energy Efficiency National Funds
Article 4 – Building Renovations
Article 8 – Energy Audits
Article 16 – Availability of qualification, accreditation and certification schemes
Article 19 MS shall evaluate and remove barriers to EE
Status Mixed/weak implementation. Not all MS have them. Many EEOs (almost all) are not yet designed to apply to LS or BACS
Mixed/weak implementation. Not all MS have them. Many funds (most) are additional and are not yet designed to apply to LS or BACS
Indirect effect on LS and BACS
Could be applied to LS and BACS but no evidence any MS has considered applying this article to them
No evidence any MS has considered applying this article to LS or BACS explicitly
No evidence any MS has considered applying this article to LS or BACS explicitly
Key: BACS = Building Automated Control System
EED = Energy Efficiency Directive
EPBD = Energy Performance in Buildings Directive
EPC = energy performance certificate (for buildings)
LS = lighting system
MS = Member State

Preparatory study on lighting systems
Month Year I 93
Overall it is clear that the existing EU policy framework contains plenty of levers and
opportunities that could be applied to the promotion of energy efficient lighting
systems; however, that the application of these is variable and generally not targeted
at lighting systems per se. European building energy performance codes all include the
impact of the lighting system but relatively few have specific targeted requirements
for lighting systems – most simply include lighting as an input into the overall
building energy target. Building EPCs include lighting within the rating system but only
some give specific targeted advice on the performance of the lighting system relative
to its potential performance. The situation for building automated controls (which can
be used to reduce lighting energy wastage) is similar except that they have even less
requirements specified.
The EED includes several general provisions that could be applied in ways that would
have an influence on lighting system energy efficiency but that is entirely dependent
on how the measures are actually put into effect at MS level. Provisions such as the
utility energy efficiency obligations, national energy efficiency funds, energy audits,
building renovations and certification and accreditation measures could all in principle
be applied in ways that promoted energy savings in lighting systems but there is little
evidence that this has been done so far.
1.5.1.2 Ecodesign requirements for non-directional household lamps
Commission Regulation (EC) No 244/2009
Commission Regulation (EC) No 859/2009 (amendment)
Commission Regulation (EC) No 244/2009, implementing Directive 2005/32/EC of the
European Parliament and of the Council with regard to ecodesign requirements for
non-directional household lamps (hereafter ‘the Regulation’) was published on the 18th
of March 2009 and entered into force two weeks later.
In Article 3 the Regulation sets requirements for Non-Directional Light Sources
(NDLS), specified in Annex II of the Regulation, in 6 stages.
The first four stages, with requirements applying from the 1st of September 2009,
2010, 2011 and 2012, eliminate low-efficacy (‘incandescent’) lamps in subsequently
lower lumen output-levels37. At the moment all general purpose incandescent lamps
with output >60 lm should have been phased-out from the EU market.
Stage 1 also sets minimum functionality requirements for Compact Fluorescent Lamps
(CFLs) and –in one group– light sources that are neither CFLs nor Light Emitting
Diodes (LEDs). This latter group of non-CFL/LED lamps mainly includes the NDLS
halogen lamps. Stage 5, which applies from 1 September 2013, sets more stringent
minimum functionality requirements regarding minimum rated lamp lifetime/lamp
survival factor at 6000h, lumen maintenance, number of switching cycles, starting
time, heat-up time to reach 60% of lumen output, premature failure rate, UVA+UVB
radiation, UVC radiation, lamp power factor (LPF) and –for CFLs only– the colour
rendering index (Ra). Most significantly, with respect to stage 1, stage 5 tightens the
requirements for the service life and lifetime functionality.
Stage 6 is applicable from 1 September 2016. It sets more stringent efficacy
requirements for clear lamps, but requirements and timing of Stage 6 are currently
37 ‘low-efficacy’ intended here for lamps where the rated power P exceeds the maximum rated power Pmax (in W) at a given rated luminous flux (Φ, in lm) with for non-clear lamps Pmax=0.24√Φ +0.0103Φ and for clear lamps in stages 1 to 5 Pmax=0.8(0.88√Φ+0.049Φ).

Preparatory study on lighting systems
Month Year I 94
revisited by the Commission in a separate context38. As it stands today, Stage 6
requires that instead of the maximum rated power Pmax (in W) being
0.8(0.88√Φ+0.049Φ), where Φ is the rated luminous output (in lm), the rated power
of clear lamps will then have to be less than a Pmax of 0.6(0.88√Φ+0.049Φ).
Futhermore, due to differences in permitted tolerances the eco-design and energy
labelling Directive specifications are no longer easily comparable.
There are a number of exemptions in the product scope of the regulation. The
exemptions include not only the ‘special purpose lamps’, but also coloured (not
‘white’) lamps, directional light sources (DLS), commercial lamps that are covered by
other legislation (LFLs, High Intensity Discharge HID lamps and non-integrated CFLs),
lamps with lumen output below 60 or above 12000 lumen, low voltage incandescent
lamps with E14/E27/B22/B15 caps. The exceptions to stage 6 requirements are clear
lamps with type G9 and R7s cap. (VHK, 2013)
1.5.1.3 Ecodesign requirements for fluorescent lamps without integrated
ballast, for high intensity discharge lamps and for ballast and
luminaires able to operate such lamps
Commission Regulation (EC) No 245/2009
Commission Regulation (EC) No 347/2010 (amendment)
Commission Regulation (EC) No 245/2009, implementing Directive 2005/32/EC of the
European Parliament and of the Council with regard to ecodesign requirements for
fluorescent lamps without integrated ballast, for high intensity discharge lamps, and
for ballasts and luminaires, was published the 18th of March 2009 and entered into
force two weeks later. Commission Regulation (EC) No 347/2010 is amending
Commission Regulation (EC) No 245/2009 (hereafter ‘the Regulation’).
The scope is defined in Article 1 and Annex 1 of the regulation. In Article 3 the
Regulation sets Ecodesign requirements that are specified in Annex III of the
Regulation, in 3 stages with an intermediate stage.
The possible phasing out is based upon achieving performance criteria like:
colour rendering (Ra)
efficacy (lm/W)
lamp lumen maintenance factor
lamp survival factor
For HID lamps only the lamps that have an E27, E40 or PGZ cap are within the scope
of the directive.
In the first stage (2010):
Halophosphate Fluorescent Lamps (T8 linear, U shaped, T9 circular, T4 linear)
were phased out;
Standby losses less or equal to 1 W per ballast;
Fluorescent ballasts for current lamps in the market shall fulfil at least
EEI = B2;
The term ballast efficiency was introduced;
Also several information requirements were introduced such as for
fluorescent lamps the rated lamp efficacy at 25°C and 35°C(T5) at 50
Hz (where applicable) and at High Frequency;
Extract on lamp efficacy requirement:
o LFL T8-36 W requires 93 lm/W (25°C);
38 VHK, Review study on the stage 6 requirements of Commission Regulation (EC) No 244/2009, draft report for the European Commission, April 2013.

Preparatory study on lighting systems
Month Year I 95
o LFL T5-28 W requires 93 lm/W (25°C);
o LFL T5-39 W requires 73 lm/W (25°C);
Extract on fluorescent ballast efficiency requirement:
o T8-36 W class B2 ≥ 79.3 %;
o T8-36 W class A2 ≥ 88.9 %;
Table 17 on ballasts for fluorescent lamps contains rated/typical wattage for 50
Hz and HF operation. This also reflects the typical efficacy gain found for HF
operation compared to 50 Hz, e.g. for the same lumen output a T8 ‘36 Watt’
lamp needs typically 36 W at 50 Hz and 32 W at HF. HF power supply can only
be provided with electronic ballasts.
In the second stage (2012):
Halophosphate Fluorescent Lamps ( T10, T12) were phased out;
For High Pressure Sodium and HPS / Metal Halide MH Lamps (E27/E40/PGZ12):
o Set up established performance criteria for MH E27/E40/PGZ12 lamps;
o Standard HPS E27/E40/PGZ12 were phased out, this means that HPS
lamps need an enhanced Xenon;
Extract on lamp efficacy requirement:
o HPS 70 W clear ≥ 90 lm/W;
o HPS 70 W not clear lamp ≥ 80 lm/W;
o MH 70 W clear ≥ 80 lm/W;
o MH 70 W not clear lamp ≥ 70 lm/W ;
Standby losses less or equal to 0.5 W per fluorescent ballast;
Minimum efficiency for HID ballast, e.g. a 70 W HID lamp requires 75 %
efficiency;
Introduction of minimum HID ballast efficiency and the obligation to make
them available.
In an intermediate stage (2015) the following lamps:
High pressure mercury lamps are expected to be phased out;
High Pressure Sodium-Plug-in/Retrofit lamps (HPM replacement) are expected
to be phase out;
Extract on lamp efficacy requirement: other HID 50W 50lm/W
Note: The regulation 244/2009 (TBC) on household lamps is much stronger for
CFLi lamps, e.g. a 50 W requires about 64 lm/W and CRI≥80 in regulation
244/2009 while any other 50 W HID requires only 50 lm/W in regulation
245/2009.
In the third stage (2017):
Low performing MH E27/E40/PGZ12 lamps are phased out; in practice this
means that ‘quartz’ MH lamps are phased out in favour of ‘ceramic’ discharge
tube MH lamps;
Compact Fluorescent Lamps with 2 pin caps and integrated starter switch
(Reason: These lamps are phased out in stage 3 as they do not operate on A2
class ballasts in practice) are phased out;
Ballasts for fluorescent lamps without integrated ballast shall have the
efficiency: ηballast ≥ EBbFL, wherein EBbFL = Plamp/(2√ (Plamp/36)+38/36Plamp
+1) for lamps between 5 and 100 Watt.
For example: a 36 W T8 lamp ballast should have ηballast ≥ 87.8 %.
This is far above the minimum class B1 requirement (Table 17) from
stage 1 and is likely to commercially phase out magnetic ballasts in low
cost applications. A side effect of phasing out magnetic fluorescent
ballasts is an increase in efficacy gain for those lamps on HF operation,
Preparatory study on lighting systems
Month Year I 96
as discussed later on. More efficient magnetic ballasts require more
copper and are expected to become too expensive for the market.
More strict minimum efficiency for HID ballast, e.g. 70 W HID lamp requires 85
% efficiency
(VHK, 2013)
1.5.1.4 Ecodesign requirements for directional lamps, for light emitting diode
lamps and related equipment
Commission Regulation (EC) No 1194/2012
Commission Regulation 1194/2012 sets minimum functional requirements for
directional and non- directional LED light sources. From the 1st of September 2013,
minimum requirements apply for:
the number of switches before failure (half the product life in hours, with a
maximum of 15 000 switches);
starting time (< 0.5 s);
lamp warm-up time (<2s to reach 95 % Φ), premature failure rate (≤ 5.0 % at
1 000 h);
colour rendering (Ra) (≥ 80, if the lamp is intended for outdoor or industrial
applications39);
colour consistency (maximum variation of chromaticity coordinates within a
six-step MacAdam ellipse40 or less);
lamp power factor (PF) for lamps with integrated control gear (P ≤ 2 W: no
requirement; 2 W < P ≤ 5 W: PF > 0.4; 5 W < P ≤ 25 W: PF > 0.5 ;P > 25 W:
PF > 0.9)
From the 1st of March 2014 additional minimum requirements will apply on
the lamp survival rate (>90% at 6000h41);
lumen maintenance (>80% at 6000h).
1.5.1.5 Energy labelling of electrical lamps and luminaires: Commission
Regulation (EC) No 847/2012
A new Commission Delegated Regulation for energy labelling of luminaires and light
sources was published in 2012. Contrary to the previous lamp energy label, regulated
under Directive 98/11/EC, the new Regulation covers directional lamps, extra low
voltage lamps, light-emitting diodes (LEDs), and lamps used predominantly in
professional lighting, such as high-intensity discharge lamps. It informs consumers
about the compatibility of the luminaire with energy-saving lamps and about the
energy efficiency of the lamps included with the luminaire. The exclusions from the
scope are similar to those intended in Regulation 244/2009. The energy efficiency
limits for classes A-G are similar to the ones in Directive 98/11/EC, but new ‘A+’,
‘A++’ and ‘A+++’ classes have been added to accommodate more efficient lighting
technology (e.g. LED). (VHK, 2013)
1.5.1.6 Energy performance of buildings Directive
Directive (2002/91/EC) and recast Directive (2010/31/EU)
39 In accordance with point 3.1.3 (l) of Annex III of commission regulation 1194/2012 40 Ellipse-shaped colour region in a chromaticity diagram where the human eye cannot see the difference with respect of the colour at the centre of the ellipse. MacAdam ellipses are used e.g. in standards for describing acceptable colour deviation between LED lamps/luminaires of the same model (1 step=1 ellipse area; 2step=2 concatenated ellipse areas, etc.) 41 The intention is to ascertain a minimum product life (lumen maintenance >70%) of around 20 000 h. The period of 6000h at the mentioned parameters values was defined to limit costs for compliance testing.

Preparatory study on lighting systems
Month Year I 97
The Energy Performance of Buildings Directive (EPBD) is, at European level, the main
policy driver affecting energy use in buildings. As originally formulated in 2002, the
EPBD sets out the following key requirements for Member States:
Minimum standards on the energy performance of new buildings and large
(>1000m²) existing buildings undergoing a ‘major renovation’;
A general framework; for a methodology for calculating the integrated energy
performance of buildings;
Energy certification for both new and existing buildings whenever they are
constructed, sold or rented out;
Implement an inspection and assessment regime for air conditioning and
boilers or, in the case of the latter, develop alternative measures to reach the
same level of energy performance.
In 2010 amendments to the EPBD were finalized and published, adding several new or
strengthened requirements, in particular:
Minimum energy performance requirements for building elements that form
part of the building envelope and have a significant impact on the energy
performance of the building envelope once retrofitted or replaced;
Setting up EU-wide nearly zero-energy buildings requirements and
development of national plans for increasing the number of NZEB buildings;
Abolishment of the 1000m² threshold for major renovations (now: 50m²);
Introducing a calculation framework for calculating the cost-optimal levels of
minimum energy performance requirements;
Minimum energy performance requirements of building systems (to be applied
in existing buildings and voluntarily be applied new buildings);
Requirement of an inspection and assessment regime for air conditioning and
heating systems or develop alternative measures to reach the same level of
energy performance;
Requirement of an inspection report for heating and air conditioning systems
(in case of application);
Independent control systems for EPC and inspection reports;
Reinforcement of the energy certification of the buildings;
Introduction of penalties.
Certification:
‘Member States shall ensure that an energy performance certificate is issued for (a)
buildings or building units which are constructed, sold or rented out to a new tenant;
and (b) buildings where a total useful floor area over 500 m 2 is occupied by a public
authority and frequently visited by the public. On 9 July 2015, this threshold of 500
m² shall be lowered to 250 m². ‘
Certification refers mainly to following articles of the recast EPBD42:
Article 11 ‘Energy Performance Certificates’;
Article 12 ‘Issue of Energy Performance Certificates’;
Article 13 ‘Display of Energy Performance Certificates’.
The issuing of EPCs has an important role in the transformation of the building sector.
By providing information, potential buyers and tenants can compare buildings/building
42 Implementing the Energy Performance of Buildings Directive (EPBD) – Featuring Country Reports 2012
Preparatory study on lighting systems
Month Year I 98
units. Also recommendations are provided for a cost-effective improvement,
encouraging home owners to refurbish their building to a better energetic standard.
The EPBD imposes that recommendations for improving energy performance should be
part of the EPC. These recommendations (standard or tailor-made) are an important
communication tool for the energetic improvement potential of the building. However
it should be considered that EPC recommendations cannot substitute detailed building
specific energy audits. Standard recommendations for the thermal envelope will
mostly depend on the U-value of the construction element. Recommendations should
not only focus on an improved U-value, but also require attention to the indoor climate
(CA EPBD 2010)43.
Cost-optimal methodology:
‘Member States shall calculate cost-optimal levels of minimum energy performance
requirements using the comparative methodology framework established in
accordance with paragraph 1 of the recast EPBD and relevant parameters, such as
climatic conditions and the practical accessibility of energy infrastructure, and
compare the results of this calculation with the minimum energy performance
requirements in force.’
The following articles of the recast EPBD are most important for the cost-optimal
methodology:
Article 3 ‘Adoption of a methodology for calculating the energy
performance of buildings’
Article 4 ‘Setting of minimum energy performance requirements’
Article 5 ‘Calculations of cost-optimal levels of minimum energy
performance requirements’
Article 6 ‘New buildings’
Article 7 ‘Existing buildings’
Article 8 ‘Technical building systems’
The cost optimal level is defined as “the energy performance level which leads to the
lowest cost during the estimated economic lifecycle” (CA EPBD 2012) (Article 2.14). It
is intended as a tool for Member States to see if they need to adjust their own
regulations with regard to the economic optimum. Cost-optimal framework is not
intended for comparisons between Member States. Member States must set national
minimum energy performance requirements to achieve these cost-optimal levels. Also
measures must be taken so that cost-optimal levels are achieved by new buildings or
buildings undergoing a major renovation, but also for replaced or retrofitted building
components that are part of the building envelope.
A framework for cost-optimal procedures is provided by the Commission Delegated
Regulation (EU) No 244/2012 accompanied by Guidelines (2012/C 115/01). The
Regulation is based on CEN-standards. Estimations on energy price developments on
the long-term are provided by the Commission. Member States must define reference
buildings (new, and existing, both residential as well as non-residential) and energy
efficiency measures that are assessed for those reference buildings. Both for the
reference buildings, as well as the reference buildings with the energy efficiency
measures applied, final and primary energy needs are assessed and costs are
calculated. Cost-optimal levels from a macroeconomic as well as from an investor’s
43 Implementing the Energy Performance of Buildings Directive (EPBD) – Featuring Country Reports 2010, ‘3.1.5 Processes for making recommendations’

Preparatory study on lighting systems
Month Year I 99
perspective are calculated, but MS can choose on which perspective they base their
energy performance requirements.
New buildings need to develop towards Nearly Zero-energy Buildings (NZEBs), but
also the existing housing stock needs to be improved. Therefore requirements for
existing buildings are also set in place, including building requirements as well as
component requirements or combinations of both. EPBD recast states that both kinds
of requirements need to be set. Requirements for components are easily
comprehensible and might be adopted more easily by people planning minor
renovation works. However they generally fail to take a holistic approach and are
often less ambitious than whole-building requirements for major renovations44.
The calculation of the energy performance of buildings has to be performed following a
common general framework given in Annex I of the recast EPBD. The energy
performance shall reflect the heating and cooling energy needs to maintain the
envisaged temperature conditions of the building and domestic hot water needs (CA
EPBD 2012). These heating and cooling energy needs relate to technical installations
and to the building envelope and its elements and the insulation materials used in
these building elements. Besides the main indicator (primary energy for most MS), U-
values, thermal transmittance coefficient or transmission losses are also be used as
indicators by some MS.
By the beginning of 2019 (new buildings occupied and owned by public authorities,
leading the way) and 2021 (all new buildings) have to be NZEB and are supposed to
also meet cost-optimal calculations. Therefore NZEB shall have a cost-optimal
combination of building envelope and building service systems. Cost-optimal
calculations from 2013 shall be reviewed once more before 2019/2021.
Impacts of EPBD on lighting systems:
The energy efficiency of lighting is explicitly addressed as a subject, mainly for the
non-residential sector, in the 2010 recast of the Energy Performance of Buildings
Directive (EPBD)45. Annex I point 3 stipulates that ‘The methodology shall be laid
down taking into consideration at least the following aspects: (e) built-in lighting
installation (mainly in the non-residential sector);’.Annex I point 4 stipulates that ‘The
positive influence of the following aspects shall, where relevant in the calculation, be
taken into account:.. (d) natural lighting.’.
The EPBD recast also explicitly formulates that ‘Member States should use, where
available and appropriate, harmonized instruments, in particular testing and
calculation methods and energy efficiency classes developed under measures
implementing Directive 2009/125/EC’.46
44 Implementing the Energy Performance of Buildings Directive (EPBD) – Featuring Country Reports 2012, ‘Energy performance requirements using the Cost-optimal methodology. Overview and Outcomes. 3.3 Requirements for existing buildings’ 45 Directive 2010/31/EU of the European Parliament and of the council fo 19 May 2010 on the energy performance of buildings. OJ L153, 18.6.2010 46 Recital (12) of the EPBD recast.

Preparatory study on lighting systems
Month Year I 100
Examples of country implementations of the EPBD concerning lighting:
Belgium:
In Belgium the EPBD is implemented at the regional level in regional decrees but the
method is harmonised between the regions47. The decrees limit the maximum primary
energy per year and per m² together with a set of other performance requirements to
be calculated (relative energy level, relative insulation level, etc.). Lighting energy
efficiency is taken into account in non-residential buildings48. Daylight control systems
and presence detectors are taken into account, but the method is considerably
simplified compared to EN 15193. Calculations are done on a monthly basis and do
take seasonal changes in daylight into account. For presence detection the highest
benefit is for manual on and automatic off implemented per area of a maximum of 30
m² (30 % saving). For daylight responsive dimming savings of up to 40 % are
possible depending on the area of luminaires that are controlled together. The highest
saving is for a control area of a maximum of 8 m². The method is simplified compared
to EN 15193 because orientations of windows and type of shading devices are not
taken into account. The calculation software to prove compliance can be downloaded
free49 .
In the Flemish region there are also specific system requirements50 for renovated non-
residential buildings.
They limit the maximum installed lighting power per m² (W/m²) depending on the
task area with corrections for presence detectors, daylight control and dimming. For
example the upper limit (W/m²) for an individual office with presence detectors and a
daylight responsive dimmer is 15/(0.7x0.8x0.9) or 29.8 W/m² or 15 W/m² without
automatic controls.
France (RT 2012):
The EPBD in France is regulated within local decrees51 and limits the maximum
primary energy per year and m² together with a combination of other minimum
performance requirements to be calculated. Calculation software to prove compliance
needs to be purchased. This software needs to be validated52 before it is
commercialised. The calculation method also takes daylight and presence detection
into account.
The RT 2012 also has a set of specific requirements for lighting installations, for
example:
Public spaces in residential buildings need presence detectors (art. 27);
Parking places need presence detectors (art. 28) (art. 40);
Sub metering for the lighting circuit (art. 23) (art. 31);
Light levels can be controlled in each room manual or automatic in
function of presence in non-residential buildings (art. 37);
A minimum requirement for windows area in residential buildings;
47 Implementing the Energy Performance of Buildings Directive (EPBD) - Featuring Country Reports 2012, ISBN 978-972-8646-28-8. 48http://www2.vlaanderen.be/economie/energiesparen/epb/doc/BijlageEPU20130719vergunningenNA2014.pdf 49 http://www.energiesparen.be/epb/prof/software 50 http://www.energiesparen.be/epb/eiseninstallaties 51 http://www.rt-batiment.fr/batiments-neufs/reglementation-thermique-2012/textes-de-references.html 52 http://www.rt-batiment.fr/batiments-neufs/reglementation-thermique-2012/logiciels-dapplication.html
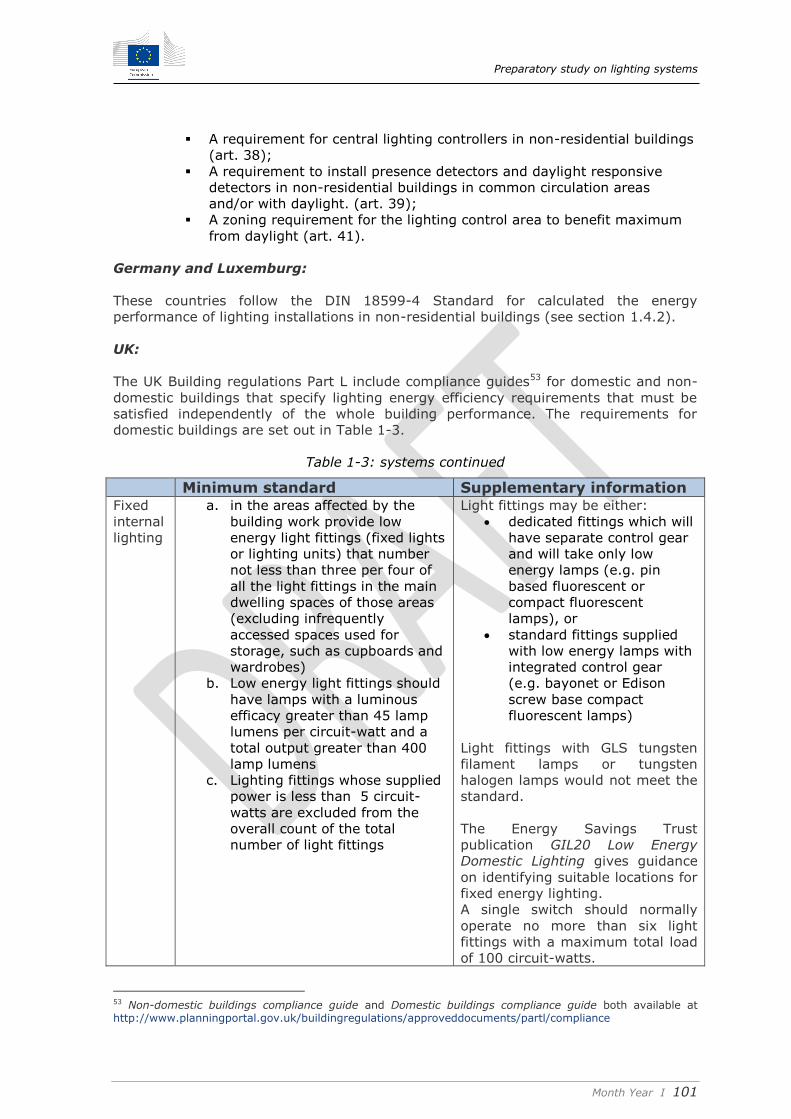
Preparatory study on lighting systems
Month Year I 101
A requirement for central lighting controllers in non-residential buildings
(art. 38);
A requirement to install presence detectors and daylight responsive
detectors in non-residential buildings in common circulation areas
and/or with daylight. (art. 39);
A zoning requirement for the lighting control area to benefit maximum
from daylight (art. 41).
Germany and Luxemburg:
These countries follow the DIN 18599-4 Standard for calculated the energy
performance of lighting installations in non-residential buildings (see section 1.4.2).
UK:
The UK Building regulations Part L include compliance guides53 for domestic and non-
domestic buildings that specify lighting energy efficiency requirements that must be
satisfied independently of the whole building performance. The requirements for
domestic buildings are set out in Table 1-3.
Table 1-3: systems continued
Minimum standard Supplementary information Fixed
internal
lighting
a. in the areas affected by the
building work provide low
energy light fittings (fixed lights
or lighting units) that number
not less than three per four of
all the light fittings in the main
dwelling spaces of those areas
(excluding infrequently
accessed spaces used for
storage, such as cupboards and
wardrobes)
b. Low energy light fittings should
have lamps with a luminous
efficacy greater than 45 lamp
lumens per circuit-watt and a
total output greater than 400
lamp lumens
c. Lighting fittings whose supplied
power is less than 5 circuit-
watts are excluded from the
overall count of the total
number of light fittings
Light fittings may be either:
dedicated fittings which will
have separate control gear
and will take only low
energy lamps (e.g. pin
based fluorescent or
compact fluorescent
lamps), or
standard fittings supplied
with low energy lamps with
integrated control gear
(e.g. bayonet or Edison
screw base compact
fluorescent lamps)
Light fittings with GLS tungsten
filament lamps or tungsten
halogen lamps would not meet the
standard.
The Energy Savings Trust
publication GIL20 Low Energy
Domestic Lighting gives guidance
on identifying suitable locations for
fixed energy lighting.
A single switch should normally
operate no more than six light
fittings with a maximum total load
of 100 circuit-watts.
53 Non-domestic buildings compliance guide and Domestic buildings compliance guide both available at http://www.planningportal.gov.uk/buildingregulations/approveddocuments/partl/compliance
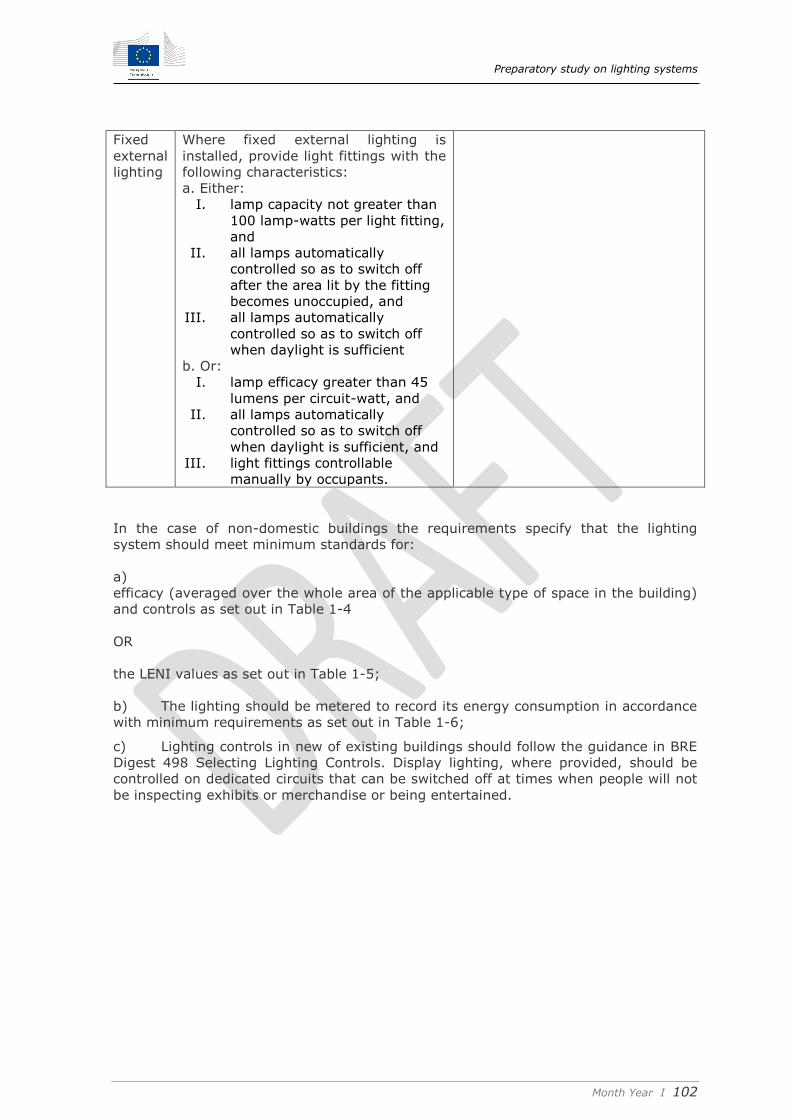
Preparatory study on lighting systems
Month Year I 102
Fixed
external
lighting
Where fixed external lighting is
installed, provide light fittings with the
following characteristics:
a. Either:
I. lamp capacity not greater than
100 lamp-watts per light fitting,
and
II. all lamps automatically
controlled so as to switch off
after the area lit by the fitting
becomes unoccupied, and
III. all lamps automatically
controlled so as to switch off
when daylight is sufficient
b. Or:
I. lamp efficacy greater than 45
lumens per circuit-watt, and
II. all lamps automatically
controlled so as to switch off
when daylight is sufficient, and
III. light fittings controllable
manually by occupants.
In the case of non-domestic buildings the requirements specify that the lighting
system should meet minimum standards for:
a)
efficacy (averaged over the whole area of the applicable type of space in the building)
and controls as set out in Table 1-4
OR
the LENI values as set out in Table 1-5;
b) The lighting should be metered to record its energy consumption in accordance
with minimum requirements as set out in Table 1-6;
c) Lighting controls in new of existing buildings should follow the guidance in BRE
Digest 498 Selecting Lighting Controls. Display lighting, where provided, should be
controlled on dedicated circuits that can be switched off at times when people will not
be inspecting exhibits or merchandise or being entertained.
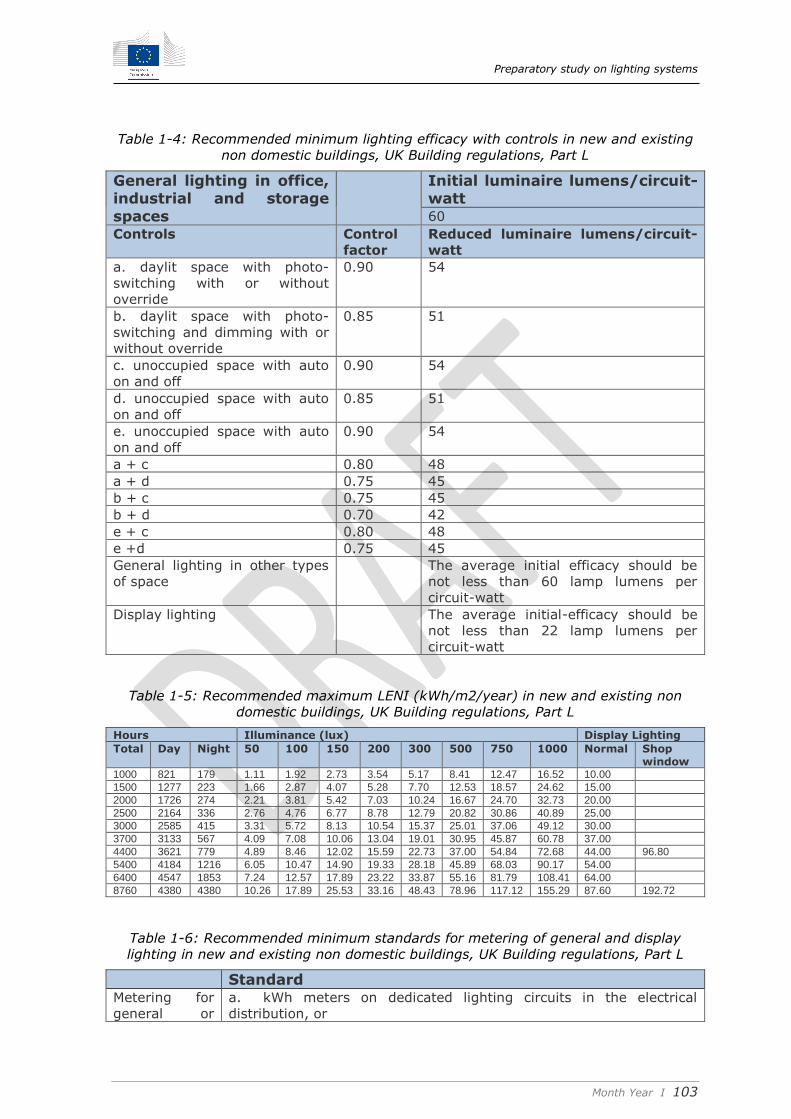
Preparatory study on lighting systems
Month Year I 103
Table 1-4: Recommended minimum lighting efficacy with controls in new and existing
non domestic buildings, UK Building regulations, Part L
General lighting in office, industrial and storage
spaces
Initial luminaire lumens/circuit-watt 60
Controls Control
factor
Reduced luminaire lumens/circuit-
watt
a. daylit space with photo-
switching with or without
override
0.90 54
b. daylit space with photo-
switching and dimming with or
without override
0.85 51
c. unoccupied space with auto
on and off
0.90 54
d. unoccupied space with auto
on and off
0.85 51
e. unoccupied space with auto
on and off
0.90 54
a + c 0.80 48
a + d 0.75 45
b + c 0.75 45
b + d 0.70 42
e + c 0.80 48
e +d 0.75 45
General lighting in other types
of space
The average initial efficacy should be
not less than 60 lamp lumens per
circuit-watt
Display lighting The average initial-efficacy should be
not less than 22 lamp lumens per
circuit-watt
Table 1-5: Recommended maximum LENI (kWh/m2/year) in new and existing non
domestic buildings, UK Building regulations, Part L
Hours Illuminance (lux) Display Lighting
Total Day Night 50 100 150 200 300 500 750 1000 Normal Shop window
1000 821 179 1.11 1.92 2.73 3.54 5.17 8.41 12.47 16.52 10.00
1500 1277 223 1.66 2.87 4.07 5.28 7.70 12.53 18.57 24.62 15.00
2000 1726 274 2.21 3.81 5.42 7.03 10.24 16.67 24.70 32.73 20.00
2500 2164 336 2.76 4.76 6.77 8.78 12.79 20.82 30.86 40.89 25.00
3000 2585 415 3.31 5.72 8.13 10.54 15.37 25.01 37.06 49.12 30.00
3700 3133 567 4.09 7.08 10.06 13.04 19.01 30.95 45.87 60.78 37.00
4400 3621 779 4.89 8.46 12.02 15.59 22.73 37.00 54.84 72.68 44.00 96.80
5400 4184 1216 6.05 10.47 14.90 19.33 28.18 45.89 68.03 90.17 54.00
6400 4547 1853 7.24 12.57 17.89 23.22 33.87 55.16 81.79 108.41 64.00
8760 4380 4380 10.26 17.89 25.53 33.16 48.43 78.96 117.12 155.29 87.60 192.72
Table 1-6: Recommended minimum standards for metering of general and display
lighting in new and existing non domestic buildings, UK Building regulations, Part L
Standard Metering for
general or
a. kWh meters on dedicated lighting circuits in the electrical
distribution, or

Preparatory study on lighting systems
Month Year I 104
display lighting b. local power meter coupled to or integrated in the lighting
controllers of a lighting or building management system, or
c. a lighting management system that can calculate the consumed
energy and make this information available to a building
management system or in an exportable file format. (This could
involve logging the hours run and the dimming level, and relating
this to the installed load.)
1.5.1.7 Energy Efficiency Directive (EED)
Directive 2012/27/EU of the European Parliament and of the Council
amending Directives 2009/125/EC and 2010/30/EU
Directive 2012/27/EU amends Directive 2009/125/EC on Ecodesign requirements for
energy-related products and Directive 2010/30/EU on energy efficiency labelling of
energy-related products, and repeals Directive 2004/8/EC on the promotion of
cogeneration and Directive 2006/32/EC on energy end-use efficiency and energy
services.
The Directive states, amongst other aspects, that Member States should establish
long-term strategies to increase the energy efficiency renovation rate of the building
stock and that public bodies’ buildings should have an exemplary role. Also, the
Directive states that by 30 April 2014, and every three years thereafter, Member
States shall submit National Energy Efficiency Actions Plans (NEEAPs) that cover
significant energy efficiency improvement measures and specify expected and/or
achieved energy savings.
Member States had to transpose most of the Directive's provisions into national
legislation by 5 June 2014.
The Directive establishes a common framework for promoting energy efficiency in the
Union to ensure that the 20% energy efficiency target in 2020 (i.e. reaching a 2020
energy consumption of no more than 1483 Mtoe of primary energy consumption and
no more than 1086 Mtoe of final energy consumption) is met and to paves the way for
further energy efficiency afterwards.
The Directive provides for the establishment of indicative national energy efficiency
targets for 2020 and requires the Commission to assess in 2014 whether the Union
can achieve its target of 20% energy efficiency in 2020 and to submit its assessment
to the European Parliament and the Council, accompanied, if necessary, by proposals
for further measures.
The Energy Efficiency Directive lays down rules designed to remove barriers and
overcome some of the market failures that impede efficiency in the supply and use of
energy. For end-use sectors, the Directive focuses on measures that lay down
requirements on the public sector, both as regards renovating the current building
stock and applying high energy efficiency standards to the purchase of buildings,
products and services. The Directive requires Member States to reach certain levels of
final energy savings by using national energy efficiency obligation schemes or
alternative policy measures. It requires regular mandatory energy audits for large
companies and lays down a series of requirements regarding metering and billing.
For the energy supply sector, the Directive requires Member States to adopt a national
heating and cooling assessment to develop the potential for high-efficiency generation
and efficient district heating and cooling, and to ensure that spatial planning

Preparatory study on lighting systems
Month Year I 105
regulations are in line with these plans. Member States must adopt authorisation
criteria that ensure that a cost-benefit analysis of the possibilities for cogeneration for
all new and substantially refurbished electricity generation installations and industrial
installations above a certain threshold is carried out and the results are taken into
account. Member States should however be able to lay down conditions for exemption
from this obligation where certain conditions are met. The Directive sets requirements
on priority/guaranteed access to the grid, priority dispatch of electricity from high
efficiency cogeneration and the connection of new industrial plants producing waste
heat to district or cooling networks, and measures to encourage the use of demand
side resources.
Other measures include requirements for national energy regulatory authorities to
take due regard of energy efficiency, information and awareness-raising actions,
requirements concerning the availability of certification schemes, actions to promote
the development of energy services, and an obligation for Member States to remove
obstacles to energy efficiency, including split incentives between the owner and tenant
of a building or among building owners.
Impacts of the Energy Efficiency Directive on lighting systems
The Energy Efficiency Directive (EED) requires Member States to set up National
Energy Efficiency Action Plans. An improved energy efficiency of lighting could be
integrated in such NEEAPs.
1.5.1.8 RoHS 2 – Directive on the Restrictions of Hazardous Substances in
Electrical and Electronic Equipment
Directive 2011/65/EU of the European Parliament and of the Council
Directive 2002/95/EC of the European Parliament and of the Council (recast) The RoHS Directive restricts the use of Lead (Pb), Mercury (Hg), Cadmium (Cd),
Hexavalent chromium (Cr6+), Polybrominated biphenyls (PBB) and Polybrominated
diphenyl ether (PBDE) in manufacturing of certain electrical and electronic equipment
sold in the European Union.
The new RoHS Directive, also known as RoHS 2, introduces new CE marking and
declaration of conformity requirements. Before placing an EEE on the market, a
manufacturer / importer / distributor must ensure that the appropriate conformity
assessment procedure has been implemented in line with module A of Annex II to
Decision No 768/2008/EC and affix the CE marking on the finished product. Since
January 2013, electronic products bearing the CE Mark must meet the requirements of
this new directive.
The new RoHS Directive scope has been extended to all electrical and electronic
equipment (EEE), including medical devices, monitoring and control instruments, and
EEE products not covered under the previous ten categories (the eleventh equipment
category) unless specifically excluded. Impacts of RoHS 2 on lighting systems
It is important for components of the system, such as lamps and controls, but not
directly relevant for the system itself.
1.5.1.9 Ecolabel Regulation
Regulation (EC) No 66/2010

Preparatory study on lighting systems
Month Year I 106
The EU Ecolabel helps consumers to identify products and services that have a
reduced environmental impact throughout their life cycle, from the extraction of raw
material through to production, use and disposal. Recognised throughout Europe, the
EU Ecolabel is a voluntary label promoting environmental excellence which can be
trusted.
Impacts of Ecolabel on lighting systems
Revised EU Ecolabel criteria for light sources were introduced in 201154. For energy
efficiency they require a minimum of 10% better than the ‘A’ class (as defined in the
lamp energy label of Directive 98/11/EC) and require minimum lumen maintenance.
They set minimum performance requirements for the number of switches, colour
rendering and colour consistency. Environmental criteria relate to hazardous
substances (e.g. mercury), substances regulated through REACH, marking of plastic
parts and recycling of packaging.
1.5.1.10 REACH
Regulation (EC) No 1907/2006
The REACH Regulation came into force on 1 June 2007 and deals with the
Registration, Evaluation, Authorisation and Restriction of Chemical substances. It
provides an improved and streamlined legislative framework for chemicals in the EU,
with the aim of improving protection of human health and the environment and
enhancing competitiveness of the chemicals industry in Europe. REACH places the
responsibility for assessing and managing the risks posed by chemicals and providing
safety information to users in industry instead of public authorities and promotes
competition across the internal market and innovation.
Manufactures are required to register the details of the properties of their chemical
substances in a central database, which is run by the European Chemicals Agency in
Helsinki. The Regulation also requires the most dangerous chemicals to be
progressively replaced as suitable alternatives are developed.
Impacts of REACH on lighting systems
Environmental criteria for Ecolabel relate to hazardous substances (e.g. mercury),
substances regulated through REACH, marking of plastic parts and recycling of
packaging.
1.5.1.11 Green Public Procurement (GPP)
The EU Ecolabel and Green Public Procurement (GPP) initiatives are policy instruments
designed to encourage the production and use of more environmentally friendly
products and services through the certification and specification of products or
services which have a reduced environmental footprint. They form part of the
European Commission’s action plan on Sustainable Consumption and Production and
Sustainable Industrial Policy adopted on 16th July 2008.
Green public procurement (GPP) is defined as “a process whereby public authorities
seek to procure goods, services and works with a reduced environmental impact
throughout their life cycle when compared to goods, services and works with the same
primary function that would otherwise be procured”55.
54 Commission Decision of 6 June 2011 on establishing the ecological criteria for the award of the EU Ecolabel for light sources, (2011/221/EU). OJ L148/13, 7.6.2011. 55 COM (2008) 400 final. Public procurement for a better environment: http://eur-lex.europa.eu/LexUriServ/LexUriServ.do?uri=COM:2008:0400:FIN:EN:PDF

Preparatory study on lighting systems
Month Year I 107
Public authorities are major consumers in Europe: they spend approximately €2 trillion
annually, equivalent to some 19% of the EU’s gross domestic product56. By using their
purchasing power to choose goods and services with lower impacts on the
environment, they can make an important contribution to sustainable consumption
and production. Moreover, green purchasing also influences the market as in
numerous cases public authorities have a large and dominant market share. By
promoting and using GPP, public authorities can provide industry with real incentives
for developing green technologies and products.
The Green Public Procurement's legislative document is the Communication on
''Public procurement for a better environment'' COM (2008) 400 accompanied
by the European GPP training toolkit. The stated GPP target in the renewed
Sustainable Development Strategy was that by the year 2010, the average level of
GPP should have been the same as the 2006 level of the best performing Member
States.
The approach under GPP is to propose two types of criteria for each sector covered:
The core criteria, which are those suitable for use by any contracting authority
across the Member States and address the key environmental impacts. They are
designed to be used with minimum additional verification effort or cost increases.
The comprehensive criteria, which are for those who wish to purchase the best
environmental friendly products available on the market. These may require
additional verification effort or a slight increase in cost compared to other products
with the same functionality.
Just as the Ecolabel is a voluntary scheme, which means that producers, importers
and retailers can choose to apply for the label for their products; GPP is also a
voluntary instrument, which means that Member States and public authorities can
determine the extent to which they implement it.
In June 2010, a new procedure for EU GPP criteria development was put in place
in order to make the criteria development process more participatory and enhance
synergies among different product-related policy instruments, for example EU GPP and
EU Ecolabel57. The Procedure for the development and revision of EU GPP criteria is
explained on the GPP website:
http://ec.europa.eu/environment/gpp/gpp_criteria_procedure.htm
Both Ecolabelling and GPP criteria would be revised based on the outcomes of the Eco-
lighting project58, after been developed and agreed upon by experts, NGOs and
stakeholders to create a credible and reliable way to make environmentally
responsible choices. These criteria shall take into consideration the net balance
between the environmental benefits and burdens; they shall be based on the most
significant environmental impacts which are expressed as far as possible via technical
key environmental performance indicators.
For several product groups common GPP criteria59 are already developed in the
framework of the training toolkit on GPP or are in the process of being developed (cfr
work plan for 2015-2016)60.
At present the following lighting equipment is covered:
56 http://ec.europa.eu/environment/gpp/what_en.htm 57 http://ec.europa.eu/environment/gpp/gpp_criteria_process.htm 58 http://www.eco-lighting-project.eu/home 59 http://ec.europa.eu/environment/gpp/eu_gpp_criteria_en.htm 60 http://ec.europa.eu/environment/gpp/gpp_criteria_wp.htm

Preparatory study on lighting systems
Month Year I 108
Indoor Lighting
Covering “lamps, luminaires (light fittings) and lighting controls installed inside
buildings” with stated exceptions for specialist lighting.
Street Lighting and Traffic Signals
Covering “Fixed lighting installation intended to provide good visibility to users of
outdoor public traffic areas during the hours of darkness to support traffic safety,
traffic flow and public security”.
The relevant key environmental impacts identified in the GPP criteria for indoor
lighting are:
energy consumption
polluting processes during manufacture
hazardous constituents
waste generation
Impacts of GPP on lighting systems
New EU Green Public Procurement (GPP) criteria for indoor lighting were introduced in
201261. They relate not only to minimum luminous efficacy of the light sources (in
lm/W), but also to lighting levels (W/m²/100 lux), lighting controls, etc
A revision of GPP criteria for street lighting is planned in 2016-2017.
1.5.1.12 Construction products (CPD/CPR) Directive
Some lighting system related products, e.g. windows, are building products and as
such are covered by the Regulation 305/2011/EC (Construction Products Regulation -
CPR), replacing Directive 89/106/EEC (Construction Products Directive - CPD). The
regulation is embedded in the goal of creating a single market ("Article 95") for
construction products through the use of CE Marking. It outlines basic requirements
for construction works (as the sum of its components) that are the basis for the
development of the standardization mandates and technical specifications i.e.
harmonized product standards and European Assessment Documents (EADs).
While the CPR regulates the processes and the roles of the parties involved for all
products alike, the necessary specific characteristics of each product are taken
account of in the specific standard or EAD.
The basic idea is to harmonize the way the performance of a construction product is
determined and declared in levels or classes while each member state may have
individual requirements regarding the required minimum level or class for a given use.
The essential requirements for construction works are mechanical resistance and
stability, safety in case of fire, hygiene, health and environment, safety and
accessibility in use, protection against noise, energy economy and heat retention and
sustainable use of natural resources.
The Regulation mandates standardisation organisations such as CEN to develop
standards in consultation with industry (CEN TC 350 and CEN TC 351). A list of these
standards can be found on the European Commission’s website62. Where harmonised
standards are not available, existing national standards apply.
61 http://ec.europa.eu/environment/gpp/pdf/criteria/indoor_lighting.pdf 62
http://ec.europa.eu/enterprise/newapproach/standardization/harmstds/reflist/constru
c.html

Preparatory study on lighting systems
Month Year I 109
In comparison to other products, the cross-border trade on construction products
within the Internal Market has traditionally not been as commonplace. National
markets often have obstacles preventing foreign products from being efficiently
commercialized. Therefore, as one of the first efforts of such Community-wide
harmonisation, the Council adopted in 1988 the Construction Products Directive (the
CPD), based on Article 95, referring to the single market. The replacement of Council
Directive 89/106/EEC by the Regulation (CPR) serves the aim to better define the
objectives of Community legislation and make its implementation easier63.
The CPR now includes in Annex I three basic requirements for construction works that
specifically relate to ecological matters:
3) Hygiene, health and Environment
6) Energy Economy and heat retention
7) Sustainable use of natural resources
For the latter, it states in detail: "The construction works must be designed, built and
demolished in such a way that the use of natural resources is sustainable and ensure
the following:
a) Recyclability of the construction works their materials and parts after demolition;
b) Durability of the construction works;
c) Use of environmentally compatible raw and secondary materials in the construction
works.”
Yet is must be kept in mind, that the CPR is – in spite of its name - a regulation which
is focussed on the free trade of building products – as the European Commission has
no competencies regarding building safety, which is within the competence of the
member states.
As a result of this, the abovementioned Annex I “shall constitute the basis for the
preparation of standardization mandates and harmonized technical specifications”.
The particular nature of construction products, that are predominantly intended to be
used by professionals (constructors, architects, civil engineers), has also brought
along a need to differentiate the regulatory structure and the role of standards from
the general horizontal rules of the Internal Market Package for Goods. Also the
meaning of the CE marking in this context is specific: it attests that the information
accompanying the product has been attained in accordance with the methods specified
in the standards and that the manufacturer takes responsibility that the product has
the declared performance.
The objective of the CPR is thus not to define the safety of construction products, but
to ensure that reliable information is presented in relation to their performance. This is
achieved by providing, mainly in standards, a common technical language, to be used
not only by manufacturers, but also by public authorities when defining their
requirements on construction works, directly or indirectly influencing the demands
placed on the products to be used in them.
Finally it has to be noted, that according to CPR Article 3 it could in principle be
possible, that the European Commission sets minimum performance requirements for
construction products.
63 http://ec.europa.eu/enterprise/construction/index_en.htm
Preparatory study on lighting systems
Month Year I 110
“Where appropriate, the Commission shall also determine, by means of delegated acts
in accordance with Article 60, the threshold levels for the performance in relation to
the essential characteristics to be declared”. 64
Impacts of GPP on lighting systems
So far, no direct impact on lighting systems is expected.
1.5.2 Member State legislation and other initiatives
1.5.2.1 Member state implementation of EPBD
Member States have implemented the EPBD into their local legislation. For examples
and a discussion see section 1.5.1.6.
1.5.2.2 Examples of Street lighting design regulation
Royal Decree 1890/2008 in Spain
The energy efficiency regulations in street lighting installations, approved by Royal
Decree 1890/2008, of 14th November, aims at improving the energy efficiency and
saving, and therefore, decreasing greenhouse gas emissions; it provides the necessary
feasibility conditions for both car drivers and pedestrians to have their security
guaranteed as well as the one of the goods in the vicinity; it provides city life with a
pleasant visual night time atmosphere; and curbs nightlight brightness or light
pollution, reducing intrusive or unpleasant light.
Guideline for Public Lighting ‘ROVL 2011’ in the Netherlands
This guideline assists in selecting the road classes according to EN 13201-2 taking
traffic density and possibilities for dimming into account.
Italian standard UNI 11431 Applicazione in ambito stradale dei dispositive
regolatori di flusso luminoso
This standard assists in the application of dimming in public lighting.
Italian decree of the 23th December 2013
This decree on public lighting, including sports lighting, refers to the European
regulations and gives guidance for design and tendering.
1.5.2.3 Examples of local luminaire labelling initiatives
Minergie luminaire label65 in Switzerland
Minergie is a luminaire label for the Suisse market, it takes into account luminaire
efficiency (LER) and upper limits for an Energy Efficiency Index (EEI) in line with the
formulas and requirements of the EU label Regulation (874/2012).
‘Milieukoopwijzer’ in Belgium
Milieukoopwijzer66 is a database that contains luminaire labels and also takes into
account luminaire efficiency. The highest level requires also a dimming interface.
64 REGULATION (EU) No 305/2011, Article 3 65 http://www.minergie.ch/leuchten.html 66 http://www.milieukoopwijzer.be/criteria/armaturen

Preparatory study on lighting systems
Month Year I 111
1.5.2.4 Sustainable building certification schemes that include lighting
BREEAM certification
Besides the EPBD, there exist also other methods to evaluate the sustainability of
lighting. One of the most commonly applied is the BREEAM certification scheme. BRE,
an independent British organization that originated from the former governmental
laboratory ‘Building Research Establishment’, has developed this methodology for
certification. BREEAM (Building Research Establishment's Environmental Assessment
Method) is the leading and most applied method worldwide to measure the
environmental performance of buildings, including lighting.
TEK Tool
In Germany an open freeware tool called ‘TEK tool67’ is available to analyse and
decompose the energy use of non-domestic buildings. The building energy balance is
decomposed into subsystems such as ventilation, heating, cooling, auxiliary energy
and lighting. Lighting values are expressed in units of kWh/(y.m²) and target values
for very high up to very low consumption are given (Figure 1-21) for various types of
building applications, e.g. open plan office, cafeteria, class room, etc.
Figure 1-21: Reference values in kWh/y.m² for lighting in various applications (source:
IWU TEK Tool68).
LEED (Leadership in Energy and Environmental Design)
LEED69 is a sustainability certification for building projects. A building is assigned a
sustainability score based on carefully established parameters. LEED was created in
2000 as an initiative of the US Green Building Council (USGBC). LEED factors in some
67 http://www.enob.info/de/software-und-tools/projekt/details/tek-teilenergiekennwerte-fuer-nichtwohngebaeude-im-bestand/ 68 IWU (2014): ‘Teilenergiekennwerte Neue Wege in der Energieanalyse von Nichtwohngebäuden im Bestand’, ISBN: 978-3-941140-38-7 69 http://www.usgbc.org/leed

Preparatory study on lighting systems
Month Year I 112
50 parameters within nine categories. The process runs as follows: the client registers
with the USGBC and this documentation leads to a provisional rating. After completion
of the building, USGBC checks whether reality corresponds with the design. LEED
certification does not come free of charge. LEED takes into account all aspects of a
construction project including lighting.
1.5.3 Examples of similar legislation outside Europe
For USA, see section 1.4.3.
1.5.3.1 Australia
Australia specifies minimum lighting performance requirements in their buildings codes
for new and existing as well as residential and non-residential buildings. Under these
lighting power density limits are set as follows.
For non-residential buildings maximum illumination power density is prescribed by
space type (Table J6.2a) with adjustments for control devices (Table J6.2b)
For residential buildings multi-occupancy (class 2): Maximum illumination power
density is prescribed by space type (Table J6.2a) with adjustments for control devices
(Table J6.2b), in subsequent Table 1-7.
Table 1-7: List of tables extracted from Australian Building codes

Preparatory study on lighting systems
Month Year I 113

Preparatory study on lighting systems
Month Year I 114

Preparatory study on lighting systems
Month Year I 115
1.5.3.2 Canada
Canada has a model National Energy Code for Buildings (NECB) that has some
similarities with the ASHRAE 90.1 model building code used in the USA. The most
recent version of the NECB was issued in 2011.
The lighting requirements do not apply to lighting within dwelling units.
Options for Compliance
Aside from alternative solutions that may always be proposed for compliance with nati
onal model codes, the NECB provides three approaches to compliance:
Prescriptive Path – “simple” prescriptive requirements
Trade‐Offs –
allowed between related building elements (e.g., higher roof insulation levels
may be traded off against lower wall insulation levels)
Performance Compliance Paths – full‐building energy‐use modeling
NECB Part 4 – Lighting
Lighting Power Limits
Limits are specified in terms of maximum lighting power. Lower levels are more
stringent.
Interior and Exterior Lighting Power [Subsections 4.2.1. and 4.2.3.]
For interior lighting, not within dwelling units, two approaches are provided:
building area method [Article 4.2.1.5.]
the space‐by‐space method [Article 4.2.1.6.].
If 10% or more of the gross lighted area of the building can be classified as a different
building type (e.g. parking garage), the space‐by‐space method must be used. The
gross lighted area would not include the area within dwelling units.
For the space‐by‐space method, the power allowances in individual spaces may be
exceeded provided the total installed power does not exceed the total allowed for all of
the spaces.

Preparatory study on lighting systems
Month Year I 116
A base allowance is specified for exterior lighting.
Lighting Controls [Subsections 4.2.2. and 4.2.4.]
Automatic time‐of‐day, occupant sensors or occupant signals must be installed for
most interior spaces other than dwelling units. Numbers, characteristics and locations
are specified. Additional controls are required where spaces have significant day‐lighted area.
Automatic time‐of‐day, occupant sensors or occupant signals must be installed for
most interior spaces other than dwelling units. Numbers, characteristics and locations
are specified. Additional controls are required where spaces have significant day‐lighted area.
Automatic time‐of‐day, photo-sensors or similar controls are required for exterior
lighting.
Lighting Trade‐Offs [Sections 4.3.]
In addition to consideration of lighting energy allowances, the calculations account for
annual day and night operating times, daylight harvesting, occupancy and personal
controls.
Comparison with ASHRAE 90.1 2010.
While there are many similarities between the NECB 2011 and ASHRAE 90.1 2010
there are also differences in the way each code/standard describes building types or
technologies. The baselines for different parts and technologies of the code/standard
will sometimes differ throughout the documents themselves. This comparison
addresses only the Prescriptive Paths in each document.
The following are the major differences in approach between the NECB 2011 and
ASHRAE 90.1 as they apply to lighting systems:
The NECB applies to new construction and additions, ASHRAE requirements
also apply to alterations to existing buildings.
The NECB has a trade-off route within lighting, HVAC and service water heating
(e.g. day lighting controls), ASHRAE does not.
1.5.3.3 China
In China the legally enforceable, mandatory standard for visual comfort (300 lux) and
power density (11 watts/m2) are defined in GB5034-2004, Standard for lighting design
of buildings.
1.5.3.4 India
The Energy Conservation Building Code of 2007 developed by the Ministry of Power
includes specifications for both indoor and outdoor lighting energy performance. The
code applies to commercial buildings and is voluntary.
1.5.3.5 Switzerland
The Swiss MINERGIE building code is a model code for all the Swiss Cantons. The
lighting requirements are specified in Norm SIA 380/4:2009 and apply to new
construction and renovation of existing buildings for non-residential buildings. Table
1-8 specifies the maximum permitted LENI (EN 15193) and LPD values for each space
type where tli is the assumed hours of lighting operation per annum in the LENI
calculation (EN 15193).
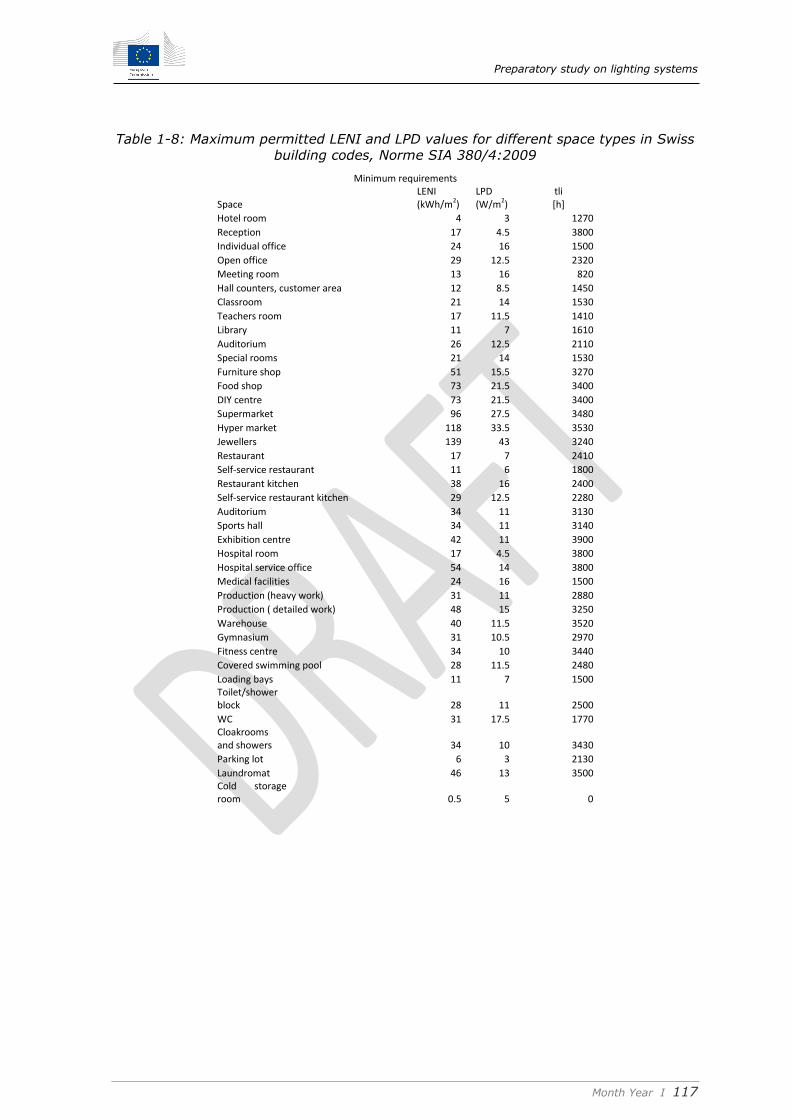
Preparatory study on lighting systems
Month Year I 117
Table 1-8: Maximum permitted LENI and LPD values for different space types in Swiss
building codes, Norme SIA 380/4:2009
Minimum requirements
Space LENI (kWh/m2)
LPD (W/m2)
tli [h]
Hotel room 4 3 1270
Reception 17 4.5 3800
Individual office 24 16 1500
Open office 29 12.5 2320
Meeting room 13 16 820
Hall counters, customer area 12 8.5 1450
Classroom 21 14 1530
Teachers room 17 11.5 1410
Library 11 7 1610
Auditorium 26 12.5 2110
Special rooms 21 14 1530
Furniture shop 51 15.5 3270
Food shop 73 21.5 3400
DIY centre 73 21.5 3400
Supermarket 96 27.5 3480
Hyper market 118 33.5 3530
Jewellers 139 43 3240
Restaurant 17 7 2410
Self-service restaurant 11 6 1800
Restaurant kitchen 38 16 2400
Self-service restaurant kitchen 29 12.5 2280
Auditorium 34 11 3130
Sports hall 34 11 3140
Exhibition centre 42 11 3900
Hospital room 17 4.5 3800
Hospital service office 54 14 3800
Medical facilities 24 16 1500
Production (heavy work) 31 11 2880
Production ( detailed work) 48 15 3250
Warehouse 40 11.5 3520
Gymnasium 31 10.5 2970
Fitness centre 34 10 3440
Covered swimming pool 28 11.5 2480
Loading bays 11 7 1500 Toilet/shower block 28 11 2500
WC 31 17.5 1770 Cloakrooms and showers 34 10 3430
Parking lot 6 3 2130
Laundromat 46 13 3500 Cold storage room 0.5 5 0

Preparatory study on lighting systems
Month Year I 118
1.6 Quick Scan
Objective:
Important note: The findings presented in the discussion below are indicative
and made only for the purpose on an initial screening exercise. They will thus
be updated in the course of conducting the later Tasks. Therefore this section
is mainly printed in grey and will not be updated in revisions of this Task 0.
According to the MEErP: “Task 0 is an optional task for the case of large or
inhomogeneous product groups, where it is recommended to carry out a first product
screening, considering the environmental impact and potential for improvement of the
products as referred to in Article 15 of the Ecodesign Directive. The objective is to re-
group or narrow the product scope, as appropriate from an ecodesign point of view,
for the subsequent analysis in Tasks 1-7.”
This preparatory study on lighting systems follows from the request for services
ENER/C3/2012-418 LOT1/05. The Quickscan is an initial screening, based on available
information from previous studies and other sources. The objective is to re-group or
narrow the product scope, as appropriate from an Ecodesign point of view, for the
subsequent analysis. This is done by gathering initial data for the study tasks in order
to allow scrutiny against the Article 15 criteria of the Ecodesign Directive
2009/125/EC. Accordingly, the structure of the Quickscan is based on the three major
criteria in Article 15, paragraph 2, as explained in section 3.1.1.
According to paragraph 2 of Article 15 of Ecodesign Directive 2009/125/EC energy-
related products such as lighting systems have to:
1. represent a significant volume of sales and trade, indicatively more than 200
000 units a year within the Community to the most recently available figures;
2. have a significant environmental impact within the Community – as specified in
the Community strategic priorities as set out in Decision No 1600/2002/EC –
considering the quantities placed on the market and/or put into service;
3. present significant potential for improvement in terms of its environmental
impact without entailing excessive costs, taking into account in particular:
i. the absence of other relevant Community legislation or failure of the
market forces to address the issue properly; and
ii. a wide disparity in the environmental performance of products available
on the market with equivalent functionality.
These three criteria will be addressed in the Quickscan as guiding principles to
determine the potential of possible Ecodesign, energy labelling, and/or energy
performance of buildings requirements.
Additionally, the provisions of the Ecodesign Directive 2009/125/EC require
consideration of the (entire) life cycle of the product and all its significant
environmental aspects (including energy efficiency during the use phase of the
product) (article 15, paragraph 4, item (a)). Furthermore, implementing measures
shall meet the following criteria (article 15, paragraph 5):
a) there shall be no significant negative impact on the functionality of the product,
from the perspective of the user;
b) health, safety and the environment shall not be adversely affected;
Preparatory study on lighting systems
Month Year I 119
c) there shall be no significant negative impact on consumers in particular as
regards the affordability and the life cycle cost of the product;
d) there shall be no significant negative impact on industry‘s competitiveness;
e) in principle, the setting of an Ecodesign requirement shall not have the
consequence of imposing proprietary technology on manufacturers; and,
f) no excessive administrative burden shall be imposed on manufacturers.
This chapter gives an overview of the Quickscan to provide an insight into the
economic and environmental importance of lighting systems and to define potential
environmental improvement actions. The results from the Quickscan will identify the
most relevant issues for determining whether lighting systems should be included
under the “priority list” of products covered by the Second Working Plan on Ecodesign.
So far ‘Lighting systems’ are not exactly defined as ‘traded products’ for
which a commonly agreed ‘unit sold’ and product code is available in official
product sales statistics such as PRODCOM. Therefore checking significance
compared to 200 000 units sold is more complex than for some product
groups. Nonetheless it seems clear that considerably more than 200000
lighting systems are installed each year across the EU.
In addition, the potential for energy savings are comfortably above 2 TWh
per year and hence can be considered to be significant within the terms
applied for the Ecodesign Directive.
1.6.1 Data sources used
The data sources used are:
Commission Staff Working Document (3009/324): ‘Accompanying
document to the Commission Regulation implementing Directive
2005/32/EC of the European Parliament and of the Council with regard
to ecodesign requirements for fluorescent lamps without integrated
ballast, for high intensity discharge lamps, and for ballasts and
luminaires able to operate such lamps, and repealing Directive
2000/55/EC of the European Parliament and of the Council’ full impact
assessment.
Commission Staff Working Document (3009/327): ‘Commission Staff
Working Document (3009/324): ‘Accompanying document to the
Commission Regulation implementing Directive 2005/32/EC of the
European Parliament and of the Council with regard to ecodesign
requirements for fluorescent lamps without integrated ballast, for high
intensity discharge lamps, and for ballasts and luminaires able to
operate such lamps, and repealing Directive 2000/55/EC of the
European Parliament and of the Council’ full impact assessment.
Commission Staff Working Document: Annex 1 working document on
possible measures targeting the energy efficiency of lighting in the
tertiary sector Presented by the Directorate General for Energy for
consultation of the Consultation Forum running from 6 July to 15
September 2010.
Lighting preparatory studies on lot 8, lot 9, lot 19
(www.eup4light.net). Road network statistics from Eurostat (length of roads).
Building stock statistics from Buildings Performance Institute Europe
(BPIE) (surface areas per sector).

Preparatory study on lighting systems
Month Year I 120
Waide et al., 'The scope for energy and CO2 savings in the EU through
the use of building automation technology', Final report August 2013.
(Note, this processed BPIE building stock data).
Typical lighting operational hours and power density (W/m²) per
sector/building type according to standard EN 15193.
Outdoor lighting estimate for non-public lighting as found in literature70.
Building construction and renovation statistics from literature71.
VHK (2011), Study on Amended Working Plan under the Ecodesign
Directive: Final Report, commissioned by the European Commission,
version 16 December 2011. This study identifies traffic lights and
lighting controls.
VHK (2013), Omnibus Review Study on Cold Appliances, Washing
Machines, Dishwashers, Washer-Driers, Lighting, Set-top Boxes and
Pumps, draft interim report (available through www.eup-network.de).
1.6.2 Lighting Installation stock data rough estimate
Important note: These are indicative for a first screening only and will be
updated in later Tasks. Therefore this section is mainly printed grey and will
not be updated in revisions of this Task 0.
In the literature there is data available concerning the size of the existing building
stock72 which can be combined with indicative operational hours of lighting and power
density in typical sectors; this results in an estimate to allocate the EU27 power
consumption per sector (Table 1-9).
Table 1-9: Relative indoor lighting power consumption per sector
70 http://www.milieurapport.be/Upload/main/AG2007_2%207c_9%20met%20voorblad.pdf 71 Ecofys (2011): ‘Panorama of the European non-residential construction sector’-Final report 72 Waide et al., 'The scope for energy and CO2 savings in the EU through the use of building automation technology', Final report August 2013

Preparatory study on lighting systems
Month Year I 121
Lot 9 contained an estimate of the energy consumption of street lighting in the EU.
Little data is available on other outdoor applications, however, an estimate of the
share of outdoor lighting energy use by application derived according to the
literature73 can be found in Table 1-10.
Table 1-10: Estimated share in outdoor lighting power consumption per sector
1.6.3 Reference Total energy consumption of the lighting stock in 2007
(rough estimate) (TWh)
Savings are relative to the energy consumption of the lighting stock, therefore this
section contains a rough estimate of the lighting stock in 2020, see Table 1-11.
The upper part of Table 1-11 subdivides the data according to the regulation from
which they have been derived, i.e. 245/2009 (Tertiary), 244/2009 (NDLS) and
1194/2012 (DLS).
The lower part of the table attempts an alternative subdivision, of the same total
values, into an outdoor share, an indoor-residential share and an indoor-non-
residential share.
Notes about this 2020 estimate:
This energy estimate is limited to the scope of existing EU policy measures and
therefore does not include, for example, special purpose lamps (estimated to
consume 58 TWh in 2007) and/or some types of controls.
The 2020-data in the table have been derived from Impact Assessment reports
that in their turn depended heavily on the data collected and derived for the
Preparatory Studies during the years 2005-2007. The clear impression is that
the progress, development and market-introduction of LED lamps is much
faster than was assumed in those years and also therefore that this estimate is
inaccurate.
This estimate neglects interactive effects with the building energy balance as
illustrated in Figure 1-1, for example energy savings in lighting could also
reduce the building cooling energy demand.
In the context of this quick scan it is not feasible to develop a new and more refined
models for the lighting stock, for the corresponding total energy consumption, and for
the energy savings related to the Eco-design and –labelling measures which have
already been implemented.
73 Van Tichelen, Bossuyt, Mira-2007 'Achtergronddocument Thema hinder: lichthinder', www.milieurapport.be

Preparatory study on lighting systems
Month Year I 122
Table 1-11: Rough estimate of Electrical Energy Consumption of the EU27 lighting
stock based on the data of the Impact Assessment reports associated with the
Regulations regarding the Ecodesign measures.
Source Main
Lamp
Types
TWh
base
year74
TWh
BAU75
2020
TWh
ECO76
2020
TWh
ECO 2020
– base
year
TWh
Savings
ECO 2020
– BAU
2020
245/200977
(Tertiary)
LFL,
CFLni,
HID
200 260 222 +22 -38
244/200978
(NDLS)
GLS,
CFLi, HL,
(LED)
112 135 84 -28 -51
1194/201279
(DLS)
GLS-R,
HL-R,
(LED)
30 50 26 -4 -24
Total All
above
342 445 332 -10 -113
Estimated Outdoor/Indoor Subdivision compatible with above totals
Outdoor HID 65 84 72 +7 -12
Indoor
Residential
GLS,
CFLi, HL,
(LED)
109 131 82 -27 -49
Indoor
Non-
Residential
LFL,
CFLni
(LED)
168 230 178 +10 -52
Total All
above
342 445 332 -10 -113
1.6.4 Link between reference energy consumption and installation stock
At the moment we can only provide an educated guess based on perception; to our
knowledge lamp manufacturers have no accurate data concerning where lamps are
used or don’t want to disclose it for commercial reasons. The assumption on the
relation between sector and lamp technology is summarised in the next table:
74 Differs from source to source, year 2005 or 2007 75 Business As Usual, based on state and trends of 2005 or 2007 76 ECO includes the effect of measures as specified in the source 77 Impact Assessment 2009-0324, for Regulation 245/2009, sub-option 2 of Annex II 78 Impact Assessment 2009-0327, for Regulation 244/2009, does not contain full energy data for BAU and ECO scenarios. Data have been taken from Preparatory study Lot 19; figure 8-6 for BAU; figure 8-36 2b for ECO. 79 Impact Assessment 2012-0419, for Regulation 1194/2012; para 2.5.4 for BAU; para 5.2.1 for Lbl Min II (stage 3 at EEI=0.95 applied) for ECO

Preparatory study on lighting systems
Month Year I 123
Table 1-12: Estimated share of lamp technology per sector indoor
Combining these assumptions with the rough estimate of the lighting stock energy
consumption in 2020 results in the following estimate per indoor sector (Table 1-13):
Table 1-13: Estimated annual power consumption of indoor lighting stock per sector
(2007)
For outdoor lighting the data on energy consumption per sector from Table 1-11 and
Table 1-13 can be combined to derive the values in (Table 1-14).
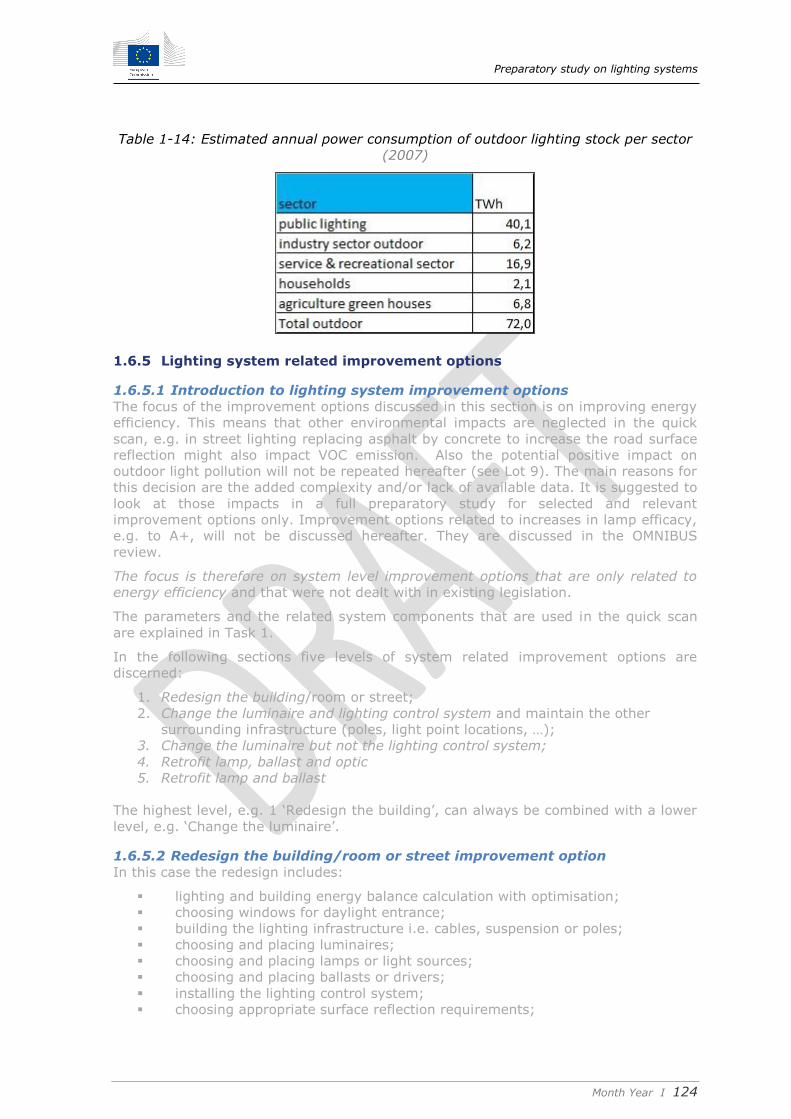
Preparatory study on lighting systems
Month Year I 124
Table 1-14: Estimated annual power consumption of outdoor lighting stock per sector
(2007)
1.6.5 Lighting system related improvement options
1.6.5.1 Introduction to lighting system improvement options
The focus of the improvement options discussed in this section is on improving energy
efficiency. This means that other environmental impacts are neglected in the quick
scan, e.g. in street lighting replacing asphalt by concrete to increase the road surface
reflection might also impact VOC emission. Also the potential positive impact on
outdoor light pollution will not be repeated hereafter (see Lot 9). The main reasons for
this decision are the added complexity and/or lack of available data. It is suggested to
look at those impacts in a full preparatory study for selected and relevant
improvement options only. Improvement options related to increases in lamp efficacy,
e.g. to A+, will not be discussed hereafter. They are discussed in the OMNIBUS
review.
The focus is therefore on system level improvement options that are only related to
energy efficiency and that were not dealt with in existing legislation.
The parameters and the related system components that are used in the quick scan
are explained in Task 1.
In the following sections five levels of system related improvement options are
discerned:
1. Redesign the building/room or street;
2. Change the luminaire and lighting control system and maintain the other
surrounding infrastructure (poles, light point locations, …);
3. Change the luminaire but not the lighting control system;
4. Retrofit lamp, ballast and optic
5. Retrofit lamp and ballast
The highest level, e.g. 1 ‘Redesign the building’, can always be combined with a lower
level, e.g. ‘Change the luminaire’.
1.6.5.2 Redesign the building/room or street improvement option
In this case the redesign includes:
lighting and building energy balance calculation with optimisation;
choosing windows for daylight entrance;
building the lighting infrastructure i.e. cables, suspension or poles;
choosing and placing luminaires;
choosing and placing lamps or light sources;
choosing and placing ballasts or drivers;
installing the lighting control system;
choosing appropriate surface reflection requirements;

Preparatory study on lighting systems
Month Year I 125
iterative redesign steps to have a close fit to lighting requirements for
tertiary lighting as defined in standards EN 12464-1&2 and EN 13201-2, e.g.
fit to maximum +5 % above the requirement of 500 lx.
Luminaires, lamps and ballasts were selected to be the best available products on the
market and moreover ballasts or drivers are dimmable, electronic ones. The dim
ability, coupled to a lighting control system, allows energy savings accordingly to the
traffic density (street lighting) or daylight (offices and indoor lighting).
1.6.5.3 Change the luminaire and the external lighting control system
improvement option
This option saves the basic infrastructure and only replaces:
luminaires;
lamps or light sources;
ballasts or drivers;
lighting control system.
Luminaires, lamps and ballasts were selected to be the best available products on the
market.
Ballasts or drivers shall be dimmable and electronic ones and play an important role in
this option. Dimming also enables close matching of the illumination to the lighting
requirements for non-domestic lighting as defined in standards EN 12464-1&2 and EN
13201-2 and therefore provides energy saving. Otherwise, there is an initial over-
illumination in projects where the maintenance factor is taken into account; a constant
illumination control system such as defined in EN 15193 can therefore provide
additional savings.
1.6.5.4 Change the luminaire but not an external lighting control system
improvement option
In existing installations of the previous option where no lighting control system can be
installed, it is possible to just replace luminaires.
In this case dimming can also be useful e.g. when dimming can be done to fine tune
matching with the minimum illumination requirements taking into account real local
conditions such as reflections and the available lamp wattages. It is also possible to
have an integrated light or presence sensor to control the light output.
1.6.5.5 Retrofit lamp, ballast and optic improvement option
If the luminaires in an installation are equipped with poor optics, only lamps, ballasts
and optics can be replaced. In this option the lamp is replaced by a directional light
source that partially bypasses the luminaire optics. This is useful in existing luminaires
with poor optical efficiency. Replacing a fluorescent lamp by a retrofit LED lamp can be
an example of this solution.
1.6.5.6 Retrofit lamp and ballast improvement option
See the Omnibus study.
1.6.5.7 More frequent operation and maintenance of the lighting system
according to the design
This can reduce calculated maintenance factors and therefore initial and total energy
in use for the life of the lighting system.
Also in existing designs it can provide savings when constant illumination control
systems are implemented, see 1.6.5.3.

Preparatory study on lighting systems
Month Year I 126
1.6.5.8 Reference Worst Case (WC) 2020 compared to BAT 2020 for street
lighting (outdoor)
The calculation shown in table 1-15 below is made for a street in a slow traffic area in
line with the Lot 9 Preparatory Study for Public Street Lighting.
The base case already takes into account the Ecodesign requirements for 2017 as
published in Commission Regulation 245:
the lamp type is an HPS with enhanced xenon-pressure and non-
dimming magnetic ballast;
the luminaire is a luminaire without optics and with ingress protection
IP45 as the regulation does not impose any requirement for luminaires;
and,
low performing optics and installation (UF).
The BAT 2017 uses:
an improved MH-lamp of the new generation;
improved UF;
a dimmable, electronic ballast with appropriate control system;
a luminaire with BAT optic, IP65 and self-cleaning glass and thus high
LMF.
The BAT 2020 LED has:
LED light source with assumed efficiency of 120 lm/W as forecast by
Lighting Europe;
a dimmable electronic driver with appropriate control system;
improved UF, it assumes that LED enables better control of the light
distribution;
a luminaire with high LMF.
Table 1-15: Worst Case with existing legislation compared to BAT 2020 at system
level for street lighting
Conclusion:
This street lighting example, illustrates that the energy consumption per year and per
useful lumen when comparing the Worst Case projected for 2017 with the BAT can
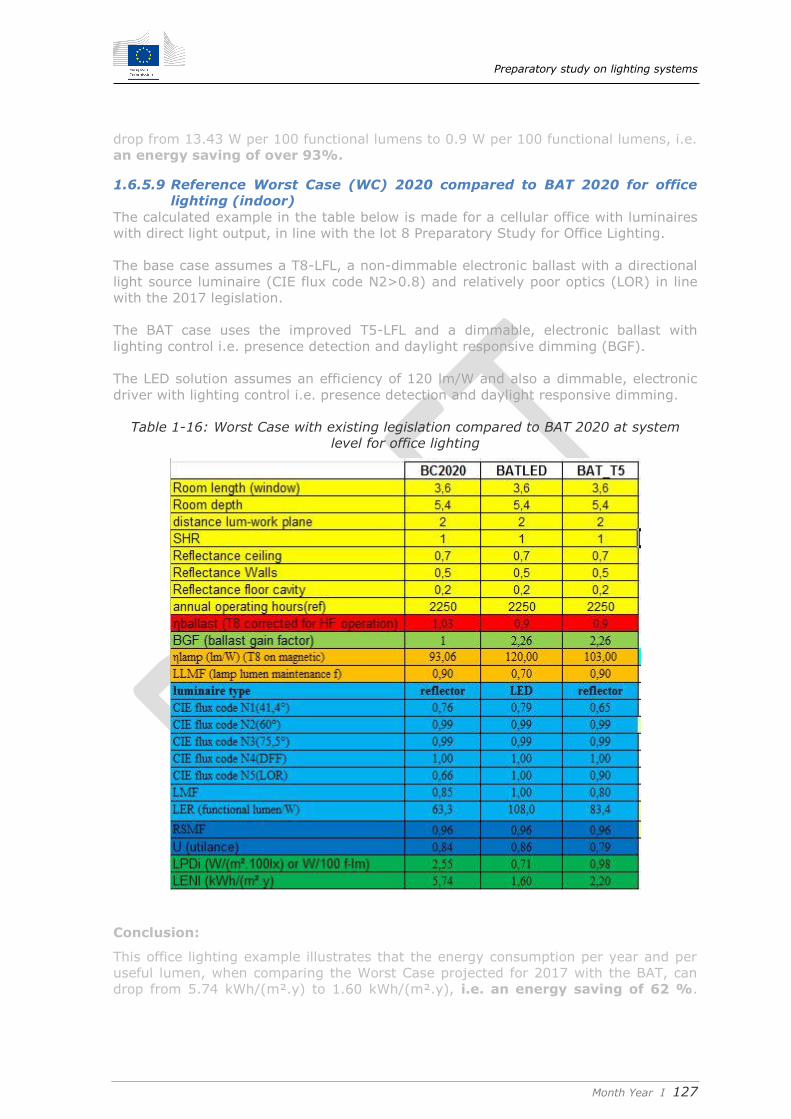
Preparatory study on lighting systems
Month Year I 127
drop from 13.43 W per 100 functional lumens to 0.9 W per 100 functional lumens, i.e.
an energy saving of over 93%.
1.6.5.9 Reference Worst Case (WC) 2020 compared to BAT 2020 for office
lighting (indoor)
The calculated example in the table below is made for a cellular office with luminaires
with direct light output, in line with the lot 8 Preparatory Study for Office Lighting.
The base case assumes a T8-LFL, a non-dimmable electronic ballast with a directional
light source luminaire (CIE flux code N2>0.8) and relatively poor optics (LOR) in line
with the 2017 legislation.
The BAT case uses the improved T5-LFL and a dimmable, electronic ballast with
lighting control i.e. presence detection and daylight responsive dimming (BGF).
The LED solution assumes an efficiency of 120 lm/W and also a dimmable, electronic
driver with lighting control i.e. presence detection and daylight responsive dimming.
Table 1-16: Worst Case with existing legislation compared to BAT 2020 at system
level for office lighting
Conclusion:
This office lighting example illustrates that the energy consumption per year and per
useful lumen, when comparing the Worst Case projected for 2017 with the BAT, can
drop from 5.74 kWh/(m².y) to 1.60 kWh/(m².y), i.e. an energy saving of 62 %.

Preparatory study on lighting systems
Month Year I 128
The main improvement comes from control systems in conjunction with a higher LER
for the LED luminaire. More refined analysis will be done in later tasks 4-6.
1.6.5.10 Reference Worst Case (WC) 2020 compared to BAT 2020 related
to changing domestic luminaire design (indoor)
In domestic lighting and some other similar lighting applications there are no strict
illumination requirements imposed via standards, as opposed to typical non-domestic
lighting applications. This has an impact on the functional unit (see Task 1) and
therefore also on system improvement options.
In the Preparatory Study for Domestic Lighting, several improvement options were
discussed at ‘system level’ that can also be applied in other lighting applications.
Note: in Lot 19 the luminaire was part of the system environment.
Improvement options related to lamp efficacy improvements:
avoid the lock-in effect into low efficiency lamps of class C or lower;
design luminaires that create a positive lock-in effect into efficient
lighting;
use coloured LEDs to create coloured light.
Options for the design of luminaires with appropriate and efficient control electronics:
luminaires that incorporate or are compatible with dimmers;
luminaires with motion sensors incorporated where appropriate;
outdoor luminaires with day/night sensors incorporated;
eliminate standby losses when power supplies are incorporated in
luminaires;
use electronic control gear instead of magnetic (conventional) control
gear for CFLni and low voltage halogen.
Options to increase the optical efficiency of luminaires:
use material with increased light transmittance for visible parts that are
transparent / translucent;
use materials with increased reflectance for invisible parts that are not
transparent/translucent;
use the correct category of luminaire for the correct application and
provide appropriate user information.
Other luminaire related improvement options:
design outdoor luminaires with photovoltaic panels;
use a reflector lamp or an LED-luminaire instead of a luminaire with
reflector for downlighters.
Conclusion:
Annex I of lot 19 included estimates on Luminaire improvement options which can
results in cumulative savings up to 80 %, on the assumption that they are all
relevant and applicable. More refined analysis will be done in later tasks 4-6.
1.6.5.11 Reference Worst Case (WC) 2020 compared to BAT 2020 for the
building energy balance related to lighting
As shown in sections 0.4 and 1.3.3, lighting systems are specified by different
characteristics. Taking into account all these characteristics makes it difficult to
compare different lighting systems. When looking at lighting systems within the

Preparatory study on lighting systems
Month Year I 129
context of a whole building energy performance approach, this becomes even more
difficult, since windows also need to be considered.
Windows are generally the weakest link in the building envelope from an insulation
point of view (e.g. U=0.24 W/m²K for walls and roofs versus 1.1 W/m²K for windows),
but provide natural daylight and solar heat gains. Heat losses and solar heat gains, as
well as daylight provision are all characterized by different aspects of the window and
its surroundings (e.g. shades, etc.).
Daylight is considered a crucial aspect in sustainable building, as shown by the
BREEAM rating system, where in the section of health and well-being credits can be
awarded for daylit rooms.
Also, windows play an important role in the perception of space and often contribute
to the architectural qualities of a building, especially in office buildings.
Conclusion:
There is no ready to use data for the quick scan, however the impact of
modelling is included in standard DIN EN 15232:2007-11, and therefore it is
recommended to reconsider this in the subsequent tasks.
1.6.6 Input received from field experience of lighting designers on target
application area's
Note the following input was received from IALD23:
“Typically Hospitals and public education establishments are designed with a high
priority placed on energy efficiency in lighting. It is challenging that the proposed
energy savings would be achieved by regulation as these are already being designed
in for new build and refurbishment projects. Commercial developments, office and
retail show the largest opportunity for system level savings as prime cost rather than
cost in use drives these projects. Hotels and Restaurants require lighting system
design to focus on the aesthetic qualities of light with style and fashion dictating much
of the design trend. Systems regulation on maintenance and operation would be most
effective here.”
1.6.7 Conclusions on scope
As already can be concluded, savings at system level can be very significant and can
reach up to 90% when comparing the worst case implementation permitted according
to the existing legislation after 2017 with the best available techniques.
Therefore the statement made in a working document of the consultation of
September 2010 on lighting is still a realistic estimate; it states that ‘addressing
lighting at system level would contribute to 90 TWh80 for the whole non-domestic
sector’81. Of course, all TWh consumed in lighting can only be saved once. This means
that when light sources become more efficient, the total impact from other system
related improvement options will become proportionally less. Subsequent tasks will
analyse this in more detail, with more categories, more representative base cases and
consider more improvement options.
The estimated energy consumption (2007) per sector and rough first estimates of the
maximum savings found are summarised in Table 1-17 and Table 1-18. The findings in
80 Of Annual Energy Savings in lighting installations (2005 reference) 81 The 90TWh refers to estimated annual energy savings in 2020
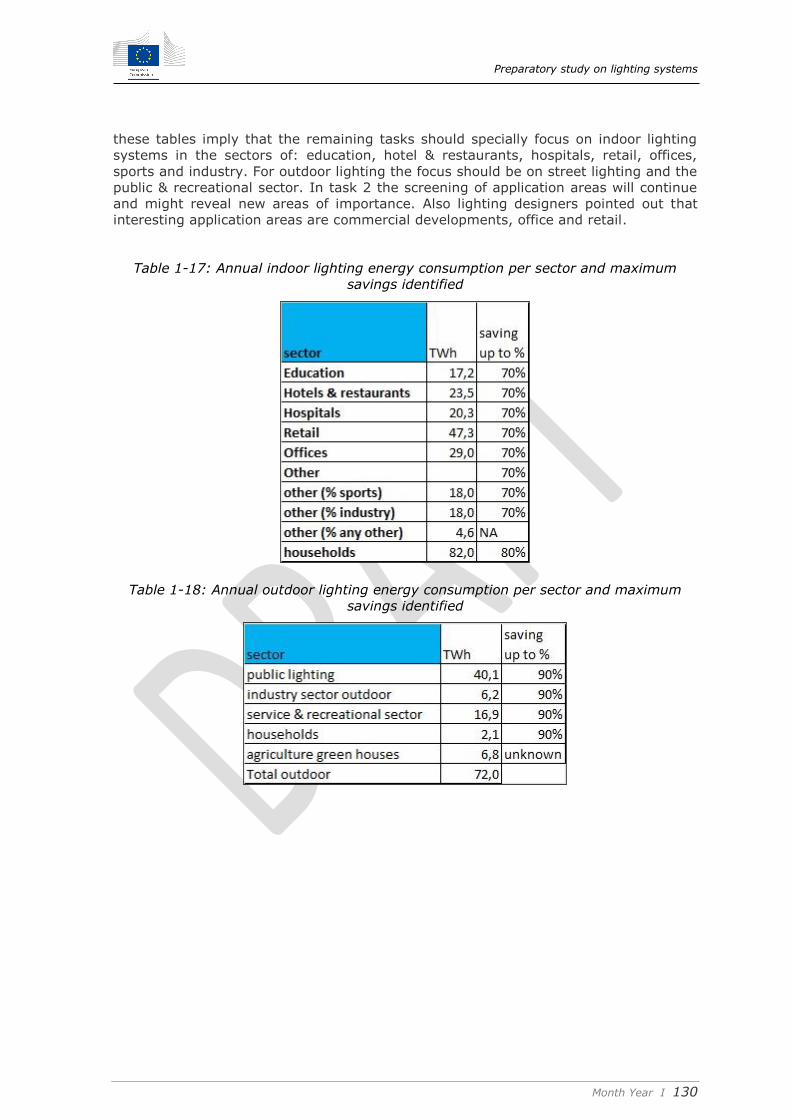
Preparatory study on lighting systems
Month Year I 130
these tables imply that the remaining tasks should specially focus on indoor lighting
systems in the sectors of: education, hotel & restaurants, hospitals, retail, offices,
sports and industry. For outdoor lighting the focus should be on street lighting and the
public & recreational sector. In task 2 the screening of application areas will continue
and might reveal new areas of importance. Also lighting designers pointed out that
interesting application areas are commercial developments, office and retail.
Table 1-17: Annual indoor lighting energy consumption per sector and maximum
savings identified
Table 1-18: Annual outdoor lighting energy consumption per sector and maximum
savings identified

Preparatory study on lighting systems
Month Year I 131
CHAPTER 2 Markets The Objective
The objective of Task 2 is to present an economic and market analysis of lighting
system products. The aims are:
to place the lighting system products within the context of EU industry and
trade policy (subtask 2.1);
To provide market size and cost inputs for the EU-wide environmental impact
assessment of the product group (subtask 2.2);
To provide insight into the latest market trends to help assess the impact of
potential Ecodesign measures with regard to market structures and ongoing
trends in product design (subtask 2.3, also relevant for the impact analyses in
Task 3); And finally,
To provide a practical data set of prices and rates to be used for Life Cycle Cost
(LCC) calculations (subtask 2.4). It should be noted that price informationis
also be supplied within Task 4.
Summary of task 2:
The preparatory phase of this study is to collect data for input from stakeholders. A
final summary of this task will be elaborated during the completion of the final report.
The European lighting market data and later on in Task 7 the high-level (scenario)
energy impact analyses of this study will be linked to the ‘Model for European Light
Sources Analysis’ (MELISA), that has been developed in the Ecodesign preparatory
study on Light Sources. It is important to understand the differences in approach and
scope between those studies, In MELISA, the initial lighting capacity, useful lifetime
sales and stock volumes are expressed in quantities of light sources and not
luminaires. The scope of this study as defined in Task 1 is on lighting installations that
are designed to fulfil lighting design requirements according to standards EN 12464 for
indoor lighting and EN13201 for outdoor lighting. As a consequence a lighting design
will require a set of luminaires for each specific application. The MELISA model was
therefore extended with several parameters to enable it to interface between both
studies. This will be useful should Task 5 and 6 assessments be needed to estimate
the total impact across Europe of different lighting system designs and their
improvement options. In this study the ‘product’ is lighting installations and their
designs. This means that the typical market product unit driver is floor or road surface
area. Market data on these areas is included in this task report. Because the outcomes
of lighting design energy evaluations of such systems are given in kWh/y.m², see Task
1, these values can together with surface area be cross-checked or verified with
MELISA data based on light source energy consumption. For non-residential
applications there is a good alignment.
More details on typical lighting applications within the scope of this assessment and
their requirements are given in Task 3 on Users. Typical lighting solutions for these
applications are discussed in Task 4. A more refined market analysis has also been
conducted to determine which typical task areas and/or building applications consume
significant amounts of energy. This showed that in addition to office spaces the
lighting energy consumption in circulation area’s, manufacturing area’s, toilet rooms,
storeroom/warehouses and shops is also significant.
When conducting the analyses using the MELISA model and later Tasks 5-7 it will be
important to avoid double counting the effect of increased lamp efficacy within lighting
stock energy consumption scenarios, because they are already taken into account in
the light source study. Therefore, when defining so-called base cases for the system
study they should already have this efficacy increase included. It is expected that this
modelling can be done by adding reference designs with lamp efficacies in line with

Preparatory study on lighting systems
Month Year I 132
the light source study scenarios applied in MELISA and by rescaling the base cases in
Task 5 and improvement options in Task 6 accordingly.
This study builds on the previous office lighting and road lighting study but when
defining reference applications in Task 4 it could be worth considering other
applications that have significant impact. This will be discussed in the stakeholder
meeting.
Comment: This report is currently a work in progress, as some parts of the study have
not yet received the benefit of comments and data from stakeholders, therefore it
should not be viewed as a draft final report.
2.1 Model for European Light Sources Analysis (MELISA)
2.1.1 Introduction to the MELISA model
The ‘Model for European Light Sources Analysis’ (MELISA) has been developed in the
Ecodesign preparatory study on Light Sources (Lot 8/9/19) 82. This study was
performed in parallel to the Lot 37 Lighting Systems study and was concluded in
October 2015.
The MELISA model has been developed on request of the European Commission with
the aim to harmonize the data for the two related preparatory studies on lighting.
Consequently the data and calculation methods contained in this model will form the
basis for the high-level (scenario) analyses in the Lighting Systems study. The final
version as described in the Task 7 report of the Light Sources study will be used.
MELISA distinguishes the light source base cases presented in Table 2-1. There are
five groups of light source types: Linear Fluorescent Lamps (LFL), High-Intensity
Discharge lamps (HID-lamps), Compact Fluorescent Lamps without integrated ballast
(CFLni), Directional lamps (DLS) and Non-directional lamps (NDLS). As shown in the
table, each group is further subdivided in classical technology base cases and also has
two associated LED base cases, respectively for LED retrofit lamps and integrated LED
luminaires. The shift in sales from the classical technology base cases to the LED base
cases of the same group is one of the essential elements in the scenario projections in
MELISA 83.
Although not shown in the table, all data in MELISA (both input data and calculated
results) are subdivided in those related to the residential sector and those related to
the non-residential sector. This is important for the Lighting Systems study because
the scope in Task 1 has been limited to EN 12464 indoor work places and EN 13201
road areas.
MELISA derives the installed stock of light sources in the EU-28 from data on the
annual sales and on the average useful lifetimes (of light sources). These stock data
are combined with average unit power values (W) and average annual operating hours
per unit (h/a) to compute the total electricity consumption per base case (TWh/a). The
contributions of the various base cases are summed to get the EU-28 totals per sector
(residential, non-residential) and the sum of the latter two provides the overall EU-28
total for all sectors. Greenhouse gas (GHG) emissions are directly related to electricity
consumption.
82 http://ecodesign-lightsources.eu/documents 83 For details see the Task 7 report of the Light Sources study.

Preparatory study on lighting systems
Month Year I 133
The electricity consumption is multiplied by the electricity rates (euros/kWh, fixed
2010 euros, discount rate 4%) to compute the associated annual electricity costs (bn
euros per year). These are combined with the annual maintenance costs to obtain the
total annual running costs.
The light source base cases distinguished in the MELISA model and the improvement
options considered in the policy scenarios of Task 7 of the Light Sources study are
shown in Table 2-1. The base cases are organized into five application groups (LFL,
HID, CFLni, DLS and NDLS). Within each application group there are classical
technology base cases (shown on the left) and base cases for LED lighting products
that can replace the classical products in the same application (shown on the right).
LED products are subdivided in retrofit solutions and integrated LED luminaires. Light
source sales data in Annex B are organized according to these five application groups
and their base cases.
Multiplying the annual sales by unit prices per light source provides the purchase costs
(per base case, per sector, and the overall EU-28 total). Adding the installation costs
provides the total acquisition costs, per sold light source.
The sum of acquisition costs and running costs is the total consumer expense.
A survey of the main input variables and the calculated intermediate and final results
for MELISA is provided in Table 2-2. For further details see the Light Sources study 82,
in particular the Task 2 (sales, stock), Task 3 (light source usage parameters), Task 4
(summary of input data per base case) and Task 7 (BAU and ECO scenarios) reports.
All economic data in MELISA are in fixed 2010 euros and include 20% VAT for the
residential sector, and no VAT for the non-residential sector.
The input data and the output data of MELISA were extensively checked against other
sources and also discussed with stakeholders in the course of the Light Sources study 84. In particular, the sales data are based on a mix of data from the industry
association LightingEurope, Eurostat and GfK market research.
For the residential sector the data are considered to be fairly accurate, within a
maximum estimated error of 10%. For the non-residential sector some data could
have a larger error, in particular with respect to the average annual operating hours
and the sales volumes of HID-lamps.
The MELISA data are therefore considered to be a sound basis for the analyses to be
conducted in the Lighting Systems study.
84 See the Task 2, 3 and 4 reports of the Light Sources study.

Preparatory study on lighting systems
Month Year I 134
Table 2-1 Light source base cases distinguished in the MELISA model (left hand side)
and improvement options used in scenarios (right hand side)
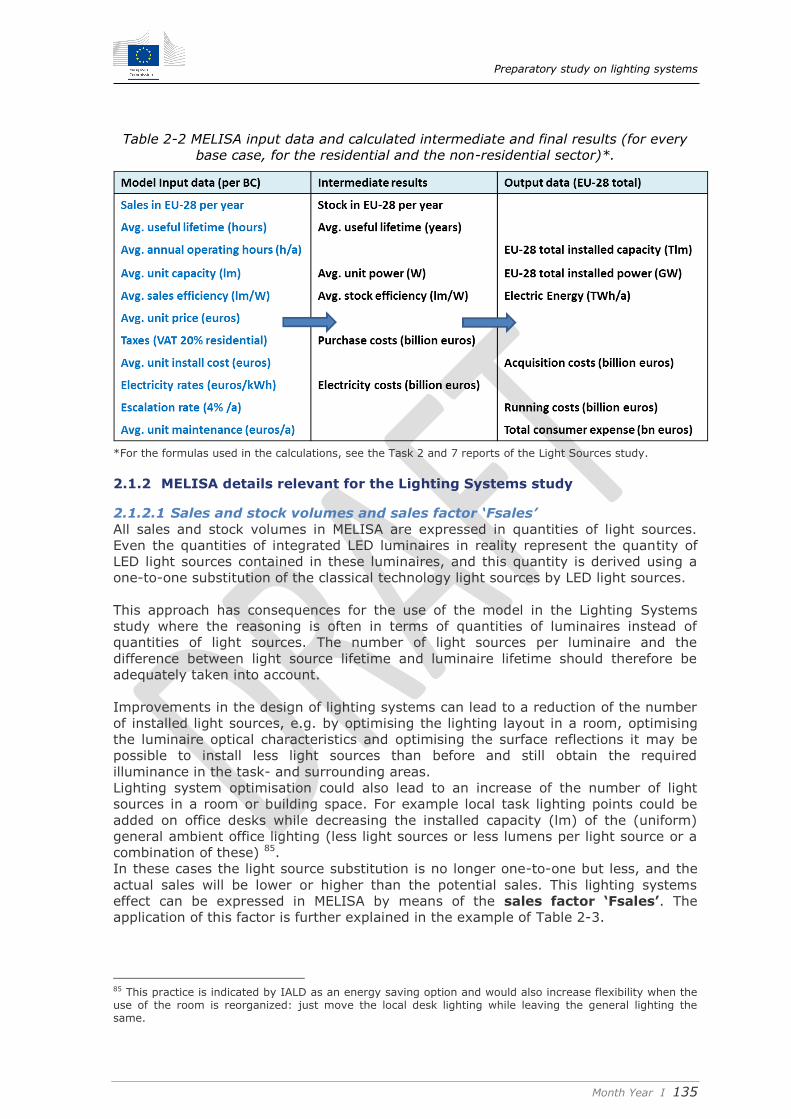
Preparatory study on lighting systems
Month Year I 135
Table 2-2 MELISA input data and calculated intermediate and final results (for every
base case, for the residential and the non-residential sector)*.
*For the formulas used in the calculations, see the Task 2 and 7 reports of the Light Sources study.
2.1.2 MELISA details relevant for the Lighting Systems study
2.1.2.1 Sales and stock volumes and sales factor ‘Fsales’
All sales and stock volumes in MELISA are expressed in quantities of light sources.
Even the quantities of integrated LED luminaires in reality represent the quantity of
LED light sources contained in these luminaires, and this quantity is derived using a
one-to-one substitution of the classical technology light sources by LED light sources.
This approach has consequences for the use of the model in the Lighting Systems
study where the reasoning is often in terms of quantities of luminaires instead of
quantities of light sources. The number of light sources per luminaire and the
difference between light source lifetime and luminaire lifetime should therefore be
adequately taken into account.
Improvements in the design of lighting systems can lead to a reduction of the number
of installed light sources, e.g. by optimising the lighting layout in a room, optimising
the luminaire optical characteristics and optimising the surface reflections it may be
possible to install less light sources than before and still obtain the required
illuminance in the task- and surrounding areas.
Lighting system optimisation could also lead to an increase of the number of light
sources in a room or building space. For example local task lighting points could be
added on office desks while decreasing the installed capacity (lm) of the (uniform)
general ambient office lighting (less light sources or less lumens per light source or a
combination of these) 85.
In these cases the light source substitution is no longer one-to-one but less, and the
actual sales will be lower or higher than the potential sales. This lighting systems
effect can be expressed in MELISA by means of the sales factor ‘Fsales’. The
application of this factor is further explained in the example of Table 2-3.
85 This practice is indicated by IALD as an energy saving option and would also increase flexibility when the use of the room is reorganized: just move the local desk lighting while leaving the general lighting the same.

Preparatory study on lighting systems
Month Year I 136
In order to determine the factor Fsales, the Lighting Systems study has to derive or
estimate:
The share Ps,inv 86 of the EU-28 total sales for a base case application for a
given year that is involved in a lighting system design optimisation leading to a
change of the number of installed light sources and consequently to a change
in sales. The current (2015) reference share is set to zero, which is also the
value assumed in the Light Sources study for all years (Ps,inv =0% → Fsales
=100%).
For the share Ps,inv , the quantity of light sources remaining after the
optimisation, expressed as the share Ps,rem 86 of the quantity of light sources
that were installed before the optimisation 87. The current (2015) reference
share is set to 100%, which is also the value assumed in the Light Sources
study for all years (Ps,rem =100% → Fsales =100%)
Fsales = 100% – Ps,inv * (100% – Ps,rem) (see example in Table 2-3)
The factor can be set separately for each base case and for the residential and non-
residential sectors of that base case.
Table 2-3 Example (for sales related to LFL T8t in 2015) of the application in MELISA
of the sales factor Fsales to account for the effect of the reduction of the number of
light sources due to improvements in lighting system design.
Derivation of the 2015 sales related to LFL T8 tri-phosphor light sources: Lamps reaching end-of-life: 168 mln (based on sales in 2009 and lifetime 6 years) Lamps for new applications: 32 mln (based on stock in 2014 and annual growth rate)
Lamps substituting T12/T8h: 21 mln (taken from the LFL T12 and LFL T8h base cases)
Potential LFL T8t sales: 221 mln (sum of the above) These potential sales are distributed in MELISA as actual sales according to a scenario (BAU or ECO), for example:
Share remaining LFL T8t: 188 mln (85%) (shares vary from year to year Shifting to LFL T5: 22 mln (10%) and from scenario to scenario, Shifting to LED retrofit: 8 mln (3.5%) with LED share increasing in Shifting to LED luminaire: 3 mln (1.5%) later years) Each of these sales quantities is multiplied (on the Excel sheet for the corresponding base case) by a factor, Fsales, which by default is 1.0.
If e.g. we assume (on the level of EU-28 as a total) that in Ps,inv = 20% of the cases the light sources shifting to LED luminaires will be involved in an optimised lighting system design and that this optimisation permits the number of light sources to be reduced to Ps,rem=75% of the original quantity, the actual number of light sources inside LED luminaires sold in 2015 would
become (100%-20%)*3 mln + 20%*75%*3mln = 2.85 mln. So the factor to be applied on the LED luminaire sheet would be Fsales = 2.85/3 *100% = 95%, or Fsales = (100%-Ps,inv) +
Ps,inv*Ps,rem = 100%-Ps,inv*(100%-Ps,rem) = 100%-20%*(100%-75%) = 95%.
86 Ps,inv = Percentage, sales, involved; Ps,rem = Percentage, sales, remaining 87 The name ‘remaining’ suggests a reduction of the number of light sources, and this is expected to be the most frequent case, but as explained in the text in some cases there could also be an increase in the number of light sources due to the system optimisation. In those cases Ps,rem can also be larger than 100%.
Preparatory study on lighting systems
Month Year I 137
2.1.2.2 Power, capacity, operating hours and factors Fphi and Fhour
The lighting capacity (expressed in lumen, lm) in MELISA is the initially
installed (rated) capacity at 100 h operation of the light source (NOT of the
luminaire). It is divided by the initial (rated luminous efficacy (expressed in lm/W) in
standard testing conditions to obtain the initially installed (rated) full power of the
light source.
The value chosen for the initial installed capacity already reflects that it may have
been chosen to be higher than strictly necessary, to compensate for lumen
degradation with time, or for lower efficacy at operating temperatures, or because the
exact desired lumens were not available.
For light sources with integrated ballast or control gear, their efficacy includes the
efficiency of the ballast/gear and consequently the derived power is the combined
power for light source and ballast/gear together. In these cases the efficiency of the
ballast/gear is set to 100% in the model.
For light sources with external ballast or control gear, the light source efficacy and
power are considered separately from the ballast/gear efficiency and power.
It is essential to note that capacity, efficacy and power in MELISA are always initial,
full, rated values (they are NOT average values over the lifetime).
To compute energy consumption, the full power is multiplied by the average full-
power-equivalent operating hours per year. This means that effects of dimming are
being accounted for in the equivalent operating hours (and NOT in the power). For
example, if a light source is operated at full power for 1500 hours per year, at 50%
power for 500 h/a and at 25% power for 200 h/a, the full-power equivalent hours to
be considered in MELISA would be 100%*1500 +50%*500+25%*200 = 1800 h/a 88.
If dimming changes over the years, for example to compensate for lumen
degradation, the average annual hours over the lifetime should be considered 89. The
only criterion for the determination of the hours is that, when multiplied by the full
rated power, the correct average annual energy consumption over the lifetime results.
For all classical technology base cases MELISA defines the average unit capacities,
average light source efficacies and average annual operating hours per unit (full-
power equivalent). When these classical technologies are substituted by LED lighting
products, the latter inherit the capacities and the annual operating hours of the
former, but a (small) rebound factor is applied 90. In principle, all these parameters
already defined in MELISA should NOT be changed in the Lighting Systems study
because they form the common harmonized data for both lighting studies. MELISA has
two separate factors, Fphi and Fhour, to express the effects of lighting system
improvements.
88 The % power during dimming should be used as the weighting factor, NOT the % of emitted luminous flux. 89 If e.g. lumen maintenance is 70% at end of useful life, and continuous constant illuminance dimming is applied to compensate for lumen degradation, dimming at start of life will be to 70% of rated power and at end of life to 100% of rated power, so average to 85%. Consequently, average annual operating hours have to be multiplied by 90%. 90 In general this factor accounts for the fact that consumers have the tendency to buy higher lumen lamps and to let them burn longer when the light sources are more energy efficient. The same factor could also be used to implement other changes in capacity. For example when low CRI HPS lamps are substituted by higher CRI LED it is probably possible to install less LED lumens than the HPS lumens before. In some LFL applications the directionality of LED tubes also allows to reduce the installed lumens. (assumption from VHK made in MELISA)

Preparatory study on lighting systems
Month Year I 138
The factor Fphi (expressed as a percentage) can be used in the Lighting Systems
study when improvements in lighting system design (layout, luminaire design, surface
reflections) lead to the installation of less capacity (lumen) in a room or building space
than before (while maintaining the same number of light sources, see Fsales before).
In order to determine the factor Fphi, the Lighting Systems study has to derive or
estimate:
The share Pf,inv 91 of the EU-28 total flux for a base case for a given year that
is involved in a lighting system design optimisation leading to a reduction of
the installed luminous flux. The current (2015) reference share is set to zero,
which is also the value assumed in the Light Sources study for all years (Pf,inv
=0% → Fphi =100%).
For the share Pf,inv , the installed luminous flux remaining after the
optimisation, expressed as the share Pf,rem 91 of the flux that was installed
before the optimisation. The current (2015) reference share is set to 100%,
which is also the value assumed in the Light Sources study for all years (Pf,rem
=100% → Fphi =100%)
Fphi = 100% – Pf,inv * (100% – Pf,rem)
The factor can be set separately for each base case and for the residential and non-
residential sectors of that base case.
The factor Fhour (expressed as a percentage) can be used in the Lighting Systems
study when improvements in lighting system design (installation of dimmers, timers,
daylight sensors, occupancy sensors, constant illuminance controls, etc.) lead to lower
average annual operating hours (full-power equivalent) than before.
In order to determine the factor Fhour, the Lighting Systems study has to derive or
estimate:
The share Ph,inv 92 of the EU-28 total operating hours for a base case for a
given year that is involved in a lighting system design optimisation leading to a
reduction of the annual operating hours. The current (2015) reference share is
set to zero, which is also the value assumed in the Light Sources study for all
years (Ph,inv =0% → Fhour =100%).
For the share Ph,inv , the annual operating hours remaining after the
optimisation, expressed as the share Ph,rem 92 of the operating hours before
the optimisation. The current (2015) reference share is set to 100%, which is
also the value assumed in the Light Sources study for all years (Ph,rem =100%
→ Fhour =100%)
Fhour = 100% – Ph,inv * (100% – Ph,rem)
The factor can be set separately for each base case and for the residential and non-
residential sectors of that base case.
Important conclusions for any later Tasks 5-7:
It will be important to avoid double counting of increased lamp efficacy in
scenarios on projected energy consumption of the lighting stock, because
this is already taken into account in the light source study. Therefore, when
defining the base case” for the system study this base case should already
include these efficacy increases. It is expected that this modelling can be
done by adding reference designs with lamp efficacies in line with MELISA
and rescale the base cases in Task 5 and improvement options in Task 6
accordingly.
91 Pf,inv = Percentage, flux, involved; Pf,rem = Percentage, flux, remaining 92 Ph,inv = Percentage, hours, involved; Ph,rem = Percentage, hours, remaining
Preparatory study on lighting systems
Month Year I 139
2.1.2.3 Cost information limitations
MELISA only includes the price information that was necessary in the Light Sources
study, i.e. unit purchase prices, unit installation costs and annual unit maintenance
costs are all for light sources and are multiplied by light source sales and stock
quantities to compute EU-28 totals.
Costs for luminaires, control gear and ballasts for classical technology lamps are not
currently considered in MELISA, except for light sources with integrated gear where
gear costs are obviously included in the unit price for the light source.
For LED lighting products the unit prices include all hardware that is necessary to
make the products operational (new starters, control gears, any new wiring), but in
the Light Sources study the same prices were used for LED retrofit lamps and
integrated LED luminaires, even if for the latter base cases (and only for these)
MELISA offers the possibility to define additional LED luminaire costs and installation
costs 93.
Costs of control devices, network-communications, timers, dimmers, daylight sensors,
occupancy sensors, system installation, management and maintenance costs, etc. are
not foreseen in MELISA.
The factors Fsales, Fphi and Fhours are sufficient to predict the energy savings and
GHG emission reductions due to improved lighting systems. The same factors will also
have several cost saving effects:
Fsales leads to lower sales and hence lower purchase and installation costs for
the light sources. Lower sales also means lower stock and hence lower energy
costs and lower maintenance costs for the light sources
Fphi leads to lower installed capacity, hence lower installed power, lower
energy and lower energy costs. For LED lighting products, where the purchase
price is expressed in euros/klm, lower capacity also means lower purchase
costs
Fhour leads to lower operating hours, hence lower energy consumption and
lower energy costs
93 This feature might be used in future in the Impact Assessment for Light Sources to study the effect of additional luminaire and installation costs in a sensitivity analysis. Great caution is necessary when defining these costs, because:
1) The costs will be multiplied by sales volumes of light sources, not by the sales volumes of luminaires.
2) The costs of the LED retrofit light sources are already taken into account and should not be counted again with the LED luminaire.
3) The costs of classical technology luminaires are not accounted in the model, so only the
difference in costs between classical luminaires and integrated LED luminaires should be counted, unless a consumer is really forced to buy an integrated LED luminaire before the end of life of the classical technology luminaire. In that case the remaining worth of the classical luminaire should be considered.
4) LED prices are expressed in MELISA in terms of euros/klm and a single average price is used for all lamp types. The impression is that this average might be too high for high-lumen lamps as LEDs substituting LFLs and HID-lamps, that are of main interest for the
Lighting Systems study. So current LED costs in MELISA could already be overestimated for these lamp types.
5) In some cases the ‘additional costs’ to be considered might also be negative.
Preparatory study on lighting systems
Month Year I 140
However the additional investments in lighting systems that have to be made to
obtain the above energy and cost savings are currently not included in MELISA. What
is missing:
Additional costs for the design, installation, operation and maintenance of the
lighting system as a whole.
Costs of control devices, network-communications, timers, dimmers, daylight
sensors, occupancy sensors, etc.
Additional costs for new control gears / ballasts (controllability, dimmability)
Additional luminaire costs
There are two options to address these costs in future analyses:
Change the existing MELISA purchase, installation and maintenance costs and
use the option to add additional costs for the integrated LED luminaires. These
costs should then be scaled in such a way that multiplication by the light
sources sales or stock produces the correct totals. This might be rather
complicated and confusing
Use a separate accounting system of additional costs and sum this a posteriori
with the MELISA values. This might be easier and more transparent 94. This
option is preferred because of the complications inherent in the previous
option.
Important conclusions for any later Tasks 5-7:
In the lighting system a separate cost accounting will be done based on cost
data supplied in Task 4 for the several design options (worst case, BAT, ..) for
lighting applications defined in Task 3. For the total EU cost impact analysis
the system study data might be rescaled to MELISA in future Tasks 5 to 7.
2.1.3 Determination of MELISA’s system parameters
As explained in section 2.1.2, the following percentages have to be defined in the
Lighting Systems study, separately for each base case and separately for the
residential and non-residential sector:
Ps,inv: share of total EU-28 sales of light sources involved in sales reduction
Pf,inv: share of total EU-28 installed capacity (lm) involved in flux reduction
Ph,inv: share of total EU-28 operating hours (fpe h/a) involved in hour
reduction
Ps,rem: share of involved sales remaining after system optimisation
Pf,rem: share of involved luminous flux remaining after system optimisation
Ph,rem: share of involved operating hours remaining after system optimisation
Ps,inv, Pf,inv, Ph,inv
The ‘involved’ shares express the degree of penetration of improved lighting systems
in the EU-28. They would be expected to slightly increase with time (BAU scenario)
and there could be an acceleration after the introduction of an ecodesign measure
94 This separate accounting can be outside of MELISA or can be added to the MELISA Excel sheet.

Preparatory study on lighting systems
Month Year I 141
(ECO scenario) 95. The degree of penetration would also be expected to be higher for
modern more efficient light source types such as LEDs than for classical technology
types. The current (2015) situation is taken as reference, with Ps,inv, Pf,inv and
Ph,inv all set to 0%.
The ‘involved’ shares should be determined based on trends in lighting system ‘sales’
and on trends in the type of systems installed (i.e. influence is on sales, flux or hours).
This type of information can probably only be provided by professionals working in the
sector, any information from stakeholders is welcome ).
Indicative methods for estimating Ps, rem and Pf, rem should be defined in
Tasks 5 and 6 based on the parameters calculated in Task 4.
2.2 Generic economic data
2.2.1 Introduction
The aim of 'Generic economic data' according to the MEErP (Annex A) is to give an
overview, for the product group that is the subject of the Ecodesign preparatory study,
of production and trade data as reported in the official EU statistics. The apparent
product sales (=production +import -export) can be derived from these data.
Lighting Systems are designed, sold, installed, commissioned, operated and
maintained and as such they are ‘products’, but they are not actually produced 96,
shipped, imported or exported as a whole sytem. Consequently they are not
distinguished as a product in the Eurostat production and trade statistics (Europroms-
PRODCOM) 97.
The scope of this study as defined in Task 1 is on lighting systems or
installations that are designed to fulfil lighting design requirements
according to standards EN 12464 for indoor lighting and EN13201 for road
lighting. As a consequence a lighting design will require a set of luminaires
for each specific application. This also means that the most appropriate l
market product unit is the floor or road surface area of lighting installations.
Such data can be found in European statistics. Because EN 12464 and EN
13201 are not applicable to residential applications they are excluded from
the market data. It should be noted that not all type of non-residential area is
covered by EN 12464 and EN 13201, see Task 1.
As explained before, the preferred market data approach used in this lighting system
study is to start from the number, sizes and types of buildings in the EU-28, from the
types of spaces in these buildings, and from the number, size/length and types of
roads and (possibly) other outdoor spaces. This information allows the estimation of
the potential number of Lighting Systems, in relation to the types of spaces and
activities. This approach was also followed in the preceding preparatory studies on
office and street lighting98.
95 An ecodesign measure can prescribe minimum product performance parameters, so the main effect would expected to be on Ps,rem , Pf,rem and Ph,rem. The ecodesign measure cannot prescribe that more consumers have to install efficient lighting systems. 96 It could be stated that they are assembled ‘on-site’ 97 http://epp.eurostat.ec.europa.eu/newxtweb/ . There is a NACE rev.2 code 4321 for electrical installations that also comprises ‘lighting systems installation’ but these activities are not included in the production and trade statistics of PRODCOM. 98 http://www.eup4light.net/

Preparatory study on lighting systems
Month Year I 142
Such information is also necessary for the estimation of factors such as the EU-28
total energy savings due to lighting system improvements from a series of possible
savings computed by the study team for individual base cases (cellular offices, open-
plan offices, shops, high-ways, parking lots, etc.): each base case saving has to be
multiplied by the number of such base case spaces in the EU-28 (or by an assumed
share thereof).
Trade data and apparent sales could be derived from Eurostat data for some of the
components of Lighting Systems, in particular for light sources, ballasts/control gear
and luminaire,s and thus could also contribute to provide market insights into installed
lighting systems. For other components such as sensors, controls, dimmers,
communication electronics (WiFi, Zigbee, DALI, etc.), and wiring this is more difficult.
Even if trade and sales data on the components were to be available, it is not an easy
task to derive the number of Lighting Systems installed in the EU-28, because this
would require knowledge of the average number of components in such a system.
The following paragraphs will first examine what trade and sales data are available for
Lighting System components (not necessarily only drawn from Eurostat data). Next,
the number, sizes and types of buildings, roads and spaces are examined.
2.2.2 Sales and stock of light sources
The EU-28 total sales and stock of light sources have been extensively reported in
Tasks 2 and 7 of the Light Sources study 82. These sales volumes are based on a mix
of data from the industry association LightingEurope, from Eurostat and from GfK
market research data. Additional data that could be relevant for the Lighting System
study and that have not been reported in the Light Sources study are included in
Annex C. This annex provides the sales and the stock for the period 1990-2030, for all
base cases, subdivided into the residential and non-residential sector, and organized
per application group (LFL, HID, CFLni, DLS, NDLS). These data are for the BAU-
scenario as defined in Task 7 of the Light Sources study 99.
It can be concluded from these data that LFL T12, LFL T8 halo-phosphor, HPM-lamps,
GLS-lamps and most mains-voltage halogen lamps (except those with G9 and R7s
caps) need not be considered in the study because by 2020 they are no longer sold
and their stock is negligible or zero.
A second conclusion from these data is that classical technology lamp types are
increasingly being substituted by more efficient LED lighting products. Consequently,
the focus in the study should be on the use of LED light sources.
2.2.3 Sales of ballasts and control gears
Eurostat trade and sales data for magnetic and electronic ballast are presented in
Annex D. These data can be summarised as follows:
In 2013 around 600 million magnetic ballasts were sold in EU-28, representing
a total value of around 165 million euros, for an average value of 0.27
euros/ballast.
No clear trend in sales can be identified.
99 That scenario includes the future effects (phase-outs) of current lighting regulations, i.e. 244/2009 stage 6 (mains-voltage non-directional halogen lamps), 1194/2012 stage 3 (mains-voltage directional halogen lamps), and 245/2009 stage 3 (more severe requirements for MH-lamps and for external ballasts), and also includes the expected trend in substitution of classical technology lamp types by LED lighting products.

Preparatory study on lighting systems
Month Year I 143
In 2013 around 70 million electronic ballasts were sold in EU-28, representing
a total value of around 550 million euros, for an average value of 8.11
euros/ballast.
As regards sales quantities there is a downward trend, from 150 million
units in 2006-2007 to 70 million units in 2013.
For several reasons, these Eurostat data are puzzling and remainunreliable 100:
The total number of ballasts sold in 2013, around 670 million units, is high
compared to the number of LFL, CFLni and HID lamps sold (around 450
million), in particular when considering that one ballast often controls more
than one lamp and that ballast useful lifetime is typically longer than the light
source lifetime.
According to the Eurostat data the share of electronic ballasts would be around
10%. However, this is contrary to expectations, contrary to trends elsewhere in
the world (approximately 80% electronic in Australia and Canada; 75%
electronic in the USA in 2005) and contrary to CELMA information from 2010
(see below) that gave 45% electronic ballast sales share in Europe in 2008 with
an increasing trend.
An average magnetic ballast would be expected to weigh not less than 0.5 kg,
which, based on the Eurostat data, would imply a value of around 0.50
euros/kg or less. This looks more like a scrap-value than a value for a new
product being sold.
In a 2010 publication 101, CELMA & ELC (now LightingEurope) provide the annual
numbers of new installed lamps driven by a given type of ballast, for the period 1997-
2008 with a forecast up to 2010, separated into LFL and HID-lamps:
For linear fluorescent lamps, 221 million ballasts were sold in 2008, of which
48% were electronic. The prediction for 2010 was for a share of at least 62%
for electronic ballasts (Figure 2-1).
For high-intensity discharge lamps, 20 million ballasts were sold in 2008, of
which 33% were electronic. The prediction for 2010 was for a share of 41% for
electronic ballasts (Figure 2-2).
The 2010 CELMA&ELC data are considered to be more reliable than the Eurostat data
and will therefore be preferred for the analysis. Extrapolating these data, it is
estimated that currently (2015) 75-80% of the ballasts sold for fluorescent lamps are
of the electronic type, and at least 50% of those sold for HID-lamps.
100 The same conclusion was drawn in a recent CLASP report on LFL’s, see section 2.4.5 in: CLASP, November 2014, “Mapping & Benchmarking of Linear Fluorescent Lighting”. http://clasponline.org/en/Resources/Resources/PublicationLibrary/2014/Benchmarking-Analysis-Linear-Fluorescent-Lighting.aspx 101 Guide of the European Lighting Industry (ELC & CELMA) for the application of the Commission Regulation (EC) No. 245/2009 amended by the Regulation No. 347/2010 setting EcoDesign requirements for “Tertiary sector lighting products”, 2nd edition, September 2010, annex C5 and C6 http://www.lightingeurope.org/uploads/files/CELMA_EcoDesign_%28SM%29258_CELMA_ELC_Tertiary_Lighting_Guide_2nd_Edition_FINAL2_Sept2010.pdf

Preparatory study on lighting systems
Month Year I 144
Figure 2-1 Market share (1997-2008) and expected market share (2009-2010) of
European ballast sales by type for use with linear fluorescent lamps (blue=magnetic
ballast; yellow=electronic ballast; orange=tolerance band) (Source: 101)
Figure 2-2 Market share (1997-2010) of the European ballast sales by type for use
with high-intensity discharge lamps (orange=magnetic ballast; green=electronic
ballast) (Source: 101)
2.2.4 Sales of luminaires
The following Eurostat PRODCOM codes related to luminaires could be relevant as a
reference for this study:
27402200 - Electric table, desk, bedside or floor-standing lamps
27402500 - Chandeliers and other electric ceiling or wall lighting fittings
(excluding those used for lighting public open spaces or thoroughfares)
27403930 - Electric lamps and lighting fittings, of plastic and other materials,
of a kind used for filament lamps and tubular fluorescent lamps

Preparatory study on lighting systems
Month Year I 145
27403300 - Searchlights and spotlights (including for stage sets, photographic
or film studios)
The trade and sales data for the first three codes of luminaires are presented in Annex
L. Luminaires for spotlights have not been reported, but sales are around 10 million
units a year and thus relatively small. Considering the description of code 27402500,
luminaires for lighting of roads and squares seem to be excluded from the reported
data, but no separate NACE code could be found for these luminaires.
In 2013 the total number of luminaires sold (according to Eurostat, for the three
codes) is around 320 million units for a total value around 9700 million euros, with an
average price around 30 euros / luminaire.
In the same year the total number of light sources sold was 1700 million units, for a
total acquisition value (purchase + installation) around 15 000 million euros 102, with
an average value of around 9 euros / light source (incl. VAT for residential, fixed 2010
euros).
Consequently the number of luminaires sold was roughly one fifth of the number of
light sources. This indicates that the average luminaire lifetime is approximately five
times longer than the average light source lifetime, in the assumption of one lamp per
luminaire. Taking into account more lamps per luminaire (e.g. 1,5) would indicate
even lower life times. As the former is usually taken as 20 years, the latter would be
around 4 years, which could be reasonable 103.
It should be noted that these luminaires sales figures include for example residential
luminaires and therefore are not directly applicable for the scope as defined in Task 1.
2.2.5 Sales of sensors
The sensors of main interest for lighting systems are daylight sensors and occupancy
sensors (movement-, presence-, vacancy-sensors). Looking for ‘sensors’ in the NACE
rev. 2 classification, only one code appears (26.51.52.71) but it is related to
measuring pressure and not of interest.
Other keywords have been used to search the list of NACE rev.2 codes for relevant
data, but only one was found:
26.11.22.40 Photosensitive semiconductor devices; solar cells, photo-diodes,
photo-transistors, etc.
The photo-diodes are interesting for daylight detection, but trade and sales data are
combined with those for e.g. solar cells and consequently would be useless for the
purposes of this study.
It is not known under which NACE code manufacturers of daylight- and occupancy
sensors register their products, but it is likely that the same codes also cover other
products. In addition, the same sensors can also be used for different applications to
lighting systems.
Consequently: no useful trade and sales data on sensors for lighting systems is
available from PRODCOM statistics.
102 Data taken from the MELISA model. 103 This does not take into account that several luminaires contain more than one light source …
Preparatory study on lighting systems
Month Year I 146
2.2.6 Sales and stock of dimmers and other control devices
According to CECAPI 104, the following can be stated regarding the sales of phase-cut
dimmers in Europe:
In 2010 5.2 million phase-cut dimmers were sold in Europe 105, corresponding
to 148 million euros in revenue.
In 2013 5.8 million phase-cut dimmers are expected to be sold, corresponding
to 180 million euros in revenue.
In 2010 around 61% of the phase-cut dimmers sold were leading-edge, around
27% trailing-edge and 12% universal.
In terms of revenues the percentages are different because leading-edge
dimmers have a lower cost. In 2010 34% of the revenues from phase-cut
dimmers were for leading-edge types, around 30% for trailing-edge and 36%
for universal types.
Trailing-edge dimmers are popular (accounting for 50% of unit sales or more)
in the Nordic countries and in Germany.
From 2010 to 2013 the growth will be stronger for trailing-edge dimmers than
for leading-edge dimmers because the former are thought to be more suitable
for CFL and LED lamps.
In 2010 approximately 75% of the phase-cut dimmers were sold in the
residential sector, and 25% in the non-residential sector, with only slight
variations of this percentage per type.
In addition CECAPI estimates that the installed base of phase-cut dimmers for Europe
is between 110 and 120 million units in 2010, of which 75% are installed in the
residential sector. Considering that the number of households in EU-28 is around 200
million, this approximately implies that on average half or less of EU households have
a phase-cut dimmer installed (half in the case of one dimmer per household).
As regards other types of dimmers and other lighting control devices, some related
NACE rev. 2 product codes were identified:
26.11.30.03 Multi-chip integrated circuits: processors and controllers, whether
or not combined with memories, converters, logic circuits, amplifiers, clock-
and timing circuits, or other circuits
26.11.30.06 Electronic integrated circuits (excluding multi-chip circuits):
processors and controllers, whether or not combined with memories,
converters, logic circuits, amplifiers, clock- and timing circuits, or other circuits
26.52.28.70 Time switches with clock or watch movement or with synchronous
motor (including switches for making and breaking the circuit supplying
electrical apparatus)
27.33.11.00 Electrical apparatus for switching electrical circuits for voltages ≤
1 kV (including push-button ad rotary switches)(excluding relays)
CPA 27.12.24 Relays, for a voltage ≤ 1000 V
CPA 27.33.13 Plugs, sockets and other apparatus for switching or protecting
electrical circuits n.e.c.
This list is probably not complete: there is a wide variety of components that are used
in lighting control and the list of potentially applicable NACE codes is long. In addition
104 Information communicated by CECAPI to the study team on Light Sources, also reported in the Task 3 report section 7.2.8 of that study. 105 Actually the countries covered by the study are France, Germany, Italy, UK, Denmark, Finland, Norway, Sweden, both residential and non-residential sectors.

Preparatory study on lighting systems
Month Year I 147
the listed items are also used for other purposes than lighting control. Consequently it
has not been deemed useful to report the corresponding trade and sales data.
It should be noted that these light control sales figures cannot directly be linked to the
scope as defined in Task 1, for example those for residential application are not within
the scope.
Any additional sales information on lighting controllers provided by preffesionals
within the sector, is welcome..
2.2.7 Sales of communication devices for lighting systems
The following NACE codes have been identified as possibly covering the trade and
sales data of communication devices used in lighting systems:
26.12.20.00 Network communications equipment (e.g. hubs, routers,
gateways) for LANs and WANs and sound, video, network and similar cards for
automatic data processing machines
26.30.23.70 Other apparatus for the transmission or reception of voice,
images or other data, including apparatus for communication in a wired or
wireless network (such as local or wide area network) other than transmission
or reception apparatus of HS 8443, 8525, 8527 or 8528.
The same remarks apply as made for control devices above: the list is not complete
and the same devices used in lighting systems can also be used for other purposes.
Consequently, no sales data are reported here.
2.2.8 Sales and stock of wiring for lighting systems
NACE code 27.32 regards the ‘Manufacture of other electronic and electric wires and
cables’. However, any trade and sales data would not be specific for lighting systems.
Cable losses fom lighting circuits were already studied in the ‘Preparatory Studies for
Product Group in the Ecodesign Working Plan 2012-2014: Lot 8 - Power Cables’106,
this study contains more market and stock data. Cables are considered outside the
scope of this study, because they were already part of another study.
2.2.9 Quantity, size and types of non-residential buildings and indoor spaces
Aim
As explained in section 2.2.1, this study will estimate the potential savings due to
improved lighting systems for individual application base cases (cellular offices, open-
plan offices, shops, manufacturing areas, circulation areas, etc.). For the derivation of
the total EU-28 savings from these basic calculations, two approaches have been
indicated:
1) Insert the base case savings in the MELISA model using the factors Fsales, Fphi
and Fhour (see section 2.1.2 and 0).
2) Multiply the savings for the individual base case spaces by the number of such
spaces in the EU-28 (or by a share thereof).
In the latter case it is convenient to express the base case savings per unit of area
(e.g. kWh/m2/a or euros/m2) and to express the number of such spaces in the EU-28
as an area (m2), so that the multiplication of the two provides the total EU-28 savings.
106 http://erp4cables.net/
Preparatory study on lighting systems
Month Year I 148
This sectionconcentrates on the latter approach and tries to estimate the subdivision
of the total EU-28 non-residential building area over the various types of
buildings/sectors and over the types of spaces/activities within these buildings.
Sources
The reference areas for lighting in non-residential buildings have been derived starting
from the report on EU-28 Building Heat Demand 107. This report was prepared on
request of the European Commission, with the aim to harmonize the basic data used
in EU-studies regarding heating, cooling and ventilation of buildings. Amongst other
aspects, this report provides the total EU-28 heated surface area per type of building
(i.e. counting not only covered ground area, but also considering the average number
of stories per building).
The report 107 is based on a variety of sources, including: GIS-based assessment of
land coverage and usage (LUCAS, previously CORINE), land registry data, statistics of
building permits, census data (population-wide questionnaire data conducted by EU
Member States typically every ten years), monetary and real estate data, urban
planning guides, analogy with the better-known residential buildings (e.g. building
volume per capita), architectural guidelines, architectual data for reference buildings,
economic activity (NACE) statistics, reverse engineering from energy use and sales of
heating systems, information from the European Climate Change Programme, joint
efforts of the national statistics offices, data from the Energy Performance of Buildings
Directive, Ecodesign preparatory studies on boilers, ventilation units and air
conditioners, and other sources.
Considering that the data sources for the report are considerably wider than just
Eurostat statistics, that the area survey was developed specifically to harmonize the
data used in EU-studies, and that the total indoor lit area would be expected to closely
correspond to the heated area, the above report107 has been used as the preferred
source in this study.
The area data per type of building/sector from the Building Heat Demand report were
integrated with data on the subdivision of non-residential buildings in types of
rooms/spaces (offices, circulation areas, toilets, technical and service areas, etc.)
provided in the same report and in other sources. In addition, data from the European
Parking Association regarding parking in structures have been used 108.
With regards to the subdivision of the lit areas by type of buildings and into the types
of rooms/spaces/activities within those buildings, an attempt has been made to follow
(as far as available data allowed) the breakdowns used in EN-15193 and EN-12464 for
the definition of default potential operating hours, absence factors, and minimum
lighting requirements.
Non-residential building area per type of building
The result of the area-analysis per type of non-residential building is shown in Table
2-4; for additional information see Annex F.
107 “Average EU building heat load for HVAC equipment”, final report, René Kemna (VHK) for the European Commission, August 2014 (chapter 4, volumes and surfaces) 108 ‘Scope of Parking in Europe – Data Collection by the European Parking Association’, 2013, http://www.europeanparking.eu/cms/Media/Taskgroups/Final_Report_EPA_Data_Collectionort_final_web1%20.pdf
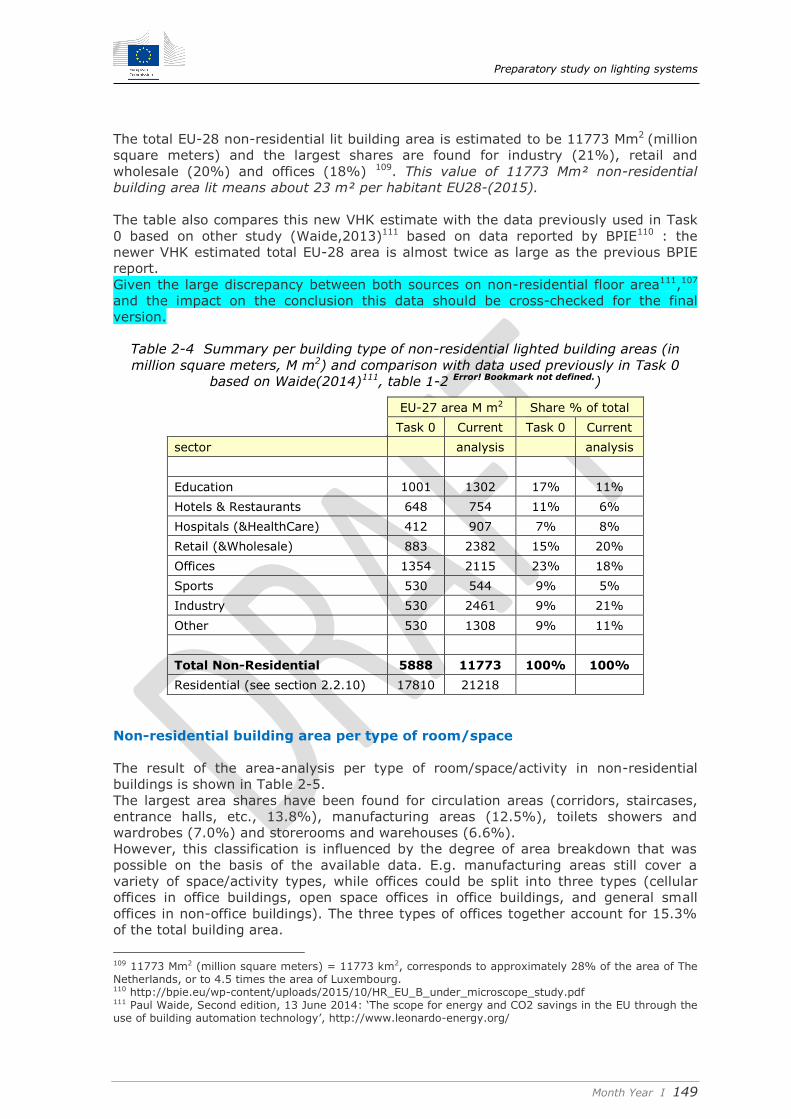
Preparatory study on lighting systems
Month Year I 149
The total EU-28 non-residential lit building area is estimated to be 11773 Mm2 (million
square meters) and the largest shares are found for industry (21%), retail and
wholesale (20%) and offices (18%) 109. This value of 11773 Mm² non-residential
building area lit means about 23 m² per habitant EU28-(2015).
The table also compares this new VHK estimate with the data previously used in Task
0 based on other study (Waide,2013)111 based on data reported by BPIE110 : the
newer VHK estimated total EU-28 area is almost twice as large as the previous BPIE
report.
Given the large discrepancy between both sources on non-residential floor area111,107
and the impact on the conclusion this data should be cross-checked for the final
version.
Table 2-4 Summary per building type of non-residential lighted building areas (in
million square meters, M m2) and comparison with data used previously in Task 0
based on Waide(2014)111, table 1-2 Error! Bookmark not defined.)
EU-27 area M m2 Share % of total
Task 0 Current Task 0 Current
sector
analysis
analysis
Education 1001 1302 17% 11%
Hotels & Restaurants 648 754 11% 6%
Hospitals (&HealthCare) 412 907 7% 8%
Retail (&Wholesale) 883 2382 15% 20%
Offices 1354 2115 23% 18%
Sports 530 544 9% 5%
Industry 530 2461 9% 21%
Other 530 1308 9% 11%
Total Non-Residential 5888 11773 100% 100%
Residential (see section 2.2.10) 17810 21218
Non-residential building area per type of room/space
The result of the area-analysis per type of room/space/activity in non-residential
buildings is shown in Table 2-5.
The largest area shares have been found for circulation areas (corridors, staircases,
entrance halls, etc., 13.8%), manufacturing areas (12.5%), toilets showers and
wardrobes (7.0%) and storerooms and warehouses (6.6%).
However, this classification is influenced by the degree of area breakdown that was
possible on the basis of the available data. E.g. manufacturing areas still cover a
variety of space/activity types, while offices could be split into three types (cellular
offices in office buildings, open space offices in office buildings, and general small
offices in non-office buildings). The three types of offices together account for 15.3%
of the total building area.
109 11773 Mm2 (million square meters) = 11773 km2, corresponds to approximately 28% of the area of The Netherlands, or to 4.5 times the area of Luxembourg. 110 http://bpie.eu/wp-content/uploads/2015/10/HR_EU_B_under_microscope_study.pdf 111 Paul Waide, Second edition, 13 June 2014: ‘The scope for energy and CO2 savings in the EU through the use of building automation technology’, http://www.leonardo-energy.org/

Preparatory study on lighting systems
Month Year I 150
Table 2-5 Summary per room type of EU-28 total non-residential lighted building
areas (million m2)
Subdivision per type of space in
Non-Residential buildings
EU-28 area M m2
Share %
of total
Circulation areas 1620 13.8%
Manufacturing area 1476 12.5%
Toilets, showers, wardrobes 829 7.0%
Storeroom / Warehouse 774 6.6%
Offices (cellular) 660 5.6%
Shops < 30 m2 643 5.5%
Offices (open space) 609 5.2%
Class rooms and similar 573 4.9%
Offices (general, small) 112 525 4.5%
Technical / service areas 502 4.3%
Eating / drinking areas 496 4.2%
Shops > 30 m2 402 3.4%
Meeting rooms 362 3.1%
Theatre, Dancing, Amusement park 358 3.0%
Parking in structures 290 2.5%
Sports Hall 242 2.1%
Hospital wards/bedrooms 191 1.6%
Examination / Treatment Rooms 180 1.5%
Waiting areas 179 1.5%
Political and religious (incl. churches) 152 1.3%
Video and Movie production and Cinemas 152 1.3%
Hotel rooms (excl. toilet/shower) 138 1.2%
Libraries, museums, zoo 112 1.0%
Radio and TV 107 0.9%
Laboratories 66 0.6%
Kitchens 60 0.5%
Waste disposal / sewage 37 0.3%
Prisons 34 0.3%
Fire service activities 4 0.0%
Total non-residential building area 11773 100.0%
Cross check 1: required and installed lighting capacity
The areas per room/space type reported above have been verified as regards their
implications for some characteristic lighting parameters.
As a first verification step, the EU-28 total areas (m2) per room/space type have been
multiplied by their respective minimum lighting requirements from EN 12464-1:2007
(lux = lm/m2) to obtain an EU-28 total required lighting capacity (lm) at task level 113.
112 Offices (cellular) and Offices (open space) are in office buildings. Offices (general, small) are in other building types, e.g. small administrative or management office in a supermarket, in a sports hall, or in a hospital. 113 Including not only the task area itself, but also the surrounding and background areas, but always at ‘task level’, as opposed to ‘light source level’.
Preparatory study on lighting systems
Month Year I 151
This result is compared with the EU-28 total installed lighting capacity at light source
level as computed in the MELISA model, based on sales quantities of light sources and
average lighting capacities per light source type.
Details on this verification step can be found in Annex E.
The main conclusion is that the two computation methods are compatible. The total
EU-28 required lighting capacity for non-residential buildings is 3648 Glm at task level.
The MELISA model for 2013 gives an installed lighting capacity of 5660 Glm at light
source level. This would imply an average utilization factor of 3648/5660 = 64%, a
value that could be considered reasonable. It should be noted that this value might
lower if the floor area is overestimated, see section 2.2.9.
Other conclusions that have been drawn from this step are:
Office buildings account for 25% of the required lighting capacity, followed by
Manufacturing/Industry (24%), Retail/Wholesale/Trade (15%) and Educational
Buildings (12%). All other building types together account for 25%.
Among room/activity types, circulation areas have the largest area share
(13.8%), but they have a relatively low lighting requirement and consequently
represent ‘only’ 6.4% of the total required lighting capacity.
Manufacturing areas have the highest share (16.2%) of the total required
lighting capacity, but this is also due to the fact that this item is not further
subdivided.
Offices have been split in cellular offices (9.0%), open space offices (9.6%),
and general-small offices (7.2%) 114 that together account for 25.8% of the
total required lighting capacity.
When small shops (6.2%) and large shops (3.9%) are taken together they
represent 10% of the total required lighting capacity.
Meeting rooms (5.7%), class rooms (5.3%) and toilets/showers/wardrobes
(5.3%) have comparable total required lighting capacities.
Cross check 2: installed lighting power
As a second verification step, the installed lighting power is determined by multiplying
the required lighting capacities (lm at task level from the first step) by the power
density values Pjlx (W/m2/lux = W/lm) suggested in prEN15193-1:2014 table C.1.
These values depend on room surface dimensions and reflection factors, the height
distance between luminaire and task plane, and the upward flux fractions (UFF) of the
luminaires (direct or indirect lighting). The Pjlx values are valid for a maintenance
factor MF=0.8 and for an overall luminaire/light source efficacy of 60 luminaire lumens
per Watt.
This result is compared with the EU-28 total installed lighting power as computed in
the MELISA model, based on sales quantities of light sources and average powers per
light source type.
114 The first two types are inside office buildings, the latter are offices in other buildings.

Preparatory study on lighting systems
Month Year I 152
Details on this cross check can be found in Annex E.
The values calculated from EU-total areas per room type correspond surprisingly well
with those computed in MELISA. In particular:
The total EU-28 installed lighting power in non-residential buildings,
considering a maintenance factor MF=0.8, and an efficacy of 60 luminaire
lumens per circuit Watt, is estimated at 87 GW. For this assumption we will
refer to ‘60 lm/W maintained luminaire efficacy’. Using the MELISA mix of lamp
types for the indoor non-residential sector and the corresponding efficacy
correction factors of prEN 15193, a correction factor FL=1.28 results, and the
estimate for the installed power would become 87*1.28 = 111 GW. The
MELISA model for 2013 gives an installed lighting power of 106 GW, which is a
very close match.
The estimated power density is 7.4 W/m2 assuming 60 lm/W maintained
luminaire efficacy , which should be corrected to 7.4*1.28 = 9.5 W/m2 if the
MELISA mix of lamp types is assumed. The MELISA value for 2013 is 9.0 W/m2.
All these values are relative low in comparison to the maximum illumination
power per square meter that for example are used in Australian building codes
(see 1.5.3.1) or in the US ASHREA 90.1 standard (see 1.4.3.4). Therefore this
might imply that the current stock is already optimised in terms of installed
power per m² or it might indicate that the stock area for this comparison is
overestimated.
Other conclusions that have been drawn from the second verification step are:
With respect to the building/sector types, the percentage shares of total
installed lighting power are close to the percentage shares of total required
lighting capacity at the task level. The reason for this is that all power density
values Pjlx are estimated to be close to the average of 0.030 W/m2/lux (values
vary from 0.029 to 0.032, with the exception of parking areas that have
0.022). In part this small variation in Pjlx values is also caused by the
application of the same efficacy of 60 luminaire lumens per circuit Watt for all
building types.
With respect to entire buildings/sectors, the installed power density is highest
for office buildings (9.8 W/m2 @ 60 lm/W maintained luminaire efficacy),
followed by Education (8.5 W/m2), Industry (8.1 W/m2) and Sports (7.7
W/m2). By far the lowest density is found for parking areas (1.3 W/m2).
With respect to room/activity types, the spread in Pjlx values is higher, ranging
from 0.024 W/m2/lux for open offices to 0.036 for small shops. The difference
between open offices (0.024) and cellular offices (0.032) is noteworthy.
With respect to room/activity types, the installed power density is highest for
meeting rooms (13.8 W/m2 @ 60 lm/W maintained luminaire efficacy), small
offices (13.4), kitchens (13.0), cellular offices (12.9), laboratories (12.4),
examination/treatment rooms (11.6) and open offices (11.1). The smallest
values are estimated for parking areas (1.3 W/m2 @ 60 lm/W maintained
luminaire efficacy), storerooms/warehouses (2.3), churches (3.5), circulation
areas (3.7) and hospital wards/bedrooms (4.4).
The EU-28 total installed powers (@ 60 lm/W maintained luminaire efficacy)
are highest for manufacturing areas (12.8 GW), cellular offices (8.5 GW),

Preparatory study on lighting systems
Month Year I 153
general small offices (7.0 GW), open space offices (6.8 GW), shops < 30 m2
(6.4 GW), circulation areas (6.0 GW), toilets, showers and wardrobes (5.3 GW)
and meeting rooms (5.0 GW). These space types together represent 66% of
the total EU-28 installed power. The short list of areas could guide the choice of
the base case spaces to consider for the analysis of savings due to improved
lighting systems.
Cross check 3: operating hours and energy consumption.
As a third verification step, the lighting energy consumption is derived by multiplying
the installed powers of the previous step by the annual operating hours. The
multiplication itself is trivial; the problem is in establishing the operating hours for
each room/space type.
The potential operating hours have been taken from prEN 15193 table B.2.3.2 (see
also Annex F 2.2 of this note). Annex F 2.2 explains in detail how these l maximum
annual reference operating hours from the standard have been reduced to estimated
actual (full-power equivalent) hours based on the standard by means of the
application of occupancy dependent factors, daylight dependent factors and constant
illuminance factors. Four values for the annual operating hours are determined (and
hence four values for the energy consumption), depending on the daylight availability
(low or medium) and on the type of daylight dependent control (manual or best-
automatic).
The same Annex F also includes comments on the potential operating hours proposed
in prEN 15193. In addition the determination of a European average for the mentioned
factors (even if for a specific room type) is rather complex, and the results have a
large error margin. Consequently the results for the operating hours (and for the
derived energy consumption) are more uncertain than those for installed capacity and
power presented above.
The details of results of the analyses regarding operating hours are presented in
Annex E.
The main conclusion is that the average annual operating hours as used in MELISA for
the light sources of the non-residential sector are considerably lower (1467 h/a) than
those derived from the potential hours in EN 15193 (2538 - 2739 h/a for manual
controls and 1858 - 2120 h/a for best automated controls).
nevertheless, it is noteworthy that the values derived from EN 15193 compare well to
the hours used in MELISA for linear fluorescent lamps (2200 h). A potential
explanation is that MELISA also has a large quantity of incandescent, halogen and CFL
light sources included in the non-residential sector, for which lower annual operating
hours are assumed, and these lamps pull the power-weighted average down to 1467
h/a. Most likely incandescent, halogen and CFL lamps are used in retail, hotel and
restaurants or any other areas that are outside the scope proposed in Task 1 related
to EN 12464. In the total EU28 data used 41 % was allocated to the retail and
industrial manufacturing sector, see 2.2.9. Also, the total area per habitant in the total
non-residential sector was above 21 m² which also indicates that much of this
estimated area should be unoccupied. Combining both, it could also indicate that in
particular in the retail and industrial sector much of the area is storage or unrented

Preparatory study on lighting systems
Month Year I 154
which could lower average annual hours. This level of detail (per lamp type) is more
difficult to consider in the EN 15193 approach 115.
The difference between the two estimates confirms that lighting operating hours for
the indoor non-residential sector are among the most difficult lighting parameters to
establish.
Other conclusions that have been drawn from the analysis of annual operating hours
are:
With respect to building types, the highest annual operating hours are
estimated for stations/airports (2849-4736 h/a), retail sector (3454-4416 h/a)
and healthcare sector (2699-3854 h/a). The lowest hours have been found for
Education (668-1248 h/a) and Offices (1158-1869 h/a).
With respect to room/activity types, the highest annual operating hours are
estimated for shops (3770-4610 h/a), prisons (3770-4610 h/a), laboratories
(3040-4430 h/a) and hospital wards/bedrooms (3380-4220 h/a). The lowest
hours have been found for technical/service areas (461-1078 h/a), class rooms
(706-1359), meeting rooms (855-1499) and libraries and museums (871-1581
h/a).
The energy results are summarised in Annex F.4 and from this the following
conclusions can be drawn:
The estimate for the EU-28 annual lighting energy for non-residential buildings
is between 190 and 220 TWh/a when the EN 15193 reference efficacy of 60
luminaire lumen per circuit Watt is assumed.
Assuming the MELISA-mix of indoor non-residential lamp types and the
correction factors FL suggested in EN 15193, the above energy consumption
can be corrected to 240-280 TWh/a.
The comparable MELISA value (inclusive of ballast energy) is 155 TWh/a and
hence much lower than the estimate derived from the EN 15193 approach
using the estimated EU-28 total room areas. This difference is almost entirely
due to a difference in annual operating hours (see above).
The overall average energy density (LENI) for EU-28 non-residential buildings
is 14-20 kWh/m2/a (@ 60 lm/W maintained luminaire efficacy), without
correction for constant illuminance control). The corresponding 2013-value
from MELISA is 13 kWh/m2/a.
As regards building types/sectors, the highest lighting energy is estimated for
manufacturing/industry (38-61 TWh/a), for the retail sector (47-60 TWh/a) and
for office buildings (24-39 TWh/a). The highest energy density is found for
stations/airports (18-31 kWh/m2/a) and for hospital/healthcare (20-28
kWh/m2/a). Excluding parkings, the lowest energy density is found for
educational buildings (6-11 kWh/m2/a).
115 It would require diversifying absence factors and daylight factors per lamp type rather than per room type. In other words, it should be established for each room type what part of the lamps is LFL, CFL, halogen or incandescent, and if different lamp types should have different factors.

Preparatory study on lighting systems
Month Year I 155
As regards room/activity types, the highest annual lighting energy is estimated
for manufacturing areas (27.5-42.5 TWh/a), although this is exceeded if the
three office types are taken together ( 31.9-49.4 TWh/a). The highest energy
density is found for laboratories (38-55 kWh/m2/a), small shops (38-46
kWh/m2/a) and examination/treatment rooms (26-41 kWh/m2/a). Low density
values are found for parking areas (1-3 kWh/m2/a), technical/service areas (3-
6), political activities/churches (4-8) and warehouses (5-9). This could guide
the choice of the base case spaces to consider for the analysis of savings due
to improved lighting systems.
2.2.10 Quantity, size and types of residential buildings and indoor spaces
Note: This section is for information only because residential buildings are not within
the scope of Task 1.
The data in Table 2-6 have also been taken from the Building Heat Demand report and
show a total EU-28 residential building area of 21218 Mm2. This is relatively close to
the estimate of 17810 Mm2 that was used in the Lot 37 exploratory study Error! Bookmark
not defined..
Table 2-6 EU28-2010 RESIDENTIAL SECTOR BUILDINGS numbers and geometry (Source: VHK 2014 107)
RESIDENTIAL SECTOR, Category Number of
blocks Number of dwellings
Area A/unit
only primary dwellings taken into account
M units M units M m² m²
Detached dwellings 34 34 4385 128
Semi-detached (2 dwellings/block) 20 39 4700 128
Terraced houses (block of 15
dwellings) 2.3 35 3824 128
Single family/duplex dwellings 56 108 12909
City blocks (130 apartments)
12.8 102 8310 81 Low-rise detached apartment blocks (25 app.)
High-rise apartment blocks (130 apartments)
Multi-family dwellings 13 102 8310
TOTAL RESIDENTIAL SECTOR 68 210 21218 0
As regards the breakdown of this area by room type, the Building Heat Demand report
provides 2013 data for a reference dwelling in Germany 116 117 (Table 2-7):
Table 2-7 Breakdown of floor area for a reference dwelling in Germany 2013 (Extract from 116)
116 Forschungsstelle für Energiewirtschaft (FfE), Bewertung und Vergleich flächenspezifischer Größen – Auf die Definition kommt es an, BWK Bd. 65 (2013) Nr. 5. 117 As also shown in Table 11 of the Building Heat Demand report, the (heated and lighted) residential building area depends on the source. There are differences depending on definition between e.g. floor area, habitable surface, useful area, net floor area, etc.. For example DIN 277 does not consider the 13 m2 for hall way as useful area (but it is lighted); also terraces are not always counted (but often lighted).

Preparatory study on lighting systems
Month Year I 156
All surfaces in m² Floor area
Living room 33
Kitchen 14
Bathroom 10
Hallway 13
Toilet 5
Bedroom 17
(Terrace) (8)
Total reference floor area
92 (100)
Other reference area data for lighting in residential buildings can be found in e.g. EN
15193 ( see Table 2-8).
Table 2-8 Reference useful areas for the lighting of rooms in residential buildings
(Source: table B.3.3.8 of prEN 15193-1:2014(E))
2.2.11 Quantity, length and types of roads
Eurostat provides road transport infrastructure statistics 118, that contain the following
road categories:
- Motorways, which belong typically to EN 13201-2 oe CIE 115 road class M (see
Task 3 for typical road infrastructure geometry and surface). Total length
reported is 63.660 km in EU28 (2010), with large networks in Spain, France
and Germany.
- E-roads: which also belong typically to EN 13201-2 oe CIE 115 road class M
(see Task 3 for typical road infrastructure geometry and surface). Total length
reported is 42.409 km in the EU28 (2010).
- State, province and communal roads, which belong typically to EN 13201-2 oe
CIE 115 road class C (see Task 3 for typical road infrastructure geometry and
surface). Total length reported is 3.616.472 km in the EU28 (2010).
118 http://ec.europa.eu/eurostat/web/transport/data/database
Preparatory study on lighting systems
Month Year I 157
- Other roads inside or outside built up areas: which also belong typically to EN
13201-2 oe CIE 115 road class P (see Task 3 for typical road infrastructure
geometry and surface). Total length reported is identical to -state, province
and communal roads.
This data is incomplete, because years and counties are missing, and therefore
derived and processed data sources will be used. Also there is no clear distinction in
data between -state, province and communal roads and other roads inside or outside
built-up areas.
Another source for information on the lengths of different road types in the different
EU-28 Member States is “European Road Statistics” of the European Road Federation
for 2011119.
This data does not include statistics on lit roads, therefore further processing is
necessary.
119 ERF, European Road Statistics 2011, http://www.irfnet.eu/index.php/publications/publications/european-road-statistics-handbook
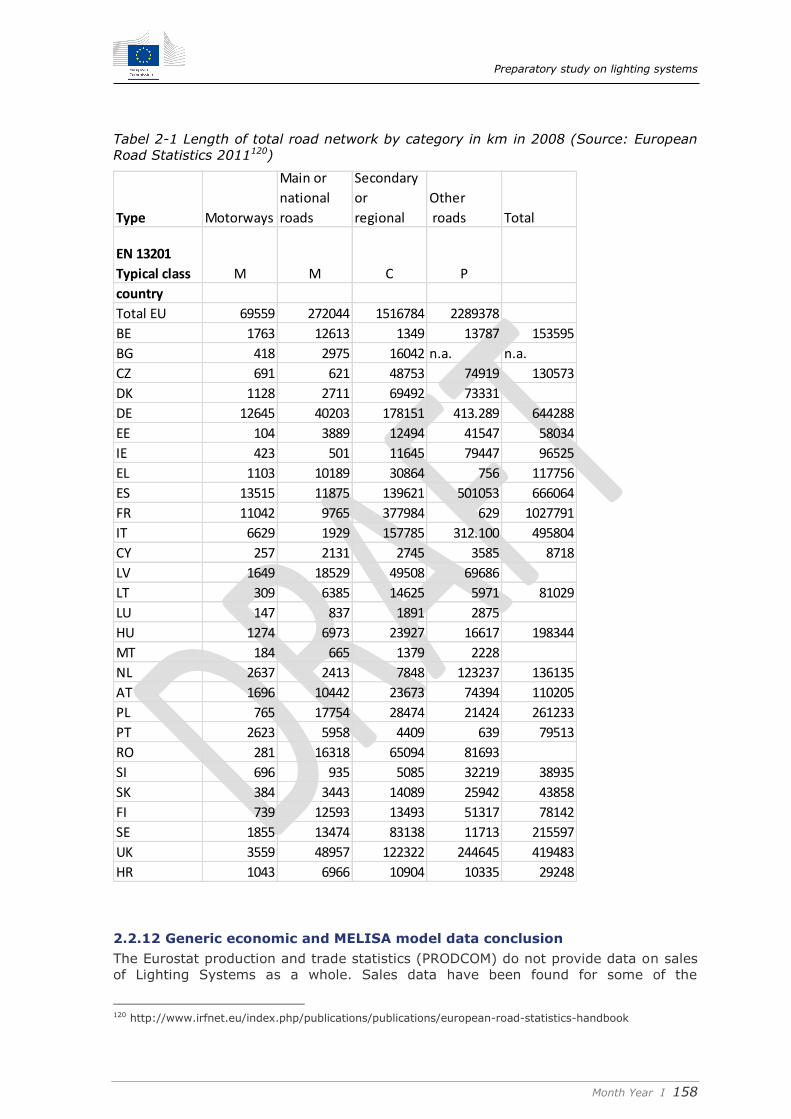
Preparatory study on lighting systems
Month Year I 158
Tabel 2-1 Length of total road network by category in km in 2008 (Source: European
Road Statistics 2011120)
2.2.12 Generic economic and MELISA model data conclusion
The Eurostat production and trade statistics (PRODCOM) do not provide data on sales
of Lighting Systems as a whole. Sales data have been found for some of the
120 http://www.irfnet.eu/index.php/publications/publications/european-road-statistics-handbook
Type Motorways
Main or
national
roads
Secondary
or
regional
Other
roads Total
EN 13201
Typical class M M C P
country
Total EU 69559 272044 1516784 2289378
BE 1763 12613 1349 13787 153595
BG 418 2975 16042 n.a. n.a.
CZ 691 621 48753 74919 130573
DK 1128 2711 69492 73331
DE 12645 40203 178151 413.289 644288
EE 104 3889 12494 41547 58034
IE 423 501 11645 79447 96525
EL 1103 10189 30864 756 117756
ES 13515 11875 139621 501053 666064
FR 11042 9765 377984 629 1027791
IT 6629 1929 157785 312.100 495804
CY 257 2131 2745 3585 8718
LV 1649 18529 49508 69686
LT 309 6385 14625 5971 81029
LU 147 837 1891 2875
HU 1274 6973 23927 16617 198344
MT 184 665 1379 2228
NL 2637 2413 7848 123237 136135
AT 1696 10442 23673 74394 110205
PL 765 17754 28474 21424 261233
PT 2623 5958 4409 639 79513
RO 281 16318 65094 81693
SI 696 935 5085 32219 38935
SK 384 3443 14089 25942 43858
FI 739 12593 13493 51317 78142
SE 1855 13474 83138 11713 215597
UK 3559 48957 122322 244645 419483
HR 1043 6966 10904 10335 29248
Preparatory study on lighting systems
Month Year I 159
components of lighting systems, in particular for light sources, ballasts / control gears,
luminaires and phase-cut dimmers. For other control devices, sensors, communication
devices and wiring, no specific sales information related to their use in lighting
systems has been found.
Although sales data for Lighting Systems are difficult to determine, there is no doubt
that the eligibility criterion of Art. 15-2a of Directive 2009/125/EC is met, because the
quantity of new lighting installations is well above 200 000 units per year.
Two methods have been identified to compute the savings due to improved lighting
systems. The first method uses MELISA and the system influence factors Fsales, Fphi
and Fhour discussed in sections 2.1.2 and 0. The second method consists in
multiplying the computed savings per unit of building area or road length for the base
case spaces (indoor or outdoor; kWh/m2/a, euros/m2/a, kWh/km/a, euros/km/a) by
the quantity of such spaces in the EU-28 (in m2 or km). For this reason the report
provides the EU-28 total areas of non-residential buildings, subdivided per building
type and per room type, the total areas of residential buildings, and the EU-28 total
lengths of roads.
In a cross-check, the reported areas for rooms/spaces in non-residential buildings
were used in combination with information, methods and requirements from the
standards EN 12464-1 and EN 15193 to compute the EU-28 total lighting requirement
(expressed in terms of lumens at the task level), the EU-28 total installed lighting
power, and the EU-28 total lighting energy consumption. Lighting capacity and power
were found to be in good agreement with the values from the MELISA model that were
computed in a completely different manner, based on light source sales quantities and
average light source characteristics (lumen, power, efficacy).
For lighting energy, the estimate using building areas leads to a higher indoor non-
residential lighting energy (240-280 TWh/a) than the MELISA model (155 TWh/a).
There are many factors both in this estimate based on EN 15193 and the MELISA
model that can explain such differences. EN 15193 uses default operating hours per
type task area which are corrected downwards based on occupancy and daylight data
and their types of associated control system. These occupancy and daylight correction
factors as defined in EN 15193 will be further discussed and analysed in more detail in
Task 3 on Users. The real data related to occupancy and daylight in the existing stock
are however often unknown. As explained before (see 2.2.9), this deviation from the
standard operating hours might be allocated to particular area’s such as storage area’s
used in retail and industry with low operating hours. Therefore one explanation might
be lower operating hours in MELISA compared to the EN 15193 estimate. In section
2.2.9 it was also suggested that the main deviation might come from operating hours
for incandescent, halogen and CFLi lamps used in the non-residential sector. It is
unlikey that these lamps are used for area’s defined in the scope of this study that is
limited to area’s for indoor work places where standard EN 12464 can be applied.
Such area’s that are therefore excluded from the scope could be found in within
hotels, restaurants and shops that use ambient lighting not following EN 12464.
Despite all this, many other factors than annual operating hours could explain such
differences, such as in EU 28 estimated annual energy consumption. For example, in
MELISA the lamp life times ( 13000 h for LFL T8t, 12000h for HPS, 8000h for HPM)
and/or the average lamp wattages (30 W for LFL T8t, 121 W for HPS, 208 W for HPM)
could be in the real stock higher as assumed resulting in an underestimated energy
consumption. Finally there are also uncertainties on the total estimated building stock
area and their relative shares of different types of task areas (office, corridor, storage,
etc.). This MELISA cross-check analysis used a total of 11,77 Bn m² non-residential

Preparatory study on lighting systems
Month Year I 160
building area lit (source: VHK (2014)121). It is above 23 m² lit non-residential indoor
area per habitant in the EU28 (2015), which is relatively high and therefore occupancy
could be low and/or the stock area could be overestimated. For comparison Task 0
used only 5,800 Bn m² non-residential building area based on BPIE market data72,110.
A smaller non-residential area would result in a higher LENI estimate, e.g.
13x11.8/5.8 = 26 kWh/(m².y) which is more in line with LENI data used in field
applications such as illustrated in section 1.5.2.4. More accurate building stock data
from stakeholders is welcome.
Given these considerations and for the purpose of this study we think that both
modelling approaches are valid and useful for this study. More precise metrics of the
lighting stock do not currently seem to be available; however, we believe that the
uncertainties are not so significant as to merit discontinuation of the study nor to
unduly delay any implementing measures in the context of Ecodesign Regulation122. In
Task 7 a sensitivity analysis could allow a better understanding of the importance of
these differences and result in a closer estimate for impact accounting of policy
measures. In further tasks calculations will be done based on EN 15193 reference
values, with a sensitivity analysis for lower annual operating hours in Task 7.
According to our analysis, the types of indoor non-residential spaces with the
highest energy impact in EU-28 are: offices, manufacturing areas, shops
(retail), circulation areas and toilets/showers/wardrobes. Together these
spaces consume almost 70% of the total EU-28 indoor non-residential lighting energy.
Base case analyses will concentrate on these space types.
2.2.13 Additional market and stock data for indoor lighting
2.2.13.1 2007 installed base lighting control (lot 8)
The following data can be reused from the preparatory study on office lighting lot 898:
Generally a lighting control (mechanism) can be classified in switch or modulation
control, manual or automatic control, and central or local control. Although almost
every combination is possible, the most frequently used systems are: automatic local
switching on by presence or occupancy detection, automatic time switch, automatic
local daylight compensation and of course the classic manual switches which can be
local or central.
121 Average EU building heat load for HVAC equipment”, final report, René Kemna (VHK) for the European Commission, August 2014 (chapter 4, volumes and surfaces) 122 Article 15 (a) in the Ecodesign Directive 2009/125/EC says ‘consider the life cycle of the product and all its significant environmental aspects, inter alia, energy efficiency. The depth of analysis of the environmental aspects and of the feasibility of their improvement shall be proportionate to their significance. The adoption of ecodesign requirements on the significant environmental aspects of a product shall not be unduly delayed by uncertainties regarding the other aspects’
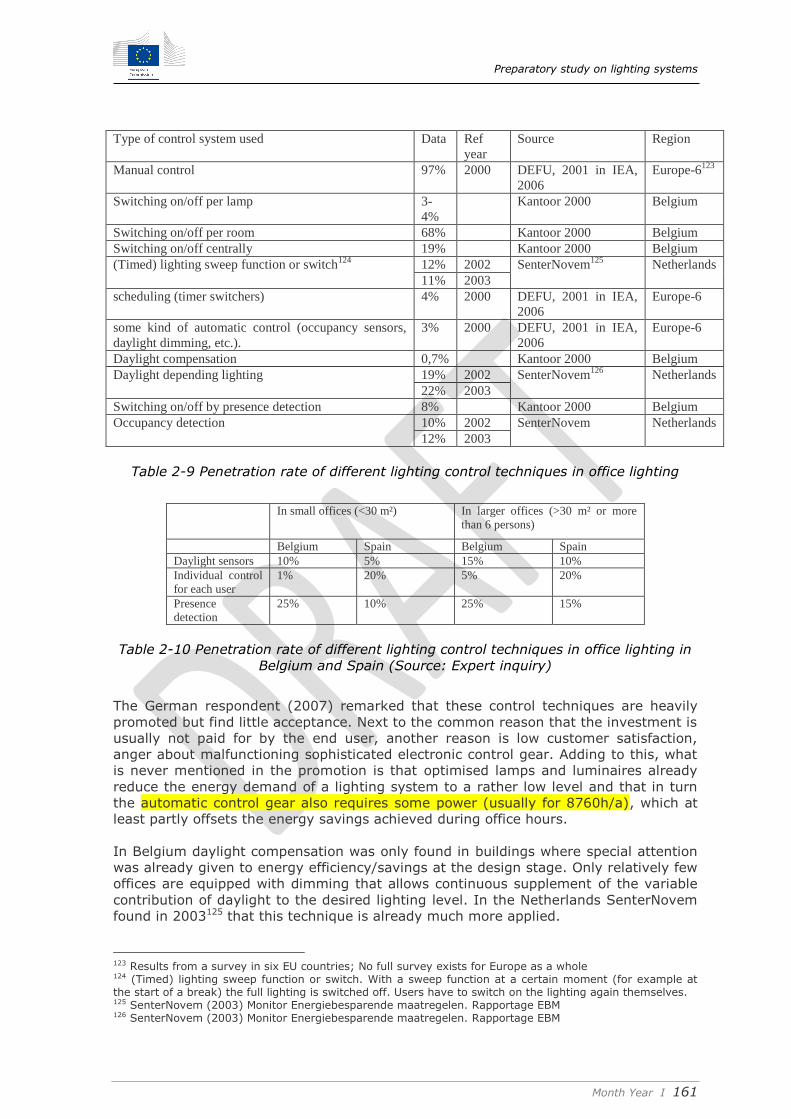
Preparatory study on lighting systems
Month Year I 161
Type of control system used Data Ref
year
Source Region
Manual control 97% 2000 DEFU, 2001 in IEA,
2006
Europe-6123
Switching on/off per lamp 3-
4%
Kantoor 2000 Belgium
Switching on/off per room 68% Kantoor 2000 Belgium
Switching on/off centrally 19% Kantoor 2000 Belgium
(Timed) lighting sweep function or switch124
12% 2002 SenterNovem125
Netherlands
11% 2003
scheduling (timer switchers) 4% 2000 DEFU, 2001 in IEA,
2006
Europe-6
some kind of automatic control (occupancy sensors,
daylight dimming, etc.).
3% 2000 DEFU, 2001 in IEA,
2006
Europe-6
Daylight compensation 0,7% Kantoor 2000 Belgium
Daylight depending lighting 19% 2002 SenterNovem126
Netherlands
22% 2003
Switching on/off by presence detection 8% Kantoor 2000 Belgium
Occupancy detection 10% 2002 SenterNovem Netherlands
12% 2003
Table 2-9 Penetration rate of different lighting control techniques in office lighting
In small offices (<30 m²) In larger offices (>30 m² or more
than 6 persons)
Belgium Spain Belgium Spain
Daylight sensors 10% 5% 15% 10%
Individual control
for each user
1% 20% 5% 20%
Presence
detection
25% 10% 25% 15%
Table 2-10 Penetration rate of different lighting control techniques in office lighting in
Belgium and Spain (Source: Expert inquiry)
The German respondent (2007) remarked that these control techniques are heavily
promoted but find little acceptance. Next to the common reason that the investment is
usually not paid for by the end user, another reason is low customer satisfaction,
anger about malfunctioning sophisticated electronic control gear. Adding to this, what
is never mentioned in the promotion is that optimised lamps and luminaires already
reduce the energy demand of a lighting system to a rather low level and that in turn
the automatic control gear also requires some power (usually for 8760h/a), which at
least partly offsets the energy savings achieved during office hours.
In Belgium daylight compensation was only found in buildings where special attention
was already given to energy efficiency/savings at the design stage. Only relatively few
offices are equipped with dimming that allows continuous supplement of the variable
contribution of daylight to the desired lighting level. In the Netherlands SenterNovem
found in 2003125 that this technique is already much more applied.
123 Results from a survey in six EU countries; No full survey exists for Europe as a whole 124 (Timed) lighting sweep function or switch. With a sweep function at a certain moment (for example at the start of a break) the full lighting is switched off. Users have to switch on the lighting again themselves. 125 SenterNovem (2003) Monitor Energiebesparende maatregelen. Rapportage EBM 126 SenterNovem (2003) Monitor Energiebesparende maatregelen. Rapportage EBM
Preparatory study on lighting systems
Month Year I 162
The SAVE report “Market research on the use of energy efficient lighting in the
commercial sector” (DEFU, 2001) concluded that controls in public office buildings in 6
European countries (F, B, DK, ES, GR, IT, UK) were overwhelmingly manual. Over
90% of rooms had manual controls in all countries except UK. In the UK 85% of rooms
had manual control only, 12% had occupancy sensing, the remainder had a mixture of
controls including time scheduling. There is a need to establish lighting control in the
market place. The only considerable share of automatic control installed was in UK
with 12-28% in offices (DEFU, 2001).
Note: the previous data sources are old (1999-2007) and it is likely that the current
situation changed to higher degrees of automation. Any new source on information on
the current status is welcome.
2.2.13.2 Cellular versus open plan offices
Source lot 8 (2007):
No data on the ratio of cellular versus open plan offices could be found for the EU25,
or at Member State level. Only The Kantoor 2000-study for Belgium reports that 48%
of total offices are open plan offices and 52% cellular offices.
The share of open plan versus cellular offices strongly varies between buildings and is
closely connected to the company philosophy and activity. On average over the full
building sample, the share of both types of offices are almost equal.
2.2.13.3 Direct lighting versus indirect lighting luminaires in offices
Source lot 8 (2007):
In this section we focus on the shares of A1127 versus A2128 type office luminaires (see
chapter 1) in the installed base. Data on this issue could be retrieved from the DEFU
study (DEFU, 2001) and the expert inquiry.
The weighted average derived from the DEFU figures gives a distribution of 73% A1
luminaires versus 27% A2 luminaires installed in European offices.
This seems to be well in line with the results retrieved from the expert inquiry. The
expert inquiry shows that while in existing lighting installations only 10-15% (Belgium
and Germany versus Spain) of the installed base are suspended luminaries (A2
luminaires), in new installations 20% (Belgium), 30% (Spain) to 50% (Germany) are
suspended luminaries with direct/indirect light.
127 Only direct light, often ceiling mounted 128 Direct/indirect light, often suspended
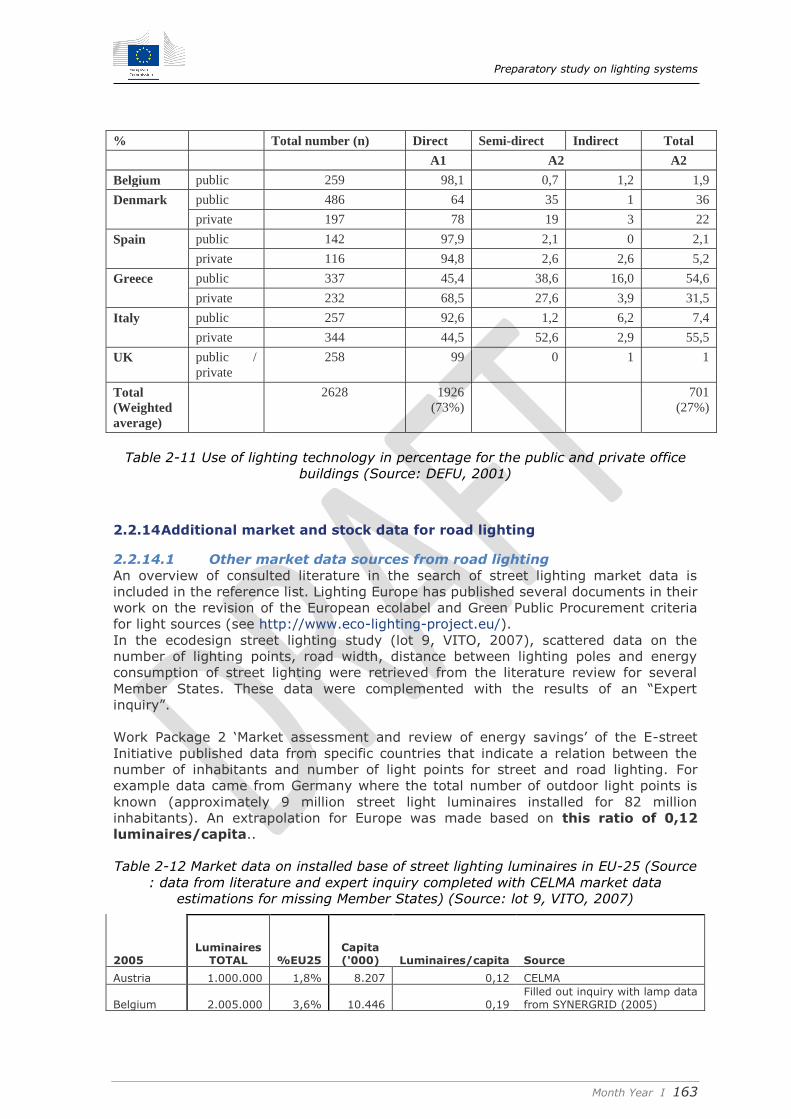
Preparatory study on lighting systems
Month Year I 163
% Total number (n) Direct Semi-direct Indirect Total
A1 A2 A2
Belgium public 259 98,1 0,7 1,2 1,9
Denmark public 486 64 35 1 36
private 197 78 19 3 22
Spain public 142 97,9 2,1 0 2,1
private 116 94,8 2,6 2,6 5,2
Greece public 337 45,4 38,6 16,0 54,6
private 232 68,5 27,6 3,9 31,5
Italy public 257 92,6 1,2 6,2 7,4
private 344 44,5 52,6 2,9 55,5
UK public /
private
258 99 0 1 1
Total
(Weighted
average)
2628 1926
(73%)
701
(27%)
Table 2-11 Use of lighting technology in percentage for the public and private office
buildings (Source: DEFU, 2001)
2.2.14 Additional market and stock data for road lighting
2.2.14.1 Other market data sources from road lighting
An overview of consulted literature in the search of street lighting market data is
included in the reference list. Lighting Europe has published several documents in their
work on the revision of the European ecolabel and Green Public Procurement criteria
for light sources (see http://www.eco-lighting-project.eu/).
In the ecodesign street lighting study (lot 9, VITO, 2007), scattered data on the
number of lighting points, road width, distance between lighting poles and energy
consumption of street lighting were retrieved from the literature review for several
Member States. These data were complemented with the results of an “Expert
inquiry”.
Work Package 2 ‘Market assessment and review of energy savings’ of the E-street
Initiative published data from specific countries that indicate a relation between the
number of inhabitants and number of light points for street and road lighting. For
example data came from Germany where the total number of outdoor light points is
known (approximately 9 million street light luminaires installed for 82 million
inhabitants). An extrapolation for Europe was made based on this ratio of 0,12
luminaires/capita..
Table 2-12 Market data on installed base of street lighting luminaires in EU-25 (Source
: data from literature and expert inquiry completed with CELMA market data
estimations for missing Member States) (Source: lot 9, VITO, 2007)
2005 Luminaires
TOTAL %EU25 Capita ('000) Luminaires/capita Source
Austria 1.000.000 1,8% 8.207 0,12 CELMA
Belgium 2.005.000 3,6% 10.446 0,19 Filled out inquiry with lamp data from SYNERGRID (2005)

Preparatory study on lighting systems
Month Year I 164
2005 Luminaires
TOTAL %EU25 Capita ('000) Luminaires/capita Source
Czech republic 300.000 0,5% 10.221 0,03 CELMA
Denmark 780.000 1,4% 5.411 0,14
Mr. Thomas Christoffersen,
based on data for city of Copenhagen
Finland 400.000 0,7% 5.237 0,08 CELMA
France 8.570.000 15,3% 60.561 0,14
ADEME (2006) and %HgHP adapted based on feedback Mr. Fourtune (email, 3/10/2006)
Germany 9.120.000 16,3% 82.501 0,11 Philips AEG Licht GmbH/WestLB AG/ WestKC GmbH (2003)
Greece 900.000 1,6% 11.076 0,08
CELMA and email Mr. Paissidis (15/06/2006): most commonly used lamp types: 400W NaHP for cat. F roads, HgHP 125, 80W for cat. M roads, HgHP 125W and (but minority) 100, 150W NaHP for cat. S roads. Some roads are over lit (e.g. cat. F roads about 6 cd/m2) other roads are not or poorly lit (even in cat. S).
Hungary 600.000 1,1% 10.098 0,06 CELMA
Italy 9.000.000 16,0% 58.462 0,15 ASSIL
Netherlands 2.500.000 4,5% 16.306 0,15
Projectbureau energiebesparing Grond-, Weg- en Waterbouw
(GWW) (2005); ECN (2000) Partly filled out inquiry by B. Hamel, RWS
Poland 4.200.000 7,5% 38.174 0,11 Email Mr. R.Zwierchanowski and Mr. J. Grzonkovski.
Portugal 1.100.000 2,0% 10.529 0,10 CELMA
Sweden 2.500.000 4,5% 9.011 0,28 Filled out inquiry Mr. Frantzell
Spain 4.200.000 7,5% 43.038 0,10 IDAE (2005)
Slovakia 200.000 0,4% 5.385 0,04 CELMA
UK 7.851.000 14,0% 60.035 0,13 Filled out inquiry and extra data Ms. Hillary Graves
Latvia 85.000 0,2% 2.306 0,04 CELMA
Lithuania 125.000 0,2% 3.425 0,04 CELMA
Estonia 50.000 0,1% 1.347 0,04 CELMA
Malta 45.000 0,1% 403 0,11 CELMA
Cyprus 88.000 0,2% 775 0,11 CELMA
Luxembourg 61.000 0,1% 455 0,13 CELMA
Ireland 401.000 0,7% 4.109 0,09 Filled out inquiry, Mr. M. Perse (ESB)
Slovenia 74.000 0,1% 1.998 0,04 CELMA
Total EU25 56.155.000 100% 459.514 0,12
Preparatory study on lighting systems
Month Year I 165
A European average of 0,12 Light Points per Inhabitant (LPI) will be used in
this study.
2.2.14.2 Share of lit roads
The lot 9 preparatory study on street lighting estimated the share of lit roads as
follows:
- 10% of category fast traffic roads (lot 9) in 1990 or typically road class M
(motorized) in EN 13201 and motorways.
- 15% of mixed traffic roads (lot 9) in 1990 or typically road class C (conflict) in
EN 13201 and intercommunal roads.
- 30% of slow traffic roads(lot 9) in 1990 or typically road class P (pedestrian) in
EN 13201 and roads in residential areas.
In the eco-design street lighting study (VITO, 2007) it was assumed that 10% of
category F roads, 15% of category M roads and 30% of category S roads were lit in
1990, increasing linearly to 15% Cat F, 17,5% Cat M and 40% Cat S roads lit in 2025.
The main driving forces for this growth in road lighting are a.o.: increases in road
infrastructure, increased passenger and freight transport activity, the high cost of
accidents, and the ageing of the overall population with diminished visual capacities.
2.2.14.3 Cross check with MELISA on light sources sales for road lighting
This is work in progress.
2.2.14.4 Conclusion on Market and stock data in road lighting
Because the past and future sales and stock data for road lighting luminaires or
lighting points sales is not directly available a forecast was made based on the
previous data. The data sources used are the average road length data (section
2.2.11), typical light pole distances (section 3.1.2), share of lit roads per category
(section 2.2.14.2), average luminaire life time (section 3.4.1.2) and installed lighting
points per inhabitant (section 2.2.14.1). The combination of this data results in an
installed stock and annual sales forecasts included in Table 2-13, the estimate for
installed stock of road lighting luminaires was about 68 million light points with an
annual sales of 2.29 million luminaires for replacements and 0.82 million for new
roads. This data will be used further in the study.
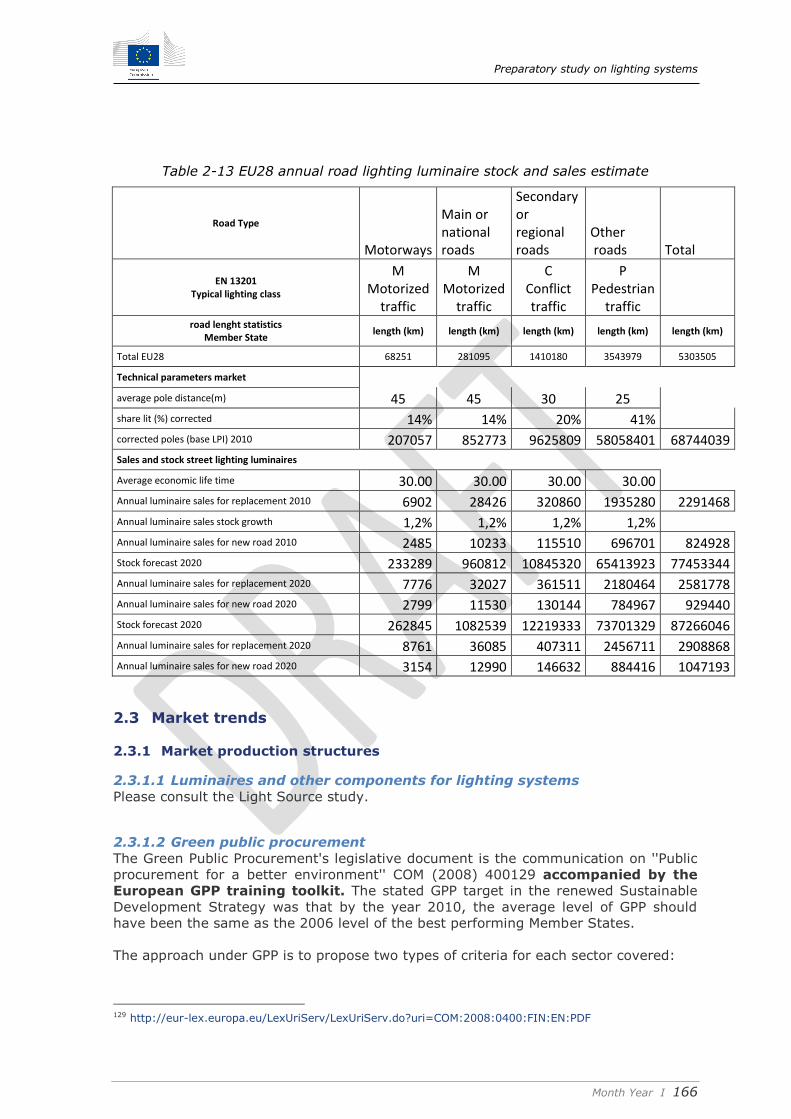
Preparatory study on lighting systems
Month Year I 166
Table 2-13 EU28 annual road lighting luminaire stock and sales estimate
Road Type
Motorways
Main or national roads
Secondary or regional roads
Other roads Total
EN 13201 Typical lighting class
M Motorized
traffic
M Motorized
traffic
C Conflict traffic
P Pedestrian
traffic road lenght statistics
Member State length (km) length (km) length (km) length (km) length (km)
Total EU28 68251 281095 1410180 3543979 5303505
Technical parameters market
average pole distance(m) 45 45 30 25 share lit (%) corrected 14% 14% 20% 41%
corrected poles (base LPI) 2010 207057 852773 9625809 58058401 68744039
Sales and stock street lighting luminaires
Average economic life time 30.00 30.00 30.00 30.00 Annual luminaire sales for replacement 2010 6902 28426 320860 1935280 2291468
Annual luminaire sales stock growth 1,2% 1,2% 1,2% 1,2% Annual luminaire sales for new road 2010 2485 10233 115510 696701 824928
Stock forecast 2020 233289 960812 10845320 65413923 77453344
Annual luminaire sales for replacement 2020 7776 32027 361511 2180464 2581778 Annual luminaire sales for new road 2020 2799 11530 130144 784967 929440
Stock forecast 2020 262845 1082539 12219333 73701329 87266046 Annual luminaire sales for replacement 2020 8761 36085 407311 2456711 2908868
Annual luminaire sales for new road 2020 3154 12990 146632 884416 1047193
2.3 Market trends
2.3.1 Market production structures
2.3.1.1 Luminaires and other components for lighting systems
Please consult the Light Source study.
2.3.1.2 Green public procurement
The Green Public Procurement's legislative document is the communication on ''Public
procurement for a better environment'' COM (2008) 400129 accompanied by the
European GPP training toolkit. The stated GPP target in the renewed Sustainable
Development Strategy was that by the year 2010, the average level of GPP should
have been the same as the 2006 level of the best performing Member States.
The approach under GPP is to propose two types of criteria for each sector covered:
129 http://eur-lex.europa.eu/LexUriServ/LexUriServ.do?uri=COM:2008:0400:FIN:EN:PDF

Preparatory study on lighting systems
Month Year I 167
The core criteria, which are those suitable for use by any contracting
authority across the Member States and address the key environmental
impacts. They are designed to be used with minimum additional verification
effort or cost increases.
The comprehensive criteria, which are for those who wish to purchase the
best environmental friendly products available on the market. These may
require additional verification effort or a slight increase in cost compared to
other products with the same functionality.
Just as the Ecolabel is a voluntary scheme, which means that producers, importers
and retailers can choose to apply for the label for their products; GPP is also a
voluntary instrument, which means that Member States and public authorities can
determine the extent to which they implement it.
In June 2010, a new procedure for EU GPP criteria development was put in place
in order to make the criteria development process more participatory and enhance
synergies among different product-related policy instruments, for example EU GPP and
EU Ecolabel130. The Procedure for the development and revision of EU GPP criteria is
explained on the GPP website131.
For several product groups common GPP criteria132 are already developed in the
framework of the training toolkit on GPP or are in the process of being developed (cfr
work plan for 2015-2016)133.
At present the following lighting equipment is covered:
Indoor Lighting134
Covering “lamps, luminaires (light fittings) and lighting controls installed inside
buildings” with stated exceptions for specialist lighting.
Street Lighting and Traffic Signals135
Covering “Fixed lighting installation intended to provide good visibility to users
of outdoor public traffic areas during the hours of darkness to support traffic
safety, traffic flow and public security”.
The relevant key environmental impacts identified in the GPP criteria for indoor
lighting are:
energy consumption
polluting processes during manufacture
hazardous constituents
waste generation
The relevant key environmental impacts identified in the GPP criteria for street lighting
and traffic signals are:
energy consumption
use of natural resources
hazardous constituents
waste generation
130 http://ec.europa.eu/environment/gpp/gpp_criteria_process.htm 131 http://ec.europa.eu/environment/gpp/gpp_criteria_procedure.htm 132 http://ec.europa.eu/environment/gpp/eu_gpp_criteria_en.htm 133 http://ec.europa.eu/environment/gpp/gpp_criteria_wp.htm 134 http://ec.europa.eu/environment/gpp/pdf/criteria/indoor_lighting.pdf 135 http://ec.europa.eu/environment/gpp/pdf/criteria/street_lighting.pdf
Preparatory study on lighting systems
Month Year I 168
light pollution
Note: Currently (2016) the GPP criteria for street lighting and traffic signs are
reviewed, more information can be found on this website:
http://susproc.jrc.ec.europa.eu/Street_lighting_and_Traffic_signs/
2.3.1.2.1 Implementation status of GPP criteria
In the 2008 Communication “Public Procurement for a Better Environment”, the
European Commission set an indicative target that, by 2010, 50% of all public
tendering procedures should be green in the EU, where “green” means compliant with
endorsed common core EU GPP criteria for ten priority product/service groups such as
construction, transport, cleaning products and services.
In 2011, the Commission commissioned a study with the aim of measuring if this
target had been met. Since there are no systematic statistics on GPP in the
Member States, the Centre for European Policy Studies and the College of Europe
conducted a survey in which over 850 public authorities from 26 Member States
participated. The respondents provided detailed answers regarding the use of core
GPP criteria in the last contract they had signed for one of the ten product/service
groups and gave more general information on the "greenness" of their overall
procurement in the period 2009/2010. For this general part, the study collected
information on more than 230,000 contracts signed by public authorities in 2009-
2010, for a value of approx. 117.5 billion Euros.
The main findings of the report are:
Although the uptake of Green Procurement in the EU is significant, it appears
that the 50% target has not been met. 26% of the last contracts signed in the
2009-2010 period by public authorities in the EU included all surveyed EU core GPP
criteria. However, 55% of these contracts included at least one EU core GPP
criterion, showing that some form of green procurement is being done at a large
scale. The study also points towards an overall positive trend in the period
2009-2010.
Another positive result is that the greenness of contracts seems to be higher when
looking at the value of contracts compared to the number of contracts. 38% of the
total value of the contracts included green criteria.
In line with earlier research, the study highlights that the uptake of EU GPP
criteria varies significantly across Europe. Looking at the last contract signed
by public authorities, there are four top performing countries (Belgium, Denmark,
Netherlands and Sweden), in which all EU core GPP criteria were applied in 40%-
60% of the cases. On the other hand, there are as many as twelve countries where
this occurred in less than 20% of the last contracts. There are some variations in
the results when looking at the uptake of at least one criterion and for all contracts
of the period 2009-2010. For some countries, the results have to be read with
caution, due to a low participation in the survey.
Moreover, the study shows that purchasing costs are still the predominant
criterion for awarding contracts. 64% of the respondents mainly used the
lowest price as the decisive criterion, while only a minority predominantly use Life
Cycle Costing evaluation methods.
Since “Street lighting and traffic signals” and “Indoor lighting” GPP criteria are quite
recent, it is difficult to estimate the value of the contracts including green criteria for
these product groups. An assessment of the trend will be further analysed during Task
2 of the Eco-lighting project.

Preparatory study on lighting systems
Month Year I 169
An overview of GPP good practice cases are listed on the Commission’s website136 both
for indoor lighting as for street lighting and traffic signals.
2.3.1.2.2 Impacts of GPP on lighting systems
New EU Green Public Procurement (GPP) criteria for indoor lighting were introduced in
2012137. They relate not only to minimum luminous efficacy of the light sources (in
lm/W), but also to lighting levels (W/m²/100 lux), lighting controls, etc. (VHK, 2013)
A revision of GPP criteria for street lighting is planned in 2016-2017.
2.3.1.3 Concept of Total cost of ownership (TCO) or Life cycle cost(LCC) used
in lighting systems
LCC is being applied by many public authorities across the EU and in a range of
sectors.
Under the EU procurement rules a contract can be awarded based on lowest price or
Most Economically Advantageous Tender (MEAT). Where the second option is chosen,
costs may be calculated on the basis of the whole life-cycle of the supplies, services or
works, and not solely on the purchase price. This allows costs associated with the use,
maintenance and end-of-life of the supplies, services or works to be taken into
account – sometimes also referred to as the Total Cost of Ownership.
In the example the higher initial purchase price of the green product is more then
compensated by the much smaller use/operating and EOL costs (Figure 2-3). For a
large number of products the operating costs constitute a significant share of the cost
a procurement agency will have to pay for. This is typically the case for energy-using
products such as vehicles, IT equipment or lighting, and buildings (for which the
operational costs can run up to 85% of the total life cycle costs) (EC, 2008).
136 http://ec.europa.eu/environment/gpp/case_group_en.htm 137 http://ec.europa.eu/environment/gpp/pdf/criteria/indoor_lighting.pdf

Preparatory study on lighting systems
Month Year I 170
Figure 2-3: Influence of use and End of Life costs on the total costs (Source: EC, GPP
training toolkit, module 1 ‘managing GPP implementation – LCC factsheet’, 2008)
Life-cycle costing or LCC is a tool which evaluates the costs of an asset throughout its
life-cycle.
The conventional LCC techniques most widely used by companies and/or governments
is based on a purely financial valuation. Four main cost categories are assessed:
investment, operation, maintenance and end-of-life disposal expenses.
An environmental LCC methodology takes into account the above four main cost
categories plus external environmental costs. The latter may come from LCA
analyses on environmental impacts, which measure for example the external costs of
global warming contribution associated with emissions of different greenhouse gases.
Environmental costs can be calculated also in respect of acidification (grams of SO2,
NOX and NH3), eutrophication (grams of NOX and NH3), land use (m2*year) or other
measurable impacts.
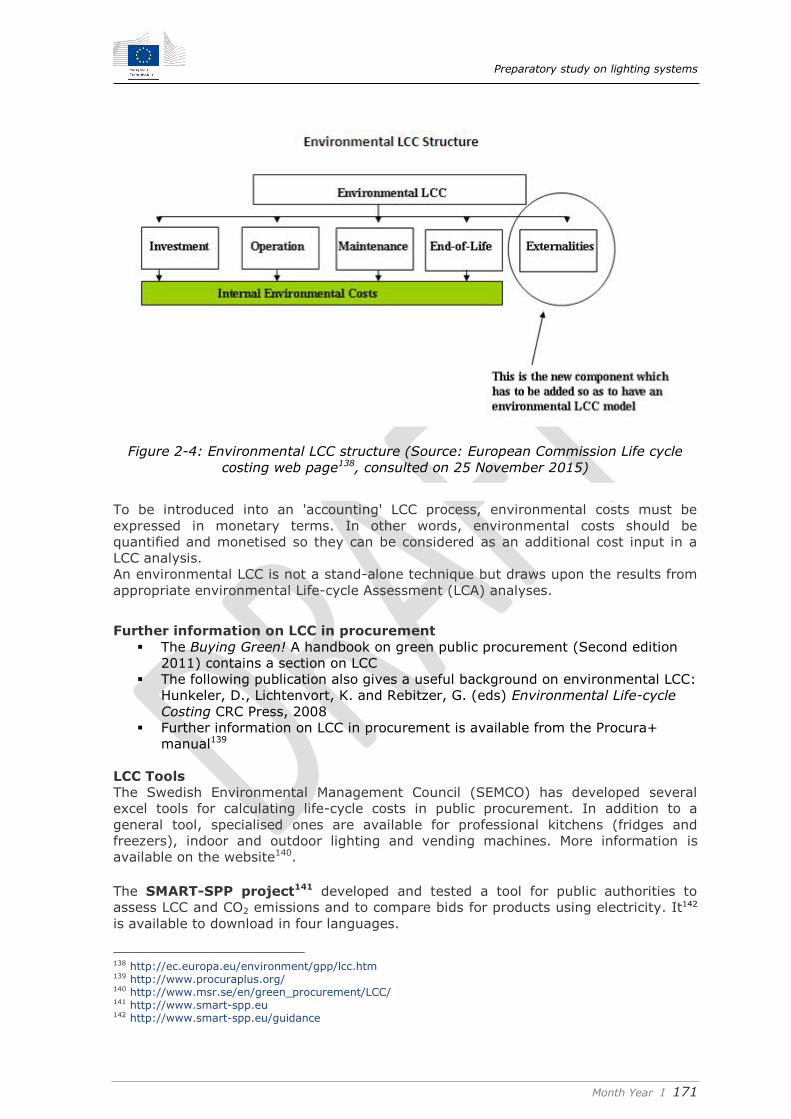
Preparatory study on lighting systems
Month Year I 171
Figure 2-4: Environmental LCC structure (Source: European Commission Life cycle
costing web page138, consulted on 25 November 2015)
To be introduced into an 'accounting' LCC process, environmental costs must be
expressed in monetary terms. In other words, environmental costs should be
quantified and monetised so they can be considered as an additional cost input in a
LCC analysis.
An environmental LCC is not a stand-alone technique but draws upon the results from
appropriate environmental Life-cycle Assessment (LCA) analyses.
Further information on LCC in procurement
The Buying Green! A handbook on green public procurement (Second edition
2011) contains a section on LCC
The following publication also gives a useful background on environmental LCC:
Hunkeler, D., Lichtenvort, K. and Rebitzer, G. (eds) Environmental Life-cycle
Costing CRC Press, 2008
Further information on LCC in procurement is available from the Procura+
manual139
LCC Tools
The Swedish Environmental Management Council (SEMCO) has developed several
excel tools for calculating life-cycle costs in public procurement. In addition to a
general tool, specialised ones are available for professional kitchens (fridges and
freezers), indoor and outdoor lighting and vending machines. More information is
available on the website140.
The SMART-SPP project141 developed and tested a tool for public authorities to
assess LCC and CO2 emissions and to compare bids for products using electricity. It142
is available to download in four languages.
138 http://ec.europa.eu/environment/gpp/lcc.htm 139 http://www.procuraplus.org/ 140 http://www.msr.se/en/green_procurement/LCC/ 141 http://www.smart-spp.eu 142 http://www.smart-spp.eu/guidance

Preparatory study on lighting systems
Month Year I 172
The European Commission is developing a calculation tool on life-cycle
costing with the aim to facilitate the use of the LCC approach amongst public
procurers. The LCC calculation tool will be elaborated in accordance with art.68 of the
new Public Procurement Directive 2014/24/EU and it will be focusing on specific
product categories such as Office IT Equipment, Lighting (Indoor Lighting), White
Goods, Vending Machines and Medical Electrical Equipment.
The project has started in January 2015 and results are expected for the second part
of 2016. The Commission organized a webinar in which the concept of the calculation
tool was presented, see agenda143.
In the white paper ‘Life cycle costing. A question of value’ of IISD (2009) a selection
of LCC tools and guidelines is listed.
2.3.2 General trends in product design and product features; feedback from
consumer associations
Lighting system design and installation services is a mature business, and lighting
designers are organized into various organisations. To support their activities lighting
design standards and software tools have been developed, see Task 1 for a listing.
2.4 Consumer expenditure data
2.4.1 Design, installation and repair cost
It is common practice that lighting design is included in the price quoted for the
luminaires and it is proposed to apply this practice in this study.
Luminaire prices for typical installation designs are included in Task 4.
Typical installation and repair times are discussed in Task 3 and costs can be
calculated based on hourly rates.
The average hourly rates in the EU28 are shown in Table 2-14 and are used as the
installer’s hourly rate or for repairs and maintenance such as lamp replacement or
cleaning.
143 http://ec.europa.eu/environment/gpp/pdf/Webinar_LCC_June2015.pdf
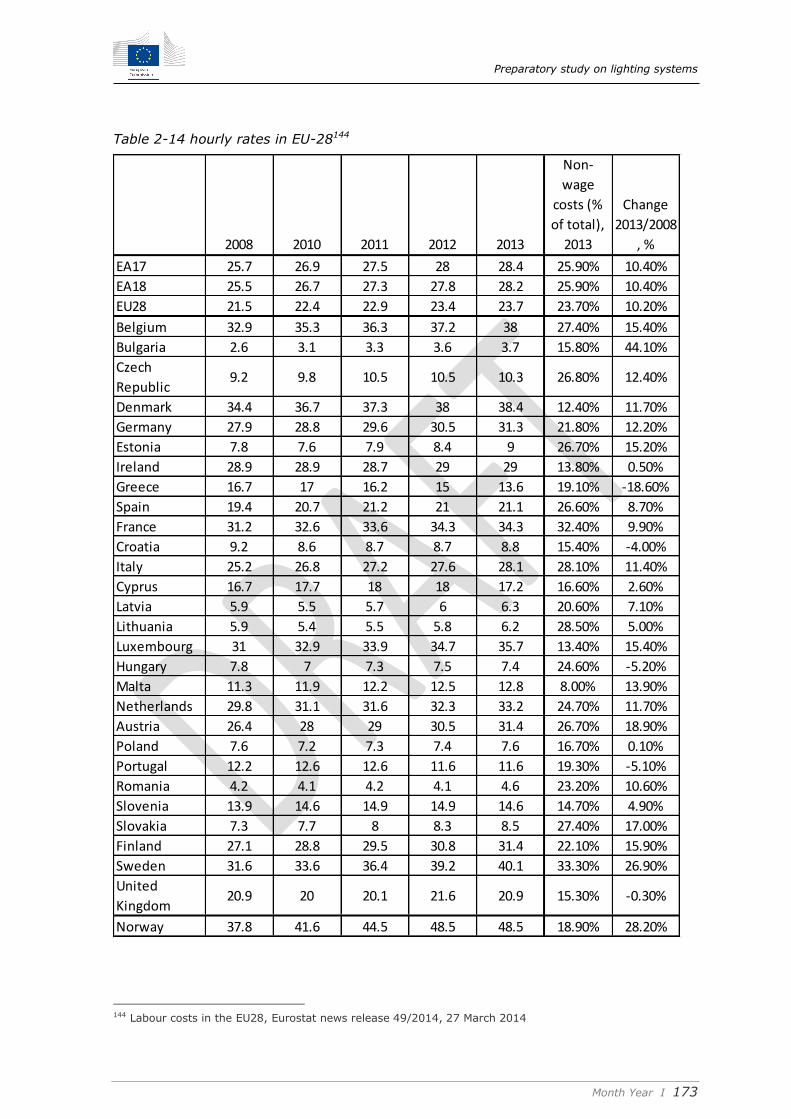
Preparatory study on lighting systems
Month Year I 173
Table 2-14 hourly rates in EU-28144
144 Labour costs in the EU28, Eurostat news release 49/2014, 27 March 2014
2008 2010 2011 2012 2013
Non-
wage
costs (%
of total),
2013
Change
2013/2008
, %
EA17 25.7 26.9 27.5 28 28.4 25.90% 10.40%
EA18 25.5 26.7 27.3 27.8 28.2 25.90% 10.40%
EU28 21.5 22.4 22.9 23.4 23.7 23.70% 10.20%
Belgium 32.9 35.3 36.3 37.2 38 27.40% 15.40%
Bulgaria 2.6 3.1 3.3 3.6 3.7 15.80% 44.10%
Czech
Republic 9.2 9.8 10.5 10.5 10.3 26.80% 12.40%
Denmark 34.4 36.7 37.3 38 38.4 12.40% 11.70%
Germany 27.9 28.8 29.6 30.5 31.3 21.80% 12.20%
Estonia 7.8 7.6 7.9 8.4 9 26.70% 15.20%
Ireland 28.9 28.9 28.7 29 29 13.80% 0.50%
Greece 16.7 17 16.2 15 13.6 19.10% -18.60%
Spain 19.4 20.7 21.2 21 21.1 26.60% 8.70%
France 31.2 32.6 33.6 34.3 34.3 32.40% 9.90%
Croatia 9.2 8.6 8.7 8.7 8.8 15.40% -4.00%
Italy 25.2 26.8 27.2 27.6 28.1 28.10% 11.40%
Cyprus 16.7 17.7 18 18 17.2 16.60% 2.60%
Latvia 5.9 5.5 5.7 6 6.3 20.60% 7.10%
Lithuania 5.9 5.4 5.5 5.8 6.2 28.50% 5.00%
Luxembourg 31 32.9 33.9 34.7 35.7 13.40% 15.40%
Hungary 7.8 7 7.3 7.5 7.4 24.60% -5.20%
Malta 11.3 11.9 12.2 12.5 12.8 8.00% 13.90%
Netherlands 29.8 31.1 31.6 32.3 33.2 24.70% 11.70%
Austria 26.4 28 29 30.5 31.4 26.70% 18.90%
Poland 7.6 7.2 7.3 7.4 7.6 16.70% 0.10%
Portugal 12.2 12.6 12.6 11.6 11.6 19.30% -5.10%
Romania 4.2 4.1 4.2 4.1 4.6 23.20% 10.60%
Slovenia 13.9 14.6 14.9 14.9 14.6 14.70% 4.90%
Slovakia 7.3 7.7 8 8.3 8.5 27.40% 17.00%
Finland 27.1 28.8 29.5 30.8 31.4 22.10% 15.90%
Sweden 31.6 33.6 36.4 39.2 40.1 33.30% 26.90%
United
Kingdom 20.9 20 20.1 21.6 20.9 15.30% -0.30%
Norway 37.8 41.6 44.5 48.5 48.5 18.90% 28.20%

Preparatory study on lighting systems
Month Year I 174
2.4.2 Disposal and dismantling cost
Lighting Systems are not disposed of as a whole but is related to disposal of the
components. Therefore it is assumed that this is covered by the MELISA model from
the Light Sources study.
To consider: extra material for luminaires? Light poles?
2.4.3 Electricity prices
Electricity prices are already defined in MELISA, but some background information is
presented below. Table 2-15 shows the average tariffs and financial rates in the EU27
suggested in the MEErP 2011 Methodology. These rates will be used in this
preparatory study according the MEErP methodology.
Unit domestic
incl.VAT
Long term
growth per yr
non-
domestic excl. VAT
Electricity (base 2011) € / kWh 0.18 5% 0.11
Discount rate for energy
(In lot 7 and MELISA also called ‘Energy escalation rate ‘)*
% 4%
*= real (inflation-corrected) increase
Table 2-15 Generic energy rates in EU-27 (1.1.2011)
2.4.4 Financial rates
Electricity prices are already defined in MELISA, but some background information on
financial values to be applied in the study is presented below.
Table 2-16 shows the average financial rates in the EU27 suggested in the MEErP
2011 Methodology. These data can be used for Life Cycle Cost calculations in Tasks 5
to 7.
Discount rate (EU default)
= interest – inflation
% 4%
VAT % Not applied for non-residential applications
Table 2-16 Generic financial rates in EU-27
2.5 Recommendations
2.5.1 Refined product scope
A more refined market analysis was done on which typical task areas and/or building
applications consume significant amounts of lighting energy. This showed that apart
Preparatory study on lighting systems
Month Year I 175
from office spaces, circulation area’s, manufacturing area’s, toilet rooms,
storeroom/warehouses and shops are also significant.
This study builds on the previous office lighting and road lighting study but when
defining reference applications in Task 4 it could be worth considering other
applications that have significant impact of this study.
2.5.2 Barriers and opportunities from the economical/commercial
perspective
Lighting system design and maintenance will be discussed in Task 3 but the added
complexity can provide an incentive or added value for energy service companies
(ESCO's)145 when they combine technical knowledgde with financial capacities. The
ESCO business model could become a one-stop shop including lighting systems that
enable builders, developers, owners, operators and occupants of buildings to purchase
energy efficient light. An ESCO might be well placed to offer a single-point access to a
full range of services from product sourcing to design, financing and installation.
Any other suggestions from stakeholders is welcome.
145 Role of ESCO's see: IAE Energy Efficiency Market Report 2014 (EEMR 2015), www.iea.org

Preparatory study on lighting systems
Month Year I 176
CHAPTER 3 Users The Objective
The objective of this task is to identify the system aspects of the use phase, especially
user requirements. Relevant user-parameters are an important input for the
assessment of the environmental impact of a product during its use and end-of-life
phase, in particular if they are different from the standard measurement conditions as
described in subtask 1.2.
Summary of task 3:
This is a draft version made in a preparatory phase of the study in order to collect
data from stakeholders. A summary of this task will be elaborated during the
completion of the draft final report.
This section identifies and provides important data for modelling the impact of the use
phase of lighting systems within the scope of this study. In order to collect and discuss
real user data, the development and selection of some reference lighting applications
is necessary. As the purpose of this study is to build on the past eco-design
preparatory studies: lot 8 on office lighting and lot 9 on street lighting, the reference
applications used in those studies are reused here and aligned with the new EN
standards and definitions set out in Task 1. The proposed reference lighting
applications to be considered in more detail are:
• Cellular office with ceiling mounted luminaires (cellular ceiling mounted)
• Cellular office with suspended luminaires (cellular suspended)
• Open plan office with ceiling mounted luminaires (open ceiling mounted)
• Open plan office with suspended luminaires (open suspended)
• Motorized road with fast traffic class M3 (EN 13201)
• Conflict road with mixed traffic class C3 (EN 13201)
• Pedestrian area road with slow traffic class P3 (EN 13201)
To model the impact of the use-phase energy calculations are proposed in line with
standards EN 15193 for indoor lighting and prEN 13201-5, see Task 1. In this Task
some reference design data is included for the selected applications and potential
deviations under real circumstances are discussed.
Dialux files modelling the reference designs are available on request for those
stakeholders who want to contribute in Task 4.
Comment: This report is currently a work in progress, as some parts of the study have
not yet received the benefit of comments and data from stakeholders, therefore it
should not be viewed as a draft final report.
3.1 How to define MEErP system aspects of lighting systems
3.1.1 MEErP system aspects of lighting systems and lighting products
The Directive 2009/125/EC establishes a framework for the setting of Ecodesign
requirements for energy-‘related’ products (ErP) and is a recast of Directive
2005/32/EC on Ecodesign requirements for energy-‘using’ products (EuP). For this
purpose the MEErP method introduced146 the concepts of: ErP with direct impact, ErP
with indirect impact and ErP with direct + indirect impact, as illustrated in Figure 3-1.
The MEErP proposed that in principle, three large groups of products can be
distinguished:
146 http://www.meerp.eu/

Preparatory study on lighting systems
Month Year I 177
products that are using energy during the use phase (hereafter ‘direct
ErP’),
products that - in the use phase - do not use energy but have a
significant impact on the energy consumption of products that are using
energy (hereafter ‘indirect ErP’).
the combination of both
In the MEErP147 it is proposed to follow a technical systems approach taking into
account ‘MEErP System Aspects’, i.e. considering that the ErP is part of a larger
product system and –through certain features of the ErP— can influence the functional
performance and/or the use of resources and emissions of the larger product system.
However, the MEErP did not include a strict, nor a clear, definition of what is a product
or a system. Because this study is concerned with ‘lighting systems’ the MEErP
proposed approach might be confusing and therefore the following approach is
suggested for use in this study:
The lighting system ‘product’ defined in Task 1 in this study is a system or
installation that is composed of luminaires, lamps,sensors and controls to
satisfy lighting requirements according to EN 12464 or EN 13201. A lighting
system in this study forms part of the building or road infrastructure.
In this study the ‘MEErP system aspects’ of a lighting system are the building
or road infrastructure such as walls, ceiling, road surface, ducts, lighting poles
or supports, connectors, power cables, etc.
Figure 3-1: Three groups of ErP, distinguished by their impact (source: MEErP 2011
Methodology Part 1).
The question if 'installed lighting systems in buildings or in road lighting are products
in the meaning of the Ecodesign of Energy Related Products Directive (2009/125/EC)?'
is discussed in section 1.3.1. In the approach of this study following the MEErP they
are considered as products148).
147 http://www.meerp.eu/ 148 http://ecodesign-lightsources.eu/

Preparatory study on lighting systems
Month Year I 178
Following the previous definition of ‘lighting system’ and ‘MEErP system aspects and
looking at the three broad MEErP product groupings defined in Figure 3-1 road lighting
belongs to the category ‘ErP with direct impact’ and indoor lighting to the category
‘ErP with direct + indirect impact’. This is because indoor lighting can replace the heat
demand on buildings and/or contribute to the cooling load, therefore this will be
studied in a separate section. For outdoor lighting there is no such indirect energy
impact identified.
3.1.2 Reference lighting system designs and lighting schemes for use in this
study
Objective: In order to collect and discuss real data the development of some
reference lighting applications is necessary. As the purpose of this study is to build on
the past eco-design preparatory studies: lot 8 on office lighting and lot 9 on street
lighting, the reference applications used in those studies are reused here and aligned
with the new EN standards and definitions set out in Task 1. These reference
applications together with some selected lighting designs or schemes are also
candidates to become so-called MEErP Base Cases in the later Tasks 5 to 7. If
considered necessary, depending on the outcomes of later Tasks 2 and 4 new
reference applications can be added in a later version of this report, for example if
some innovations or impact cannot be covered with the current selection.
Stakeholders are also invited to present additional sources of data.
3.1.2.1 Cellular office with ceiling mounted luminaires
Figure 3-2: Cellular office with ceiling mounted luminaires reference design
A model office was defined (Figure 3-2) with the following design parameters:
Office task area lighting requirements are established according to EN 12464
(see Task 1):
Em (minimum maintained average illuminance): 500 lx
UGR (glare): ≤ 19
U0 (uniformity): ≥ 0.6
Ra (CRI): ≥ 80

Preparatory study on lighting systems
Month Year I 179
Task area: whole floor area in the reference design (optimisation will
be done in Task 4).
Primary functional unit (see definition in Task 1): 500 lx per hour
Occupants:
Two, each with an office desk (see Figure 3-2).
Funiture:
Reference simulation will be done without furniture.
Office geometry and properties:
Room length: 3.6 m (one side with window)
Room depth: 5.4 m
Height of window: 2.8 m
Height Task area: 0.8 m
distance from luminaire to-work plane: 2 m
Space Height Ration (SHR): 1
Reflectance ceiling: 0.7 (which is a default values in EN 15193)
Reflectance Walls: 0.5 (which is a default values in EN 15193)
Reflectance floor cavity: 0.2 (which is a default values in EN 15193)
Suspension ratio: 0 (which means the luminaire is ceiling mounted)
Window orientation: South oriented To Be Confirmed(TBC) (= default
value in Dialux 4)
Latitude/Longitude (location): 50°/-9° (Frankfurt, DE)
Office geometry and properties:
Room length: 3.6 m (one side with window)
Room depth: 5.4 m
Height of window: 2.8 m
3.1.2.2 Cellular office with suspended luminaires
Figure 3-3: Cellular office with suspended luminaires reference design
A similar model office to section 3.1.2.1 was defined with suspended luminaires
(Figure 3-3) and with the following design parameters:
Office task area lighting requirements according to EN 12464 (see Task 1):
Em (minimum maintained average illuminance): 500 lx
UGR (glare): ≤ 19
U0 (uniformity): ≥ 0.6
Ra (CRI): ≥ 80

Preparatory study on lighting systems
Month Year I 180
Task area: whole floor area in the reference design (optimisation will
be done in Task 4)
Primary functional unit (see definition in Task 1): 500 lx per hour
All parameters are identical compared to previous section 3.1.2.3 apart from the
Suspension Ratio (=0.25), which means the luminaire is ceiling mounted.
3.1.2.3 Open plan office with ceiling mounted luminaires
Figure 3-4: Open plan office with ceiling mounted luminaires reference design
A model office was defined (Figure 3-4) with the following design parameters:
Office task area lighting requirements according to EN 12464 (see Task 1):
Em (minimum maintained average illuminance): 500 lx
UGR (glare): ≤ 19
U0 (uniformity): ≥ 0.6
Ra (CRI): ≥ 80
Task area: whole floor area in the reference design (optimisation will
be done in Task 4)
Primary functional unit (see definition in Task 1): 500 lx per hour
Occupants:
Up to twentyfour, each having an office desk (0.7 x 1.8 m) (see Figure
3-4).
Office geometry and properties:
Room length: 16.2 m (one side with window)
Room depth: 10.8 m
Height of window: 2.8 m
Height Task area : 0.8 m
Distance from luminaire to-work plane: 2 m
Space height Ratio (SHR): 1

Preparatory study on lighting systems
Month Year I 181
Reflectance ceiling: 0.7 (which is a default values in EN 15193)
Reflectance Walls: 0.5 (which is a default values in EN 15193)
Reflectance floor cavity: 0.2 (which is a default values in EN 15193)
Suspension ratio: 0 (means ceiling mounted)
Window orientation: South oriented TBC
Latitude/Longitude (location): 50°/-9° (Frankfurt, D)
3.1.2.4 Open plan office with suspended luminaires
A model office was defined (Figure 3-4) with the following design parameters:
Office task area lighting requirements according to EN 12464 (see Task 1):
Em (minimum maintained average illuminance): 500 lx
UGR (glare): ≤ 19
U0 (uniformity): ≥ 0.6
Ra (CRI): ≥ 80
Task area: whole floor area in the reference design (optimisation will
be done in Task 4)
Primary functional unit (see definition in Task 1): 500 lx per hour
All parameters are identical compared to previous section 3.1.2.3 apart from the
Suspension Ratio (=0.25), which means the luminaire is ceiling mounted.
3.1.2.5 Motorized road traffic class M3
A model street was defined for modelling of a motorway with fast motorized traffic use
only; which corresponds to the road class M3 (Motorized) in EN 13201 (Figure 3-5).
Road class M3 (ME3b) requirements according to EN 13201-2 (see Task 1):
Lm: 1.0 Cd/m²
U0 dry conditions (uniformity): ≥ 0.4
TI (glare): 15 %
EIR (Edge Illumination Ratio on edge 3.5 m width) (edge illumination
ratio): 0.5 (should this be applied to the emergency lane?)
Requirements on the emergency lane (TBD)
With regards to the emergency lane and EIR the proposal is:
C4 class lighting on the emergency lane (3 metre width)
Because there are C4 class requirements on the emergency lane no
EIR (=0) requirements are needed.
The benefit of this approach is that UF data of the lot 9 study can be
used.
Note: we are aware that different approaches are used in Member
States but think this is a reasonable working compromise for this
study.
Primary functional unit (see definition in Task 1): 1.0 Cd/m² per hour

Preparatory study on lighting systems
Month Year I 182
Figure 3-5: Reference design for road class M3
Road geometry and properties:
Light point distance/light pole height (m): 45/15 (Space Height Ratio
typically around 4 and pole distance between 35 up to 80 m)
Road width (m) (half of 2x2) (incl. emergency lane): 2x10 m
hard shoulder/emergency lane: 2x3 m
centre beam: 2 m
Qo luminance coeff. Road: 0.07
Qo luminance coeff. Surround: 0.1
3.1.2.6 Conflict road traffic class C3
A model street was defined for a mixed traffic road with motorized traffic, slow moving
vehicles, and possibly cyclists and pedestrians; which is similar to class C3 (Conflict) in
EN 13201.
Road class C3 requirements according to EN 13201 (see Task 1):
Em: 15 lx
U0 dry conditions (uniformity): ≥ 0.4
TI (glare): 20 %
Primary functional unit (see definition in Task 1): 15 lx per hour
Road geometry and properties:
Light point distance/light pole height (m): 30/8 (Space Height Ratio
typically between 3 and 4.54 and pole distance between 25 up to 50 m)
Road width (m) (half of 2x2) (incl. pedestrian lane): 10 m
Pedestrian lane: 2x1.5 m
Qo luminance coeff. Road: 0.07
Qo luminance coeff. Surround: 0.1
Note: The public surrounding space next to the traffic lanes can differ strongly in
residential areas depending on whether there are: separate parking lanes or not,
separate footpaths or not, green strips between traffic lanes and footpaths or not, etc.
Many commercial areas only allow traffic during the night and the early morning. As a
Preparatory study on lighting systems
Month Year I 183
consequence they do not have separate traffic lanes and footpaths, which is assumed
in this reference application.
3.1.2.7 Pedestrian road traffic class P3
A model street was defined for mainly urban and pedestrian areas corresponding to
road class P3 (Pedestrian) in EN 13201.
Road class P3 requirements according to EN 13201 (see Task 1):
Em: 7.5 lx
Emin: 1.5 lx
Primary functional unit (see definition in Task 1): 7.5 lx per hour
Road geometry and properties:
Light point distance/light pole height (m): 25/5 (Space Height Ratio
typically between 4 and 5 and pole distance 15 up to 50 m)
Road width (m): 8 m
3.2 Direct impact of the lighting system on the use phase
Scope: The objective of this section is to identify, retrieve and analyse data and
report on the environmental & resources impacts during the use phase for ErP with a
direct energy consumption effect. Indoor lighting and road lighting are discussed in
separate sections and align with the descriptions, scope and terminology used in EN
standards as much as possible.
3.2.1 Energy consumption of indoor lighting systems in the use phase
according to EN 15193
3.2.1.1 Energy of indoor lighting systems according to EN 15193
These formulas were introduced in Task 1 in Figure 1-3 and the relevant part is
included in Figure 3-6. The most important parameter is the Lighting Energy
Numerical Indicator (LENI, EN 15193) which represents the annual energy
consumption(kWh) per square meter.

Preparatory study on lighting systems
Month Year I 184
Figure 3-6 Formulas for modelling energy consumption in indoor lighting
3.2.1.2 Use parameters influencing lighting system control
3.2.1.2.1 Day time, night time and occupied period
Daylight and occupancy control can deliver significant energy savings. In order to help
assess how much EN 15193 is used the standard defines the following periods:
ty = Annual operating hours (ty) – defined as 8 760 hours
td = day light (h/ty), default values per type of building are defined in annex B
tn = night time (h/ty), default values per type of building are defined in annex B
to = occupied period (h/ty), = td+tn
Values used for this study:
Annex B of EN 15193 defines the values of td = 2250 h/y and tn = 250 h/y for office
buildings. It should be noted that these are default values that are corrected
downwards for occupancy and daylight with factors Fo and Fc according to the
formulas in Figure 3-6 as will be explained in later sections.
3.2.1.2.2 Occupancy Dependency Factor (Fo)
An Occupancy Dependency Factor (Fo) is defined in EN 15193 to model the impact
of occupancy control.
Approach:
This is a correction factor applied to the operational hours that is calculated from an
absence factor (Fa), as defined for different types of reference rooms (cellular office,
open plan office, etc..), and an occupancy control factor (Foc), as defined for different
types of control (centralised control, presence detector, etc.).

Preparatory study on lighting systems
Month Year I 185
Background:
The user influence on final lighting energy consumption is to a large extent driven by
how the light installation reacts on the presence or absence of the user. Several
switching schemes are possible which allow the installation to reduce the lighting
intensity or even to switch the installation off completely when the user is absent. The
extent to which the user is absent is therefore the first important factor used to define
the effect of different switching schemes on the final energy consumption.
Different light switching schemes interact directly or indirectly with users according to
their presence. In reality, the number of potential switching schemes available is very
large. In every type refinements are possible and often combinations of different types
are required to obtain a suitable solution for a specific building. These refinements
have an influence on the energy efficiency of the installation. However, it is necessary
to apply generalisations for this study, and the available switching schemes have
therefore been grouped into the following predominant types.
“Centralised control”: all lighting in the building is centrally switched on and
off. This scheme permits hardly any interference with presence of the
building users.
“Manual control”: this scheme allows the users to switch on the light at
arrival and to switch it off on departure. Acceptable occupancy interference
and energy saving is possible as long as the areas controlled by the
switches remain small enough. EN-15193-1 makes a distinction above and
below 30m² controlled area per switch. This is applied for all areas except
meeting rooms.
“Manual control and automatic sweep”: The automatic sweep (switched off
timer) adds additional programming of automatic sweeps, and centrally
switches off all lights in the evening, with the exception of some lights
which remain active during the night.
“Presence detection”: Similarly to manual control, the effectiveness of
presence detection is largely influenced by the area which it controls. A
mark of 30 m² per controlled area is again defined to distinguish 'small' and
'larger' office areas.
“Manual control + presence detection to switch off”: in this scheme
presence detection is only used to switch off the lights 5 minutes after the
last presence was detected.
Most commercially available switching schemes can be categorised into one of the
described types. The following table gives absence factors for these different schemes
for the specific office areas. The factor Foc is the occupancy dependency factor which
relates the installed power to the occupancy period.

Preparatory study on lighting systems
Month Year I 186
Table 3-1: Typical occupancy dependency factors (Foc) (source: EN15193-1)
Installations that respond to absence in offices often make use of luminaire dimming
capability. For instance, centralised automatic sweeps in offices can switch off all lights
in the office after working hours, but they can also lower the lighting intensity to 10 or
20% for the entire area. This responds to a general demand of users to avoid
completely dark offices. Incorporation of dimming capability within absence control
can therefore greatly influence the energy–efficiency of the installation. In open plan
offices it is assumed that presence detection is always performed on dimming instead
of complete switching off, in order not to disturb occupants in other areas.
Calculation and values used for this study:
The Fo factor can be calculated using lighting design software based on the EN 15193
standard, such as Dialux. It uses the Occupancy dependency factor (Foc) (see Table
3-1) and Absence factor(Fa) calculation methods defined in the standard. The Absence
factor is 0.3 for a “cellular 2-6 person office”, 0 for “open plan offices with detector
range > 30m²” and 0.2 for “open plan offices with detector range < 10m²”. In Task 4
a spreadsheet incorporating part of the EN 15193 calculation will be made available,
stakeholders who are interested to contribute can ask for it.
3.2.1.2.3 Daylight Dependency Factor (Fd)
A Daylight Dependency Factor (Fd) is defined in EN 15193 to model the impact of
daylight on artificial lighting energy consumption.
Approach:
This is a correction factor on the operational hours as a function of: climate, latitude,
daylight factor for sun shading not activated in relation to glazing and orientation,
daylight supply factor for sun shading activated in relation to daylight availability and
the type of blind control and type of daylight-responsive control systems.
Daylight supply in EN 15193 depends on the so-called Daylight Factor(D). This
standards classifies daylight availability as a function of the daylight factor, see Table
3-2. The daylight factor should reflect ‘the mean value of the daylight measured on
the axis running parallel to the respective façade section and at a distance of half the
space depth from the façade’. A Daylight Factor herein is defined as the ratio of the
light level inside a structure due to daylight versus the light level outside the structure
(i.e. 10000 lux), as a consequence 2 % means 200 lx. Daylight factors are calculated
with a standardized sky (CIE sky No 1), which represents an overcast sky with diffuse
daylight. This means that such calculations are independent of the orientation of the
building.

Preparatory study on lighting systems
Month Year I 187
Table 3-2 Daylight classification as a function of daylight factor (source: EN 15193)
Classification of daylight availability depending on Daylight Factor
of the raw building carcass opening
DF ≥ 6 % Strong
6 % > DF≥ 4 % Medium
4 % > DF ≥ 2 % Low
DF< 2 % None
Figure 3-7 Daylight Factor calculations149, left for a cellular office with standard
reflection coefficients (ceiling=0,7; wall=0,5; floor=0,2) and right for bright reflection
coefficients ((ceiling=0,84(white matte); wall=0,71 (beige); floor=0,59(linoleum))
149 VELUX Daylight Visualizer software (validated with CIE 171:2006), free available at http://www.velux.com/

Preparatory study on lighting systems
Month Year I 188
Figure 3-8 Daylight Factor calculations , left for a open plan office with standard
reflection coefficients (ceiling=0,7; wall=0,5; floor=0,2) and right for bright reflection
coefficients ((ceiling=0,84(white matte); wall=0,71 (beige); floor=0,59(linoleum))
Taking into account the daylight availability and the type of blind control the standard
EN incudes different types of daylight to calculate a so-called daylight supply factor
(Fd,s), for vertical facades with sun shading see Table 3-3.
The types of blind control (annex F) (EN 15193) to calculate a daylight supply factor
(Fd,s) are (see also section 1.3.2.3.1):
“MO” (Manual operated): glare protection only - systems which provide glare
protection in compliance with the regulations applying to the respective
utilization profile, e. g. regulations for computer terminal workplaces. This
includes manually operated venetian blinds and semi-transparent fabric sun-
screens.
“Auto” (Automatic): automatically-operated protection against solar radiation
and glare - devices to protect against solar radiation and/or glare and which
can be moved in relation to the amount of daylight available. Venetian blinds
which are automatically opened slightly after being lowered, so that
transmittance is greater than that of the fully-closed blinds.
“Guided”: light-guiding systems (examples would be useful in Task 4).
“None”: No protection against solar radiation and shades. (NOTE only
applicable for areas being evaluated for which no special regulations or
provisions such as the regulations for computer terminal workplaces apply.)
Table 3-3 Determination of daylight supply factor(Fd,s) for sun shading activated
(source: EN 15193)
Classification of daylight availability
control type None Low Medium Strong
D<2% 2%≤D<4% 4%≤D<6% D≥6%
MO 0 0,1 0,2 0,3
Auto 0 0,2 0,43 0,55
Guided 0,3 0,65 0,8
None 0,3 0,65 0,8
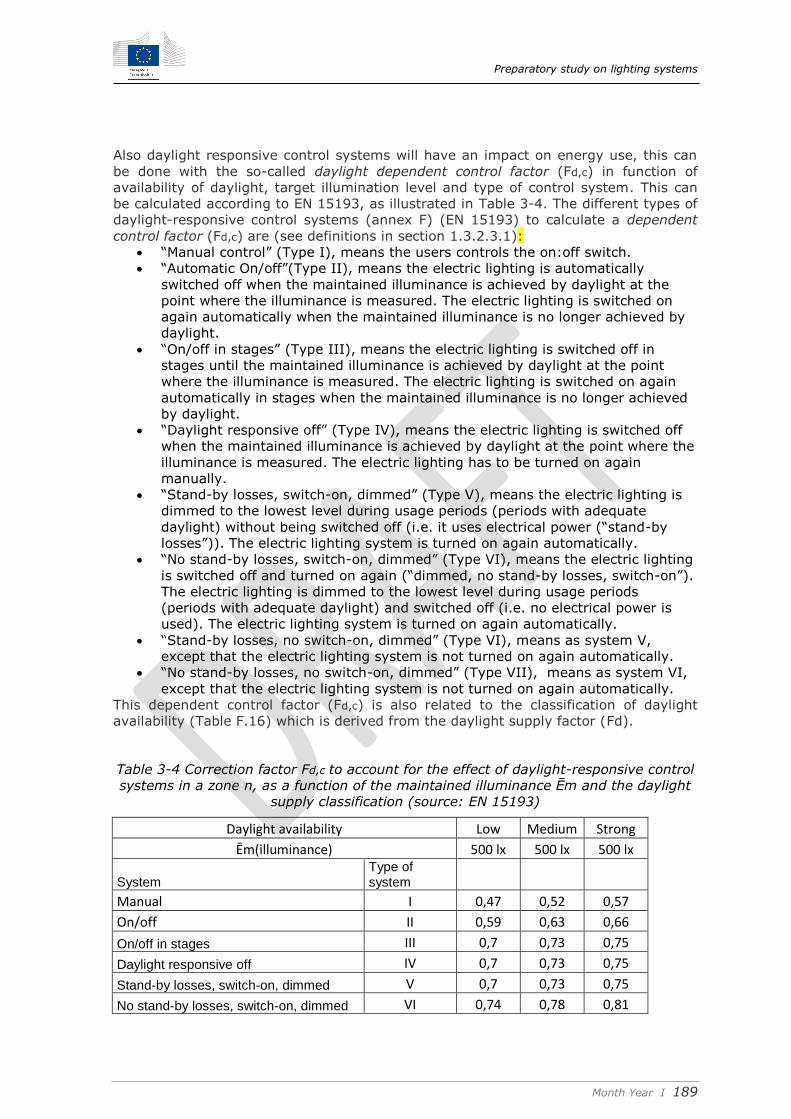
Preparatory study on lighting systems
Month Year I 189
Also daylight responsive control systems will have an impact on energy use, this can
be done with the so-called daylight dependent control factor (Fd,c) in function of
availability of daylight, target illumination level and type of control system. This can
be calculated according to EN 15193, as illustrated in Table 3-4. The different types of
daylight-responsive control systems (annex F) (EN 15193) to calculate a dependent
control factor (Fd,c) are (see definitions in section 1.3.2.3.1):
“Manual control” (Type I), means the users controls the on:off switch.
“Automatic On/off”(Type II), means the electric lighting is automatically
switched off when the maintained illuminance is achieved by daylight at the
point where the illuminance is measured. The electric lighting is switched on
again automatically when the maintained illuminance is no longer achieved by
daylight.
“On/off in stages” (Type III), means the electric lighting is switched off in
stages until the maintained illuminance is achieved by daylight at the point
where the illuminance is measured. The electric lighting is switched on again
automatically in stages when the maintained illuminance is no longer achieved
by daylight.
“Daylight responsive off” (Type IV), means the electric lighting is switched off
when the maintained illuminance is achieved by daylight at the point where the
illuminance is measured. The electric lighting has to be turned on again
manually.
“Stand-by losses, switch-on, dimmed” (Type V), means the electric lighting is
dimmed to the lowest level during usage periods (periods with adequate
daylight) without being switched off (i.e. it uses electrical power (“stand-by
losses”)). The electric lighting system is turned on again automatically.
“No stand-by losses, switch-on, dimmed” (Type VI), means the electric lighting
is switched off and turned on again (“dimmed, no stand-by losses, switch-on”).
The electric lighting is dimmed to the lowest level during usage periods
(periods with adequate daylight) and switched off (i.e. no electrical power is
used). The electric lighting system is turned on again automatically.
“Stand-by losses, no switch-on, dimmed” (Type VI), means as system V,
except that the electric lighting system is not turned on again automatically.
“No stand-by losses, no switch-on, dimmed” (Type VII), means as system VI,
except that the electric lighting system is not turned on again automatically.
This dependent control factor (Fd,c) is also related to the classification of daylight
availability (Table F.16) which is derived from the daylight supply factor (Fd).
Table 3-4 Correction factor Fd,c to account for the effect of daylight-responsive control
systems in a zone n, as a function of the maintained illuminance Ēm and the daylight
supply classification (source: EN 15193)
Daylight availability Low Medium Strong
Ēm(illuminance) 500 lx 500 lx 500 lx
System Type of system
Manual I 0,47 0,52 0,57
On/off II 0,59 0,63 0,66
On/off in stages III 0,7 0,73 0,75
Daylight responsive off IV 0,7 0,73 0,75
Stand-by losses, switch-on, dimmed V 0,7 0,73 0,75
No stand-by losses, switch-on, dimmed VI 0,74 0,78 0,81

Preparatory study on lighting systems
Month Year I 190
Stand-by losses, no switch-on, dimmed VII 0,77 0,8 0,83 No stand-by losses, no switch-on, dimmed VIII 0,81 0,86 0,89
Finally, the Daylight Dependency Factor (Fd) is calculated from the daylight dependent
control factor (Fd,c) and the daylight supply factor (Fd,s) with the following formula:
Fd = 1 - Fd,c x Fd,s
Background:
The exact calculation of daylight savings is dependent on: local weather conditions,
the building’s construction, types of blind used and the control systems used. The
calculation of daylight availability is documented in the EN15193 standard for various
configurations and conditions.
Due to seasonal differences the monthly energy consumption for artificial light with
daylight contribution will vary. Therefore the standard contains ‘Monthly distribution
key factors for vertical façades’ (Annex F). These factors can also be used to calculate
the indirect effects of lighting on the building energy balance for the cooling and/or
heating load per month, see section 3.3.
Calculation and values used for this study:
The Fd factor can be calculated based on the EN 15193 standard or by lighting design
software based on this standard, such as Dialux.
For the reference offices according to calculations, seeFigure 3-7and Figure 3-8 the
following daylight availability classes will be used:
- Cellular office with standard reflection coefficients: medium daylight
availability.
- Cellular office with bright reflection coefficients: strong daylight availability.
- Open plan office with standard reflection coefficients: low daylight availability.
- Open office with standard reflection coefficients: medium daylight availability.
The impact can vary according to the choosen solar blind and daylight control system,
see Table 3-3 and Table 3-4.
3.2.1.2.4 Constant illuminance Factor (Fc)
A Constant illuminance Factor (Fc)r is defined in EN 15193 to model the impact of
smart dimming control designed to constantly match the illuminance to the required
minimum.
Approach:
This is a correction factor on the consumed power as a function of the maintenance
factor (FM) and the type of control.
Background:
All lighting installations, from the instant they are installed, start to decay and reduce
their output. Therefore EN 12646 specifies the task illuminance in terms of maintained
illuminance and in order to assure conformity the scheme should provide higher initial
illuminance. As a consequence the decay rate is estimated in the design of the lighting
scheme and applied in the calculations, which is known as the maintenance factor
(FM), see later section 3.2.1.3. A smart constant illumination control system increases
the power over time to keep the luminous flux constant based upon the known lumen
depreciation of the light source (no external sensors involved). Hence it will provide
additional energy saving because less power is consumed in the beginning - the EN
15193 standard provides formulas to calculate these savings.

Preparatory study on lighting systems
Month Year I 191
Apart from the maintenance factor other factors can also contribute to over
illumination, such as over specifying the number and output of luminaires, and such a
control can compensate for this and save power. Other examples are: variations in
room reflection coefficient, see section 3.2.1.4, and/or a discrete number of light
points and their maximum light output that always need to surpass the minimum
requirement, see section 3.2.1.5.
Calculation and values for this study:
The FC factor can be calculated based on the EN 15193 standard. In Task 4 a
spreadsheet incorporating part of the EN 15193 is available on request for
stakeholders who want to contribute and verify.
3.2.1.3 Influence of maintenance factors (FLM, FLLM, FRSM)
The EN 12464 standard series specifies requirements in terms of ‘Maintained
illuminance’ (Em), which is a value below which the average illuminance on the
specified area should not fall. Therefore, for compliance, the planner or designer needs
to establish and document how much the luminous flux of a lighting installation will
decrease by a certain point in time and recommend appropriate maintenance action.
Therefore an overall maintenance factor (FM) is defined.
Approach:
This can be done based on the maintenance factor (FM), and the room surface
maintenance factor (FRSM) as defined in Task 1.
The overall maintenance factor (FM) can be calculated as follows:
FM = FLM x FLLM x FRSM (assuming spot replacement, see section 3.4.4)
Wherein,
FLM = Luminaire maintenance factor (see Task 1)
FLMM = Lamp Lumen Maintenance Factor (see Task 1)
FRSM =Room surface maintenance factor(see Task 1)
FM = FLS x FLM x FLLM (assuming no spot replacement, see section 3.4.4)
With,
FLS = Lamp Survival Factor (see Task 1)
All factors are dependent on the frequency of the maintenance cycle, see section
3.4.4.
For LED luminaires the factors FM and FLS are not directly available from the standard
data but can be calculated from other data available in catalogues according to IEC
62717 and with a guideline provided for conversion of those parameters150:
LLMF is obtained from manufacturers' light degradation curves for the relevant
observation period, but is based on the LED module rated life, Lx (IEC 62717) (see
Task 1).
FLMM = Lx
Wherein,
Lx = length of time during which a LED module provides more than the claimed
percentage x of the initial luminous flux, under standard conditions (see Task 1)/
Lx values at F50 will be used, hence accepting a luminaire failure fraction of 50
% on the percentage x of the initial luminous flux (IEC 62717)
at their rated life designates the percentage (fraction) of failures .
150 ZVEI (2013): ‘Guide to Reliable Planning with LED Lighting Terminology, Definitions and Measurement Methods: Bases for Comparison’
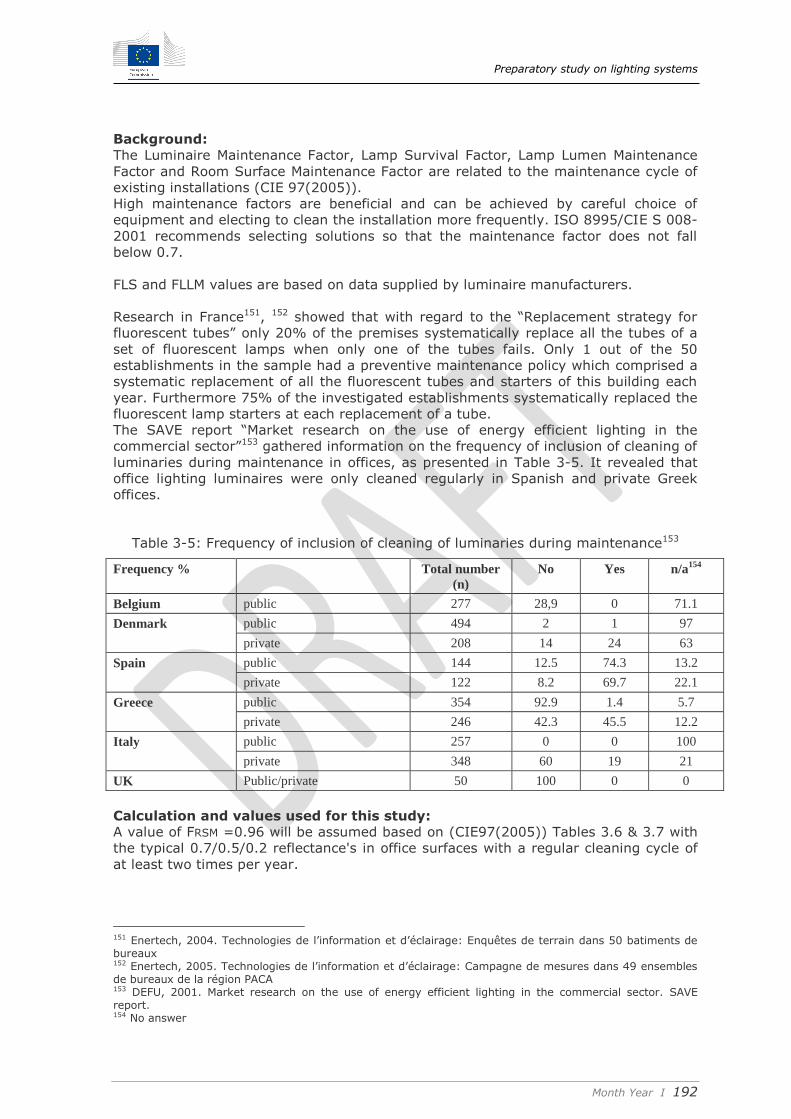
Preparatory study on lighting systems
Month Year I 192
Background:
The Luminaire Maintenance Factor, Lamp Survival Factor, Lamp Lumen Maintenance
Factor and Room Surface Maintenance Factor are related to the maintenance cycle of
existing installations (CIE 97(2005)).
High maintenance factors are beneficial and can be achieved by careful choice of
equipment and electing to clean the installation more frequently. ISO 8995/CIE S 008-
2001 recommends selecting solutions so that the maintenance factor does not fall
below 0.7.
FLS and FLLM values are based on data supplied by luminaire manufacturers.
Research in France151, 152 showed that with regard to the “Replacement strategy for
fluorescent tubes” only 20% of the premises systematically replace all the tubes of a
set of fluorescent lamps when only one of the tubes fails. Only 1 out of the 50
establishments in the sample had a preventive maintenance policy which comprised a
systematic replacement of all the fluorescent tubes and starters of this building each
year. Furthermore 75% of the investigated establishments systematically replaced the
fluorescent lamp starters at each replacement of a tube.
The SAVE report “Market research on the use of energy efficient lighting in the
commercial sector”153 gathered information on the frequency of inclusion of cleaning of
luminaries during maintenance in offices, as presented in Table 3-5. It revealed that
office lighting luminaires were only cleaned regularly in Spanish and private Greek
offices.
Table 3-5: Frequency of inclusion of cleaning of luminaries during maintenance153
Frequency % Total number
(n)
No Yes n/a154
Belgium public 277 28,9 0 71.1
Denmark public 494 2 1 97
private 208 14 24 63
Spain public 144 12.5 74.3 13.2
private 122 8.2 69.7 22.1
Greece public 354 92.9 1.4 5.7
private 246 42.3 45.5 12.2
Italy public 257 0 0 100
private 348 60 19 21
UK Public/private 50 100 0 0
Calculation and values used for this study:
A value of FRSM =0.96 will be assumed based on (CIE97(2005)) Tables 3.6 & 3.7 with
the typical 0.7/0.5/0.2 reflectance's in office surfaces with a regular cleaning cycle of
at least two times per year.
151 Enertech, 2004. Technologies de l’information et d’éclairage: Enquêtes de terrain dans 50 batiments de bureaux 152 Enertech, 2005. Technologies de l’information et d’éclairage: Campagne de mesures dans 49 ensembles de bureaux de la région PACA 153 DEFU, 2001. Market research on the use of energy efficient lighting in the commercial sector. SAVE report. 154 No answer
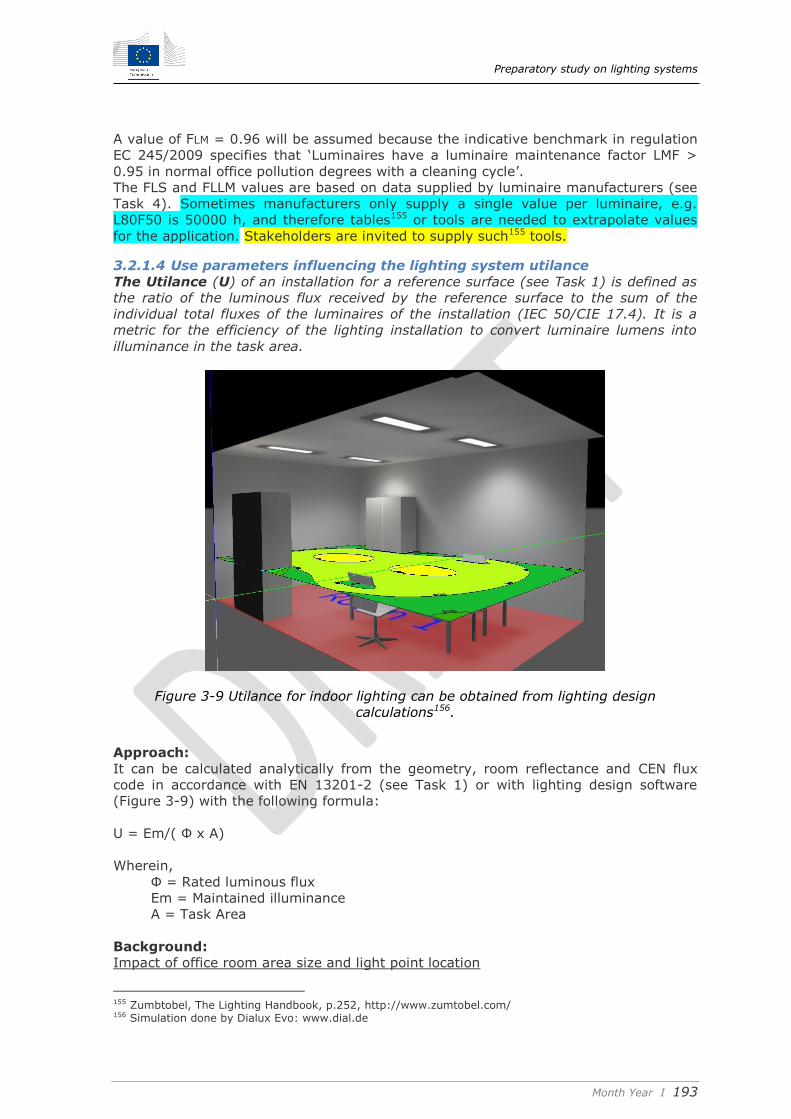
Preparatory study on lighting systems
Month Year I 193
A value of FLM = 0.96 will be assumed because the indicative benchmark in regulation
EC 245/2009 specifies that ‘Luminaires have a luminaire maintenance factor LMF >
0.95 in normal office pollution degrees with a cleaning cycle’.
The FLS and FLLM values are based on data supplied by luminaire manufacturers (see
Task 4). Sometimes manufacturers only supply a single value per luminaire, e.g.
L80F50 is 50000 h, and therefore tables155 or tools are needed to extrapolate values
for the application. Stakeholders are invited to supply such155 tools.
3.2.1.4 Use parameters influencing the lighting system utilance
The Utilance (U) of an installation for a reference surface (see Task 1) is defined as
the ratio of the luminous flux received by the reference surface to the sum of the
individual total fluxes of the luminaires of the installation (IEC 50/CIE 17.4). It is a
metric for the efficiency of the lighting installation to convert luminaire lumens into
illuminance in the task area.
Figure 3-9 Utilance for indoor lighting can be obtained from lighting design
calculations156.
Approach:
It can be calculated analytically from the geometry, room reflectance and CEN flux
code in accordance with EN 13201-2 (see Task 1) or with lighting design software
(Figure 3-9) with the following formula:
U = Em/( Ф x A)
Wherein,
Ф = Rated luminous flux
Em = Maintained illuminance
A = Task Area
Background:
Impact of office room area size and light point location
155 Zumbtobel, The Lighting Handbook, p.252, http://www.zumtobel.com/ 156 Simulation done by Dialux Evo: www.dial.de

Preparatory study on lighting systems
Month Year I 194
Local infrastructure and room design can have a large effect on the efficiency of
lighting installations. Office zone lay-out can influence lighting design, e.g. individual
or cellular offices allow more dimming options for energy saving compared to open
plan offices with cubicles. Also the reflection of walls is larger in cellular offices
compared to open plan offices. In order to analyse the influence of this factor on
lighting system energy consumption a set of typical room types are defined in this
study: a cellular office and an open plan office.
Impact of room surface reflection
The room surface reflection also has an influence on the illumination of the task area.
The most common default or typical room reflectance values157 are included in Table
3-6 below, they can be used for photometric calculations.
The exact surface reflection is not always known during the design of the installation
and can also change during use, therefore default values are commonly used in
photometric calculations. But this can lead to over or under dimensioning of the
illumination in rooms with bright or dark surfaces, therefore these extreme values are
also included. It is important to note that products that are adaptable to variable room
reflectance conditions by including dimming ballasts can tune the illumination level
close to the minimum required. Also furniture can have an impact on real
performance, see Figure 3-9. High reflectance values are also beneficial for increasing
the use of daylight, see section 3.2.1.2.3. The very bright values in Table 3-6 are
sourced from Table 3-3 and based on reference data from daylight calculation
software149.
Table 3-6: Reflectance values used in this study
very bright typical (default) very dark
Ceiling reflectance 0.84(e.g. white matte) 0.7 0.5
Wall reflectance 0.71 (e.g. beige) 0.5 0.3
Floor cavity reflectance 0.59 (e.g. linoleum) 0.2 0.2
What are typical dimensions of a small office room or cellular office?
A cellular office is often between 18 m² and 30 m² 157. Several administrations specify
net available surfaces for each office worker. Architectural standards take 10 to 15 m²
per office worker into account. Usually multiples of 60 cm are used in order to fit with
floor and ceiling tiles. The Belgian administration uses as a guideline 12 m² per office
worker. A guide on the implementation of EN 12464 recommends that the work
station area should be assumed to be 1.8 m x 1.8 m square158 and as minimum the
total office area should be much larger. As a conclusion this study proposes to select a
room length of 3.6 m parallel to the window and a room depth of 5.4 m, resulting in a
room size with a floor area of 19.44 m². These are the dimensions of the cellular
offices defined in sections 3.1.2.1and 0 The assumed height is based on architectural
standards used in buildings from 1970 up to the present. The net height between
ceiling and floor is often 2.8 m. In older buildings, this height is often higher;
however, new project developments focus on a maximum number of building floors for
economic reasons and therefore a ceiling height of 2.8m is considered to be
representative.
The selected room depth takes into account the maximum depth of the daylight area
defined in EN 15193 as 2.5 times the maximum window height of 2.8 metres minus
the typical height of an office desk (0.8 m) which results in 5 metres. The formula
from the standard EN 15193 is an important rule of thumb in building design for
157 Fördergemeinschaft Gutes Licht. Heft 04 Gutes Licht für Büros und Verwaltungsgebäude, ISBN 3-926 193-04-02 158 Licht.de: Guide to DIN EN 12464-1, ISBN-No. PDF edition (English) 978-3-926193-89-6

Preparatory study on lighting systems
Month Year I 195
defining maximum room depths with sufficient daylight in buildings. As a consequence
the typical office depth is rarely much more than 6 metres.
An important trend due to the increased cost of buildings per square meter is to have
more workers per area, up to 1 per 6 m² instead of 1 per 12 m² as suggested before.
Technically this is possible by installing mechanical ventilation, air conditioning,
reduction of the total office area close to the minimum work station area (1.8m x
1.8m) and working as in as paperless a manner as possible without cabinets. In our
reference cellular application office defined in sections 3.1.2.1 and 0 we will therefore
assume two office workers.
What are typical dimensions of a large office room or open plan office?
Open plan or group offices are also evaluated in this study. Open plan offices are
typically used by groups of from 10 to 30 office workers. The dimensions of the
reference open plan application in sections 3.1.2.3 and 3.1.2.4 were selected by
multiplying the dimensions of the cellular office application by a factor 3 but with a
window at the longest side. This results in an office area of 175 m², that can typically
host 24 workers (see Figure 3-4)
Generally, in these offices it is beneficial to use a slightly increased ceiling height in
order not to create a very shallow floor to ceiling appearance, therefore an office
ceiling height of 3 meters was chosen.
Methods for increasing the Utilance will be discussed in Task 4.
Calculation method and values used for this study:
The Utilance will be calculated with lighting design software and the Flux code method
(EN 13032-2).
3.2.1.5 Luminaire installation and matching of the minimum lighting design
requirements for the task area
Over-lighting compared to the minimum required illuminance will also contribute to
energy losses. This effect has been modelled in road lighting (in standard prEN 13201-
5) and will be modelled using a similar approach here. Therefore a correction factor
for over-lighting(Fc) is defined.
Approach:
The correction factor for over-lighting, Fcl=CL=Em,min/Em as defined in Task 1.
Background:
Selecting the correct number of luminaires to closely match the minimum required
illumination:
Luminaires are sold in discrete numbers with stepwise changing lumen outputs, and
therefore tend to be over-dimensioned in order to satisfy the minimum illumination
requirements. For example the luminaire grid needs to fit with the ceiling design, and
it may only be possible to install 3 or 4 luminaires but nothing in between. Dimmable
luminaires with constant illumination control can address this problem by lowering the
light output, see section 3.2.1.2.4.
Over-dimensioning task areas with high illuminance requirements:
The standard EN 12464-1 requires that 'for places where the size and/or location of
the task area is unknown, the area where the task might occur shall be taken as the
task area' while illuminance requirements for the surrounding area in office lighting
are only 300 lx compared to 500 lx for the task area.
In consequence energy can be saved by providing dimming capabilities to luminaires
in order to adapt their output in use to the exact office desk location.
The following parameter can be used in the assumption that 1/3 of the area can be
dimmed from 500 to 300 lx: BGF = 1/(1-0.33x200/500) = 1/0.87 = 1.15.

Preparatory study on lighting systems
Month Year I 196
Calculation method and values used for this study:
The Em, min can be sourced from the EN 12464 standard and Em can be calculated
with lighting design software and the Flux code method (EN 13032-2).
3.2.1.6 Luminaire and lamp efficacy parameters
Please consult the complementary light source study159 (lot 7) which addresses this
topic.
3.2.2 Energy consumption of indoor lighting system in the use phase not yet
covered in prEN 15193
The performance parameters defined in chapter 1 are obtained under standard test
conditions, however in real life these parameters may deviate from these values.
Hereafter we will discuss the factors that can influence the energy consumption of
luminaires and their control systems in real life, for example: temperature, line
voltage...
Approach:
An extra parameter (see definition in chapter 1) could be defined which enables
additional corrections on energy consumption:
BMF: Ballast Maintenance Factor
Background:
Temperature effect:
Lamp efficacy and hence power consumption of fluorescent lamps are influenced by
temperature148. As with fluorescent lamps in general, the rated luminous flux for T5
HE and T5 HO fluorescent lamps is specified at 25 °C, and T5 HE and T5 HO lamps
achieve their maximum luminous flux at temperatures between 34 and 38 °C. One of
the advantages of T5 lamps is therefore an increased luminaire light output ratio
(RLO).
In this study we assume the appropriate constant environmental temperature for
office lighting applies.
Line voltage effect:
Power consumption and light output of gas discharge lamps vary with line voltage
when a magnetic ballast is used: typically giving a +/- 20 % power variation with a
+/- 10 % variation of line voltage. Line voltage variations of up to +/- 10 % are
allowed and also not exceptional in the public grid. Electronic ballasts used in office
lighting can overcome this problem. They incorporate electronic Power Factor
Compensation (PFC) circuits that need to be used for ballast power levels above 25 W
in order to satisfy standard EN 61000-3-2 160. The most commonly used active
electronic PFC topologies are independent of the line voltage161.
Lamp voltage effect:
Power consumption and light output of gas discharge lamps also vary with lamp
voltage when a magnetic ballast is used. Lamp voltage can vary with production
variations and generally increases with aging. Some electronic ballasts have an
internal power control loop and are independent of the lamp voltage, they even detect
'end-of-life' when lamp voltage becomes excessive. This is also the case with LEDs,
see the Lot 8/9/19 light source study148.
Low Power factor impact:
159 http://ecodesign-lightsources.eu/ 160 Basu (2004), Supratim Basu, T.M.Undeland, PFC Strategies in light of EN 61000-3-2, EPE-PEMC 2004 Conference in Riga, LATVIA, 1- 3 September 2004 161 Garcia, (2003), Single phase power factor correction: a survey, IEEE Transactions on Power Electronics, volume 18, issue 3, May 2003.
Preparatory study on lighting systems
Month Year I 197
The power factor of an AC electric power system is defined as the ratio of the real
power to the apparent power and is a number between 0 and 1. Real power is the
capacity of the circuit for performing work in a particular time. Apparent power
includes the reactive power that utilities need to distribute even when it accomplishes
no useful work. Low-power-factor loads increase losses in a power distribution system
and result in increased energy costs (LRC (1995)). There is no direct limitation on
power factor of luminaires at product level. However many power distribution
companies have penalties for large consumers when the total power factor is below
0.8. Therefore many luminaire manufacturers incorporate this feature in luminaires.
This feature is always incorporated in electronic ballasts with power levels above 25
W, because an active power factor compensation (PFC) circuit is needed in order to
satisfy the harmonic current limits of standard EN 61000-3-2 (Basu (2004)). In
consequence, electronic ballasts with power factor compensation (all above 25 W)
outperform magnetic ballasts.
Power factor compensation and capacitor ageing:
Power factor compensation capacitors are used with magnetic ballasts. The
capacitance decreases with capacitor age. Poor performance of the capacitor causes
an increase of reactive currents and causes additional power losses in the cables of
the distribution grid. According to a study by ADEME (2006) up to 9% of additional
energy losses can be caused in the distribution grid by aged capacitors with a poor
power factor.
High level of harmonic line currents:
Discharge lamps cause harmonic currents that cannot be compensated in magnetic
ballasts162. The level of harmonic current on the line voltage when using magnetic
ballasts can vary from 8 to 13 %. In particular, third harmonic currents (which are
limited under EN 61000-3-2) can cause increased magnetic losses in distribution
transformers and in the neutral wire163. Electronic ballasts with pure sine wave
electronic power factor corrector (PFC) circuits overcome this problem. This feature is
always incorporated in electronic ballasts with power levels above 25 W, because an
active Power Factor Compensation (PFC) circuit is needed in order to satisfy the
harmonic current limits of standard EN 61000-3-2 160. As a consequence electronic
ballasts (of > 25 W) with power factor compensation outperform magnetic ballasts.
Colour and Vision:
TBW
Weather conditions:
When daylight responsive control systems are involved, the daylight harvesting is
related to the weather conditions. These may deviate from the predicted or assumed
conditions and also vary across Europe. The standard EN 15193 includes for different
locations default weather conditions but for this study a single standard location
(Frankfurt) was chosen because of its central location in Europe.
Working hours and office occupancy:
User behaviour, including occupancy, is often hard to predict and the standard works
with default hours per type of area and/or activity.
Conclusions and values used for this study:
It is proposed to neglect conduct of an assessment within this study of the losses
associated with deviations in the operating conditions of luminaires from those
specified in the standard discussed because more precise data and evidence is missing
and also taking these effects into account is not common practice.
162 Chang (1993), Chang, Y.N.; Moo, C.S.; Jeng, J.C, Harmonic analysis of fluorescent lamps with electromagnetic ballasts, IEEE Region 10 Conference Proceedings on Computer, Communication, Control and Power Engineering, 1993. 163 IESNA, 1995. Lighting Handbook, Eighth Edition, ISBN 0-87995-102-8, p.215
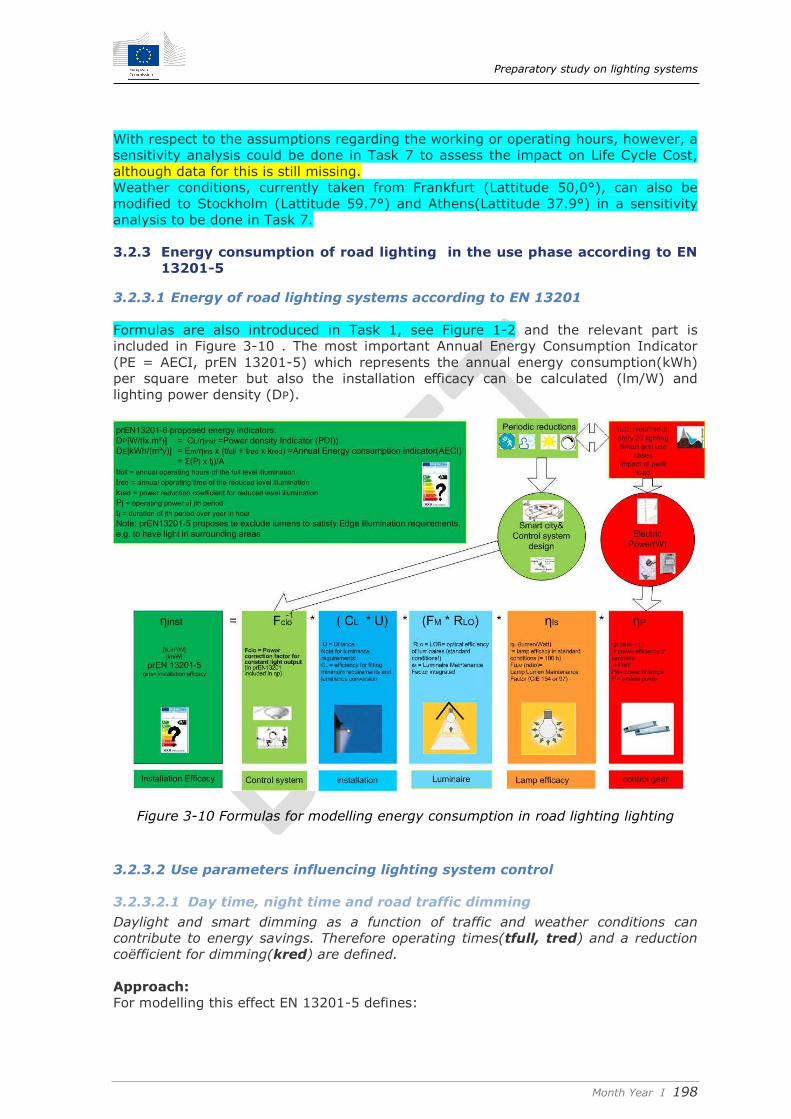
Preparatory study on lighting systems
Month Year I 198
With respect to the assumptions regarding the working or operating hours, however, a
sensitivity analysis could be done in Task 7 to assess the impact on Life Cycle Cost,
although data for this is still missing.
Weather conditions, currently taken from Frankfurt (Lattitude 50,0°), can also be
modified to Stockholm (Lattitude 59.7°) and Athens(Lattitude 37.9°) in a sensitivity
analysis to be done in Task 7.
3.2.3 Energy consumption of road lighting in the use phase according to EN
13201-5
3.2.3.1 Energy of road lighting systems according to EN 13201
Formulas are also introduced in Task 1, see Figure 1-2 and the relevant part is
included in Figure 3-10 . The most important Annual Energy Consumption Indicator
(PE = AECI, prEN 13201-5) which represents the annual energy consumption(kWh)
per square meter but also the installation efficacy can be calculated (lm/W) and
lighting power density (DP).
Figure 3-10 Formulas for modelling energy consumption in road lighting lighting
3.2.3.2 Use parameters influencing lighting system control
3.2.3.2.1 Day time, night time and road traffic dimming
Daylight and smart dimming as a function of traffic and weather conditions can
contribute to energy savings. Therefore operating times(tfull, tred) and a reduction
coëfficient for dimming(kred) are defined.
Approach:
For modelling this effect EN 13201-5 defines:

Preparatory study on lighting systems
Month Year I 199
tfull = annual operating time at full illumination level (h)
tred =annual operating time at full illumination level (h)
kred = reduction coefficient for the illumination level (h)
Background:
Globally the dark period is 4000 h per year. Seasonal changes between winter and
summer increase with distance from the equator. Nordic countries have daylight
during almost the whole day in summer and are dark (almost) all day in winter. At
equinox (21 March and 21 September) day and night periods are equal everywhere
over the globe. As a consequence 4000 operating hours per year is the universal
default value for street lighting. Switching off street lighting later in the night is rarely
applied and there are several arguments why this is the case as explained below.
Public lighting requirements are traditionally dominated by road traffic safety concerns
and the perceived security feeling especially in densely populated areas. The absolute
reduction of crime by public lighting is not proven and is controversial. Several studies
show that lighting can displace criminality from higher lit places to lower lit places164.
Switching off 50 % of the lamps in alternating patterns causes poor uniformity in the
illumination of the street, one of the important performance requirements for public
lighting, a better alternative is dimming each luminaire.
The Expert inquiry of lot 9 (2007) sent out to all stakeholders showed that complete or
partial switch off is rarely applied in the 25 EU-countries, and is probably only used for
a maximum of up to 5% of the EU’s roads.
One reason why this is the case might be that the lamp survival factor of a discharge
lamp is negatively influenced by the number of switching cycles during its lifetime, due
to the high voltage peak that the ignitor generates to start the lamp. If the number of
switching cycles is doubled the normal lifetime of a discharge lamp is shortened by
30%.
Dimming related to traffic density is rarely done but the method is included in
guideline CEN/TR 13201-1, in this case traffic density should be interpreted on an
hourly basis and light levels could be adapted accordingly. This new practice is not yet
incorporated in this guideline and traffic density is expressed on a daily basis resulting
in one road class connected to a particular road. It is also clear that road classes with
high light levels selected on a daily basis can benefit more from dimming compared to
lower level classes. One objective of the 'E-street' SAVE project was to contribute to
the development of standards and guidelines adapted to intelligent dimming. Work
group CIE 40.44 is working on this subject.
Dimming related to local weather conditions is also rarely done and limited data is
available, therefore the lot 9 study assumed a minimum saving of approx. 5% only
when stepwise electronic dimming ballasts are provided.
Values used for this study:
The proposal for this study is to use the following default values:
tfull = 4000 h
tred = 0 h
kred = 0
In Task 4 more appropriate schemes that include dimming will be investigated.
3.2.3.2.2 Constant illumination control (Fclo)
Constant light output (CLO) control of a road lighting installation aims to provide a
constant light output from the light sources. Therefore the constant light output
control factor (Fclo) is defined.
164 Narisada K. & D. Schreuder (2004), Light pollution handbook., Springer verlag 2004, ISBN 1-4020-2665-X
Preparatory study on lighting systems
Month Year I 200
Approach:
The approach proposed in this study is to follow the same approach as suggested for
indoor lighting in section 3.2.1.2.4, hence:
Fclo = Fc
Background:
Smart dimming to compensate for Lamp Lumen Maintenance Factor (FM):
See section 3.2.1.2.4.
Smart dimming to fine tune to local parameters and avoid over-lighting:
This function allows adjustment to the minimum required light level when using the
standard available wattages with their stepwise changing lumen outputs, for example:
luminaire with a 70 W HPS versus 100 W HPS lamp. New dimming electronic control
gear enables the maximum lumen output to be set according to the minimum
illumination required.
Calculation and values used for this study:
For non-dimming systems we assume that this results in 10% over-lighting (see lot
9).
For smart dimming systems it is assumed that the light output is matched to the
minimum requirements.
3.2.3.3 Influence of maintenance factors (FLM, FLLM, FRSM)
See section 3.2.1.3 for definition and approach.
Calculation and values used for this study:
According to the benchmark formulated in EC Regulation 245/2009, luminaires should
have an optical system that has an ingress protection rating as follows:
— IP65 for road classes M
— IP5x for road classes C and P.
The corresponding maintenance factor (FM) is sourced from standard CIE 154 (see
Task 1) based on the maintenance cycle and the ingress protection.
FLS and FLLM values are based on data supplied by luminaire manufacturers (see Task
4).
3.2.3.4 Use parameters influencing the lighting system utilance
The Utilance (U) of an installation for a reference surface (see Task 1) is defined as
the ratio of the luminous flux received by the reference surface to the sum of the
individual total fluxes of the luminaires of the installation (IEC 50/CIE 17.4). It is a
metric for the efficiency of the lighting installation to convert luminaire lumens into
illuminance on the road surface.
Approach:
It can be calculated analytically from the geometry with lighting design software using
the following formula:
U = Em/( Ф x A)
Wherein,
Ф = Rated luminous flux
Em = Maintained illuminance
A = Task Area

Preparatory study on lighting systems
Month Year I 201
Figure 3-11 Utilance for road lighting can be obtained from lighting design
calculations165.
Methods for increasing the Utilance will be discussed in Task 4.
Background:
In street lighting the utilance is of particular importance, as it is a measure of the
proportion of the light that is directed towards the area to be lit. However, not all light
is directed to this area, see Figure 3-12, as sometimes light is directed towards the
sky and is wasted. Even the most efficient luminaires can lead to a waste of light when
they are not properly used due to wrong tilt angle orientation or the optics used in the
luminaire, therefore proper lighting design and installation is important to obtain
energy efficient street lighting.
Figure 3-12: More than half of the light is directed to the sky or sea and is wasted
Impact from road width:
The road width is an important parameter defining the road surface to be lit.
165 Simulation done by Dialux Evo: www.dial.de
Preparatory study on lighting systems
Month Year I 202
In the Lot 9 study an enquiry was sent out to all stakeholders. This is a summary of
the replies:
The received answers indicate almost the same (standardized) width for
traffic lanes in the different road categories; for class M we found 3.50 to
3.75m, for class C 3.50m and for class P 2.50m to 3.00m.
There were typically 2 traffic lanes per direction for class M roads (but
sometimes 3 or 4), for class C and P there is most often 1 lane per
direction.
Definition of the useful area:
Any functional lighting system is likely to cause interference with its surrounding
environment because the luminaire should direct the light towards the surface or
objects that need to be lit and nothing else, but this is not always the case e.g. in
street lighting when light is directed toward the sky.
Lighting point spacing and spacing to height ratio (SHR):
The spacing between lighting poles or lighting points and the height of them can vary
substantially.
In the lot 9 study an enquiry was sent out to all stakeholders. This is a summary of
the replies:
For the M road classes there is a very large difference in the spacing applied
by EU countries, varying from 40 to 90m, although the spacing/height ratio
is approximately the same: 4 (e.g. 90/20, 60/15, 48/12, 40/13). In class M
there are several subclasses (M1 to M5 see EN13201) with increased
illumination levels.
For the C road classes the spacing/height ratio applied varies between 4.5
and 3 (e.g. 45/10, 50/12.5, 35/11). In class C there are several subclasses
(C1 to C5 see EN 13201).
For the P roads classes the divergence of the spacing/height ratio is
between 5 and 4 (e.g. 40/8, 36/8, 25/5, 30/7, 20/4). In class P there are
several subclasses (P1 to P5 see EN 13201).
It is logical that the SHR varies between the categories. In classes M and C, the
European standard imposes severe limitations on the glare caused by the luminaires.
This means that the luminaires cannot have wide beam light distributions and so the
spacing is limited to about 4 times the height. In class P, the limitations on glare are
lower and commonly lamps with smaller wattages are used so the risk of glare also
decreases; implying that the luminaires can have wide beam optics and the spacing
can therefore be higher. In residential areas there is generally a limitation on the pole
height, but with a higher SHR the spacing can be adjusted to reasonable values.
Road Reflection for class M traffic with luminance requirements:
This is based on CIE 144(2001): Road surface and road marking reflection
characteristics. This standard is required to calculate the luminance value from
illumination conditions for various types of surface. This can be done with an average
luminance coefficient (Q0) as defined in CIE 144: 'A measure for the lightness of a
road surface being defined as the value of the luminance coefficient q averaged over a
specified solid angle of light incidence' with: Lm = QO x Em . Typical values for Q0 are
given in Table 3-7 and the expert enquiry results in Table 3-8. Please note that real
road reflection can vary strongly depending on local conditions (dustiness, wetness,
etc.) from -40 % up to 60 %.
Table 3-7: Average luminance coefficient (Q0): parameter values applied in this study
Class Q0 description mode of reflection
R1 0.1 concrete road or asphalt with minimum 12 % of mostly diffuse

Preparatory study on lighting systems
Month Year I 203
artificial brightener
R2 0.07 Asphalt (for more info see standard) mixed
R3 0.07 Asphalt (for more info see standard) slightly specular
R4 0.08 Asphalt (for more info see standard) mostly specular
Table 3-8: Expert inquiry results
Class M Class C Class P
% high Q0
reflection
(concrete)
% low Q0
reflection
(asphalt)
% high Q0
reflection
(concrete)
% low Q0
reflection
(asphalt)
% high Q0
reflection
(concrete)
% low Q0
reflection
(asphalt)
% 5 95 5 95 5 95
Typical
Q0
0.075 0.075 0.075
Calculation method and values used for this study:
The Utilance will be calculated with lighting design software in Task 4 for the reference
designs discussed in section 3.1.2.
3.2.3.5 Luminaire and lamp efficacy parameters
Please consult the complementary light source study166 (lot 7).
3.2.4 Energy consumption of road lighting in the use phase that is not yet
covered EN 13201-5
The performance parameters defined in chapter 1 are obtained under standard test
conditions, however in real life these parameters can deviate from the values derived
under the standard conditions. Hereafter we will discuss four factors that can influence
the energy consumption of (mainly) luminaires in real life; for example temperature,
line voltage, weather conditions, traffic density, ...
Approach:
The following parameter (see definition in chapter 1) could be defined:
BMF: Ballast Maintenance Factor
Background:
Street lighting, colour and the sensitivity of the human eye and nature:
It is important in the context of street lighting that the actual standard performance
requirements on photometric values as defined in chapter 1 (lumen, lux, candela) are
defined for photopic vision only. There are, however, studies that indicate that white
light is optically beneficial compared to more yellowish light at similar but very low
illuminance levels, when also considering scotopic and mesopic vision.
Photopic vision is the scientific term for human colour vision under normal lighting
conditions during the day.
The human eye uses three types of cones to sense light in three respective bands of
colour. The pigments of the cones have maximum absorption values at wavelengths of
about 445 nm (blue), 535 nm (green), 575 nm (red). Their sensitivity ranges overlap
to provide continuous (but non-linear) vision throughout the visual spectrum. The
maximum possible photopic efficacy is 683 lumens/W at a wavelength of 555 nm
166 http://ecodesign-lightsources.eu/

Preparatory study on lighting systems
Month Year I 204
(yellow-green) according to the definition of the CIE 1931 standard observer167 as
illustrated in Figure 3-13. As illustrated in this figure, with ‘white light’ as defined in
Commission Regulation (EC) No 859/2009, this maximum efficacy of 683 lm/W cannot
be reached. It will depend on the definition of ‘white light’ and its chromacity
coordinates (CIE XY), see Figure 3-13.
Figure 3-13 Maximum possible luminous efficacy (lumens per watt) shown on CIE
1931 chromaticity diagram (Schelle, 2014168)
Scotopic vision is the scientific term for human vision "in the dark".
In that range, the human eye uses rods to sense light. Since the rods have a single
absorption maximum scotopic efficacy of about 1700 lumens/W at a wavelength of
507 nm according to the definition of the CIE 1951 scotopic standard observer167,
scotopic vision is colour blind. The sensitivity range of the rods makes the eye more
sensitive to blue light at night, while red light is almost exclusively perceived through
photopic vision.
167 https://en.wikipedia.org/wiki/Luminosity_function 168 Schelle (2014): ‘Maximum Efficacy/Efficiency of Coloured Light and Practical Applications’, By Donald Schelle, Analog Field Applications Engineer - Texas Instruments Article Q1/CY14, February 17, 2014, www.ti.com

Preparatory study on lighting systems
Month Year I 205
Mesopic vision is the scientific term for a combination between photopic vision and
scotopic vision in low (but not quite dark) lighting situations.
The combination of the higher total sensitivity of the rods in the eye for the blue range
with the colour perception through the cones results in a very strong appearance of
bluish colours (e.g. flowers) around dawn.
Please note that the assessment of the advantages/disadvantages of more white light
in road lighting is complicated and the subject of ongoing research studies (e.g. EU
Growth Project 'MOVE: Mesopic Optimisation of Visual Efficiency') coordinated by the
CIE Technical Committee on 'Visual Performance in the Mesopic Range' (1-58)). As a
consequence, at low light levels or so called 'mesopic view conditions' photometric
values such as lamp efficacy or luminance could be corrected.
Temperature:
See section 3.2.2.
Line voltage:
See section 3.2.2.
Lamp voltage:
See section 3.2.2.
Power factor compensating capacitor aging:
See section 3.2.2.
Weather conditions:
TBW.
Traffic density:
TBW. (Input required: might be related to EN 13201-1?)
Car headlights:
It is also possible to provide road lighting with car headlights for motorized traffic, but
so far EN 13201 does not take this into account. In Task 4 it is possible that the
impact from car headlights will be discussed.
Conclusions and values used for this study:
It is proposed to neglect in this study the losses due to deviations in operating
conditions of luminaires and light colour from the standard conditions, as discussed,
because more precise data and evidence is missing and also taking these effects into
account is not a common practice.
Nevertheless, it is worthwhile assessing (if possible) the potential impact of new types
of smart car headlights in road class M, e.g. high beam headlights to reduce glare for
counter-flow traffic.
3.3 Indirect impact of the use phase on energy consumption
Scope: The objective of this section is to identify, retrieve and analyse data, and
report on the environmental & resources impacts during the use phase for ErP with an
indirect energy consumption effect. This is only relevant for indoor lighting.
3.3.1 Heat replacement effect in buildings
TBW (An example/reference building with full EN 15193 calculation and a monthly
energy balance would be welcome).
Note: this will depend on the heating/cooling period of the selected building.
3.3.2 Impact on the cooling loads in buildings
TBW(An example/reference building with full EN 15193 calculation and a monthly
energy balance would be welcome).
Note: this will depend on the heating/cooling period of the selected building.

Preparatory study on lighting systems
Month Year I 206
3.3.3 Conclusion on indirect impact on heating and cooling in buildings
TBW
3.4 End-of-Life behaviour
Scope: The scope of this section is to identify, retrieve and analyse data, and report
on consumer behaviour (avg. EU) regarding end-of-life aspects. This includes: product
use & stock life, repair- and maintenance practice and other impact parameters.
3.4.1 Economic Lifetime of the lighting installation
3.4.1.1 Economic Lifetime of indoor lighting installations
Because the lifetime of lighting equipment is shorter than of buildings, there is a
natural need for recurring retrofits169.
A measurement campaign in offices in the PACA region in France showed that the
average age of a luminaire for fluorescent tubes is 10.1 years 151,152.
The SAVE study170 reports an average life of a lighting installation in offices in the EU-
15 of 24 years: ranging from 19 years in the West region (reported by UK and
Ireland) to up 28-30 years in the North region (reported by Finland and Denmark
respectively).
Experience in the Netherlands shows that in half of the offices a lighting system of
over 20 years is installed. These miss out on the technological developments and the
related savings. Philips states that office lighting is often out-of-date because the rate
of replacement is very, very slow. Per office, yearly 7 to 10% of the lighting is
replaced; so it takes about 15 years before a lighting installation is replaced (Berno
Ram in Van de Wiel, H., 2006). In another report171 this concern was also confirmed.
The average lighting stock gradually improves as newer, more efficient installations
replace old, inefficient ones; however, much of the existing stock remains unchanged.
The governments of the New Member States report the highest level of need for
refurbishment in the EU.
The data presented above are also consistent with the information retrieved from the
expert inquiry in the lot 8 study (2007): in Belgium, Germany and Spain lighting
installations are currently being renewed in offices on average every 15-20 years. The
German respondent remarked that a partial renovation, refurbishment or repair will be
more frequent, but a total reinstallation less so.
Conclusion:
The lighting installation lifetime is assumed to be 20 years on average (+/- 10 years)
3.4.1.2 Economic Lifetime of road lighting installations
The average overall lifetime for luminaires is expressed in years after placement.
Because the lifetime is only influenced by local conditions such as weather (humidity,
wind…), pollution, vibrations caused by traffic density, etc., time in service should not
be taken into account. A lifetime of 30 years is common practice. This figure is based
on practical experiences and is confirmed by the first responses to our inquiry (Table
3-9). The variation can be considerable. Whereas in the centre of municipalities and in
shopping streets - where public lighting is an element of street furniture - replacement
times can be much shorter e.g. 15 years. In rural areas - with very low traffic density
- luminaires with an age of 35 years and even more can be encountered. Many
169 ATLAS, 2006. http://ec.europa.eu/comm/energy_transport/atlas/htmlu/lightdmarbarr.html 170 Novem, 1999. Study on European Green Light: Saving potential and best practices in lighting applications and voluntary programmes. SAVE report 171 Ecofys, 2005. Cost-effective climate protection in the building stock of the new EU Member States: Beyond the EU Energy Performance of Buildings Directive. Report for EURIMA

Preparatory study on lighting systems
Month Year I 207
installations of 20 years and older are of course no longer complying with the
standards on illumination, depending on the maintenance regime applied. Regular
cleaning of the luminaire is necessary. This cleaning necessity depends strongly on the
characteristics of the luminaire. Where the reflector of an open luminaire needs a new
polish and anodizing at least every 10 years; a cleaning of the outer glazing at lamp
replacement can be sufficient for luminaires with an IP65 optical compartment.
As mentioned before, a product life of 30 years for a luminaire is common practice,
but the standard deviation on this lifetime is significant. In the centre of municipalities
and in shopping streets, public lighting installations are an element of street furniture
and therefore often have shorter replacement times.
Conclusion:
Regarding average installation lifetime, see Table 3-9.
Table 3-9: Luminaire life time: parameter values applied in this study
Road class M Road class C Road class P
min. avg. max min. avg. max min. avg. max
life
time (y)
25 30 35 25 30 35 15 30 35
3.4.2 Typical maintenance time for indoor lighting systems
Maintenance costs may have a major impact on equipment choices: for long time
uses, one may prefer long life duration light sources to minimise employment-related
refurbishing costs. Lack of understanding of the consequences of poor maintenance
leads to many lighting installations being poorly maintained. There are indications that
the benefits of maintenance are not clearly understood by lighting owners169.
The required installation and maintenance time, estimates are included in Table 37 on
the basis of experience.
Table 3-10: Estimation of maintenance and installation cost related parameters used
for LCC calculations in this study
Time required for installing one luminaire
(t-luminaire install)
20 min.
Time required for group lamp replacement
(t-group relamping)
3 min.
Time required for spot lamp replacement
(t-spot relamping)
20 min.
Time required for luminaire cleaning (in addition to time for group lamp replacement)
(t-luminaire cleaning)
1.5 min.
3.4.3 Typical maintenance time of road lighting systems
The required installation and maintenance time for street lighting was estimated based
on 25 years of experience in Belgium (L. Vanhooydonck) and is included in Table 3-11.

Preparatory study on lighting systems
Month Year I 208
Table 3-11: Estimation of maintenance and installation time parameters
Time required for installing one luminaire
(group installation)
20 min.
Time required for lamp replacement (group
replacement)
10 min.
Time required for lamp replacement (spot
replacement)
20 min.
Time required for maintenance including
ballast replacement
30 min.
3.4.4 Frequency of maintenance cycle and repair or re-lamping of
installations
In non-residential lighting it is common practice to compare solutions based on the
total system costs172,173 taking into account the capital cost related to the initial
installation, with the estimated energy cost and cost for maintenance. Of course, this
does not exclude that many existing installations are operating on the market that do
not follow their planned maintenance schedule.
Approach:
The typical periods for maintenance on installations are:
tgroup = is the time for group lamp replacement in years (y)
tcleaning = is the period for cleaning luminaires and lamps
tspot = is the period for a spot replacement of a lamp or an abrubt failure of an LED
luminaire.
The time period for a group replacement (tgroup) defines the Lamp Survival Factor
(FLS) or in case of LEDs by the LED module failure fraction, Fy (IEC 62717). They are
related to manufacturing data, see Task 4 on technology.
The time period related to cleaning (tcleaning) is related to cleaning luminaires and
the Luminaire Maintenance Factor (FLM), see sections 3.2.1.3 and 3.2.3.3. Group
replacement and luminaire cleaning can be combined, for example tgroup =
2xtcleaning.
The annual consumption of lamps per luminaire in standard conditions is
straightforward and related to the Lamp Survival Factor (FLS) and the time period for
group replacement (tgroup) in years:
Ny = 1 / tgroup + (1 - FLS) / tgroup
Note: it is assumed that when carrying out spot replacement only the broken lamp is
replaced even when several lamps are installed in one luminaire.
The annual consumption of ballasts (electronic control gear) per luminaire in standard
conditions (ballast tc point @ 70 °C) will be modelled according to catalogue data
(OSRAM catalogue 2006/2007 p. 11.132):
Nb = BFR/100x toperating /1000h x Nbal
Where:
• BFR = ballast failure rate per 1000 h with the ballast tc point @ 70 °C.
• Nbal = number of ballasts per luminaire.
172 licht.wissen 01 ‘Lighting with Artificial Light’ available from licht.de 173 ZVEI(2013): ‘Guide to Reliable Planning with LED Lighting Terminology, Definitions and Measurement Methods: Bases for Comparison’.
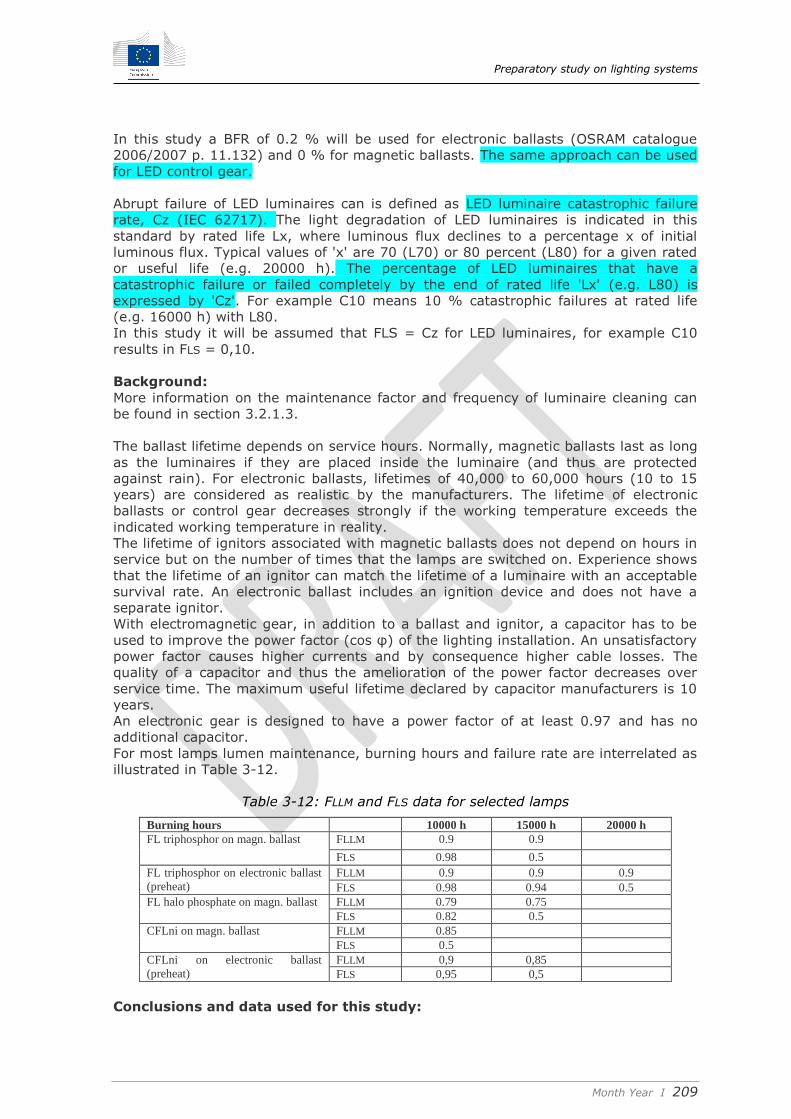
Preparatory study on lighting systems
Month Year I 209
In this study a BFR of 0.2 % will be used for electronic ballasts (OSRAM catalogue
2006/2007 p. 11.132) and 0 % for magnetic ballasts. The same approach can be used
for LED control gear.
Abrupt failure of LED luminaires can is defined as LED luminaire catastrophic failure
rate, Cz (IEC 62717). The light degradation of LED luminaires is indicated in this
standard by rated life Lx, where luminous flux declines to a percentage x of initial
luminous flux. Typical values of 'x' are 70 (L70) or 80 percent (L80) for a given rated
or useful life (e.g. 20000 h). The percentage of LED luminaires that have a
catastrophic failure or failed completely by the end of rated life 'Lx' (e.g. L80) is
expressed by 'Cz'. For example C10 means 10 % catastrophic failures at rated life
(e.g. 16000 h) with L80.
In this study it will be assumed that FLS = Cz for LED luminaires, for example C10
results in FLS = 0,10.
Background:
More information on the maintenance factor and frequency of luminaire cleaning can
be found in section 3.2.1.3.
The ballast lifetime depends on service hours. Normally, magnetic ballasts last as long
as the luminaires if they are placed inside the luminaire (and thus are protected
against rain). For electronic ballasts, lifetimes of 40,000 to 60,000 hours (10 to 15
years) are considered as realistic by the manufacturers. The lifetime of electronic
ballasts or control gear decreases strongly if the working temperature exceeds the
indicated working temperature in reality.
The lifetime of ignitors associated with magnetic ballasts does not depend on hours in
service but on the number of times that the lamps are switched on. Experience shows
that the lifetime of an ignitor can match the lifetime of a luminaire with an acceptable
survival rate. An electronic ballast includes an ignition device and does not have a
separate ignitor.
With electromagnetic gear, in addition to a ballast and ignitor, a capacitor has to be
used to improve the power factor (cos φ) of the lighting installation. An unsatisfactory
power factor causes higher currents and by consequence higher cable losses. The
quality of a capacitor and thus the amelioration of the power factor decreases over
service time. The maximum useful lifetime declared by capacitor manufacturers is 10
years.
An electronic gear is designed to have a power factor of at least 0.97 and has no
additional capacitor.
For most lamps lumen maintenance, burning hours and failure rate are interrelated as
illustrated in Table 3-12.
Table 3-12: FLLM and FLS data for selected lamps
Burning hours 10000 h 15000 h 20000 h
FL triphosphor on magn. ballast FLLM 0.9 0.9
FLS 0.98 0.5
FL triphosphor on electronic ballast
(preheat)
FLLM 0.9 0.9 0.9
FLS 0.98 0.94 0.5
FL halo phosphate on magn. ballast FLLM 0.79 0.75
FLS 0.82 0.5
CFLni on magn. ballast FLLM 0.85
FLS 0.5
CFLni on electronic ballast
(preheat)
FLLM 0,9 0,85
FLS 0,95 0,5
Conclusions and data used for this study:
Preparatory study on lighting systems
Month Year I 210
TBW
3.4.5 Recycling and disposal of the luminaire
Recycling and disposal of the luminaire, ballast, lamps and other electronic parts is the
responsibility of the manufacturers according to the WEEE Directive. Manufacturers
can choose between organizing the collection themselves or join a collective initiative
such as Recupel (Belgium), RecOlight (U.K.), Recylum (France), Ecolamp (Italy),….
These organizations provide the collection and recycling service for the manufacturers
and collect the waste from installers or companies doing technical maintenance &
repair in street lighting. In practice, installers or companies doing technical
maintenance & repair, remove and collect the luminaires and separate the lamps.
Additional information is given at: www.recupel.be, www.ear-project.de,
www.zvei.org, www.uba.de, www.bmu.de, www.altgeraete.org, www.bitkom.org,
www.Eco-Lamp.sk, www.dti.gov.uk.
With respect to hazardous substances in the other parts, PCB’s can still be found in old
capacitors within equipment that is older than approximately 20yrs. The use of PCBs
in new equipment is forbidden and in practice is no longer the case.
See also the light source study148.
3.5 Local Infra-structure
Scope: The objective of this section is to identify, retrieve and analyse data, and
report on barriers and opportunities relating to the local infra-structure regarding
energy water, telecom, installation, physical environment...
3.5.1 Opportunities for lighting system design and the follow up process
As will be illustrated in Task 4 much of the energy saving possibilities created at
system level are the results of starting with a good lighting system design. This is the
job of the lighting system designer who brings together requirements of the visual
tasks, requirements of people, opportunities provided by the space for example
possibilities to ease or simplify installation and maintenance, availability of daylight,
occupancy patterns, surface finishes, etc. By combining the correct luminaires with the
best control strategy to match the space and tasks, and by providing flexibility in the
lighting scheme to allow the lighting to be varied according to user requirements over
time, energy savings may be made whilst providing a safe and comfortable
environment. For this design process, the lighting designer can rely on existing EN
standards such as EN 15193 or EN 13201-5 to optimise energy savings, see sections
3.2.1.1 and 3.2.3.1. In this design process minimum lighting performance
requirements can be sourced from established standards such as EN 12464-1 for
indoor lighting of work places, see also Task 1. This process using standards is also
illustrated in Figure 1-2 and Figure 1-3. These standards can provide an objective
basis for comparison of alternative designs and therefore yield to more optimised
solutions.
After the design stage it is important that the installation complies with the design
which is the job of the installer. Nevertheless, during the installation modifications
could occur compared to the original design specification. For example, another carpet
with a different reflection coefficient might be selected. This will have an impact on the
performance, see section 3.2.1.4. Therefore it is useful to involve a commissioning
engineer, who can incorporate these changes in the final lighting system settings to

Preparatory study on lighting systems
Month Year I 211
obtain optimal performance. This will allow a verification engineer to check for final
acceptance of the delivered system on behalf of the building owner.
Once the system has been delivered and starts operation, further savings can be
obtained by an appropriate follow up of the lighting system. This can be done by
building operation and maintenance personnel. For example as explained in later
section 3.5.10, the task area function might change over the life time of the building
which could require new lighting system settings. Also fine tuning of the building
automation control system for occupancy and light measurement might be useful111.
Luminaire cleaning can also contribute to energy savings, see sections 3.2.1.3 and
3.2.3.3.
As a conclusion, the full chain of potential actors that are ideally involved in the
process from lighting design until operation and maintenance is illustrated in Figure
3-14. Using this full chain of actors could be an opportunity to increase employment
while also having the economic benefits from the energy savings.
Figure 3-14 Full chain of actors involved from lighting system design until
maintenance and operation
3.5.2 'Lock-in effect' for new products due to limitations imposed by existing
in road lighting
Previous investments in infrastructure (lamp poles, grids) can obviously lead to 'lock
in' effects. Usually, pole distances cannot be changed without substantial
infrastructural changes and related costs. As a consequence the maximum obtainable
energy savings cannot always be realized without additional investments.

Preparatory study on lighting systems
Month Year I 212
Figure 3-15: Street lighting luminaire attached to cables(left) and to electricity
distribution (right)
Figure 3-16: Street lighting luminaires attached to poles(left) and to a house (right)
Examples:
Luminaires can be attached to poles for electricity distribution, to poles for
public lighting only, to houses, or on cables above a street (see Figure 3-15
and Figure 3-16). It is clear that light point locations cannot be changed
without great infrastructural changes and related costs. Therefore in re-lighting
projects (with more efficient luminaires and/or more efficient lamps) the pole
distance usually cannot be changed. If the new installation supplies a useful
luminous flux that is higher than necessary, the maximum energy savings will
not be reached.
Public lighting can be connected together with the residential electrical
distribution grid or have a separate grid. A separate grid is sometimes required
for tele-management systems.
Lamps are only sold in a defined and limited power series (e.g. 50-70-100-150
Watt). This implies that in real circumstances an overpowering can occur to
meet the minimum required light levels. Fine tuning of the maximum lamp
power set point by using lamp power dimmable ballasts or installing line
voltage regulators can adjust the light output to the required levels.

Preparatory study on lighting systems
Month Year I 213
HID lamp power is regulated by the integrated ballast in the luminaire. This
means that when replacing a lamp with a more efficient one, there is no energy
saving but only more light output from the lamp. The only solution for this is
again via fine tuning of the maximum lamp power set point with dimmable
ballasts or installing line voltage regulators.
3.5.3 Lack of interest by authorities
Public street lighting has to provide good visibility to users of outdoor public traffic
areas during the hours of darkness to support traffic safety, traffic flow and public
security. On the other hand, the public authorities are responsible for procurement
and management of public lighting installations. If the public lighting installations
provide the required visibility, investments in energy saving projects that do not give
quick earnings are often not a priority.
Examples:
There exist many compromising motivating factors that can prevail at the
design stage of public lighting installations, including: budget and planning for
investments in new street lighting (infrastructure), pay-back period for new
investments, risk of quality related complaints from adoption of new
technology, general resistance to change, etc.
A new trend called 'city beautification' can also be identified. The main
objective is to make city centres more attractive and install decorative street
lighting luminaires with designs that fit with historical buildings or the city
character. Aesthetics are the most important parameter in this case and these
might compromise the eco-design characteristics of street luminaires. In many
cases design architects are dominating projects and it will be important that
these people are aware of environmental impacts (see also limitation in 3.3.4)
and of the advantages of new eco-designed products.
3.5.4 Lack of interest by the office building owner
As stated in the definition, the 'building owner' can influence many types of
subcontractor activities. A simple overview of 'metrics for defining success' related to
the contractor or subcontractor is shown in Table 3-13. All actors will try to influence
the 'building owner' and motivation can therefore be very diverse. Finally, the lighting
designer (if involved) needs to look for a compromise solution and the products which
best meet this. From the table it is also clear that there are many more factors
involved then energy efficiency alone.

Preparatory study on lighting systems
Month Year I 214
Table 3-13: Compromising motivating factors that may influence the selection and
design of lighting systems'
subcontractor/contractor performance metric
Building developers* euro per square meter
Electrical engineers* Watt per square meter, code compliance
Lighting engineers* illuminance, quality of light
Construction managers* Planning and specifications/adherence to drawings
Contractors* Budget and schedule (no call-backs)
Suppliers* Sales and margins
Construction workers* Signoff
Leasing agents* Quick rental; euro per square meter
Building operators* Simple payback
Maintenance staff* Complaints
Architects** Creative expression, Pride, Profit
Utility DSM (Demand Side Management) staff* Euro per avoided kilowatt and kilowatt-hour
* Adapted from Energy Efficient Buildings: Institutional Barriers and Opportunities by E-Source, Inc., 1992 ** Adapted from Commercial and Industrial Lighting Study by Xenergy, Inc., 2000
3.5.5 Lack of knowledge or skilled subcontractors
The proliferation of more advanced lighting design and energy saving techniques can
require additional skills that might not be available thus can form a market barrier,
see also section 3.5.1.
For example, freely available lighting design software lowers the technical barrier to
lighting design without requiring basic knowledge regarding lighting fundamentals and
awareness about realistic lighting system performance. As a consequence, there can
sometimes be too much reliance on outputs of lighting software without scrutiny of the
results.
Also complex lighting energy saving techniques where office, or building layout
interacts (e.g. day lighting, presence detection, indirect lighting) could suffer from this
lack of knowledge in the office design stage.
3.5.6 Lack of user acceptance for automatic control systems
It is important to take 'user acceptance' into account especially with automatic control
systems. For example, experiences with complex daylight responsive control systems
show that problems may occur when users do not know the purpose or how it works
(IEA task 21 (2001)). These problems can vary from complaints to completely
overruling the system through bypassing or deactivating it, which will normally leads
to reduced energy saving.
3.5.7 Limitations imposed by local light colour preferences
It is possible that the local population, or the local authority purchasing the
equipment, has preference for a certain light colour blend (gold, cold white, yellow, ..)
that best fits their perception of comfort according to: local climate (warm, cool, rainy,
snow,..), colour of street surrounding buildings, etc.

Preparatory study on lighting systems
Month Year I 215
Examples:
CIE defines a chromaticity diagram and provides a sense of the visual
appearance of the light sources and an indication (colour temperature) of how
visually a 'warm' or 'cool' lamp appears (1976 CIE chromaticity diagram).
(IEA (2006)174 p. 106): 'Lamp sales around the world reveals an apparent user
preference for 'cooler' light sources the closer the illuminated locations is to the
equator'.
The high energy efficient High Pressure Sodium lamp have a warmer (gold)
colour compared to the energy inefficient High Pressure Mercury lamp ('cool
white').
3.5.8 Lack of skilled work force
The proliferation of more advanced lighting systems and energy saving techniques can
require additional skills that people responsible for design and installation might be
lacking, see also section 3.5.1.
Examples:
This is especially the case for lighting energy saving techniques where complex
tele-management technologies are used (e.g. traffic density and weather
related dimming, fine tuning of maximum power point according to real street
lighting surroundings, special lamp versus ballast requirements, etc.).
Optical systems that require fine tuning related to the real surroundings.
‘Easy to use’ calculation programs, can give the impression that anybody can
design street lighting installations. This fact may obscure a lack of design skills,
discernment and scrutiny of the results.
When urban architects are more involved in street lighting they need technical
lighting designer skills.
3.5.9 Light pollution and sky glow
Much as artificial lighting provides a very useful service, it has also given rise to a
side-effect known as 'light pollution'. For example, in most of our urban environments
it is no longer possible to see any but the brightest stars as a consequence of light
emitted by outdoor lighting illumination.
Light pollution is defined in guideline CIE 126(1997) on 'Guidelines for minimizing sky
glow' as 'a generic term indicating the sum-total of all adverse effects of artificial
light'. The next sections present a short summary of the adverse effects of artificial
light that have been be identified in the literature.
Sky glow' (Figure 3-17) is defined (CIE 126(1997)) as:
'the brightening of the night sky that results from the reflection of radiation (visible
and non-visible), scattered from constituents of the atmosphere (gas molecules,
aerosols and particulate matter), in the direction of the observation. It comprises two
separate components as follows:
(a) Natural sky glow – That part of the sky glow which is attributed to radiation
from celestial sources and luminescent processes in the Earth’s upper
atmosphere.
(b) Man-made sky glow – That part of the sky glow which is attributable to
man-made sources of radiation (e.g. outdoor electric lighting), including
radiation that is emitted directly upwards and radiation that is reflected
from the surfaces of the Earth'.
Potential obtrusive effects from outdoor lighting are described in technical guide CIE
150 (2003) on 'The limitation of the effects of obtrusive light from outdoor lighting
installations'.
174 IEA, 2006. Light’s Labour’s Lost: Policies for energy-efficient lighting’

Preparatory study on lighting systems
Month Year I 216
‘Obtrusive light’ is defined (in CIE 150) as 'spill light, which because of quantitative,
directional or spectral attributes in a given context, gives rise to annoyance,
discomfort, distraction or a reduction in the ability to see essential information' (CIE
150 (2003)).
There are also adverse effects of outdoor lighting reported175,176,177on: the natural
environment (e.g. insect, disruption of bird habitats, etc.), residents (e.g. light
trespass in bedrooms), on transport system users (e.g. Figure 3-17), sightseeing and
astronomical observation.
It is therefore also possible to distinguish ‘astronomical light pollution’ that obscures
the view of the night sky, from ‘ecological light pollution’, that alters natural light
regimes in terrestrial and aquatic ecosystems. 'The more subtle influences of artificial
night lighting on the behaviour and community ecology of species are less well
recognized, and could constitute a new focus for research in ecology and a pressing
conservation challenge'178.
Figure 3-17: Examples of light pollution: sky glow (left) and glare (right)
In the case of street lighting luminaires research shows that the emission angle of the
upward light flux plays a role in reducing sky glow179. It was found that if the distance
from the city increases, the effects of the emission at high angles above the horizontal
decrease relatively to the effects of emission at lower angles above the horizontal.
Outside, some kilometers from cities or towns, the light emitted by luminaires
between the horizontal and 10 degrees above the horizontal is as important as the
light emitted at all the other angles in producing the artificial sky luminance. Therefore
to reduce the light emitted between the horizontal and 10 degrees above by street
lighting luminaires could be an objective in fighting light pollution.
It is expected that measures aiming at increasing energy efficiency will reduce the
amount of wasted light and have a positive effect on mitigating "light pollution".
175 CIE 150 (2003) technical report. 176 Narisada K. & Schreuder D. (2004) Light pollution handbook., Springer verlag 2004, ISBN 1-4020-2665-X 177 Steck B. (1997) Zur Einwirkung von Aussenbeleuchtungsanlagen auf nachtaktive Insekten', LiTG-Publikation Nr. 15, ISBN 3-927787-15-9 178 T. Longscore & C. Rich (2004): 'Ecological light pollution', Frontiers in Ecology and the Environment: Vol. 2, No. 4, pp. 191–198 179 Cinzano et al. (2000a) ' The Artificial Sky Luminance And The Emission Angles Of The Upward Light Flux', P. Cinzano, F.J. Diaz Castro, Mem. Soc. Astro. It., vol.71, pp. 251-256

Preparatory study on lighting systems
Month Year I 217
3.5.10 Selection of the task area according to EN 12464 and impact on the
light levels
It is important that the designer does not over specify the requirements of each area
in the building, for example in Table 3-1 on general areas such as gangways in
buildings. Apart from that it is also important to clearly define task areas because the
illuminance of the immediate surrounding area may be lower than the illuminance on
the task area but shall be not less than the values given in Table 3-15.
Table 3-14 Relationship of illuminances on immediate surrounding to the illuminance
on the task area
Table 3-15 General areas inside buildings – Storage rack areas
3.5.11 Selection of the road classes according to EN 13201 and impact on
light levels
It is important that the designer does not over specify the requirements of the road
classes in EN 13201-2 because they can significantly impact energy consumption, see
for example M classes in Table 3-16 . As mentioned EN 13201-1 serves as a guideline
for selecting these classes but each EU country has converted this differently into their
national standards.

Preparatory study on lighting systems
Month Year I 218
Table 3-16 Example of EN 13201-2 road classes lighting requirements
3.5.12 Indoor light installed for non visual aspects of lighting contributing to
energy consumption
Visible light sources can also be installed in for non-visual aspects, for example with
the aim to influence sleep/wake cycles, alertness, performance patterns, core body
temperature or production of hormones. Such effects are described in the German
Standard DIN 5031-10:2013-12 on 'Optical radiation physics and illuminating
engineering - Part 10: Photobiologically effective radiation, quantities, symbols and
action spectra'. Clearly, this application can contribute to additional energy
consumption of light sources in buildings but they do not belong to the application of
Standard EN 12464-1 on indoor lighting in work places and therefore to the proposed
scope of this study.
3.6 Recommendations
3.6.1 Refined product scope
To be done on the final version
3.6.2 Barriers and opportunities
To be done on the final version
Preparatory study on lighting systems
Month Year I 219
CHAPTER 4 Technologies (product supply side, includes both BAT and BNAT)
The Objective
This chapter addresses the MEErP Task 4, in which the objective is to analyse technical
aspects related to lighting systems. Typical products and systems on the market and
alternative design options are described, including indications of the use of materials,
performance and costs. Additionally, information on product manufacturing,
distribution, durability and end-of-life processing is reported. Best Available
Technologies (BAT) and Best Not yet Available technologies (BNAT) are also analysed,
in which:
- 'Best' shall mean most effective in achieving a high level of environmental
performance of the product.
- 'Available' technology shall mean that it is developed on a scale which allows
implementation for the relevant product under economically and technically
viable conditions, taking into consideration the costs and benefits, whether or
not the technology is used or produced inside the Member States in question
or the EU-28, as long as they are reasonably accessible to the product
manufacturer. Barriers for take-up of BAT should be assessed, such as cost
factors or availability outside Europe.
- 'Not yet' available technology shall mean that it is not yet developed on a
scale which allows implementation for the relevant product but that it is
subject of research and development. Barriers for BNAT should be assessed,
such as cost factors or research and development outside Europe.
The full details of the MEErP content for this task are summarised in Annex A.
Summary of task 4:
This is a draft version made in a preparatory phase of the study to collect data from
stakeholders. A summary of this task will be elaborated during the completion of the
draft final report. This version is released with a complementary calculation
spreadsheet that models technological and economical improvement options at system
level (available on request for stakeholders who want to contribute). The purpose of
this version is to check with stakeholders the approach and how data can be provided
to complete the document. From the draft results it is already clear that, apart from
improving the lamp efficacy, many other improvement options at system level can
contribute to more energy savings. The calculated outcomes for the a cellular office
with ceiling mounted luminaires resulted in a Lighting Energy Numerical Indicator
(LENI) as defined in EN 15193 for the Worst Case design of 52.7 kWh/m²y, for the
mainstream 26 kWh/m²y and for the best of BAT it was only 5.7 kWh/m²y. It is also
clear that such a high improvement potential is not only due to an increase of the light
source efficacy that was assumed to increase from 75 lm/W up to an expected 140
lm/W for LED luminaires. Similar results were obtained for outdoor lighting that were
calculated in line with the standard prEN 13201-5 and which is currently under
development. Improvement is a combination of many design options and parameters.
Comment: This report is currently a work in progress, as some parts of the study have
not yet received the benefit of comments and data from stakeholders, therefore it
should not be viewed as a final report.
Preparatory study on lighting systems
Month Year I 220
4.1 Technical product description of lighting systems
Objective and general approach:
This section follows the decomposition into components and/or subsystems of the
lighting system that has been introduced in Task 1 in Figures 1-1, 1-2 and 1-3. For the
further reading of this task report it is important to understand this decomposition and
all its defined parameters. Of equal importance is being aware that the proposed
scope in Task 1 was to focus on lighting systems installed where minimum
requirements are valid according to the standard series EN 12464 (indoor lighting) and
EN 13201 (outdoor lighting) and that these standards use the concept of minimum
‘maintained illuminance or luminance’. By consequence, initial installations are over-
dimensioned compared to the minimum required and that the maintenance factors as
defined in Task 1 are taken into account based on the current user practices and
maintenance schemes that are explained in Task 3 on Users.
Because there are many parameters involved in optimising lighting systems(see
Figures 1-2, 1-3), this results in many different possible variations and it is a
challenge to discuss systematically all these improvement lighting design options.
Moreover, it is also important to do this on an equal basis for comparison. Therefore in
the subsequent sections the improvement design options will be grouped into
categories (worst case, mainstream, ..) for the set of selected reference lighting
applications in Task 3 and analysed at subsystem level as previously defined in Task 1.
Data is processed in a spreadsheet complementary to this report, this spreadsheet is
available on request for stakeholders who want to contribute with data in Task 4. The
spreadsheet also enables to simulate many other options that are not discussed in
detail or not yet included in this draft version. Each application has its own sheet and
every design solution is a column. The main purpose is to assess the impact of the
individual improvements at component and/or subsystem level on the overall energy
performance of the selected reference lighting systems.
In brief the reference lighting applications proposed in Task 3 were:
Cellular office with ceiling mounted luminaires (cellular ceiling mounted)
Cellular office with suspended luminaires (cellular suspended)
Open plan office with ceiling mounted luminaires (open ceiling mounted)
Open plan office with suspended luminaires (open suspended)
Motorized road with fast traffic class M3 (EN 13201)
Conflict road with mixed traffic class C3 (EN 13201)
Pedestrian area road with slow traffic class P3 (EN 13201)
For these reference lighting systems we will look at ‘a Worst Case’, ‘a Mainstream
design’, ‘several BAT designs’ and ‘BNAT designs’ on energy use or other
environmental improvements. Also indoor and outdoor lighting will be discussed in
separate sections because of the strong differences in standards and user
requirements. Note: in the final version also other types of reference designs might be
added for modelling, for example in line with policy scenarios of the lot 7 light source
study180.
In the Best Available Technology(BAT) sections, several options at the installation
level will be considered apart from each other and discussed in detail because they
were not subject of the eco-design light source study180. For light sources and control
gear the BAT from this study180 will be assumed without repeating the details and their
background.
In a final concluding section all data will be grouped and compared on energy use.
180 http://ecodesign-lightsources.eu/

Preparatory study on lighting systems
Month Year I 221
Note: this is a first draft concept version for discussion with stakeholders on how and
which data is useful and can be provided, in a later version more documentation will
be added.
4.1.1 Worst case (WC) or high energy using lighting indoor systems
Approach: This section on Worst Case or high energy using systems assesses the
lowest energy performance products that can enter the market (2016). They could
also be used in later sections for modelling the stock of existing systems, to be
considered if another category needs to be introduced for this in the event that this is
deemed relevant and that data is available.
4.1.1.1 The WC control system level indoor
The WC control system following the definitions of EN 15193 is:
constant illumination control(EN 15193): none
occupancy control type(EN 15193): Manual On/Off
room type absence (EN 15193): Open>sense 30m² (open plan office), Cellular
2-6 p. (cellular office)
type of daylight control (Table F.16) (EN 15193): Manual
type of blinds control (annex F 3.2.4) (EN 15193): Manual operated blinds
The expected impact on product price:
No additional costs
Examples and rationale for selected data:
The proposed selection is the least performing solution in EN 15193. It is based
on manual operated light switches and operated louvres.
Basic light switches and solar blinds are part of the building infrastructure,
therefore no extra costs for this solution will be taken into account.
4.1.1.2 WC control gear or ballast indoor
The proposed worst case Power efficiency of the Luminaire is:
ηp = 0.762 or 76.2 %
no dimming
Pc (luminaire control stand by power)(W): 0 W
The expected impact on product price of this solution is:
It is normally included in a basic luminaire, therefore for this solution no extra
costs compared to the luminaire will be taken into account.
Examples and rationale for the selected data:
This value was taken according to Regulation 245/2009 for a typical T8-18Watt
lamp class A3 ballast: ηp = 76.2 %
4.1.1.3 WC luminaire and lamp efficacy indoor
The proposed worst case luminaire performance parameters are (see Task 1 for
definitions):
ηls = 75 lm/W
FLLM @ 8000 h = 0.90
FLS @ 8000 h = 0.90
Cellular suspended: RLO = 0.74
CIE flux code: 0.75/0.99/0.99/0.92/0.74/0.75/1.00/1.00/0.08
Cellular ceiling mounted: RLO = 0.47
CIE flux code: 0.47/0.79/0.96/1.00/0.47
Open plan suspended: RLO = 0.73

Preparatory study on lighting systems
Month Year I 222
CIE flux code: 0.75/0.99/0.99/0.92/0.74/0.75/1.00/1.00/0.08
Open plan ceiling mounted: RLO = 0.47
CIE flux code: 0.47/0.79/0.96/1.00/0.47
Suspended: FLM = 0.92
Ceiling mounted: FLM = 0.91
The expected luminaire price for this solution is:
Suspended: 100 euro (excl. VAT) (3 x 18 W LFL)
Ceiling mounted: 70 euro (excl. VAT) (1 x 28 W LFL)
(these worst case designs are not optimized and therefore will not take into
account additional cost for lighting design)
Examples and rationale for the selected data:
The worst case RLO values used for luminaire efficiency are sourced from the lot
8 office lighting study.
The lamp efficacy(ηls) is according to Regulation 245/2009 stage 3 for a LFL T8-
18Watt lamp.
The luminaire maintenance factor (FLM) was sourced from standard CIE 97
(2005) for a Class B open top housing luminaire in the case of a ceiling mounted
luminaire and Class C closed top housing for a ceiling mounted luminaire both in
a very clean environment and an elapsed time between cleaning of two years.
The price is the lowest price that was found on an online retailer website181 for a
similar luminaire.
4.1.1.4 WC Installation indoor
The proposed worst case installation parameters are (see Task 1 for definitions):
Cellular suspended: EN 13032 calculated with flux code = TBD
Cellular ceiling mounted: EN 13032 calculated with flux code = TBD
Open plan suspended: EN 13032 calculated with flux code = TBD
Open plan ceiling mounted: EN 13032 calculated with flux code = TBD
FRSM = 0.96
Reflectance ceiling/wall/floor: 0.7/0.5/0.2 (see Task 3)
FCL in cellular office = 1 + (1-6/4)/2 = 1.25
FCL in open plan office = 1
Note: the respective reference geometries have been defined in Task 3.
The expected installation price for this solution is:
For installation times and associated cost per luminaire see Task 3.
Approach for design cost:
Included with the luminaire.
Examples and rationale for the selected data:
The Utilance is calculated with the flux code.
The room surface maintenance factor was sourced CIE 97(2005) for a very clean
working environment with cleaning of walls and ceiling every year.
The Factor for over-dimensioning FCL is assumed to be in between selecting for 4
or 6 luminaires in a cellular office. In an open plan office this effect is assumed
to be neglectable because of the high amount of luminaires.
181 www.voltus.de
Preparatory study on lighting systems
Month Year I 223
4.1.2 Mainstream or medium energy using lighting indoor systems
Approach: This section on mainstream or medium energy use systems considers
average systems found on the market today reflected by the selected reference
designs (see Task 3). They could also be used in later sections for modelling the stock
of existing systems, to be considered if another category needs to be introduced for
this in the event that this is deemed relevant and that data is available.
4.1.2.1 The MAINSTREAM control system level indoor
The same assumptions as for the worst case system will be used, as we will assume
that automated controls are not generally applied.
4.1.2.2 MAINSTREAM control gear or ballast indoor
The proposed mainstream Power efficiency of the Luminaire is:
ηp = 0.842 or 84.2 %
no dimming
Pc (luminaire control stand by power)(W): 0 W
The expected impact on product price of this solution is:
It is little more expensive compared to the worst case ballast: assumption + 5
euro (TBC).
Examples and rationale for the selected data:
This value was taken according to Regulation 245/2009 for a typical T8-18 Watt
lamp class A2 ballast: ηp = 84.2 %
4.1.2.3 MAINSTREAM luminaire and lamp efficacy indoor
The proposed mainstream luminaire performance parameters are (see Task 1 for
definitions):
ηls = 86 lm/W
FLLM @ 16000 h = 0.90
FLS @ 16000 h = 0.90
Cellular suspended: RLO = 0.85
CIE flux code: 0.67/0.94/0.98/0.36/0.85/0.75/1.00/1.00/0.64
Cellular ceiling mounted: RLO = 0.68
CIE flux code: 0.64/0.92/0.98/1.00/0.68
Open plan suspended: RLO = 0.85
CIE flux code: 0.67/0.94/0.98/0.36/0.85/0.75/1.00/1.00/0.64
Open plan ceiling mounted: RLO = 0.68
CIE flux code: 0.64/0.92/0.98/1.00/0.68
Suspended: FLM = 0.92
Ceiling mounted: FLM = 0.91
The expected luminaire price for this solution is:
Suspended: 200 euro (excl. VAT) (e.g. 2x36 W LFL)
Ceiling mounted: 200 euro (excl. VAT) (e.g. 2x36 W LFL)
(The higher price of this mainstream product can be justified because in this
case we assume that a photometric file is available and that design services are
included)
Examples and rationale for the selected data:
The mainstream RLO values used for luminaire efficiency and flux code are the
average from the lot 8 office lighting study.
The lamp efficacy (ηls), FLLM, FLS are according to Regulation 245/2009 stage 3
for a LFL T5-14Watt lamp.

Preparatory study on lighting systems
Month Year I 224
The luminaire maintenance factor (FLM) was sourced from standard CIE 97
(2005) for a Class B open top housing luminaire in the case of a ceiling mounted
luminaire and Class C closed top housing for a ceiling mounted luminaire both in
a very clean environment and an elapsed time between cleaning of two years.
The price is used is the average price from the lot 8 and cross checked with
online retailers182' 183 for a similar luminaire.
4.1.2.4 MAINSTREAM Installation indoor
The proposed mainstream installation parameters are (see Task 1 for definitions):
Cellular suspended: U = EN 13032 calculated with flux code = TBD
Cellular ceiling mounted: U = EN 13032 calculated with flux code = TBD
Open plan suspended: U = EN 13032 calculated with flux code = TBD
Open plan ceiling mounted: U = EN 13032 calculated with flux code = TBD
FRSM = 0.96
Reflectance ceiling/wall/floor: 0.7/0.5/0.2 (see Task 3)
FCL in cellular office = 1.25
FCL in open plan office = 1
Note: the respective reference geometries have been defined in Task 3.
The expected installation price for this solution is:
For installation times and associated cost per luminaire see Task 3.
Approach for design cost:
Included with the luminaire (see previous section).
Examples and rationale for the selected data:
The Utilance is calculated with the flux code.
Other parameters are sourced from the WC, because they are assumed as
mainstream.
4.1.3 BAT or low energy using lighting indoor systems
Approach: This section on BAT or low energy use systems considers the best systems
found on the market today. BATref is a reference BAT system with no specific
installation level improvement options implemented apart from automation as
modelled in EN15193, but other BAT options can be defined. They could also be used
in later sections for modelling the impact of any future policy measures, to be
considered if another category needs to be introduced for this in the event that this is
deemed relevant and that data is available.
4.1.3.1 The BATref control system level indoor
Dimmable control gear with:
Pc (luminaire control stand by power)(W): to be defined W
The BAT control system following the definitions of EN 15193 is:
constant illumination control(EN 15193): yes
occupancy control type(EN 15193): presence detector
room type absence (EN 15193): Open>sense 10m² (open plan office), Cellular
2-6 p. (cellular office)
type of daylight control (Table F.16) (EN 15193): No stand-by losses, no switch-
on, dimmed. EN 15193 defines this mode as ‘Systems which are daylight-
182 www.voltus.de 183 http://www.eibmarkt.com/

Preparatory study on lighting systems
Month Year I 225
responsive, and dim the electric lighting: The electric lighting is switched off and
turned on again (“dimmed, no stand-by losses, switch-on”). The electric lighting
is dimmed to the lowest level during usage periods (periods with adequate
daylight) and switched off (i.e. no electrical power is used). The electric lighting
system is turned on again automatically.’ Note, switching devices such as
bistable or latching relays184 should be used in this operation mode.
type of blinds control (annex F 3.2.4) (EN 15193): Automatic operated blinds
The expected impact on product price:
Stakeholders are invited to provide input
Examples and rationale for selected data:
The proposed selection is the best performing solution described in EN 15193. It
is based on presence detectors, daylight responsive sensors and automatic
operated louvres.
Notes:
Louvres are considered to belong to the so-called system environment of
the lighting system, because they are normally installed to reduce glare
and moreover they reduce the amount of available daylight. Therefore
they are in a strict sense not part of the lighting installation itself but are
part of the system environment as discussed in Task 1.
Special systems such as light guides185 or others sensors can be
discussed in a separate section. Light guides, as opposed to louvres, will
contribute to more daylight and could therefore be seen as part of the
lighting system.
Stakeholders can provide input on this.
4.1.3.2 BATref control gear or ballast indoor
The proposed BATref Power efficiency of Luminaire is:
ηp = 1,00 or 100 %
dimming
Pc (luminaire control stand by power)(W): to be defined (TBD) W
The expected impact on product price of this solution is:
TBD
Examples and rationale for the selected data:
This value is the target value of EN 15193 but is related to the lamp (ηls = 140
lm/W) and luminaire efficacy (RLO = 1.00), hence the product of these two
should be 140 lm/W. Details of this technology are explained in the light source
study180 and will not be repeated here.
4.1.3.3 BATref luminaire and lamp efficacy indoor
The proposed BATref luminaire performance parameters are (see Task 1 for
definitions):
ηls = 140 lm/W
FLLM @ 32000 h = 0.80
FLS @ 32000 h = 0.90
Cellular suspended: RLO = 1.00
CIE flux code: 0.67/0.94/0.98/0.36/1.00/0.75/1.00/1.00/0.64
Cellular ceiling mounted: RLO = 1.00
184 https://en.wikipedia.org/wiki/Relay 185 http://www.econation.be/ or http://www.warema.com/en/BUSINESS_PARTNERS/PRODUCTS/Light_guidance_systems/Index.php
Preparatory study on lighting systems
Month Year I 226
CIE flux code: 0.64/0.92/0.98/1.00/1.00
Open plan suspended: RLO = 1.00
CIE flux code: 0.67/0.94/0.98/0.36/1.00/0.75/1.00/1.00/0.64
Open plan ceiling mounted: RLO = 1.00
CIE flux code: 0.64/0.92/0.98/1.00/1.00
Suspended: FLM = 1.00
Ceiling mounted: FLM = 1.00
The expected luminaire price for this solution is:
Suspended: 250 + X euro (excl. VAT)
Ceiling mounted: 250 + X euro (excl. VAT)
(This price includes design services)
Examples and rationale for the selected data:
The lamp efficacy and light output ratio values are the benchmark values for so-
called expenditure factors in prEN 15193 but are related to the lamp (ηls = 140
lm/W) and luminaire efficacy (RLO = 1.00). Also the target maintenance factor
FM = 0.80 = FLLM x FLM x FRSM will be used as suggested in prEN 15193,
therefore FLM and FRSM are supposed to be 1.00.
It should be noted that in Regulation EC 245/2009 the indicative benchmark for
FLM was > 0.95.
4.1.3.4 BATref Installation indoor
The proposed BATref installation parameters are (see Task 1 for definitions):
Cellular suspended: U = EN 13032 calculated with flux code = TBD
Cellular ceiling mounted: U = EN 13032 calculated with flux code = TBD
Open plan suspended: U = EN 13032 calculated with flux code = TBD
Open plan ceiling mounted: U = EN 13032 calculated with flux code = TBD
FRSM = 1.00
Reflectance ceiling/wall/floor: 0.7/0.5/0.2 (see Task 3)
FCL in cellular office = 1.25
FCL in open plan office = 1
Note: the respective reference geometries have been defined in Task 3.
The expected installation price for this solution is:
For installation times and associated cost per luminaire see Task 3.
Approach for design cost:
Included with the luminaire.
Examples and rationale for the selected data:
The Utilance is calculated with the flux code (EN 13032), which is incorporated in
the project spreadsheet. The meaning and importance of Utilance is explained in
Task 3; the improvement is achieved by selecting better optics for the task
and/or placement of luminaires in the room. Another option to increase Utilance
is increasing surface reflections, this can be discussed in a separate BAT
improvement option.
4.1.3.5 Other BAT options at installation level indoor
In this section other BAT improvement options will be elaborated, for example:
BAT fit:
This is a solution wherein dimmable control gear is used to fit the illumination level
exactly to the minimum required for the task area (500 lx). In the calculation
Preparatory study on lighting systems
Month Year I 227
spreadsheet this is implemented by correcting the amount of luminaires (2.44 instead
of 3 in a cellular office).
BAT area:
This is a solution wherein luminaires and optics are arranged such that only the office
desk area has the minimum required illumination level (500 lx) and the surrounding
area the minimum required for the surrounding area (300 lx) (EN 12464). In a open
plan the corridor area could be even less (100 lx), to be assessed in the final version.
In the spreadsheet this is calculated by lowering the required average illuminance to
400 lx and modifying the number of luminaires (1.95 in cellular office).
BAT design01:
This is an individual design with high grade LED luminaires and higher reflecting wall
surfaces that has been calculated with Dialux software. Afterwards the Dialux results
were entered in the spreadsheets. In the spreadsheet there is an option to work with
calculated illuminance values. Stakeholders are invited to supply similar Dialux design
solutions, to be discussed in the stakeholder meeting.
BAT redefine area:
This is a solution for applications wherein the task area illumination requirements
change over the life time of the building space, for example from office task area to
cafeteria with meeting room and corridor. This is useful for the defined open plan
office (Task 3). To be further elaborated in the final version. It is close to the previous
'BAT area' solution, whereby a flexible building management system can cope with
this to redefine the individual task illumination levels.
BAT bright surface reflections:
This is the same as the BATref solution, but with bright surface reflections to increase
the Utilance and use of daylight (see sections3.2.1.2.3 and 3.2.1.4).
4.1.4 BNAT or low energy using indoor lighting systems
Approach: In this section on BNAT or low energy use systems we are discussing the
best systems that are under development but not on a stage of development which
allows market introduction. They could also be used in later sections for modelling the
impact of any future policy measures, to be considered if another category needs to
be introduced for this in the event that this is deemed relevant and that data is
available.
Stakeholders are invited to provide input such as ideas or calculated reference
designs.
4.1.5 Worst case or high energy using road lighting systems
Approach: This section on Worst Case or high energy use systems considers the
lowest performance that can enter the market after stage 3 of EC Regulation
245/2009. They could also be used in later sections for modelling the stock of existing
systems, to be considered if another category needs to be introduced for this in the
event that this is deemed relevant and that data is available.
4.1.5.1 The WC control system and control gear level outdoor
The WC control system following the definitions of EN 13201 is:
CLO regulation (EN 13201): none
t red (annual operating time at reduced illumination): 2000 h
Preparatory study on lighting systems
Month Year I 228
k red (reduction coefficient for the illumination level): 1
ηp = 90 %
The expected impact on product price:
No additional costs
Examples and rationale for selected data:
The proposed selection is the least performing solution in EN 13201 where no
constant light output regulation (CLO) is provided and there is no reduced light
level during hours of low traffic. The ballast efficiency is according to Regulation
245/2009 stage 3 Table 16 on high intensity discharge lamps between 105 up to
405 Watt. There is also no dimming assumed after midnight during hours of low
traffic (kred = 1).
4.1.5.2 WC luminaire and lamp efficacy outdoor
The proposed worst case luminaire performance parameters are (see Task 1 for
definitions):
ηls = 105 lm/W
FLLM @ 16000 h = 0.95
FLS @ 16000 h = 0.94
tgroup = 4 year (group replacement and cleaning period)
Road class M: RLO = 0.70
UFF = 0.05
Road class C: RLO = 0.70
UFF = 0.03
Road class P: RLO = 0.69
UFF = 0.57
Open luminaires: FLM = 0.51 (source CIE 154(2003): IP2x, medium pollution, 2 y
cycle)
The expected luminaire price for this solution is:
Road class M: 180 euro (excl. VAT)
Road class C: 170 euro (excl. VAT)
Road class P: 140 euro (excl. VAT)
It is assumed that this price includes the design and calculation service (TBC)
So far poles are not included (TBC)
Examples and rationale for the selected data:
The worst case RLO values used for luminaire efficiency are sourced from the lot
9 street lighting study. Also the Upward Light Flux Fraction (UFF) is included, for
example for road class P (Pedestrian) an omnidirectional globe luminaire is
assumed that emits more light upward as downward to the road.
The lamp efficacy(ηls) is the minimum according to Regulation 245/2009 stage 3
for an 105 up to 155 Watt HPS lamp.
The luminaire maintenance factor (FLM) was sourced from standard CIE 154
(2003) for an open luminaire (IP2x)(see lot 9).
The price is the lowest price from the lot 9 study on street lighting.
4.1.5.3 WC Installation outdoor
The proposed worst case installation parameters are (see Task 1 for definitions):
Road class M: U = 0.47
FCL-1 = 1 + (1-250/150)/2 = 1.33
Road class C: U = 0.36
FCL -1= 1 + (1-150/100)/2 = 1.25
Road class P: U = 0.16
FCL-1 = 1 + (1-100/70)/2 = 1.21
Preparatory study on lighting systems
Month Year I 229
Note U values will be recalculated in the final version taking into account an update of
the definition of the useful area (see Task 3), especially the road class M should be
reviewed reconsidering the emergency lane and/or edge requirements.
Note: the respective reference road geometries and characteristics were defined in
Task 3.
The expected installation price for this solution is:
For installation times and associated cost per luminaire see Task 3.
Approach for design cost:
Included with the luminaire.
Examples and rationale for the selected data:
The Utilance(U) is sourced from the lot 9 study but will be recalculated in the
final version of this report. The meaning of the Utilance is explained in Task 3, it
is mainly related to directing the light towards the road surface. In this case the
luminaire optics and installation are not in the most effective way to direct all
light from the light sources to the target road surface. It are the worst case
luminaires for classes M and C with a poor reflector and balloon frosted lamps
and for class P with an omnidirectional globe.
The correction factor for over-lighting (FCL) is calculated from the assumption
that one has to select on average just in between two common available
wattages, e.g 250 versus 150 Watt results in FCL = 1.33.
4.1.6 Mainstream or average energy using road lighting systems
Approach: This section on Mainstream or average energy use systems considers the
modelling of an average performing road lighting installation that can enter the
market in 2016. They could also be used in later sections for modelling the stock of
existing systems, to be considered if another category needs to be introduced for this
in the event that this is deemed relevant and that data is available.
4.1.6.1 The MAINSTREAM control system and control gear level outdoor
This is assumed to be similar to the Worst Case because advanced controls are not
considered mainstream solutions in road lighting.
4.1.6.2 MAINSTREAM luminaire and lamp efficacy outdoor
The proposed mainstream luminaire performance parameters are (see Task 1 for
definitions):
ηls = 105 lm/W
FLLM @ 16000 h = 0.95
FLS @ 16000 h = 0.94
tgroup = 4 year (group replacement and cleaning period)
Road class M: RLO = 0.73
UFF = 0.03
Road class C: RLO = 0.76
UFF = 0.00
Road class P: RLO = 0.71
UFF = 0.18
Closed luminaires: FLM = 0.86 (source CIE 154 (2003): IP5x, medium pollution, 2 y
cycle)
The expected luminaire price for this solution is:
Road class M: 370 euro (excl. VAT)
Road class C: 220 euro (excl. VAT)

Preparatory study on lighting systems
Month Year I 230
Road class P: 170 euro (excl. VAT)
It is assumed that this price includes the design and calculation service (TBC)
So far poles are not included (TBC)
Examples and rationale for the selected data:
The mainstream RLO values are average values sourced from the lot 9 street
lighting study186.
The lamp efficacy (ηls) is the minimum according to Regulation 245/2009 stage
3 for an 105 up to 155 Watt HPS lamp, which is considered an average wattage
for this application.
The luminaire maintenance factor (FLM) was sourced from standard CIE 154
(2003) for an closed luminaire IP5X and cleaning cycle of 2 years.
The price is the average price from lot 9.
4.1.6.3 MAINSTREAM Installation outdoor
The proposed mainstream installation parameters are (see Task 1 for definitions):
Road class M: U = 0.55
FCL-1 = 1 + (1-250/150)/2 = 1.33
Road class C: U =0.45
FCL-1 = 1 + (1-150/100)/2 = 1.25
Road class P: U = 0.20
FCL-1 = 1 + (1-100/70)/2 = 1.21
Note U values will be recalculated in the final version taking into account an update of
the definition of the useful area (see Task 3).
Note: the respective reference geometries have been defined in Task 3.
The expected installation price for this solution is:
For installation times and associated cost per luminaire see Task 3.
Approach for design cost:
Included with the luminaire.
Examples and rationale for the selected data:
The Utilance (U) is sourced from the lot 9 study186. It is assumed that the
average values for classes M and C with a standard reflector and mixed tubular
clear and balloon frosted lamps are applicable. Class P is a mixture of luminaires
and installations.
The correction factor for over-lighting (FCL) is calculated from the assumption
that on average one has to select in between two common available wattage
values, e.g 250 versus 150 Watt results in FCL = 1.33.
4.1.7 BAT or low energy using road lighting systems
Approach: This section on BAT or low energy use systems considers the best systems
found on the market today. BATref is a reference BAT system with no specific
installation-level improvement options implemented, apart from automation as
modelled in EN13201-5, but other BAT options can be defined. They could also be
used in later sections for modelling the impact of any future policy measures, to be
considered if another category needs to be introduced for this in the event that this is
deemed relevant and that data is available. They could also be used in later sections
for modelling the stock of existing systems, to be considered if another category needs
to be introduced for this in the event that this is deemed relevant and that data is
available.
186 http://www.eup4light.net/

Preparatory study on lighting systems
Month Year I 231
4.1.7.1 The BATref control system and control gear level outdoor
The BATref control system following the definitions of EN 13201 is:
CLO regulation (EN 13201): none
t red (annual operating time at reduced illumination): 2000 h
k red (reduction coefficient for the illumination level): 0.7
ηp = 94 %
Pc (luminaire control stand by power)(W): to be defined W
The expected impact on product price:
50 euro per luminaire?
Examples and rationale for selected data:
The proposed selection is the best performing solution in EN 13201 where
constant light output regulation (CLO) is provided according to that standard.
This assumes that there is a reduced light level during hours of low traffic with
approximately 30 % light level reduction of class M3 (1 Cd/m²) to class M4 (0.75
Cd/m²) (kred = 0.7 during 2000 h). The ballast efficiency is the best that has
been found on the market.
4.1.7.2 BATref luminaire and lamp efficacy outdoor
The proposed BATref luminaire performance parameters (see Task 1 for definitions)
are:
ηls = 140 lm/W
FLLM @ 100000 h = 0.80
FLS @ 16000 h = 0.99
tgroup = 4 year (group replacement and cleaning period)
Road class M: RLO = 1.00
UFF = 0.02
Road class C: RLO = 1.00
UFF = 0.02
Road class P: RLO = 1.00
UFF = 0.02
Closed luminaires: FLM = 0.89 (source CIE 154 (2003): IP6x, medium pollution, 2 y
cycle)
The expected luminaire price for this solution is:
Road class M: 1000 euro (excl. VAT)
Road class C: 750 euro (excl. VAT)
Road class P: 500 euro (excl. VAT)
It is assumed that this price includes the design and calculation service (TBC)
So far poles are not included (TBC)
Examples and rationale for the selected data:
The BAT reference RLO values are average values sourced from the lot 9 street
lighting study187.
The lamp efficacy(ηls) is the same target value as for indoor lighting.
The Lumen Maintenance Values (FLLM) is compliant with the value that is most
often cited in LED luminaire manufacturers catalogues.
The luminaire maintenance factor (FLM) was sourced from the standard CIE 154
(2003) for a closed luminaire IP6X and cleaning cycle of 2 years.
The price is estimated from online retailer websites188, 183 but will be updated in
the course of this study.
187 http://www.eup4light.net/
Preparatory study on lighting systems
Month Year I 232
4.1.7.3 BATref installation outdoor
The proposed BATref installation parameters are (see Task 1 for definitions):
Road class M: U = 0.70
FCL-1 = 1
Road class C: U = 0.70
FCL-1 = 1
Road class P: U = 0.60
FCL-1 = 1
Note U values will be recalculated in the final version taking into account an update of
the definition of the useful area (see Task 3) after discussion in the stakeholder
meeting.
Note: the respective reference geometries have been defined in Task 3.
The expected installation price for this solution is:
For installation times and associated cost per luminaire see Task 3.
Approach for design cost:
Included with the luminaire.
Examples and rationale for the selected data:
The Utilance (U) will be based on software calculations, stakeholder can provide
input. A Dialux file with the reference design will be available for this purpose,
calculated average maintained illuminance for the areas can be introduced in the
project spreadsheet.
The correction factor for over-lighting (FCL) assumes dimmable control gear and a
constant and perfect fit to the minimum required illumination.
4.1.7.4 BAT other installation
In this section other BAT improvement options will be elaborated, for example:
BAT case01 for application Motorized Road M3:
In this application a specific street lighting design was calculated with Dialux based on
LED luminaires and entered in the spreadsheet. Stakeholders are invited to supply
similar Dialux design solutions, to be discussed in the stakeholder meeting.
4.1.7.5 BNAT outdoor installation
Other solutions under development can be proposed herein. Stakeholders are invited
to supply information.
4.2 Production, distribution and End of Life
Objective: The objective of this section is to consider environmental impacts from the
'production' and 'distribution' of lighting systems. Material flows and collection effort at
end-of-life, to landfill/incineration/recycling/re-use should also be modelled. Please
note that the MEErP methodology uses the EcoReport Tool which is a spreadsheet that
models production according to Bill-Of-Materials and the volume of packed material
and recycling ratios and methods.
Proposed approach:
188 www.voltus.de
Preparatory study on lighting systems
Month Year I 233
Much of the design work is does not consume materials and has to be done by local
designers and installers with little need for transport. Lighting Systems are not
disposed of as a whole but is related to disposal of the components. Therefore it is
assumed that this is covered by the MELISA model from the Light Sources study189
using the MELISA model, see also Task 2. To model this impact a sales factor (Fsales)
is introduced in MELISA., see Task 2. The (Fsales)factor is also calculated in the
spreadsheet developed in this Task 4.
This means that other factors will be neglected, such as wall painting, light poles,
cabling, etc.
4.3 Summary of lighting system technical solutions and technical improvement options
This section summarises, calculates and compares the energy performance
parameters from the improvements and parameters discussed in the previous sections
for the selected reference applications defined in Task 3. Formulae were sourced from
prEN15193 or prEN 13201-5 in line with those defined in Task 1 and 3. These
formulae are included in a spreadsheet which is complementary to this report. This
spreadsheet is available on request for stakeholders who want to contribute. All data
from previous sections is entered in this spreadsheet. There follows a brief discussion
on the outcomes.
Discussion of the results for indoor lighting:
The calculated outcomes on annual energy consumption for the defined cellular office
with ceiling-mounted luminaires applications are summarised in Table 4-1 for the
different design options that were previously discussed. The Lighting Energy Numerical
Indicator (LENI, EN 15193) for the Worst Case design is 56 kWh/m²y, for the
mainstream is 26 kWh/m²y and the best of BAT is 5.7 kWh/m²y. It is also clear that
such a high improvement potential is not only due to an increase of the light source
efficacy from 75 lm/W up to an expected 140 lm/W for LED luminaires but is related to
a combination of factors. These outcomes are in line with the TEK tool discussed in
section 1.5.2.4 in Task 1 and therefore seem to be reliable. Table 4-1 also includes
some expenditure factors sourced from prEN15193 and supplementary factors
included in this study. These expenditure factors can provide insight into how far
sublevels are optimised compared to the benchmark. This could be further elaborated
and documented in the final version. Is this useful?
189 http://ecodesign-lightsources.eu/

Preparatory study on lighting systems
Month Year I 234
Table 4-1 Annual Lighting Energy consumption and installation efficacy calculated for a
cellular office with ceiling mounted luminaires in Worst Case(WC), mainstream and
BAT lighting designs
As an experiment, Table 4-1 also includes the concept of partial expenditure factors
that is under development in prEN15193. Partial expenditure factors can be useful to
provide insight into how far a system is optimised compared to benchmark values. The
lower its values the better, in most cases the theoretical best values is '1'.
The following expenditure factors are defined (prEN 15193):
eL,C: Partial expenditure factor for constant illuminance control
eL,O: Partial expenditure factor for occupancy dependant lighting control
eL,D: Partial expenditure factor for daylight dependant lighting control
eL,ES: Partial expenditure factor for the electric lighting system
eL,ES,del: Partial expenditure factor for delivery of electric light
eL,ES,dis: Partial expenditure factor for distribution of electric light
eL,ES,gen: Partial expenditure factor for generation of electric light
Similar calculations were done for road lighting, the results are summarised in Table
4-2 for Worst Case(WC), mainstream and BAT lighting designs. It shows that the
installation efficacy can range from 11.3 up to 76.6 lm/W with a corresponding Annual
Energy Consumption Indicator (AECI, prEN 13201-5) of 5.06 to 0.63 kWh/(m²y) and a
lighting power density (PD, prEN 13201-5) from 0.066 to 0.015 W/m².lx. Clearly also
here again, this improvement is not only related to the improvement of the light
source efficacy but is due to a combination of several improvement options.
Reference design lot 37
WC
lot 37
Mainstream
lot 37
BATref
lot 37
BATfit
lot 37
BATarea
lot 37
BATdesign01
ηls (lm/W) =ηL (25°C s tandard condictions) 75,00 86,00 140,00 140,00 140,00 110,94
FLLM (lamp lumen maintenance f) (=f(t-lamp replacement period)) 0,90 0,90 0,80 0,80 0,80 0,80
ηp = fB (power efficiency of luminaire) 0,76 0,84 1,00 1,00 1,00 1,00
CIE flux code N5(RLO) (Luminaire light output ratio) 0,47 0,68 1,00 1,00 1,00 1,00
FLM (Luminaire Maintenance Factor) 0,91 0,91 1,00 1,00 1,00 1,00
FRSM (Room Surface Maintenance Factor) 0,96 0,96 0,96 0,96 0,96 0,96
constant illumination control(EN 15193) n n y y y y
occupancy control type(EN 15193) Man. On/Off Auto On/Off presence det. presence det. presence det. presence det.
room type absence (EN 15193) Cellular 2-6 p. Cellular 2-6 p. Cellular 2-6 p. Cellular 2-6 p. Cellular 2-6 p. Cellular 2-6 p.
type of daylight control (Table F.16) (EN 15193) I: Manual I: Manual VIII: nSB nSWon DimVIII: nSB nSWon DimVIII: nSB nSWon DimVIII: nSB nSWon Dim
type of blinds control (annex F 3.2.4) (EN 15193) MO MO Auto Auto Auto Auto
U (utilance) = ηR (software or flux code) 0,64 0,74 0,74 0,74 0,74 0,81
eL,C (eq. 18) part. expend. 4 const. Il lum. control 1,00 1,00 1,01 1,01 1,01 1,01
eL,O (eq. 19) part. expend. 4 occupancy control 1,29 1,14 1,21 1,21 1,21 1,21
eL,D (eq. 19) part. expend. 4 daylight dep. control 1,11 1,11 1,09 1,09 1,09 1,09
eE (eff. For fitting to minimum requirements 1,23 1,23 1,23 1,00 1,00 0,91
eL,ES, del (eq. 19) part. expend. 4 delivery of light 1,12 0,97 0,97 0,97 0,97 0,88
eL,ES, dis (eq. 19) part. expend. 4 distrub. of light 2,13 1,48 1,00 1,00 1,00 1,00
eL,ES, gen (eq. 19) part. expend. 4 generation of light 1,42 1,37 1,00 1,00 1,00 1,26
eLES (eq. 19) part. Expend. 4 lighting system 3,39 1,96 0,97 0,97 0,97 1,12
LENI (kWh/m²Y) (f 15) 55,8 27,5 9,8 8,0 6,4 8,4
ƞinst-u (usefull installation efficacy) (lm/W) 13,56 28,63 88,75 88,75 88,75 76,95
Fhour-s (=(Fox(Fdxtd+tn)/(td+tn) 0,82 0,73 0,57 0,57 0,57 0,57
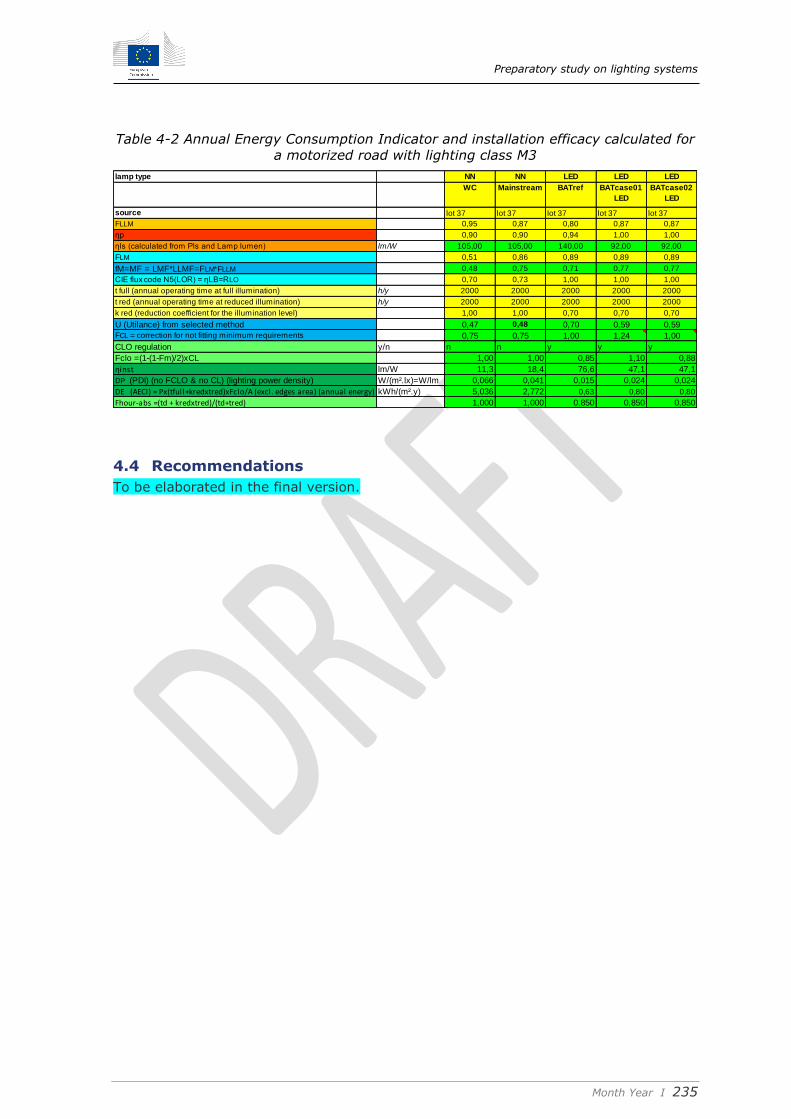
Preparatory study on lighting systems
Month Year I 235
Table 4-2 Annual Energy Consumption Indicator and installation efficacy calculated for
a motorized road with lighting class M3
4.4 Recommendations
To be elaborated in the final version.
lamp type NN NN LED LED LED
WC Mainstream BATref BATcase01
LED
BATcase02
LED
source lot 37 lot 37 lot 37 lot 37 lot 37
FLLM 0,95 0,87 0,80 0,87 0,87
ηp 0,90 0,90 0,94 1,00 1,00
ηls (calculated from Pls and Lamp lumen) lm/W 105,00 105,00 140,00 92,00 92,00
FLM 0,51 0,86 0,89 0,89 0,89
fM=MF = LMF*LLMF=FLM*FLLM 0,48 0,75 0,71 0,77 0,77
CIE flux code N5(LOR) = ηLB=RLO 0,70 0,73 1,00 1,00 1,00
t full (annual operating time at full illumination) h/y 2000 2000 2000 2000 2000
t red (annual operating time at reduced illumination) h/y 2000 2000 2000 2000 2000
k red (reduction coefficient for the illumination level) 1,00 1,00 0,70 0,70 0,70
U (Utilance) from selected method 0,47 0,48 0,70 0,59 0,59
FCL = correction for not fitting minimum requirements 0,75 0,75 1,00 1,24 1,00
CLO regulation y/n n n y y y
Fclo =(1-(1-Fm)/2)xCL 1,00 1,00 0,85 1,10 0,88
ηinst lm/W 11,3 18,4 76,6 47,1 47,1
DP (PDI) (no FCLO & no CL) (lighting power density) W/(m².lx)=W/lm 0,066 0,041 0,015 0,024 0,024
DE (AECI) = Px(tfull+kredxtred)xFclo/A (excl. edges area) (annual energy) kWh/(m².y) 5,036 2,772 0,63 0,80 0,80
Fhour-abs =(td + kredxtred)/(td+tred) 1,000 1,000 0,850 0,850 0,850


![Preparatory review study - Annex Hecodesign-fridges.eu/sites/ecodesign-fridges.eu... · Preparatory /review study - Annex H prepared by Van Holsteijn en Kemna [VHK] 16.3.2015 Commission](https://img.pdfslide.us/doc/110x75/5e9df0eeefc6076f4a5e338f/preparatory-review-study-annex-hecodesign-preparatory-review-study-annex-h.jpg)