Embed Size (px)
Citation preview
ECS Solid State Letters, 2 (11) M53-M56 (2013) M532162-8742/2013/2(11)/M53/4/$31.00 © The Electrochemical Society
Preparation of Three Dimensional Porous Silicon withFluoride-Free Method and Its Application in Lithium Ion BatteriesXuelin Yang,a,z Changchuan Shi,a Lulu Zhang,a Gan Liang,b Shibing Ni,a and Zhaoyin Wenc
aCollege of Mechanical and Material Engineering, Three Gorges University, Yichang 443002, ChinabDepartment of Physics, Sam Houston State University, Huntsville, Texas 77341, USAcShanghai Institute of Ceramics, Chinese Academy of Sciences, Shanghai 200050, China
Three dimensional porous silicon (PS) powder samples are synthesized by a fluoride-free method composed of high-temperaturesintering and liquid extraction processes. As a conducting agent and strength supporter, amorphous carbon is incorporated into poroussilicon using a hydrothermal technology. The microstructure and composition of PS and PS/Carbon composite are characterized bymeans of scanning electron microscopy (SEM) and X-ray diffraction (XRD). Electrochemical properties are investigated by cyclicvoltammetry (CV) and galvanostatic charge/discharge tests. The experimental results indicate that reversible capacity and capacityretention of silicon anode can be significantly improved with the existence of 3D pores and amorphous carbon. More specifically,the PS and PS/Carbon electrodes deliver reversible capacity of 664.6 mAh g−1 and 608.7 mAh g−1 after 100 cycles.© 2013 The Electrochemical Society. [DOI: 10.1149/2.009310ssl] All rights reserved.
Manuscript submitted July 12, 2013; revised manuscript received August 6, 2013. Published August 14, 2013.
Lithium ion batteries (LIB) have become the most popular powersources for a wide range of applications due to their high energydensity, high voltage, low self-discharge, and free maintenance.1,2
Developing new electrodes with higher capacity or higher energydensity has been increasingly important due to the LIB miniaturiza-tion for portable electronic product development in aviation, mili-tary and automobile industries. Silicon with high theoretical capacity(4200 mAh g−1) has been widely investigated as a candidate for next-generation high-capacity anode materials.3,4 However, severe particlepulverization can be caused by large volume changes during repeatedinsertion/extraction reaction, resulting in a substancial capacity fadingdue to electrical disconnection.5,6 A variety of silicon structures andsilicon-based composites have been designed to solve this problem.Examples include the use of mesoporous silicon nanowires,3,6,7 siliconnanotubes,8 porous silicon,9–18 and Si dispersed in an active/inactivematrix.19–23 Extensive studies have confirmed that the electrochemi-cal performance of silicon can be effectively improved by designing itinto three-dimensional (3D) porous structure.3,9,10 For all preparationmethods of porous silicon, however, the use of the virulent and corro-sive hydrofluoric (HF) solution is indispensale. Therefore, it is desiredto seek a safer alternative method to replace the traditional preparationprocesses. In this work, we developed a simple fluoride-free methodto synthesize 3D PS powder material and carried out the study on theelectrochemical properties of 3D PS and PS/Carbon composite.
Experimental
3D porous silicon.— Silicon and magnesium powders were groundin ethanol to ensure homogeneous mixing. After drying, the mixturewas heated to 500◦C for 8 h in argon atmosphere to obtain magnesiumsilicide (Mg2Si) powders. Then, Mg2Si powders were milled for 1 hin ethanol, followed by heat-treatment (1000◦C, 3 h) under vacuum(<50 Pa). After cooling to room temperature, the resultant wasbleached in HCl solution, filtered and washed with deionized wateruntil the PH value reached 7. Finally, the 3D porous silicon powderswere obtained by further heat-treatment (1000◦C, 3 h) of the resultantin argon to remove volatile impurities. And the tap density of the 3Dporous silicon powders was measured by the tap density measurementinstrument (JZ-1, China).
Carbon-coated porous silicon.— To improve electronic conductiv-ity, carbon was incorporated into 3D PS via a hydrothermal method.The carbon-coated porous silicon was synthesized by a hydrothermalreaction using glucose as carbon source. The suspension composedof 3D porous silicon powders and glucose solution was magneticallystirred under negative pressure for 3 h to facilitate the glucose solution
zE-mail: [email protected]
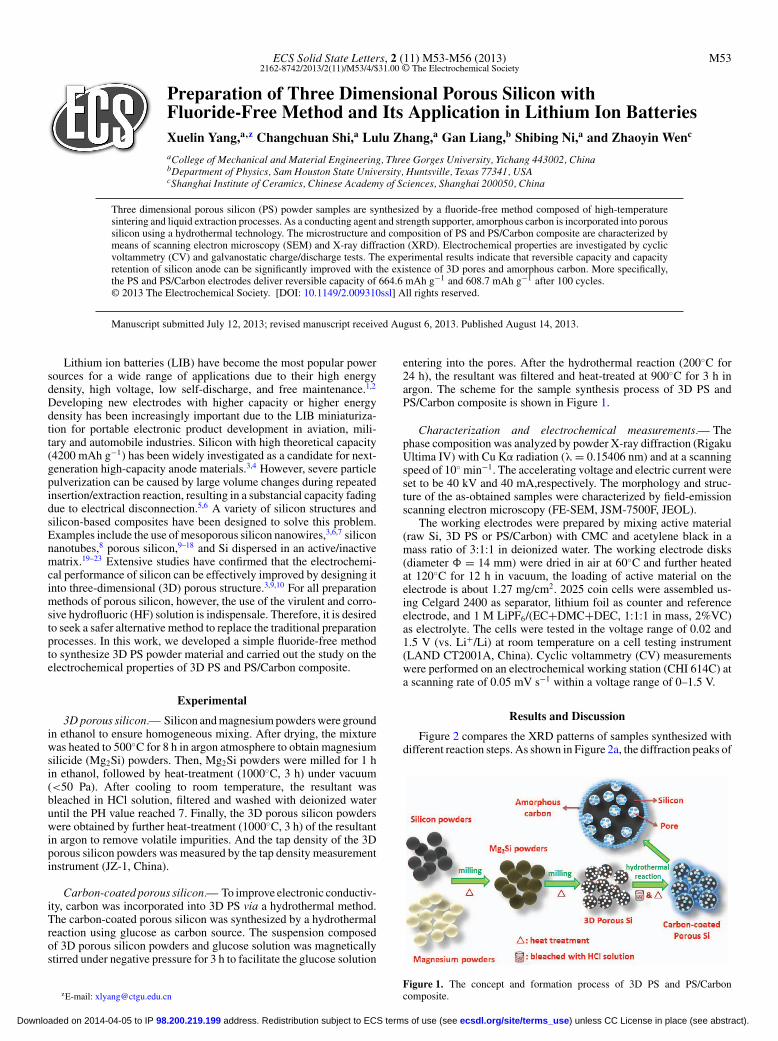
entering into the pores. After the hydrothermal reaction (200◦C for24 h), the resultant was filtered and heat-treated at 900◦C for 3 h inargon. The scheme for the sample synthesis process of 3D PS andPS/Carbon composite is shown in Figure 1.
Characterization and electrochemical measurements.— Thephase composition was analyzed by powder X-ray diffraction (RigakuUltima IV) with Cu Kα radiation (λ = 0.15406 nm) and at a scanningspeed of 10◦ min−1. The accelerating voltage and electric current wereset to be 40 kV and 40 mA,respectively. The morphology and struc-ture of the as-obtained samples were characterized by field-emissionscanning electron microscopy (FE-SEM, JSM-7500F, JEOL).
The working electrodes were prepared by mixing active material(raw Si, 3D PS or PS/Carbon) with CMC and acetylene black in amass ratio of 3:1:1 in deionized water. The working electrode disks(diameter � = 14 mm) were dried in air at 60◦C and further heatedat 120◦C for 12 h in vacuum, the loading of active material on theelectrode is about 1.27 mg/cm2. 2025 coin cells were assembled us-ing Celgard 2400 as separator, lithium foil as counter and referenceelectrode, and 1 M LiPF6/(EC+DMC+DEC, 1:1:1 in mass, 2%VC)as electrolyte. The cells were tested in the voltage range of 0.02 and1.5 V (vs. Li+/Li) at room temperature on a cell testing instrument(LAND CT2001A, China). Cyclic voltammetry (CV) measurementswere performed on an electrochemical working station (CHI 614C) ata scanning rate of 0.05 mV s−1 within a voltage range of 0–1.5 V.
Results and Discussion
Figure 2 compares the XRD patterns of samples synthesized withdifferent reaction steps. As shown in Figure 2a, the diffraction peaks of
Figure 1. The concept and formation process of 3D PS and PS/Carboncomposite.
) unless CC License in place (see abstract). ecsdl.org/site/terms_use address. Redistribution subject to ECS terms of use (see 98.200.219.199Downloaded on 2014-04-05 to IP
M54 ECS Solid State Letters, 2 (11) M53-M56 (2013)
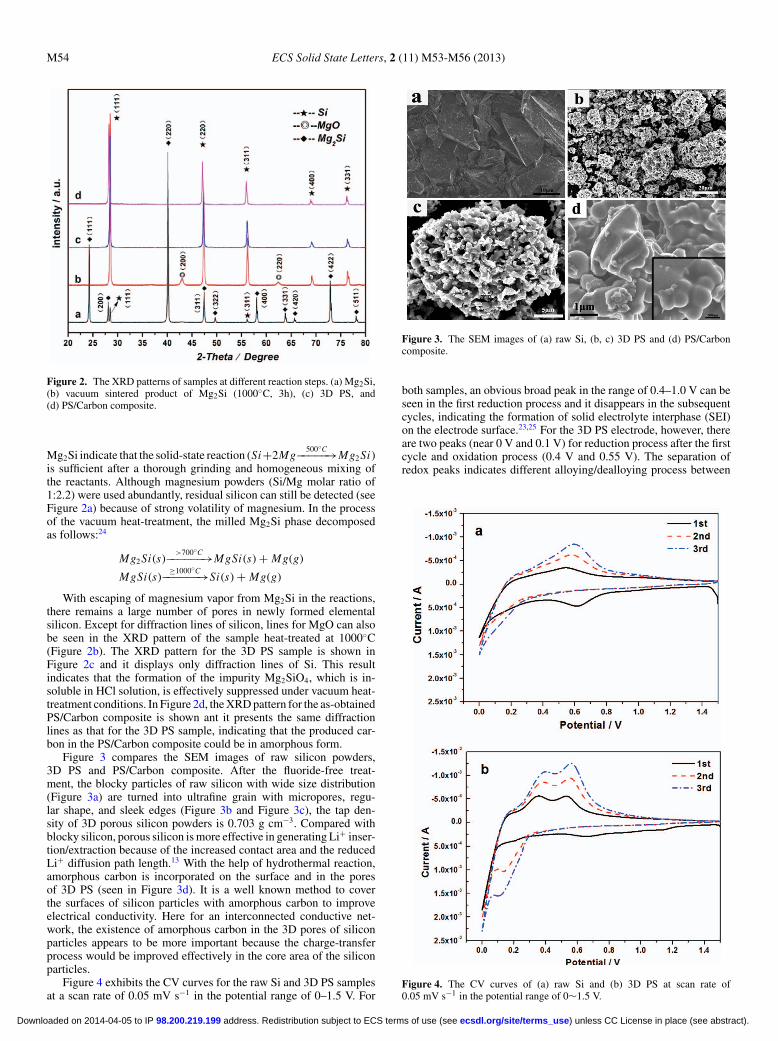
Figure 2. The XRD patterns of samples at different reaction steps. (a) Mg2Si,(b) vacuum sintered product of Mg2Si (1000◦C, 3h), (c) 3D PS, and(d) PS/Carbon composite.
Mg2Si indicate that the solid-state reaction (Si+2Mg500◦C−−−−−→Mg2 Si)
is sufficient after a thorough grinding and homogeneous mixing ofthe reactants. Although magnesium powders (Si/Mg molar ratio of1:2.2) were used abundantly, residual silicon can still be detected (seeFigure 2a) because of strong volatility of magnesium. In the processof the vacuum heat-treatment, the milled Mg2Si phase decomposedas follows:24
Mg2 Si(s)>700◦C−−−−−−→MgSi(s) + Mg(g)
MgSi(s)≥1000◦C−−−−−−→Si(s) + Mg(g)
With escaping of magnesium vapor from Mg2Si in the reactions,there remains a large number of pores in newly formed elementalsilicon. Except for diffraction lines of silicon, lines for MgO can alsobe seen in the XRD pattern of the sample heat-treated at 1000◦C(Figure 2b). The XRD pattern for the 3D PS sample is shown inFigure 2c and it displays only diffraction lines of Si. This resultindicates that the formation of the impurity Mg2SiO4, which is in-soluble in HCl solution, is effectively suppressed under vacuum heat-treatment conditions. In Figure 2d, the XRD pattern for the as-obtainedPS/Carbon composite is shown ant it presents the same diffractionlines as that for the 3D PS sample, indicating that the produced car-bon in the PS/Carbon composite could be in amorphous form.
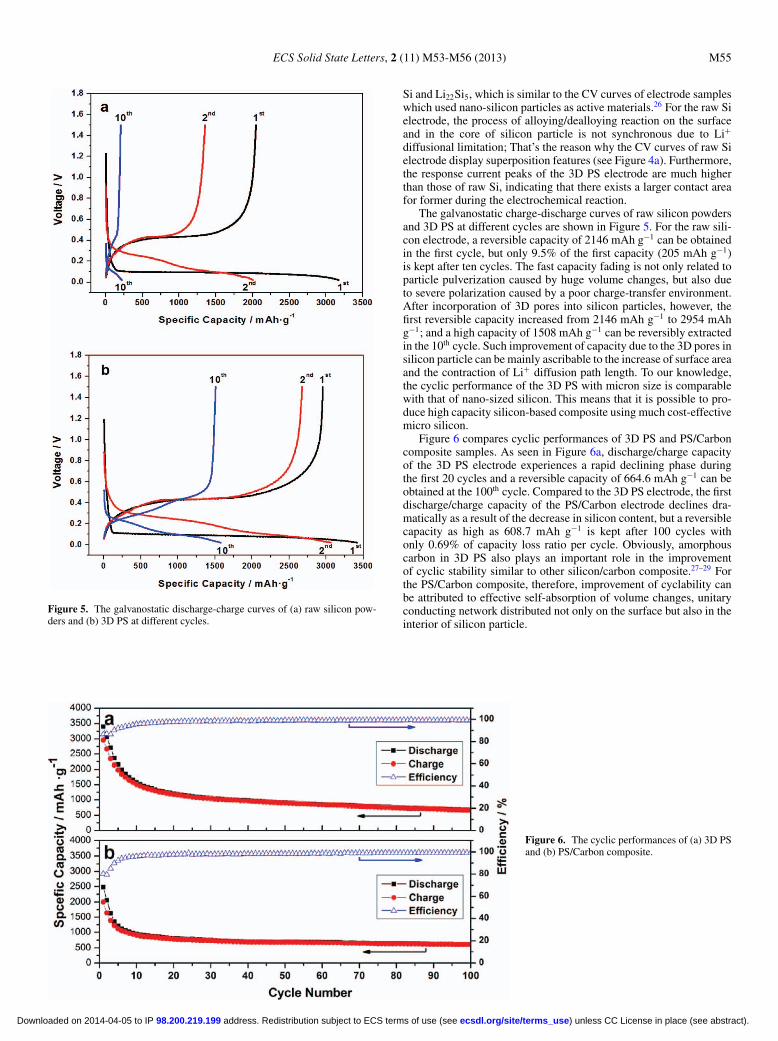
Figure 3 compares the SEM images of raw silicon powders,3D PS and PS/Carbon composite. After the fluoride-free treat-ment, the blocky particles of raw silicon with wide size distribution(Figure 3a) are turned into ultrafine grain with micropores, regu-lar shape, and sleek edges (Figure 3b and Figure 3c), the tap den-sity of 3D porous silicon powders is 0.703 g cm−3. Compared withblocky silicon, porous silicon is more effective in generating Li+ inser-tion/extraction because of the increased contact area and the reducedLi+ diffusion path length.13 With the help of hydrothermal reaction,amorphous carbon is incorporated on the surface and in the poresof 3D PS (seen in Figure 3d). It is a well known method to coverthe surfaces of silicon particles with amorphous carbon to improveelectrical conductivity. Here for an interconnected conductive net-work, the existence of amorphous carbon in the 3D pores of siliconparticles appears to be more important because the charge-transferprocess would be improved effectively in the core area of the siliconparticles.
Figure 4 exhibits the CV curves for the raw Si and 3D PS samplesat a scan rate of 0.05 mV s−1 in the potential range of 0–1.5 V. For
Figure 3. The SEM images of (a) raw Si, (b, c) 3D PS and (d) PS/Carboncomposite.
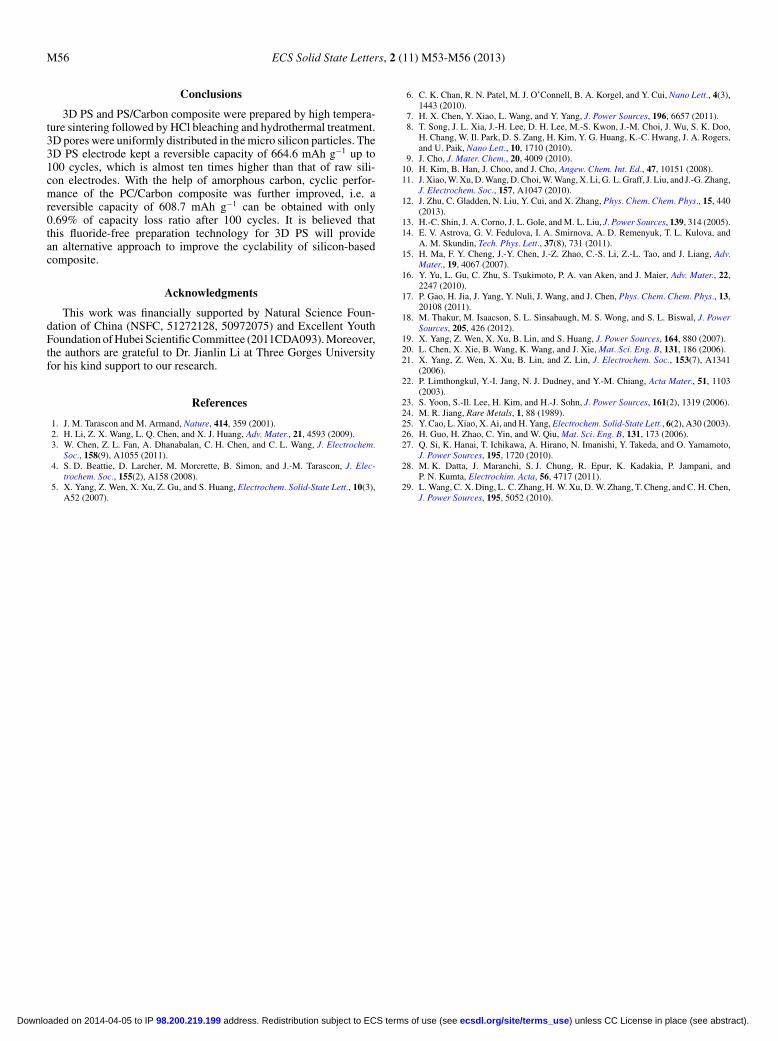
both samples, an obvious broad peak in the range of 0.4–1.0 V can beseen in the first reduction process and it disappears in the subsequentcycles, indicating the formation of solid electrolyte interphase (SEI)on the electrode surface.23,25 For the 3D PS electrode, however, thereare two peaks (near 0 V and 0.1 V) for reduction process after the firstcycle and oxidation process (0.4 V and 0.55 V). The separation ofredox peaks indicates different alloying/dealloying process between
Figure 4. The CV curves of (a) raw Si and (b) 3D PS at scan rate of0.05 mV s−1 in the potential range of 0∼1.5 V.
) unless CC License in place (see abstract). ecsdl.org/site/terms_use address. Redistribution subject to ECS terms of use (see 98.200.219.199Downloaded on 2014-04-05 to IP
ECS Solid State Letters, 2 (11) M53-M56 (2013) M55
Figure 5. The galvanostatic discharge-charge curves of (a) raw silicon pow-ders and (b) 3D PS at different cycles.
Si and Li22Si5, which is similar to the CV curves of electrode sampleswhich used nano-silicon particles as active materials.26 For the raw Sielectrode, the process of alloying/dealloying reaction on the surfaceand in the core of silicon particle is not synchronous due to Li+
diffusional limitation; That’s the reason why the CV curves of raw Sielectrode display superposition features (see Figure 4a). Furthermore,the response current peaks of the 3D PS electrode are much higherthan those of raw Si, indicating that there exists a larger contact areafor former during the electrochemical reaction.
The galvanostatic charge-discharge curves of raw silicon powdersand 3D PS at different cycles are shown in Figure 5. For the raw sili-con electrode, a reversible capacity of 2146 mAh g−1 can be obtainedin the first cycle, but only 9.5% of the first capacity (205 mAh g−1)is kept after ten cycles. The fast capacity fading is not only related toparticle pulverization caused by huge volume changes, but also dueto severe polarization caused by a poor charge-transfer environment.After incorporation of 3D pores into silicon particles, however, thefirst reversible capacity increased from 2146 mAh g−1 to 2954 mAhg−1; and a high capacity of 1508 mAh g−1 can be reversibly extractedin the 10th cycle. Such improvement of capacity due to the 3D pores insilicon particle can be mainly ascribable to the increase of surface areaand the contraction of Li+ diffusion path length. To our knowledge,the cyclic performance of the 3D PS with micron size is comparablewith that of nano-sized silicon. This means that it is possible to pro-duce high capacity silicon-based composite using much cost-effectivemicro silicon.
Figure 6 compares cyclic performances of 3D PS and PS/Carboncomposite samples. As seen in Figure 6a, discharge/charge capacityof the 3D PS electrode experiences a rapid declining phase duringthe first 20 cycles and a reversible capacity of 664.6 mAh g−1 can beobtained at the 100th cycle. Compared to the 3D PS electrode, the firstdischarge/charge capacity of the PS/Carbon electrode declines dra-matically as a result of the decrease in silicon content, but a reversiblecapacity as high as 608.7 mAh g−1 is kept after 100 cycles withonly 0.69% of capacity loss ratio per cycle. Obviously, amorphouscarbon in 3D PS also plays an important role in the improvementof cyclic stability similar to other silicon/carbon composite.27–29 Forthe PS/Carbon composite, therefore, improvement of cyclability canbe attributed to effective self-absorption of volume changes, unitaryconducting network distributed not only on the surface but also in theinterior of silicon particle.
Figure 6. The cyclic performances of (a) 3D PSand (b) PS/Carbon composite.
) unless CC License in place (see abstract). ecsdl.org/site/terms_use address. Redistribution subject to ECS terms of use (see 98.200.219.199Downloaded on 2014-04-05 to IP
M56 ECS Solid State Letters, 2 (11) M53-M56 (2013)
Conclusions
3D PS and PS/Carbon composite were prepared by high tempera-ture sintering followed by HCl bleaching and hydrothermal treatment.3D pores were uniformly distributed in the micro silicon particles. The3D PS electrode kept a reversible capacity of 664.6 mAh g−1 up to100 cycles, which is almost ten times higher than that of raw sili-con electrodes. With the help of amorphous carbon, cyclic perfor-mance of the PC/Carbon composite was further improved, i.e. areversible capacity of 608.7 mAh g−1 can be obtained with only0.69% of capacity loss ratio after 100 cycles. It is believed thatthis fluoride-free preparation technology for 3D PS will providean alternative approach to improve the cyclability of silicon-basedcomposite.
Acknowledgments
This work was financially supported by Natural Science Foun-dation of China (NSFC, 51272128, 50972075) and Excellent YouthFoundation of Hubei Scientific Committee (2011CDA093). Moreover,the authors are grateful to Dr. Jianlin Li at Three Gorges Universityfor his kind support to our research.
References
1. J. M. Tarascon and M. Armand, Nature, 414, 359 (2001).2. H. Li, Z. X. Wang, L. Q. Chen, and X. J. Huang, Adv. Mater., 21, 4593 (2009).3. W. Chen, Z. L. Fan, A. Dhanabalan, C. H. Chen, and C. L. Wang, J. Electrochem.
Soc., 158(9), A1055 (2011).4. S. D. Beattie, D. Larcher, M. Morcrette, B. Simon, and J.-M. Tarascon, J. Elec-
trochem. Soc., 155(2), A158 (2008).5. X. Yang, Z. Wen, X. Xu, Z. Gu, and S. Huang, Electrochem. Solid-State Lett., 10(3),
A52 (2007).
6. C. K. Chan, R. N. Patel, M. J. O’Connell, B. A. Korgel, and Y. Cui, Nano Lett., 4(3),1443 (2010).
7. H. X. Chen, Y. Xiao, L. Wang, and Y. Yang, J. Power Sources, 196, 6657 (2011).8. T. Song, J. L. Xia, J.-H. Lee, D. H. Lee, M.-S. Kwon, J.-M. Choi, J. Wu, S. K. Doo,
H. Chang, W. Il. Park, D. S. Zang, H. Kim, Y. G. Huang, K.-C. Hwang, J. A. Rogers,and U. Paik, Nano Lett., 10, 1710 (2010).
9. J. Cho, J. Mater. Chem., 20, 4009 (2010).10. H. Kim, B. Han, J. Choo, and J. Cho, Angew. Chem. Int. Ed., 47, 10151 (2008).11. J. Xiao, W. Xu, D. Wang, D. Choi, W. Wang, X. Li, G. L. Graff, J. Liu, and J.-G. Zhang,
J. Electrochem. Soc., 157, A1047 (2010).12. J. Zhu, C. Gladden, N. Liu, Y. Cui, and X. Zhang, Phys. Chem. Chem. Phys., 15, 440
(2013).13. H.-C. Shin, J. A. Corno, J. L. Gole, and M. L. Liu, J. Power Sources, 139, 314 (2005).14. E. V. Astrova, G. V. Fedulova, I. A. Smirnova, A. D. Remenyuk, T. L. Kulova, and
A. M. Skundin, Tech. Phys. Lett., 37(8), 731 (2011).15. H. Ma, F. Y. Cheng, J.-Y. Chen, J.-Z. Zhao, C.-S. Li, Z.-L. Tao, and J. Liang, Adv.
Mater., 19, 4067 (2007).16. Y. Yu, L. Gu, C. Zhu, S. Tsukimoto, P. A. van Aken, and J. Maier, Adv. Mater., 22,
2247 (2010).17. P. Gao, H. Jia, J. Yang, Y. Nuli, J. Wang, and J. Chen, Phys. Chem. Chem. Phys., 13,
20108 (2011).18. M. Thakur, M. Isaacson, S. L. Sinsabaugh, M. S. Wong, and S. L. Biswal, J. Power
Sources, 205, 426 (2012).19. X. Yang, Z. Wen, X. Xu, B. Lin, and S. Huang, J. Power Sources, 164, 880 (2007).20. L. Chen, X. Xie, B. Wang, K. Wang, and J. Xie, Mat. Sci. Eng. B, 131, 186 (2006).21. X. Yang, Z. Wen, X. Xu, B. Lin, and Z. Lin, J. Electrochem. Soc., 153(7), A1341
(2006).22. P. Limthongkul, Y.-I. Jang, N. J. Dudney, and Y.-M. Chiang, Acta Mater., 51, 1103
(2003).23. S. Yoon, S.-Il. Lee, H. Kim, and H.-J. Sohn, J. Power Sources, 161(2), 1319 (2006).24. M. R. Jiang, Rare Metals, 1, 88 (1989).25. Y. Cao, L. Xiao, X. Ai, and H. Yang, Electrochem. Solid-State Lett., 6(2), A30 (2003).26. H. Guo, H. Zhao, C. Yin, and W. Qiu, Mat. Sci. Eng. B, 131, 173 (2006).27. Q. Si, K. Hanai, T. Ichikawa, A. Hirano, N. Imanishi, Y. Takeda, and O. Yamamoto,
J. Power Sources, 195, 1720 (2010).28. M. K. Datta, J. Maranchi, S. J. Chung, R. Epur, K. Kadakia, P. Jampani, and
P. N. Kumta, Electrochim. Acta, 56, 4717 (2011).29. L. Wang, C. X. Ding, L. C. Zhang, H. W. Xu, D. W. Zhang, T. Cheng, and C. H. Chen,
J. Power Sources, 195, 5052 (2010).
) unless CC License in place (see abstract). ecsdl.org/site/terms_use address. Redistribution subject to ECS terms of use (see 98.200.219.199Downloaded on 2014-04-05 to IP