Embed Size (px)
Citation preview
Preliminary Analysis of D.C. Public Schools
Reading and Math Scores
By the
Council of the Great City Schools
July 30, 2013
2
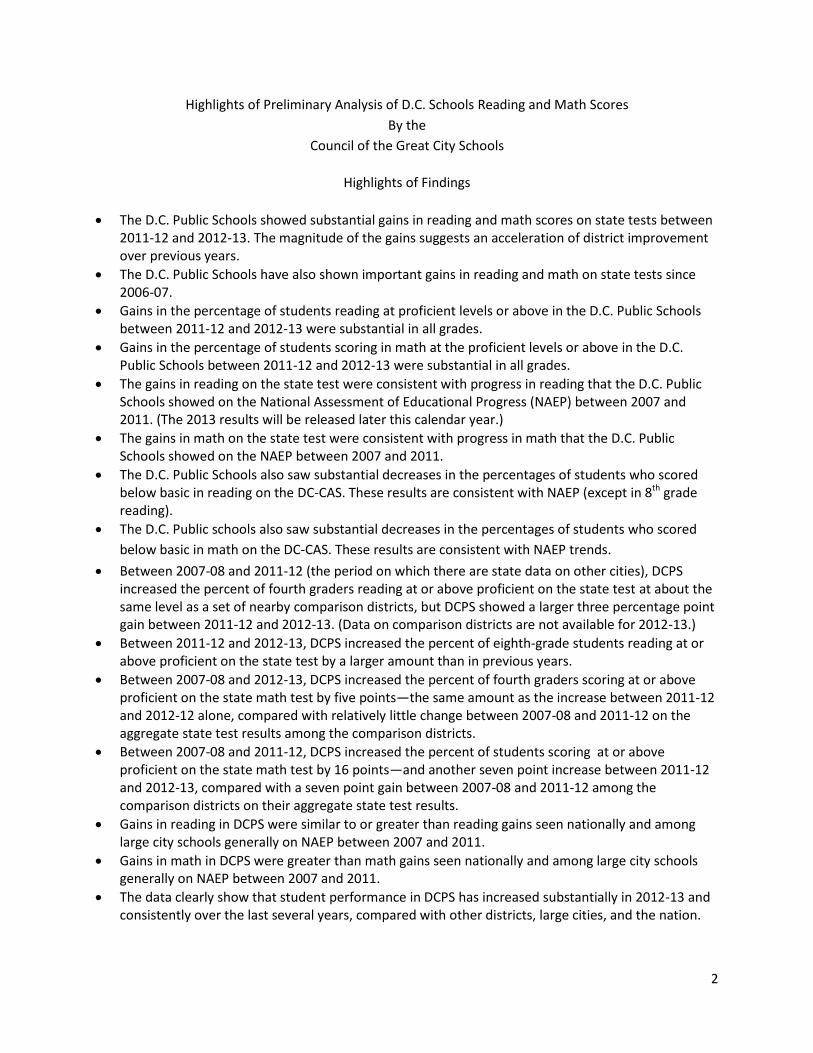
Highlights of Preliminary Analysis of D.C. Schools Reading and Math Scores
By the
Council of the Great City Schools
Highlights of Findings
The D.C. Public Schools showed substantial gains in reading and math scores on state tests between 2011-12 and 2012-13. The magnitude of the gains suggests an acceleration of district improvement over previous years.
The D.C. Public Schools have also shown important gains in reading and math on state tests since 2006-07.
Gains in the percentage of students reading at proficient levels or above in the D.C. Public Schools between 2011-12 and 2012-13 were substantial in all grades.
Gains in the percentage of students scoring in math at the proficient levels or above in the D.C. Public Schools between 2011-12 and 2012-13 were substantial in all grades.
The gains in reading on the state test were consistent with progress in reading that the D.C. Public Schools showed on the National Assessment of Educational Progress (NAEP) between 2007 and 2011. (The 2013 results will be released later this calendar year.)
The gains in math on the state test were consistent with progress in math that the D.C. Public Schools showed on the NAEP between 2007 and 2011.
The D.C. Public Schools also saw substantial decreases in the percentages of students who scored below basic in reading on the DC-CAS. These results are consistent with NAEP (except in 8th grade reading).
The D.C. Public schools also saw substantial decreases in the percentages of students who scored
below basic in math on the DC-CAS. These results are consistent with NAEP trends.
Between 2007-08 and 2011-12 (the period on which there are state data on other cities), DCPS increased the percent of fourth graders reading at or above proficient on the state test at about the same level as a set of nearby comparison districts, but DCPS showed a larger three percentage point gain between 2011-12 and 2012-13. (Data on comparison districts are not available for 2012-13.)
Between 2011-12 and 2012-13, DCPS increased the percent of eighth-grade students reading at or above proficient on the state test by a larger amount than in previous years.
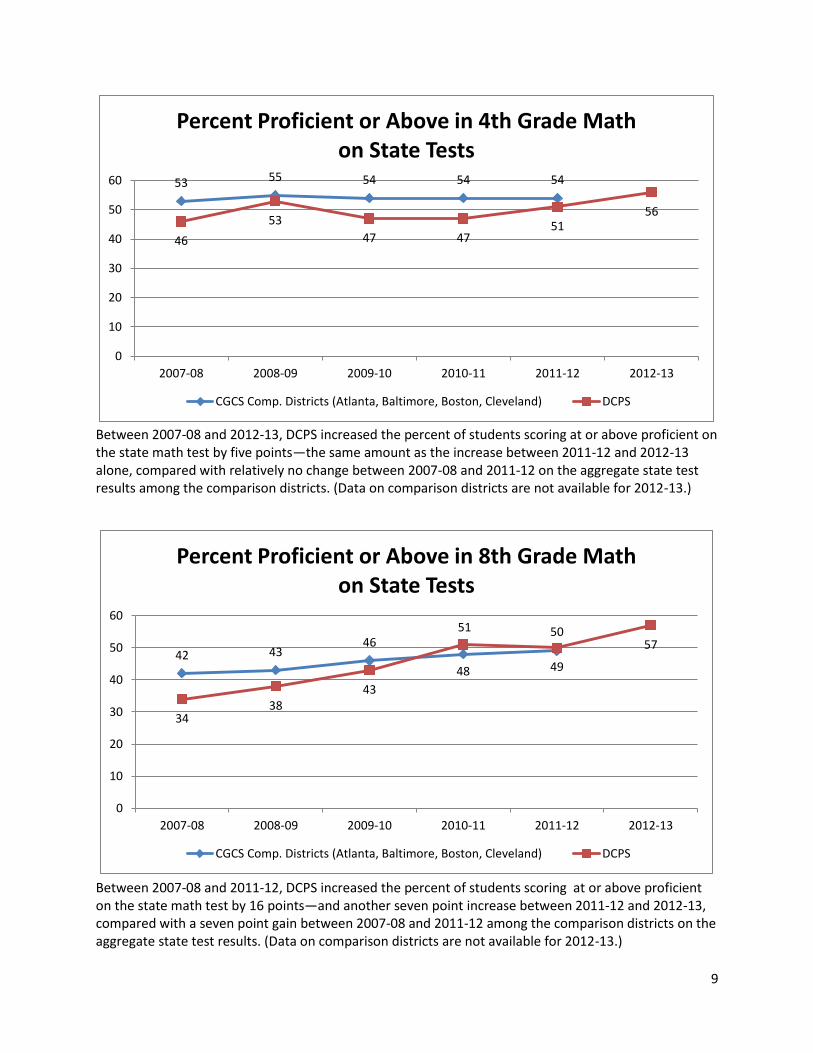
Between 2007-08 and 2012-13, DCPS increased the percent of fourth graders scoring at or above proficient on the state math test by five points—the same amount as the increase between 2011-12 and 2012-12 alone, compared with relatively little change between 2007-08 and 2011-12 on the aggregate state test results among the comparison districts.
Between 2007-08 and 2011-12, DCPS increased the percent of students scoring at or above proficient on the state math test by 16 points—and another seven point increase between 2011-12 and 2012-13, compared with a seven point gain between 2007-08 and 2011-12 among the comparison districts on their aggregate state test results.
Gains in reading in DCPS were similar to or greater than reading gains seen nationally and among large city schools generally on NAEP between 2007 and 2011.
Gains in math in DCPS were greater than math gains seen nationally and among large city schools generally on NAEP between 2007 and 2011.
The data clearly show that student performance in DCPS has increased substantially in 2012-13 and consistently over the last several years, compared with other districts, large cities, and the nation.
3
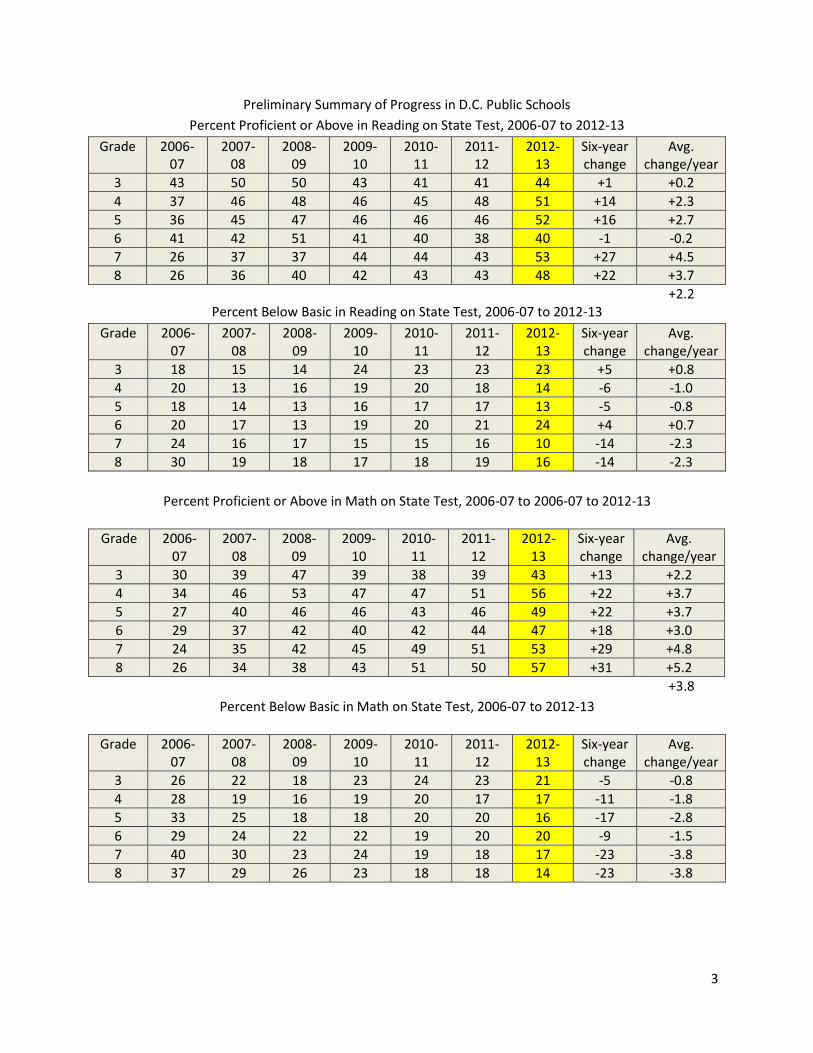
Preliminary Summary of Progress in D.C. Public Schools
Percent Proficient or Above in Reading on State Test, 2006-07 to 2012-13
Grade 2006-07
2007-08
2008-09
2009-10
2010-11
2011-12
2012-13
Six-year change
Avg. change/year
3 43 50 50 43 41 41 44 +1 +0.2
4 37 46 48 46 45 48 51 +14 +2.3
5 36 45 47 46 46 46 52 +16 +2.7
6 41 42 51 41 40 38 40 -1 -0.2
7 26 37 37 44 44 43 53 +27 +4.5
8 26 36 40 42 43 43 48 +22 +3.7
+2.2 Percent Below Basic in Reading on State Test, 2006-07 to 2012-13
Grade 2006-07
2007-08
2008-09
2009-10
2010-11
2011-12
2012-13
Six-year change
Avg. change/year
3 18 15 14 24 23 23 23 +5 +0.8
4 20 13 16 19 20 18 14 -6 -1.0
5 18 14 13 16 17 17 13 -5 -0.8
6 20 17 13 19 20 21 24 +4 +0.7
7 24 16 17 15 15 16 10 -14 -2.3
8 30 19 18 17 18 19 16 -14 -2.3
Percent Proficient or Above in Math on State Test, 2006-07 to 2006-07 to 2012-13
Grade 2006-07
2007-08
2008-09
2009-10
2010-11
2011-12
2012-13
Six-year change
Avg. change/year
3 30 39 47 39 38 39 43 +13 +2.2
4 34 46 53 47 47 51 56 +22 +3.7
5 27 40 46 46 43 46 49 +22 +3.7
6 29 37 42 40 42 44 47 +18 +3.0
7 24 35 42 45 49 51 53 +29 +4.8
8 26 34 38 43 51 50 57 +31 +5.2
+3.8
Percent Below Basic in Math on State Test, 2006-07 to 2012-13
Grade 2006-07
2007-08
2008-09
2009-10
2010-11
2011-12
2012-13
Six-year change
Avg. change/year
3 26 22 18 23 24 23 21 -5 -0.8
4 28 19 16 19 20 17 17 -11 -1.8
5 33 25 18 18 20 20 16 -17 -2.8
6 29 24 22 22 19 20 20 -9 -1.5
7 40 30 23 24 19 18 17 -23 -3.8
8 37 29 26 23 18 18 14 -23 -3.8
4
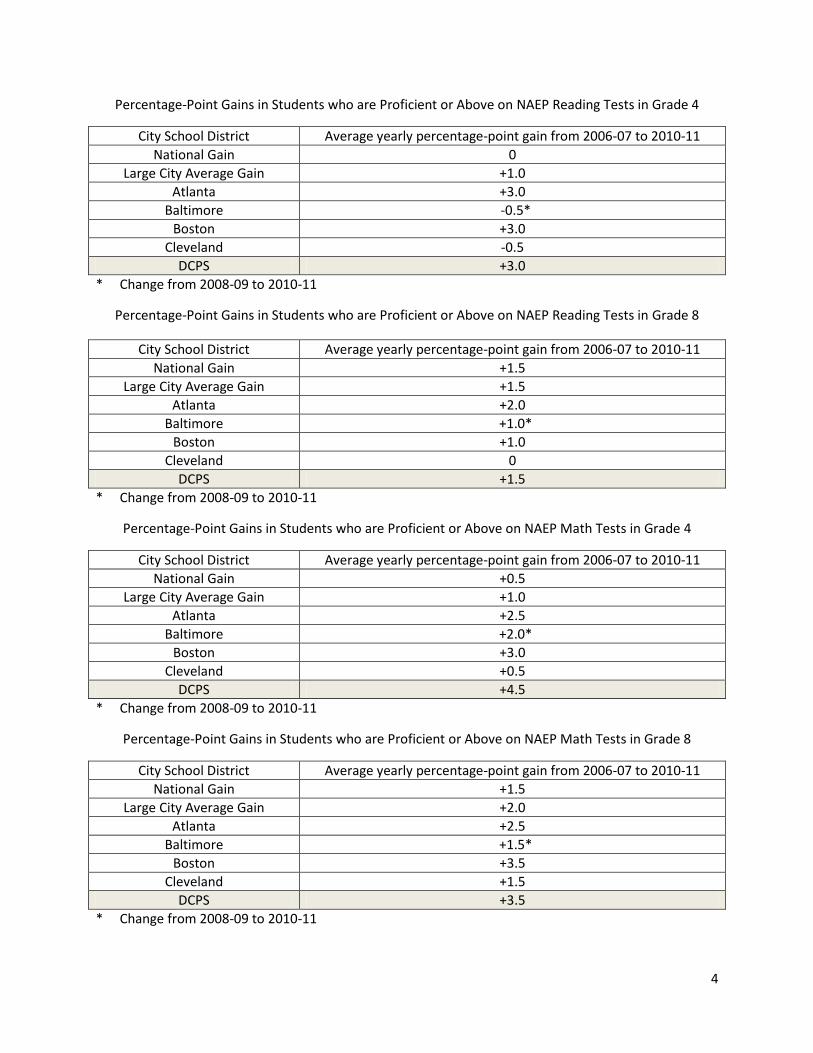
Percentage-Point Gains in Students who are Proficient or Above on NAEP Reading Tests in Grade 4
City School District Average yearly percentage-point gain from 2006-07 to 2010-11
National Gain 0
Large City Average Gain +1.0
Atlanta +3.0
Baltimore -0.5*
Boston +3.0
Cleveland -0.5
DCPS +3.0
* Change from 2008-09 to 2010-11
Percentage-Point Gains in Students who are Proficient or Above on NAEP Reading Tests in Grade 8
City School District Average yearly percentage-point gain from 2006-07 to 2010-11
National Gain +1.5
Large City Average Gain +1.5
Atlanta +2.0
Baltimore +1.0*
Boston +1.0
Cleveland 0
DCPS +1.5
* Change from 2008-09 to 2010-11
Percentage-Point Gains in Students who are Proficient or Above on NAEP Math Tests in Grade 4
City School District Average yearly percentage-point gain from 2006-07 to 2010-11
National Gain +0.5
Large City Average Gain +1.0
Atlanta +2.5
Baltimore +2.0*
Boston +3.0
Cleveland +0.5
DCPS +4.5
* Change from 2008-09 to 2010-11
Percentage-Point Gains in Students who are Proficient or Above on NAEP Math Tests in Grade 8
City School District Average yearly percentage-point gain from 2006-07 to 2010-11
National Gain +1.5
Large City Average Gain +2.0
Atlanta +2.5
Baltimore +1.5*
Boston +3.5
Cleveland +1.5
DCPS +3.5
* Change from 2008-09 to 2010-11
5
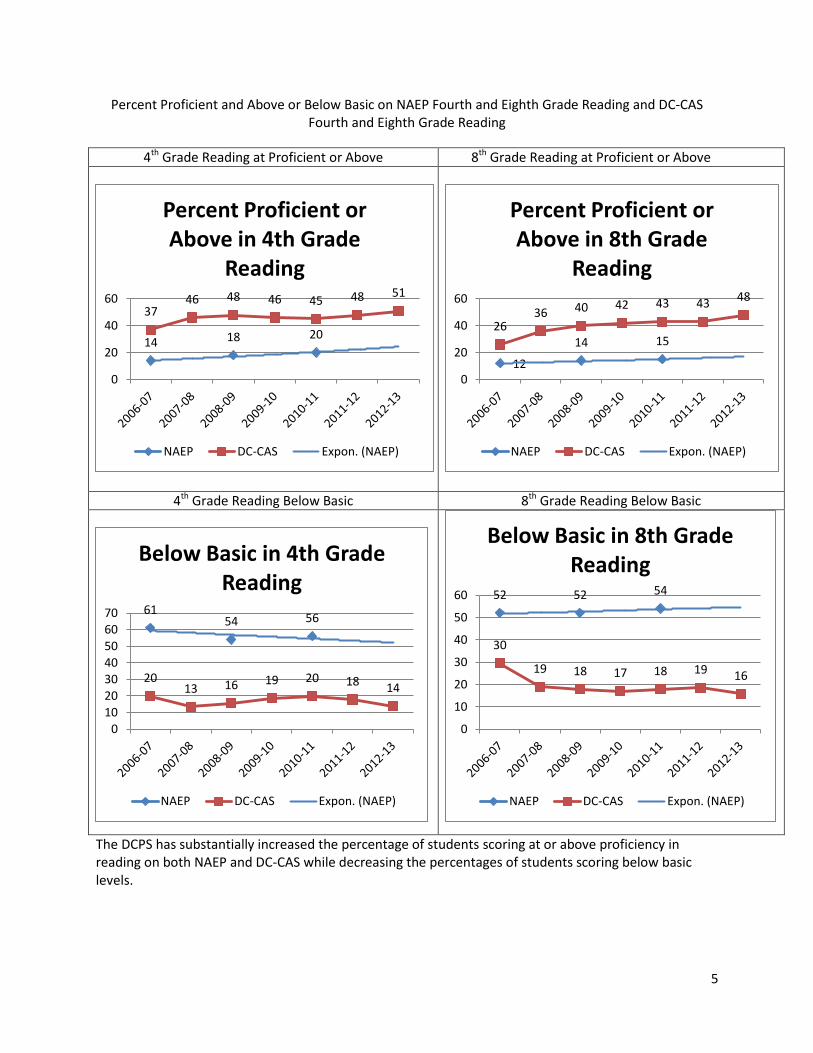
Percent Proficient and Above or Below Basic on NAEP Fourth and Eighth Grade Reading and DC-CAS Fourth and Eighth Grade Reading
4th Grade Reading at Proficient or Above 8th Grade Reading at Proficient or Above
4th Grade Reading Below Basic 8th Grade Reading Below Basic
The DCPS has substantially increased the percentage of students scoring at or above proficiency in reading on both NAEP and DC-CAS while decreasing the percentages of students scoring below basic levels.
14 18 20
37 46 48 46 45 48 51
0
20
40
60
Percent Proficient or Above in 4th Grade
Reading
NAEP DC-CAS Expon. (NAEP)
12
14 15 26
36 40 42 43 43 48
0
20
40
60
Percent Proficient or Above in 8th Grade
Reading
NAEP DC-CAS Expon. (NAEP)
61 54 56
20 13 16 19 20 18 14
0
10
20
3040
50
6070
Below Basic in 4th Grade Reading
NAEP DC-CAS Expon. (NAEP)
52 52 54
30
19 18 17 18 19 16
0
10
20
30
40
50
60
Below Basic in 8th Grade Reading
NAEP DC-CAS Expon. (NAEP)
6
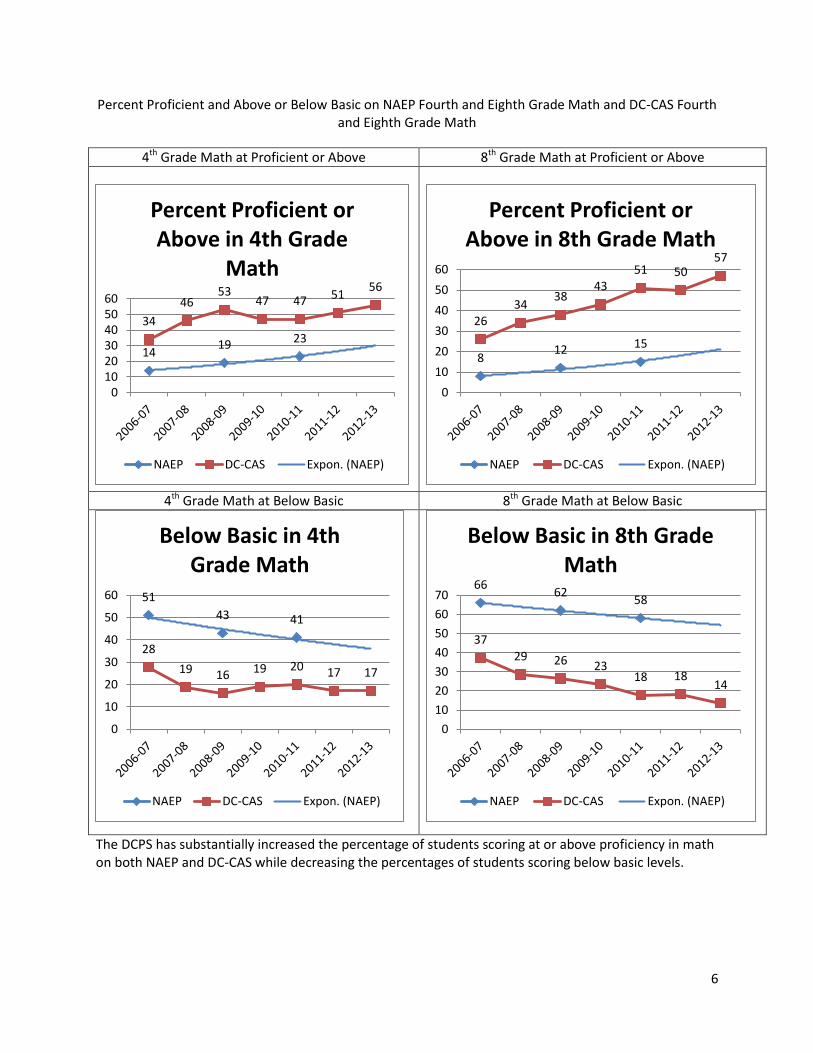
Percent Proficient and Above or Below Basic on NAEP Fourth and Eighth Grade Math and DC-CAS Fourth and Eighth Grade Math
4th Grade Math at Proficient or Above 8th Grade Math at Proficient or Above
4th Grade Math at Below Basic 8th Grade Math at Below Basic
The DCPS has substantially increased the percentage of students scoring at or above proficiency in math on both NAEP and DC-CAS while decreasing the percentages of students scoring below basic levels.
14 19 23
34
46 53
47 47 51 56
0102030405060
Percent Proficient or Above in 4th Grade
Math
NAEP DC-CAS Expon. (NAEP)
8 12 15
26 34
38 43
51 50 57
0
10
20
30
40
50
60
Percent Proficient or Above in 8th Grade Math
NAEP DC-CAS Expon. (NAEP)
51
43 41
28
19 16 19 20 17 17
0
10
20
30
40
50
60
Below Basic in 4th Grade Math
NAEP DC-CAS Expon. (NAEP)
66 62
58
37
29 26 23 18 18
14
0
10
20
30
40
50
60
70
Below Basic in 8th Grade Math
NAEP DC-CAS Expon. (NAEP)
7
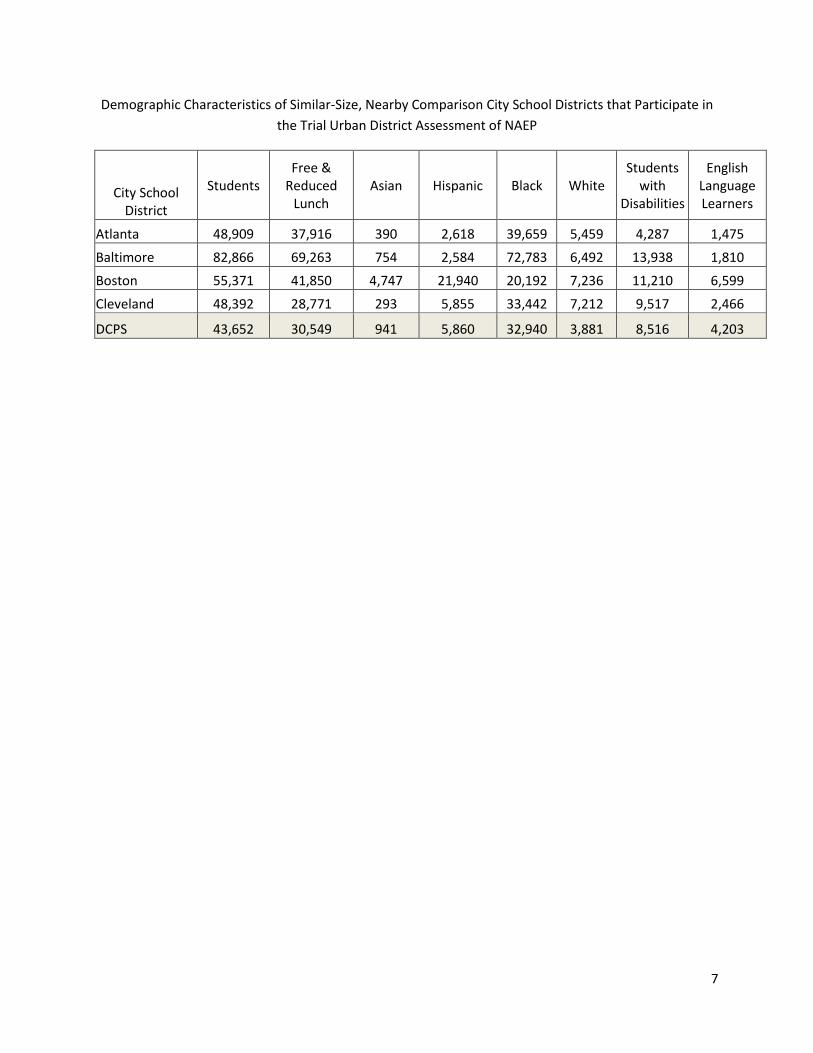
Demographic Characteristics of Similar-Size, Nearby Comparison City School Districts that Participate in
the Trial Urban District Assessment of NAEP
City School District
Students Free &
Reduced Lunch
Asian Hispanic Black White Students
with Disabilities
English Language Learners
Atlanta 48,909 37,916 390 2,618 39,659 5,459 4,287 1,475
Baltimore 82,866 69,263 754 2,584 72,783 6,492 13,938 1,810
Boston 55,371 41,850 4,747 21,940 20,192 7,236 11,210 6,599
Cleveland 48,392 28,771 293 5,855 33,442 7,212 9,517 2,466
DCPS 43,652 30,549 941 5,860 32,940 3,881 8,516 4,203
8
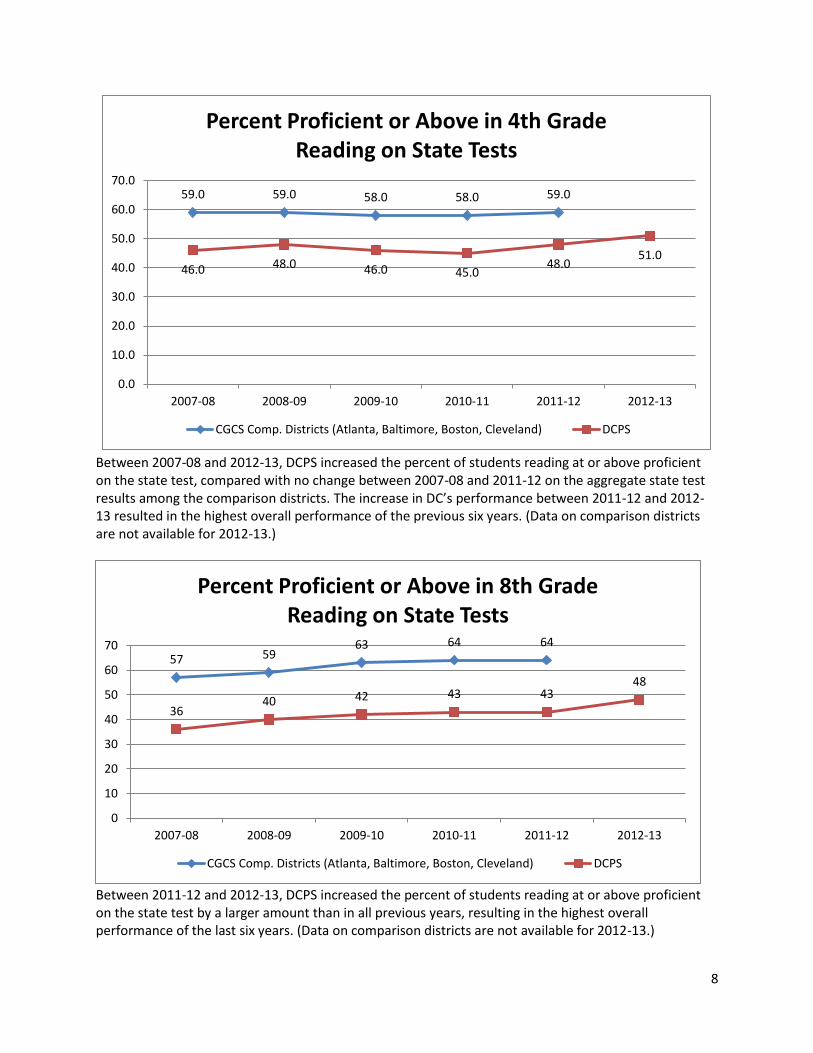
Between 2007-08 and 2012-13, DCPS increased the percent of students reading at or above proficient on the state test, compared with no change between 2007-08 and 2011-12 on the aggregate state test results among the comparison districts. The increase in DC’s performance between 2011-12 and 2012-13 resulted in the highest overall performance of the previous six years. (Data on comparison districts are not available for 2012-13.)
Between 2011-12 and 2012-13, DCPS increased the percent of students reading at or above proficient on the state test by a larger amount than in all previous years, resulting in the highest overall performance of the last six years. (Data on comparison districts are not available for 2012-13.)
59.0 59.0 58.0 58.0 59.0
46.0 48.0 46.0 45.0 48.0
51.0
0.0
10.0
20.0
30.0
40.0
50.0
60.0
70.0
2007-08 2008-09 2009-10 2010-11 2011-12 2012-13
Percent Proficient or Above in 4th Grade Reading on State Tests
CGCS Comp. Districts (Atlanta, Baltimore, Boston, Cleveland) DCPS
57 59 63 64 64
36 40 42 43 43
48
0
10
20
30
40
50
60
70
2007-08 2008-09 2009-10 2010-11 2011-12 2012-13
Percent Proficient or Above in 8th Grade Reading on State Tests
CGCS Comp. Districts (Atlanta, Baltimore, Boston, Cleveland) DCPS
9
Between 2007-08 and 2012-13, DCPS increased the percent of students scoring at or above proficient on the state math test by five points—the same amount as the increase between 2011-12 and 2012-13 alone, compared with relatively no change between 2007-08 and 2011-12 on the aggregate state test results among the comparison districts. (Data on comparison districts are not available for 2012-13.)
Between 2007-08 and 2011-12, DCPS increased the percent of students scoring at or above proficient on the state math test by 16 points—and another seven point increase between 2011-12 and 2012-13, compared with a seven point gain between 2007-08 and 2011-12 among the comparison districts on the aggregate state test results. (Data on comparison districts are not available for 2012-13.)
53 55 54 54 54
46
53
47 47 51
56
0
10
20
30
40
50
60
2007-08 2008-09 2009-10 2010-11 2011-12 2012-13
Percent Proficient or Above in 4th Grade Math on State Tests
CGCS Comp. Districts (Atlanta, Baltimore, Boston, Cleveland) DCPS
42 43 46
48 49
34 38
43
51 50 57
0
10
20
30
40
50
60
2007-08 2008-09 2009-10 2010-11 2011-12 2012-13
Percent Proficient or Above in 8th Grade Math on State Tests
CGCS Comp. Districts (Atlanta, Baltimore, Boston, Cleveland) DCPS
10
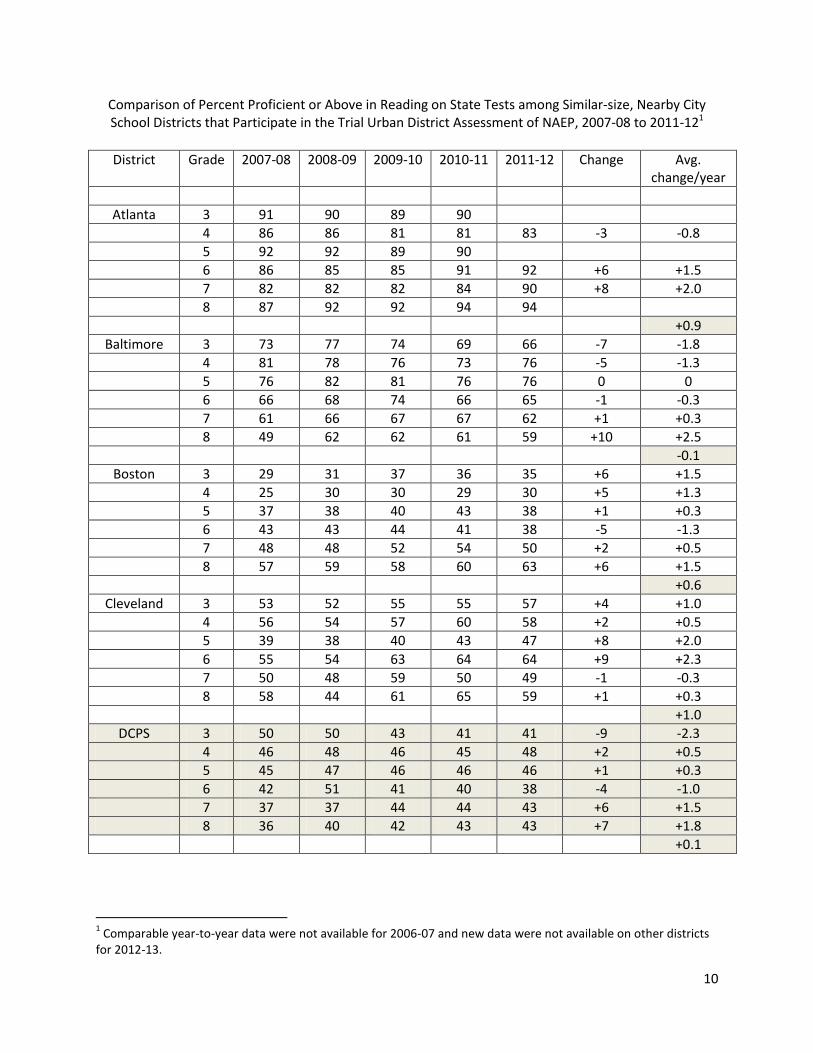
Comparison of Percent Proficient or Above in Reading on State Tests among Similar-size, Nearby City School Districts that Participate in the Trial Urban District Assessment of NAEP, 2007-08 to 2011-121
District Grade 2007-08 2008-09 2009-10 2010-11 2011-12 Change Avg. change/year
Atlanta 3 91 90 89 90
4 86 86 81 81 83 -3 -0.8
5 92 92 89 90
6 86 85 85 91 92 +6 +1.5
7 82 82 82 84 90 +8 +2.0
8 87 92 92 94 94
+0.9
Baltimore 3 73 77 74 69 66 -7 -1.8
4 81 78 76 73 76 -5 -1.3
5 76 82 81 76 76 0 0
6 66 68 74 66 65 -1 -0.3
7 61 66 67 67 62 +1 +0.3
8 49 62 62 61 59 +10 +2.5
-0.1
Boston 3 29 31 37 36 35 +6 +1.5
4 25 30 30 29 30 +5 +1.3
5 37 38 40 43 38 +1 +0.3
6 43 43 44 41 38 -5 -1.3
7 48 48 52 54 50 +2 +0.5
8 57 59 58 60 63 +6 +1.5
+0.6
Cleveland 3 53 52 55 55 57 +4 +1.0
4 56 54 57 60 58 +2 +0.5
5 39 38 40 43 47 +8 +2.0
6 55 54 63 64 64 +9 +2.3
7 50 48 59 50 49 -1 -0.3
8 58 44 61 65 59 +1 +0.3
+1.0
DCPS 3 50 50 43 41 41 -9 -2.3
4 46 48 46 45 48 +2 +0.5
5 45 47 46 46 46 +1 +0.3
6 42 51 41 40 38 -4 -1.0
7 37 37 44 44 43 +6 +1.5
8 36 40 42 43 43 +7 +1.8
+0.1
1 Comparable year-to-year data were not available for 2006-07 and new data were not available on other districts
for 2012-13.
11
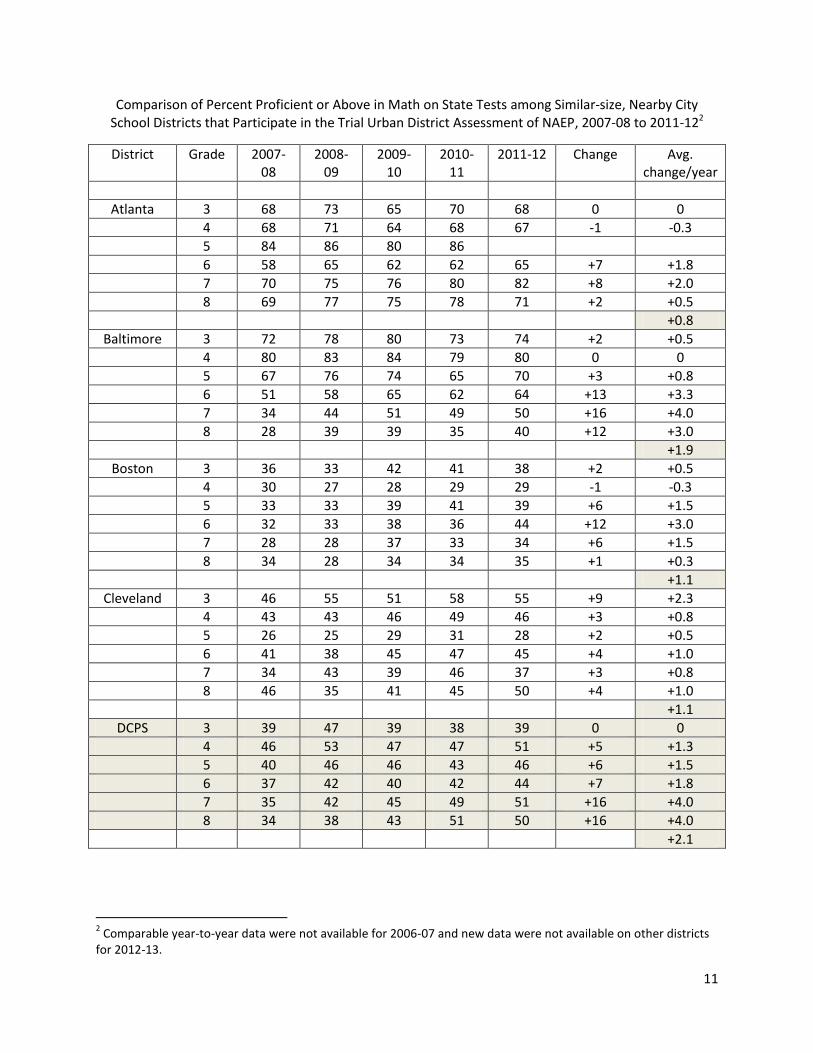
Comparison of Percent Proficient or Above in Math on State Tests among Similar-size, Nearby City School Districts that Participate in the Trial Urban District Assessment of NAEP, 2007-08 to 2011-122
District Grade 2007-08
2008-09
2009-10
2010-11
2011-12 Change Avg. change/year
Atlanta 3 68 73 65 70 68 0 0
4 68 71 64 68 67 -1 -0.3
5 84 86 80 86
6 58 65 62 62 65 +7 +1.8
7 70 75 76 80 82 +8 +2.0
8 69 77 75 78 71 +2 +0.5
+0.8
Baltimore 3 72 78 80 73 74 +2 +0.5
4 80 83 84 79 80 0 0
5 67 76 74 65 70 +3 +0.8
6 51 58 65 62 64 +13 +3.3
7 34 44 51 49 50 +16 +4.0
8 28 39 39 35 40 +12 +3.0
+1.9
Boston 3 36 33 42 41 38 +2 +0.5
4 30 27 28 29 29 -1 -0.3
5 33 33 39 41 39 +6 +1.5
6 32 33 38 36 44 +12 +3.0
7 28 28 37 33 34 +6 +1.5
8 34 28 34 34 35 +1 +0.3
+1.1
Cleveland 3 46 55 51 58 55 +9 +2.3
4 43 43 46 49 46 +3 +0.8
5 26 25 29 31 28 +2 +0.5
6 41 38 45 47 45 +4 +1.0
7 34 43 39 46 37 +3 +0.8
8 46 35 41 45 50 +4 +1.0
+1.1
DCPS 3 39 47 39 38 39 0 0
4 46 53 47 47 51 +5 +1.3
5 40 46 46 43 46 +6 +1.5
6 37 42 40 42 44 +7 +1.8
7 35 42 45 49 51 +16 +4.0
8 34 38 43 51 50 +16 +4.0
+2.1
2 Comparable year-to-year data were not available for 2006-07 and new data were not available on other districts
for 2012-13.
12
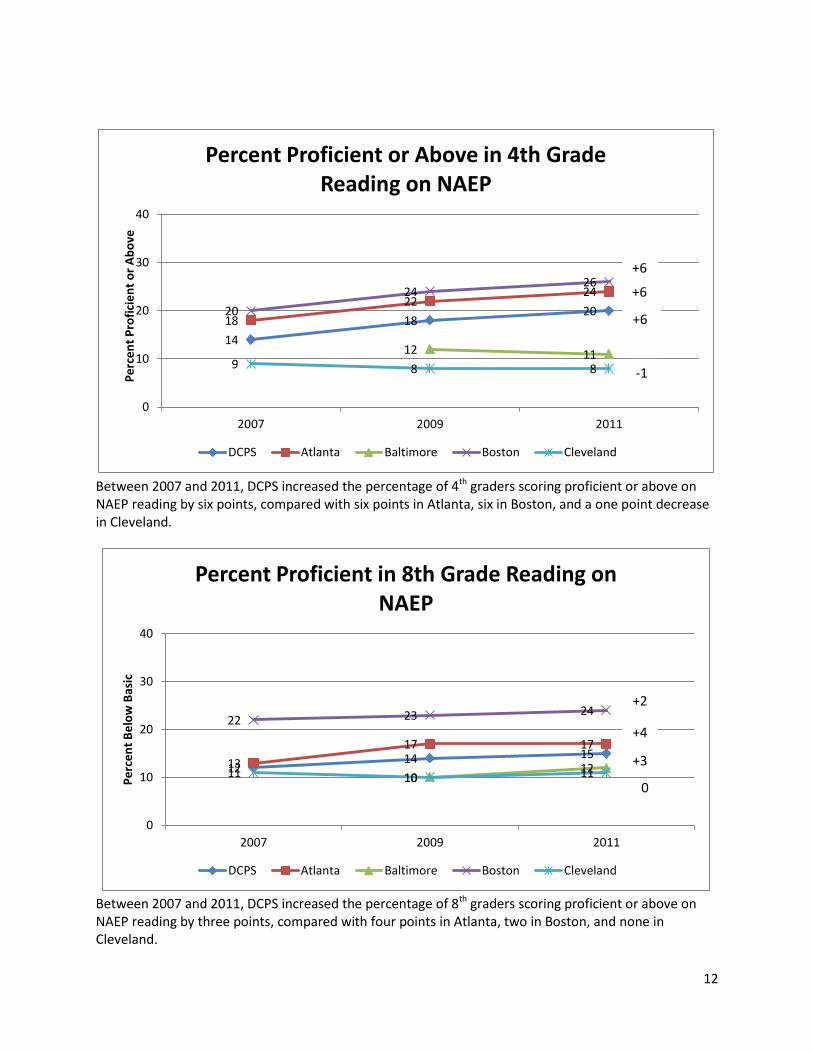
Between 2007 and 2011, DCPS increased the percentage of 4th graders scoring proficient or above on NAEP reading by six points, compared with six points in Atlanta, six in Boston, and a one point decrease in Cleveland.
Between 2007 and 2011, DCPS increased the percentage of 8th graders scoring proficient or above on NAEP reading by three points, compared with four points in Atlanta, two in Boston, and none in Cleveland.
14
18 20
18
22 24
12 11
20
24 26
9 8 8
0
10
20
30
40
2007 2009 2011
Pe
rce
nt
Pro
fici
en
t o
r A
bo
ve
Percent Proficient or Above in 4th Grade Reading on NAEP
DCPS Atlanta Baltimore Boston Cleveland
+6
+6
-1
+6
12 14 15
13
17 17
10 12
22 23 24
11 10 11
0
10
20
30
40
2007 2009 2011
Pe
rce
nt
Be
low
Bas
ic
Percent Proficient in 8th Grade Reading on NAEP
DCPS Atlanta Baltimore Boston Cleveland
+6
+2
+4
0
+3
13
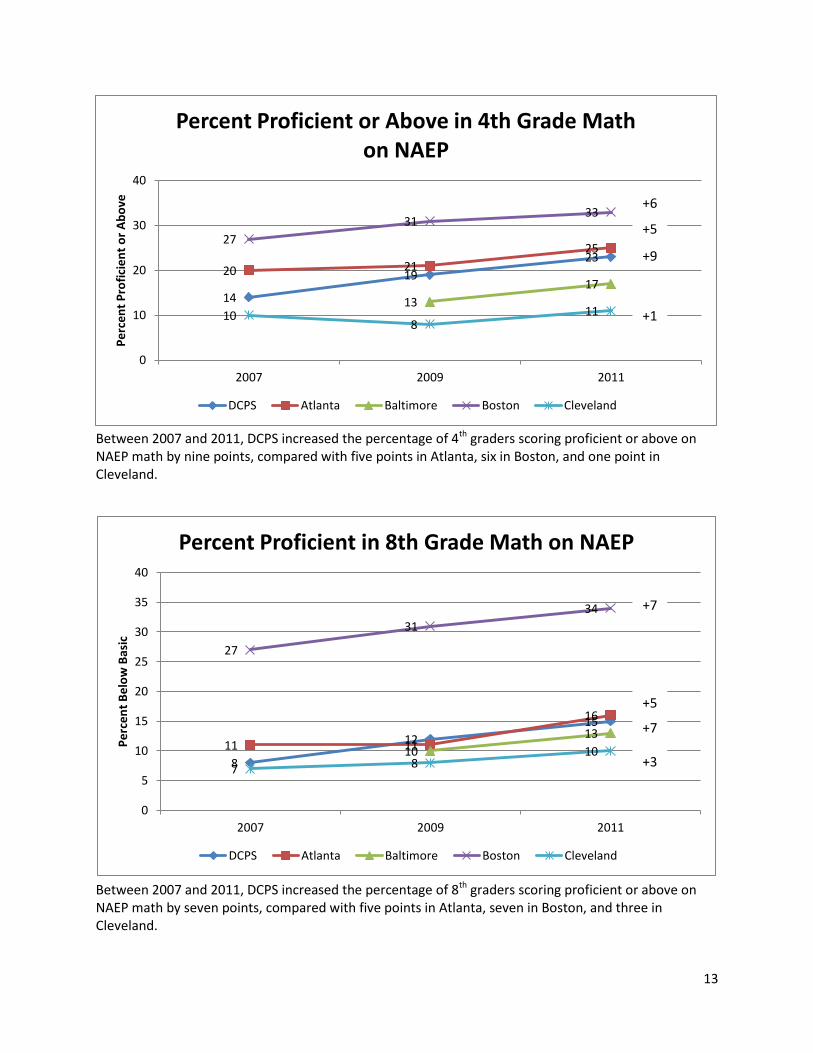
Between 2007 and 2011, DCPS increased the percentage of 4th graders scoring proficient or above on NAEP math by nine points, compared with five points in Atlanta, six in Boston, and one point in Cleveland.
Between 2007 and 2011, DCPS increased the percentage of 8th graders scoring proficient or above on NAEP math by seven points, compared with five points in Atlanta, seven in Boston, and three in Cleveland.
14
19
23 20 21
25
13
17
27
31 33
10 8
11
0
10
20
30
40
2007 2009 2011
Pe
rce
nt
Pro
fici
en
t o
r A
bo
ve
Percent Proficient or Above in 4th Grade Math on NAEP
DCPS Atlanta Baltimore Boston Cleveland
8
12
15
11 11
16
10
13
27
31
34
7 8 10
0
5
10
15
20
25
30
35
40
2007 2009 2011
Pe
rce
nt
Be
low
Bas
ic
Percent Proficient in 8th Grade Math on NAEP
DCPS Atlanta Baltimore Boston Cleveland
+6
+5
+9
+1
+7
+5
+7
+3
14
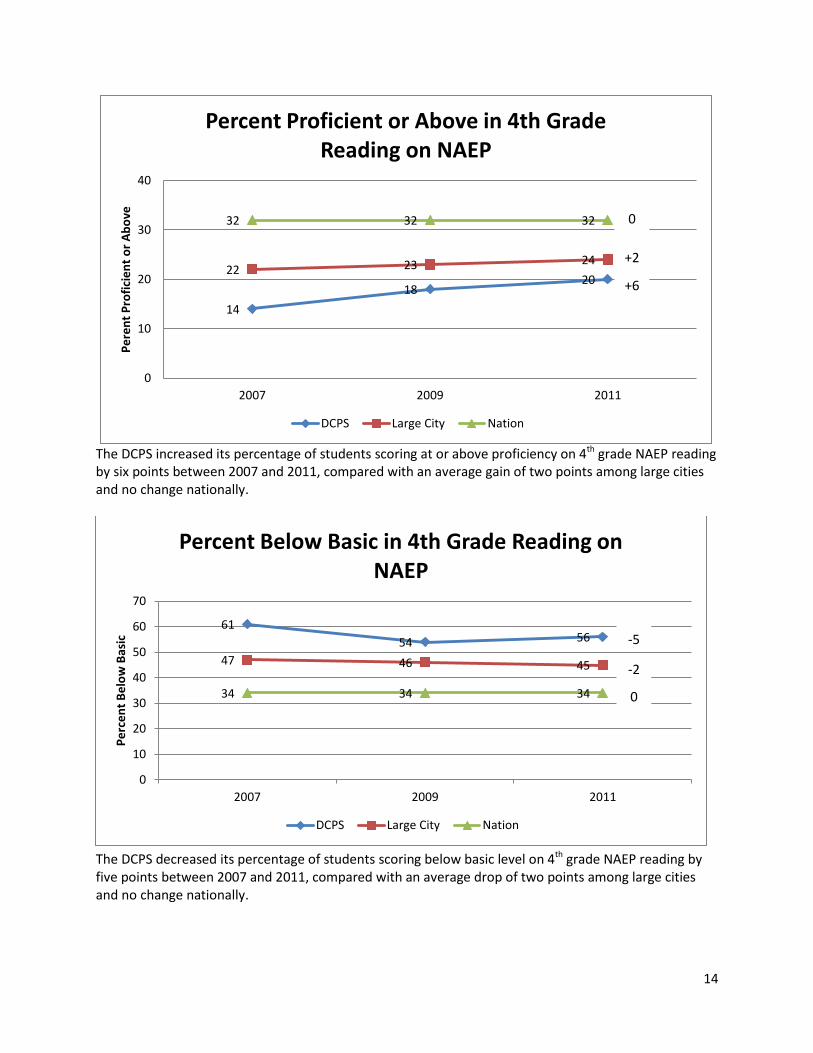
The DCPS increased its percentage of students scoring at or above proficiency on 4th grade NAEP reading by six points between 2007 and 2011, compared with an average gain of two points among large cities and no change nationally.
The DCPS decreased its percentage of students scoring below basic level on 4th grade NAEP reading by five points between 2007 and 2011, compared with an average drop of two points among large cities and no change nationally.
14
18 20
22 23 24
32 32 32
0
10
20
30
40
2007 2009 2011
Pe
ren
t P
rofi
cie
nt
or
Ab
ove
Percent Proficient or Above in 4th Grade
Reading on NAEP
DCPS Large City Nation
61
54 56
47 46 45
34 34 34
0
10
20
30
40
50
60
70
2007 2009 2011
Pe
rce
nt
Be
low
Bas
ic
Percent Below Basic in 4th Grade Reading on NAEP
DCPS Large City Nation
0
0
+2
+6
-5
-2
15
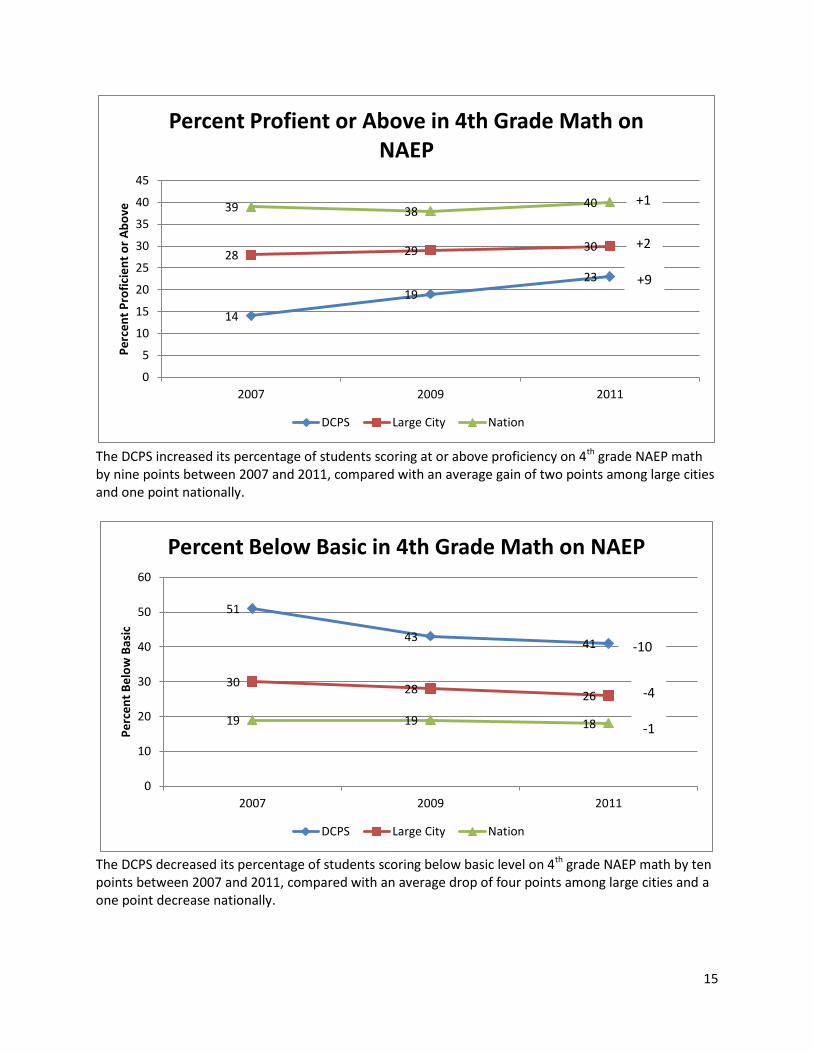
The DCPS increased its percentage of students scoring at or above proficiency on 4th grade NAEP math by nine points between 2007 and 2011, compared with an average gain of two points among large cities and one point nationally.
The DCPS decreased its percentage of students scoring below basic level on 4th grade NAEP math by ten points between 2007 and 2011, compared with an average drop of four points among large cities and a one point decrease nationally.
14
19
23
28 29 30
39 38 40
0
5
10
15
20
25
30
35
40
45
2007 2009 2011
Pe
rce
nt
Pro
fici
en
t o
r A
bo
ve
Percent Profient or Above in 4th Grade Math on NAEP
DCPS Large City Nation
+1
+2
51
43 41
30 28
26
19 19 18
0
10
20
30
40
50
60
2007 2009 2011
Pe
rce
nt
Be
low
Bas
ic
Percent Below Basic in 4th Grade Math on NAEP
DCPS Large City Nation
+9
-10
-4
-1
16
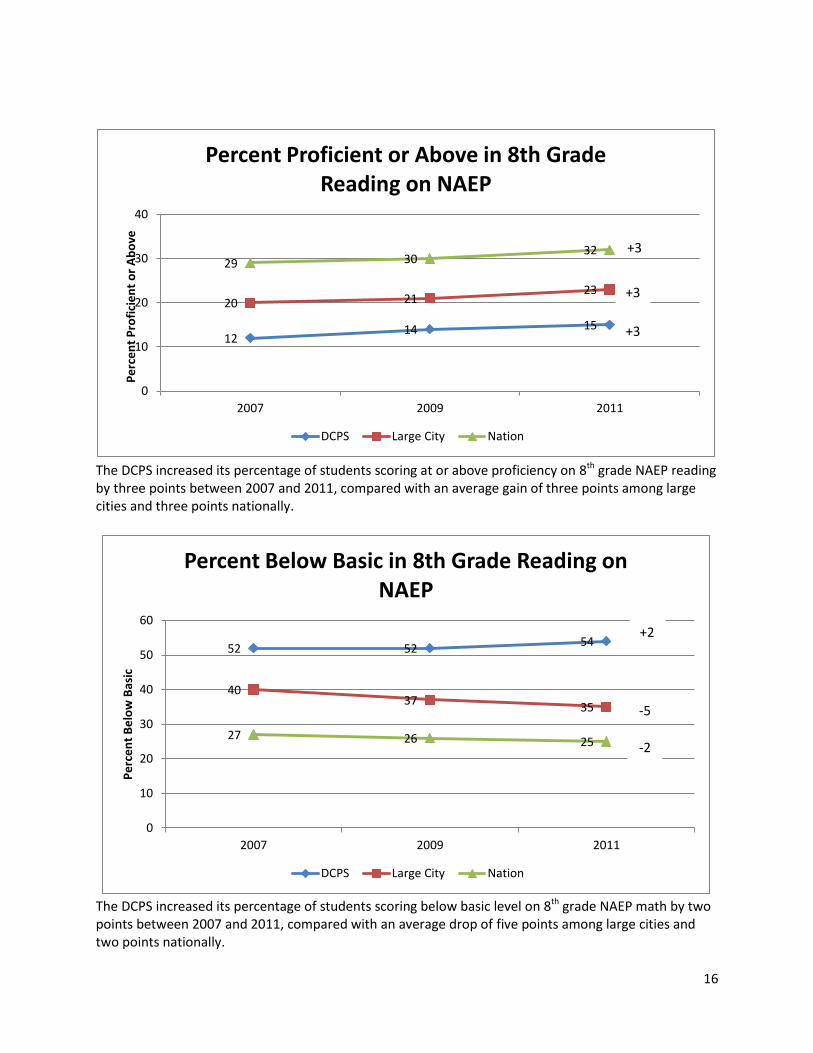
The DCPS increased its percentage of students scoring at or above proficiency on 8th grade NAEP reading by three points between 2007 and 2011, compared with an average gain of three points among large cities and three points nationally.
The DCPS increased its percentage of students scoring below basic level on 8th grade NAEP math by two points between 2007 and 2011, compared with an average drop of five points among large cities and two points nationally.
12 14 15
20 21 23
29 30 32
0
10
20
30
40
2007 2009 2011
Pe
rce
nt
Pro
fici
en
t o
r A
bo
ve
Percent Proficient or Above in 8th Grade Reading on NAEP
DCPS Large City Nation
+3
52 52 54
40 37
35
27 26 25
0
10
20
30
40
50
60
2007 2009 2011
Pe
rce
nt
Be
low
Bas
ic
Percent Below Basic in 8th Grade Reading on NAEP
DCPS Large City Nation
+2
+3
+3
-5
-2
17
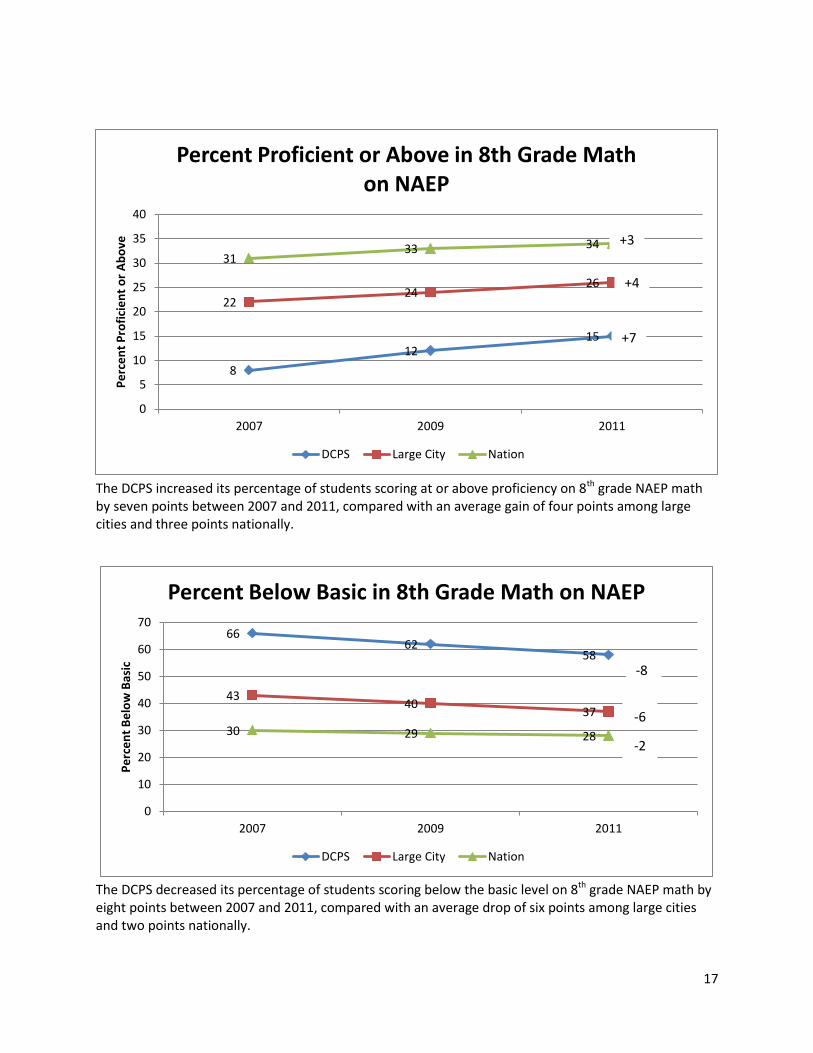
The DCPS increased its percentage of students scoring at or above proficiency on 8th grade NAEP math by seven points between 2007 and 2011, compared with an average gain of four points among large cities and three points nationally.
The DCPS decreased its percentage of students scoring below the basic level on 8th grade NAEP math by eight points between 2007 and 2011, compared with an average drop of six points among large cities and two points nationally.
8
12 15
22 24
26
31 33 34
0
5
10
15
20
25
30
35
40
2007 2009 2011
Pe
rce
nt
Pro
fici
en
t o
r A
bo
ve
Percent Proficient or Above in 8th Grade Math on NAEP
DCPS Large City Nation
66 62
58
43 40
37
30 29 28
0
10
20
30
40
50
60
70
2007 2009 2011
Pe
rce
nt
Be
low
Bas
ic
Percent Below Basic in 8th Grade Math on NAEP
DCPS Large City Nation
-8
+3
+4
+7
-6
-2