Embed Size (px)
Citation preview


I
Preface
First, I would like to dedicate this thesis to my father, who sadly passed away when I was in
the initial phase of this thesis. I know he would have been proud to see me finish this thesis
and graduating.
This thesis marks both the end of something amazing and the beginning of a new adventure.
Five years have passed and I would like to say thank you to all who has made this journey a
great experience.
First of all I would like to thank my supervisor, Ingemund Jordanger, for giving me valuable
input and keeping me on track so I managed to finish this thesis.
The subject of the thesis was suggested to me by Aker Solutions. I accepted the subject gladly
as the purpose of the thesis was appealing and interesting. I would like to thank everybody at
Aker Solutions, especially the tender and tie-in department. An extra thank you to Lars
Rimmereid who has helped me contact the right people and made sure I got the information I
needed.
To everybody who has provided me with data and input on my thesis, thank you. I would not
have been able to finish this thesis without your help.
Finally, I would like to thank my friends and family for being there for me through all the ups
and downs.
Ås, June 15, 2015
_____________________
Sanjin Rupic

II

III
Abstract
Bream and Johan Sverdrup are two oil and gas fields in the North Sea. Johan Sverdrup has
divers as the base case for tie-in operations in Phase 1, while Bream has a diver less tie-in
system as the base case. The purpose of this study is to determine the factors that are deciding
when the operators need to decide what system they want to use. Aker Solutions will benefit
with new knowledge about the diver based technology.
Through data collection from multiple contractors and oil companies, I have been able to
estimate costs and perform multiple analysis on these two fields, which I look at as case
studies. With estimated data I performed a MCDA analysis and a cost analysis to determine
the deciding factors.
All of the analysis showed the hardware cost and installation cost as the two most important
factors for both Statoil (Johan Sverdrup operator) and Premier Oil (Bream operator). Statoil
had a total cost saving of 34 MNOK by choosing a diver based tie-in solution for Johan
Sverdrup. Premier Oil had surprisingly also a total cost saving of 5,6 MNOK by choosing a
diver based tie-in solution for Bream.
Results from the MCDA analysis showed that the most important qualitative parameter is the
availability of vessels and standardized equipment for both operators.
Aker Solutions should use the information collected in this thesis to consider entering the
diver based market, as the hardware costs are low, and future field operators may consider a
diver based tie-in solution.

IV

V
Sammendrag
Bream og Johan Sverdrup er to olje- og gassfelt i Nordsjøen. Johan Sverdrup har
dykkerbaserte tie-in systemer som base case i Phase 1, mens Bream har dykkerløst tie-in
system som base case. Formålet med denne studien er å fastslå hvilke parametere er
avgjørende for om en operatør går for et dykkerbasert eller et dykkerløst tie-in system. Ved å
gjøre dette vil Aker Solutions få innsikt i hvordan det dykkerbaserte markedet er og hva
kostnadene ligger på.
Gjennom innsamling av data fra ulike kontraktører og oljeselskaper så har jeg utført flere
analyser på disse to feltene, som har fungert som to case studier. Ved å bruke estimerte data er
en MCDA analyse og en kostnadsanalyse blitt utført for å finne de avgjørende parameterne.
Gjennom analysene kom det frem at det er koblings- og installasjonskostnaden som er de
viktigste faktorene både for Statoil (operatør for Johan Sverdrup) og Premier Oil (operatør for
Bream). Statoil oppnådde en kostnadsbesparelse på 34 MNOK ved å velge dykkerbasert tie-in
system. Analysen viste at Premier Oil også oppnådde en noe overraskende kostnadsbesparelse
på 5,6 MNOK på å velge dykkerbasert tie-in system på Bream.
Resultatene fra MCDA analysen viste at de viktigste kvalitative parameterne for begge
operatørene er tilgjengeligheten av fartøy og standardisert utstyr.
Aker Solutions burde bruke informasjonen som er samlet inn gjennom denne studien og
vurdere å entre det dykkerbaserte markedet. Kostnadene er lave og fremtidige felt kan ha en
dykkerbasert tie-in løsning.

VI

VII
Table of contents
Preface ...................................................................................................................................................... I
Abstract ................................................................................................................................................. III
Sammendrag ........................................................................................................................................... V
1 Introduction ..................................................................................................................................... 1
1.1 Thesis structure ........................................................................................................................ 1
1.2 Prior knowledge ...................................................................................................................... 1
1.3 Terminology ............................................................................................................................ 2
2 Goals ................................................................................................................................................ 3
2.1 Thesis goals ............................................................................................................................. 3
2.2 Aker Solutions’ goals .............................................................................................................. 3
2.3 Sub-goals ................................................................................................................................. 3
2.4 Limitations............................................................................................................................... 4
2.5 Case studies ............................................................................................................................. 4
2.5.1 Bream .............................................................................................................................. 4
2.5.2 Johan Sverdrup ................................................................................................................ 7
3 Theory ............................................................................................................................................. 9
3.1 Tie-in technology .................................................................................................................. 10
3.2 Remote Operated Vehicle...................................................................................................... 13
3.3 Diver based technology ......................................................................................................... 15
3.4 Tie-in operations with divers ................................................................................................. 16
3.5 Tie-in operations with ROV .................................................................................................. 19
3.6 Oil and gas fields ................................................................................................................... 23
3.6.1 Bream ............................................................................................................................ 23
3.6.2 Johan Sverdrup .............................................................................................................. 24
3.7 Market ................................................................................................................................... 26
3.7.1 1990s and early 2000s ................................................................................................... 26
3.7.2 Present day and future market ....................................................................................... 27
3.8 Challenges ............................................................................................................................. 28
4 Methodology ................................................................................................................................. 29
4.1 Qualitative research ............................................................................................................... 30
4.2 Quantitative research ............................................................................................................. 33
4.3 Mixed method ........................................................................................................................ 34
4.3.1 Data management .......................................................................................................... 37
4.3.2 Data collection ............................................................................................................... 38
4.3.3 Data analysis .................................................................................................................. 41
4.3.4 Model ............................................................................................................................. 42

VIII
4.4 Present Value Evaluation ...................................................................................................... 44
4.5 Economic model .................................................................................................................... 44
5 Analysis and results ....................................................................................................................... 46
5.1 Bream .................................................................................................................................... 47
5.2 Discussion regarding Bream.................................................................................................. 54
5.3 Johan Sverdrup ...................................................................................................................... 59
5.4 Discussion regarding Johan Sverdrup ................................................................................... 64
5.5 End discussion ....................................................................................................................... 68
6 Conclusion ..................................................................................................................................... 70
7 Evaluation and future work ........................................................................................................... 72
8 References ..................................................................................................................................... 74
Appendix 1 ............................................................................................................................................ 78
Appendix 2 ............................................................................................................................................ 79
Appendix 3 ............................................................................................................................................ 80
Appendix 4 ............................................................................................................................................ 81
Appendix 5 ............................................................................................................................................ 82

IX
List of figures
Figure 2.1 Planned development of Bream ............................................................................................. 5 Figure 2.2: Diver less scope for Bream (Rimmereid 2015) .................................................................... 6 Figure 2.3: Scope for diver solution at Bream ........................................................................................ 7 Figure 3.1: HCS tie-in (Aker Solutions 2012) ....................................................................................... 11 Figure 3.2: Clamp Connector from Aker Solutions (Aker Solutions) ................................................... 12 Figure 3.3: Flange connecting spools with a standardized amount of bolts (OSTS) ............................ 13 Figure 3.4: WROV envelope and footprint(Aker Solutions 2013a) ...................................................... 15 Figure 3.5 ROV gripping arm envelope (Aker Solutions 2013b figure 13 (p. 12)) .............................. 20 Figure 3.6 ROV T4 manipulator envelope (Aker Solutions 2013b figure 14 (p.13)) ........................... 21 Figure 3.7: SCMS side .......................................................................................................................... 22 Figure 3.8: PLEM side .......................................................................................................................... 22 Figure 3.9 Bream field location (Offshore Technology) ....................................................................... 24 Figure 3.10 Johan Sverdrup - Location relative to Norway (SAFE i Statoil 2013) .............................. 25 Figure 3.11: Johan Sverdrup licenses and operators (Statoil 2013) ...................................................... 25 Figure 3.12: Crude oil history chart (Macrotrends.net 2015) ................................................................ 26 Figure 4.1: Inductive approach to the relationship between theory and research (Bryman 2012 Fig 2.2
(p. 26)) ................................................................................................................................................... 31 Figure 4.2: Mixed method research (Cohen & Crabtree 2006 p. 632 (figure 27.1)) ............................. 35 Figure 4.3: Three levels of classification .............................................................................................. 38 Figure 5.1: Bream: HCS connector cost 3 MNOK ................................................................................ 51 Figure 5.2: Bream: HCS connector cost: 2 MNOK .............................................................................. 52 Figure 5.3: Bream: HCS connector cost 4,5 MNOK ............................................................................. 53 Figure 5.4: MCDA main criteria shown as graph ................................................................................. 54 Figure 5.5: Johan Sverdrup: Graphed cost analysis of diver assisted and diver less. HCS cost: 6,5
MNOK ................................................................................................................................................... 61 Figure 5.6: Johan Sverdrup: Graphed cost analysis of diver assisted and diver less. HCS cost: 6
MNOK ................................................................................................................................................... 62 Figure 5.7: Johan Sverdrup: Graphed cost analysis of diver assisted and diver less. HCS cost: 5,5
MNOK ................................................................................................................................................... 62 Figure 5.8: Johan Sverdrup: Graphed cost analysis of diver assisted and diver less. HCS cost: 5
MNOK ................................................................................................................................................... 63 Figure 5.9: MCDA analysis of Johan Sverdrup shown as diagrams ..................................................... 64

X

XI
List of tables
Table 3.1: Excursion table for the living depth of divers(Standards Norway 2014 Table 13 (p. 43)) .. 17 Table 3.2: Depth limitations for different types of divers (Cross) ........................................................ 18 Table 5.1: Overview of Johan Sverdrup and Bream ............................................................................. 46 Table 5.2: MCDA analysis performed on the Bream case .................................................................... 48 Table 5.3: Summary of MCDA analysis of Bream field ....................................................................... 49 Table 5.4: Cost analysis of the diver based solution on Bream ............................................................. 49 Table 5.5: Cost analysis of the diver less solution on Bream ................................................................ 50 Table 5.6: Bream: Cost analysis summary ............................................................................................ 57 Table 5.7: MCDA analysis performed on Johan Sverdrup ................................................................... 59 Table 5.8: Summary of MCDA analysis of Johan Sverdrup ................................................................. 60 Table 5.9: Cost analysis of diver based solution for Johan Sverdrup .................................................... 60 Table 5.10: Cost analysis of diver less solution for Johan Sverdrup ..................................................... 61 Table 5.11: Johan Sverdrup: Cost analysis summry.............................................................................. 67 Table 5.12: Pros & cons for hardware cost ........................................................................................... 69 Table 5.13: Pros & cons for installation and operation ......................................................................... 70

1
1 Introduction
1.1 Thesis structure The structure of this thesis is designed in a way that will make the reading more comfortable
and the contents should be understandable. I will start with explaining the goals I have set and
why this thesis is being written. The case studies I have chosen to look at will be described in
2.5 and from there I will describe the theory of the subsea industry and the technology that is
being used. Chapter 4 explains the methodology used, so that the reader can recreate my
process of data collecting and analyzing. I will finish with a presentation of my findings and
discussion surrounding them before I present my conclusion and discuss the future.
1.2 Prior knowledge As a student in Industrial Economics and Technology Development with a specialization in
machine and product development, I had the technical background required to learn about the
oil and gas industry. My experience that can directly relate to this subject is my internship at
Aker Solutions in 2014. I have limited knowledge regarding divers and their work in the
subsea industry but I hope this thesis will let me learn a lot about the oil and gas industry as
well as let me contribute with an inexperienced mind, which can sometimes be useful for
companies.
My specialization in my studies includes some economics subjects, which will benefit me
when writing the economics part of this study.
To finish this thesis and to conclude with a sensible conclusion I will have to learn about a
mostly unfamiliar topic and relate this to what I already know about economics and other
subjects that may come of use.

2
1.3 Terminology
BOE Barrels of oil equivalent
CC Clamp connector
DSV Diving Support Vessel
EPC Engineering, procurement and
construction
FID Final Investment Decision
FPSO Floating Production Storage and
Offloading
ITT Invitation To Tender
ND Nominal Diameter
o.e. Oil equivalent
OCV Offshore Construction Vessel
OPEC Organization of the Petroleum
Exporting Countries
OPEX Operating expenditure – Ongoing
cost
OROV Observation Remote Operated
Vehicle
PLEM Pipeline End Module
ROV Remotely Operated Vehicle
SCMS Subsea Control Module
SPS
Subsea Production Systems - Some
SPS companies are Aker Solutions,
FMC Technologies and GE Oil and
Gas.
SURF/TURF Subsea/Umbilicals/Risers/Flowlines
WROV Work Remotely Operated Vehicle

3
2 Goals Aker Solutions does not have a study on the specific subject I am about to address. In this
section, I will explain my goals with this thesis, as well as Aker Solutions’ goals with this
thesis. Both the goal for this thesis and Aker Solutions’ strategic goal have been determined
through conversations with Aker and their opinion have been of great importance. I have
chosen two oil and gas fields as two case studies for this thesis. These are Johan Sverdrup and
Bream, and the scope will be presented in detail in 2.5.
2.1 Thesis goals Operators of oil and gas fields are the ones responsible for the decision if the base case is
diver assisted tie-in technology or diver less tie-in technology.
Determine what factors are deciding for the operator when they decide whether to go for a
diver less solution or a diver based solution.
2.2 Aker Solutions’ goals Aker Solutions have a strategic goal with this thesis. They are interested in the diver based
market, and they do not have any studies that presents the concrete difference between diver
based and diver less technology. A thesis like this is valuable for future references, and when
a new oil and gas field is discovered. Aker Solutions’ main goal for this thesis will be:
1. Learn more about the diver based market, and understand why Statoil chose a diver
based tie-in solution on Johan Sverdrup and Premier Oil a diver less solution on
Bream.
With a lower oil price, there may be a profit to focusing on working with divers, and
customizing their equipment not only for ROVs, but also for divers. This study will conclude
with a discussion whether or not Aker should look into the diver-assisted market and expand
their strategy to involve diver-assisted technology as well.
2.3 Sub-goals Throughout the work, I have developed several sub-goals that will help me conclude the main
goal, and help Aker Solutions achieve their goal. These sub-goals are:
- Analysis of most important quantitative parameters related to both diver and diver
less tie-in technology
- Analysis of most important qualitative parameters related to both diver and diver less
tie-in technology

4
- Present an overview of the technologies used in both cases
- Develop an economical model
2.4 Limitations To limit this thesis to a manageable level, certain limitations will have to set. A thesis about
ROVs (Remote Operated Vehicle) and divers in the oil and gas industry has the possibility to
be extensive, and with the time given it’s necessary to limit it to achieve a satisfied result. The
thesis itself will be limited by two things, the technology that is in the scope, and the case
studies.
Technology
The tie-in technology is the limitation this thesis will focus on. For diver less systems it is
mainly the HCS that is in the scope, and for the diver assisted systems it is the usage of
flanges. All tools that are required to operate and install this technology are within the scope.
North Sea
The thesis is limited to subsea fields in the North Sea. This limitation means that the
regulations regarding the subject is limited to the Norwegian laws and regulations. Two fields
have been selected, Bream and Johan Sverdrup. These two fields have different properties,
while both are at a depth where divers are allowed. Johan Sverdrup has diver based tie-in as a
base case, while Bream has a diver less system. Aker Solutions have done both work and
conceptual studies for both fields, so some information is obtainable. Johan Sverdrup is
especially interesting, as it is one of the largest fields discovered on the Norwegian Shelf. As
these two fields acts as the case studies of this thesis I will present them individually in 2.5.
2.5 Case studies These studies are two oil and gas fields in the North Sea as I have previously mentioned.
Bream and Johan Sverdrup are suitable fields to look into, as they have a different tie-in
solution as base case, while they are at the same depth. Below is a short presentation of both
fields and their scope.
2.5.1 Bream
Premier Oil is the operator of this field, and the decision to go for diver less tie-in is complex
and interesting. Ron Finlayson explains that Premier Oil made a pros and cons matrix on the
two solutions. The main reasons from their standings was the cost aspect of the project as well
as the availability of vessels (Finlayson 2015). Technip has stated that Premier Oil wanted a

5
lot of the equipment to be automated, and to have the opportunity to control everything
remotely (Hiemeyer 2015).
Key facts:
Depth: 94 – 124 meters (Premier Oil 2014)
Total amount of resources: 8 million Sm3 oil(BG Norge 2012; Premier Oil 2014)
Resource rate per day: 6 360 Sm3 oil per day (BG Norge 2012 p.13)
Field operator: Premier Oil
Export method: FPSO and shipping
As shown in figure 2.1, Bream’s main concept study show a subsea production system, with a
FPSO to handle the oil and gas. The FPSO has a capacity of storing 3.77 million Sm3 oil. The
FPSO has been chosen as the exporting method as the amount of existing gas within the
Figure 2.1 Planned development of Bream

6
reservoir is not high enough to handle an exporting method with the usage of pipelines to
shore. The limited gas will be used as fuel (Premier Oil 2014 p.15-17).
Premier Oil was presented two possible tie-in solutions for Bream by Aker Solutions. The
diver less solution that was presented to Premier Oil by Aker Solutions consisted of 20
connectors (including IB and OB side) (Rimmereid 2015). Figure 2.2 shows that there will be
10 rigid spools for the diverless solution. There are some limitations to when the spools can
be transported and installed. Metrology has to be done before the spools can be made. The
metrology takes about 12 hours per spool. Transporting the spools offshore requires much
planning as the best option is to minimize the usage of ROV vessels and transportation vessels
as this is costly.
Figure 2.2: Diver less scope for Bream (Rimmereid 2015)
The other case Aker Solutions presented to Premier Oil consisted of a diver based solution
with 32 connectors in total. Figure 2.3 illustrates the scope that Bream could have had if
Premier Oil decided to go for a diver based solution. 15 rigid spools are used in this case, and
metrology is needed here as well.

7
Figure 2.3: Scope for diver solution at Bream
The main pipeline for Bream is 12” and the production lines are 10”. The cost for a 14” HCS
connector is estimated by Aker Solutions to be 3 MNOK. The calculation is shown in
Appendix 5.
The Bream field has a base case with diver less tie-in systems, and the case study will show
what factors were decisive in the selection of type of tie-in system for this field.
2.5.2 Johan Sverdrup
Key facts:
Total amount of resources: 290 – 460 million Sm3 o.e. (1,8 – 2,9 billion BOE)
Resource rate per day (Phase 1): 50 000 – 60 000 Sm3 o.e. (Statoil 2015)
Resource rate at full production: 90 000 – 100 000 Sm3 o.e.(Statoil 2015)
Lifetime: 50 years
Field operator: Statoil and Lundin-Petroleum
Reservoir pressure: 195 bar
Export method: Pipeline transport to land

8
Subsea facilities
As Statoil has pointed out in their report on Johan Sverdrup, there will be three 4-slotted
templates installed subsea. All of the templates will be designed with trawl protection, as
there is a lot of fishing in the area (Statoil 2014). Additionally, the following SPS equipment
is planned to be developed for the Johan Sverdrup project:
3 manifolds
12 wells
All of the flow lines will be connected to the manifold via rigid 14” ND spools, and the 3
templates are connected to the field center riser platform via two 16” ND reeled pipelines
(Subsea 2015). A branch pipe from each header out to each single XMT will, according to Jon
Brandeggen, is a 5/6”. The production will be done topside, while water and gas injection will
be done subsea (Brandeggen 2015).
Statoil, the operator on this field, required that the 14” pipeline can handle a bending moment
that is 410 kNm, as stated in the requirement document Statoil has provided (Subsea 2015).
This is higher than the 12” HCS that Aker delivers (Brandeggen 2015). There is a discussion
if it is possible to use a 16” HCS to be within the requirement. The cost for a 16” HCS
connector is estimated by Aker Solutions to be 6,5 MNOK as shown in Appendix 5.
The entire subsea production will have a base case with the usage of divers and the equipment
will be diver compatible. Diver assisted hardware is as explained in 3.3. Engineering will be
necessary to make the existing Aker equipment possible to use for a diver subsea. Statoil has
specified that their requirements include the following:
1. Based on a diver operated bolted flange with angular misalignment capacity up to ±2º
2. It shall be possible to install bolts from both sides of the flange (Free movement of
100% of bolt length on both sides of the flanges).
(Subsea 2015)
For the future, Statoil has stated that the project should be compatible with ROVs, and that it
may be possible to do maintenance work with ROVs.

9
3 Theory The following section addresses some general information regarding the tie-in technology.
Some parts are discussed in more detail than others are as I have deemed that necessary for
the reader to understand why this thesis is written.
“Tie-in services in the oil and gas industry are done by divers and by remote operations by
using ROVs”
(Jørgensen 2015)
Aker Solutions only provide technology and products related to the use of ROVs offshore.
Most of their tie-in equipment is not designed for use with divers. As of today, Aker Solutions
has none studies regarding this subject and putting these two methods up against each other.
As Statoil has required that the large field Johan Sverdrup is to be diver operated, Aker
Solutions is almost forced into learning about diver technology. Johan Sverdrup is important
for a contractor like Aker Solutions, which is discussed in 2.5.2 and 3.6.2. To learn more
about divers and tie-in technology installed by divers Aker has expressed their interest in a
study where the diver based technology is being compared to the already existing diver less
technology. As the interest in writing a thesis about this subject is mutual, I decided to try my
best in learning about these two market and give some input back to Aker Solutions.
The subsea era started in the early 1940s and divers were a common method of getting
performing operations at the seafloor. As resources were discovered at deeper depths than the
divers could dive at that time, the ROVs were invented and replaced or assisted the divers in
their work. There were a lot of accidents regarding the use of divers back in the late 1900
which accelerated the use and technology development of the ROV (Kjølleberg & Falch-
Nilsen 2013).
Different fields have different needs regarding approaches and methods to be applied. When a
field is discovered there are several steps that has to be taken before an eventual operation can
begin. It all starts with the discovery of the field. Then the oil companies, also called energy
producers, send out an ITT (Invitation to tender) to contractors that specialize in delivering
subsea systems. An ITT is sent to different SPS contractors, and they all compete to be the
one that is trusted with the task of delivering the system to the oil company. There may be
some things the SPS company is disagreeing with the oil company on, and then a number of
reviews and negotiations start. This phase may take several months, and when the oil
company is satisfied with the option that the SPS company is willing to deliver, production

10
and engineering may begin. This phase is costly in working hours, as the engineering has not
yet begun (Mørk et al. 2015).
Different contractors that deliver different parts of the ITT may have conversations in
between and cooperate regarding some solutions, as this can benefit both parties (Subsea 7
2014). Some parts of the contract is only based on the engineering part of the SPS, while other
parts may be on the installation and the decommissioning on the SPS.
3.1 Tie-in technology
Subsea technology has been around for quite some time. In the early 90s, the realization that
production was possible from the seabed was a valid and realistic opinion shared by the whole
oil and gas industry. New technology is always expensive at first in general. This was also the
case with subsea technology. Later in the 1990s, Statoil tested Norwegian subsea technology
off the coast of Western Africa, which spiked the interest of other large international
companies. This drove the technology forward, both in improved well recovery rate, cost
effectiveness in both operating and manufacturing the technology and the technology evolved
slowly into the subsea technology we know today. The hardware cost has had a bit slower
progress than the actual operation cost. Hardware cost increase rate can be set to 3% annually.
The real cost that has been made more efficient is the cost of performing the operation, the
installation cost (Undrum 2015).
Tie-in connection systems are the building blocks of the subsea industry. Tie-in products
include the following (Aker Solutions 2014b):
Various connection systems
o HCS
o VCS
o RTS
o GHO
Connectors
Tools
Jumpers/spools

11
Figure 3.1: HCS tie-in (Aker Solutions 2012)
Tie-in technology is a vital part of the subsea field development. All of the different
connection systems have the same goal in mind, to connect various subsea parts so that the
flow is successful. As FMC Technologies states it:
“Each tie-in and connection point requires some form of subsea base structure. This base
may be on a single well structure, a template, a manifold, or other individual structure such
as a Riser Base, a Pipeline End Manifold (PLEM), a Pipeline End Termination (PLET) or an
In-line Tee. “
(FMC Technologies p. 6)
This thesis will focus on the usage of the HCS system and its connectors and the tools that are
required to do a tie-in operation. A HCS system is compatible with bore sizes from 3” and up
to 28” as well as multibore, which is a more advanced connection. Connectors that are based
on the usage of ROVs are very advanced in both mechanics and physics. Aker Solutions has
developed their own Clamp Connector, which is a known product in the oil and gas industry.
The CC is designed in a way that once it is installed it can be left subsea as it has a long
lifetime. The sealing inside the connector is one of the key components of the CC. The TX
seal inside creates a metal-to-metal sealing which is sometimes considered as necessary in the
subsea industry. The installation of a HCS is done by a ROV. As there are no bolts, no
rotational guiding is required and ROVs are capable of installing this with the usage of tools

12
(Aker Solutions 2014b). One HCS tie-in termination can take some time, everything between
6 hours to 24 hours is possible. The CC that the ROV is responsible for installing is illustrated
in figure 3.2.
Figure 3.2: Clamp Connector from Aker Solutions
(Aker Solutions)
Diver based connection systems are less advanced than the CC. Divers operate with common
flanges, they are only specialized for using subsea. The flange is a known utility that is widely
used in many industries, not only the oil and gas industry. A flange is often manufactured
according to a standard that is applicable in the country it is made or will be used. ASME,
DIN, BS and ISO are such standards that specify what materials are to be used, what pressure
it has to be designed for and other criteria (Nayar 2000 Ch. 1).
It is just as important to have the diver in mind when designing the flange, as it’s important to
make the flange easy to operate. As showed in figure 3.3 the flange is bolted with a
standardized amount of bolts. A sealing ring inside the flanges will work as the main sealing
between the hubs (Freudenberg Oil & Gas Technologies). A ROV cannot operate such a
flange, as the ROV has limitations regarding movement and operations, see 3.2 for more on
this subject.

13
Figure 3.3: Flange connecting spools with a standardized amount of bolts (OSTS)
3.2 Remote Operated Vehicle
A ROV is a Remote Operated Vehicle that is widely used in the oil and gas industry. A ROV
allows oil and gas companies to execute operations that might be too dangerous for a person.
This may benefit the company in economic ways or have some other advantages for the
company. In the 1950s the first ROV was used to perform tasks deep out in the sea, where it
was dangerous and tough conditions for humans (ROV Committee of the Marine Technology
Society). The offshore oil and gas companies became interested and in the 1970s, the work-
class ROV was created. Throughout the1980s, the technology progressed fast. New offshore
development became too deep for divers and the ROVs became the new standard in deeper
waters. Soon the ROV was a necessary tool for the oil and gas industry. Since then ROVs are
very important to the oil and gas industry, as they have the potential to work at both shallow
and deep waters.
To perform a diver less operation the company has to have a ROV vessel at its disposal. The
ROV is connected to its vessel with an umbilical that provides hydraulics, power and
communication. There is a crew on the vessel that controls the ROVs movements and actions.
The total amount of crew is usually around 2-3 persons that work at usually quite some long
shifts (Hiemeyer 2015). Various ROV sizes exist, for different uses. Different vessels are used
for different operations and they have a different cost as well.
14
A ROV has limited capabilities. A WROV (Work-ROV) is required for installation operations
and operations that require the ROV to perform actions and interact with structures and tools.
An OROV (Observation-ROV) can be used when there is only need for visual inspection or to
assist divers when they are in the water. They may also be able to carry some weight (iTech 7
2015). The WROV has to utilize extra tools that will help it to perform different tasks subsea,
as its own arms lack the flexibility of a human arm.
The ROV has the following available tools at its disposal:
Torque tool: Example of usage is opening and closing a CC.
Stroke tool: Common tool used to stroke the OB (outboard) hub to the IB (inboard)
hub.
Seal cleaning and replacement tool
Some of the tools are too large for the ROV to carry itself, resulting in the tool being lowered
independently by a crane. This operation requires the use of a lifting crane and the operation
lasts longer (Aker Solutions 2014b). Lack of flexibility makes the WROV being unable to
perform operations that is usually done by divers. Some examples are welding subsea,
tightening bolts and doing tasks that require flexibility (PSE Global Recruitment).
A standard Aker WROV has a footprint of 2500mm x 1900mm x 1900mm, which is the
actual size of the ROV. For performing operations and have the ability to maneuver around,
the ROV has a certain space around itself where there are no obstructions. This space is
described as the ROV’s envelope and is 500mm on each side, 500mm above and below and
1000mm behind the ROV (Aker Solutions 2013b). This envelope is the same as the
NORSOK standard; 3500mm x 2900mm x 2900mm (LxWxH) (Standards Norway 1998).
Figure 3.4 is showing that the necessary space for the ROV is quite large, and the ROV itself
cannot operate in every tight spot.Error! Reference source not found.

15
Figure 3.4: WROV envelope and footprint(Aker Solutions 2013a)
The Aker OROV is smaller and requires less space than the WROV. Its footprint is 1500mm
x 1000mm x 1000mm. The clearance to the nearest structure must be minimum 250mm on
each side, 250mm above and below and 500mm behind the ROV. The envelope is then
2500mm x 1500mm 1500mm (Aker Solutions 2013b).
3.3 Diver based technology
Diver based technology has not evolved that much since the first divers that went offshore
diving. To perform a diver based operation a DSV is needed. DSV is a diving support vessel

16
that has a large crew consisting of support personnel as well as divers (Subsea 7 & Aker
Solutions 2015). Different vessels in various sizes exist, depending on the operation needed.
The vessel is equipped with all the necessary hardware for the operation to be successful. The
components used in a diver based tie-in operation can be:
API or SPO Flanges with corresponding gaskets/seal rings
Bolts
Taper-Lok flanges
Johan Sverdrup is a field that will maybe have the Taper-Lok flange on some of the structures
(Subsea 7 & Aker Solutions 2015). This flange is comprised of a male and female flange, as
well as a seal ring and a complete set of studs and nuts as explained by AF Global
Corporation (AF Global Corp). The misalignment that is allowed with this type of flange can
be 10 to 20 degrees. The installation is somewhat easier as well, since there is less need for
initial guiding. On the other hand, there is need for a rotational guiding as the holes on each
flange has to be aligned for the diver to connect them.
The following tools are used by divers when they perform their tasks subsea:
Jack tackles/flange pullers
Lifting frames
Clump weights
Hydraulic tensioning equipment (bolt jacks)
Buoyancy elements
Oxy-arc cutting tools
The divers have a lot of tools and possibilities to interact with structures subsea. With the
right tools, divers are capable of interacting with structures and connectors that are designed
for ROV interaction. This requires the diver to be equipped with the right ROV tools. This is
one major upside with divers, they are very flexible and can interact with much more
equipment than the ROV (Mørk et al. 2015).
3.4 Tie-in operations with divers
A tie-in operation with divers is time-consuming and has a large scope. Several incidents in
the 1970s and 1980s has made the regulations for divers very strict. Divers were used widely
in the North Sea as this was the only way to operate subsea. As the late-effects of diving at
great depths were not well known at the time, many of the divers experienced several health
17
problems later in life (Kjølleberg & Falch-Nilsen 2013). Later on the regulation became
stricter and it became safer for divers to dive deeper.
The HSE issue is very important when doing operations with divers. The divers and the
contractors that employ them must follow several procedures to be allowed to perform a
diving operation. The physical work environment regulations for divers in the North Sea is as
stated in 5.2.2.1 in NORSOK Standard U-100:
“The physical environment for divers in water, chambers, bells, LDC and/or habitats, shall be
subject to particular and close monitoring, with control of all parameters relevant to the
safety and health of the diver. Methods to achieve optimum conditions shall be implemented
by the contractor by actively seeking and evaluating new knowledge.”
(Standards Norway 2014)
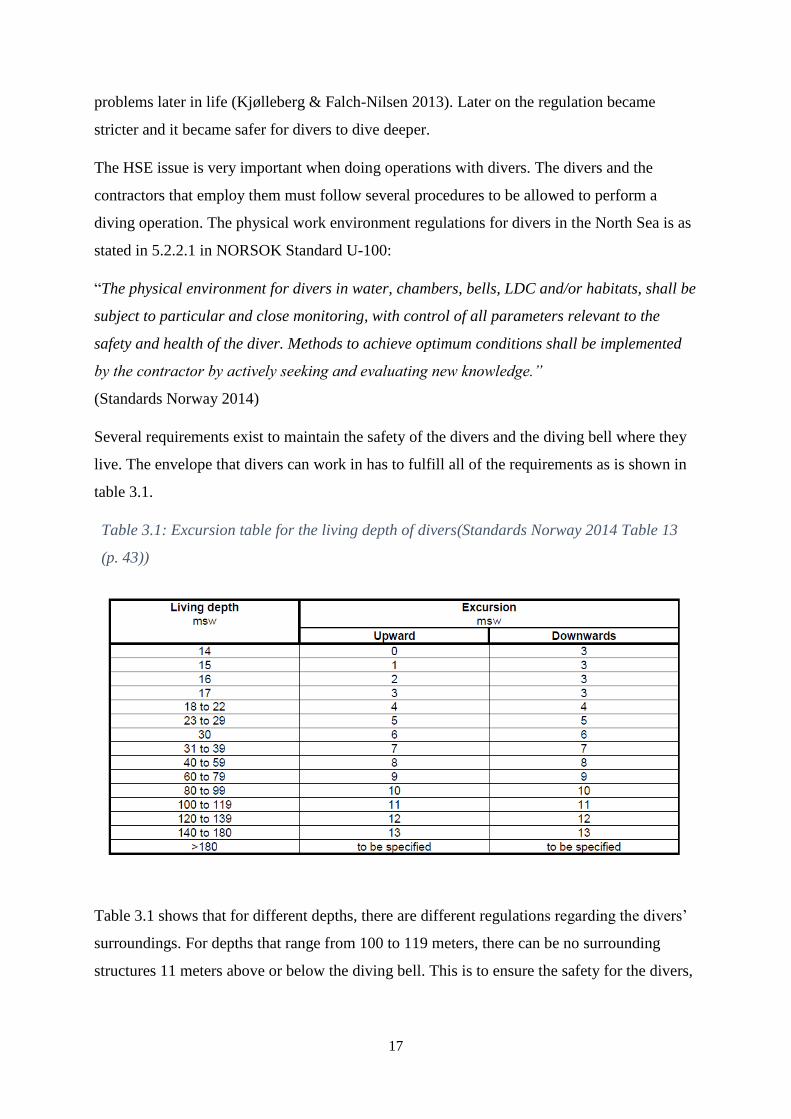
Several requirements exist to maintain the safety of the divers and the diving bell where they
live. The envelope that divers can work in has to fulfill all of the requirements as is shown in
table 3.1.
Table 3.1: Excursion table for the living depth of divers(Standards Norway 2014 Table 13
(p. 43))
Table 3.1 shows that for different depths, there are different regulations regarding the divers’
surroundings. For depths that range from 100 to 119 meters, there can be no surrounding
structures 11 meters above or below the diving bell. This is to ensure the safety for the divers,
18
and that no obstacles can obstruct the entrance to the bell, some distance is needed for clump
weight and heave allowance (Subsea 7 & Aker Solutions 2015).
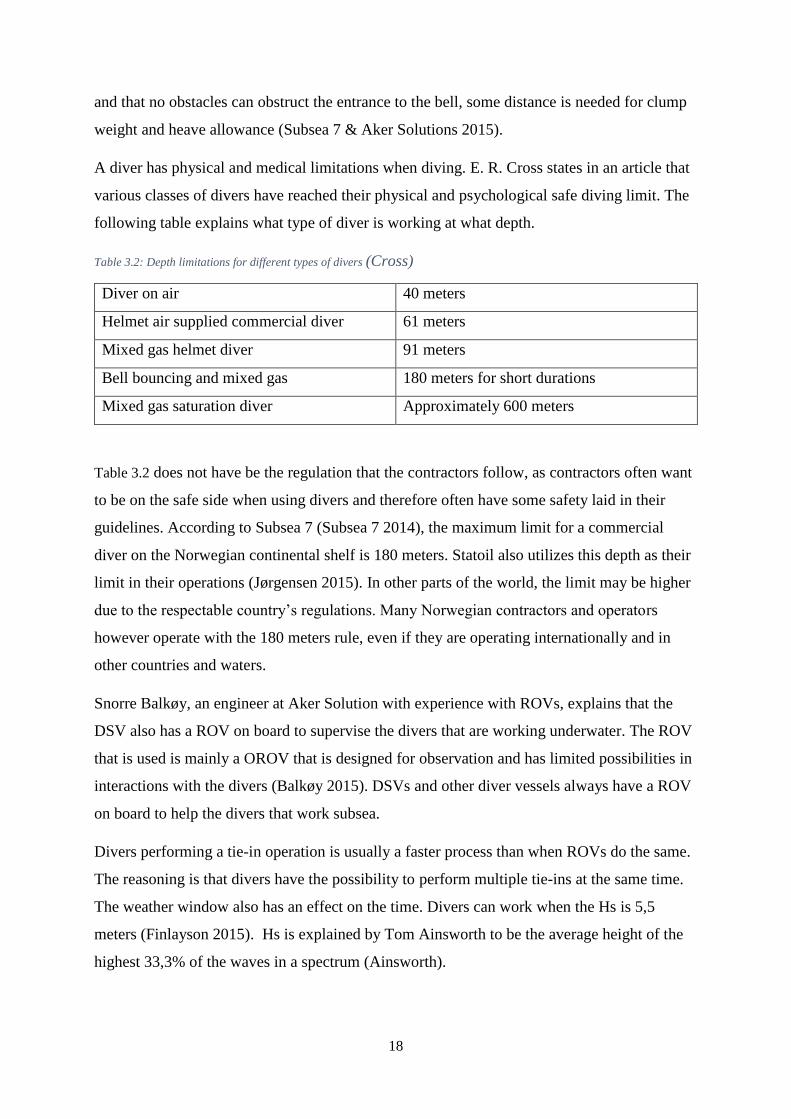
A diver has physical and medical limitations when diving. E. R. Cross states in an article that
various classes of divers have reached their physical and psychological safe diving limit. The
following table explains what type of diver is working at what depth.
Table 3.2: Depth limitations for different types of divers (Cross)
Diver on air 40 meters
Helmet air supplied commercial diver 61 meters
Mixed gas helmet diver 91 meters
Bell bouncing and mixed gas 180 meters for short durations
Mixed gas saturation diver Approximately 600 meters
Table 3.2 does not have be the regulation that the contractors follow, as contractors often want
to be on the safe side when using divers and therefore often have some safety laid in their
guidelines. According to Subsea 7 (Subsea 7 2014), the maximum limit for a commercial
diver on the Norwegian continental shelf is 180 meters. Statoil also utilizes this depth as their
limit in their operations (Jørgensen 2015). In other parts of the world, the limit may be higher
due to the respectable country’s regulations. Many Norwegian contractors and operators
however operate with the 180 meters rule, even if they are operating internationally and in
other countries and waters.
Snorre Balkøy, an engineer at Aker Solution with experience with ROVs, explains that the
DSV also has a ROV on board to supervise the divers that are working underwater. The ROV
that is used is mainly a OROV that is designed for observation and has limited possibilities in
interactions with the divers (Balkøy 2015). DSVs and other diver vessels always have a ROV
on board to help the divers that work subsea.
Divers performing a tie-in operation is usually a faster process than when ROVs do the same.
The reasoning is that divers have the possibility to perform multiple tie-ins at the same time.
The weather window also has an effect on the time. Divers can work when the Hs is 5,5
meters (Finlayson 2015). Hs is explained by Tom Ainsworth to be the average height of the
highest 33,3% of the waves in a spectrum (Ainsworth).

19
The size of the pipeline does not affect the time usage in installation (Andresen 2015), only
what type of tie-in installation it is. One tie-in of a spool takes approximately 12 hours, and
since there is a connector on both ends, the tie-in takes 24 hours to completely tie-in the spool.
3.5 Tie-in operations with ROV
Tie-in operations done with ROV differ quite a lot from operations done with divers. An ROV
does not have the maneuverability and the swiftness of divers. ROV Committee of the Marine
Technology Society (ROV Committee of the Marine Technology Society) explains in detail
how a ROV is connected to its vessel. From the vessel, there is an umbilical that supplies the
ROV with hydraulics and electrical signals while at the same time feeds the vessel and ROV
operator with data and video signals. The umbilical is the “life source” of the ROV.
Additional strength reinforcement allows the ROV to carry and recover heavy tools and
equipment.
The actual operation is performed by a crew consisting of 2-3 ROV operators and additional
crew on the vessel performing different tasks related to the operation (Balkøy 2015). All
equipment that the ROV has to interfere with needs to satisfy the necessary space envelope
for the ROV. When operating in the envelope the ROV uses one arm to stabilize itself while it
performs different tasks and operate different tools with the other. This requires structures to
have handle bars at all places where the ROV is supposed to operate. The handle bars have to
be within the requirements of the ROVs manipulator arms, which have an envelope of their
own as shown in figure 3.5 and figure 3.6 (Aker Solutions 2013b).

20
Figure 3.5 ROV gripping arm envelope (Aker Solutions 2013b figure 13 (p. 12))
The manipulator arm that the ROV uses to do actions is called the T4 arm. This arm has an
envelope that is shown in figure 3.6. The ROV also needs some space where there are no
structures, see left side on figure 3.6. This space is required for the ROV to have the
possibility to rotate. This distance of 600 mm may even have to be increased if the necessary
operation requires the ROV to have an angle (Aker Solutions 2013b Ch. 5.4.).

21
Figure 3.6 ROV T4 manipulator envelope (Aker Solutions 2013b figure 14 (p.13))
A single tie-in operation performed by a ROV and its crew can take up to several days,
depending if everything goes according to the plan, or if challenges arise while working. The
ROV is submerged only when all the equipment is already in place. Lowering a flow line can
take up to 24 hours, while a spool can be lowered in a shorter time. Typical time distribution
for the specific 12” HCS installation is shown in figure 3.7 for the SCMS side and figure 3.8
for the PLEM side (Rasmussen 2014).

22
Figure 3.7: SCMS side
The PLEM is the Pipeline End Module and is at the one end of the flow line or spool. A
SCMS is a Subsea Control Module and is the other part that is connected to the same flow
line or spool.
Figure 3.8: PLEM side
By adding up the hours shown in figure 3.7 and figure 3.8 the tie-in will take 15,9 hours. The
ROV maintenance is added in the hours, as hours not used in the tie-in process is still time
7,6
1,9
Spool Y-105-SC [hrs]SCMS side
Time HCS tie-in
wow
ROV maintenance etc
Crane/ROV flying
6,4
Spool Y-105-SC [hrs]PLEM side
Time HCS tie-in
wow
ROV maintenance etc
Crane/ROV flying

23
spent overall. Technip has stated that an average time that can be used in calculations of a
spool tie-in is 24 hours (Andresen 2015). This is 12 hours spent on each end, and is not that
far off the time that Aker has experienced in their earlier projects, as is showed in the above
stated figures. The installation time will however differ when the HCS size changes. Tie-in on
larger connectors than 12” takes longer time (Rasmussen 2014).
3.6 Oil and gas fields
Oil and/or gas fields are large fields in the ocean that present the location and the spread of
the field. A field is usually a larger site, with many resource wells below the ground. Both
onshore and offshore wells exist. A field can be several hundred km2 large, and stretch for
hundreds of km in one direction. The depth of the field varies with the geology of the field.
In the following two chapters I will shortly elaborate on the presented two fields in the North
Sea, Bream and Johan Sverdrup.
3.6.1 Bream
The Bream field was discovered in 1972 by Phillips Petroleum Company, but later abandoned
because of negative test results. A while later, in 2009, BG Norway appraised the field further
and estimated the recoverable volumes to be between 39 – 63 million barrels of oil (Offshore
Technology). The location of the field is about 110 km southwest from Stavanger, Norway, in
the Licence PL407, as shown in figure 3.9.

24
Figure 3.9 Bream field location (Offshore Technology)
Premier Oil has planned a development for the Bream field with production start in 2018 with
a lifetime of 6 years (Premier Oil 2014). This estimated lifetime varies with the oil price and
may even be up to 12 years (BG Norge 2012).
Aker Solutions have insight in the planned technology that is supposed to be used subsea, and
the template that will be lowered subsea is a 6-slotted one. Premier Oil explains in their
papers that the field will have six 1200 m long horizontal wells, which four of them will be
producing wells, and two will be injection wells (Premier Oil 2014 p. 12-13).
3.6.2 Johan Sverdrup
Johan Sverdrup, in contrast to Bream, is a much larger and more known oil and gas field. This
field was discovered by Lundin-Petroleum in the aftermath of discovering the Edvarg Grieg
field in 2007. The discovery of Sverdrup happened in 2010 on the license PL501. As Lundin
– Petroleum (Lundin-Petroleum) states it, this field is one of the largest discoveries on the
Norwegian shelf. The location is 140 km offshore west of the coast of Norway, and a water
depth of 110-120 meters (Lundin-Petroleum).

25
Figure 3.10 Johan Sverdrup - Location relative to Norway (SAFE i
Statoil 2013)
The field is spread across several licenses. License PL265 and PL502 are operated by Statoil,
while PL501 is operated by Lundin-Petroleum. Figure 3.11 shows which operator has control
over which part of the field.
Figure 3.11: Johan Sverdrup licenses and operators (Statoil 2013)
Lundin
Petroleum

26
3.7 Market
3.7.1 1990s and early 2000s
The oil is one of the world most important commodities as oil is used in most of the vehicles
we have in the world we live in, as well as it has the possibility to act as an energy source in
other areas and industries. The price has had both upswings and downswings throughout the
history, and there are many different factors that affect the price of oil. Oil companies interest
in developing newly discovered fields are controlled by if the investment will be profitable.
For an investment to be profitable the demand and the selling price has to be satisfying
enough to begin development. Several incidents have affected the oil price as its chart is
shown in Figure 3.12: Crude oil history chart (Macrotrends.net 2015)figure 3.12. Various
incidents, such as the economic crisis in Asia in 1997 and 1998 led to a downfall and slump in
the oil price (WTRG Economics). The oil price was at this point at a record low 16 $ per
barrel as is seen in figure 3.12. The common cause for the price to go in a downward spiral is
simply more oil produced than demanded in the global market. This is the model of supply
and demand at its best.
Figure 3.12: Crude oil history chart (Macrotrends.net 2015)

27
After the economic crisis in Asia the oil price steadily rose until hitting a slump late 2008.
This was caused by an increase in petroleum inventories, which is a major factor in deciding
the price. The demand was way lower, and an economic crisis in USA contributing to
lowering the price. All these small shocks create a great effect together, and affect the price of
oil significantly (Smith 2009).
The oil price has an effect in the development of new technology. Companies and contractors
seek to hold their costs low by developing new ways to extract oil and gas, while at the same
time increasing the recovery rate of oil extracted from reservoirs (Mørk et al. 2015). As the
need to operate at deeper and deeper places, the subsea industry became more popular and
useful. The subsea market within the oil and gas industry is divided between SPS contractors,
installation companies and the field operators. Both diver less and diver based operations are
important aspects for a company, as they have different qualifications and working methods.
Figure 3.12 shows that the oil industry has been going mainly good from 2000 and forward.
This has led to several contractors wanting to enter this market. Companies realized that the
subsea industry is growing and will become important for the future, and they want to be a
part of this. Subsea 7 and Technip have always been the only two companies that provide
diving services. Other smaller contractors have also wanted to provide diving services, but
Subsea 7 states that there is not much room in the market for additional service companies to
provide this kind of services. Smaller contractors that deliver standalone services exist, but
these are not nearly as large or has the same reputation as Subsea 7 and Technip when it
comes to larger contracts and projects (Clausen 2015).
3.7.2 Present day and future market
As of today, the oil price is yet again in a slump, even almost hitting the level of the crisis in
the late 2008. This sudden drop in price has shocked the market in a way that makes it very
uncertain both for contractors and for oil companies. There is a fear of investing in new fields
and taking great risks, and oil companies demand safer options. This oil price is what makes
Johan Sverdrup a very important field for many contractors. Johan Sverdrup is not only large
in reservoir size, but also great for using the field as exposure for contractors that are
involved. To be involved in this major project is a sought after possibility.
The lower oil price affects the oil companies in a way that they will make less profit than
originally planned. Operators seek the option with the lowest cost, and this increases the
competition between the competitive contractors. With an investment cost of approximately

28
117 BNOK in the first phase, Statoil will have a total revenue of 1350 BNOK over the
lifetime of the field (Offshore.no 2015). By just looking at these numbers, one can understand
the importance of this field for Norway and the future welfare in the country. Contractors
wants to win contracts regarding this field so that they can handle the oil crisis as best as
possible.
The oil and gas industry is as any other industry, based on cost and revenue. The market is
tough, and contractors rely on their specialized technology and reputation within the market to
win contracts with the oil companies. There are 4-5 international contractors that deliver tie-in
technology, and Therese Mørk points out that every major contractor needs to have a cost
effective technology while at the same time deliver top notch technology and service (Mørk et
al. 2015). Operators of different fields, especially Johan Sverdrup and Bream are interested in
solutions that benefit them and their plan for the actual field.
3.8 Challenges
With the price of oil being the apparent parameter that has the greatest impact on the oil and
gas industry, it may be hard to be a contractor when the oil and gas industry experiences hard
and challenging times. SPS contractors rely heavily on the demand for their technology, and if
oil companies do not invest in new fields, the whole market halts. SPS contractors will have
fewer projects in play, which forces them to reduce number of employees and improve their
cost effectiveness. In these times when it is crucial to have the technology that is sought after,
there is a great risk of specializing into only one subsea technology. Aker Solutions deliver
diver less systems and standalone products for the subsea business. By excluding the usage of
divers Aker Solutions has a vast amount of knowledge on diver less technology, but close to
none on the diver based technology. This becomes a challenge when an oil company decides
to have divers as a base case on a new and up and coming field.
This is why this thesis will be interesting, as Aker Solutions wants to keep the pace with the
market and all the competitors.

29
4 Methodology The intention of this section is to present the methodology used in solving this thesis.
Methodology can be used in various ways to find answers to the underlying questions or
problems. This chapter will describe the methodology that has been used in this thesis.
As Kothari mentions it in “Research Methodology, Methods & Techniques”, the term
research refers to the systematic method consisting of defining a problem, the collecting of
data, analyzing facts, and reaching certain conclusions towards the problem at task (Kothari
2011). Furthermore he states that the purpose of a research is to apply scientific procedures to
the data that is collected and discover the answers to the given questions. Kothari puts
research studies into four different broad groupings that define the purpose of the study. This
thesis corresponds to what Kothari says: “To gain familiarity with a phenomenon or to
achieve new insights into it (studies with this object in view are termed as exploratory or
formulative research studies)” (Kothari 2011 p.2). The thesis is meant to be an informative
study to give Aker Solution insight in the market that relies on divers subsea, which
corresponds to Kothari’s definition of a underlying purpose.
The sole objective of a research can be a descriptive study including surveys and enquiries of
different kinds. This is known as the term Ex post facto research, Latin for “after the fact”.
Burton explains that ex post facto research is mostly used in matters associated with the law
(Burton 2007). This kind of research limits the scientist to study variables he or she has no
control over and cannot affect. This thesis is an analytical research which is the opposite of a
descriptive research. Kothari explains in page 3 that in an analytical research the researcher
uses the facts and information and analyzes these to make a critical evaluation of the material.
(Kothari 2011 p.3). The methodology in this thesis is based on information and data
collecting, and analyzing the collected data. The challenge and danger in doing this kind of
research studies is the quality of the data. Sources have to be reliable, and the data has to be
correct, or else the conclusion will be inconclusive and not give a trustworthy result.
Data analysis is the critical stage in every research study, and the data management is just as
important. The data management will be discussed in 4.3.1 and I will point out whether there
are any obvious flaws to the raw data, equivalent to what Bryman does regarding a research
done on senior management retirees (Bryman 2012 p.13). Furthermore, it is important to
distinguish between an analysis based on raw primary data and analysis based on secondary
data. Primary data is explained by Bryman to be data that the researcher is responsible for

30
both the collection of data and the analysis of the data collected (Bryman 2012 p.13). Both
Kothari and Bryman agrees that the raw data has to be original and collected for the first time.
The primary data may be collected through various methods, thereof interviews, in-depth
conversations, surveys among other methods (Bryman 2012; Kothari 2011). Secondary data
analysis is an analysis on someone else’s primary data, which means the data has been
processed and is therefore probably more reliable. Secondary data can be said to be a
“compilation” of already existing data, as the collection method is quite different from
primary data. The collection of the secondary data is a faster process than collecting primary
data. Interviews and surveys are swapped out for existing reports, journals, books and
governing documents. Every document that is either published or unpublished is often
secondary data as someone else has collected the data and analyzed it. The major difference
between these two data types is that secondary data already exist and is already analyzed in
some context. One must be careful when using secondary data in an analysis, as the data
probably has been collected with a different primary goal. When using secondary data Kothari
states that one must check that the data has the following characteristics (Kothari 2011 p.
111):
1. Reliability of data
2. Suitability of data
3. Adequacy of data
If the researcher is not sure if the data is trustworthy and does not suit the research problem,
the data should not be used.
There are many different ways of collecting data for a thesis, including this thesis regarding
subsea industry. Qualitative and quantitative methods are well known methods to obtain data
that has to be analyzed. They differ in the way of collecting the data and the type of data. In
4.1 and 4.2 I will shortly describe these two methods, and how I have incorporated them into
my thesis.
4.1 Qualitative research
Qualitative research is used when the researches aims on investigating human behavior, their
opinions and to discover underlying motives of human behavior. Several methods to obtain
the qualitative data exist. Specified methods that are used are deep interviews and
conversations as mentioned in Research Methodology (Kothari 2011 p.5).

31
Qualitative research is the method that uses words and human interaction, instead of hardcore
facts and numbers. This is the major difference from the quantitative research. The linking
between theory and data in qualitative research is typically associated with an inductive
approach. The inductive approach starts with observing and collecting data and developing a
theory afterwards. Usually when doing an inductive approach, the researches wants to
validate that the theory is truly reliable and usable for the specified study. This is called an
iterative strategy, and revolves with going back and forth between the data collecting and the
theory creating. This will ensure that the theory holds, by having a proper grounded theory.
By using this iterative strategy, the approach contains a deductive element as well, as the
going back and forth will mean that there is a basis theory and research question that is
defined before observing and collecting data (Bryman 2012 p.24-27).
A more defined approach can be explained in the following 6 steps:
1. General research question(s)
2. Selection of relevant site(s) and subjects
3. Collection of relevant data
4. Interpretation of data
5. Conceptual and theoretical work
6. Writing up findings/conclusions
(Bryman 2012 p.384-387 (Figure 17.1))
Figure 4.1: Inductive approach to the
relationship between theory and research
(Bryman 2012 Fig 2.2 (p. 26))
Observations/Findings
Theory

32
These steps are pretty straightforward, and there are not many other ways to interpret them.
The deductive element is the starting phase, as general research question(s) are defined before
the collection of data. After the collection and interpretation of the data the researcher does
the theoretical work, as is an inductive approach to the study, and also an iterative strategy if
done multiple times.
There are multiple ways to collect qualitative data, but most methods are some kind of social
interaction. Some methods are deep interviews, socializing with people and attending relevant
meetings. These methods to collect data is specifically suited when observing social
interactions and collecting data on how people act when they are being asked questions on the
research subject (Bryman 2012 part 3). The Robert Wood Johnson Foundation (through
various sources) discuss five existing types of interviews:
1. Structured interviews
2. Semi-structured interviews
3. Unstructured interviews
4. Informal interviews
5. Focus groups
(Cohen & Crabtree 2006)
The first three interviews types are the fundamental types, and the difference lies in both
preparation and the desired outcome of these interviews. Structured interviews are quick and
short questionnaires, well prepared and there is little or no deviation from the questions. The
topic is often well known and the interview subject should be able to answer all the questions
with already prepared responses. This limits the interviewer to gather any additional
information that the interview subject may have. The opposite is the unstructured interview,
which can be seen as an unprepared interview that may be very time-consuming. There is no
questionnaire in these types of interviews, and the interviewer is guiding the discussion
forward. As the interviewer has a plan in mind, he has to guide the discussion where he wants,
and try to stay on the topic. This type is most often used the researches does not fully
comprehend the topic, and needs more information to be satisfied with his understanding. As
these interviews may take a long time there may be need for the usage of a recorder so that
every aspect of the interview will be analyzed. The semi-structured interview is somewhere in
between the structured and unstructured interview. Characteristics for these interviews is that
the interviewer has developed an interview guide, which will feature the topics that has to be
discussed. One can stray away from the topics in the interview guide, but it is important to get
33
back on track, so that the discussion remains factual and the data and result from the interview
is valid. The semi-structured interview is a common way of utilizing interviews in studies, as
it allows the subject to talk freely, yet remain on the topic. Data collected from these
interviews may not have been collected if used a different type. Cohen & Crabtree states that
informal interviews are social meetings and talks done “on the fly”, as these are short
interviews that have no guide of any kind. These interviews are good to use when the
researcher is involved in field work, or the opportunity to attend a social setting just came up,
and the possible outcome is too great to miss. The last method of data collection is focus
groups, which revolves around using the semi-structured interview method in a group. How
the interview is done can be customized to suit the research topic, but it is important to stick
to an interview guide, and lead the group into the right discussions (Cohen & Crabtree 2006).
4.2 Quantitative research
A quantitative research is quite different from a qualitative research, both in terms of
approach, the data collected and the resulting analysis. A broad generalization of the term
quantitative research is that the majority of the data is numerical or in some similar format.
This generalization is not accurate, as Bryman explains that quantitative research does not
only have to mean the study contains numerical data (Bryman 2012 p. 161). The quantitative
research is known to have a deductive approach, which is the opposite of an inductive
approach. The researcher starts with defining the theory, and collects and analyzes data
afterwards, with an iterative process if needed. The theory is usually only loose defined to
correlate with the data that is later collected. There are 11 steps in Bryman’s process of
quantitative research.
1. Theory
2. Hypothesis
3. Research design
4. Devise measures of concepts
5. Select research site(s)
6. Select research subjects/respondents
7. Administer research instruments/collect data
8. Process data
9. Analyze data
10. Findings/conclusions

34
11. Write up findings/conclusions
(Bryman 2012 p. 161 (Figure 7.1))
Many of these steps are self-explanatory, but Bryman insists that several steps are elaborated.
However, step 2 is rarely used in quantitative research, as the theory and its problem is the
core in the study. Step 4 is mostly used in science studies that require the researcher to explain
different operations regarding an experiment. An example is explaining how the temperature
is measured in an experiment regarding heat dynamics. Step 7 – 9 are customized for each
study, as the researcher has to customize these steps to better suit the research that is being
done. Step 7 is approached differently when doing an experimental research, as opposed when
doing a social study. When using a MCDA method, as I will elaborate in 4.3 and 4.3.4, the
researcher has to code the data in step 8, and assign scores to the data that is collected. How
the data is analyzed also depends on the model that is chosen, whether it’s a simple
comparison between different tables, or if the model used is advanced economically (Bryman
2012 p. 160-165). Last couple of steps are writing up the findings and conclusions that ends
the study. The conclusion will answer the hypothesis and let us know if it is supported or not.
It is important that the writings are presented in a convincing way so that thesis is solid and
will have a validity to the potential readers.
Advantages with using a quantitative method is that the researches will have possibility to
show exactly how things are the way they are in a quantified matter. The criticism is however
that there is no qualitative data involved, which may affect the findings in a bad way. The data
will not contain any personal opinions, or take into account that the data may have been
affected by some other factors that are not measureable, like politics, personal opinions or
other social factors.
4.3 Mixed method
When a project requires both qualitative and quantitative research and data, a so-called mixed
method is preferred. The mixed method utilizes both the qualitative and the quantitative
methods of collecting and analyzing data. This has the advantage of utilizing advantages that
the qualitative method has as well as the quantitative. Mixed method research requires that the
researcher makes certain choices that will set the method on a determined course. These
choices are made on the basis of what the research question and topic is, and what the goals of
the study is. As the scope of this thesis requires me to study both qualitative and quantitative
data, a mixed method was the best suited method to use. The goals and limitations I have set
35
in chapter 3 shows that this thesis will focus on two fields in the North Sea. These two fields
are thought on as two independent case studies, which will allow me to study them both
individually and then see if there were any factors that stand out as the most important.
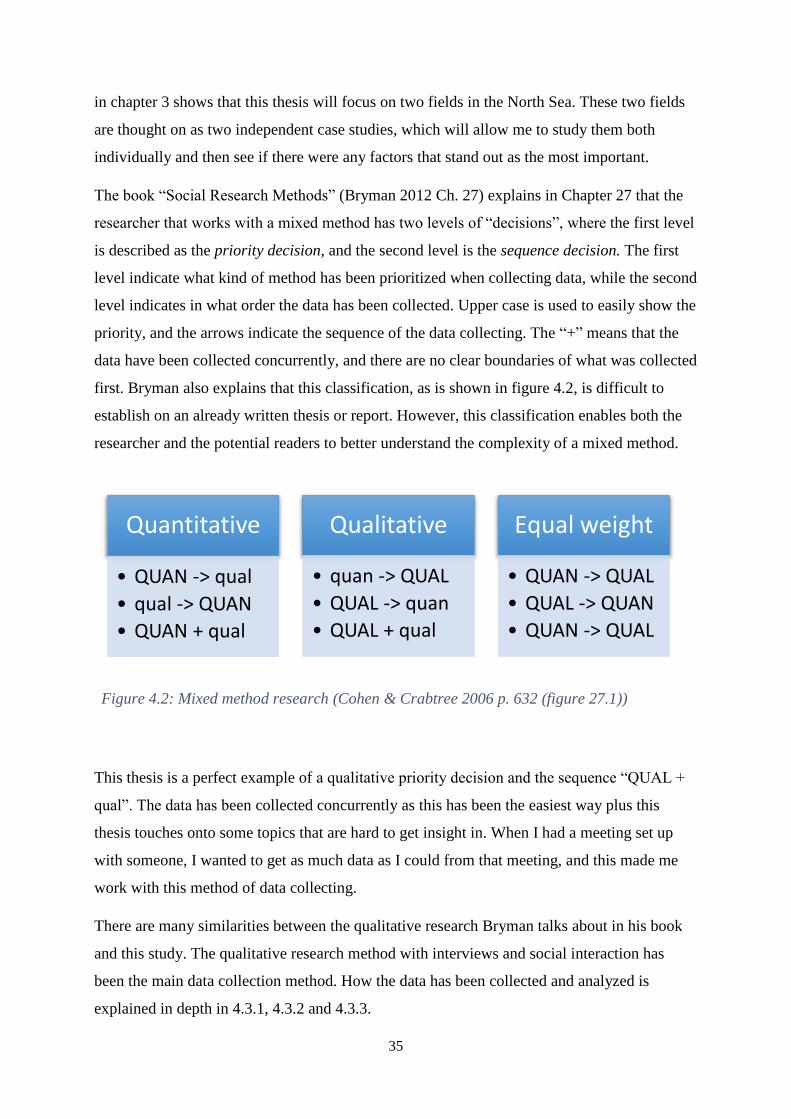
The book “Social Research Methods” (Bryman 2012 Ch. 27) explains in Chapter 27 that the
researcher that works with a mixed method has two levels of “decisions”, where the first level
is described as the priority decision, and the second level is the sequence decision. The first
level indicate what kind of method has been prioritized when collecting data, while the second
level indicates in what order the data has been collected. Upper case is used to easily show the
priority, and the arrows indicate the sequence of the data collecting. The “+” means that the
data have been collected concurrently, and there are no clear boundaries of what was collected
first. Bryman also explains that this classification, as is shown in figure 4.2, is difficult to
establish on an already written thesis or report. However, this classification enables both the
researcher and the potential readers to better understand the complexity of a mixed method.
Figure 4.2: Mixed method research (Cohen & Crabtree 2006 p. 632 (figure 27.1))
This thesis is a perfect example of a qualitative priority decision and the sequence “QUAL +
qual”. The data has been collected concurrently as this has been the easiest way plus this
thesis touches onto some topics that are hard to get insight in. When I had a meeting set up
with someone, I wanted to get as much data as I could from that meeting, and this made me
work with this method of data collecting.
There are many similarities between the qualitative research Bryman talks about in his book
and this study. The qualitative research method with interviews and social interaction has
been the main data collection method. How the data has been collected and analyzed is
explained in depth in 4.3.1, 4.3.2 and 4.3.3.
Quantitative
• QUAN -> qual
• qual -> QUAN
• QUAN + qual
Qualitative
• quan -> QUAL
• QUAL -> quan
• QUAL + qual
Equal weight
• QUAN -> QUAL
• QUAL -> QUAN
• QUAN -> QUAL

36
For analyzing the data I have used is a customized version of the MCDA (multiple-criteria
decision anlysis). MCDA methods are used when there are multiple criterias to be evaluated,
with both qualitative as well as quantitative criterias. This allows me to work with all the
relevant data so that nothing is left out. Guitouni & Marcel explain that there are many
MCDA versions that are very similar, yet different at the same time, and it may be difficult to
understand what method is best suited for a project.
“It it is a vicious circle to think of using a MCDA tool to choose a MCDA method”
(Guitouni & Martel 1998 p.519)
The multicriterion decision analysis (MCDA) is a non-linear method to help the researcher to
come to conclusions and recommendations. As shown by Guitouni & Martel (Guitouni &
Martel 1998 p.2) the goal of every MCDA method is to end up with “good”
recommendations. Many different MCDA methods exist to solve a decision making situation
(DMS). Structuring and articulating the decision problem is the first out of four steps in the
MCDA process. All four steps can be describes as Guitouni & Martels states it (Guitouni &
Martel 1998 p.1):
1. Structuring the decision problem
2. Articulating and modelling the preferences
3. Aggreagating the alternative evaluations (preferences)
4. Making recommendations
This thesis has the decision problem stated in chapter 3. The main problem is to get insight in
the case studies, and to determine the main factors that matter when the operator has to decide
between diver less tie-in and diver based tie-in. This problem is being supported by different
sub-problems as mentioned in 2.3. The limitations are described in 2.4 and will act as a
framework for the method.
The score to each of the factors is based on both the qualitative and quantiative data I have
acquired and by asking Aker Solutions for an opinion on how they would apply these scores.
By confirming my set scores with Aker Solutions I strengthen the scores and their meaning.
Bryman names this method as a test-retest. Test-retest is about making the data stability, and
by asking different employees at Aker Solutions the data will be more stable and trustworthy.
(Bryman 2012 p.168-169)

37
The MCDA method used in this thesis can be explained roughly as the method where the
findings will show what factors are most important in a set context. The process of
determining how to incorporate a MCDA method into the data that is collected can be a major
task as Guitouni & Marcel have mentioned. The main difference between various MCDA
methods is how the weighting is done and how the preferences are done. The MCDA method
that is used in this thesis is customized for this thesis and its context and I will present here
how I have incorporated the MCDA into this thesis.
The MCDA is developed with the operator of the field in mind. They have two possible
alternatives:
1. Diver based tie-in solutions
2. Diver less tie-in solutions
The purpose of the MCDA analysis is to see how well each alternative scores on several
criteria categories that are developed by me and experts in the subsea industry. The main
criteria categories are broken down into sub criteria so that the rating and scoring will be more
accurate. How the model is built up is explained in detail in 4.3.4.
4.3.1 Data management
The classification of goal, alternatives and criteria is divided into three different levels as
shown on figure 4.3. The classification represents that the goals consist of criteria that have to
be measured in order to conclude on the goal. NPV (net present value) in this figure is
representing the quantitative data involved.

38
The data in this thesis is presented as secondary data as everything is collected and analyzed
before by someone else and probably with a different primary purpose. Aker Solutions has
been my most important source, as they help me collect data in their own company, as well as
with other contractors.
The data I receive from other contractors than Aker Solutions is validated by Aker Solutions,
as they has experience with the subsea industry, and knows if I receive data that has not
fulfilled Kothari’s 3 requirements, reliability, suitability and adequacy (Kothari 2011).
4.3.2 Data collection
The oil and gas industry stores most of its data internally, which makes it hard for researcher
to perform a secondary data analysis on sensitive data that is not meant for the public. Data is
collected through communication with Aker Solutions and other companies regarding
technical and economical details.
Qualitative research approaches has been the main method of collecting data in this thesis. I
have performed several interviews and social meetings with both Aker Solutions employees
as well as employees in other companies. The type that I have used the most is the informal
interviews, together with some unstructured and semi-structured interviews. As the subject is
quite new to me, I mostly had informal interviews in the beginning, as well as acting just as
an observer in meetings where a related subject was discussed. As I have used a mixed
method in this thesis, the unstructured and informal types of interviews have been helpful
Figure 4.3: Three levels of classification
Criteria
Alternatives
Goal Diver based or diver less
Diver based
Quantitative Qualitative
Diver less
Quantitative Qualitative

39
when collecting data. I had to collect as much information as I could when I had the
opportunity, and this is the main reason for choosing these type of interviews. In these social
interactions, I have asked for both quantitative and qualitative data. Throughout the work in
this thesis I have had interviews and conversations with various people in the following
companies (See Appendix 4 for the names):
Aker Solutions
Technip
Subsea 7
Statoil
Premier Oil
EMAS
PTIL
The qualitative data gives me an insight in how subsea tie-in operations are performed and
more important, the companies underlying opinion regarding the two subjects in this thesis,
divers and diver less operations. Through interviews, I have been able to both understand the
companies’ opinions and thus create an analysis based on this qualitative data. Throughout all
the interviews I have been the one taking notes while asking questions. This has proved to be
a challenge, as it is not as easy as many thinks to comprehend a lot of technical and economic
facts while at the same time taking notes. I chose not to use a recorder as I believe the
interview subject will feel a bit more safer without the recorder in the room. I have sent my
notes to the interviewing subject after I revised them, so that they could validate that I have
noted the right answers. This was my way of doing the test-retest method, so that my data
could be strengthen.
Other methods of research approach is the collection of data from the Internet. Qualitative
research often begins with a case study and as Silverman puts it: “studies phenomena in the
contexts in which they arise through observation and/or recording or the analysis of printed
and Internet material” (Silverman 2011).
General information regarding the two oil and gas fields that are in the scope, Bream and
Johan Sverdrup, is raw data originally meant for the public and the media, and is presented in
this thesis as facts for both fields. This secondary data will also be taken into account when
conducting the analysis. Historical data in this thesis is also secondary data, as it already is
presented in many different ways on the Internet. This is collected and serves as the base of

40
the introductory part of this thesis. The price of oil is secondary data and is an interesting
factor, as it may have an influence on the findings of this thesis. I got the impression that the
price of oil was a sensitive topic for most of my interview subjects. Regardless, their opinion
on this matter and how this affects the market is very useful and valuable both for this thesis
and for future work.
Aker Solutions has done a similar comparison between diver less and diver assisted tie-in on
the oil and gas field named Butch. This study and its data and results will serve as a
supplement to the data collected, to estimate if there are any factors that may have been
ignored or missing out from the economical method (Aker Solutions 2014a). Operators of
Bream and Johan Sverdrup, Premier-Oil and Statoil may have done similar studies on the
fields they operate, but this data is confidential internally and very difficult to collect.
General data for this thesis is difficult to collect as the oil and gas industry relies heavily on
secrecy regarding their own technology and strategy. Especially data and information
regarding Johan Sverdrup is hard to collect, as this field is of great importance to all
companies in the oil and gas industry and the tender process is, as of May 2015, still ongoing.
All companies protect their own information and do not want to let it get out in the public as
this may give their competitors a competitive advantage.
As previously said, a lot of information and data is confidential, and I have to tread carefully
when speaking to other contractors regarding this subject so that Aker Solutions does not
reveal their strategy for the future or the goal with this thesis.
Since a lot of the information needed for this thesis is confidential, and impossible for me as a
researcher to collect, I have used a method that uses expert judgments in cases where
quantitative data is not possible to collect (Hughes 1996). The method I have used is a
simplified method which I have simplified to make it work with my thesis. Where quantitative
data is not possible to collect I have reached out to individuals that are experts on the subject I
am working on, and asked for their input. By asking for the same questions to multiple
experts I have made it possible to calculate a mean value for the data. These estimations will
be based on both earlier studies on different fields, general historic trends and numbers as
well as assumptions from experts in the different fields. Quantitative data that is assumed and
estimated will have a larger uncertainty, which is a weakness of having this method. This
applies especially for the Johan Sverdrup field, as I have very little quantitative data regarding

41
this field and that results in most of the data being estimated. Following factors and their cost
have been estimated by using expert judgements:
Johan Sverdrup
Estimated that both the UTA and the HCM is necessary for the diver based solution as
well.
Flange cost of 0,4 MNOK.
Planning cost of 2 MNOK.
Metrology estimated to 12 hours per spool.
For the Bream field the following have been estimated:
Flange cost of 0,2 MNOK.
Metrology estimated to 12 hours per spool.
Planning cost of 1 MNOK.
That most of the diver based data is estimated for the Johan Sverdrup is unfortunate, but
necessary as the information is confidential. This is a weakness for this study as the results
will be based on these estimates.
4.3.3 Data analysis
The scope of this thesis limits the analysis to a secondary data analysis. Kothari explains that
the time available and the scope of the enquiry is important when deciding what method to
use. To collect and analyze primary data takes much more time than using secondary data that
already exist (Kothari 2011 p. 96-112). The gathering of information and data on a relatively
unknown subject takes a lot of time, especially in a very competitive and secretive
environment. Based on this, and the fact that there is no point of inventing the wheel anew, all
data will be secondary data, and Aker Solutions and other experts will validate and help with
assumptions where there is none existing data.
The analysis of the secondary data will be done by performing a customized MCDA method.
The request from Aker was to determine which factor is most important when an oil company
uses either diver less or diver assisted solutions. Using this request as a underlying motive, the
best method to perform a data analysis would be the MCDA method. Aker is included in the
process, so that they can help determine the weight and importance of the different factors.

42
Before starting to analyze the data, several steps has to be taken beforehand. Kothari explains
this in his book “Research Methodology” as the following processing operations:
1. Editing: The data has to be edited and a quality assurance has to be performed. In this
thesis Aker will be of assistance so that the data is validated and correct. The data will
be arranged in orderly table, so that simple errors can be easily spotted and removed.
2. Coding: This step is about effectiveness and categorizing the data so that the analysis
will go faster. For this thesis, this means assigning scores to each factor that is used in
the MCDA model.
3. Classification: Kothari explains this step as categorizing vast amounts of data, so that
it become comprehendible. The secondary data I collected for this thesis will be
organized and categorized in fitting groups. As the volume is quite small, compared to
what Kothari operates with, there will be a minimum of categories.
4. Tabulation: In this step the researcher organizes the data in orderly rows and columns,
so that the data is orderly arranged in a table.
(Kothari 2011 p.122-128)
This thesis does not have a large volume with data, therefore the processes have been done a
bit differently. I found it to be better to do the classification and coding before editing the data
itself and validating it. It was faster to send Aker data that was orderly arranged in tables and
documents, so that they could spot mistakes and errors easily. This helped me speed up the
process.
4.3.4 Model
The models that are used to process the quantitative data in this thesis are all made in Excel.
Aker Solutions has calculated their own costs regarding their connectors and their known
technology. The same models are applied to both the Bream field and Johan Sverdrup as these
are the cases that are being studied. The following models have been made in Excel and used
to assess the two fields in more detail:
Economic cost for the tie-in process for both diver based and diver less solutions
o The purpose with this model is to understand the total cost for the project.
Economic model where the variable is “time in days”
o Purpose of this model is to illustrate how the cost progresses over a period of
installation days.

43
o The model will be displayed with different costs of the diver less connector, to
give Aker Solutions some insight in what effect a reduce in cost would have.
To assess all the qualitative data I have created a MCDA model in Excel to show what criteria
are the most important. The model I have used is one example from NC State University in
the US (NC State University). The model from NC State University is only a frame for my
data in Excel, and does not give me any other benefits than serve as a framework. The
purpose of this model is to give Aker an insight in what factors they can decide are most
important in their opinion, and they can see what criteria are most important from a
researcher’s point of view. The model is based on categorizing the data in criteria and sub-
criteria. The model is made in the viewpoint of the operator of the field. They have two
alternatives, a diver based tie-in solution, or a diver less solution. When rating and weighing
the different criteria one has to rate according to how well the solution satisfies the criteria
from the operator’s point of view. The criteria and sub-criteria I have chosen for this thesis are
the following:
Hardware cost (Quantitative)
o Tie-in
o Tools
o Template and structures
Installation cost (Quantitative)
o Rental rate vessels
Engineering cost (Quantitative data)
o Customizing existing equipment
Time usage (Quantitative)
o Installation time
o Vessel rental time
HSE (Qualitative)
o Safety when installing (for the ROV-operators or the divers)
o Safety in the area of the installation
Availability (Qualitative)
o Vessels
o Standardized equipment

44
All the criteria categories have been assigned a ranking from 1-10 whereas 1 is the most
important and a 10 for the least important criteria. The criteria categories have also been
assigned a group weighting that will determine the total weighting of the group. 100 points
have been allocated this way so the total sum of all the groups will be 100. The third step in
this process is to assign each sub-criteria its own weight. The value can range between zero
and the group weighting. Several sub-criteria can have the same weight; it can just not exceed
the group weight of the main criteria group.
The last step is the rating that has to be applied to all sub-criteria. The rating is individual for
both the diver assisted and the diver less solution. The rating is based on an ordinal scale from
1 to 5, where 1 is poor, 2 is below average, 3 is fair, 4 is very good and 5 is excellent. By
using an ordinal scale the rating is not relative to the others interests, and only to how good
the sub-criteria satisfies the solution that is being analyzed (NC State University). The rating
is done by me, with a lot of input and suggestions from all of the contractors and companies I
have talked to. I have taken their input into account and the outcome is the rating in fifth and
sixth column in the MCDA models. This MCDA model and analysis will give both me and
Aker Solution an insight in what criteria other contractors find interesting, as well as the
general opinion I have obtained by talking to a lot of other contractors and operators.
4.4 Present Value Evaluation
The entire cash flow is happening in a short span of time, and the operator usually has to pay
for the tie-in investment as soon as it has been delivered (Aker Solutions 2015). Since the
investment and cash flow will probably occur in a one-year span, there will be no need to
evaluate the net present value of the cash flows, and take this into the analysis.
4.5 Economic model
Determining the variables needed for the economical model to be successful has been a
combination of qualitative and quantitative research. The parameters have to be found through
interviews with engineers and economists, as surveys are not accurate enough in this matter.
The target audience is engineers with experience and knowledge about the subsea industry,
preferably specifically the ROV and diver-part of the industry. A pure quantitative research
with surveys posted in various magazines and sites for engineers is not accurate enough, and a
qualitative approach is preferred (Silverman 2011). A single source of information will not
suffice, and multiple sources is needed to make the study reliable. Both the information that is
summarized through conversations and interviews and behavior and attitude is data collected.
45
The cost analysis is a model made in Excel to determine the total cost for the diver based and
the diver less solution. Two major parameters are chosen to be evaluated as the qualitative
research suggested it. This is the hardware cost and the installation cost. By using the data that
is collected I have been able to simulate costs for both the tie-in solutions. I have done some
simplification such as using the same installation time per spool (0,34 days) on both cases and
using 1,5 MNOK per day as the cost of an ROV rental vessel and 3 MNOK per day as a
diving rental vessel. The simplification have been taken after discussing it with various
sources, so they are viable. The model has costs that are displayed from a minimum to a
maximum range. This is utilized wherever possible, to illustrate what range the costs are in.
When there is no data available, a value has been estimated between the minimum and
maximum values. The estimated value has been used in calculations and used in the simulated
values.
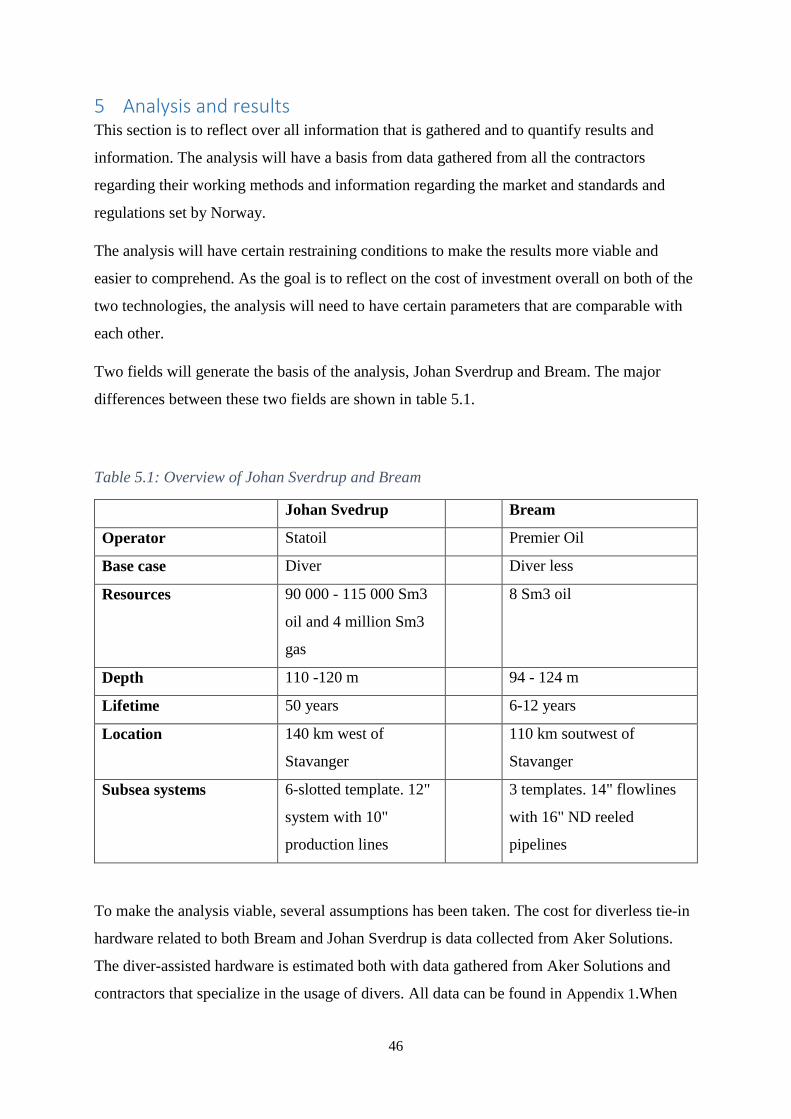
46
5 Analysis and results This section is to reflect over all information that is gathered and to quantify results and
information. The analysis will have a basis from data gathered from all the contractors
regarding their working methods and information regarding the market and standards and
regulations set by Norway.
The analysis will have certain restraining conditions to make the results more viable and
easier to comprehend. As the goal is to reflect on the cost of investment overall on both of the
two technologies, the analysis will need to have certain parameters that are comparable with
each other.
Two fields will generate the basis of the analysis, Johan Sverdrup and Bream. The major
differences between these two fields are shown in table 5.1.
Table 5.1: Overview of Johan Sverdrup and Bream
Johan Svedrup Bream
Operator Statoil Premier Oil
Base case Diver Diver less
Resources 90 000 - 115 000 Sm3
oil and 4 million Sm3
gas
8 Sm3 oil
Depth 110 -120 m 94 - 124 m
Lifetime 50 years 6-12 years
Location 140 km west of
Stavanger
110 km soutwest of
Stavanger
Subsea systems 6-slotted template. 12"
system with 10"
production lines
3 templates. 14" flowlines
with 16" ND reeled
pipelines
To make the analysis viable, several assumptions has been taken. The cost for diverless tie-in
hardware related to both Bream and Johan Sverdrup is data collected from Aker Solutions.
The diver-assisted hardware is estimated both with data gathered from Aker Solutions and
contractors that specialize in the usage of divers. All data can be found in Appendix 1.When

47
discussing the cost analysis that has been done I will mostly focus on trying to somehow
improve the costs of the diver less solution, as it is this Aker Solution have influence over,
and can improve. Each case will be presented and then discussed individually and then
combined in the end discussion.
5.1 Bream
The MCDA analysis that is performed on the Bream case is presented in table 5.2. What the
different columns and rows mean and how they are weighted, rated and scored is explained in
4.3.4.
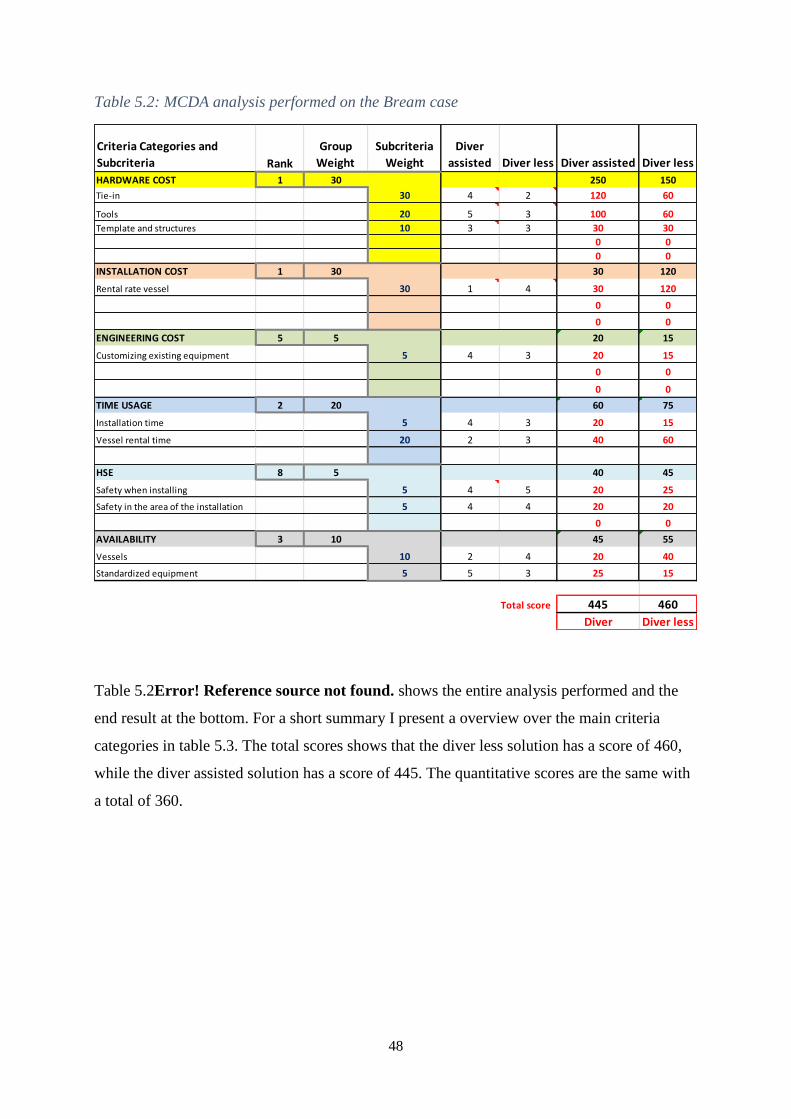
48
Table 5.2: MCDA analysis performed on the Bream case
Table 5.2Error! Reference source not found. shows the entire analysis performed and the
end result at the bottom. For a short summary I present a overview over the main criteria
categories in table 5.3. The total scores shows that the diver less solution has a score of 460,
while the diver assisted solution has a score of 445. The quantitative scores are the same with
a total of 360.
Criteria Categories and
Subcriteria Rank
Group
Weight
Subcriteria
Weight
Diver
assisted Diver less Diver assisted Diver less
HARDWARE COST 1 30 250 150
Tie-in 30 4 2 120 60
Tools 20 5 3 100 60
Template and structures 10 3 3 30 30
0 0
0 0
INSTALLATION COST 1 30 30 120
Rental rate vessel 30 1 4 30 120
0 0
0 0
ENGINEERING COST 5 5 20 15
Customizing existing equipment 5 4 3 20 15
0 0
0 0
TIME USAGE 2 20 60 75
Installation time 5 4 3 20 15
Vessel rental time 20 2 3 40 60
HSE 8 5 40 45
Safety when installing 5 4 5 20 25
Safety in the area of the installation 5 4 4 20 20
0 0
AVAILABILITY 3 10 45 55
Vessels 10 2 4 20 40
Standardized equipment 5 5 3 25 15
Total score 445 460
Diver Diver less

49
Table 5.3: Summary of MCDA analysis of Bream field
If the decision should be based entirely on the MCDA analysis Premier Oil should go for a
diver less solution, as this solution scores higher in the analysis. The quantitative data has
been analyzed further in an economic analysis. The diver assisted solution is presented in table
5.4
Table 5.4: Cost analysis of the diver based solution on Bream
Diver Diverless Diver Diverless
Availability 45 55 3,5 3,5
HSE 40 45 4,0 4,5
Time usage 60 75 3,0 3,0
Engineering cost 20 15 4,0 3,0
Installation cost 30 120 1,0 4,0
Hardware cost 250 150 4,0 2,7
Quantitative total 360 360 3,0 3,17
Total scores 445 460
Average scores based
on subcriteria rating
Min Probable Max Simulated
Flanges (32 x 14") 0,1 0,2 0,4 6,4
HW cost 6,4
Vessel per day 2,0 3,0 4,0 3,0
Vessel mob/demob cost 12,0 15,0 12,0
Installation days 25,5 40,0 25,5
Installation cost 81,0 175,0 81,0
Engineering cost (metrology) 7,5 7,5
Other costs (structures, planning onshore etc) 1,0 1,0
Maintenance costs - -
Total cost for diver solutions: 95,9 MNOK
Installation cost in % of total cost: 84 %

50
Key points from this analysis:
Total cost: 95,9 MNOK
Hardware cost: 6,4 MNOK
Installation period: 25,5 days
Installation cost is 84,5 % of the total cost.
The same analysis has been done on the diver less solution. The results are presented in table
5.5.
Table 5.5: Cost analysis of the diver less solution on Bream
Key points from this cost analysis:
Total cost: 101,5 MNOK
Hardware cost: 60,0 MNOK
Installation cost: 32,5 MNOK
The HW cost is 59,1% of the total cost
Connector cost change will have an impact on the total cost. Illustration of when the two
solutions will intersect is shown with the following graphs. Various costs for the HCS
connector has been illustrated.
Min Probable Max Simulated
Connector HCS (20 x 14") 3,0 60,0
HW cost 60,0
Vessel per day 1,0 1,5 3,0 1,5
Vessel mob/demob cost 6,0 6,0
Installation days 2,0 17,6 40,0 17,6
Installation cost 32,5 32,5
Engineering cost (metrology) 5,0 5,0
Other costs (structures etc) 4,0 4,0
Maintenance costs (not NPV adjusted) - -
Total cost for diver less solutions: 101,5 MNOK
Installation cost in % of total cost: 59 %

51
Figure 5.1: Bream: HCS connector cost 3 MNOK
Results from figure 5.1:
Diver less solution has a total cost of 96 MNOK at 14 days.
Intersection point: Approximately 40 days.
0
20
40
60
80
100
120
140
160
180
0 2 4 6 8 10 12 14 16 18 20 22 24 26 28 30 32 34 36 38 40 42 44 46 48 50
Co
st in
MN
OK
Days
HCS connector cost: 3 MNOK
Diver assistedHWTotal graph
Diver less HW
Total graph

52
Figure 5.2: Bream: HCS connector cost: 2 MNOK
Results from figure 5.2:
Diver less solution cost at 17,6 days: 79,9 MNOK
0
20
40
60
80
100
120
140
160
180
0 2 4 6 8 10 12 14 16 18 20 22 24 26 28 30 32 34 36 38 40 42 44 46 48 50
Co
st in
MN
OK
Days
HCS connector cost 2 MNOK
Diver assistedHW
Total graph
Diver less HW
Total graph

53
Figure 5.3: Bream: HCS connector cost 4,5 MNOK
Results from figure 5.3:
No intersection point in the given interval.
Expensive HCS connector
0
20
40
60
80
100
120
140
160
180
200
0 2 4 6 8 10 12 14 16 18 20 22 24 26 28 30 32 34 36 38 40 42 44 46 48 50
Co
st in
MN
OK
Days
HCS connector cost 4,5 MNOK
Diver assistedHWTotal graph
Diver less HW
Total graph

54
5.2 Discussion regarding Bream
The MCDA analysis on the Bream field that is shown in table 5.3 explains what criteria have
been the most important to Premier Oil.
Figure 5.4: MCDA main criteria shown as graph
As figure 5.4 shows, there are several criteria that are scored in favor of the diver assisted
solution and there are some that are score in the diver less solution. The diverless solution
scores higher in 4 out of the 6 main criteria categories that are set. The only criteria the diver
assisted solution has a higher score in are “hardware cost” and “engineering cost”. The diver
assisted solution is as previously in the thesis mentioned to be heavily favored in the cost
aspect of the technology, as most of the technology is easier to procure and develop and
thereby making the technology more cost efficient. Diver assisted solution has the highest
score of the analysis with the hardware score being 250. This may imply that this is the most
important criteria, which is somewhat correct. The hardware criteria has a group weight of 30,
as seen in table 5.2, which makes the criteria tied as the most important together with the
installation cost. The flanges and the tooling that divers require is so much simpler than ROV

55
tools and equipment, which makes the hardware predictable and easy to come by. Cause of
the simplicity of flanges, and the fact that spools will be shorter when there are no large
connectors on each end, the rating for the diver assisted has been given a 4 out of 5. The diver
less has been given a 2 since the tie-in connectors are large, expensive and the spools have to
be a minimum of 500 mm longer on each end for the ROV to be capable of performing a tie-
in. Increased spool size increases the usage of deck space while transporting and limiting the
number of spools the vessel can carry which leads to longer transporting time and higher cost.
A similar distribution can be seen with the sub criteria “tools”. Diver assisted has been given a
5 while the diver less only a 3. Common tools like wrenches and other practical tools that are
widely used can be used subsea as well, of course with some modification. ROVs do not have
the flexibility with their arms, and therefore their tools are specialized and engineered for the
actual task. Often several tools are required, and there is little room for improvisation. This is
expensive and the tools are not easy to come by. Additionally, they take some time to replace
if they get damaged. This is the reasoning behind the low score for the diver less solution.
If one is to look only on the diver less solution there is no doubt that the solution should be
diver assisted. However that is not the case for operators, as there are many other factors that
has to be looked at.
The installation cost, which comprises of the rental vessel rate is also weighted with a 30 in
table 5.2. Often are these two criteria the two most important quantitative criteria when a
decision has to be made. This applies here as well as the weighting is shown to be 30. The
weighting is based on input from other contractors, and from the operator of the field, Premier
Oil. As the operator, Premier Oil has a higher influence in what the weighting should be than
the contractors I have been in contact with. Together with hardware cost, these two
quantitative criteria constitute 60 of the 100 “points” that the criteria categories are being
given. This suggests that these two are important criteria for an operator when deciding
between two solutions. The diver less solution is clearly regarded as the solution that satisfies
the criteria best, with a rating of 4 against a rating of 1 for the diver assisted.
Premier Oil mentioned strongly that they found the rental rate for diver vessels to be way too
expensive. In UK there are more contractors that deliver diver vessels than in Norway. As
Premier Oil is a UK based oil company they were used to the competitive prices of UK diver
vessels, and it seems like Norwegian prices scared them a bit.

56
HSE and engineering cost are both weighted as a 5, as these criteria did not have any great
impact on the decision that was being made. HSE is an aspect that is very important to all
companies, but both they and other contractors consider diving to be completely safe and
therefore this is not an issue for this decision making.
Other ratings worth mentioning from table 5.2 is the time usage and the availability. The time
usage is important to discuss as this is linked to the total installation cost that the solution will
have. Divers are slightly faster to perform tie-in operations, and they can do multiple
operations at the same time. A rating of 4 against a 3 for ROV installation time is sensible.
Sub criteria “vessel rental time” is the important sub criteria in this category with a weight of
20 out of 20 possible. The divers install faster, but the vessel uses a much longer time to get
out to the field and get divers to the required depth, which makes this sub criteria score bad
against the diver less solution. ROV vessels do not need the extra time for divers to adjust to
the pressure as the ROV can be lowered straight to the seafloor. The diver less solution is
rated only a 3 cause of the extra time spent on collecting spools that need to be installed. The
extra connectors on each spool require the spools to be longer and this requires extra trips
back and forth between the field and mainland and this takes quite some time. The diver
vessel can bring up to four spools on the deck space, while the ROV vessel only has room for
one.
When all of the scores are set up against each other the quantitative criteria appear to have the
same score, and it is the qualitative that separates them. Table 5.3 shows that the diver less
solution scores a total of 460, while the diver assisted solution gets a score of 445. From this
analysis, I will suggest that Premier Oil uses ROVs and diver less technology to perform the
tie-in operations. This will benefit Premier Oil the most as this satisfies their requirements and
wishes. As the quantitative criteria are clearly more important in the decision-making, I have
performed several cost analyses to determine what solution was in fact more cost effective.
All my interviews with the various contractors have given me a great deal of qualitative data
as well as quantitative. From their point of view, it seems that the economical aspect is the
most important one, and that is also, why I have focused on the cost analysis that I have done
in this thesis.

57
The cost analysis presented in 5.1 can be summarized in to table 5.6.
Table 5.6: Bream: Cost analysis summary
If Premier Oil would see only on the cost analysis, a diver based solution has a preferable
cost. However there are certain aspects one has to determine what to look into. The time used
to perform the operation is strongly in favor of the diver less solution. This criterion was rated
as important in the MCDA analysis. The installation cost and HW cost are also two
parameters that are very important, and the two large factors when performing this cost
analysis. While the diver less solution has a higher HW cost, it has a much lower installation
cost. The vessel rate per day is also much lower as presented in table 5.5. This implies that the
risk is lower for using this solution. If something happens, and the project is delayed, the cost
will increase at a higher rate for the diver based solution (vessel rental rate 3 MNOK per day
vs 1,5 MNOK per day for the ROV vessel).
The total savings for choosing the diver based solution is approximately 5,6 MNOK. This is
not a large saving, and there is probably several other costs included in a correct calculation,
as my data is estimated based on several interviews and conversations with various
contractors. The number of spools are 15 for the diver based and 10 for the diver less solution.
It takes approximately one day for a one-way trip to the field with spools (including mob time
on mainland). Spools used with the diver based solution are shorter and lighter as there are no
large connectors on the ends with porches and guide frames. This makes it possible to have 3-
5 spools on each trip, which saves a lot of time traveling. Spools used with ROVs are heavier
and longer, so there is usually only room for one spool on the deck. In the Bream case the
diver solution had 15 spools, and the calculation in Appendix 2 shows what it means for the
cost when there is room for four spools on one diving vessel, while only one spool on the
deck on a ROV vessel. This means that there is probably a limit on spools if the diver less
solution is to have a lower cost.
Diver based solution Diver less solution
Total HW cost 14,9 68,99
Days required to complete tie-in 25,5 17,64
Total installation cost 81 32,46
Total cost 95,9 101,45
Installation in % of total cost 84 % 32 %
HW cost in % of total cost 16 % 68 %

58
For this field I would say that both of the solutions are viable. Qualitative data from Technip
has made me aware that Premier Oil also said that they wanted to have many things
automated. This is not confirmed, but this would mean that a diver less solution is highly
sought after, as a lot of the equipment is remotely controlled and automatic. Data collected
from Premier Oil also said that they encountered rental vessel rates for diving vessels in
Norway to be above the UK prices. This would mean that the price of the diving vessel may
be higher than 3 MNOK per day, which would make the calculation of cost look better for the
diving less solution.
I have shown what would have happened if the HCS connector from Aker Solutions costs 2
MNOK in figure 5.2. The total cost for the installation time of 18 days would have been 82
MNOK in total, which is approximately 14 MNOK lower than the diver based solution. The
price of the connectors have a lot impact on the total cost for the diver less solution, as HW
cost is 68 % of the total cost (with HCS cost of 3 MNOK per connector).

59
5.3 Johan Sverdrup
Johan Sverdrup has been evaluated with the same models as the Bream field. Table 5.7 shows
the MCDA analysis that has been done. For information on what each column means and how
the rating is done, see 4.3.4.
Table 5.7: MCDA analysis performed on Johan Sverdrup
Criteria Categories and
Subcriteria Rank Group Weight
Subcriteria
Weight
Diver
assisted Diver less
Diver
assisted Diver less
HARDWARE COST 1 30 210 140
Tie-in 30 3 2 90 60
Tools 20 3 2 60 40
Template and structures 20 3 2 60 40
0 0
0 0
INSTALLATION COST 1 25 50 100
Rental rate vessel 25 2 4 50 100
0 0
0 0
ENGINEERING COST 5 5 20 15
Customizing existing equipment 5 4 3 20 15
0 0
0 0
TIME USAGE 2 25 95 65
Installation time 5 4 3 20 15
Vessel rental time 25 3 2 75 50
HSE 8 5 40 45
Safety when installing 5 4 5 20 25
Safety in the area of the installation 5 4 4 20 20
0 0
AVAILABILITY 3 10 65 40
Vessels 5 3 4 15 20
Standardized equipment 10 5 2 50 20
Total score 480 405
Diver Diver less

60
Table 5.8: Summary of MCDA analysis of Johan Sverdrup
Economic modeled that is described in 4.5 is applied to Johan Sverdrup so that a cost analysis
can be evaluated.
Table 5.9: Cost analysis of diver based solution for Johan Sverdrup
Diver Diverless Diver Diverless
Availability 65 40 4,0 3,0
HSE 40 45 4,0 4,5
Time usage 95 65 3,5 2,5
Engineering cost 20 15 4,0 3,0
Installation cost 50 100 2,0 4,0
Hardware cost 210 140 3,0 2,0
Quantitative total 375 320 3,1 2,9
Total scores 480 405
Average scores based
on subcriteria rating
Min Probable Max Simulated
Flanges (16 x 14") 0,1 0,4 0,4 33,4
Connector HCM incl. Purchase price tooling (12x 12") 5,0 60,0
Connector UTA (4x) incl purchase price tooling 1,9 7,6
HW cost 101,0
Vessel per day 2,0 3,0 4,0 3,0
Vessel mob/demob cost 12,0 15,0 12,0
Installation days 18,1 40,0 18,1
Installation cost 62,2 175,0 62,2
Engineering cost (metrology) 4,0 4,0
Other costs (structures, planning onshore etc) 2,0 2,0
Maintenance costs - -
Total cost for diver solutions: 169,2 MNOK

61
Table 5.10: Cost analysis of diver less solution for Johan Sverdrup
Graphs are used to illustrate how the diver less solution will correlate with the diver assisted
over time, and which solution is most cost efficient at a given installation time. The graphs are
made from the economic model described in 4.5. The lines represent the results in table 5.9
and table 5.10 with the amount of days being the variable.
Figure 5.5: Johan Sverdrup: Graphed cost analysis of diver assisted and diver less. HCS
cost: 6,5 MNOK
Results from figure 5.5:
The intersection between the two solutions happens at approximately 36 days.
Min Probable Max Simulated
Connector (22x 16" HCS) 6,5 143,0
HW cost 143,0
Vessel per day 1,0 1,5 3,0 1,5
Vessel mob/demob cost 6,0 6,0
Installation days 2,0 25,7 40,0 25,7
Installation cost 44,6 44,6
Engineering cost (metrology) 4,0 4,0
Other costs (structures etc) 11,7 11,7
Maintenance costs - -
Total cost for diver less solutions: 203,3 MNOK
0
50
100
150
200
250
300
0 2 4 6 8 10 12 14 16 18 20 22 24 26 28 30 32 34 36 38 40 42 44 46 48 50
Co
st in
MN
OK
Days
HCS 16" connector with a cost: 6,5 MNOK
Diverassisted HW
Total graph
Diver lessHW
Total graph

62
Figure 5.6: Johan Sverdrup: Graphed cost analysis of diver assisted and diver less. HCS
cost: 6 MNOK
Results from Figure 5.6:
Intersection between the two solutions happens at 27 days with a cost of 194 MNOK.
Figure 5.7: Johan Sverdrup: Graphed cost analysis of diver assisted and diver less. HCS
cost: 5,5 MNOK
Results from Figure 5.7:
Intersection between these two solutions happens at 19 installation days. The cost is
then approximately 171 MNOK. Barely higher than the diver based total cost.
Diver less cost at 26 days: Approximately 182 MNOK
0
50
100
150
200
250
300
0 2 4 6 8 10 12 14 16 18 20 22 24 26 28 30 32 34 36 38 40 42 44 46 48 50
Co
st in
MN
OK
Days
HCS 16" connector cost: 6 MNOK
Diverassisted HW
Total graph
Diver lessHW
Total graph
0
50
100
150
200
250
300
0 2 4 6 8 10 12 14 16 18 20 22 24 26 28 30 32 34 36 38 40 42 44 46 48 50
Co
st in
MN
OK
Days
HCS 16" connector cost: 5,5 MNOK
Diver assistedHW
Total graph
Diver less HW
Total graph

63
Figure 5.8: Johan Sverdrup: Graphed cost analysis of diver assisted and diver less. HCS
cost: 5 MNOK
Results from figure 5.8:
Approximately same cost with the same installation time.
Diver less at 25 days: Approximately 170 MNOK
Diver based at 18 days: Approximately 169 MNOK.
0
50
100
150
200
250
300
0 2 4 6 8 10 12 14 16 18 20 22 24 26 28 30 32 34 36 38 40 42 44 46 48 50
Co
st in
MN
OK
Days
HCS 16" connector cost: 5 MNOK
Diverassisted HW
Total graph
Diver lessHW
Total graph

64
5.4 Discussion regarding Johan Sverdrup
Johan Sverdrup is perhaps the most important field that exist today. To win a contract on this
field means a lot to a contractor, as the field will last for a long time and the reward will be
great, both for the operator and the contractor that wins the contract. These are bad times for
the oil and gas industry and if a contractor does not win a contract for this field it may bring
consequences later regarding new fields and new contracts. The field is not yet fully planned
and there is still a lot of business going on regarding who will get the responsibility for parts
of the field and the technology that will be used. This means that some of my information
may not be completely accurate regarding the exact numbers and costs for this field, but I will
assume that my data is correct.
Figure 5.9 shows the main criteria from the MCDA analysis in table 5.7 as graphs. The Y-axis
is the total score that is given for the actual category. This field is somewhat opposite to
Bream, as here one can see that the diver based solution has a higher score in 4 out of the 6
categories. The only category that the diver less solution scores higher is in installation cost
and in HSE.
Figure 5.9: MCDA analysis of Johan Sverdrup shown as diagrams

65
If we take a look at table 5.7 the main category is yet again the hardware cost, with a group
weight of 30 out of 100 possible points. The hardware cost is divided in the same sub criteria,
with tie-in being the most important one with 30 points out of 30 possible. Diver based
solution scores naturally higher here as the tie-in technology is simpler with the flanges that
are being used. However, the diver based solution is only given a rating of 3 because of the
need of some technology that is quite advanced and expensive as well. This technology
includes UTA and HCM. These are somewhat different that normal tie-ins are done as they do
not have flanges but a different kind of connectors that require the usage of ROV tools. The
positive side is that these tools are “diver-friendly” and existing tools can be used here. The
diver less solution is rated as a 2 as a 100% diver less solution requires 22 HCS connectors,
and the size has to go up to 16”. There is a great jump in cost for this size, which is
unpractical and quite expensive.
The sub criteria tooling is rated the same as tie-in for both solutions, 3 and 2. The tooling for
divers are simple for the flanges, but the UTA and HCM require ROV tooling as mentioned.
The diver less solution requires special 16” tooling, as the tooling for the 12” and 14” is not
usable with the 16” system. The tooling is more advanced and leads to higher costs as shown
in Appendix 5.
The same rating is given to the sub criteria “template and structures”. Diver assisted require
some structures to stand on, and the HCM is not specialized for divers as of today, which rates
this as a 3. The diver less solution does not perform well with a rating of 2. One may even
give this sub criteria a 1. There is no room for 3x16” HCS porches and UTA in the WAG
manifold that is suggested from Aker Solutions. There is a possibility to choose a 12” HCS,
but this will decrease the capacity of the system, which is unwanted. With many structures
that is diver less the main dimension and weight will increase and this will increase the cost
overall. These ratings is what gives the diver based solution a score of 240 in hardware cost,
while the diver less solution only gets a score of 140 as seen in figure 5.9.
Criteria category “rental rate vessel” and “time usage” are tied for the second and third most
important criteria with a group weight of 25 out of 100. The rental rate for diver vessels is
better scored for Johan Sverdrup than for Bream, with a rating of 2 and therefore a score of
50. This is mainly because there was some welding that was planned for a 36” pipe, and
divers were already being planned for use. This is practical, as there is a possibility to save
some mob cost as well as transporting cost. A ROV has trouble doing the welding cause of
the lack of flexibility and accuracy when performing motion sensitive actions as stated in the
66
theory regarding ROVs. This speaks to the case that a diver based solution should be used for
Johan Sverdrup.
Time usage is a criterion that Statoil had an input on as well. They meant that ROV based
systems used a bit longer time performing the needed tie-in operations. If the operator uses
the same vessels for transporting spools as the base case vessel, there is a lot more deck space
on a diver vessel. This results in fewer trips back to the mainland to collect spools. As the
amount of spools is the same (see Appendix 3), it will take a lot longer time for the diver less
solution to get all spools out to the field. The weather window is also some shorter for the
ROV based solution, as ROVs cannot operate above a Hs of 3,5m while a diver can operate
until the Hs is 5,5m. Premier Oil has provided data that shows that a increased cost of 5% in
the time used for tie-in with ROVs is a valid assumption and I have incorporated that in the
cost analysis that is done (see Appendix 1). With Statoil claiming that the time usage was an
important factor for them, and all these facts, I rated the diver based solution a 3 as fair and
the diver less solution as a 2 as it is satisfying the criteria below average.
HSE is for Statoil a key criterion, but both diving and using a ROV is considered as
completely safe so this criteria is just weighted with a 5. Divers are of course humans, and
there is a risk when having a person subsea installing structures and working with large
forces. Jørgensen from Statoil mentioned that a study exist that studied the death risk of divers
and it was estimated to be 50% lower death risk working as a diver than working as a
helicopter pilot. This data is regarded as pointing towards the diver based solution.
The last criteria that Statoil has mentioned was the availability. They were concerned with the
availability of equipment, and they wanted to have a form of “insurance” if something were to
go wrong. Diver based equipment is standardized, as it is rated with a 5 and diver less is only
rated as a 2. The vessels available was largely in the favor of diver less before, but now there
are more diver vessels in the market, so this is not that much of an issue longer. This sums up
that it is important to have equipment in reserve and that it can be shipped out quickly, so that
the delay will be minimized. That is why diver based solution scores a 65 on this criteria,
while the diver less only scores 40 points.
The MCDA analysis shows totally that the diver based solution gets a total score of 480 with
210 points from hardware cost and 95 points from time usage. Both of these criteria are group
weighted high (30 and 25) which ensures that the solution scores high in total. The diver less

67
solution scores relatively low in hardware cost, as the ratings are quite low (all sub criteria
rated 2), while it scores high in installation cost. This is due to the low rates for rental vessels.
In this case the quantitative criteria are the most important ones with scores 375 and 320 in
the two solutions, see figure 5.9. A cost analysis is important to look into for a better
understanding on why the diver based solution has been chosen by Statoil. I want to remind
that all costs are estimated with some basic input from various contractors, and the cost
analysis does not reflect the realistic cost for Statoil with this field.
The cost analysis regarding the Johan Sverdrup field can be summarized into the following
table:
Table 5.11: Johan Sverdrup: Cost analysis summry
The total cost is approximately 34 MNOK lower by choosing the diver based solution than the
diver less solution. Even if the data that is used in the model is estimated, it seems plausible as
Statoil have as well claimed that the savings are very high by going with a diver based
solution.
I want to point out how large the hardware cost is for this field. My estimates show that the
diver based solution has a hardware cost of 63% of the total cost. This is largely due to the
HCM and UTA connectors that are in the scope. It should be the installation cost that should
have the highest percent, as the HW cost for diver based solutions should be cheap. The tie-in
time is lower for the divers as they can perform multiple actions at the same time, and the
amount of spools is eight for both the solutions, which makes the diver less solution use a lot
of time to collect spools. Statoil hinted that they were also worried about the time spent on
collecting spools, as they wanted to have all their equipment as fast as possible to the field, so
that the tie-in operation was as effective as possible.
By taking a look at the graphs that are presented in 5.3 one can see the breaking point for how
many days are needed for the diver based solution to become the same cost as the diver less.
Diver based solution Diver less solution
Total HW cost 107,0 158,7
Days required to complete tie-in 18,1 25,7
Total installation cost 62,2 44,6
Total cost 169,2 203,3
Installation in % of total cost 37 % 22 %
HW cost in % of total cost 63 % 78 %
68
In figure 5.5 at 31 days, the diver based solution has a cost of approximately 205 MNOK. As
this is an increase in 13 days of installation time, it is highly unlikely that this will happen.
For the diver less solution to be the same total cost as the diver less, with the installation time
being kept constant, the HCS connectors have to be changed to 5 MNOK. This will result in
having a diver less solution at the total cost of 170 MNOK which is approximately the same
as the diver based solution. The installation time will still be the same, only the cost will be
lower.
If the tie-in time for diver less can become more efficient, by optimizing the spools for faster
transporting time or by redesigning structures so that the installation of spools and other tie-in
products goes faster, the HCS connector with a cost of 5,5 MNOK may be profitable as well.
5.5 End discussion
Both the cases have been valuable in comparing these two solutions. The cost analysis have
shown that they are on to something. Especially the cost analysis regarding Johan Sverdrup
points towards that the diver based solution is clearly the most cost effective, something that
Statoil has said as well. The case regarding Bream is presenting a cost saving of
approximately 5 MNOK by choosing the diver based solution. Premier Oil did a simplified
cost saving analysis on the Bream field themselves, and the result was 10 MNOK savings by
using divers. However they later found out that diver vessels were more expensive than they
had calculated. There are probably some estimates in my model that are not entirely correct,
and there are probably a lot more factors involved that I have excluded in my simplified
model. As the difference in this case is so low compared to Johan Sverdrup I can still
understand why Premier Oil went for a diver less solution on Bream. Contracts that improve
the cost savings of one solution may exist that I am not aware of. A lot of information is
classified as I mentioned earlier.
The MCDA analysis that is done and presented is discussed in 5.2 and 5.4 can be said to show
that the “hardware cost”, “installation cost” and “time usage” are the most important criteria
for an operator. All of these criteria are quantitative. Statoil mentioned that they have 3 main
factors as their strategy. These are (Hordnes 2015):
Safety
Effectivity
Cost

69
If HSE is satisfied, which it normally is if the company follows all the rules and guidelines
that are set, then the cost and effectiveness is what defines the solution. As effectiveness can
be said to be included in the “time usage” and in the “installation cost”, I consider my results
to be fairly as I expected. The time usage can be said to be a variable of the installation cost,
and I will therefore consider “installation cost” and “hardware cost” to be the two major
factors regarding what decision to choose. Table 5.12 and table 5.13 shows a pros and cons
table that shortly summarizes all the pros and cons about the these two factors.
Table 5.12: Pros & cons for hardware cost
Hardware
Diverless Diver assisted
Pros • Reliable • Can be automated/remotely controlled
• Standardized hardware. • Tools standardized. • Light structures • Less expensive flanges. • Shorter lead-time
Cons
• Expensive connectors and tooling. • Higher lead-time on structures (longer delivery time for HCS)
• Divers require additional safety structures (platform etc.)

70
Table 5.13: Pros & cons for installation and operation
6 Conclusion Determine what factors are deciding for the operator when they decide whether to go for a
diver less solution or a diver based solution.
By analyzing and discussing the two solutions at Bream and Johan Sverdrup I can conclude
that there are indeed multiple variables that play a role when the operator has to decide
between diver based tie-in system or a diver less one. The most important factors are the
hardware cost and the installation cost. The hardware cost can be broken down to several sub
factors such as:
Cost of tie-in connectors/flanges
Number of spools
Number of connectors
Hardware will ultimately also affect the installation time, as an increase in number of spools
also increases the installation time and thereby increases installation cost. One additional rigid
Installation and operation
Diverless Diver assisted
Pros
• Lots of vessels available. • Less HSE/planning cost related • Lower vessel rate per day • Installation can go on for a long time without breaks
• Easy to solve challenges that arise during installation. • Divers can do a lot of work while they are in the water. • Simple spool installation • Higher Hs tolerance • Divers can install diver less technology
Cons
• Spools are large and massive; require crane and maybe several trips back and forth to transport them. • ROVs require special tooling. Especially when there are large expansion forces. • Longer lead-time if something goes wrong (and new parts are required) • More complex installation of spools
• Expensive installation rates • Extensive HSE measures for the divers that work subsea. • Relies on divers being available for working • Availability of DSV and other diver vessels are slightly lower than their counterpart OCV.

71
spool increases the vessel time by at least one day each way for a diver less vessel, while only
six hours for a diving vessel. Both Bream and Johan Sverdrup had a lower total cost with the
diver based tie-in solution. Bream was unexpected, as Premier Oil has chosen a diver less
system, which implies there are some other factors that have an impact on the decision. Statoil
will achieve a saving of 34 MNOK by choosing diver based tie-in solution on Johan Sverdrup
An operator has to decide between if they want to have a higher starting cost and then a low
cost for installing or the opposite, a low starting cost and high installation cost.

72
7 Evaluation and future work There are many improvements that can be made to the models used in this thesis. A large
amount of the quantitative data used in the case regarding Johan Sverdrup is estimated at best,
and realistic data should be used in this model as soon this data becomes available (should
happen in Q3-Q4 2015).
The different models used in this thesis have only taken into account the factors that are
regarded as the most important ones when deciding what solution to go for. There are smaller
factors behind a simple “HW cost” that should be interesting to look into. Some smaller
factors one should look into are:
Structural design
o Cost, weight and size of the various structures used for a tie-in process.
Technology wanted in the project
o How automated should the operation be, what technology is desired and what
is necessary
The lead time for various structural parts necessary for a tie-in operation
The installation time that is used in this thesis is simplified, and is another factor that can be
measured in much greater detail and applied to the model. It is possible to measure the exact
time in hours needed, and applied for greater accuracy. There are also several improvements
that can be made to make the tie-in go faster and smoother, such as performing several tie-ins
simultaneously.
Additionally I suggest that Aker Solution looks into the technology of a diver assisted
solution and learn more about this technology. Throughout the analysis I have understood that
future risk is a topic that is very important for both an operator and a SPS contractor. In this
market one cannot plan for more than a couple years ahead. Statoil have stated that they plan
for about 5 years ahead when deciding what to do (Jørgensen 2015). The market is changing,
and it is difficult, if not impossible to foresee how drastically the market can change. A great
example is the change we are in now, with the much lower oil price and the supply that
exceeds the demand.
One statement from Statoil that I suggest Aker to think about is the following quote from
Roar Jørgensen in Statoil:

73
“The company that comes up with an universal method of performing a tie-in and that can
use both divers and ROVs will win contracts in the future. This will lower the risk in the
projects, and therefore the cost aspect will benefit from this.”
(Jørgensen 2015)
A solution that benefits from the cheap hardware the divers have and the availability and the
installation cost of a diver less solution, will probably be the new and “better” technology in
the future.
This thesis have only looked into two fields in the North Sea. It would be interesting to make
a study like this use multiple fields across the globe, to see if factors differ over the world. If
one is to do a study like this on the global market, there has be several limitations applied. I
would suggest to keep the variables to a minimum at first, and try see if the same parameter
differs overall.
Throughtout my work on this thesis I have come across several people that suggested that the
amount of spools are a factor that I should look into. Unfortunately, I did not have time to
analyze this any further. A interesting topic would be to see if there is a spool amount that can
act as the “break-even” between diver based and diver less solutions. That is if everything else
is static for both solutions. An example to look into would be if the spool amount is 15 or
lower, and the HCS system can be a 12” or 14”.

74
8 References
AF Global Corp. Available at: http://afglobalcorp.com/taperlok/?q=flange-assemblies (accessed: 23.04.).
Ainsworth, T. Significant Wave Height. Available at: http://www.mxak.org/weather/pdfs/waves.pdf (accessed: 13.06.).
Aker Solutions. Clamp Connectors (accessed: 03.06.). Aker Solutions. (2012). Aker Solutions signs contract with McDermott
subsidiary. Available at: https://www.akersolutions.com/Global/Media/images/Ichthys_TieInConnector_320.jpg (accessed: 12.06.2015).
Aker Solutions. (2013a). ROV Intervention Requirements. Aker Solutions. (2013b). ROV Intervention Requirements AKER
STANDARD. Aker Solutions. (2014a). Diver assisted tie-in vs HCS. 18 pp. Aker Solutions. (2014b). Presentation of tie-in technology for summer
interns 2014 (25.06.2014). Aker Solutions. (2015). Meeting with Aker regarding status on thesis
and last input. (02.06.2015). Andresen, E. (2015). Spools - installasjonstid (04.06.2015). Balkøy, S. (2015). ROV-operations. BG Norge. (2012). Plan for utbygging og drift av PL 407 Bream Del 2 -
Konsekvensutredning. (1): 75. Brandeggen, J. (2015). Johan Sverdrup - Diver/Diverless litt info (E-mail
27.02.2015). Bryman, A. (2012). Social research methods. 4th ed. Oxford ; New
York: Oxford University Press. xli, 766 p. pp. Burton, W. C. (2007). Ex post facto. Available at: http://legal-
dictionary.thefreedictionary.com/ex+post+facto (accessed: 16.04.).
Clausen, T. (2015). Interview with Terje Clausen regarding divers, diving market, tie-in operations (06.06.2015).

75
Cohen, D. & Crabtree, B. (2006). Qualitative Research Guidelines Project. Available at: http://www.qualres.org/HomeInte-3595.html (accessed: 25.05.).
Cross, E. R. Commercial Diving; And how deep is deep? Available at: http://www.skin-diver.com/departments/crosstalk/commdiving.asp?theID=150 (accessed: 10.03.2015).
Finlayson, R. (2015). Diver vs diverless tie-in on Bream (05.06.2015). FMC Technologies. Subsea Tie-in Systems. fmctechnologies.com. Freudenberg Oil & Gas Technologies. SPO-S CF : the standard of
subsea flanges. Available at: http://www.vectortg.com/spo-subsea-flanges/?style=264 (accessed: 13.06.).
Guitouni, A. & Martel, J.-M. (1998). Tentative guidelines to help choosing an appropriate MCDA method.
Hiemeyer, P. (2015). Conversation regarding divers and reasons to why choose diver-assisted (04.06.2015).
Hordnes, C. (2015). Conversation regarding HSE and divers (12.06.2015).
Hughes, R. T. (1996). Expert judgement as an estimating method. 6. iTech 7. (2015). Observation class ROVs. Available at:
http://www.interventiontechnology.com/en/technology-and-assets/observation-class-rovs/ (accessed: 13.06.).
Jørgensen, R. (2015). Conversation regarding divers vs diverless (25.05.2015).
Kjølleberg, E. & Falch-Nilsen, K. (2013). Pionértiden var «vill vest»: NRK. Available at: http://www.nrk.no/fordypning/_-pionertiden-var-_vill-vest_-1.11197916 (accessed: 07.04.).
Kothari, C. R. (2011). Research methodology: methods and techniques. 2nd ed.: New Age International.
Lundin-Petroleum. Development: Norway - Johan Sverdrup. Available at: https://www.lundin-petroleum.com/eng/Development_JohanSverdrup.php (accessed: 24.03.2015).

76
Lundin-Petroleum. Norway - Johan Sverdrup. Available at: https://www.lundin-petroleum.com/eng/johansverdrup.php (accessed: 24.03.2015).
Macrotrends.net. (2015). Crude Oil Price History Chart. www.macrotrends.net.
Mørk, T., Mathisen, L. & Pedersen, M. (2015). Phone meeting with Aker Solutions and Subsea7. Oslo (27.01.2015).
Nayar, M. L. (2000). Piping Handbook. 7th ed. NC State University. Multi-Criteria Decision Analysis. Available at:
http://www.ncsu.edu/nrli/decision-making/MCDA.php (accessed: 20.05.).
Offshore Technology. Bream Area Project, Central North Sea, Norway. www.offshore-technology.com. Available at: http://www.offshore-technology.com/projects/bream-area-project-central-north-sea/ (accessed: 19.03.2015).
Offshore Technology. Bream Area Project, Central North Sea, Norway. Available at: http://www.offshore-technology.com/projects/bream-area-project-central-north-sea/bream-area-project-central-north-sea1.html (accessed: 23.03.).
Offshore.no. (2015). Gir inntekter for generasjoner. Available at: http://www.offshore.no/sak/63710__gir_inntekter_for_generasjoner (accessed: 21.05.2015).
OSTS. Flange CAPT. Available at: http://osts.com.au (accessed: 13.06.2015).
Premier Oil. (2014). Plan for Utbygging og Drift av Bream - Del 2 Konsekvensutredning. 93.
PSE Global Recruitment. ROV and Subsea News. Available at: http://www.pserecruitment.com/about-us/subsea-rov-articles/ (accessed: 13.06.).
Rasmussen, I.-A. (2014). Spool installation. Rimmereid, L. (2015). HCS og connectorer på Bream (14.04.2015). ROV Committee of the Marine Technology Society. ROVs - A BRIEF
HISTORY. Available at: http://www.rov.org/rov_history.cfm (accessed: 25.03.2015).

77
ROV Committee of the Marine Technology Society. What is an ROV? Available at: http://www.rov.org/rov_overview.cfm (accessed: 25.03.2015).
SAFE i Statoil. (2013). Informasjon uke 37. Available at: http://www.safeistatoil.no/index.cfm?id=404313 (accessed: 24.03.2015).
Silverman, D. (2011). Interpreting qualitative data : a guide to the principles of qualitative research. 4th ed. Los Angeles: Sage. xv, 500 p. pp.
Smith, J. L. (2009). The 2008 Oil Price Shock: Markets or Mayhem? Standards Norway. (1998). Subsea Intervention Systems: Standards
Norway,. Standards Norway. (2014). NORSOK Standard U-100 Manned
Underwater Operation. Statoil. (2013). Johan Sverdrup extends into new license. Available at:
http://www.statoil.com/en/NewsAndMedia/News/2013/Pages/19Mar_JohanSverdrup.aspx (accessed: 24.03.2015).
Statoil. (2014). Johan Sverdrup-feltet PL265, PL501, PL501B og PL501B
PUD del II - Konsekvensutredning
November 2014. 144 pp. Statoil. (2015). Submitting the development plan for Johan Sverdrup.
Available at: http://www.statoil.com/en/NewsAndMedia/News/2015/Pages/13Feb_JS_PUD.aspx (accessed: 15.05.2015).
Subsea 7. (2014, 24.09.2014). Aker Solutions Diving Presentation. Subsea 7 & Aker Solutions. (2015). (09.03.2015). Subsea. (2015). Functional Requirements Subsea Facilities. Undrum, A. (2015). Kostnadskalkyler og informasjon rundt HCS. WTRG Economics. Oil Price History and Analysis. Available at:
http://www.wtrg.com/prices.htm (accessed: 03.05.).

78
Appendix 1
Qualitative data collected and used in the calculations:
ROV vessel rate
ROV tie-in installation
time Diver vessel rate Diver installation time
Aker Solutions 1,5 - 2,5 Approx 15h for 12" More than ROV vessel No quantitative data
Emas 1 No quantitative data 3 No quantitative data
Subsea 7 1 - 1,2 Spools are a factor 1,7 - 3 75% of the time ROV uses
Technip Approx 1,7 HCS spool one side: 12h Approx 3 1/3 of the time an ROV uses
Premier Oil 3 (UK sector) 5% slower than divers 4 (UK sector)
Due to higher Hs allowance:
5% faster than ROV
Statoil 1 - 1,5 No quantitative data 2 - 3 No quantitative data
Diver assisted dataDiver less data

79
Appendix 2 Calculations regarding Bream
Time usage for diver based solution:
Time usage for diver less solution:
Avg time HCS tie-in: 0,3 days
Get to field 0,5 days
Deco time 0 days
Antall connections 20
Transport spools. 1 dag - en vei 10 days
Installation days 6,8 days
Transport spools: 10
Installation time 16,8 days
Additional 5% for Hs height 17,6 days
Avg time tie-in (75% of the time of HCS tie-in): 0,25 days
Get to field and dive to work depth: 5 days
Deco time and transport to shore: 5 days
Number of spools: 15
Flanges 32
Total time installing 8 days
Time collecting spools 7,5 days
Total installation time: 25,5 days

80
Appendix 3
Calculations regarding Johan Sverdrup:
Time usage for diver less:
Time usage for diver based solution:
Avg time HCS tie-in: 0,3 days
Get to field 0,5 days
Deco time 0 days
Number of connections (Tie-in) 22
Transport spools (1 day each way) 8 spools 16 days
Installation days 24,5 days
Additional 5 % for Hs height 25,7 days
Avg time tie-in (75% of the time of ROV tie-in) 0,25 days
Get to field and dive to work depth 5 days
Deco time and transport to shore 5 days
Number of spools 8
UTA tie-in Included in above time
HCM tie-in Included in above time
Days tie-in 4,07
Transport spools. Smaller DSV. 1 day - one way 4 days
Total days 18,07

81
Appendix 4 Standardized interview guide with a listing of the people that have provided me with data:
Aker Solutions: Lars Rimmereid (Tie-in), Atle Undrum (Tender), Haakon Dolven (Tender), Therese
Mørk (Tender), Jon Brandeggen (Tie-in), Ståle Balkøy (ROV), Christopher Knudzon (Tie-in) and
Martin Pedersen (Tie-in).
Technip: Pernille Hiemeyer, Even Andresen,
Subsea 7: Terje Clausen
EMAS: Halvor Tveito
Statoil: Magnar Birkeland, Roar Jørgensen, Cato Hordnes
Premier Oil: Ron Finlayson
PTIL: Olav Hauso, Tor Gunnar Dale
Standardized interview guide where I decided what topics we should discuss
Topics:
Cost regarding to installation
o Vessel rates
o Mob/demob
o Time usage
o Installation time
o Weather window
o Availability
Cost related to hardware
o Type of hardware
o Metrology
o Standardized equipment
HSE
o Safety
o Health risks
Technical
o HCS
o ITS
o Diver flanges
o ROV tools
o Tie-in systems
o Clamp Connector
Market
o Competition in the market
o Oil price and the effects
o Technology evolution
The interview subjects thoughts on the thesis problem
o Thoughts
o Opinions

82
Appendix 5 Calculation provided by Aker Solution on their technology:
Cost Assumptions HW Cost
Hardware prices for HCM are based on JS Base case.
Hardware prices for 16" and 12" HCS is based on generic Costbase with same markup as JS BC
Insert quantities where neccessary
0
Cost Assumptions Tooling Cost
Only Procurement cost for Tooling included
Cost for Tooling based on generic Cost base
Least neccessary quantities included
Revenue per Connector Calculation
12" HCS
HW Cost 32,8 MNOK
Insulation - MNOK
Additional Cost 12,32 MNOK
Total connector costs 45,16
ROV Tooling 1,5 MNOK
Manhours 15 %
Other costs 10 %
Number of connectors 22 QTY
Total revenue 58,3 MNOK
Revenue per Connector 2,7 MNOK
Assumed revenue per connector 3,0 MNOK
Only selected tooling is included, profit included
16" HCS
HW Cost 69,0 MNOK
Insulation - MNOK
Additional Cost 25,89 MNOK
Total connector costs 94,92
ROV Tooling 13,9 MNOK
Manhours 15 %
Other costs 10 %
Number of connectors 22 QTY
Total revenue 136,0 MNOK
Revenue per Connector 6,2 MNOK
Assumed revenue per connector 6,5 MNOK
Only selected tooling is included, profit included

83
12" HCM
HW Cost 27,0 MNOK
Insulation - MNOK
Additional Cost 10,14 MNOK
Total connector costs 37,17
ROV Tooling 7,7 MNOKManhours 15 %
Other costs 10 %
Number of connectors 12 QTY
Total revenue 56,1 MNOK
Revenue per Connector 4,7 MNOK
Assumed revenue per connector 5,0 MNOK
Only selected tooling is included, profit included

Postboks 5003 NO-1432 Ås, Norway+47 67 23 00 00www.nmbu.no