Embed Size (px)
Citation preview

International Journal of
Environmental Research
and Public Health
Article
Predictors for Clinical Outcomes Related to Upper ExtremityMusculoskeletal Disorders in a Healthy Working Population
Oliver Lotter 1,* , Tobias Lieb 2, Jochen Molsner 3 and Viktor Breul 4
�����������������
Citation: Lotter, O.; Lieb, T.; Molsner,
J.; Breul, V. Predictors for Clinical
Outcomes Related to Upper
Extremity Musculoskeletal Disorders
in a Healthy Working Population. Int.
J. Environ. Res. Public Health 2021, 18,
9171. https://doi.org/10.3390/
ijerph18179171
Academic Editor: César Fernández
De Las Peñas
Received: 11 May 2021
Accepted: 26 August 2021
Published: 31 August 2021
Publisher’s Note: MDPI stays neutral
with regard to jurisdictional claims in
published maps and institutional affil-
iations.
Copyright: © 2021 by the authors.
Licensee MDPI, Basel, Switzerland.
This article is an open access article
distributed under the terms and
conditions of the Creative Commons
Attribution (CC BY) license (https://
creativecommons.org/licenses/by/
4.0/).
1 Department of Plastic, Aesthetic, Hand and Reconstructive Surgery, Academic District Hospital,Zeppelinstrasse 21, 78532 Tuttlingen, Germany
2 Office for Occupational and Hand Therapy, Neuhauser Strasse 85, 78532 Tuttlingen, Germany;[email protected]
3 IAS-Group for Occupational Health Management, Koenigstrasse 6, 78532 Tuttlingen, Germany;[email protected]
4 Department of Medical Scientific Affairs, Aesculap AG, Am Aesculap Platz, 78532 Tuttlingen, Germany;[email protected]
* Correspondence: [email protected]; Tel.: +49-7424-950-4491; Fax: +49-7424-950-4499
Abstract: A wide range of endpoints and methods of analysis can be observed in occupational healthstudies in the context of work-related musculoskeletal disorders (WMSDs). Comparison of studyresults is therefore difficult. We investigated the association between different clinical endpoints andthe presence of upper extremity WMSDs in a healthy working population. Furthermore, the influenceof socio-demographic, work-related, and individual predictors on different endpoints was examined.Two self-administered questionnaires were distributed to 70 workers and employees. In addition,a standardized physical examination and an industry test were performed in this cross-sectionalstudy. Correlations between WMSDs and clinical endpoints were analyzed with the Spearmanmethod and prediction ellipses. Multiple regression models were used to study the strength ofassociations with a pre-defined set of potential influencing factors. The prevalence of WMSDs was56% (39/70). Disabilities of Arm, Shoulder, and Hand (DASH) score/pain under strain showedthe strongest correlations with WMSDs. When analyzing the correlation between WMSDs andpre-selected predictors, none of the predictors could be identified as a risk factor. The DASH scoreremains a close candidate for best surrogate endpoint for WMSDs detection. Standardized analysismethods could improve the methodological quality of future occupational health studies.
Keywords: work-related musculoskeletal disorders (WMSDs); upper extremity; repetitive work; sur-gical device mechanics; DASH score; Purdue Pegboard Test; multiple analysis; correlation; predictors
1. Introduction
Work-related musculoskeletal disorders (WMSDs), also known as cumulative traumadisorders (CTD), repetitive strain injuries (RSI), or occupational overuse syndromes (OOS),account for more than 48% of work-related disorders [1,2]. The overall global prevalencefor such conditions ranges from 4.0% to 30%, increasing with age, and the annual preva-lence lies between 0.14% and 14.9% across different industries and work processes [3–6].Treatment costs for WMSDs are estimated at 1.3% of the US gross national product andbetween 0.5% and 2.0% in Scandinavian countries [7,8].
WMSDs are of multifactorial origin. The work environment contributes significantlyto the condition and/or the condition is aggravated by the work activity [9]. Such dis-orders are caused by the accumulation of microtraumatic events in the musculoskeletalsystem over a long period of time and represent a broad spectrum of inflammatory anddegenerative diseases, jeopardizing the quality of life and functional capacity of thoseaffected [10,11]. They are a significant occupational health problem among industrial andclerical workers with a strong medical, economic, and social impact in terms of absences
Int. J. Environ. Res. Public Health 2021, 18, 9171. https://doi.org/10.3390/ijerph18179171 https://www.mdpi.com/journal/ijerph

Int. J. Environ. Res. Public Health 2021, 18, 9171 2 of 15
due to sickness and early retirement, cost of medical care, low productivity, and personalsuffering [12]. These disorders represent one of the greatest work-related challenges of ourtime, and they have a great impact on individuals and society.
Various physical/biomechanical (e.g., repetitive hand motion), psychosocial (e.g.,decision latitude at work), organizational (e.g., night shifts), and genetic (e.g., gender)factors have been linked to the development of WMSDs in numerous occupational settingsand specific industries [13–15]. Studies to date have only been able to consider some ofthese factors simultaneously, making it difficult to build a closed picture of the interactionsbetween them [16].
The aim of this analysis was to investigate the association between the presence ofupper extremity WMSDs in a healthy working population and different clinical endpointsthat are likely to be measured in the clinical routine. Usually, these endpoints only representmore or less useful surrogates for an actual health problem, whose roles should be moreclearly determined in order to improve the efficiency of the research. This analysis is alsointended to investigate a set of potentially predisposing socio-demographic, work-related,and individual characteristics (“risk factors” or “predictors”) for WMSDs and relatedclinical endpoints.
2. Materials and Methods2.1. Study Population
The study was conducted at the headquarters and main production site of AesculapAG, Tuttlingen, Germany, with about 3500 workers and employees. This company is theworld market leader in the field of surgical instruments. The study population was dividedinto three groups based on their occupational activities: group I = grinding and polishing,characterized by repetitive and forceful exertions (“grinding”), group II = inspection andpackaging, characterized by repetitive exertions without force (“packaging”), and groupIII = all other white-collar and blue-collar employees as a cross-section of the companywithout exposure to grinding or packaging as a control group (“control”). Approval ofthe study was obtained from the Ethics Committee of the Baden-Wuerttemberg MedicalAssociation, Jahnstrasse 40, 70597 Stuttgart, Germany (project number F-2017-005).
2.2. Study Design and Data Collection
Random samples of active white-collar and blue-collar workers were drawn fromthe three groups using statistic software and were recruited between September 2017 andMarch 2018. No incentives were offered, and participation decision was met voluntarily oninvitation by signing the informed consent. The following eligibility criteria were appliedaccording to our previous publication [17]: Age < 18 or > 65 years; employment in therespective workplace for less than 5 years; currently not on sick leave; no absence fromwork due to upper extremity pain for more than 2 weeks within the last 3 months; andnone of the following conditions: cervical spine syndrome or herniated intervertebraldisc, shoulder pain radiating into the forearm, debilitating congenital malformation of theupper extremity, rheumatoid conditions including fibromyalgia, previous upper extremitysurgery due to nerve entrapment syndrome(s), and/or chronic musculoskeletal disorders,such as tennis elbow; golfer’s elbow; or tenosynovitis of the flexor and/or extensor tendons,including trigger finger and de Quervain’s disease, and three or less unanswered items inthe DASH disability/symptom questionnaire.
The participants were asked to fill in two standardized, self-administered question-naires. The first questionnaire obtained demographic and personal data, considered aspredictors in the analyses, such as sex, handedness, secondary occupation, sporting andphysical hobbies, age, height and weight (body mass index), employment level, and yearsof service. Participants completed the questionnaires at the company’s health centerindependently and without assistance.

Int. J. Environ. Res. Public Health 2021, 18, 9171 3 of 15
2.3. Clinical Endpoints and Signs for WMSDs2.3.1. Disabilities of the Arm, Shoulder, and Hand (DASH) Score
As a second questionnaire, the validated DASH outcome measure was applied to as-sess physical function and symptoms [18,19]. The results of this 30-item questionnaire wereused to calculate a scale score ranging from 0 (no disability) to 100 (most severe disability).
2.3.2. Visual Analog Scale (VAS)
VAS is an instrument to measure the intensity of pain [20]. A Likert scale between 0(no pain) and 10 (maximal pain) was used to collect the subjective evaluation for pain atrest and pain under strain in the form of a self-reporting measure. Results for pain at restand pain under strain were analyzed as independent continuous endpoints.
2.3.3. Range of Motion (ROM)
ROM measurements of active wrist joint mobility of both hands were performed usinga goniometer in the three planes extension/flexion (E/F), supination/pronation (S/P),and ulnar/radial abduction (U/R). The measurements were recorded according to theneutral zero method [21]. The overall ranges in degrees were calculated for each plane. Theprimary/non-primary hand and the plane were considered as repeated measures variablesin variance analyses.
2.3.4. Grip Strength
Grip strength is the measurement of the maximum hand force using the Jamar dy-namometer in three consecutive passes per side [22]. The measurement unit is kg. Theprimary/non-primary hand and the consecutive pass number were also considered asrepeated measures variables. Grip strength is the accepted method of measuring the grossmotor skills of the hand.
2.3.5. Purdue Pegboard (PPB) Test
The neurophysiological PPB Test was performed to determine the dexterity of theparticipants [23]. As a former industrial test, it now serves primarily to assess disabilitiesand limitations. The pegboard consists of a board with two parallel rows of 25 holes, intowhich cylindrical metal pegs are placed by the examinee. The test involves a total of fourtrials [24]. The subsets for preferred, non-preferred, and both hands require the test personto place the pins in the holes as quickly as possible, with the score being the number of pinsplaced in 30 s. Purdue Pegboard trial number four was chosen as the representative clinicalendpoint as it summarizes trial numbers 1 to 3 well by adding them up, and thereforeshould show the potential differences more clearly.
2.3.6. Subjective Complaints
The presence of subjective complaints regarding the upper extremities of a test personwas assessed in the form of a yes/no type of self-reported question. Subjects were askedabout general complaints (pain, restriction of movement, and/or numbness of the upperextremity) with the request for differentiation into complaints of the elbow, forearm, wrist,and/or hand [25].
2.3.7. Clinical Signs of Work-Related Musculoskeletal Disorders
Musculoskeletal diagnoses were measured via a structured physical examinationof the elbow, forearm, wrist, and hand by one single hand surgeon. The examiner wasblinded to the questionnaire responses of the test persons. The diagnoses of De Quervain’stenosynovitis, lateral epicondylitis, and nerve entrapment syndromes, including carpaltunnel syndrome (median nerve), cubital tunnel syndrome (ulnar nerve), and Guyon’scanal syndrome (ulnar nerve) were made based on pathognomonic clinical signs forupper extremity pathologies, after selection by a multidisciplinary team consisting of anoccupational physician, hand surgeon, and occupational therapist [23]. These included
Int. J. Environ. Res. Public Health 2021, 18, 9171 4 of 15
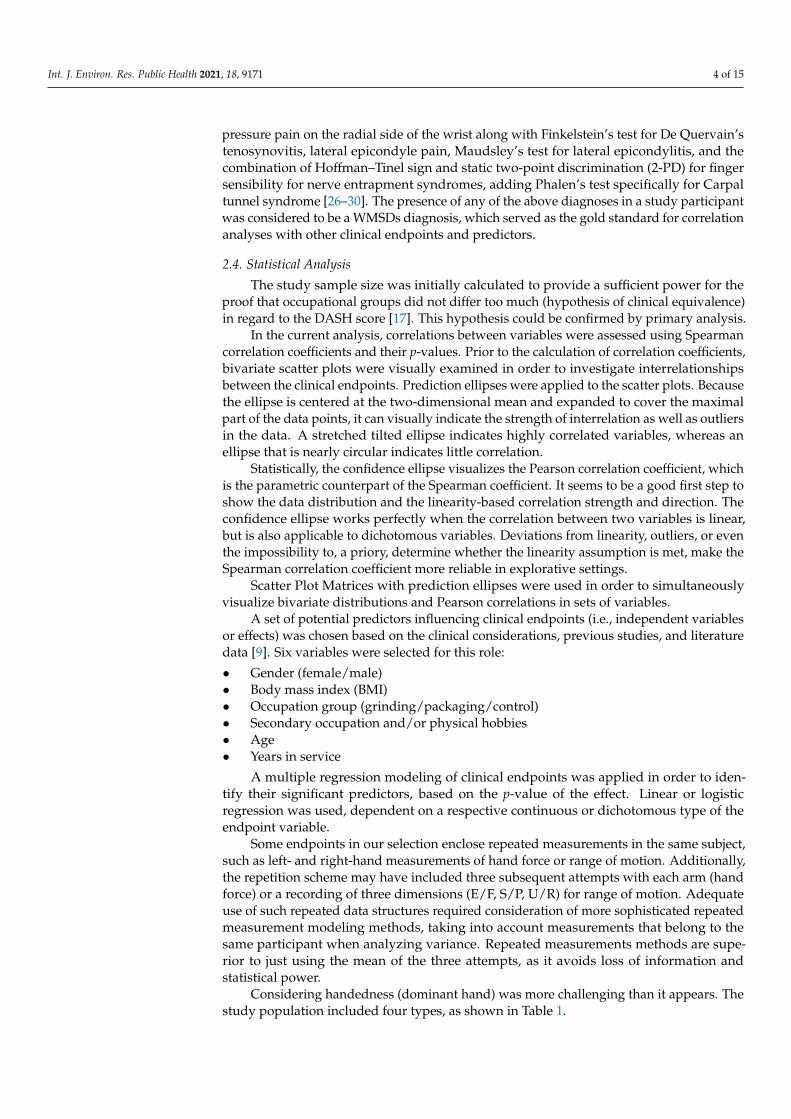
pressure pain on the radial side of the wrist along with Finkelstein’s test for De Quervain’stenosynovitis, lateral epicondyle pain, Maudsley’s test for lateral epicondylitis, and thecombination of Hoffman–Tinel sign and static two-point discrimination (2-PD) for fingersensibility for nerve entrapment syndromes, adding Phalen’s test specifically for Carpaltunnel syndrome [26–30]. The presence of any of the above diagnoses in a study participantwas considered to be a WMSDs diagnosis, which served as the gold standard for correlationanalyses with other clinical endpoints and predictors.
2.4. Statistical Analysis
The study sample size was initially calculated to provide a sufficient power for theproof that occupational groups did not differ too much (hypothesis of clinical equivalence)in regard to the DASH score [17]. This hypothesis could be confirmed by primary analysis.
In the current analysis, correlations between variables were assessed using Spearmancorrelation coefficients and their p-values. Prior to the calculation of correlation coefficients,bivariate scatter plots were visually examined in order to investigate interrelationshipsbetween the clinical endpoints. Prediction ellipses were applied to the scatter plots. Becausethe ellipse is centered at the two-dimensional mean and expanded to cover the maximalpart of the data points, it can visually indicate the strength of interrelation as well as outliersin the data. A stretched tilted ellipse indicates highly correlated variables, whereas anellipse that is nearly circular indicates little correlation.
Statistically, the confidence ellipse visualizes the Pearson correlation coefficient, whichis the parametric counterpart of the Spearman coefficient. It seems to be a good first step toshow the data distribution and the linearity-based correlation strength and direction. Theconfidence ellipse works perfectly when the correlation between two variables is linear,but is also applicable to dichotomous variables. Deviations from linearity, outliers, or eventhe impossibility to, a priory, determine whether the linearity assumption is met, make theSpearman correlation coefficient more reliable in explorative settings.
Scatter Plot Matrices with prediction ellipses were used in order to simultaneouslyvisualize bivariate distributions and Pearson correlations in sets of variables.
A set of potential predictors influencing clinical endpoints (i.e., independent variablesor effects) was chosen based on the clinical considerations, previous studies, and literaturedata [9]. Six variables were selected for this role:
• Gender (female/male)• Body mass index (BMI)• Occupation group (grinding/packaging/control)• Secondary occupation and/or physical hobbies• Age• Years in service
A multiple regression modeling of clinical endpoints was applied in order to iden-tify their significant predictors, based on the p-value of the effect. Linear or logisticregression was used, dependent on a respective continuous or dichotomous type of theendpoint variable.
Some endpoints in our selection enclose repeated measurements in the same subject,such as left- and right-hand measurements of hand force or range of motion. Additionally,the repetition scheme may have included three subsequent attempts with each arm (handforce) or a recording of three dimensions (E/F, S/P, U/R) for range of motion. Adequateuse of such repeated data structures required consideration of more sophisticated repeatedmeasurement modeling methods, taking into account measurements that belong to thesame participant when analyzing variance. Repeated measurements methods are supe-rior to just using the mean of the three attempts, as it avoids loss of information andstatistical power.
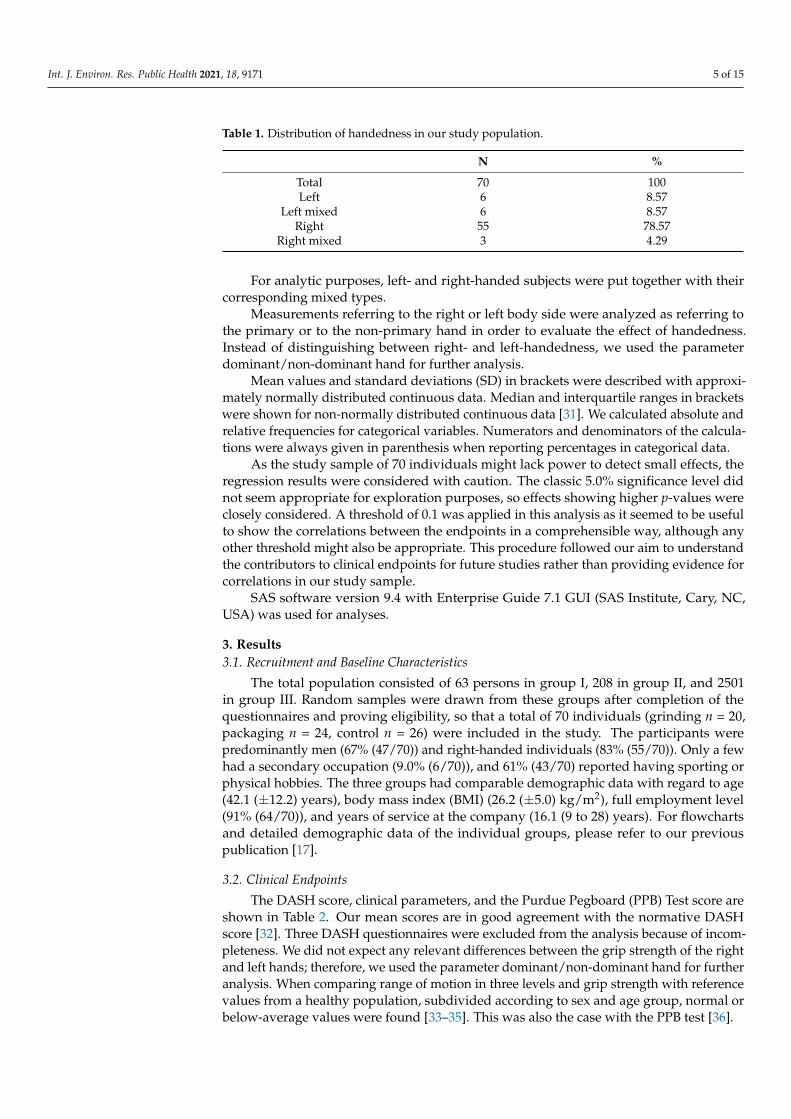
Considering handedness (dominant hand) was more challenging than it appears. Thestudy population included four types, as shown in Table 1.
Int. J. Environ. Res. Public Health 2021, 18, 9171 5 of 15
Table 1. Distribution of handedness in our study population.
N %
Total 70 100Left 6 8.57
Left mixed 6 8.57Right 55 78.57
Right mixed 3 4.29
For analytic purposes, left- and right-handed subjects were put together with theircorresponding mixed types.
Measurements referring to the right or left body side were analyzed as referring tothe primary or to the non-primary hand in order to evaluate the effect of handedness.Instead of distinguishing between right- and left-handedness, we used the parameterdominant/non-dominant hand for further analysis.
Mean values and standard deviations (SD) in brackets were described with approxi-mately normally distributed continuous data. Median and interquartile ranges in bracketswere shown for non-normally distributed continuous data [31]. We calculated absolute andrelative frequencies for categorical variables. Numerators and denominators of the calcula-tions were always given in parenthesis when reporting percentages in categorical data.
As the study sample of 70 individuals might lack power to detect small effects, theregression results were considered with caution. The classic 5.0% significance level didnot seem appropriate for exploration purposes, so effects showing higher p-values wereclosely considered. A threshold of 0.1 was applied in this analysis as it seemed to be usefulto show the correlations between the endpoints in a comprehensible way, although anyother threshold might also be appropriate. This procedure followed our aim to understandthe contributors to clinical endpoints for future studies rather than providing evidence forcorrelations in our study sample.
SAS software version 9.4 with Enterprise Guide 7.1 GUI (SAS Institute, Cary, NC,USA) was used for analyses.
3. Results3.1. Recruitment and Baseline Characteristics
The total population consisted of 63 persons in group I, 208 in group II, and 2501in group III. Random samples were drawn from these groups after completion of thequestionnaires and proving eligibility, so that a total of 70 individuals (grinding n = 20,packaging n = 24, control n = 26) were included in the study. The participants werepredominantly men (67% (47/70)) and right-handed individuals (83% (55/70)). Only a fewhad a secondary occupation (9.0% (6/70)), and 61% (43/70) reported having sporting orphysical hobbies. The three groups had comparable demographic data with regard to age(42.1 (±12.2) years), body mass index (BMI) (26.2 (±5.0) kg/m2), full employment level(91% (64/70)), and years of service at the company (16.1 (9 to 28) years). For flowchartsand detailed demographic data of the individual groups, please refer to our previouspublication [17].
3.2. Clinical Endpoints
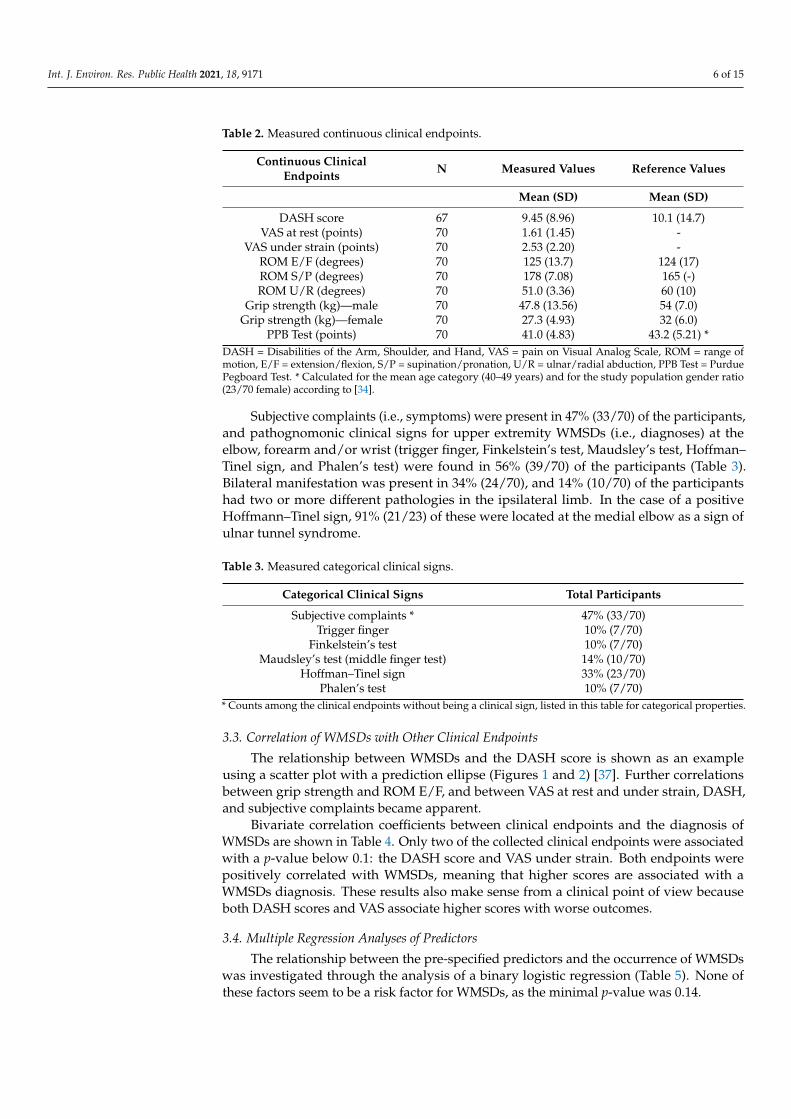
The DASH score, clinical parameters, and the Purdue Pegboard (PPB) Test score areshown in Table 2. Our mean scores are in good agreement with the normative DASHscore [32]. Three DASH questionnaires were excluded from the analysis because of incom-pleteness. We did not expect any relevant differences between the grip strength of the rightand left hands; therefore, we used the parameter dominant/non-dominant hand for furtheranalysis. When comparing range of motion in three levels and grip strength with referencevalues from a healthy population, subdivided according to sex and age group, normal orbelow-average values were found [33–35]. This was also the case with the PPB test [36].
Int. J. Environ. Res. Public Health 2021, 18, 9171 6 of 15
Table 2. Measured continuous clinical endpoints.
Continuous ClinicalEndpoints N Measured Values Reference Values
Mean (SD) Mean (SD)
DASH score 67 9.45 (8.96) 10.1 (14.7)VAS at rest (points) 70 1.61 (1.45) -
VAS under strain (points) 70 2.53 (2.20) -ROM E/F (degrees) 70 125 (13.7) 124 (17)ROM S/P (degrees) 70 178 (7.08) 165 (-)ROM U/R (degrees) 70 51.0 (3.36) 60 (10)
Grip strength (kg)—male 70 47.8 (13.56) 54 (7.0)Grip strength (kg)—female 70 27.3 (4.93) 32 (6.0)
PPB Test (points) 70 41.0 (4.83) 43.2 (5.21) *DASH = Disabilities of the Arm, Shoulder, and Hand, VAS = pain on Visual Analog Scale, ROM = range ofmotion, E/F = extension/flexion, S/P = supination/pronation, U/R = ulnar/radial abduction, PPB Test = PurduePegboard Test. * Calculated for the mean age category (40–49 years) and for the study population gender ratio(23/70 female) according to [34].
Subjective complaints (i.e., symptoms) were present in 47% (33/70) of the participants,and pathognomonic clinical signs for upper extremity WMSDs (i.e., diagnoses) at theelbow, forearm and/or wrist (trigger finger, Finkelstein’s test, Maudsley’s test, Hoffman–Tinel sign, and Phalen’s test) were found in 56% (39/70) of the participants (Table 3).Bilateral manifestation was present in 34% (24/70), and 14% (10/70) of the participantshad two or more different pathologies in the ipsilateral limb. In the case of a positiveHoffmann–Tinel sign, 91% (21/23) of these were located at the medial elbow as a sign ofulnar tunnel syndrome.
Table 3. Measured categorical clinical signs.
Categorical Clinical Signs Total Participants
Subjective complaints * 47% (33/70)Trigger finger 10% (7/70)
Finkelstein’s test 10% (7/70)Maudsley’s test (middle finger test) 14% (10/70)
Hoffman–Tinel sign 33% (23/70)Phalen’s test 10% (7/70)
* Counts among the clinical endpoints without being a clinical sign, listed in this table for categorical properties.
3.3. Correlation of WMSDs with Other Clinical Endpoints
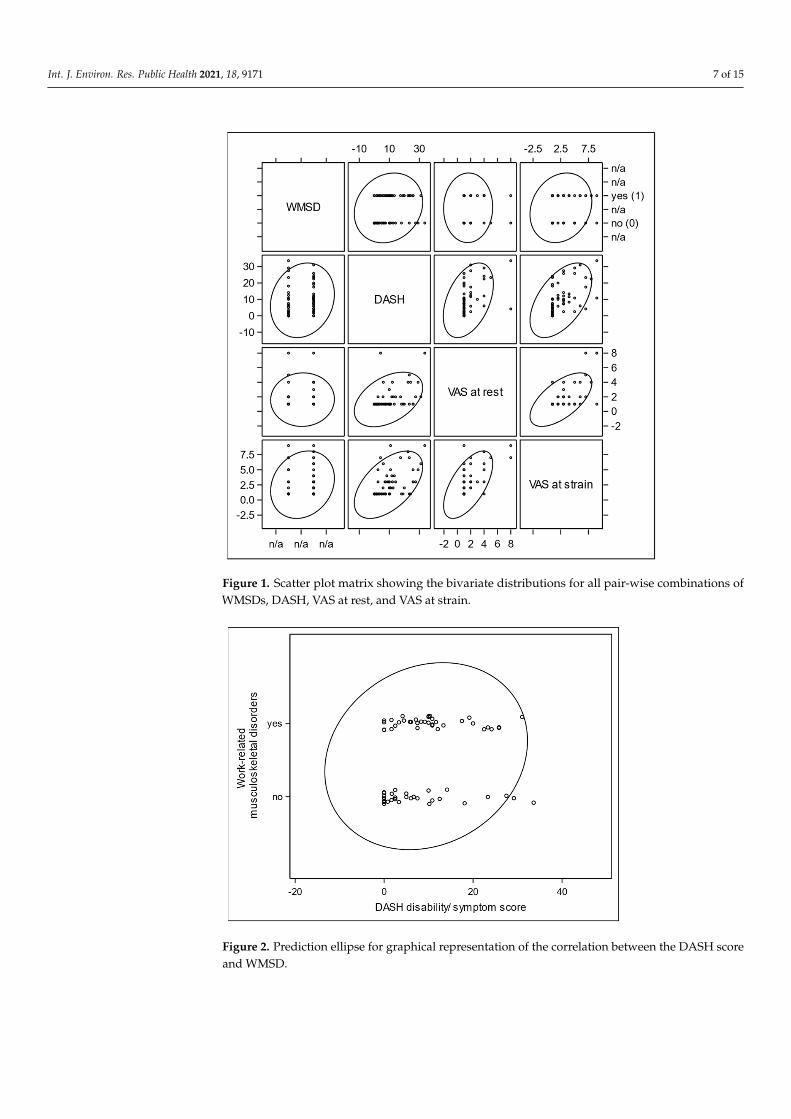
The relationship between WMSDs and the DASH score is shown as an exampleusing a scatter plot with a prediction ellipse (Figures 1 and 2) [37]. Further correlationsbetween grip strength and ROM E/F, and between VAS at rest and under strain, DASH,and subjective complaints became apparent.
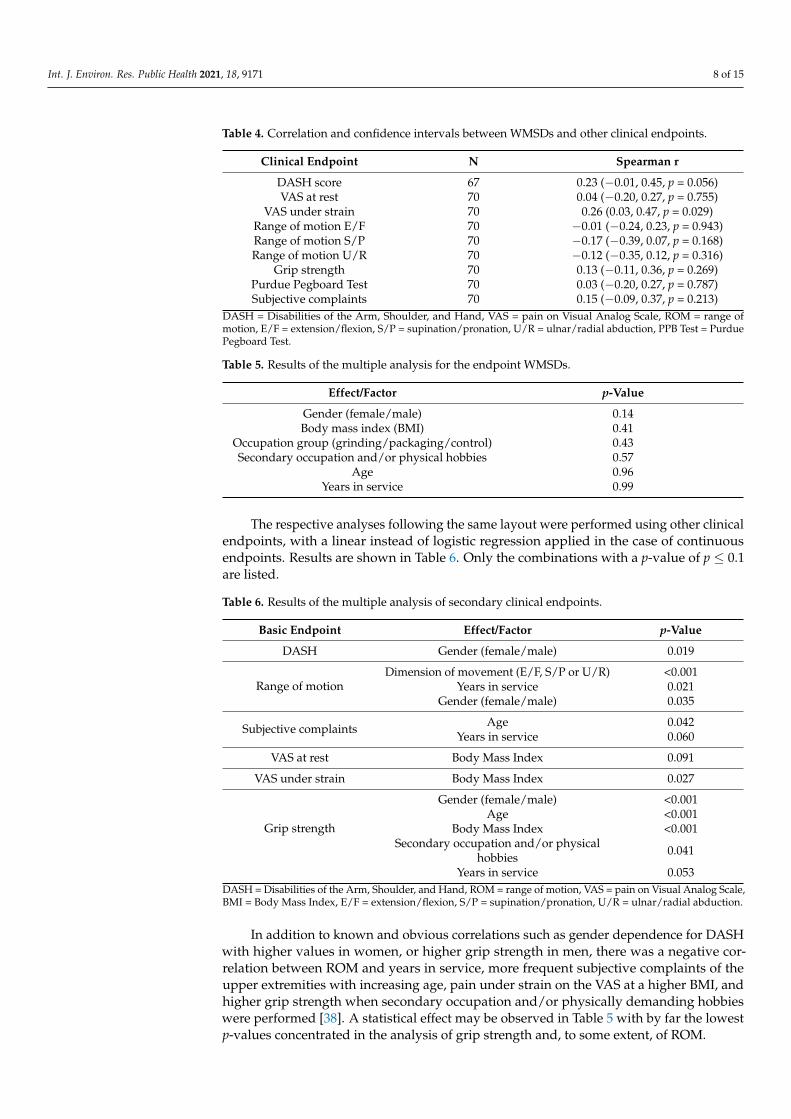
Bivariate correlation coefficients between clinical endpoints and the diagnosis ofWMSDs are shown in Table 4. Only two of the collected clinical endpoints were associatedwith a p-value below 0.1: the DASH score and VAS under strain. Both endpoints werepositively correlated with WMSDs, meaning that higher scores are associated with aWMSDs diagnosis. These results also make sense from a clinical point of view becauseboth DASH scores and VAS associate higher scores with worse outcomes.
3.4. Multiple Regression Analyses of Predictors
The relationship between the pre-specified predictors and the occurrence of WMSDswas investigated through the analysis of a binary logistic regression (Table 5). None ofthese factors seem to be a risk factor for WMSDs, as the minimal p-value was 0.14.
Int. J. Environ. Res. Public Health 2021, 18, 9171 7 of 15
Int. J. Environ. Res. Public Health 2021, 18, 0 7 of 15
Int. J. Environ. Res. Public Health 2021, 18, x 7 of 16
grip strength and ROM E/F, and between VAS at rest and under strain, DASH, and sub-jective complaints became apparent.
Figure 1. Scatter plot matrix showing the bivariate distributions for all pair-wise combinations of WMSDs, DASH, VAS at rest, and VAS at strain.
Figure 1. Scatter plot matrix showing the bivariate distributions for all pair-wise combinations ofWMSDs, DASH, VAS at rest, and VAS at strain.
Figure 1. Scatter plot matrix showing the bivariate distributions for all pair-wise combinations ofWMSDs, DASH, VAS at rest, and VAS at strain.
Int. J. Environ. Res. Public Health 2021, 18, 0 8 of 15Int. J. Environ. Res. Public Health 2021, 18, x 8 of 16
Figure 2. Prediction ellipse for graphical representation of the correlation between the DASH score and WMSD.
Bivariate correlation coefficients between clinical endpoints and the diagnosis of WMSDs are shown in Table 4. Only two of the collected clinical endpoints were associated with a p-value below 0.1: the DASH score and VAS under strain. Both endpoints were positively correlated with WMSDs, meaning that higher scores are associated with a WMSDs diagnosis. These results also make sense from a clinical point of view because both DASH scores and VAS associate higher scores with worse outcomes.
Table 4. Correlation and confidence intervals between WMSDs and other clinical endpoints.
Clinical Endpoint N Spearman r DASH score 67 0.23 (−0.01, 0.45, p = 0.056) VAS at rest 70 0.04 (−0.20, 0.27, p = 0.755)
VAS under strain 70 0.26 (0.03, 0.47, p = 0.029) Range of motion E/F 70 −0.01 (−0.24, 0.23, p = 0.943) Range of motion S/P 70 −0.17 (−0.39, 0.07, p = 0.168) Range of motion U/R 70 −0.12 (−0.35, 0.12, p = 0.316)
Grip strength 70 0.13 (−0.11, 0.36, p = 0.269) Purdue Pegboard Test 70 0.03 (−0.20, 0.27, p = 0.787) Subjective complaints 70 0.15 (−0.09, 0.37, p = 0.213)
Figure 2. Prediction ellipse for graphical representation of the correlation between the DASH scoreand WMSD.
Table 4. Correlation and confidence intervals between WMSDs and other clinical endpoints.
Clinical Endpoint N Spearman r
DASH score 67 0.23 (−0.01, 0.45, p = 0.056)VAS at rest 70 0.04 (−0.20, 0.27, p = 0.755)
VAS under strain 70 0.26 (0.03, 0.47, p = 0.029)Range of motion E/F 70 −0.01 (−0.24, 0.23, p = 0.943)Range of motion S/P 70 −0.17 (−0.39, 0.07, p = 0.168)Range of motion U/R 70 −0.12 (−0.35, 0.12, p = 0.316)
Grip strength 70 0.13 (−0.11, 0.36, p = 0.269)Purdue Pegboard Test 70 0.03 (−0.20, 0.27, p = 0.787)Subjective complaints 70 0.15 (−0.09, 0.37, p = 0.213)
DASH = Disabilities of the Arm, Shoulder, and Hand, VAS = pain on Visual Analog Scale, ROM = range ofmotion, E/F = extension/flexion, S/P = supination/pronation, U/R = ulnar/radial abduction, PPB Test = PurduePegboard Test.
Figure 2. Prediction ellipse for graphical representation of the correlation between the DASH scoreand WMSD.
Int. J. Environ. Res. Public Health 2021, 18, 9171 8 of 15
Table 4. Correlation and confidence intervals between WMSDs and other clinical endpoints.
Clinical Endpoint N Spearman r
DASH score 67 0.23 (−0.01, 0.45, p = 0.056)VAS at rest 70 0.04 (−0.20, 0.27, p = 0.755)
VAS under strain 70 0.26 (0.03, 0.47, p = 0.029)Range of motion E/F 70 −0.01 (−0.24, 0.23, p = 0.943)Range of motion S/P 70 −0.17 (−0.39, 0.07, p = 0.168)Range of motion U/R 70 −0.12 (−0.35, 0.12, p = 0.316)
Grip strength 70 0.13 (−0.11, 0.36, p = 0.269)Purdue Pegboard Test 70 0.03 (−0.20, 0.27, p = 0.787)Subjective complaints 70 0.15 (−0.09, 0.37, p = 0.213)
DASH = Disabilities of the Arm, Shoulder, and Hand, VAS = pain on Visual Analog Scale, ROM = range ofmotion, E/F = extension/flexion, S/P = supination/pronation, U/R = ulnar/radial abduction, PPB Test = PurduePegboard Test.
Table 5. Results of the multiple analysis for the endpoint WMSDs.
Effect/Factor p-Value
Gender (female/male) 0.14Body mass index (BMI) 0.41
Occupation group (grinding/packaging/control) 0.43Secondary occupation and/or physical hobbies 0.57
Age 0.96Years in service 0.99
The respective analyses following the same layout were performed using other clinicalendpoints, with a linear instead of logistic regression applied in the case of continuousendpoints. Results are shown in Table 6. Only the combinations with a p-value of p ≤ 0.1are listed.
Table 6. Results of the multiple analysis of secondary clinical endpoints.
Basic Endpoint Effect/Factor p-Value
DASH Gender (female/male) 0.019
Range of motionDimension of movement (E/F, S/P or U/R) <0.001
Years in service 0.021Gender (female/male) 0.035
Subjective complaints Age 0.042Years in service 0.060
VAS at rest Body Mass Index 0.091
VAS under strain Body Mass Index 0.027
Grip strength
Gender (female/male) <0.001Age <0.001
Body Mass Index <0.001Secondary occupation and/or physical
hobbies 0.041
Years in service 0.053DASH = Disabilities of the Arm, Shoulder, and Hand, ROM = range of motion, VAS = pain on Visual Analog Scale,BMI = Body Mass Index, E/F = extension/flexion, S/P = supination/pronation, U/R = ulnar/radial abduction.
In addition to known and obvious correlations such as gender dependence for DASHwith higher values in women, or higher grip strength in men, there was a negative cor-relation between ROM and years in service, more frequent subjective complaints of theupper extremities with increasing age, pain under strain on the VAS at a higher BMI, andhigher grip strength when secondary occupation and/or physically demanding hobbieswere performed [38]. A statistical effect may be observed in Table 5 with by far the lowestp-values concentrated in the analysis of grip strength and, to some extent, of ROM.
Int. J. Environ. Res. Public Health 2021, 18, 9171 9 of 15
4. Discussion
We chose to survey a population of actively employed surgical device mechanics andcompared them with a group of employees believed not to be exposed to repetitive handand arm movements to such a large extent.
The overall prevalence of subjective upper extremity complaints (i.e., symptoms) was47% (33/70). Eight out of 20 (40%) grinders, 14/24 (58%) packers, and 11/26 (42%) peoplein the control group reported such symptoms. One or more upper extremity WMSDs(i.e., diagnoses) at the elbow, forearm, and/or wrist were found in 56% (39/70), of which12/20 (70%) were grinders, 14/24 (54%) were packers, and 13/26 (42%) were controlpersons. These results are consistent with previous studies showing a prevalence rateof symptoms between 21% and 71% in the study group and between 6.0% and 50% inthe control group [5,39–50]. With regard to diagnoses, existing studies report a preva-lence between 21% and 56% in the study group compared to 5.0% to 22% in the controlgroup [5,39,41–43,45]. Within the framework of the standardized clinical examination, weapplied rather “softer” criteria, as recommended by Vikari-Juntura [51]. This might explainthe higher detection of WMSDs via examination as compared to the lower number ofsubjective complaints reported in the questionnaire. An above average co-occurrence ofmedial epicondylitis (golfer’s elbow) and nerve entrapment at the medial elbow (cubitaltunnel syndrome) was found in 30% of our test persons and 54% of the individuals withupper extremity complaints in this cohort [52–54].
Study designs and research methods used to collect and process data via WMSDs areextremely heterogeneous. Our literature search revealed that, out of 262 original researcharticles, only about 4.0% of the studies contained a clinical examination of the individualswith or without structured questionnaires/interviews including a control group [17]. Moststudies were based on self-administered questionnaires and results from health insurancedatabases without a control group.
The clinical endpoint values of our study population were largely consistent with thereference values of the general population, but in some cases (grip strength, PPB tests) alsoshowed below average values. This is surprising and contradicts the study situation, asour cohort tends to have an above-average physical load [55]. The reasons for this could bemechanical support, shorter working hours, and a historical shift in populations’ referencevalues without the first two points mentioned.
A closer look into the scatter plot revealed an obvious floor effect in the DASH dis-tribution (Figure 1). DASH values of probands with WMSDs concentrated more in theten-point range, whereas the “no WMSDs” group very often had a DASH score of 0. Thiscaused the slight tilt of the ellipse, correlating with the Pearson correlation coefficient,which, in the first approximation, visualized an interrelation between the DASH scoreand WMSDs (Figure 2). However, the non-normality contradicted the application of theparametric Pearson regression and caused a switch to the non-parametric Spearman corre-lation. Its coefficient was indeed much more sensitive to this effect, due to its robustnesstowards non-normal distribution of the DASH values. For the same reason, the normalityassumption was not given for ROM and VAS distributions, so the Spearman method hadto be preferred for evaluation of interactions between WMSDs and these endpoints. Thisparticular non-parametric correlation analysis with one dichotomous variable is known asrank-biserial correlation.
In the bivariate analysis, we found a correlation between the DASH score and WMSDsas well as VAS under strain and WMSDs. A simple clinical explanation for this couldbe that pathology (WMSDs) manifests itself through pain, especially when the hand isused forcefully. This aspect is a common feature of the DASH questionnaire and alsomanifests itself with VAS under strain. VAS at rest, ROM, grip strength, the PPB Test,and the indication of subjective complaints by the study participants were not suitable todetect WMSDs in our study. However, the question of subjective complaints is a centralcomponent of many studies and the basis for their interpretation.
Int. J. Environ. Res. Public Health 2021, 18, 9171 10 of 15
Regarding the upper extremities, the validity of questionnaires for WMSDs has notbeen clarified, and it is not known how an optimal questionnaire can be constructed andwhat information can be obtained [56]. A purely technical investigation using measurementdata without clinical examination would have the advantage of resource optimization butcould not be related to WMSDs either [57]. This is also supported by the relatively weakcorrelation between measured clinical endpoints and WMSDs in our study. Accordingly,a clinical examination based on a predetermined set of diagnostic criteria remains thegold standard for cross-sectional investigations in order to keep well-defined disordersseparate from more diffuse conditions. Although clinical examination is time-consumingand hard for both the subject and the examiner, it seems to be necessary at this time todetect defined WMSDs.
Although the p-value has not quite reached the conventional significance level of 0.05in our study (p = 0.056), the correlation we found between WMSDs and the DASH score maynot therefore be considered non-existent and could be of interest for the design of futurestudies [58]. The DASH score as a self-administered, region-specific outcome instrumentfor upper-extremity disability and symptoms was tested against the gold standard ofWMSDs detection (i.e., the clinical examination). To our knowledge, there are no studiesfocusing on the correlation between WMSDs and the DASH score, whereas this is the casefor some upper extremity pathologies other than WMSDs [59]. According to our analysis,the DASH score has the potential to replace the resource-intensive clinical examinationas a screening tool. In case of conspicuous DASH scores, the latter could be used in afocused manner for diagnosis, with therapeutic and preventive measures derived fromit. The DASH score has shown good validity, reliability, and responsiveness in relation toupper extremity disorders [60]. In comparison, the Nordic Musculoskeletal Questionnaire(NMQ), often used in cross-sectional studies, is a simple validated questionnaire that refersto complaints in nine body parts, including the hand/wrist/elbow [61]. Its content is inno way comparable to the detailed questions of the DASH, with its focus on the upperextremities, and hardly exceeds the yes/no question on subjective complaints in our study.To what extent further questionnaires are suitable for the detection of upper extremitypathologies will be the subject of future studies.
For the endpoint WMSDs, the multiple analysis of our study did not show any inde-pendent predictors significant at a 0.1 level. This is partially in contrast to previous studies,in which work-related and socio-demographic characteristics have been determined aspredisposing upper extremity disorders [5]. Work-related factors include static postures;excessive force and strain; vibration; repeated pushing, pulling, and lifting; overuse ofparticular anatomical structures or regions; poor posture or improper positioning; awk-ward movements; long duration of pressure; rapid work pace; short recovery periods;low decision latitude; years of service; and job satisfaction [39,62–65]. Socio-demographiccharacteristics predicting WMSDs include factors such as sex, age, marital status, workexperience, body mass index, and physical activities [66–71]. For standardization andbetter comparability of future studies, the authors have selected the predictor variable setfollowing the International Classification of Functioning, Disability, and Health (ICF). Thisis an internationally recognized classification of health and health-related domains [72].The scatter plot matrix with prediction ellipses has proven to be a fast graphic analysis anda preliminary stage for a detailed statistical evaluation in our study.
Multiple analyses were also used to examine the independent predictors for otherclinical endpoints. Significant positive correlations between ROM and years in service,more frequent subjective complaints of the upper extremity with increasing age, higher VASunder strain with a higher BMI, and higher grip strength with the presence of a secondaryoccupation and/or physically demanding hobbies are particularly noteworthy. Thesefindings are relevant for future investigations, because the relationships of independentvariables to each other may disturb the identification of risk factors for WMSDs, actingas confounders. These relationships should therefore be considered when analyzing anyWMSDs-related outcomes.
Int. J. Environ. Res. Public Health 2021, 18, 9171 11 of 15
The literature pool of 262 publications, compiled for the primary publication, wasscanned for indications that any multiple regression methods were used for predictoranalyses. Only 32 articles (12%) could be identified, indicating that the usage of multivariateanalyses is still not common in this type of study.
The very low p-values for effects in the analysis of grip strength and range of motion(see Table 6) probably resulted from the increase in power due to the higher number ofindividual measurements (2 × 3 measurements per subject, i.e., total n = 420 in 70 subjects).However, the variance analysis employed in regression models with other simply measuredvalues lacks such an amount of information regarding the variance of the measurements.The additional information gave the analysis of variance more statistical power, i.e., moresensitivity for effects detection.
We intentionally tried to avoid the term “significant” in regard to this analysis, inorder not to refer our reported p-values to the conventional 5.0% significance level, whichmay be prone to misinterpretation [58,73]. Using the concept of hypothesis testing inthe scientifically accurate way, setting a significance level would require a multiplicitycorrection for a number of pre-defined tests. Such explicit correction would, on the otherhand, take away our flexibility to follow the effects and relations in our data, which containsa complex network of endpoints and their predictors. For this reason, this secondaryanalysis was clearly explorative. This means that the p-values shown in the tables arenot referred to any significance level. They rather provide continuous information ofhow effects are related or ranked according to their strengths. In this respect, Table 3in the results section has to be considered as identification of two potential candidatesfor appropriate surrogate measures for WMSDs prevalence. However, real evidence forthe adequacy of any of these candidates for WMSDs detection in clinical use has to begenerated by a dedicated study.
The DASH score was considered to be the surrogate endpoint of choice for our primaryanalysis of WMSDs prevalence among medical device manufacturing employees. Thecurrent analyses confirm that DASH still has to remain as the closer choice when assessingthe WMSDs status of a population.
Regarding the limitations of our study, it should be noted that cross-sectional studiesalways represent a snapshot, and no statement can be made about the duration of anexisting WMSDs. In particular, it is not possible to clearly distinguish between chronic,recurrent, or acute diseases. As in other studies, we also focused on a manageable numberof potential risk factors, because an increasing number of predictors increases the prob-ability of false positive effects, especially in smaller samples. This makes it difficult toassess these effects as a whole. Due to the single investigator approach, there is a risk ofsystematic error for over-sensitive detection of WMSDs, which is indicated by the highernumber of diagnoses compared to symptoms in our study. On the other hand, the exami-nation was performed by the same hand surgeon, which may have led to the diagnosisat an earlier stage than in a clinical setting. However, reducing the systematic error bya multiple investigator approach would have brought an inter-observer error into play,arising as a result of different teaching backgrounds and subjective assessments. Repeatingthe physical examination tests by having two investigators examine the same person wasnot an option for the authors. A major reason for this is that most test results dependon the announcement of symptoms (pain, numbness, etc.), and participants learn duringfollow-up examinations, which limits the objectivity of such study designs [57]. The smallstudy sample of 70 individuals might not provide power to detect small effects, so it maybe considered another limitation. Even though the cross-sectional design of our study doesnot permit causal inference, the observed relations provide valuable evidence for furtherresearch and policy making. For further limitations with regard to the three occupationalactivities, we would like to refer to our previous publication [17].
Int. J. Environ. Res. Public Health 2021, 18, 9171 12 of 15
5. Conclusions
The methods used to collect, process, and interpret data on WMSDs are extremelyheterogeneous, so the comparability between studies is poor. This study evaluated sur-vey methods and assessment tools for the detection of upper extremity WMSDs and itsassociations in a healthy working population.
While the most frequently used questionnaires focus on subjective complaints that donot seem to be related to WMSDs, the DASH questionnaire could prove to be an efficientscreening method. However, the gold standard for the detection of WMSDs, and alsofor the derivation of prophylactic, therapeutic, and rehabilitative measures, is still thestandardized physical examination, based on a predetermined set of diagnostic criteria.
Our analysis has not identified any risk factors for WMSDs in the study data. Possibly,the effects of investigated risks were too small to be detected by our relatively smallstudy sample.
In order to make epidemiological research on upper extremity WMSDs more compara-ble, a uniform study design in regard to endpoint selection is recommended. We hope thatthe methodological results of our work will help other researchers to obtain more efficientand consistent tools for the research on upper extremity WMSDs.
Author Contributions: Conceptualization, O.L., T.L. and V.B.; methodology, O.L. and J.M.; software,V.B.; validation, T.L. and O.L.; formal analysis, V.B.; investigation, O.L. and T.L.; resources, J.M.;data curation, J.M. and V.B.; writing—original draft preparation, O.L. and V.B.; writing—review andediting, all authors; visualization, T.L.; supervision, O.L.; project administration, J.M. All authorshave read and agreed to the published version of the manuscript.
Funding: This research received no external funding.
Institutional Review Board Statement: The study was conducted according to the guidelines of theDeclaration of Helsinki, and approved by the Ethics Committee of the Baden-Wuerttemberg MedicalAssociation, Jahnstrasse 40, 70597 Stuttgart, Germany (project number F-2017-005, date 01/24/2017).
Informed Consent Statement: Informed consent was obtained from all subjects involved in the study.
Data Availability Statement: The data presented in this study are available on request from thecorresponding author.
Acknowledgments: The authors would like to thank all of the study participants and the staff in-volved in the conduct of the study, in particular Katharina Lange, Manager Medical Scientific Affairs,Aesculap AG; Stefanie Latuske, Mevluede Orhan, and Ulrike Hofer, Health Center, Aesculap AG.
Conflicts of Interest: The authors declare no conflict of interest.
References1. Snashall, D. ABC of work-related disorders-hazards of work. BMJ 1996, 313, 161–164. [CrossRef]2. Melhorn, J.M. Cumulative trauma disorders and repetitive strain injuries. Clin. Orthop. Relat. Res. 1998, 351, 107–126. [CrossRef]3. Backhans, M.; Stjernschantz Forsberg, J.; Lager, A. (Eds.) Folkhälsorapport 2015 [Public Health Report 2015], 1st ed.; Center of
Epidemiology and Community Medicine: Stockholm, Sweden, 2015; pp. 23–24.4. Kumar, V.K.; Kumar, S.P.; Baliga, M.R. Prevalence of work-related musculoskeletal complaints among dentists in India: A national
cross-sectional survey. Indian J. Dent. Res. 2013, 24, 428–438. [CrossRef] [PubMed]5. van Eerd, D.; Beaton, D.; Cole, D.; Lucas, J.; Hogg-Johnson, S.; Bombardier, C. Classification systems for upper-limb muscu-
loskeletal disorders in workers: A review of the literature. J. Clin. Epidemiol. 2003, 56, 925–936. [CrossRef]6. da Costa, J.T.; Baptista, J.S.; Vaz, M. Incidence and prevalence of upper-limb work related musculoskeletal disorders: A systematic
review. Work 2015, 51, 635–644. [CrossRef] [PubMed]7. Hoy, D.G.; Smith, E.; Cross, M.; Sanchez-Riera, L.; Buchbinder, R.; Blyth, F.M. The global burden of musculoskeletal conditions
for 2010: An overview of methods. ARD 2014, 73, 982–989. [CrossRef] [PubMed]8. Jensen, L.K.; Hansen, H.B. Working environment. Many work impediments among personnel in operating room. Sygeplejersken
1986, 86, 4–10. [PubMed]9. Bernard, B.P. Musculoskeletal disorders and workplace factors: A critical review of epidemiologic evidence for work-related
musculoskeletal disorders of the neck, upper extremity, and low back. US Department of Health and Human Services. NIOSH1997, 10, 97–141.
Int. J. Environ. Res. Public Health 2021, 18, 9171 13 of 15
10. Baldwin, M.L.; Butler, R.J. Upper extremity disorders in the workplace: Costs and outcomes beyond the first return to work. J.Occup. Rehabil. 2006, 16, 303–323. [CrossRef]
11. Buckle, P.W.; Devereux, J.J. The nature of work-related neck and upper limb musculoskeletal disorders. Appl. Ergon. 2002, 33,207–217. [CrossRef]
12. Palmer, K.; Coggon, D.; Cooper, C.; Doherty, M. Work related upper limb disorders: Getting down to specifics. Ann. Rheum. Dis.1998, 57, 445–446. [CrossRef] [PubMed]
13. Mather, L.; Ropponen, A.; Mittendorfer-Rutz, E.; Narusyte, J.P. Health, work and demographic factors associated with a lowerrisk of work disability and unemployment in employees with lower back, neck, and shoulder pain. BMC Musculoskelet. Disord.2019, 20, 622–629. [CrossRef]
14. Warren, N.; Dillon, C.; Morse, T.; Hall, C.; Warren, A. Biomechanical, psychosocial, and organizational risk factors for WRMSD:Population-based estimates from the Connecticut upper-extremity surveillance project (CUSP). J. Occup. Health Psychol. 2000, 5,164–181. [CrossRef]
15. Gerr, F.; Fethke, N.B.; Merlino, L.; Anton, D.; Rosecrance, J.; Jones, M.P. A prospective study of musculoskeletal outcomes amongmanufacturing workers: Effects of physical risk factors. Hum. Factors 2014, 56, 112–130. [CrossRef]
16. Burdorf, A.; Sorock, G. Positive and negative evidence for risk factors of work-related back disorders. Scand. J. Work Environ.Health 1997, 23, 243–256. [CrossRef]
17. Lotter, O.; Lieb, T.; Breul, V.; Molsner, J. Is Repetitive Workload a Risk Factor for Upper Extremity Musculoskeletal Disorders inSurgical Device Mechanics? A Cross-Sectional Analysis. Int. J. Environ. Res. Public Health 2020, 17, 1383. [CrossRef]
18. Germann, G.; Harth, A.; Wind, G.; Demir, E. Standardization and validation of the German version 2.0 of the Disability of Arm,Shoulder, Hand (DASH) questionnaire. Unfallchirurg 2003, 106, 13–19. [CrossRef] [PubMed]
19. Hudak, P.L.; Amadio, P.C.; Bombardier, C. Development of an upper extremity outcome measure: The DASH (disabilities of thearm, shoulder, and hand). Am. J. Ind. Med. 1996, 29, 602–608. [CrossRef]
20. Revill, S.I.; Robinson, J.O.; Rosen, M.; Hogg, M.I.J. The reliability of a linear analogue for evaluating pain. Anaesthesia 1976, 31,1191–1198. [CrossRef] [PubMed]
21. Ryf, C.; Weymann, A. The neutral zero method—A principle of measuring joint function. Injury 1995, 26, 1–11. [CrossRef]22. Schmidt, R.T.; Toews, J.V. Grip strength as measured by the Jamar dynamometer. Arch. Phys. Med. Rehabil. 1970, 51, 321–327.
[PubMed]23. Sherman, E.M.S. The Purdue Pegboard Test. In A Compendium of Neuropsychological Tests: Administration, Norms, and Commentary,
3rd ed.; Strauss, E., Sherman, E.M.S., Spreen, O., Eds.; Oxford University Press: Oxford, UK, 2006; pp. 1068–1079.24. Golden, C.J.; Espe-Pfeifer, P.; Wachsler-Felder, J. Neuropsychological Interpretations of Objective Psychological Tests, 1st ed.; Springer:
Berlin/Heidelberg, Germany, 2006; pp. 26–27.25. Mansfield, N.J.; Marshall, J.M. Symptoms of musculoskeletal disorders in stage rally drivers and co-drivers. Br. J. Sports Med.
2001, 35, 314–320. [CrossRef] [PubMed]26. Waris, P.; Kuorinka, I.; Kurppa, K.; Luopajärvi, T.; Virolainen, M.; Pesonen, K.; Nummi, J.; Kukkonen, R. Epidemiologic screening
of occupational neck and upper limb disorders. Methods and criteria. Scand. J. Work Environ. Health 1979, 5, 25–38. [CrossRef][PubMed]
27. Finkelstein, H. Stenosing tendovaginitis at the radial styloid process. J. Bone Jt. Surg. 1930, 12, 509–540.28. Sheon, R.E.; Moskowitz, R.W.; Goldberg, V.M. Soft Tissue Rheumatic Pain: Recognition, Management, Prevention, 2nd ed.; Lea &
Febiger: Philadelphia, PA, USA, 1988; pp. 134–139.29. Phalen, G.S. The carpal tunnel syndrome: Seventeen years’ experience in diagnosis and treatment of 654 hands. J. Bone Jt. Surg.
1966, 48, 211–228. [CrossRef]30. Leclerc, A.; Landre, M.; Chastang, J.; Niedhammer, I.; Roquelaure, Y. Study Group on Repetitive Work. Upper-limb disorders in
repetitive work. Scand. J. Work Environ. Health 2001, 27, 268–278. [CrossRef]31. Lang, T.A.; Secic, M. How to Report Statistics in Medicine, 2nd ed.; American College of Physicians: Philadelphia, PA, USA, 2006;
pp. 233–237.32. Hunsaker, F.G.; Cioffi, D.A.; Amadio, P.C.; Wright, J.G.; Caughlin, B. The American academy of orthopedic surgeons outcomes
instruments: Normative values from the general population. J. Bone Jt. Surg. 2002, 84, 208–215. [CrossRef]33. Klum, M.; Wolf, M.B.; Hahn, P.; Leclère, F.M.; Bruckner, T.; Unglaub, F. Normative data on wrist function. J. Hand Surg. 2012, 37,
2050–2060. [CrossRef]34. Soucie, J.M.; Wang, C.; Forsyth, A.; Funk, S.; Denny, M.; Roach, K.E.; Boone, D. Range of motion measurements: Reference values
and a database for comparison studies. Hemophilia Treatment Center Network. Haemophilia 2011, 17, 500–507. [CrossRef]35. Guenther, C.M.; Buerger, A.; Rickert, M.; Crispin, A.; Schulz, C.H. Grip strength in healthy Caucasian adults: Reference values. J.
Hand Surg. 2008, 33, 558–565. [CrossRef]36. Agnew, J.; Bolla-Wilson, K.; Kawas, C.H.; Bleeker, M.L. Purdue Pegboard age and sex norms for people 40 years old and older.
Dev. Neuropsychol. 1988, 4, 29–35. [CrossRef]37. Confidence and Prediction Ellipses. Available online: https://support.sas.com/documentation/cdl/en/procstat/66703/HTML/
default/viewer.htm#procstat_corr_details19.htm (accessed on 21 July 2020).38. Jester, A.; Harth, A.; Rauch, J.; Germann, G. DASH Data of Non-Clinical versus Clinical Groups of Persons—A Comparative
Study of T-norms for Clinical Use. Handchir. Mikrochir. Plast. Chir. 2010, 42, 55–64. [CrossRef] [PubMed]
Int. J. Environ. Res. Public Health 2021, 18, 9171 14 of 15
39. Lipscomb, H.J.; Epling, C.A.; Pompeii, L.A.; Dement, J.M. Musculoskeletal symptoms among poultry processing workers and acommunity comparison group: Black women in low-wage jobs in the rural South. Am. J. Ind. Med. 2007, 50, 327–338. [CrossRef][PubMed]
40. Macdonald, F.; Waclawski, E. Upper limb disorders among coopers in the Scotch whisky industry. Occup. Med. 2006, 56, 232–236.[CrossRef]
41. Ohlsson, K.; Attewell, R.G.; Pålsson, B.; Karlsson, B.; Balogh, I.; Johnsson, B.; Kilbom, A.; Kuorinka, I.A.; Silverstein, B.A.;Sjogaard, G.; et al. Repetitive industrial work and neck and upper limb disorders in females. Am. J. Ind. Med. 1995, 27, 731–747.[CrossRef]
42. Ohlsson, K.; Hansson, G.A.; Balogh, I.; Stroemberg, U.; Pålsson, B.; Nordander, C.; Rylander, L.; Skerfving, S. Disorders of theneck and upper limbs in women in the fish processing industry. Occup. Environ. Med. 1994, 51, 826–832. [CrossRef]
43. Bovenzi, M.; Zadini, A.; Franzinelli, A.; Borgogni, F. Occupational musculoskeletal disorders in the neck and upper limbs offorestry workers exposed to hand-arm vibration. Ergonomics 1991, 34, 547–562. [CrossRef]
44. Punnett, L.; Robins, J.M.; Wegman, D.H.; Keyserling, W.M. Soft tissue disorders in the upper limbs of female garment workers.Scand. J. Work Environ. Health 1985, 11, 417–425. [CrossRef]
45. Luopajärvi, T.; Kuorinka, I.; Virolainen, M.; Holmberg, M. Prevalence of tenosynovitis and other injuries of the upper extremitiesin repetitive work. Scand. J. Work Environ. Health 1979, 5, 48–55. [CrossRef]
46. Ohlander, J.; Keskin, M.C.; Weiler, S.; Stork, J.; Radon, K. Snap-fits and upper limb functional limitations in German automotiveworkers. Occup. Med. 2016, 66, 471–477. [CrossRef]
47. Taspinar, O.; Kepekci, M.; Ozaras, N.; Aydin, T.; Guler, M. Upper extremity problems in doner kebab masters. J. Phys. Ther. Sci.2014, 26, 1433–1436. [CrossRef]
48. Ghosh, T.; Das, B.; Gangopadhyay, S. A comparative ergonomic study of work-related upper extremity musculoskeletal disorderamong the unskilled and skilled surgical blacksmiths in West Bengal, India. Indian. J. Occup. Environ. Med. 2011, 15, 127–132.
49. Hembecker, P.K.; Reis, D.C.; Konrath, A.C.; Gontijo, L.; Merino, E.A. Investigation of musculoskeletal symptoms in a manufactur-ing company in Brazil: A cross-sectional study. Braz. J. Phys. Ther. 2017, 21, 175–183. [CrossRef]
50. Gold, J.E.; D’Errico, A.; Katz, J.N.; Gore, R.; Punnett, L. Specific and non-specific upper extremity musculoskeletal disordersyndromes in automobile manufacturing workers. Am. J. Ind. Med. 2009, 52, 124–132. [CrossRef]
51. Viikari-Juntura, E. Neck and upper limb disorders among slaughterhouse workers. An epidemiologic and clinical study. Scand. J.Work Environ. Health 1983, 8, 283–290. [CrossRef] [PubMed]
52. Shiri, R.; Viikari-Juntura, E.; Varonen, H.; Heliövaara, M. Prevalence and determinants of lateral and medial epicondylitis: Apopulation study. Am. J. Epidemiol. 2006, 164, 1065–1074. [CrossRef]
53. Wolf, J.M.; Mountcastle, S.; Burks, R.; Sturdivant, R.X.; Owens, B.D. Epidemiology of lateral and medial epicondylitis in a militarypopulation. Mil. Med. 2010, 175, 336–339. [CrossRef] [PubMed]
54. Crouch, T. Obtaining an Accurate Diagnosis. In Carpal Tunnel Syndrome and Repetitive Stress Injuries: The Comprehensive Guide toPrevention, Treatment, and Recovery, 2nd ed.; Crouch, T., Ed.; North Atlantic Books: Berkeley, CA, USA, 1992; pp. 23–27.
55. Kilbom, S.; Armstrong, T.; Buckle, P.; Fine, L.; Hagberg, M.; Haring-Sweeney, M.; Martin, B.; Punnett, L.; Silverstein, B.;Sjøgaard, G.; et al. Musculoskeletal Disorders: Work-related Risk Factors and Prevention. Int. J. Occup. Environ. Health 1996, 2,239–246.
56. Burdorf, A.; van der Beek, A.J. In musculoskeletal epidemiology are we asking the unanswerable in questionnaires on physicalload? Scand. J. Work Environ. Health 1999, 25, 81–83. [CrossRef]
57. Hansson, G.-Å.; Balogh, I.; Unge Byström, J.; Ohlsson, K.; Nordander, C.; Asterland, P.; Sjölander, S.; Rylander, L.; Winkel, J.;Skerfving, S. Questionnaire versus direct technical measurements in assessing postures and movements of the head, upper back,arms, and hands. Scand. J. Work Environ. Health 2001, 27, 30–40. [CrossRef] [PubMed]
58. Altman, D.G.; Bland, J.M. Absence of evidence is not evidence of absence. BMJ 1995, 311, 485. [CrossRef] [PubMed]59. Ostlie, K.; Franklin, R.J.; Skjeldal, O.H.; Skrondal, A.; Magnus, P. Assessing Physical Function in Adult Acquired Major Upper-
Limb Amputees by Combining the Disabilities of the Arm, Shoulder, and Hand (DASH) Outcome Questionnaire and ClinicalExamination. Arch. Phys. Med. Rehabil. 2011, 92, 1636–1645. [CrossRef] [PubMed]
60. Changulani, M.; Okonkwo, U.; Keswani, T.; Kalairajah, Y. Outcome evaluation measures for wrist and hand—Which one tochoose? Int. Orthop. 2008, 32, 1–6. [CrossRef] [PubMed]
61. Dickinson, C.E.; Campion, K.; Foster, A.F.; Newman, S.J.; Orourke, A.M.T.; Thomas, P.G. Questionnaire development—Anexamination of the Nordic musculoskeletal questionnaire. Appl. Ergon. 1992, 23, 197–201. [CrossRef]
62. Industry Starnadrs for the Prevention of Work-Related Musculoskeletal Disorders in Sonography. Available online: https://www.osha.gov/SLTC/etools/hospital/sonography/sonography.html (accessed on 15 March 2021).
63. Punnett, L.; Wegman, D.H. Work-related musculoskeletal disorders: The epidemiological evidence and the debate. J. Electromyogr.Kinesiol. 2004, 14, 13–23. [CrossRef] [PubMed]
64. Davis, T.R. Do repetitive tasks give rise to musculoskeletal disorders? Occup. Med. 1999, 49, 257–258. [CrossRef]65. Berberoglu, U.; Tokuc, B. Work-related musculoskeletal disorders at two textile factories in Edirne, Turkey. Balkan Med. J. 2013, 30,
23–27. [CrossRef]66. Wang, P.C.; Rempel, D.; Harrison, R.; Chan, J.; Ritz, B. Work-organizational and personal factors associated with upper body
musculoskeletal disorders among sewing machine operators. Occup. Environ. Med. 2007, 64, 806–813. [CrossRef]
Int. J. Environ. Res. Public Health 2021, 18, 9171 15 of 15
67. Pelissier, C.; Fontana, L.; Fort, E. Occupational risk factors for upper limb and neck musculoskeletal disorder among healthcarestaff in nursing homes for the elderly in France. Ind. Health 2014, 52, 334–346.
68. Moodley, R.; Naidoo, S. The prevalence of musculoskeletal disorders among dentists in KwaZulu-Natal. S. Afr. Dent. J. 2015, 70,98–103.
69. Alshagga, M.A.; Nimer, A.R.; Yan, L.P.; Ibrahim, I.A.A.; Al-Ghamdi, S.S.; Al-Dubai, S.A.R. Prevalence and factors associatedwith neck, shoulder, and low back pains among medical students in a Malaysian Medical College. BMC Res. Notes 2013, 6, 244.[CrossRef] [PubMed]
70. Rodrigues, E.V.; Gomes, A.R.S.; Tanhoffer, A.I.P.; Leite, N. Effects of exercise on pain of musculoskeletal disorders: A systematicreview. Acta Ortopédica Bras. 2014, 22, 334–338. [CrossRef]
71. Mekonnen, T.H.; Abere, G.; Olkeba, S.W. Risk Factors Associated with Upper Extremity Musculoskeletal Disorders amongBarbers in Gondar Town, Northwest Ethiopia, 2018: A Cross-Sectional Study. Pain Res. Manag. 2019, 2019, 6984719. [CrossRef][PubMed]
72. Sternberg, A.; Bethge, M. Measuring work functioning in individuals with musculoskeletal disorders with reference to theInternational Classification of Functioning, Disability, and Health: A systematic literature review. Int. J. Rehabil. Res. 2018, 41,97–109. [CrossRef] [PubMed]
73. Amrhein, V.; Greenland, S.; McShane, B. Scientists rise up against statistical significance. Nature 2019, 567, 305–307. [CrossRef][PubMed]