Embed Size (px)
Citation preview

PREDICTING THE SEVERITY OF NUCLEAR POWER PLANT TRANSIENTS BY USING GENETIC AND
NEAREST NEIGHBOR ALGORITHMS
JIE LIN,* YAIR BARTAL, AND ROBERT E. UHRIG Instnunentation & Controls Division Oak Ridge National Laboratoryt Oak Ridge, TN 3 7831 -601 2
To be presented at ANNIE'94, November 13-16,1994 St. Louis, Missouri
"Currently with Energy Division, Oak Ridge National Laboratory, Oak Ridge, TN 378314070. tManaged by Martin Marietta Energy Systems, Inc., for the U.S. Depaxtment of Energy under contract DE-AC05-84QR21400.

DISCLAIMER
Portions of this document may be illegible in electronic image products. images are produced from the best available original document.

PREDICTING THE SEVERITY OF NUCLEAR POWER PLANT TRANSIENTS BY USING GENETIC AND
NEAREST NEIGHBOR ALGORITHMS
JIE LIN,* YAIR BARTAL, AND ROBERT E. UHRIG lnstrumentaiion & Controls Division Oak Ridge Narional Laboratory 0u.k Ridge, TN 37831-6012
ABSTRACT: Nuclear power plant status is monitored by a human operator. To enhance the operator’s capability to diagnose the nuclear power plant status in case of a transient, several systems were developed to identify the type of the transient. Few of them addressed the further question: how severe is the transient? In this paper, we explore the possibility of predicting the severity of a transient using genetic algorithms and nearest neighbor algorithms after its type has been identified.
INTRODUCTION
Nuclear power plants are complex systems. Safety issues of nuclear energy use are of great concern, especially since the Three Mile Island nuclear power plant accident. Early detection and identification of transients are very important to the safe use of nuclear reactors r1-31. In order to properly assess a transient, it is important to predict its severiiy. In this paper, we explore the possibility of predicting the severity of several transients.
NUCLEAR POWER PLANT DATA SPECIFICATION
Since reactor transients cannot be introduced in a nuclear power plant for studies, the best alternative is to use a high fidelity nuclear power plant simulator to provide transient data. The San Onofre unit 1 simulator, which simulates a 3 loop 436 Mw Westinghouse reactor, was chosen as the source of transient data.
The simulator was run for each transient test at a steady state condition for about one minute. Then a specific transient was introduced which lasted for the next four minutes. In each run, 76 different variables were sampled five times per second. Most of these variables correspond to readings of instruments in the control room. For each specific transient, these variables change differently and there exists a subset of these variables which can best identify the transient and its severity. This subset of variables is called the most important variable set for a specific transient.
*Currently with Energy Division, Oak Rage National Laboratory, Oak Ridge, TN 378314070. tManaged by Martin Marietta Energy Systems, Inc., for the U.S. Department of Energy d e r contract DE-AC05-840R2 1400.

Following are the seven transient types chosen:
1. Steam generator tube rupture 2. Hot leg loss of coolant accident 3. Cold leg loss of coolant accident 4. Main steam line break inside containment 5. Main steam line break outside containment 6. Feed water line break inside containment 7. Feed water line break outside containment
There are six severity levels of leakage for each transient type: 0.1 gpm (gallons per minute), 1 gpm, 10 gpm, 100 gpm , lo00 gpm and 0 to 1 gpm ramp increase leakages.
Genetic algorithms are massively parallel search and optimization techniques [4,5]. The principle behind genetic algorithms is Darwinian natural selection theory and natural genetics.
In the use of genetic algorithms, possible solutions are ended into bit strings to form a population that is generated randomly. Though none of these strings is assumed to be close to the optimal solution, the optimal string may be hidden in pieces of bits in these bit strings. Each string has a fitness value as an index of its value to an optimal solution. By means of reproduction biased by the fitness factor, crossover and mutation, the average fitness of each generation will be better than that of the previous generation. Eventually, the fittest bit string which is born will be a near optimal solution. Because genetic algorithms require only fitness information, they are ideal candidates to be used to search for the most important variables.
SEARCH FUR THE MOST IMPORTANT VARIABLES
In order to find the most important variables for a specific transient, a Similarity Based Formula (SBF) is used as a criteria to measure the similarity of two patterns. The SBF is based on the similarity and nearest neighborhood of patterns [6]. For each transient type, 20 patterns are sampled evenly distributed from each of the above six different severity level data. These 120 patterns are used to form a historical database. Then, 20 different patterns are sampled evenly distributed from each of the above six different severity level data. These 120 patterns are used to form an observed database. To predict the leakage value corresponding to each pattern in the observed database, the leakage values associated with the two most similar patterns in the historical database are used.
Since not all the 76 variables have the same influence over the prediction of the leakage rates, a genetic algorithm is used to find the most important variables. A 76 bit string which represents the 76 variables in the transient data is used to encode the solution. The similarity, 4, of two patterns xi=(xzi ... xu...) and x k = ( x z k ... x ~ . . . ) is:

A value of 2p = 0 indicates maximum similarity, which occurs when the two patterns are identical. &k can be thought as a distance between two patterns. The value c, is equal to either 0 or 1 which is generated by the genetic algorithm and determines which variables participate in the calculation [7,8]. The exponents, 114 and 5 are determined by trial and error.
When the two most similar patterns in the historical database are found for a specific pattern in the observed database, their two corresponding distance values bfl) and $kQ) are available too. The following formula which is a weighted linear interpolation is used to predict the leakage value of the pattern in the observed database:
where yl and y2 are the leakage values associated with the two most similar patterns in the historical database.
The genetic algorithm fitness function is defined as follows:
wherep, is the predicted leakage value, 0, is the actual leakage value, and 120 is the number of patterns in the observed database. 0, is used in the denominator to ensure the prediction accuracy for smaller leakages.
Genetic algorithms are efficient for broad search. After tens of generations, the bit strings in each generation look similar. At that time the genetic algorithms are not efficient to search further. A local search technique called leave-one-out is used to improve the search efficiency. For example, in some generation, variables 1,2,3,4,5 are found by genetic algorithms as the most important variable set so far. Its fitness fbnction value is& Now we use the subset (2,3,4,5), (1,3,4,5), (1,2,4,5), (1,2,3,5), and (1,2,3,4) to make predictions using equations (1) and (2) and calculate their fitness function valuesf,, fi, A, fr andfs respectively using equation (3). If& is the smallest among fr, fi, fj, fi andfs, we use variables 1,2,3,4 as a new starting point, whose fitness function value becomes newf,, and do the local search again untilf,

stops decreasing. This technique is very effective to reduce the number of variables after genetic algorithm search for each generation.
RESULTS OF TRANSIENT SEVERITY PREDICTIONS
Genetic algorithms search is computational intensive. For this particular problem, it took 24 hours to find the most important variable set for one transient type on a PC486DX2/50. With a minor modification, the genetic algorithm was ported to the KSR1-64 supercomputer which has 64 processors. Each KSR1-64 processor is twice as fast as the PC486DX2/50. Figure 1 is the genetic algorithm search speed benchmark test. From this figure it is seen clearly that the KSR1-64 running speed increased linearly when more and more processors were used. This means that our parallel implementation of the genetic algorithm achieved good load balance on each processor. By using 40 processors in parallel, it took only about 20 minutes to complete the same computation. The most important variable sets found by the genetic algorithm varied from one transient type to another. The number of variables in the most important variable sets varied from 7 to 24 out of the original 76 variables.
To predict the transient severity levels, a new database was prepared for each transient. From each of the above six severity level data, 50 patterns are sampled to form a transient severity database where there are 300 patterns. For each presented pattern of a known transient type, we used the similarity based formula (equation (1)) and its most important variable set to find two nearest neighbors from its transient severity database. Then we used the interpolation formula (equation (2)) to predict the leakage corresponding to the presented pattem. Figure 2 is the predicted result for one transient type. For the rest of the transient types, the results are similar. From this figure, one can see clearly that the predicted leakages are very close to the actual leakages except in the beginning of the transient. As far as feasibility is concerned, this system is implemented in a PC486DXU50 with a prediction speed as fast as 0.05 second per prediction which is fast enough in real situation.
As a comparison, we used the historid database to train a backpropagation family neural network with 76 input nodes, 5 to 10 hidden nodes (one hidden layer) and 1 output node. After the training, we used the observed database to test the neural network. The test result is not good for the large leakage patterns. For the smallest leakage patterns, some predicted leakages became negative which are impossible in reality.
CONCLUSIONS
Genetic algorithms are very robust search techniques. They have been used here to find the most important variable sets which are necessacy for the accurate predictions. The combmtion of the SBF and the most important variable sets has proved to be an effective appxvach to the detection and quantification of leaks. One advantage of this approach is that the predicted results are traceable. One can trace to the specific patterns in the historical database which contributed to the predicted results. Another advantage of this approach is that no training is involved.

ACKNOWLEDGMENT
The authors would like to thank , 4 y Ryan an Stan Chan of Ryan Nuclear, Inc. for providing data from their San Onofre Nuclear Power Plant Simulator as well as technical advice.
REFERENCES
[l] Uhrig, R. and Guo, 2. (1989). "Use of Neural Networks to Identify Transient Operation Conditions in Nuclear Power Plants", l 3 m x d q p of Tnternational
nn Ava in -, Madrid, Spain, April 10-14, 1989.
[2] Wett, E. and Uhrig, R. (1992). "Nuclear Power Plant Status Diagnostics Using an Artiiicial Neural Network", -, Vol. 97, pp 272-281, March 1992.
[3] Bartal, Y., Lin, J., Uhrig, R. (1993). "Nuclear Power Plants Transient Diagnostics Using Artificial Neural Networks", f l . . -, Volume 3. ASME press. . . . [4] David E. Goldberg (1989).
[5] Lawrence Davis (1991). Handhnok nf . Van Nostrand
[6] Legendre, L. (1983). [7J Kelly, J. and Davis, L. (1991). "Hybridizing the Genetic Algorithm and the K
Nearest Neighbors Classification Algorithm", l?mxdqy of the F d 1, Morgan Kaufman Publishers, 1991.
[SI Punch, W., Goodman, E., Pei, M., Lai, C., Hovland, P., and Enbody, R. (1993). "Further Research on Feature Selection and Classification Using Genetic Algorithms", J h x x d i n ~ m - on Genetic Algodmu, Morgan Kaufman Publishers, 1993.
in leaming. Reading, Mass. Addison-Wesley Publishing Co.
Reinhold. , Elsevier Scientific Pub. Co.
Number of Processors Used
Figure 1 The genetic algorithm running speed benchmark
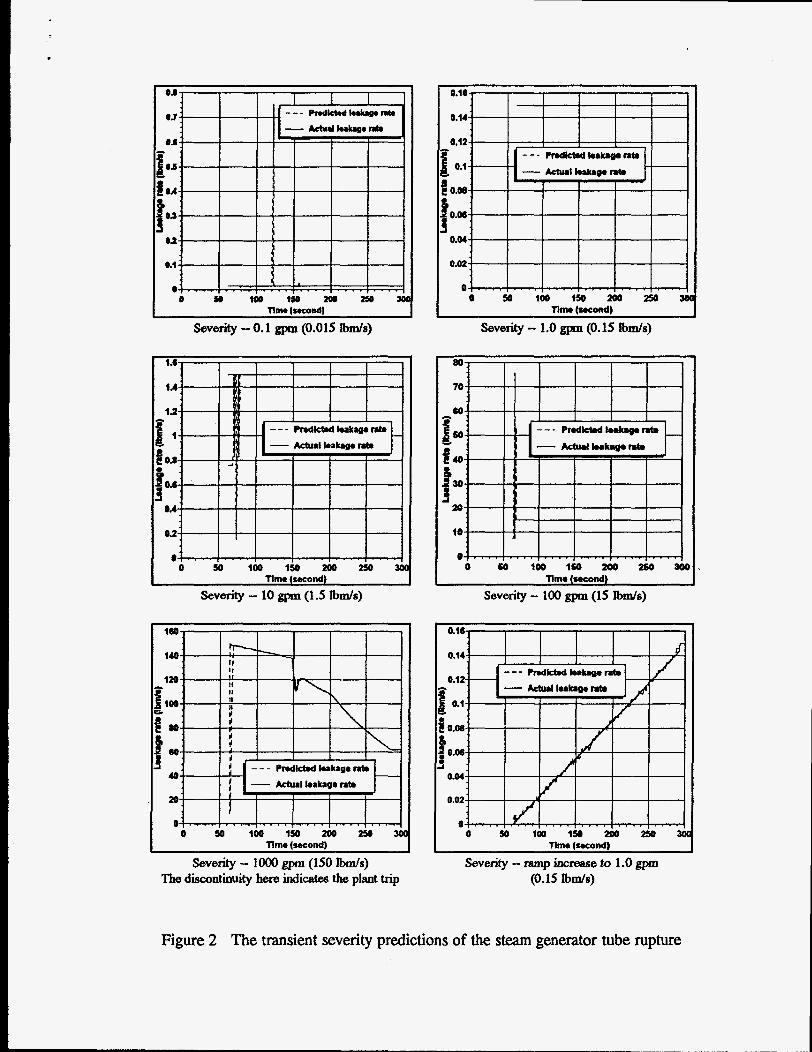
severity - 0.1 gpn (0.015 bds)
severity - 10 gpm (1.5 W S )
Time (second)
severity - lo00 gpm (150 b d s ) The discontinuity here indicates the plant trip
severity - 1.0 gpm (0.15 bds)
I Time (second) Severity - 100 gpm (15 l b d s )
O e r n r n 0 0 5 0 1 0 0 1 5 0 2 0 0 2 5 0 3 0
Tlme (second)
Severity - ramp increase to 1.0 gpm (0.15 buds)
Figure 2 The transient severity predictions of the steam generator tube rupture