Embed Size (px)
Citation preview
Predicting risk of unplanned hospital readmission in survivors of critical illness: a population-level cohort study
Nazir I Lone PhD1 2, Robert Lee MSc2, Lisa Salisbury PhD1 3, Eddie Donaghy PhD1 4, Pamela Ramsay
PhD1 5, Janice Rattray PhD6, Timothy S Walsh MD1 2 4
1 University Department of Anaesthesia, Critical Care, and Pain Medicine, School of Clinical Sciences,
University of Edinburgh, 47 Little France Crescent, Edinburgh, EH16 4SA, UK.
2 Usher Institute for Population Health Sciences and Informatics, University of Edinburgh, Teviot
Place, Edinburgh, EH8 9AG, UK.
3 Queen Margaret University Edinburgh, Queen Margaret Drive, Musselburgh, EH21 6UU, UK.
4 MRC Centre for Inflammation Research, University of Edinburgh, 47 Little France Crescent,
Edinburgh, EH16 4TJ, UK.
5 Edinburgh Napier University, 219 Colinton Rd, Edinburgh EH14 1DJ, UK.
6 School of Nursing and Health Sciences, University of Dundee, 11 Airlie Place, Dundee, DD1 4HJ
Corresponding author and institution where work was performedDr Nazir Lone, University Department of Anaesthesia, Critical Care, and Pain Medicine, School of
Clinical Sciences, University of Edinburgh, 47 Little France Crescent, Edinburgh, EH16 4SA. Email:
[email protected] Phone: +44 131 242 6395
Word count
3689
Online supplementThis article has an online data supplement.
Key wordsIntensive care; critical care; patient readmission; hospitalization; outcome
1
2
AbstractBackgroundIntensive care unit survivors experience high levels of morbidity after hospital discharge and are at
high risk of unplanned hospital readmission. Identifying those at highest-risk before hospital
discharge may allow targeting of novel risk reduction strategies. We aimed to identify risk factors for
unplanned 90-day readmission, develop a risk prediction model and assess its performance to screen
for ICU survivors at highest readmission risk.
MethodsPopulation cohort study linking registry data for patients discharged from general ICUs in Scotland
(2005-2013). Independent risk factors for 90-day readmission and discriminant ability (c-index) of
groups of variables were identified using multivariable logistic regression. Derivation and validation
risk prediction models were constructed using a time-based split.
ResultsOf 55,975 ICU survivors, 24.1% (95%CI 23.7%,24.4%) had unplanned 90-day readmission. Pre-
existing health factors were fair discriminators of readmission (c-index 0.63,95%CI 0.63,0.64), but
better than acute illness factors (0.60) or demographics (0.54). In a subgroup of those with no
comorbidity, acute illness factors (0.62) were better discriminators than pre-existing health factors
(0.56). Overall model performance and calibration in the validation cohort was fair (0.65,95%CI
0.64,0.66) but did not perform sufficiently well as a screening tool, demonstrating high false
positive/false negative rates at clinically relevant thresholds.
ConclusionsUnplanned 90-day hospital readmission is common. Pre-existing illness indices are better predictors
of readmission than acute illness factors. Identifying additional patient-centred drivers of
readmission may improve risk prediction models. Improved understanding of risk factors that are
amenable to intervention could improve the clinical and cost-effectiveness of post-ICU care and
rehabilitation.
3
Word count: 250
4

Key points
What is the key question?
What is the relative importance of risk factors for unplanned 90-day readmission in ICU survivors
and can those at highest risk of readmission be screened for using risk prediction models?
What is the bottom line?
24.1% of ICU survivors had unplanned 90-day readmission. Pre-existing illness indices were better
predictors of readmission than acute illness factors but this was reversed in the subgroup with no
recorded comorbidity. Discriminant ability of the overall risk prediction model was fair (c-index 0.65)
but the model did not perform sufficiently well as a screening tool at clinically relevant probability
thresholds.
Why read on?
The high unplanned hospital readmission rates we report in ICU survivors are similar to those with
chronic diseases. We provide a comprehensive evaluation of drivers for readmission and highlight
the importance of pre-illness health factors in post-ICU morbidity.
5
Introduction
Unplanned hospital readmissions within 30 days are estimated to cost the health service in England
over £2 billion per year and over $17 billion per year in US Medicare expenditure.(1, 2) Reduction
strategies targeting readmissions have therefore been a focus for policy makers through quality
improvement activities and financial penalties.(2, 3) ICU survivors are known to experience
increased mortality, use more acute hospital resource and reduced quality of life in the years
following hospital discharge.(4-8) This increased morbidity has been termed the ‘post-intensive care
syndrome’ and may leave ICU survivors and their care-givers with less resilience to new acute
stressors as well as persisting problems related to the acute critical illness.(9)
Unplanned hospital readmission is a potentially useful outcome measure in ICU survivor populations.
It is easy to measure in linked information systems, is associated with increased costs, and may
reflect the effectiveness of rehabilitation interventions, which are increasingly considered a standard
of care following critical illness(10) despite recent conflicting trial evidence.(11) However, the
validity of unplanned readmission as an outcome measure requires an understanding of contributing
factors, especially those that are potentially modifiable by intervention within survivor populations.
Although statistical models have been developed to predict readmission risk for many hospitalised
patient groups,(12-14) none have specifically assessed ICU populations with risk factors related to
the critical illness episode e.g. organ dysfunction. An ICU-specific model could potentially identify
survivors at high risk, and might enable screening of survivors before hospital discharge in whom to
target novel risk reduction strategies.
As part of a mixed-methods programme exploring drivers of unplanned readmission following
critical illness(15), we undertook a national cohort study to quantify the proportion of ICU survivors
experiencing readmission within 90 days of discharge and identify risk factors for 90-day
readmission. We also aimed to develop a risk prediction model and assess its performance as a
screening tool to identify ICU survivors at highest readmission risk.
6
Methods
Approvals
This study gained approval from the Privacy Advisory Committee of NHS National Services Scotland
(Reference PAC 12/14). South East Scotland Research Ethics Committee granted a waiver (Reference
NR/1403AB5). All data were anonymised and analysed in a safe haven environment.
Study setting and databases
We used a cohort study design. Data sources were linked registries: Scottish Intensive Care Society
Audit Group (SICSAG),(16) Scottish Morbidity Record of acute hospital admissions (SMR01), Scottish
death records, acute psychiatric hospital admissions (SMR04), Scottish Cancer Registry, and Scottish
outpatient registry (SMR00). The SICSAG audit registry captures all adult general intensive care
activity (24 units in 2013) serving a population of around 5 million (4.2 million aged ≥16) within
Scotland and is subject to regular validation assessments.(17) See Supplement health service setting
details.
Participants
The cohort comprised Scottish residents aged ≥16 admitted to and discharged from general ICUs in
Scotland (01/01/2005-31/12/2013) who survived to hospital discharge. For analyses to identify
predictors of readmission, the whole cohort was used. For analyses relating to the risk prediction
model construction, a time-based partition of the dataset was used to create two groups: discharge
from index hospital stay 01/01/2005-17/01/2012, derivation cohort (70%); 18/01/2012-31/12/2013,
validation cohort (30%). For analyses demonstrating the performance of the risk prediction model as
a screening tool, the validation cohort was used.
7
Variables
Outcomes: The primary outcome was first unplanned hospital readmission within 90 days of
discharge from index hospitalisation. Second and subsequent readmissions were not included. We
chose this time-point as the survivorship literature shows a longer period ‘at risk’, both for increased
mortality and hospital resource use.(4-6) ‘Unplanned hospital admission’ was defined using
‘emergency admission’ codes in the ‘Admission Type’ field in SMR01 database (accuracy >93% in
validation reports).(18) We also reported a secondary composite outcome of 90d death or
unplanned readmission. Follow up was complete, although emigration from Scotland was not
recorded. However, emigration in older age groups from Scotland to the remainder of the UK or
overseas is known to be low (0.6% of residents aged ≥45 years annually).(19)
Predictors: Factors were classified into three groups: demographics; indices of pre-existing patient
health; and indices of critical illness severity. See Supplement for additional information relating to
variables.
Statistical analysis
Data were analysed using SAS Enterprise Guide v6.1 (SAS Institute,Cary,NC,USA) and Stata v14
(StataCorp LC,Texas,USA). A complete cases analysis was performed for all analyses. Additional
information is available in the Supplement. We undertook two separate modelling strategies: one to
identify independent predictors of readmission risk and one to develop a risk prediction model.
Univariable/multivariable predictors: Individual univariable associations with the outcome were
assessed by entering each variable in a logistic regression model and reporting the odds ratio with
95% confidence interval (95%CI). The c-index was presented to aid interpretation of the predictive
ability of each variable. The c-index quantifies the ability of a model to distinguish between patients
who experience a readmission and those who do not. A c-index of 0.5 indicates the model performs
no better than chance and 1.0 indicates perfect discrimination. However, the c-index may be
insensitive when used alone to compare between models. Therefore, to assess the relative
8
importance of the three pre-defined groups of variables (demographics, indices of pre-existing
health, indices of critical illness), the c-index of each group was estimated and observed risk was
plotted against equal size deciles of predicted risk. This plot differs from a calibration plot as the
deciles of predicted risk are plotted at intervals of equal width on the x-axis rather than at the mean
of predicted risk for the decile. Therefore, a steeper upward gradient of observed risk across the x-
axis indicates that the group of variables is a better predictor of the outcome than another group. In
addition, we presented the classification tables in supplementary material.(20) This illustrates the
change in classification of events and non-events when comparing two models. Multivariable
associations with the outcome were assessed using logistic regression with no variable selection
procedures.
Risk prediction model: We chose a time-based split as this is a stronger design for internal validation
than a random split as the former method allows for random variation.(21) Variable selection for the
model derivation was performed using backward elimination with a significance level of 0.05 using
70% of the cohort. We assessed model performance by assessing: discriminant ability, assessed by
calculating the concordance index (c-index) and presenting a receiver operating characteristics (ROC)
curve; calibration, assessed with a calibration plot of predicted probability against observed
proportion with the outcome; and overall model performance by calculating Brier’s score. We
followed best practice and did not apply a statistical test for calibration (e.g. Hosmer-Lemeshow test)
nor reported calibration in the derivation dataset.(21) We presented sensitivity and specificity at
thresholds of predicted risk to illustrate the ability of the model to be used as a tool to screen
patients before hospital discharge.
Subgroup analyses: We repeated multivariable analyses to identify if the relationship between
groups of predictors and unplanned readmission differed in two subgroups: patients admitted to
ICU on an unplanned basis (excluding those admitted after elective surgery) and patients with no
recorded comorbidity. The rationale for this was that patients admitted electively to ICU after
9
planned surgery may follow recognised pathways post-hospital discharge. Similarly, patients with no
previous comorbidity may have different drivers for unplanned readmission which may be more
attributable to acute illness rather than pre-existing ill health.
Sensitivity analysis: We performed the following sensitivity analyses:
1. To evaluate if a shorter follow-up period affected the relative importance of the three pre-defined
groups of variables, we repeated analyses using 30-day unscheduled readmission as the outcome
comparing c-indices and ROC curves between groups.
2. To evaluate the effect of death as a competing risk to readmission, we used two approaches. We
repeated analyses with the composite outcome of 90-day death or unplanned readmission,
inspecting outcome distribution of death without readmission across categories, univariable odds
ratios, and risk prediction model performance. However, this approach gives equal value to death
and readmission in the outcome. Therefore, we also used Fine and Gray competing risk regression
models to identify independent predictors of time to unscheduled readmission within 90 days which
explicitly accounts for the competing risk of death. We evaluated the relative importance of groups
of variables by reporting change in Akaike Information Criterion (AIC), a measure of model fit (lower
values indicate better fit).
3. To evaluate the effect of representation of comorbidities, we repeated the multivariable analysis
replacing count of comorbidities with individual comorbidities.
Results
In total, 55,975 patients were admitted to ICUs and discharged alive (eFigure 1). Median age was
60yrs (IQR 45,71), and patients living in the most deprived regions were over-represented (49.2%
resident in two most deprived quintiles, 40% in general population) (Table 1; eTable 1). Pre-existing
illness and morbidity was prevalent: 31.3% had an unplanned admission during the previous year;
10

56.4% had at least one comorbidity. Previous alcohol-related (10.8%) and drug-related morbidity
(7.0%) were prevalent (eTable 1). The commonest admission diagnosis was pneumonia (8.4%).
Of 55,975 patients, 13,471 (24.1%,95%CI 23.7%,24.4%) experienced unplanned 90d readmission
(Figure 1). A further 712 (1.3%,95%CI 1.2%,1.4%) died without being admitted. 14,183 patients
(25.3%,95%CI 25.0%,25.7%) experienced 90d readmission/death). An additional 1015 (1.8%, 95%CI
1.7%,1.9%) died within 90 days, but these deaths occurred after an unplanned readmission.
11
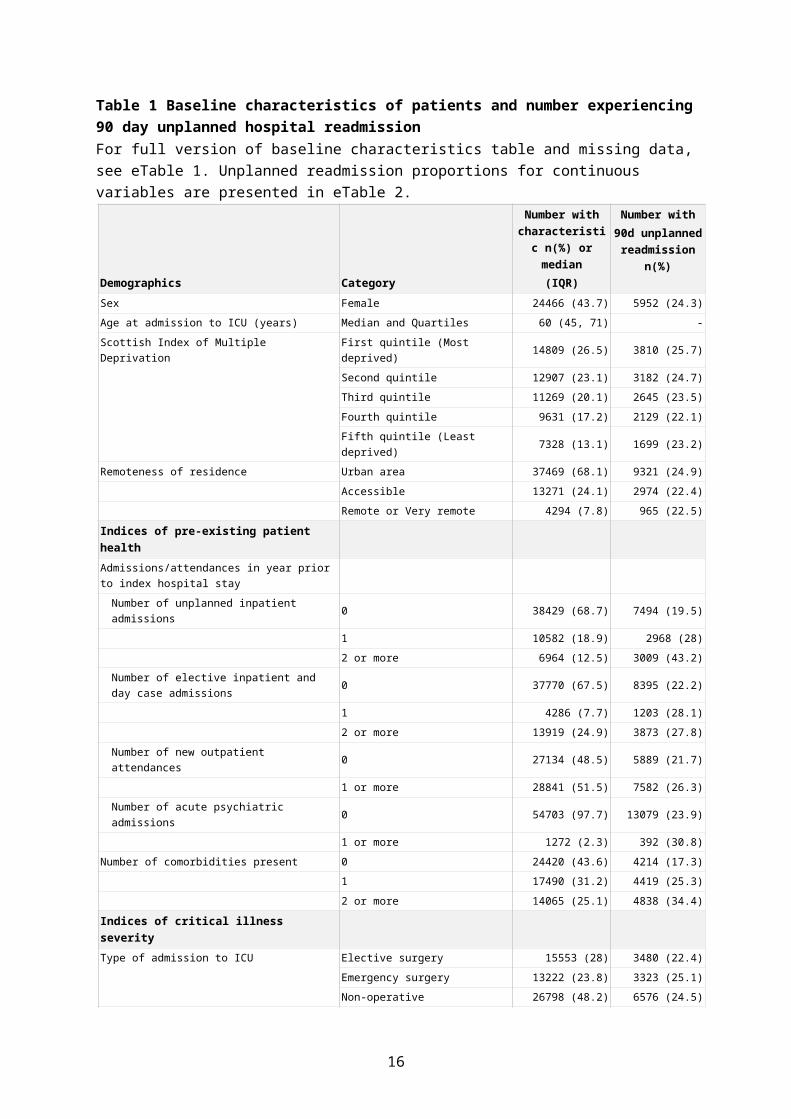
Table 1 Baseline characteristics of patients and number experiencing 90 day unplanned hospital readmissionFor full version of baseline characteristics table and missing data, see eTable 1. Unplanned readmission proportions for continuous variables are presented in eTable 2.
Demographics Category
Number with characteristic
n(%) or median (IQR)
Number with90d unplanned
readmission n(%)
Sex Female 24466 (43.7) 5952 (24.3)
Age at admission to ICU (years) Median and Quartiles 60 (45, 71) -
Scottish Index of Multiple Deprivation First quintile (Most deprived) 14809 (26.5) 3810 (25.7)
Second quintile 12907 (23.1) 3182 (24.7)
Third quintile 11269 (20.1) 2645 (23.5)
Fourth quintile 9631 (17.2) 2129 (22.1)
Fifth quintile (Least deprived) 7328 (13.1) 1699 (23.2)
Remoteness of residence Urban area 37469 (68.1) 9321 (24.9)
Accessible 13271 (24.1) 2974 (22.4)
Remote or Very remote 4294 (7.8) 965 (22.5)
Indices of pre-existing patient healthAdmissions/attendances in year prior to index hospital stay
Number of unplanned inpatient admissions 0 38429 (68.7) 7494 (19.5)
1 10582 (18.9) 2968 (28)
2 or more 6964 (12.5) 3009 (43.2)
Number of elective inpatient and day case admissions 0 37770 (67.5) 8395 (22.2)
1 4286 (7.7) 1203 (28.1)
2 or more 13919 (24.9) 3873 (27.8)
Number of new outpatient attendances 0 27134 (48.5) 5889 (21.7)
1 or more 28841 (51.5) 7582 (26.3)
Number of acute psychiatric admissions 0 54703 (97.7) 13079 (23.9)
1 or more 1272 (2.3) 392 (30.8)
Number of comorbidities present 0 24420 (43.6) 4214 (17.3)
1 17490 (31.2) 4419 (25.3)
2 or more 14065 (25.1) 4838 (34.4)
Indices of critical illness severityType of admission to ICU Elective surgery 15553 (28) 3480 (22.4)
Emergency surgery 13222 (23.8) 3323 (25.1)
Non-operative 26798 (48.2) 6576 (24.5)
APACHE II score at admission to ICU Median and Quartiles 15 (11, 20) -
Mechanical ventilation during ICU stay Yes 33447 (60.2) 8116 (24.3)
Renal replacement therapy during ICU stay Yes 3925 (7.1) 1170 (29.8)
Cardiovascular system support during ICU stay Yes 20101 (36.2) 5174 (25.7)
Maximum number of organs supported on any day during ICU stay
0 17877 (32.2) 4070 (22.8)
1 20969 (37.8) 5032 (24)
2 14277 (25.7) 3638 (25.5)
3 2407 (4.3) 649 (27)
Length of ICU stay (days) Median and Quartiles 2 (1, 4) -
Length of index hospital stay (days) Median and Quartiles 15 (8, 31) -
12
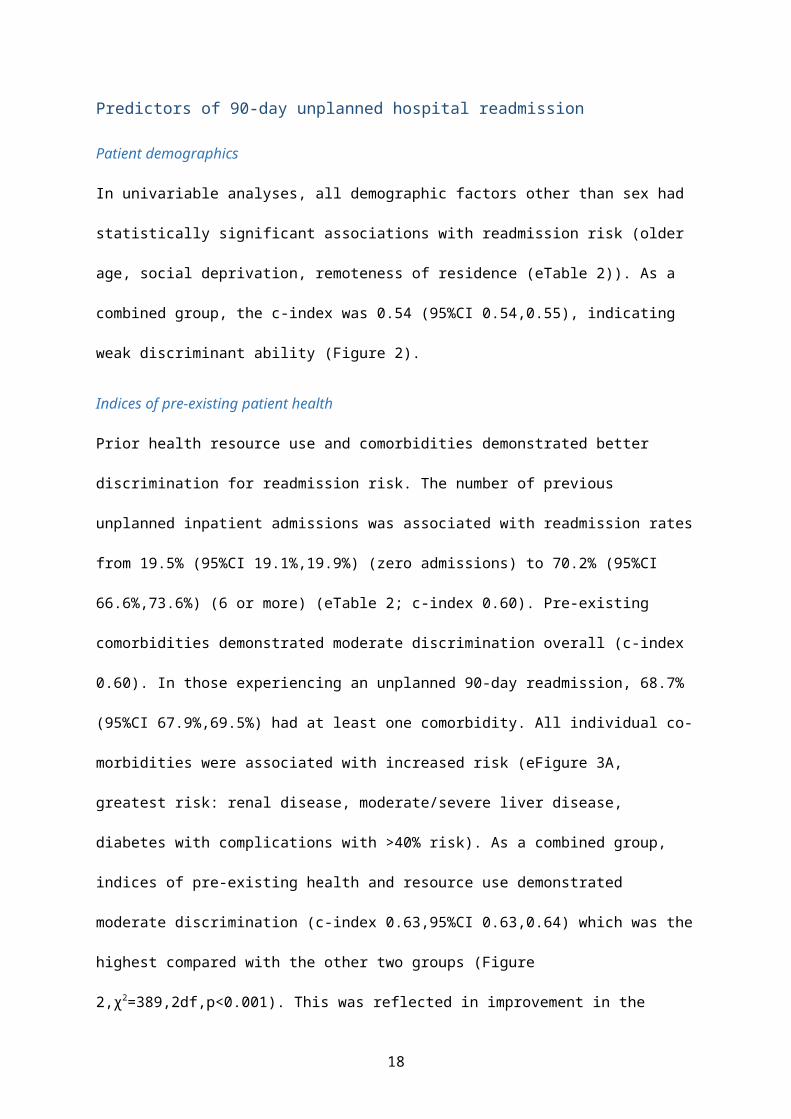
Predictors of 90-day unplanned hospital readmission
Patient demographics
In univariable analyses, all demographic factors other than sex had statistically significant
associations with readmission risk (older age, social deprivation, remoteness of residence (eTable
2)). As a combined group, the c-index was 0.54 (95%CI 0.54,0.55), indicating weak discriminant
ability (Figure 2).
Indices of pre-existing patient health
Prior health resource use and comorbidities demonstrated better discrimination for readmission risk.
The number of previous unplanned inpatient admissions was associated with readmission rates from
19.5% (95%CI 19.1%,19.9%) (zero admissions) to 70.2% (95%CI 66.6%,73.6%) (6 or more) (eTable 2;
c-index 0.60). Pre-existing comorbidities demonstrated moderate discrimination overall (c-index
0.60). In those experiencing an unplanned 90-day readmission, 68.7% (95%CI 67.9%,69.5%) had at
least one comorbidity. All individual co-morbidities were associated with increased risk (eFigure 3A,
greatest risk: renal disease, moderate/severe liver disease, diabetes with complications with >40%
risk). As a combined group, indices of pre-existing health and resource use demonstrated moderate
discrimination (c-index 0.63,95%CI 0.63,0.64) which was the highest compared with the other two
groups (Figure 2,χ2=389,2df,p<0.001). This was reflected in improvement in the classification of
patients not experiencing a readmission of 31.5% and 10.7% in comparison to demographics and
critical illness severity indices respectively at the expense of worse reclassification of patients
experiencing a readmission (-18.2% and -6.1% respectively) (eTables 3a and 3b).
Indices of critical illness severity
Overall, diagnostic category (c-index 0.57) and APACHE II score (c-index 0.55) were weak
discriminators (eTable 2). Some specific diagnostic categories were associated with high readmission
risk (variceal bleed (45.8%; 95%CI 41.3%,50.4%) and pancreatitis (40.0%; 95%CI 36.1%,44.1%)).
Organ support variables were weak discriminators of 90-day readmission (c-index range 0.51-0.52).
13

Similarly, length of post-ICU hospital stay and overall length of hospital stay were weak
discriminators (c-index 0.52-0.56). As a combined group, the c-index for indices of critical illness
severity was 0.60 (95%CI 0.60,0.61) (Figure 2).
Multivariable analyses
In multivariable analyses, number of previous unplanned admissions was strongly associated with
risk of 90-day readmission, with a predicted absolute risk increase from 20.3% (95%CI 19.9%,20.8%)
in those with no previous readmissions to 61.1% (95%CI 57.7%,65.5%) in those with 6 or more (OR
6.19,95%CI 5.12,7.49) (eTable 4). Readmission risk increased with comorbidity count, from 19.5%
(no comorbidities;95%CI 18.8%,20.1%) to 34.5% (5 or more;95%CI 30.6%,38.5%). Replacing
comorbidity count with individual comorbidities revealed seven individual comorbidities no longer
retained statistical significance (eFigure 3B). Several other factors remained statistically significant,
but the gradient of readmission risk across categories was less pronounced; these included age, type
of admission to ICU, and length of post-ICU hospital stay. Several specific diagnoses were
independently associated with predicted risk substantially higher than the population mean, namely
oesophageal variceal bleed (33.5%, 95%CI 28.8%,38.1%) and pancreatitis (38.4%, 95%CI
34.0%,42.7%). Several factors were not significant predictors in multivariable analysis, including
socioeconomic status, APS, and ICU length of stay.
Risk prediction model
In the derivation cohort (n=33294, eTable 5), the overall discriminant ability of the model was fair (c-
index 0.67,95%CI 0.66,0.67) and overall performance was acceptable (Brier’s score 0.170). In the
validation cohort (eTable 6), discriminant ability and overall performance were similar (c-index
0.65,95%CI 0.64,0.66; Brier’s score 0.176; Figure 3). Model calibration across the range of predicted
risk in the validation cohort was reasonable although the model slightly under-predicted readmission
risk (mean observed risk 25.0%; mean predicted risk 23.6%) (eFigure 4).
14

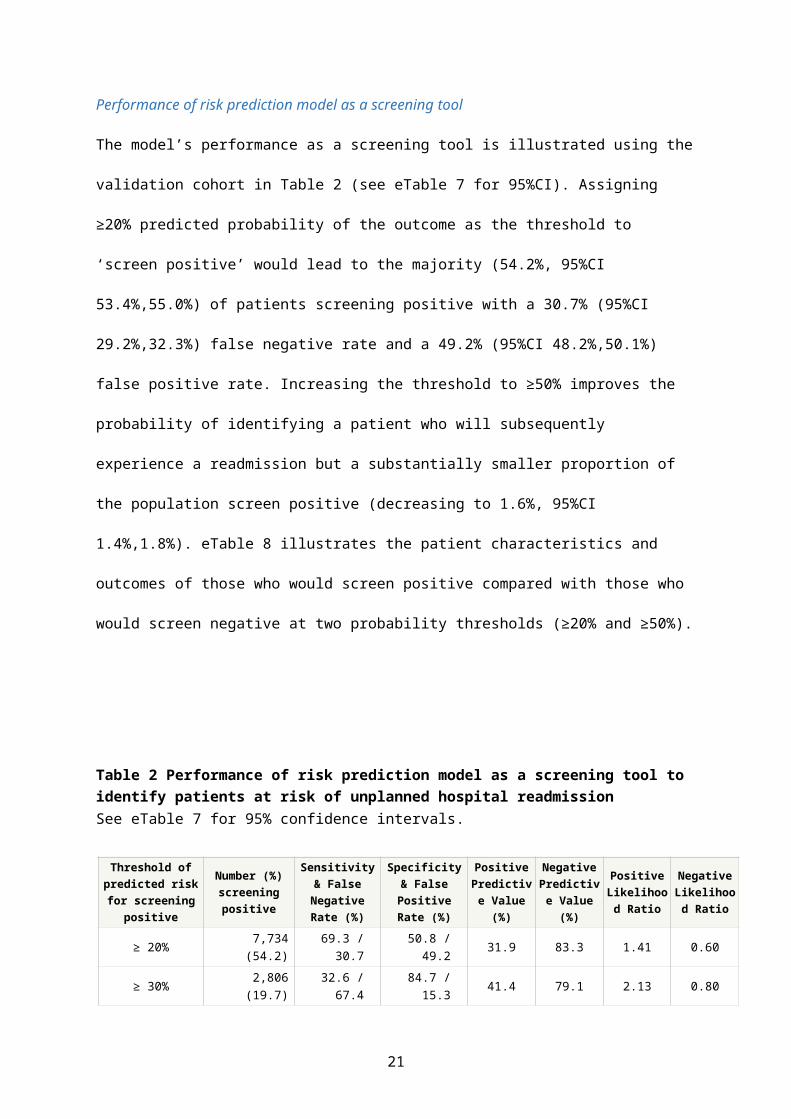
Performance of risk prediction model as a screening tool
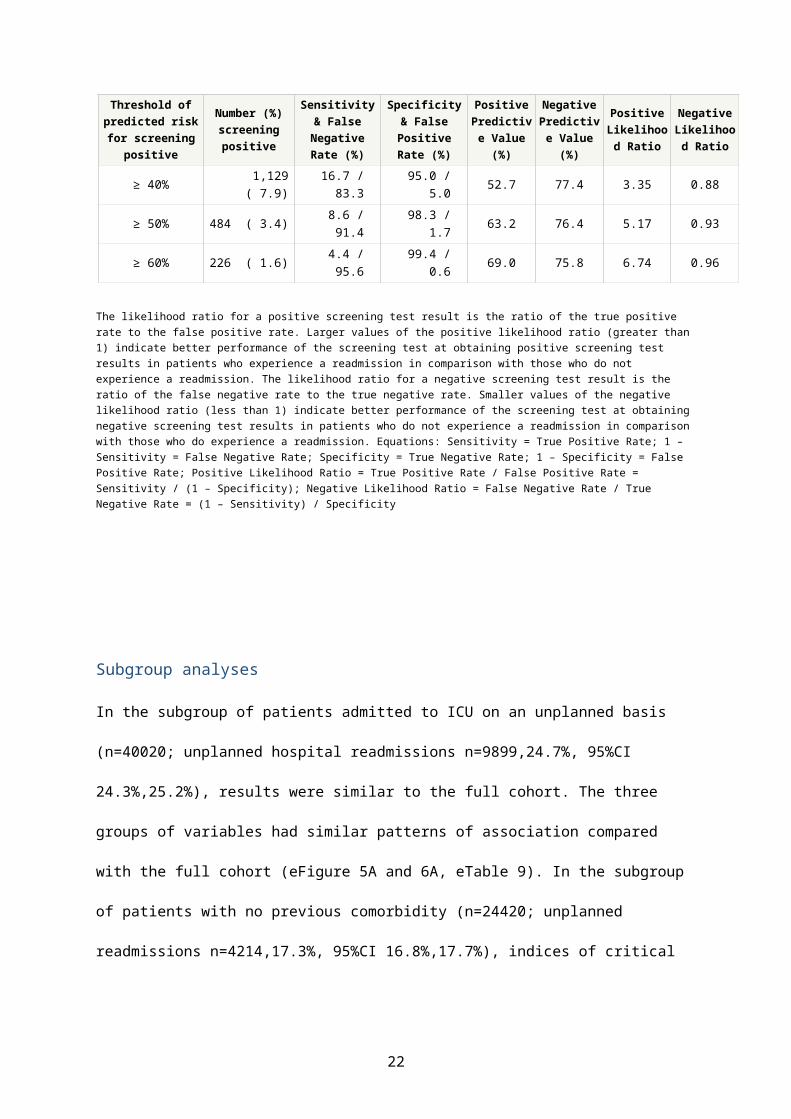
The model’s performance as a screening tool is illustrated using the validation cohort in Table 2 (see
eTable 7 for 95%CI). Assigning ≥20% predicted probability of the outcome as the threshold to ‘screen
positive’ would lead to the majority (54.2%, 95%CI 53.4%,55.0%) of patients screening positive with
a 30.7% (95%CI 29.2%,32.3%) false negative rate and a 49.2% (95%CI 48.2%,50.1%) false positive
rate. Increasing the threshold to ≥50% improves the probability of identifying a patient who will
subsequently experience a readmission but a substantially smaller proportion of the population
screen positive (decreasing to 1.6%, 95%CI 1.4%,1.8%). eTable 8 illustrates the patient characteristics
and outcomes of those who would screen positive compared with those who would screen negative
at two probability thresholds (≥20% and ≥50%).
Table 2 Performance of risk prediction model as a screening tool to identify patients at risk of unplanned hospital readmission See eTable 7 for 95% confidence intervals.
Threshold of predicted risk for
screening positive
Number (%) screening positive
Sensitivity & False Negative
Rate (%)
Specificity & False Positive
Rate (%)
Positive Predictive Value (%)
Negative Predictive Value (%)
Positive Likelihood
Ratio
Negative Likelihood
Ratio
≥ 20% 7,734 (54.2) 69.3 / 30.7 50.8 / 49.2 31.9 83.3 1.41 0.60
≥ 30% 2,806 (19.7) 32.6 / 67.4 84.7 / 15.3 41.4 79.1 2.13 0.80
≥ 40% 1,129 ( 7.9) 16.7 / 83.3 95.0 / 5.0 52.7 77.4 3.35 0.88
≥ 50% 484 ( 3.4) 8.6 / 91.4 98.3 / 1.7 63.2 76.4 5.17 0.93
≥ 60% 226 ( 1.6) 4.4 / 95.6 99.4 / 0.6 69.0 75.8 6.74 0.96
The likelihood ratio for a positive screening test result is the ratio of the true positive rate to the false positive rate. Larger values of the positive likelihood ratio (greater than 1) indicate better performance of the screening test at obtaining positive screening test results in patients who experience a readmission in comparison with those who do not experience a readmission. The likelihood ratio for a negative screening test result is the ratio of the false negative rate to the true negative rate. Smaller values of the negative likelihood ratio (less than 1) indicate better performance of the screening test at obtaining negative screening test results in patients who do not experience a readmission in comparison with those who do experience a readmission. Equations: Sensitivity = True Positive Rate; 1 – Sensitivity = False Negative Rate; Specificity = True Negative Rate; 1 – Specificity = False Positive Rate; Positive Likelihood Ratio = True Positive Rate / False Positive Rate = Sensitivity / (1 – Specificity); Negative Likelihood Ratio = False Negative Rate / True Negative Rate = (1 – Sensitivity) / Specificity
15
Subgroup analyses
In the subgroup of patients admitted to ICU on an unplanned basis (n=40020; unplanned hospital
readmissions n=9899,24.7%, 95%CI 24.3%,25.2%), results were similar to the full cohort. The three
groups of variables had similar patterns of association compared with the full cohort (eFigure 5A and
6A, eTable 9). In the subgroup of patients with no previous comorbidity (n=24420; unplanned
readmissions n=4214,17.3%, 95%CI 16.8%,17.7%), indices of critical illness severity had the greatest
discriminant ability (c-index 0.622) (eFigure 5B and 6B, eTable 9).
Sensitivity analysis
Similar results were found using 30-day unscheduled readmission as the outcome: indices of pre-
existing patient health retained the highest discriminant ability (c-index 0.617 vs 0.601 critical illness
indices vs 0.535 demographics; χ2=304,2df,p<0.001) (eFigure 2; eTable 9).
The small proportion of deaths without a preceding unplanned readmission that occurred in
individuals was relatively balanced across covariates in the derivation cohort (eTable 2). Both
sensitivity analyses using logistic regression models of combined outcome of 90-day death or
readmission and time to first unplanned readmission (Fine and Gray regression model) accounting
for the competing risk of death (eTable 4) did not substantially differ from the findings of the
primary multivariable analysis. Model performance for the combined outcome of 90-day death or
readmission was similar (c-index 0.66,95%CI 0.65,0.67; Brier’s score 0.179). The relative importance
of the three groups of covariates was similar for both analyses comparing c-indices of the combined
outcome (90d death/readmission) (eFigure 2; eTable 9) and analyses comparing AIC for time to first
unplanned readmission (AIC 244863 pre-existing health vs 246039 critical illness indices vs 246909
demographics; full model 244238).
16

Discussion
In a large, complete population study, we have demonstrated that 1 in 4 ICU survivors experience an
unplanned readmission within 90 days of hospital discharge. Indices of pre-existing ill health were
more strongly predictive of readmission than indices of critical illness severity in the whole cohort,
but this was reversed in subgroup analyses of patients with no recorded comorbidity. A risk
prediction model derived from multiple data sources had, at best, only moderate discriminant
ability. A screening tool derived from this model is unlikely to perform sufficiently well in isolation to
identify cases in whom to target high intensity interventions aimed at reducing readmissions
amongst ICU survivors.
Our data indicate unplanned readmission rates among ICU survivors are substantially higher than
the general hospital population (30 day readmission 14.7% in ICU survivors vs 7.0% in all hospital
inpatients(22)). Unplanned readmission rates are increasingly used as a quality indicator and target
for improvement.(23, 24) Although many variables had statistically significant associations with
readmission risk, almost all had limited discriminant power as individual factors. A key finding was
that ICU-related factors such as organ support are not independently associated with readmission
risk among survivors. In contrast, pre-existing health factors had the greatest predictive power of all
variables. However, in the subgroup of patients with no pre-existing comorbidity, indices of critical
illness had greater discriminant power than pre-existing health factors. These findings are consistent
with pre-critical illness chronic health being the dominant factor at a population-level in general
critical care survivors in determining post-ICU health trajectories, whereas new impairments that
follow an ICU admission may be more dominant in subgroups with no comorbidity.(25-27)
Addressing recovery from critical illness from this perspective has important implications for
research, policy, and service design given the high prevalence of older patients with comorbidity in
critical care populations.(4, 6) For example, it may explain the lack of effect on clinical outcomes
from rehabilitation interventions focussed mostly on physical therapy alone,(7) and also questions
17
the rationale for using outcomes such as longer term hospital costs and HRQoL in critical care trials
without accounting for pre-illness health status.
Our model had a similar discriminant ability compared with other published risk prediction scores
used in general hospitalised populations (c-indices of studies using retrospective administrative data
0.55-0.72)(28). This was despite inclusion of ICU-related/acute factors. These findings may be
explained by our datasets not including important factors associated with readmission risk, such as
social and organisational factors identified in a systematic review.(28) Research in other populations
highlights the importance of these factors, which have not previously been well-addressed in ICU
survivor populations. For example, family stress,(29) lack of information,(30) and frailty(31) could all
be important during the early post-hospital period. Furthermore, some patients will experience
readmissions due to unpredictable factors which would not be present in exhaustively
comprehensive datasets. Analysis of PROFILE’s qualitative component, comprising interviews and
focus groups with ICU survivors and their carers, may reveal additional insights.(15) Our study clearly
shows that additional research is needed to understand other factors driving readmission risk in this
population to improve the discriminant value of a clinical decision support tool.
We used 90-day unplanned readmission as our primary outcome, whereas 30-day readmission is
widely used in other patient groups.(12, 27, 28, 32) We believe the longer time period is justified
because the ICU survivorship literature shows a longer period ‘at risk’, both for increased mortality
and hospital resource use.(4-6) In addition, a sensitivity analysis using 30-day readmission as the
outcome was similar to the primary outcome. Furthermore, HRQoL typically starts to plateau in ICU
survivors after three months(7, 31) and this time point is widely used for primary outcome
measurement in critical care trials.(7, 33) Extending the period of interest further risks including
readmissions that are less causally related to the critical illness hospitalisation.
Our study has a number of strengths. The database had complete population coverage, included a
diverse range of data sources which undergo regular validation, and contained a large number of
18
events, resulting in unbiased, precise estimates. We undertook sensitivity analyses to explore the
effect of death as a competing risk. We reported our risk prediction model using current best
practice and undertook internal validation using a recommended time-based split.(21) Other risk
prediction scores for readmission have minimised the number of variables to ensure ease of clinical
use.(12, 34, 35) We decided a priori to pursue a non-parsimonious approach to model building with
the intention of electronic implementation.
There are potential limitations to our study. We were unable to access measurements of
preadmission functional status, frailty trajectories or biomarkers relating to inflammation, which
have been associated with poorer health outcomes following critical illness.(31, 32, 36, 37)
Furthermore, we had no data on social care or other non-clinical variables that have been shown to
influence readmission risk, for example polypharmacy,(14) or low health literacy.(38) These are not
routinely considered in critical care recovery pathways.
Our study has a number of methodological limitations. Whilst a time-based split is a robust method
of model validation, secular trends in demographics, clinical practice and healthcare organisation can
bias model performance. This may mean time-based validation methods perform worse than
methods in which derivation and validation cohorts are drawn from the same time period. In
addition, using statistical significance to select variables may have resulted in more complex models
than, for example, using change in Bayesian Information Criterion. Furthermore, 12.8% were
missing APACHE II scores. This is due to specific APACHE II model exclusions, rather than being
‘missing’, and these values cannot therefore be imputed. This means our model cannot be
generalised to those patients excluded from APACHE II scoring.
Our design did not enable an assessment of the proportion of readmissions that might be avoided
through interventions. A recent systematic review estimated the median proportion of avoidable
readmissions was 27%.(39) This research question may be better investigated using qualitative
methodology, which was the approach used in a parallel part of our research programme.(15)
19

Understanding the modifiable factors that cause readmissions in critical care survivors is essential for
designing effective anticipatory interventions. Developing and testing such interventions requires
detailed understanding of the factors that may be important.(40) Whilst we could only report
presence of comorbidity, our study suggests optimising chronic disease management is at least as
important as strategies specific to the complications of critical illness.
Our results have important implications for future research and policy. The unplanned readmission
rates we report in ICU survivors are similar to those with chronic disease currently targeted with
specific discharge pathways and community support.(41, 42) Although guidelines promote
rehabilitation after critical illness,(10, 43) the most clinically and cost-effective way to deliver these
are unknown and evidence-based care pathways do not yet exist, in contrast with other conditions
such as myocardial infarction(42) and stroke.(44) Our data support the need for clear pathways with
appropriate support for ICU survivors during care transitions, especially from secondary into primary
care.
Conclusion
We have demonstrated that 1 in 4 patients experience an unplanned hospital readmission within 90
days of discharge following an episode of critical illness. Pre-existing illness indices are better
predictors of readmission risk than acute illness factors at a whole cohort level. In a subgroup of
those with no comorbidity, acute illness factors predominate. Identifying additional patient-centred
drivers of readmission may improve risk prediction models. Improving our understanding of patient
groups and risk factors that are amenable to intervention could improve the clinical and cost-
effectiveness of post-ICU care and rehabilitation.
20
Acknowledgements We are grateful to clinicians in ICUs in Scotland who contribute data to the Scottish Intensive Care
Society Audit Group registry and Information Services Division (ISD Scotland) for providing data and
undertaking linkage.
Competing interestsOn behalf of all authors, the corresponding author states that there is no conflict of interest.
Role of the funding sourceThe project was funded through a research grant from the Chief Scientist Office for Scotland
(reference CZH/401026). The funder had no role in study design; collection, analysis, and
interpretation of data; writing of the report; and in the decision to submit the paper for publication.
The corresponding author had full access to all the data in the study and had final responsibility for
the decision to submit for publication.
Authors’ contributionsAll contributed to conception and design of the work. NL and RL contributed to data acquisition and
analysis. All authors contributed to interpretation of data for the work. NL and TW drafted the work.
All authors revised it critically for important intellectual content. All authors gave final approval of
the version to be published. All authors agree to be accountable for all aspects of the work in
ensuring that questions related to the accuracy or integrity of any part of the work are appropriately
investigated and resolved.
Ethical approvalAll data relating to patients were anonymised and analysed in a safe haven environment. This study
gained approval from the Privacy Advisory Committee of NHS National Services Scotland (Reference
PAC 12/14). South East Scotland Research Ethics Committee granted a waiver (Reference
NR/1403AB5).
21
References
1. Jencks SF, Williams MV, Coleman EA. Rehospitalizations among patients in the Medicare fee-for-service program. The New England journal of medicine 2009;360(14):1418-1428.2. NHS Confederation FTN. Briefing: the impact of non-payment for acute readmissions. Feb 2011. 2011 [cited 14/10/2016]Available from: http://www.chks.co.uk/userfiles/files/The%20impact%20of%20non-payment%20for%20acute%20readmissions%20FINAL%20FOR%20WEB.pdf3. Zuckerman RB, Sheingold SH, Orav EJ, et al. Readmissions, Observation, and the Hospital Readmissions Reduction Program. The New England journal of medicine 2016;374(16):1543-1551.4. Lone NI, Gillies MA, Haddow C, et al. Five-Year Mortality and Hospital Costs Associated with Surviving Intensive Care. Am J Respir Crit Care Med 2016;194(2):198-208.5. Hill AD, Fowler RA, Pinto R, et al. Long-term outcomes and healthcare utilization following critical illness--a population-based study. Critical care (London, England) 2016;20:76.6. Wunsch H, Guerra C, Barnato AE, et al. Three-year outcomes for Medicare beneficiaries who survive intensive care. Jama 2010;303(9):849-856.7. Walsh TS, Salisbury LG, Merriweather JL, et al. Increased Hospital-Based Physical Rehabilitation and Information Provision After Intensive Care Unit Discharge: The RECOVER Randomized Clinical Trial. JAMA internal medicine 2015;175(6):901-910.8. Oeyen SG, Vandijck DM, Benoit DD, et al. Quality of life after intensive care: a systematic review of the literature. Critical care medicine 2010;38(12):2386-2400.9. Needham DM, Davidson J, Cohen H, et al. Improving long-term outcomes after discharge from intensive care unit: report from a stakeholders' conference. Critical care medicine 2012;40(2):502-509.10. Tan T, Brett SJ, Stokes T. Rehabilitation after critical illness: summary of NICE guidance. Bmj 2009;338:b822.11. Connolly B, Salisbury L, O'Neill B, et al. Exercise rehabilitation following intensive care unit discharge for recovery from critical illness. The Cochrane database of systematic reviews 2015(6):Cd008632.12. Donze JD, Williams MV, Robinson EJ, et al. International Validity of the HOSPITAL Score to Predict 30-Day Potentially Avoidable Hospital Readmissions. JAMA internal medicine 2016;176(4):496-502.13. Wallace E, Stuart E, Vaughan N, et al. Risk prediction models to predict emergency hospital admission in community-dwelling adults: a systematic review. Medical care 2014;52(8):751-765.14. Donnan PT, Dorward DW, Mutch B, et al. Development and validation of a model for predicting emergency admissions over the next year (PEONY): a UK historical cohort study. Archives of internal medicine 2008;168(13):1416-1422.15. Walsh TS, Salisbury L, Donaghy E, et al. PReventing early unplanned hOspital readmission aFter critical ILlnEss (PROFILE): protocol and analysis framework for a mixed methods study. BMJ open 2016;6(6):e012590.16. SICSAG. Scottish Intensive Care Society Audit Group Annual Report: Audit of Intensive Care Units in Scotland 2016 Reporting on 2015. 2016 [cited 04/10/2016]Available from: http://www.sicsag.scot.nhs.uk/docs/2016-08-09-SICSAG-Publication-Report.pdf17. SICSAG. Scottish Intensive Care Society Audit Group Annual Report: Data Quality. 2017 [cited 06/04/2017]Available from: http://www.sicsag.scot.nhs.uk/quality/data.html18. NSS. Assessment of SMR01 Data Scotland 2014-2015. [Online] 2015 [cited 06/04/2017]Available from: http://www.isdscotland.org/Health-Topics/Hospital-Care/Publications/2012-05-08/Assessment-of-SMR01Data-2010-2011-ScotlandReport.pdf19. Scotland NRo. Migration between Scotland and Overseas. . 2017 [cited 01/05/2017]Available from: http://www.nrscotland.gov.uk/statistics-and-data/statistics/statistics-by-theme/migration/migration-statistics/migration-between-scotland-and-overseas
22
20. Kerr KF, Wang Z, Janes H, et al. Net Reclassification Indices for Evaluating Risk-Prediction Instruments: A Critical Review. Epidemiology 2014;25(1):114-121.21. Moons KG, Altman DG, Reitsma JB, et al. Transparent Reporting of a multivariable prediction model for Individual Prognosis or Diagnosis (TRIPOD): explanation and elaboration. Ann Intern Med 2015;162(1):W1-73.22. Blunt I, Bardsley M, Grove A, et al. Classifying emergency 30-day readmissions in England using routine hospital data 2004–2010: what is the scope for reduction? Emergency Medicine Journal 2015;32(1):44-50.23. Fischer C, Lingsma HF, Marang-van de Mheen PJ, et al. Is the readmission rate a valid quality indicator? A review of the evidence. PloS one 2014;9(11):e112282.24. Press MJ, Scanlon DP, Ryan AM, et al. Limits of readmission rates in measuring hospital quality suggest the need for added metrics. Health affairs (Project Hope) 2013;32(6):1083-1091.25. Iwashyna TJ. Trajectories of Recovery and Dysfunction after Acute Illness, with Implications for Clinical Trial Design. American Journal of Respiratory and Critical Care Medicine 2012;186(4):302-304.26. Iwashyna TJ, Netzer G, Langa KM, et al. Spurious Inferences about Long-Term Outcomes. American Journal of Respiratory and Critical Care Medicine 2012;185(8):835-841.27. Hua M, Gong MN, Brady J, et al. Early and late unplanned rehospitalizations for survivors of critical illness*. Critical care medicine 2015;43(2):430-438.28. Kansagara D, Englander H, Salanitro A, et al. Risk Prediction Models for Hospital Readmission A Systematic Review. Jama-Journal of the American Medical Association 2011;306(15):1688-1698.29. Cameron JI, Chu LM, Matte A, et al. One-Year Outcomes in Caregivers of Critically Ill Patients. The New England journal of medicine 2016;374(19):1831-1841.30. Deacon KS. Re-building life after ICU: a qualitative study of the patients' perspective. Intensive & critical care nursing 2012;28(2):114-122.31. Bagshaw SM, Stelfox HT, Johnson JA, et al. Long-term association between frailty and health-related quality of life among survivors of critical illness: a prospective multicenter cohort study. Critical care medicine 2015;43(5):973-982.32. Greysen SR, Stijacic Cenzer I, Auerbach AD, et al. Functional impairment and hospital readmission in Medicare seniors. JAMA internal medicine 2015;175(4):559-565.33. Lacroix J, Hébert PC, Fergusson DA, et al. Age of Transfused Blood in Critically Ill Adults. New England Journal of Medicine 2015;372(15):1410-1418.34. Hasan O, Meltzer DO, Shaykevich SA, et al. Hospital Readmission in General Medicine Patients: A Prediction Model. Journal of General Internal Medicine 2010;25(3):211-219.35. van Walraven C, Dhalla IA, Bell C, et al. Derivation and validation of an index to predict early death or unplanned readmission after discharge from hospital to the community. Canadian Medical Association Journal 2010;182(6):551-557.36. Ferrante LE, Pisani MA, Murphy TE, et al. Functional trajectories among older persons before and after critical illness. JAMA internal medicine 2015;175(4):523-529.37. Griffith DM, Lewis S, Rossi AG, et al. Systemic inflammation after critical illness: relationship with physical recovery and exploration of potential mechanisms. Thorax 2016.38. Bailey SC, Fang G, Annis IE, et al. Health literacy and 30-day hospital readmission after acute myocardial infarction. BMJ open 2015;5(6):e006975.39. van Walraven C, Bennett C, Jennings A, et al. Proportion of hospital readmissions deemed avoidable: a systematic review. CMAJ : Canadian Medical Association journal = journal de l'Association medicale canadienne 2011;183(7):E391-402.40. Craig P, Dieppe P, Macintyre S, et al. Developing and evaluating complex interventions: the new Medical Research Council guidance. Bmj 2008;337:a1655.41. Hartl S, Lopez-Campos JL, Pozo-Rodriguez F, et al. Risk of death and readmission of hospital-admitted COPD exacerbations: European COPD Audit. The European respiratory journal 2016;47(1):113-121.
23
42. Jones K, Saxon L, Cunningham W, et al. Secondary prevention for patients after a myocardial infarction: summary of updated NICE guidance. Bmj 2013;347:f6544.43. Faculty of Intensive Care Medicine. Guidelines for the Provision of Intensive Care Services. 2015 [cited 14/10/2016]Available from: https://www.ficm.ac.uk/standards-and-guidelines/gpics44. Dworzynski K, Ritchie G, Fenu E, et al. Rehabilitation after stroke: summary of NICE guidance. Bmj 2013;346:f3615.
24

Figure Legends
Figure 1 Cumulative incidence within 90 days of discharge from index hospital stay of (a) unplanned hospital admission and (b) unplanned hospital admission or death
Figure 2 (A) Observed risk of 90 day unplanned hospital readmission by deciles of predicted risk and (B) Receiver operator characteristics for three groups: patient demographics, indices of pre-existing patient health, and indices of critical illness severity.
Within each panel, each point represents 10% of the cohort grouped by their predicted risk of 90 day readmission derived from the group of characteristics labelled by the panel axis label. The observed risk for ‘Demographics’ variables ranges from 18.2% in the lowest predicted risk decile to 29.4% in the highest. The observed risk for the ‘pre-existing health indices’ group of variables ranges from 15.3% in the lowest predicted risk decile to 46.9% in the highest. The gradient of the line is therefore steeper. The steeper positive gradient observed for ‘Pre-existing health indices’ compared with ‘Demographics’ indicates that there is a greater increase in observed readmission risk for each increment in decile of predicted risk for the group of characteristics, and therefore this group is a better predictor of readmission across the range of predicted risk.
Figure 3 Receiver operator characteristics curve for model predicting unplanned hospital readmission within 90 days of discharge from index hospital stay in the validation cohort (n=14,273)
25


![UvA-DARE (Digital Academic Repository) Ethnic …among other ethnic groups.[3,4] For the past 2 decades, unplanned readmission rates and excess length of stay (LOS) have been put forward](https://img.pdfslide.us/doc/110x75/5ec8c1a223a49b207e39468c/uva-dare-digital-academic-repository-ethnic-among-other-ethnic-groups34-for.jpg)