Embed Size (px)
Citation preview
n Feature Article
MONTH/MONTH 201x | Volume xx • Number X
Overhand pitching places immense stresses on the body, especially the shoulder and elbow, where signifi-
cant upper-extremity torque is generated to accelerate the baseball.1 In professional baseball, with 750 active major league and
almost 6000 minor league players, injury among pitchers is substantial. Conte et al2 reported that, during 11 seasons, although only 47% of players were pitchers, they represented 57% of the total disabled days, with an increasing trend in the number of disabled days during the course of their study. Similarly, Posner et al3 found that, among major league baseball players, the rate of injury was 34% higher in pitchers compared with position players and that pitchers accounted for 62.4% of disabil-ity days. Most of these were shoulder and elbow injuries.3 More recently, Li et al4 found that pitchers had 27 times more days
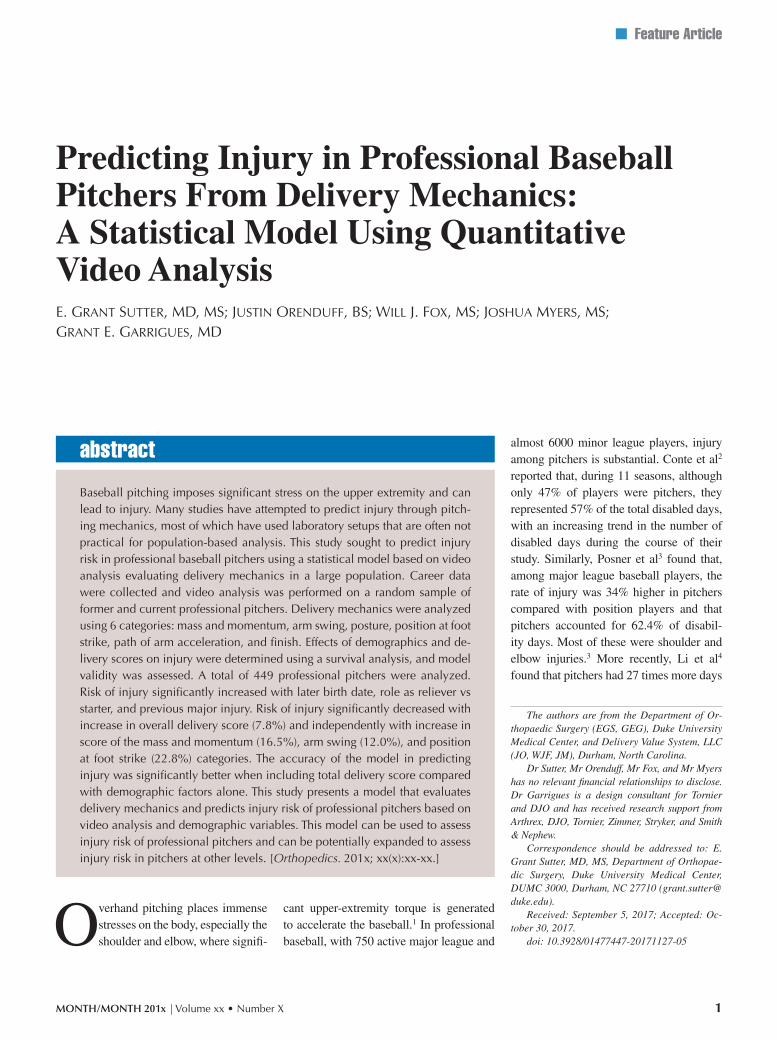
Predicting Injury in Professional Baseball Pitchers From Delivery Mechanics: A Statistical Model Using Quantitative Video AnalysisE. Grant SuttEr, MD, MS; JuStin OrEnDuff, BS; Will J. fOx, MS; JOShua MyErS, MS; Grant E. GarriGuES, MD
The authors are from the Department of Or-thopaedic Surgery (EGS, GEG), Duke University Medical Center, and Delivery Value System, LLC (JO, WJF, JM), Durham, North Carolina.
Dr Sutter, Mr Orenduff, Mr Fox, and Mr Myers has no relevant financial relationships to disclose. Dr Garrigues is a design consultant for Tornier and DJO and has received research support from Arthrex, DJO, Tornier, Zimmer, Stryker, and Smith & Nephew.
Correspondence should be addressed to: E. Grant Sutter, MD, MS, Department of Orthopae-dic Surgery, Duke University Medical Center, DUMC 3000, Durham, NC 27710 ([email protected]).
Received: September 5, 2017; Accepted: Oc-tober 30, 2017.
doi: 10.3928/01477447-20171127-05
abstract
Baseball pitching imposes significant stress on the upper extremity and can lead to injury. Many studies have attempted to predict injury through pitch-ing mechanics, most of which have used laboratory setups that are often not practical for population-based analysis. This study sought to predict injury risk in professional baseball pitchers using a statistical model based on video analysis evaluating delivery mechanics in a large population. Career data were collected and video analysis was performed on a random sample of former and current professional pitchers. Delivery mechanics were analyzed using 6 categories: mass and momentum, arm swing, posture, position at foot strike, path of arm acceleration, and finish. Effects of demographics and de-livery scores on injury were determined using a survival analysis, and model validity was assessed. A total of 449 professional pitchers were analyzed. Risk of injury significantly increased with later birth date, role as reliever vs starter, and previous major injury. Risk of injury significantly decreased with increase in overall delivery score (7.8%) and independently with increase in score of the mass and momentum (16.5%), arm swing (12.0%), and position at foot strike (22.8%) categories. The accuracy of the model in predicting injury was significantly better when including total delivery score compared with demographic factors alone. This study presents a model that evaluates delivery mechanics and predicts injury risk of professional pitchers based on video analysis and demographic variables. This model can be used to assess injury risk of professional pitchers and can be potentially expanded to assess injury risk in pitchers at other levels. [Orthopedics. 201x; xx(x):xx-xx.]
1
Copyright © SLACK inCorporAted
n Feature Article
missed from elbow injuries compared with position players. This can affect a pitcher’s earning potential and can have drastic fi-nancial effects for teams’ investment in their players.
As a result, significant time and re-sources have been invested in discerning the cause of these injuries in young and professional players alike. Pitch and inning counts,5-7 pain,8 strength,9 pitch velocity,10 and shoulder range of motion11 have all been found to play a potential role. How-ever, particular attention has been paid to the specific biomechanics and kinetics of overhand pitching in both professional and youth pitchers.6,12-20 Video analysis and motion capture analysis have been used to investigate pitching mechanics along the mechanical chain during the throwing motion.14 An emphasis on fluid timing has emerged, such that the proper coordination of proximal segments will maximize angu-lar velocity of the distal segments with less upper-extremity torque.13,18
Most studies use motion capture to analyze kinematics and calculate torques, from which injury potential is inferred. Although these studies are powerful in terms of the data generated on particular pitchers at a specific time point, they are limited in that they require expensive,
complex laboratory setups that are not accessible or practical for a population-based analysis. Video analysis has been a useful technique for identifying injury mechanism and risk factors (eg, in the setting of anterior cruciate ligament inju-ry).21-23 In the setting of pitching mechan-ics, it has the potential for evaluation of hundreds of pitchers across various eras, teams, and skill levels. To the best of the authors’ knowledge, no previous study has evaluated the connection between risk of injury and in-game pitching me-chanics of a large population of pitchers across a lengthy period.
The purpose of this study was to gen-erate a model that can predict injury risk by incorporating demographic factors and video analysis evaluating key mechanical components of the pitching delivery in a large population of professional pitch-ers. Six mechanical components involved in the coordinated timing of the kinetic chain (upper-extremity, trunk, and low-er-extremity positions) were assessed to identify potentially injurious mechanics and predict injury risk. The authors hy-pothesize that this model can predict inju-ry risk and can be used to identify poten-tially injurious mechanics in professional baseball pitchers.
Materials and MethodsSubject Data
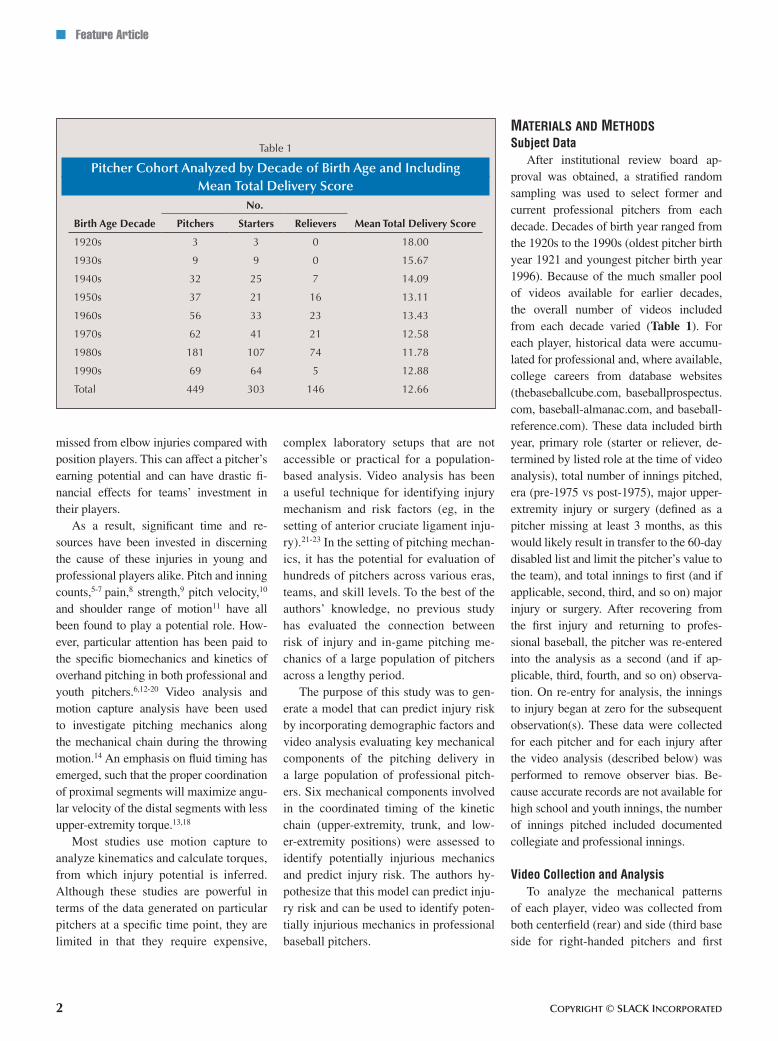
After institutional review board ap-proval was obtained, a stratified random sampling was used to select former and current professional pitchers from each decade. Decades of birth year ranged from the 1920s to the 1990s (oldest pitcher birth year 1921 and youngest pitcher birth year 1996). Because of the much smaller pool of videos available for earlier decades, the overall number of videos included from each decade varied (Table 1). For each player, historical data were accumu-lated for professional and, where available, college careers from database websites (thebaseballcube.com, baseballprospectus.com, baseball-almanac.com, and baseball-reference.com). These data included birth year, primary role (starter or reliever, de-termined by listed role at the time of video analysis), total number of innings pitched, era (pre-1975 vs post-1975), major upper-extremity injury or surgery (defined as a pitcher missing at least 3 months, as this would likely result in transfer to the 60-day disabled list and limit the pitcher’s value to the team), and total innings to first (and if applicable, second, third, and so on) major injury or surgery. After recovering from the first injury and returning to profes-sional baseball, the pitcher was re-entered into the analysis as a second (and if ap-plicable, third, fourth, and so on) observa-tion. On re-entry for analysis, the innings to injury began at zero for the subsequent observation(s). These data were collected for each pitcher and for each injury after the video analysis (described below) was performed to remove observer bias. Be-cause accurate records are not available for high school and youth innings, the number of innings pitched included documented collegiate and professional innings.
Video Collection and Analysis To analyze the mechanical patterns
of each player, video was collected from both centerfield (rear) and side (third base side for right-handed pitchers and first
Table 1
Pitcher Cohort Analyzed by Decade of Birth Age and Including Mean Total Delivery Score
No.
Birth Age Decade Pitchers Starters Relievers Mean Total Delivery Score
1920s 3 3 0 18.00
1930s 9 9 0 15.67
1940s 32 25 7 14.09
1950s 37 21 16 13.11
1960s 56 33 23 13.43
1970s 62 41 21 12.58
1980s 181 107 74 11.78
1990s 69 64 5 12.88
Total 449 303 146 12.66
2
MONTH/MONTH 201x | Volume xx • Number X
n Feature Article
base side for left-handed pitchers) angles. For each pitcher, 3 pitches were recorded from both angles, during the same game, to quantify mechanical pattern and mini-mize the effect of pitch-to-pitch varia-tion. Video was used regardless of type of pitch and whether the pitch was a ball or a strike. All video obtained was from tele-vision broadcast game footage (youtube.com and MLB.com). Once collected, each player’s video was uploaded into a video analysis program (ChalkTalk Telestrator; PowerChalk, Cary, North Carolina).
Delivery Scoring SystemSix pitching technique components of
the delivery scoring system—mass and momentum, arm swing, posture, position at foot strike, path of arm acceleration, and finish—were then analyzed per the protocol below.
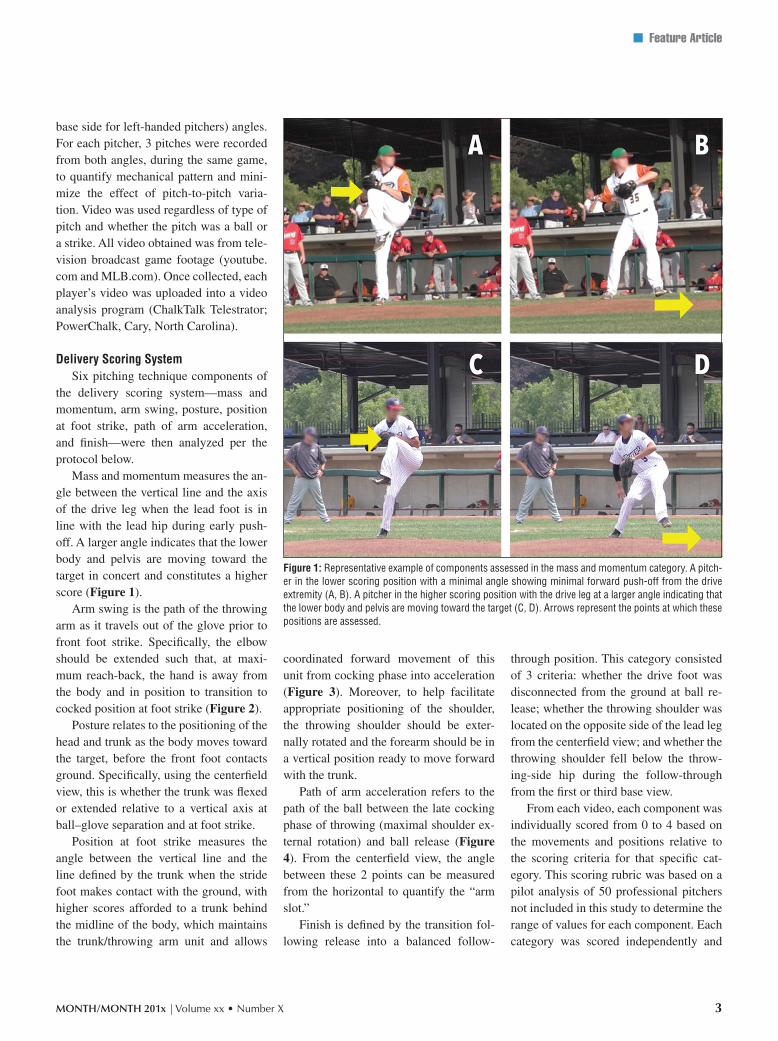
Mass and momentum measures the an-gle between the vertical line and the axis of the drive leg when the lead foot is in line with the lead hip during early push-off. A larger angle indicates that the lower body and pelvis are moving toward the target in concert and constitutes a higher score (Figure 1).
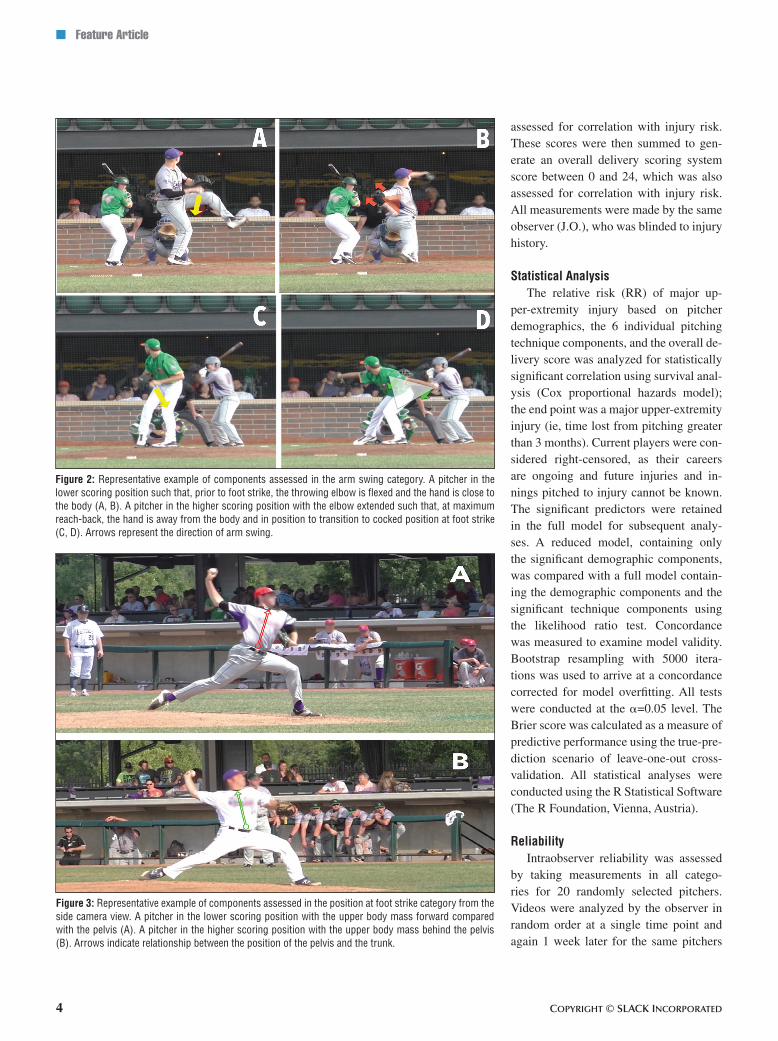
Arm swing is the path of the throwing arm as it travels out of the glove prior to front foot strike. Specifically, the elbow should be extended such that, at maxi-mum reach-back, the hand is away from the body and in position to transition to cocked position at foot strike (Figure 2).
Posture relates to the positioning of the head and trunk as the body moves toward the target, before the front foot contacts ground. Specifically, using the centerfield view, this is whether the trunk was flexed or extended relative to a vertical axis at ball–glove separation and at foot strike.
Position at foot strike measures the angle between the vertical line and the line defined by the trunk when the stride foot makes contact with the ground, with higher scores afforded to a trunk behind the midline of the body, which maintains the trunk/throwing arm unit and allows
coordinated forward movement of this unit from cocking phase into acceleration (Figure 3). Moreover, to help facilitate appropriate positioning of the shoulder, the throwing shoulder should be exter-nally rotated and the forearm should be in a vertical position ready to move forward with the trunk.
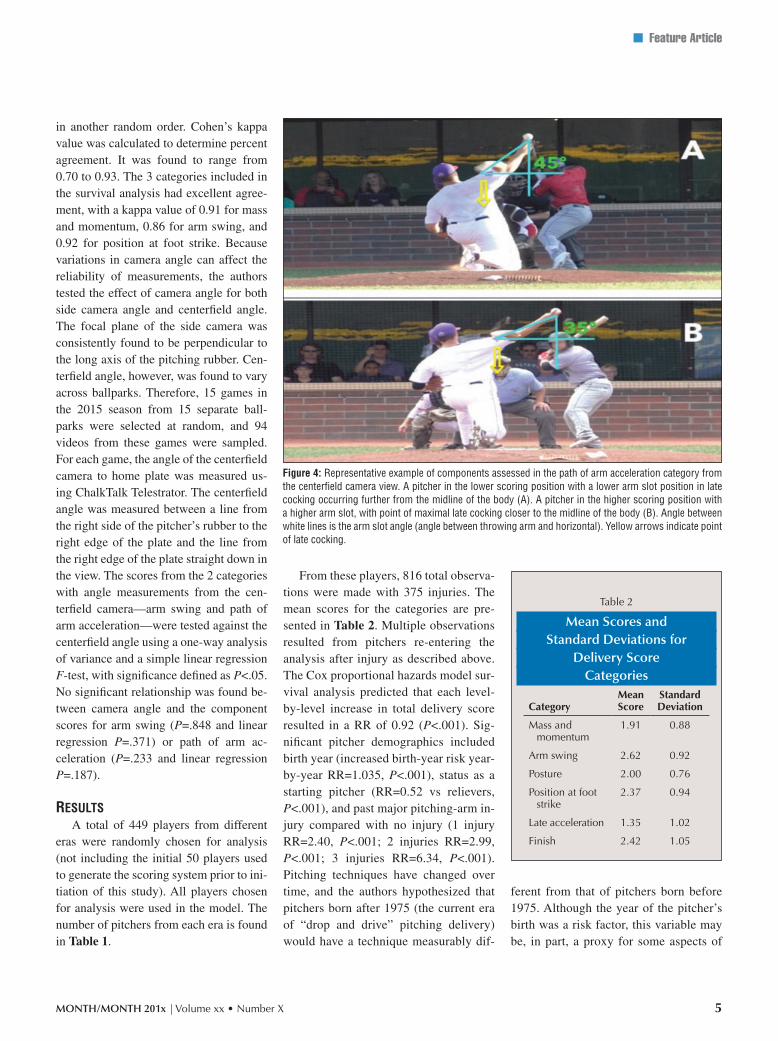
Path of arm acceleration refers to the path of the ball between the late cocking phase of throwing (maximal shoulder ex-ternal rotation) and ball release (Figure 4). From the centerfield view, the angle between these 2 points can be measured from the horizontal to quantify the “arm slot.”
Finish is defined by the transition fol-lowing release into a balanced follow-
through position. This category consisted of 3 criteria: whether the drive foot was disconnected from the ground at ball re-lease; whether the throwing shoulder was located on the opposite side of the lead leg from the centerfield view; and whether the throwing shoulder fell below the throw-ing-side hip during the follow-through from the first or third base view.
From each video, each component was individually scored from 0 to 4 based on the movements and positions relative to the scoring criteria for that specific cat-egory. This scoring rubric was based on a pilot analysis of 50 professional pitchers not included in this study to determine the range of values for each component. Each category was scored independently and
Figure 1: Representative example of components assessed in the mass and momentum category. A pitch-er in the lower scoring position with a minimal angle showing minimal forward push-off from the drive extremity (A, B). A pitcher in the higher scoring position with the drive leg at a larger angle indicating that the lower body and pelvis are moving toward the target (C, D). Arrows represent the points at which these positions are assessed.
3
Copyright © SLACK inCorporAted
n Feature Article
assessed for correlation with injury risk. These scores were then summed to gen-erate an overall delivery scoring system score between 0 and 24, which was also assessed for correlation with injury risk. All measurements were made by the same observer (J.O.), who was blinded to injury history.
Statistical AnalysisThe relative risk (RR) of major up-
per-extremity injury based on pitcher demographics, the 6 individual pitching technique components, and the overall de-livery score was analyzed for statistically significant correlation using survival anal-ysis (Cox proportional hazards model); the end point was a major upper-extremity injury (ie, time lost from pitching greater than 3 months). Current players were con-sidered right-censored, as their careers are ongoing and future injuries and in-nings pitched to injury cannot be known. The significant predictors were retained in the full model for subsequent analy-ses. A reduced model, containing only the significant demographic components, was compared with a full model contain-ing the demographic components and the significant technique components using the likelihood ratio test. Concordance was measured to examine model validity. Bootstrap resampling with 5000 itera-tions was used to arrive at a concordance corrected for model overfitting. All tests were conducted at the α=0.05 level. The Brier score was calculated as a measure of predictive performance using the true-pre-diction scenario of leave-one-out cross-validation. All statistical analyses were conducted using the R Statistical Software (The R Foundation, Vienna, Austria).
ReliabilityIntraobserver reliability was assessed
by taking measurements in all catego-ries for 20 randomly selected pitchers. Videos were analyzed by the observer in random order at a single time point and again 1 week later for the same pitchers
Figure 2: Representative example of components assessed in the arm swing category. A pitcher in the lower scoring position such that, prior to foot strike, the throwing elbow is flexed and the hand is close to the body (A, B). A pitcher in the higher scoring position with the elbow extended such that, at maximum reach-back, the hand is away from the body and in position to transition to cocked position at foot strike (C, D). Arrows represent the direction of arm swing.
Figure 3: Representative example of components assessed in the position at foot strike category from the side camera view. A pitcher in the lower scoring position with the upper body mass forward compared with the pelvis (A). A pitcher in the higher scoring position with the upper body mass behind the pelvis (B). Arrows indicate relationship between the position of the pelvis and the trunk.
4
MONTH/MONTH 201x | Volume xx • Number X
n Feature Article
in another random order. Cohen’s kappa value was calculated to determine percent agreement. It was found to range from 0.70 to 0.93. The 3 categories included in the survival analysis had excellent agree-ment, with a kappa value of 0.91 for mass and momentum, 0.86 for arm swing, and 0.92 for position at foot strike. Because variations in camera angle can affect the reliability of measurements, the authors tested the effect of camera angle for both side camera angle and centerfield angle. The focal plane of the side camera was consistently found to be perpendicular to the long axis of the pitching rubber. Cen-terfield angle, however, was found to vary across ballparks. Therefore, 15 games in the 2015 season from 15 separate ball-parks were selected at random, and 94 videos from these games were sampled. For each game, the angle of the centerfield camera to home plate was measured us-ing ChalkTalk Telestrator. The centerfield angle was measured between a line from the right side of the pitcher’s rubber to the right edge of the plate and the line from the right edge of the plate straight down in the view. The scores from the 2 categories with angle measurements from the cen-terfield camera—arm swing and path of arm acceleration—were tested against the centerfield angle using a one-way analysis of variance and a simple linear regression F-test, with significance defined as P<.05. No significant relationship was found be-tween camera angle and the component scores for arm swing (P=.848 and linear regression P=.371) or path of arm ac-celeration (P=.233 and linear regression P=.187).
resultsA total of 449 players from different
eras were randomly chosen for analysis (not including the initial 50 players used to generate the scoring system prior to ini-tiation of this study). All players chosen for analysis were used in the model. The number of pitchers from each era is found in Table 1.
From these players, 816 total observa-tions were made with 375 injuries. The mean scores for the categories are pre-sented in Table 2. Multiple observations resulted from pitchers re-entering the analysis after injury as described above. The Cox proportional hazards model sur-vival analysis predicted that each level-by-level increase in total delivery score resulted in a RR of 0.92 (P<.001). Sig-nificant pitcher demographics included birth year (increased birth-year risk year-by-year RR=1.035, P<.001), status as a starting pitcher (RR=0.52 vs relievers, P<.001), and past major pitching-arm in-jury compared with no injury (1 injury RR=2.40, P<.001; 2 injuries RR=2.99, P<.001; 3 injuries RR=6.34, P<.001). Pitching techniques have changed over time, and the authors hypothesized that pitchers born after 1975 (the current era of “drop and drive” pitching delivery) would have a technique measurably dif-
ferent from that of pitchers born before 1975. Although the year of the pitcher’s birth was a risk factor, this variable may be, in part, a proxy for some aspects of
Figure 4: Representative example of components assessed in the path of arm acceleration category from the centerfield camera view. A pitcher in the lower scoring position with a lower arm slot position in late cocking occurring further from the midline of the body (A). A pitcher in the higher scoring position with a higher arm slot, with point of maximal late cocking closer to the midline of the body (B). Angle between white lines is the arm slot angle (angle between throwing arm and horizontal). Yellow arrows indicate point of late cocking.
Table 2
Mean Scores and Standard Deviations for
Delivery Score Categories
CategoryMean Score
Standard Deviation
Mass and momentum
1.91 0.88
Arm swing 2.62 0.92
Posture 2.00 0.76
Position at foot strike
2.37 0.94
Late acceleration 1.35 1.02
Finish 2.42 1.05
5
Copyright © SLACK inCorporAted
n Feature Article
pitching technique. Indeed, when com-pared with pitchers born prior to 1975, pitchers born after 1975 were found to have a significantly lower total delivery score (12.1 vs 13.6, P<.001). The fol-lowing technique component variables
also had a statistically significant cor-relation with injury: mass and momen-tum (RR=0.84, P=.007), arm swing (RR=0.88, P=.032), and position at foot strike (RR=0.77, P<.001). These signifi-cant predictors were retained in the full
model for subsequent analyses. These re-sults are summarized in Table 3.
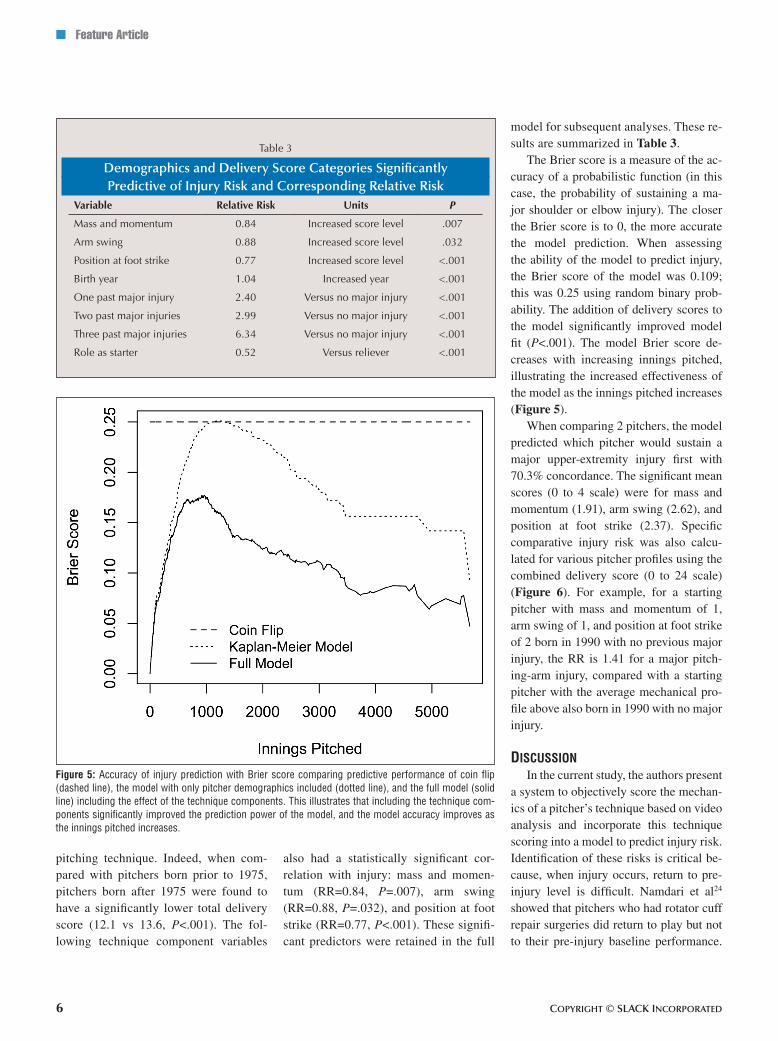
The Brier score is a measure of the ac-curacy of a probabilistic function (in this case, the probability of sustaining a ma-jor shoulder or elbow injury). The closer the Brier score is to 0, the more accurate the model prediction. When assessing the ability of the model to predict injury, the Brier score of the model was 0.109; this was 0.25 using random binary prob-ability. The addition of delivery scores to the model significantly improved model fit (P<.001). The model Brier score de-creases with increasing innings pitched, illustrating the increased effectiveness of the model as the innings pitched increases (Figure 5).
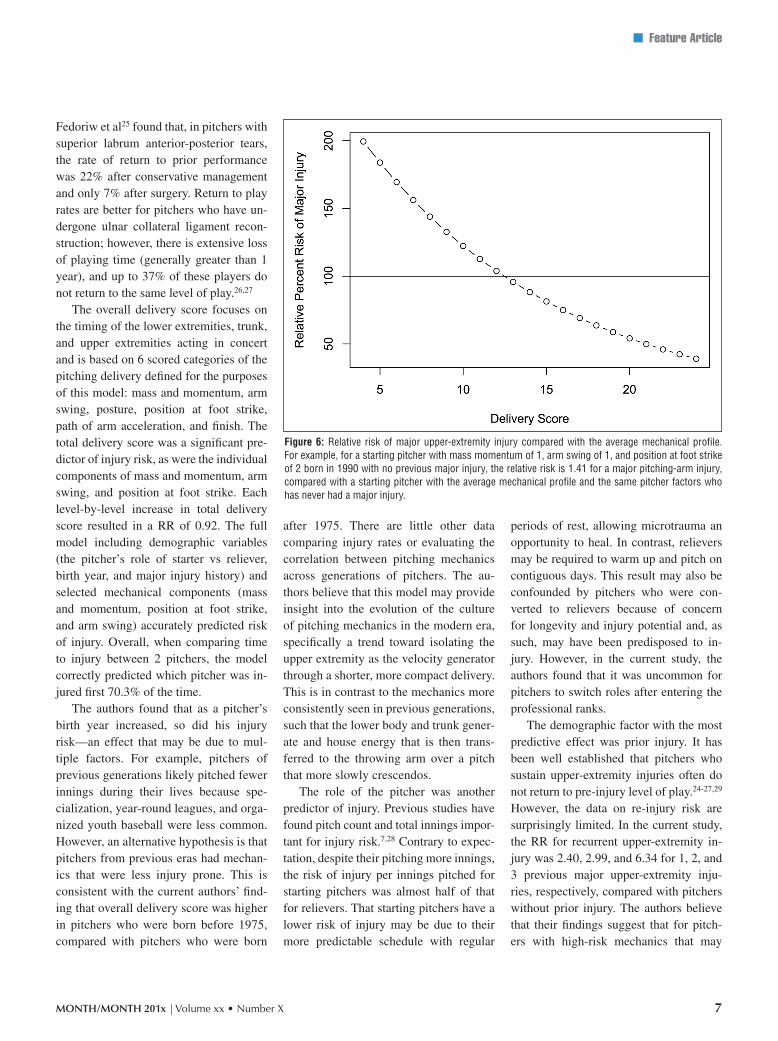
When comparing 2 pitchers, the model predicted which pitcher would sustain a major upper-extremity injury first with 70.3% concordance. The significant mean scores (0 to 4 scale) were for mass and momentum (1.91), arm swing (2.62), and position at foot strike (2.37). Specific comparative injury risk was also calcu-lated for various pitcher profiles using the combined delivery score (0 to 24 scale) (Figure 6). For example, for a starting pitcher with mass and momentum of 1, arm swing of 1, and position at foot strike of 2 born in 1990 with no previous major injury, the RR is 1.41 for a major pitch-ing-arm injury, compared with a starting pitcher with the average mechanical pro-file above also born in 1990 with no major injury.
discussion In the current study, the authors present
a system to objectively score the mechan-ics of a pitcher’s technique based on video analysis and incorporate this technique scoring into a model to predict injury risk. Identification of these risks is critical be-cause, when injury occurs, return to pre-injury level is difficult. Namdari et al24 showed that pitchers who had rotator cuff repair surgeries did return to play but not to their pre-injury baseline performance.
Table 3
Demographics and Delivery Score Categories Significantly Predictive of Injury Risk and Corresponding Relative Risk
Variable Relative Risk Units P
Mass and momentum 0.84 Increased score level .007
Arm swing 0.88 Increased score level .032
Position at foot strike 0.77 Increased score level <.001
Birth year 1.04 Increased year <.001
One past major injury 2.40 Versus no major injury <.001
Two past major injuries 2.99 Versus no major injury <.001
Three past major injuries 6.34 Versus no major injury <.001
Role as starter 0.52 Versus reliever <.001
Figure 5: Accuracy of injury prediction with Brier score comparing predictive performance of coin flip (dashed line), the model with only pitcher demographics included (dotted line), and the full model (solid line) including the effect of the technique components. This illustrates that including the technique com-ponents significantly improved the prediction power of the model, and the model accuracy improves as the innings pitched increases.
6
MONTH/MONTH 201x | Volume xx • Number X
n Feature Article
Fedoriw et al25 found that, in pitchers with superior labrum anterior-posterior tears, the rate of return to prior performance was 22% after conservative management and only 7% after surgery. Return to play rates are better for pitchers who have un-dergone ulnar collateral ligament recon-struction; however, there is extensive loss of playing time (generally greater than 1 year), and up to 37% of these players do not return to the same level of play.26,27
The overall delivery score focuses on the timing of the lower extremities, trunk, and upper extremities acting in concert and is based on 6 scored categories of the pitching delivery defined for the purposes of this model: mass and momentum, arm swing, posture, position at foot strike, path of arm acceleration, and finish. The total delivery score was a significant pre-dictor of injury risk, as were the individual components of mass and momentum, arm swing, and position at foot strike. Each level-by-level increase in total delivery score resulted in a RR of 0.92. The full model including demographic variables (the pitcher’s role of starter vs reliever, birth year, and major injury history) and selected mechanical components (mass and momentum, position at foot strike, and arm swing) accurately predicted risk of injury. Overall, when comparing time to injury between 2 pitchers, the model correctly predicted which pitcher was in-jured first 70.3% of the time.
The authors found that as a pitcher’s birth year increased, so did his injury risk—an effect that may be due to mul-tiple factors. For example, pitchers of previous generations likely pitched fewer innings during their lives because spe-cialization, year-round leagues, and orga-nized youth baseball were less common. However, an alternative hypothesis is that pitchers from previous eras had mechan-ics that were less injury prone. This is consistent with the current authors’ find-ing that overall delivery score was higher in pitchers who were born before 1975, compared with pitchers who were born
after 1975. There are little other data comparing injury rates or evaluating the correlation between pitching mechanics across generations of pitchers. The au-thors believe that this model may provide insight into the evolution of the culture of pitching mechanics in the modern era, specifically a trend toward isolating the upper extremity as the velocity generator through a shorter, more compact delivery. This is in contrast to the mechanics more consistently seen in previous generations, such that the lower body and trunk gener-ate and house energy that is then trans-ferred to the throwing arm over a pitch that more slowly crescendos.
The role of the pitcher was another predictor of injury. Previous studies have found pitch count and total innings impor-tant for injury risk.7,28 Contrary to expec-tation, despite their pitching more innings, the risk of injury per innings pitched for starting pitchers was almost half of that for relievers. That starting pitchers have a lower risk of injury may be due to their more predictable schedule with regular
periods of rest, allowing microtrauma an opportunity to heal. In contrast, relievers may be required to warm up and pitch on contiguous days. This result may also be confounded by pitchers who were con-verted to relievers because of concern for longevity and injury potential and, as such, may have been predisposed to in-jury. However, in the current study, the authors found that it was uncommon for pitchers to switch roles after entering the professional ranks.
The demographic factor with the most predictive effect was prior injury. It has been well established that pitchers who sustain upper-extremity injuries often do not return to pre-injury level of play.24-27,29 However, the data on re-injury risk are surprisingly limited. In the current study, the RR for recurrent upper-extremity in-jury was 2.40, 2.99, and 6.34 for 1, 2, and 3 previous major upper-extremity inju-ries, respectively, compared with pitchers without prior injury. The authors believe that their findings suggest that for pitch-ers with high-risk mechanics that may
Figure 6: Relative risk of major upper-extremity injury compared with the average mechanical profile. For example, for a starting pitcher with mass momentum of 1, arm swing of 1, and position at foot strike of 2 born in 1990 with no previous major injury, the relative risk is 1.41 for a major pitching-arm injury, compared with a starting pitcher with the average mechanical profile and the same pitcher factors who has never had a major injury.
7
Copyright © SLACK inCorporAted
n Feature Article
have contributed to the index injury, these high-risk mechanics remain, thereby in-creasing the risk for a recurrent injury. Additionally, these pitchers may be even more susceptible to injury because the na-tive anatomy and tissue may be compro-mised as a result of prior injury and per-haps surgical procedures.
Each level-by-level increase in deliv-ery score in the arm swing category re-sulted in a RR of 0.88, which is consistent with the emphasis placed on arm position in relation to the body through the throw-ing motion. Previous studies using motion capture analysis have identified various components of the kinetic chain as poten-tial points for injury. Fleisig et al17 found that maximal anterior shoulder force, ad-duction torque, internal rotation torque, and elbow varus torque (with varus de-fined by these authors as the direction of force being applied to the forearm by the humerus to stress the medial side of the el-bow and equivalent to the “valgus” stress adopted by the other authors discussed) occur at maximal external rotation of the shoulder. The results of the current au-thors’ model suggest that once the throw-ing hand leaves the glove, the shoulder and elbow should be extended with increased shoulder abduction, away from the body so that the throwing arm can transition to the vertical forearm position in the cock-ing phase. This is opposed to a flexed el-bow position with shoulder internal rota-tion that requires later shoulder external rotation into the cocking phase, which may increase shoulder and elbow torques. This alignment may better facilitate prop-er timing between the arm and the trunk as the body accelerates forward. Simi-larly, Davis et al,14 who evaluated youth and adolescent pitchers with video analy-sis and motion capture with 5 categories of posture, argue for humeral abduction prior to any significant trunk rotation to ensure stabilization of the scapula. Agui-naldo et al12 found that a more horizontal arm slot at ball release increased elbow joint stresses because the ball is farther
from the body. The current authors’ injury prediction data are consistent with these results, and they therefore evaluate for ap-propriate shoulder abduction to minimize harmful shoulder and elbow stresses dur-ing the acceleration process.
Arm slot position and elbow flexion during arm cocking and through maxi-mum external rotation are also important in determining the magnitude of elbow valgus torque. Werner et al30 analyzed high-speed video of 40 professional pitch-ers and found increased elbow valgus stress at higher shoulder abduction angles at foot strike, increased shoulder horizon-tal velocity, and increased elbow flexion. Overall, 97% of the variance in elbow val-gus stress was explained by shoulder ab-duction at foot strike, peak horizontal arm velocity, elbow angle, and peak shoulder external rotation torque.30 Other studies have had contrary results. Fleisig et al17 found that the ulnar collateral ligament was at greatest stress at maximum shoul-der external rotation when the elbow was flexed to 90°. Similarly, Aguinaldo and Chambers13 showed that a more flexed elbow during maximal external rotation will decrease stress about the elbow, argu-ing that rotation about the trunk provides a greater magnitude of stress to the elbow than to the humerus. Therefore, elbow torque is reduced as the ball is closer to the trunk.13 The current authors agree with this concept, and their scoring system also accounts for this with a higher score in the path of arm acceleration category.
The mass and momentum component also had a substantial influence on upper-extremity injury risk with a RR of 0.84 with each increase in score. This illus-trates the importance of coordinated tim-ing of the upper extremity with the trunk and the pelvis. The mass and momentum component evaluates how well a pitcher’s pelvis and lower body are moving toward the target during the early cocking phase to provide forward direct force of the en-tire body instead of relying on only the upper extremity. The authors’ results sug-
gest that a higher angle between the verti-cal and the drive leg at the point of initial forward movement, representing a for-ward-directed force generated by the drive leg, decreases injury risk. This is intuitive as more of the resultant hand/ball velocity can be captured from the forward-moving proximal pelvis and trunk.
The scored mechanics in the mass and momentum category are also affected by the timing of pelvic rotation. Namely, for the lead foot to reach maximum stride length, the body must move forward or the lead hip must flex to stride appro-priately. With higher drive leg angles (increased knee flexion and some inter-nal rotation), appropriate stride length is achieved without the otherwise obligate early pelvic rotation to allow the lead hip to open. Multiple studies have shown that pitchers who rotate their trunks early in the throwing cycle generate higher shoul-der and elbow torques.12,13 Davis et al14 found that, when normalized to body weight and height, pitchers with early pelvic rotation had more humeral internal rotation torque and elbow valgus torque. However, 95% of pitchers in their study led with pelvic rotation.14 Support for re-ducing shoulder and elbow torques comes from Douoguih et al,31 who investigated the motion of professional pitchers with injuries requiring surgery. They com-pared pitchers with early trunk rotation (trunk rotation prior to stride foot with non-vertical arm position) with pitch-ers in the “inverted-W position” (one or both elbows elevated above the shoulder in the early cocking phase).31 Although the inverted-W position did not predict a higher risk of injury requiring surgery, the early pelvic rotation did. Early trunk rotation at the cocking phase without ap-propriate vertical arm position will not allow the upper extremity to capitalize on momentum generated by the lower body. Moreover, the upper extremity will have to “catch up” during the early accelera-tion phase, which may lead to increased shoulder and elbow torques.
8
MONTH/MONTH 201x | Volume xx • Number X
n Feature Article
Urbin et al32 showed that increasing the time from foot contact to peak pel-vic angular velocity decreased shoulder torque. However, Wight et al33 found that a more open pelvis orientation (>30°) at foot strike (more “squared up”) produced less shoulder distractive force, internal rotation torque, and elbow flexion and varus torque (in this study, varus was also defined as in the Fleisig et al17 study ref-erenced above and was equivalent to “val-gus” as defined by other authors) than a closed pelvis orientation. Although these results can be viewed as conflicting, the proposed beneficial mechanics are not mu-tually exclusive. Pelvic rotation unlocks the trunk as the pitcher leads with his hips with an appropriately early arm swing and cocking. As described above, however, the trunk should remain closed and back for longer to avoid early forward momentum in order to allow for appropriate shoulder abduction and vertical position of the arm to move forward with the remainder of the body. If the pelvis is in a more open orientation at foot strike, then the kinetic energy generated from the rotation of the pelvis can be transferred effectively up the chain to the most distal components at ball release. Simply, the pelvis should be open at foot strike, but this rotation should be initiated later in the cycle. This concept is assessed in the current authors’ analysis of mass and momentum and is also scored in the position at foot strike discussed below.
The largest reduction in risk resulted from increased score in the position at foot strike category, in which each in-creased delivery score level resulted in a RR of 0.77. The authors believe that this is consistent with the overall importance of arm and trunk position at this critical time. Davis et al14 suggested a hand-on-top posi-tion with the elbow at its highest position at foot strike with the shoulder internally rotated. On the basis of the results of the current study, the authors believe that this may have injurious effects. The authors found that an abducted shoulder position with the elbow at approximately the shoul-
der level, with shoulder external rotation and elbow flexion to 90°, decreased injury potential. In addition to the relationship between foot strike and the upper extrem-ity, trunk tilt in both the sagittal and the coronal plane is also an important consid-eration. At the time of lead foot strike, the authors advocate for trunk position with-out forward tilt toward the mound. This allows the proximal trunk and upper ex-tremity to move forward in concert from cocking to early acceleration to maximize distal angular velocity. Increased trunk tilt position in the coronal plane at foot strike and late acceleration pulls the arm away from the midline of the trunk and should increase upper-extremity torques. Oyama et al19 found just that in high school play-ers. Those with the midline of the trunk on the non-throwing side of the stride foot exhibited greater upper-extremity torques. Trunk position at foot strike was assessed primarily as part of the foot strike category but was indirectly addressed in the finish category. Trunk position was scored as increased trunk tilt during follow-through that will push the body from the midline away from the throwing extremity and the target. Therefore, a larger portion of the momentum must be directed away from the target. Similarly, lower-extremity po-sition at foot strike is also important to ensure that the momentums of all compo-nents of the kinetic chain are directed to-ward the target.14 It is critical to maximize the lower-extremity contribution in the ki-netic chain, but this is often underutilized. Mullaney et al34 investigated fatigue of up-per-extremity muscles and hips and found that post-game strength was selectively de-creased in shoulder flexion, internal rota-tion, and adduction. These findings should not be surprising, given the magnitude of forces through the upper extremity. They also found that there was minimal lower-extremity strength loss. This suggests that many pitchers do not effectively use the trunk and lower extremities to off-load the upper extremity, which is more susceptible to fatigue and injury.34
Although increased shoulder and el-bow torques may be potential sources of injury, some have argued that these in-creased torques may also be required to generate more ball velocity.16,35 However, this has been shown to not necessarily be the case. Davis et al14 showed that certain mechanics improve throwing efficiency (more speed with lower upper-extremity torque). The current authors believe that this further demonstrates the importance of coordinated timing of the kinetic com-ponents, which is the basis of their model scoring.
This study had several limitations. The authors used video analysis from 2 cameras obtained from television broad-casts instead of the multi-camera views typically used in laboratory-based motion capture. However, with the availability of high-quality video, this is also a strength, as data were gathered during actual in-game competition, across a large number of pitchers, and during a lengthy period. Additionally, this technique allows the authors’ model to be based on actual inju-ries, as opposed to inferring injury poten-tial from calculated kinematics.
Error in measurement can arise from the potentially varying camera angles used in video analysis. Therefore, as described in the Materials and Methods section, the authors performed an internal study to as-sess this error on the 2 camera views used in their analysis—side camera and cen-terfield camera. They found that the side camera remained essentially constant, at least during the time period they mea-sured, whereas the centerfield angle var-ied by ballpark. However, their sensitivity analysis found no significant statistical re-lationship between the centerfield camera angle and the 2 scoring categories—arm swing and path of arm acceleration—that rely on the centerfield camera.
The authors also acknowledge that the major league pitching mound was de-creased by 6 inches in 1969. The effects of this change are unclear regarding both pitching performance and potential for in-
9
Copyright © SLACK inCorporAted
n Feature Article
jury. Although the authors did not account for this in the current study, it is a factor worth investigating in future studies that may also elucidate the best mound height to reduce pitcher injuries.
An additional limitation is that this co-hort consisted of only professional pitch-ers, thereby limiting application of the model to younger or less-skilled pitchers at lower levels of competition. This is an important consideration because this de-manding athletic task is common through-out the world and particularly in the United States, where it is estimated that each year 15 million individuals, includ-ing 5 million youth players, participate in some form of organized baseball, with pitcher generally being the most common position on the roster.36,37 At some point during the season, 32% of youth pitchers experience pain in the shoulder and 26% feel elbow pain.7 Despite the limited dif-ferences in mechanics between younger and professional pitchers,35,38 the accura-cy of the model will still need to be tested in other baseball populations (eg, in youth pitchers, in whom unique injury patterns occur and alterations in developmental anatomy may lead to future injury).39,40
conclusionA model that can predict injury risk
by incorporating demographic factors and video analysis evaluating key mechanical components of the pitching delivery in a large population of professional pitchers has been presented. Additional prospec-tive studies of professional, amateur, and youth players will seek to further evaluate the mechanics correlated with injury risk that might lead to pain, injury, disability, and financial hardship for players and teams alike.
references 1. Brown LP, Niehues SL, Harrah A, Yavorsky
P, Hirshman HP. Upper extremity range of motion and isokinetic strength of the inter-nal and external shoulder rotators in major league baseball players. Am J Sports Med. 1988; 16(6):577-585.
2. Conte S, Requa RK, Garrick JG. Disability days in major league baseball. Am J Sports Med. 2001; 29(4):431-436.
3. Posner M, Cameron KL, Wolf JM, Belmont PJ Jr, Owens BD. Epidemiology of Major League Baseball injuries. Am J Sports Med. 2011; 39(8):1676-1680.
4. Li X, Zhou H, Williams P, et al. The epide-miology of single season musculoskeletal injuries in professional baseball. Orthop Rev (Pavia). 2013; 5(1):e3.
5. Fleisig GS, Andrews JR, Cutter GR, et al. Risk of serious injury for young baseball pitchers: a 10-year prospective study. Am J Sports Med. 2011; 39(2):253-257.
6. Lyman S, Fleisig GS, Andrews JR, Osinski ED. Effect of pitch type, pitch count, and pitching mechanics on risk of elbow and shoulder pain in youth baseball pitchers. Am J Sports Med. 2002; 30(4):463-468.
7. Lyman S, Fleisig GS, Waterbor JW, et al. Longitudinal study of elbow and shoulder pain in youth baseball pitchers. Med Sci Sports Exerc. 2001; 33(11):1803-1810.
8. Trakis JE, McHugh MP, Caracciolo PA, Bus-ciacco L, Mullaney M, Nicholas SJ. Muscle strength and range of motion in adolescent pitchers with throwing-related pain: implica-tions for injury prevention. Am J Sports Med. 2008; 36(11):2173-2178.
9. Byram IR, Bushnell BD, Dugger K, Char-ron K, Harrell FE Jr, Noonan TJ. Preseason shoulder strength measurements in profes-sional baseball pitchers: identifying players at risk for injury. Am J Sports Med. 2010; 38(7):1375-1382.
10. Bushnell BD, Anz AW, Noonan TJ, Torry MR, Hawkins RJ. Association of maximum pitch velocity and elbow injury in profession-al baseball pitchers. Am J Sports Med. 2010; 38(4):728-732.
11. Wilk KE, Macrina LC, Fleisig GS, et al. Def-icits in glenohumeral passive range of motion increase risk of elbow injury in professional baseball pitchers: a prospective study. Am J Sports Med. 2014; 42(9):2075-2081.
12. Aguinaldo AL, Buttermore J, Chambers H. Effects of upper trunk rotation on shoulder joint torque among baseball pitchers of vari-ous levels. J Appl Biomech. 2007; 23(1):42-51.
13. Aguinaldo AL, Chambers H. Correlation of throwing mechanics with elbow valgus load in adult baseball pitchers. Am J Sports Med. 2009; 37(10):2043-2048.
14. Davis JT, Limpisvasti O, Fluhme D, et al. The effect of pitching biomechanics on the upper extremity in youth and adolescent baseball pitchers. Am J Sports Med. 2009; 37(8):1484-1491.
15. Dun S, Loftice J, Fleisig GS, Kingsley D, Andrews JR. A biomechanical comparison of youth baseball pitches: is the curveball
potentially harmful? Am J Sports Med. 2008; 36(4):686-692.
16. Escamilla R, Fleisig G, Barrentine S, An-drews J, Moorman C III. Kinematic and kinetic comparisons between American and Korean professional baseball pitchers. Sports Biomech. 2002; 1(2):213-228.
17. Fleisig GS, Andrews JR, Dillman CJ, Esca-milla RF. Kinetics of baseball pitching with implications about injury mechanisms. Am J Sports Med. 1995; 23(2):233-239.
18. Fleisig GS, Barrentine SW, Escamilla RF, Andrews JR. Biomechanics of overhand throwing with implications for injuries. Sports Med. 1996; 21(6):421-437.
19. Oyama S, Yu B, Blackburn JT, Padua DA, Li L, Myers JB. Effect of excessive contralat-eral trunk tilt on pitching biomechanics and performance in high school baseball pitchers. Am J Sports Med. 2013; 41(10):2430-2438.
20. Wicke J, Keeley DW, Oliver GD. Compari-son of pitching kinematics between youth and adult baseball pitchers: a meta-analytic approach. Sports Biomech. 2013; 12(4):315-323.
21. Bere T, Flørenes TW, Krosshaug T, et al. Mechanisms of anterior cruciate ligament in-jury in World Cup alpine skiing: a systematic video analysis of 20 cases. Am J Sports Med. 2011; 39(7):1421-1429.
22. Stuelcken MC, Mellifont DB, Gorman AD, Sayers MG. Mechanisms of anterior cruciate ligament injuries in elite women’s netball: a systematic video analysis. J Sports Sci. 2016; 34(16):1516-1522.
23. Hewett TE, Torg JS, Boden BP. Video analy-sis of trunk and knee motion during non-contact anterior cruciate ligament injury in female athletes: lateral trunk and knee abduc-tion motion are combined components of the injury mechanism. Br J Sports Med. 2009; 43(6):417-422.
24. Namdari S, Baldwin K, Ahn A, Huffman GR, Sennett BJ. Performance after rotator cuff tear and operative treatment: a case-control study of major league baseball pitchers. J Athl Train. 2011; 46(3):296-302.
25. Fedoriw WW, Ramkumar P, McCulloch PC, Lintner DM. Return to play after treatment of superior labral tears in professional baseball players. Am J Sports Med. 2014; 42(5):1155-1160.
26. Fleisig GS, Leddon CE, Laughlin WA, et al. Biomechanical performance of baseball pitchers with a history of ulnar collateral ligament reconstruction. Am J Sports Med. 2015; 43(5):1045-1050.
27. Ford GM, Genuario J, Kinkartz J, Githens T, Noonan T. Return-to-play outcomes in professional baseball players after medial ul-nar collateral ligament injuries: comparison of operative versus nonoperative treatment based on magnetic resonance imaging find-ings. Am J Sports Med. 2016; 44(3):723-728.
10
MONTH/MONTH 201x | Volume xx • Number X
n Feature Article
28. Murray TA, Cook TD, Werner SL, Schlegel TF, Hawkins RJ. The effects of extended play on professional baseball pitchers. Am J Sports Med. 2001; 29(2):137-142.
29. Harris JD, Frank JM, Jordan MA, et al. Re-turn to sport following shoulder surgery in the elite pitcher: a systematic review. Sports Health. 2013; 5(4):367-376.
30. Werner SL, Murray TA, Hawkins RJ, Gill TJ. Relationship between throwing mechan-ics and elbow valgus in professional base-ball pitchers. J Shoulder Elbow Surg. 2002; 11(2):151-155.
31. Douoguih WA, Dolce DL, Lincoln AE. Early cocking phase mechanics and upper extrem-ity surgery risk in starting professional base-ball pitchers. Orthop J Sports Med. 2015; 3(4):2325967115581594.
32. Urbin MA, Fleisig GS, Abebe A, Andrews
JR. Associations between timing in the base-ball pitch and shoulder kinetics, elbow kinet-ics, and ball speed. Am J Sports Med. 2013; 41(2):336-342.
33. Wight J, Richards J, Hall S. Influence of pel-vis rotation styles on baseball pitching me-chanics. Sports Biomech. 2004; 3(1):67-83.
34. Mullaney MJ, McHugh MP, Donofrio TM, Nicholas SJ. Upper and lower extremity mus-cle fatigue after a baseball pitching perfor-mance. Am J Sports Med. 2005; 33(1):108-113.
35. Fleisig GS, Barrentine SW, Zheng N, Esca-milla RF, Andrews JR. Kinematic and kinetic comparison of baseball pitching among vari-ous levels of development. J Biomech. 1999; 32(12):1371-1375.
36. Fleisig GS, Andrews JR. Prevention of elbow injuries in youth baseball pitchers. Sports
Health. 2012; 4(5):419-424.
37. Rice SG, Congeni JA; and Council on Sports Medicine and Fitness. Baseball and softball. Pediatrics. 2012; 129(3):e842-e856.
38. Fleisig G, Chu Y, Weber A, Andrews J. Vari-ability in baseball pitching biomechanics among various levels of competition. Sports Biomech. 2009; 8(1):10-21.
39. Polster JM, Bullen J, Obuchowski NA, Bryan JA, Soloff L, Schickendantz MS. Relation-ship between humeral torsion and injury in professional baseball pitchers. Am J Sports Med. 2013; 41(9):2015-2021.
40. Warden SJ, Bogenschutz ED, Smith HD, Gutierrez AR. Throwing induces substantial torsional adaptation within the midshaft hu-merus of male baseball players. Bone. 2009; 45(5):931-941.
11