Embed Size (px)
Citation preview
-~-------
Journal of Research of the National Bureau of Standards Vol. 60, No. 2, February 1958 Research Paper 2826
Precise Evaluation of Surface Area With Indirectly Calculated Dead Space
William V. Loebenstein
The determination of surface area f rom ni trogen adsorp tion data ob tain ed at low temperatUl'e by vol umelri c methods is subj ect to several error . One error that becomes especially serious when t he surface area is small is associated wi t h t he cali bration of t he dead space with helium. This er ror is large because the vo lume of adsorbed gas is calculated as a small diffe rence between two comparatively large quantiti es.
A statistical method of successive approximations has been developed for calculating t he dead space. The latte r is obtained as t hat quantity necessary t o yield t he best agreement with t he known isotherm equation. T his proced ure fi xes t he va lue of V m (directly proportiona l to t he surface area). The proced ure a lso provides fin es ti mate of t he experimental error assoc iated wi th t he over-all determinat ion.
1. Introduction
Adsorp tion of vapors a t temperature near their boiling points provides t he most convenien t means for determination of the surfaee areas of finely divided or porous solids. In volumetrie appara tus, which is most commonly used, the amount of adsorbed gas is the difference between that admi tted to the sample container and that remaining in the dead space. The latter is the void space between 0 1'
wi thin the solid par ticles plus the volume of the connecting t ubing.
The precision wi th which a dead spaee calibration is normally made using helium is fairly well limi ted by the equipment and cloes no t depend upon the surface area of the sample. The effect of this limitation of precision upon the measm-ement of the volume of gas (nitrogen , for example) adsorbed is especially serious when the surface area is relatively small . This is because Lhe amount of gas adsorbed is calcula ted as th e small difference between two large quantities. Indeed, the uncertain ty in the measurement r esulting from the dead space calibration is greater than that of all other factors which con tribute to the over-all error of the surface area determination . It is difficult to express this fact using rigorous mathematical language because the sm-face area evaluation results from the parameters of a least-square line assumed to represent all of the points. N o simple relationship exists between the over-all error and the errors associated wi th the determination of the individual points, especially since an error in the dead space actually des troys the linearity of the plotted curve.
Anyone who has made surface area determinations in the conventional manner can calculate from his own data the percentage change in surface area resul ting from an error of, say, one percent in the dead space. The author has found that this error exceeded 100 percen t for a sample of glass beads whose area was of the order of 0 .2 m2/g as measured with N2 a t 900 K . N ormally, of course, the careful technician would in such a case make sufficient replicate determina tions of the dead pace to insure tha t i ts precision was appreciably bet ter than one per cent.
105
In rou tine determinaLions where the isotherm equa tion is known from previous experience, the dead space need not be experimentally ob tained. The surface area can be found by assigning a value for the dead space that will allow the experimen tal m easuremen ts to fi t the known iso th erm. This paper describes a procedure of ucces ive approximaLions by which this is accomplished. The con erva tive technician may always prefer to determine the helium calibration direc tly. H e can use the resultant dead space value as a starting point which may then be "refined" according to the technique described here. It is unnecessary to continue t he refinemen t beyond the point in the calculations wh ere the error of the dead space ccases to be the dominant fac tor contribu ting to the over-all error of t he urface area determina tion.
It is for tunate that the adsorption isotherms which apply to a la rge number of ma terials measured at or near the boiling point of t he adsorbate are expressible in one linear form or ano ther . These are represented by t he well known "Free Surface" equa tion of Brunauer , Emmett, and T eller [1] 1 (BET) (eq 1), and by the equally familiar Langmuir equation (eq 2) .
p /[V(Po-p )]= [(O- l )/ (V ",O) ] p /Po+ l / (V",O) (1)
p /V = po/(VmB )+ p /V m, (2)
p = pressure attained when adsorption and desorption processes ar e a t equilibrium,
po=vapor pressure, V= volume of gas adsorbed STP,
B, O= constants (under condi tions of the experiment) related to the energy of adsorpt ion, and
V m= a constan t equal to t he volume of gas (STP) required to cover the surface to t he extent of one molecular layer .
1 Figures in brackets indicate the literatu re references at the end of this paper.
2 . Determination of the Dead Space Factor Z
The volume of adsorbed gas may be calculated from measurements as follows:
V = k [N- (fp jR ) Z] (3)
where N is the total number of moles of gas admitted to the adsorption tube and the quantity (jp/R )Z represents the moles which remain in the gaseous state in equilibrium with the adsorbed phase. The factor f corrects for the nonideal behavior of a real gas at low temperatures. It is usually expressed as (l + ap ) where a is a constant [2] depending upon t~e pal:ticular gas and its ~emperatu~·e. The quantIty R ~s the gas constant III appropnate units; Z is the ratlO of the dead space volume to the absolute temperature ; and the proportionality constant k converts the moles of gas adsorbed to milliliters per gram at STP. The problem then is to choose a value of Z by trial so that with the measured values of Nand p the best fit to the known isotherm equation is obtained. . It is customary in using the BET isotherm equa
tlOn t? plot p / [V.(Po:-p] as Y against p jpo as X. The resu l tll1g graph IS Imear and may be written as follows :
Y = a+ bX (4)
where the intercept a and the slope b depend only on C and V w It should be noted that I jV m= a+ b. The surfa:ce area is determined by multiplying Vm by a packmg factor characteristic of the gas adsorbed and of the temperature at which the isotherm was carried ou t.
The denominator of eq (6) contains only terms 3 in x and, hence, is independent of Z and need not be determined. The numerator is designated by F (z )
(7)
As each successive choice of Z is made, the value of Y is computed for each experimental point and F (z) evaluated from eq (7) . If the new F (z ) is nearer zero than the last, the new choice has then resulted in an improvement in linearity. 4
The question may arise as to how far this procedure need be carried before the results can be considered acceptable. This can be answered in terms of the experimental error as measured by the random scatter of the points. This is discussed in the next section of this paper. A standard deviation S(lIV ) a.ttributable to randoI!! scatter is relatively insensitIve to small changes 111 Z . On the other hand, the value of I /V m may be extremely sensitive to changes in Z. Consider, therefore, two values of Z that produce corresponding values of F (z)' both greater than and less than zero , respectively . Two sets of values for Y may be determined and from these, two values of I /V m . If the difference between these latter two is small compared with S(i /vm) , estimated from either set, no further improvement in Z can be justified by the data.
3 . Estimate of Experimental Error
The preceding section was concerned with the con tribu tion of the error of the dead space to th e over-all variability of the results. When this is sufficiently reduced, the variability that remains is a measure of the scatter of the experimental points.
The errors associated with the regression pal'ameters a and b may be r eadily calculated. Furthermore, an equation may be derived [3, 4, 5] for the standard deviation of the sum of a and b. The result may be written
The best value of Z in eq (3) is obtained when. th E, resulting values for the gas adsorbed obey eq (4) . It ~s not possib~e to determine Z with sufficient preClSlOn by graplllcal means alonc, hence an analytical D!et~od was developed .. This was achieved by CODsldenng eq (4 ) as a speClal case of the more general empirical equation
s2( 1 IVm)=S~ . x [l jn+ (I _ X )2jS X2].
(5) The term s~ . x is evaluated as follows 5, 6 Y = a+ bX+ cX2
(8)
The least square value for th e added parameter c can be determined and the value assumed for Z adjusted to make this coefficient approach zero.
The lcast square solution 2 for the coefficient c is
c S x2Sx2y- SX3 Sxy SX2SX4- (S x3) 2
, The following nomeurlature is used throughout this paper:
X, Y are the individual points. n=numb('r of points, X=("l:.X )/n; Y=("l:.Y)/n, x= X -X; Y= y-IT;
Sx'= "l:.X'-("l:. X)'/n, Sy'= "l:.Y'-(YY)2/n, Sxy= "l:.XY-(YX ) (Y V)/n Sx'= YXX'-(Y X) (YX')/n
Sx'y= "l:. X' Y -(Y X') (YY)/n: aud Sx·= "l:.X'· )(2-(YX')'/n -
(6)
(9)
Confidence limits in I /V m may be determined by inserting "student-t" values into the relationship
(10)
3 Pressure (or relative pressure), which Is taken as the independent variable, Is assumed to be measured withou t error. W hile this is not strictly true, the assumption is permissible since these errors are probably very small as compared with those for derived quantities such as the volume of gas adsorbed which appears in the ordinate. Furthermore, the errors in Y are assumed to be completely random and normally distributed about a mean of zero.
• The qnantity F ,Z) (as it passes through zero) hasa positive slope (with respect to Z). An estimate of the magnitude of this slope from previous choices aids in the selection of Z.
• T he quantity (n-3) Is preferred here as a more conservative estimate of the number of degrees of freedom than (n-2). This Is because the da.ta have been utilized for the determination of three parameters instead of the usual two.
6 In compllting 8y.% from eq (9) , rounding oll by dropping of di~its should be postponed until the end of the operat ion, otherwise serious errors may be introduced.
106
Hence, the confidence interval surrounding V m (which is proportional to the surface area) is given as
(11)
The 95-percent confidence limits are implied if not otherwise stated. In layman's language this means that the interval determined by the stated limits will , on the average, bracket the correct value of l /V", 95 percent of the time. The appropriate "student-t" values may be found in any elementary textbook on statistical methods.
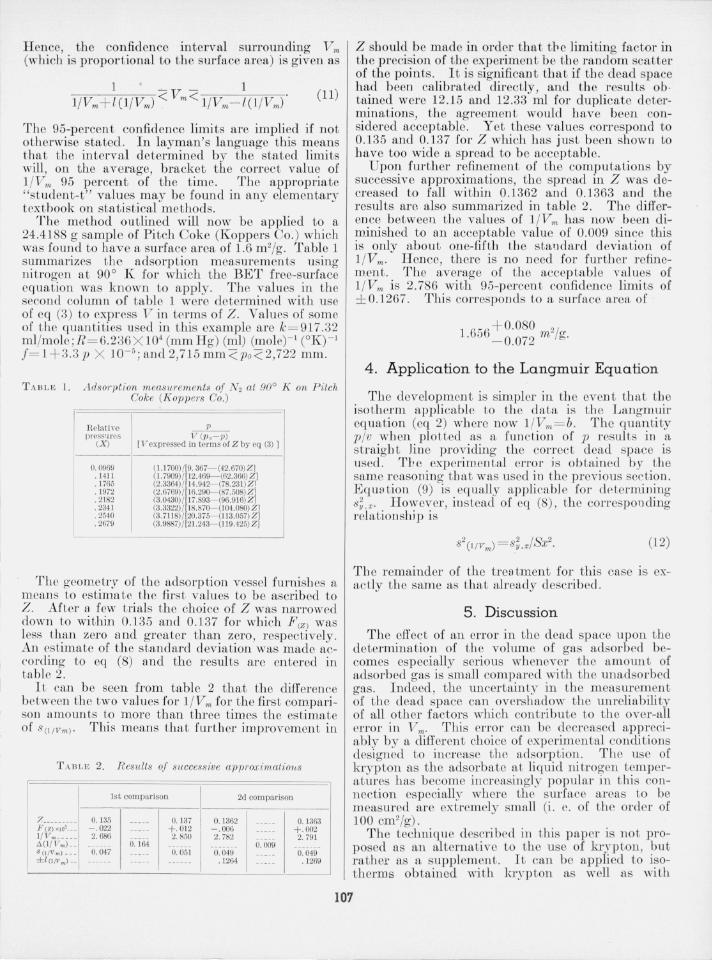
The method outlined will now be applied to a 24.4188 g sample of Pitch Coke (Koppers Co. ) which was found to have a surface area of 1.6 m 2/g. Table 1 summarizes the adsorption measurements using nitrogen at 90 0 K for which the BET free-surface equation was known to apply . The values in the second column of table 1 were determined with use of eq (3) to express V in terms of Z . Values of som e of the quantities used in this example are k = 917 .32 ml/mole; R = 6.236 X 10⁴ (mmHg) (ml) (mole)-1 (OIq -1 f= 1+ 3.3p X 10- 5 ; and 2,71 5mm < po< 2,722 mm.
T A BLE 1. Adsorption measW'emenls of N z at 90° K on P itch Coke (K oppers Co .)
Rclatiyc preSS1 lres
(X )
0.0969 . 1411 . 1765 .1972 .2182 .2341 .2540 .2679
p i7(p ,-p)
[11 expressed in terms of Z by cq (3) 1
(1.1700)/[9. 367-(42.6iO)ZJ (I. 7909) / [12.469-(62.366) Zl (2.3364)!!14.942-(78.231)Zl (2.6769) / 16.290-(87.508)Zj (3.0430)/ [17.893-(96.916)Z (3.3322)/ [18.870-(104.080) Zj (3.7118) /[20.375-(11 3.057) Z (3.9887)/121.243- (119.425) Zl
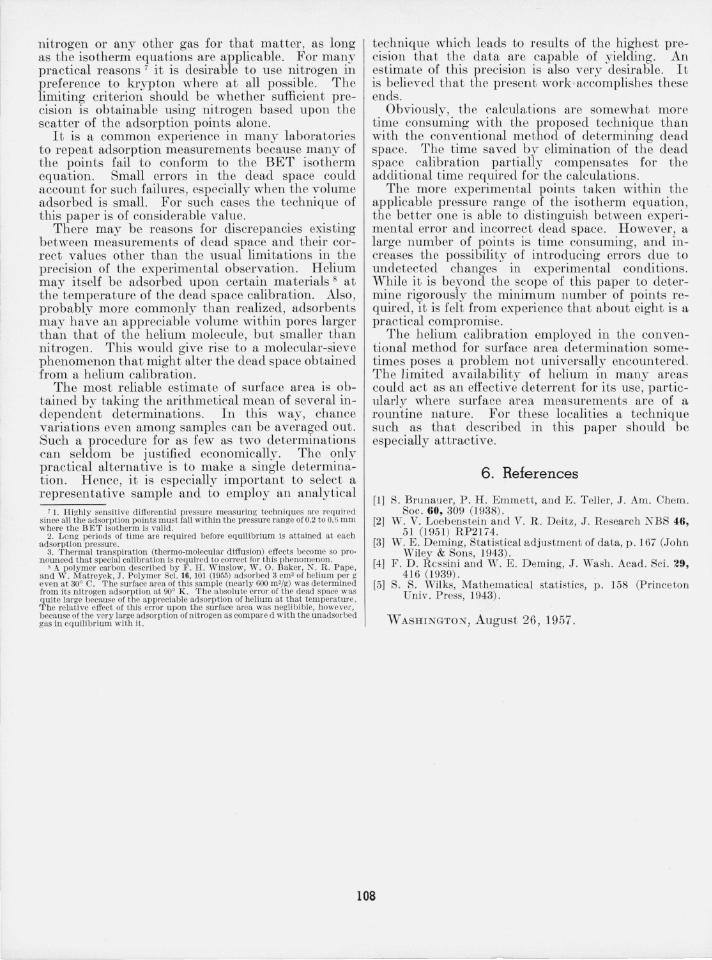
The geometry of th e adsorption vessel furnishes a means to estimate the nrst valu es to be ascribed to Z . After II few trials the choice of Z was narrowed down to within 0.135 and 0.137 for which F (z) was less th.an zero II nd greater than zero, respectively. An estun.ate of the standard deviation was made according to eq (8) llnd the results are entered in tablc 2.
I t can be seen from table 2 that the difference between the two values for l /Vm for the fu'st compariSOIl llmounts to more than three times the estimate of S(lIVm)' This means that further improvement in
T ABLE 2. Res1tits oj successive approximal7;ohs
7 ...... _ F CZ)x105 __ _ I / V m •••••
£0(1/ V m) .. S (INm) __ _
±l(I{Vm)--
1st comparison
0. 135 -. 022 2.686
0.047 0.164
0.137 +.0 12 2.850
0.051
0.1362 -.006 2.782
0. 049 .1264
2d com parison
0.009
0.1363 +.002 2.791
0.049 . 1269
Z should be made in order that tpe limiting faetor in the precision of the experiment be the random scatter of the points . It is significant that if the dead space had been calibrated directly, and the results ob · tained were 12 .15 and 12.33 ml for duplicate determinations, the agreement would have been considered acceptable. Yet th ese values correspond to 0.135 and 0.137 for Z which has just been shown to have too wide a spread to be acceptable.
Upon further refulement of the compu taLions by successive approximations, the pread in Z was decreased to fall within 0.1362 and 0.1363 and the resul ts are also summarized in table 2. The difference between the values of l /Vm has now been diminished to lln acceptable value of 0.009 since this is only about one-fifth the standard deviation of l /Vm . H ence, there is no Il eed for furth er refinement. The average of the acceptable values of l /Vm is 2.786 wiLh 95-percen t confidence limits of ± 0.1267. This corresponds to a surface area of
1 656 + 0.080 2/ . - 0.072 m g.
4 . Application to the Langmuir Equation
Th e development is simpler iu the event that the isotherm applicable to the data is the Langmuir equation (eq 2) wh ere now l /Vm = b. The quantity p/v wh en ploUed as a fun ction of p results in a s traigh t lin e providing the correct dead space is used . Th e experimental e1'1'Ol' is obtained by the same r easoning that was used in the previo us section . Eqm) tion (9) is equally applicabl e for determining s~,x. However , in stead of eq (8), the corresponding relationship is
(12)
Th e remainder of the treaLment for this case IS exactly th e same as that already described.
5. Discussion
The effect of an error in the dead space upon the determination of the volume of gas adsorbed becomes especially serious whenever the amount of adsorbed gas is small compared with the unadsorbed gas. Indeed , the uncertainty in the measurem ent of the dead space can overshadow the unreliability of all other factors which contribute to th e over-all error in V m• This error can be decreased appreciably by a different choice of experimental condit ions designed to increase the adsorp tion. The use of kryp ton as the adsorbate at liquid nitrogen temperatures has become increasingly popular in this connection especially where the surface areas to be measured are extremely small (i . e. of t he order of 100 cm 2/g) .
The technique described in this paper is not proposed as an alternative to th e use of krypton, but rather as a supplement. It can be applied to isotherms obtained with kryp ton as well as with
107
nitrogen or any other gas for that matter, as long as the isotherm equations are applicable. For many practical reasons 7 it is desirable to use nitrogen in preference to krypton where at all possible. The limiting criterion should be whether sufficient precision is obtainable using nitrogen based upon the scatter of the adsorption points alone.
It is a common experience in many laboratories to repeat adsorption measurements because many of the points fail to conform to the BET isotherm equation. Small errors in the dead space could account for such failures , especially when the volume adsorbed is small. For such cases the technique of this paper is of considerable value.
There may be reasons for discrepancies existing between measurements of dead space and their correct values other than the usual limitations in the precision of the experimental observation. Helium may itself be adsorbed upon certain materials 8 at the temperature of the dead space calibration. Also, probably more commonly than realized, adsorbents may have an appreciable volume within pores larger than that of the helium molecule, but smaller than nitrogen. This would give rise to a molecular-sieve phenomenon that might alter the dead space obtained from a helium calibration.
The most reliable estimate of surface area is obtained by taking the arithmetical mean of several independent determinations. In this way, chance variations even among samples can be averaged out. Such a procedure for as few as two determinations can seldom be justified economically. The only practical alternative is to make a single determination. Hence, it is especially important to select a representative sample and to employ an analytical
j 1. I-li ghly sensitive differential pressure measuring techniques are required sincc all the adsorption pOints must fall within the pressure range of 0.2 to 0.(, mm where the BET isotherm is valid.
2. Long periods of time are required before equilibrium is attained at each adsorption pressure .
3. Thermal transpiration (thermo·molecular diffusion) effects become so pro· nounced that special calibration is required to correct for this phenomenon.
S A polymer carbon described by F . H. WinslOW, W . O. Baker , N . R . P ape, and ,I'. Matreyek, J. Polymer Sci. 16, 101 (1955) adsorbed 3 cm3 of helium per g even at 30° C. The surface area of this sample (nearly 600 m'/g) was determined from its nitrogen adsorption at 90° K . The absolute error of the dead space was quite large because of the appreciable adsorption of helium at that temperature. The relative effect of this error upon the surface area was neglibible, however, because of the very large adsorption of nitrogen as compare d with the unadsorbed gas in equilibrium with it.
technique which leads to results of the highest precision that the data are capable of yielding. An cstimate of this precision is also very desirable. It is believed that the present work accomplishes these ends.
Obviously, the calculations are somewhat more time consuming with the proposed technique than with the conventional method of determining dead space. The time saved by elimination of the dead space calibration partially compensates for the additional time required for thc calculations.
The more experimental points taken within the applicable pressure range of the isotherm equation, the better one is able to distinguish between experimental error and incorrect dead space. However, a large number of points is time consuming, and increases the possibility of introducing errors due to undetected changes in experimental conditions. While it is beyond the scope of this paper to determine rigorously the minimum number of points required, it is felt from experience that about eight is a practical compromise.
The helium calibration employed in the conventional method for surface area determination sometimes poses a problem not universally encountered. The limited availability of helium in many areas could act as an effective deterrent for its use, particularly where surface area m easurements are of a rountine nature. For these localities a technique such as that described in this paper should be especially attractive.
6 . References
[Jl S. Brunauer, P. H. Emmett, and E. Teller, J. Am. Chem. Soc. 60, 309 (1938).
[2] W. V. Loebenstein and V. R. Deitz, J. Research NBS 46, 51 (1951) RP2174.
[3] W. E. Deming, Statistical adjustment of data, p. 167 (John Wiley & Sons, 1943).
[4] F. D. Rcssini and W. E. D eming, J. Wash. Acad . Sci. 29, 416 (1939) .
[5] S. S. Wilks, Mathematical statistics, p. 158 (Princeton Univ. Press, 1943) .
WASHINGTON, August 26, 1957.
108