Embed Size (px)
Citation preview
This article was downloaded by: [Gazi University]On: 04 November 2014, At: 01:39Publisher: Taylor & FrancisInforma Ltd Registered in England and Wales Registered Number: 1072954 Registered office: Mortimer House,37-41 Mortimer Street, London W1T 3JH, UK
Human and Ecological Risk Assessment: AnInternational JournalPublication details, including instructions for authors and subscription information:http://www.tandfonline.com/loi/bher20
Pre-Positioning Disaster Response Facilities and ReliefItemsÇiğdem Renklia & Serhan Durana
a Middle East Technical University, Industrial Engineering Department, Ankara, TurkeyAccepted author version posted online: 05 Sep 2014.
To cite this article: Çiğdem Renkli & Serhan Duran (2014): Pre-Positioning Disaster Response Facilities and Relief Items,Human and Ecological Risk Assessment: An International Journal, DOI: 10.1080/10807039.2014.957940
To link to this article: http://dx.doi.org/10.1080/10807039.2014.957940
Disclaimer: This is a version of an unedited manuscript that has been accepted for publication. As a serviceto authors and researchers we are providing this version of the accepted manuscript (AM). Copyediting,typesetting, and review of the resulting proof will be undertaken on this manuscript before final publication ofthe Version of Record (VoR). During production and pre-press, errors may be discovered which could affect thecontent, and all legal disclaimers that apply to the journal relate to this version also.
PLEASE SCROLL DOWN FOR ARTICLE
Taylor & Francis makes every effort to ensure the accuracy of all the information (the “Content”) containedin the publications on our platform. However, Taylor & Francis, our agents, and our licensors make norepresentations or warranties whatsoever as to the accuracy, completeness, or suitability for any purpose of theContent. Any opinions and views expressed in this publication are the opinions and views of the authors, andare not the views of or endorsed by Taylor & Francis. The accuracy of the Content should not be relied upon andshould be independently verified with primary sources of information. Taylor and Francis shall not be liable forany losses, actions, claims, proceedings, demands, costs, expenses, damages, and other liabilities whatsoeveror howsoever caused arising directly or indirectly in connection with, in relation to or arising out of the use ofthe Content.
This article may be used for research, teaching, and private study purposes. Any substantial or systematicreproduction, redistribution, reselling, loan, sub-licensing, systematic supply, or distribution in anyform to anyone is expressly forbidden. Terms & Conditions of access and use can be found at http://www.tandfonline.com/page/terms-and-conditions
ACCEPTED MANUSCRIPT
ACCEPTED MANUSCRIPT 1
Pre-Positioning Disaster Response Facilities and Relief Items
Çiğdem Renkli and Serhan Duran
Middle East Technical University, Industrial Engineering Department, Ankara, Turkey
Address correspondence to Çiğdem Renkli, Orta Doğu Teknik Üniversitesi Endüstri
Mühendisliği Bölümü Üniversiteler Mahallesi, Dumlupınar Bulvarı No:1 06800 Çankaya
Ankara/TURKEY; E-mail: [email protected]
Running Head: Pre-Positioning Disaster Response Facilities
Dow
nloa
ded
by [
Gaz
i Uni
vers
ity]
at 0
1:39
04
Nov
embe
r 20
14
ACCEPTED MANUSCRIPT
ACCEPTED MANUSCRIPT 2
ABSTRACT
Large-scale disasters cause enormous damage to people living in the affected areas.
Providing relief quickly to the affected is a critical issue in recovering the effects of a disaster.
Pre-disaster planning has an important role on reducing the arrival time of relief items to the
affected areas and efficiently allocating them. In this study, a mixed integer programming model
is proposed in order to pre-position warehouses throughout a potential affected area and
determine the amount of relief items to be held in those warehouses. Time between the strike of
the disaster and arrival of relief items at the affected areas is aimed to be minimized. In addition,
using probabilistic constraints, the model ensures that relief items arrive at affected areas within
a certain time window with certain reliability. Considering instable fault lines on which Istanbul
is located, the proposed model is applied to the Istanbul case for pre-positioning warehouses a
priori to the possible expected large-scale earthquake.
Key Words: disaster management, humanitarian logistics, mixed integer programming,
probabilistic constraints. Dow
nloa
ded
by [
Gaz
i Uni
vers
ity]
at 0
1:39
04
Nov
embe
r 20
14
ACCEPTED MANUSCRIPT
ACCEPTED MANUSCRIPT 3
INTRODUCTION
Disasters are stochastic in their nature; exact time, place, and magnitude of disasters
cannot be known before they strike. They are unpreventable events that cause many deaths and
affect even more people. People who lack survival needs like immediate medical assistance,
food, water, and need immediate assistance are defined as affected people (International
Federation of Red Cross and Red Crescent Societies 2012). Assisting affected people by
responding quickly and effectively is a crucial but difficult task due to these uncertainties. For
quick and effective response, humanitarian logistics plans should be prepared.
It is stated that `humanitarian supply chains are among the most dynamic and complex
supply chains in the world' (Thomas 2005). Challenges due to unpredictability of disasters must
be considered in humanitarian logistics. Balcik and Beamon (2008) describe the challenging
characteristics of humanitarian logistics as `Unpredictability of demand, in terms of timing,
location, type and size; suddenly occurring demand in very large amounts and short lead times
for a variety of supplies; high stakes associated with adequate and timely delivery; and, lack of
resources (supply, people, technology, transportation capacity, and money).' Just the numbers;
9,655 people killed and 124.5 million needing assistance in 2012 due to natural disasters indicate
the colossal needs to be satisfied timely (Guha-Sapir et al. 2013).
In addition to these challenging characteristics, survivability of infrastructure of the affected
areas is another concern (Barbarosoglu and Arda 2004). A large-scale disaster may destroy paths
linking locations on the affected area and block the roads for relief transportation. In this study,
we focus on the infrastructure vulnerability concept and propose a mathematical formulation that
Dow
nloa
ded
by [
Gaz
i Uni
vers
ity]
at 0
1:39
04
Nov
embe
r 20
14
ACCEPTED MANUSCRIPT
ACCEPTED MANUSCRIPT 4
locates disaster response facilities (DRFs) and relief items while providing certain reliability on
relief item transportation.
The rest of the paper is organized as follows. First, a brief review of the related literature is
given. Then, proposed mathematical models are explained. Later, computational studies and
results are presented using a numerical example and a numerical study on the city of Istanbul. In
the Conclusion, the results are discussed and future studies are mentioned.
LITETATURE REVIEW
Humanitarian logistics is a broad area that includes different stages of disaster
management. Literature on humanitarian logistic can be classified as literature on preparedness,
literature on disaster response, and literature on relief operations (Apte 2010).
Hongzhong et al. propose a model that optimizes the location of facilities for medical
supplies to address large-scale emergencies in the Los Angeles area (Hongzhong et al. 2005). In
this study, an emergency service location problem is examined considering large-scale
emergency situations and characteristics of a large-scale facility location problem. Proposed
large-scale emergency facility location problem (LEMS) mainly decides on location of the
facilities. Uncertainty of demand is handled by defining a set of possible emergency situations,
and using parameters representing both the `likelihood that a certain emergency situation affects
a demand point and impact that the emergency situation will have on the population of a demand
point' (ibid.). Additional coverage for the demand points is provided by forcing the expected
coverage of a demand point to be greater than a required number.
Dow
nloa
ded
by [
Gaz
i Uni
vers
ity]
at 0
1:39
04
Nov
embe
r 20
14
ACCEPTED MANUSCRIPT
ACCEPTED MANUSCRIPT 5
Balcik and Beamon (2008) study a variant of the maximal covering location problem that
determines number and location of distribution centers and amount of relief supplies to be stored
considering quick-onset disasters. The problem includes multiple relief items with different
coverage requirements, a pre-disaster budget constraint, an expected post-disaster budget
constraint, capacity constraints, and stepwise partial coverage. Uncertainty is again handled by
using possible scenarios.
Mete and Zabinsky also propose a two-stage stochastic programming problem that
determines locations of the facilities and inventory levels to be held. Their formulation provides
a solution for storage and distribution of medical supplies. Using possible disaster scenarios, the
model handles the uncertainty related with a disaster. They use the model in a case study for
earthquake scenarios in the Seattle area where hospitals use their own warehouses or shared
warehouses to store relief items. In the case study, the authors aim to use pre-positioning
warehouses to store additional items by considering timely delivery.
Another two-stage stochastic programming model is proposed by Rawls and Turnquist
(2010) to decide the location and amounts of various types of emergency supplies to be
positioned a priori to a disaster. Uncertainties in demand and in transportation network
availability are handled using scenarios. In addition, probability that supplies are damaged is
considered in the model. They stated that solving deterministic equivalent of the two-stage
stochastic programming model is problematic with large data and they used a L-shaped method
to solve it. The model is applied to a case study on hurricane threats in southeastern USA. Later,
Rawls and Turnquist (2011) extend their previous study by adding reliability and maximal
service distance constraints. They define a reliable set of scenarios and allow the model to
Dow
nloa
ded
by [
Gaz
i Uni
vers
ity]
at 0
1:39
04
Nov
embe
r 20
14
ACCEPTED MANUSCRIPT
ACCEPTED MANUSCRIPT 6
endogenously select the reliability set of scenarios. Demand in a reliable set is certainly covered
within the maximal service distance. Sum of occurring probabilities of the reliable scenarios is
forced to be greater than a given reliability so that probability of covering all demand within the
maximal service distance is greater than or equal to that given reliability. After their work in
2011, Rawls and Turnquist extend their study with reliability constraints by adding time periods
(Rawls and Turnquist 2012).
Duran et al. (2011) conduct a study to improve CARE International's emergency response
times. The model finds optimal number and location of pre-positioning warehouses given that
demand for relief supplies can be met from both pre-positioned warehouses and suppliers. They
allow multiple events to occur within a replenishment lead time. Their Mixed Integer
Programming (MIP) model minimizes the average response time over all demand instances and
gives decisions on location of warehouses, quantities of supply from warehouses and from
suppliers, and the quantity of supply held in a warehouse.
Verma and Gaukler (2011) present a two-stage stochastic programming model in order to
locate disaster response facilities. Their model locates the facilities in the first stage, and in the
second stage it determines the amounts transported from an opened facility to demand points.
They use possible scenarios for epicenter of the disaster and their model takes the possible effect
of the disaster on the functioning of a facility into account using a random variable depending on
the distance between the facility and the epicenter of the disaster. They conduct a computational
study for the state of California and present their results.
Klibi et al. (2013) propose a stochastic programming approach for pre-positioning
emergency supplies. They use a scenario-based approach and make decisions on location,
Dow
nloa
ded
by [
Gaz
i Uni
vers
ity]
at 0
1:39
04
Nov
embe
r 20
14
ACCEPTED MANUSCRIPT
ACCEPTED MANUSCRIPT 7
number, capacity of the facilities, and inventories to be held. They generate scenarios using the
Monte Carlo procedure, solve a two-stage stochastic programming model, and they evaluate
alternative designs using performance measures.
Gormez and Koksalan (2010) address the disaster response and relief facility location
problem for Istanbul. In terms of purposes, it is very similar to our study. However, the
formulations that are proposed are different. The data used are also obtained from the same
report (JICA and IMM 2002), however, the proposed models are single-item models and they are
deterministic. Stochastic elements are not included in the formulations that distinguish our study.
The preparation stage of humanitarian logistics, which is the focus of this work, includes
pre-positioning disaster response facilities and relief items a priori to a disaster. Facilities are
pre-positioned in order to reduce the response time. Although the exact time, magnitude, and the
place of a disaster cannot be known, its effect can be predicted. Therefore, in the literature,
stochasticity of the situation is mostly covered by considering possible scenarios and the
expected value of an objective function with respect to the scenarios. For example, when the
number of affected people in a population center is not known due to unpredictable magnitude of
the disaster, different scenarios with different disaster magnitude and thus with different number
of affected people can be utilized. Different probabilistic elements are present in disaster
scenarios such as survivability of the infrastructure. A disaster response facility can be pre-
positioned and some affected areas can be assigned to that facility to be served; however,
assuming that relief item transportation roads are not blocked, the aftermath of a disaster is not
realistic. This is why, in this study, probabilistic constraints are used to ensure a certain
reliability in transportation.
Dow
nloa
ded
by [
Gaz
i Uni
vers
ity]
at 0
1:39
04
Nov
embe
r 20
14
ACCEPTED MANUSCRIPT
ACCEPTED MANUSCRIPT 8
Probabilistic constraints, which are similar to the ones used in emergency facility location
problems in order to provide reliability in serving a demand point, are modified and adapted to
humanitarian logistics area for serving the purpose of ensuring reliability for an affected area to
get its relief items. In an emergency vehicle problem ReVelle and Hogan (1989) introduce
probabilistic constraints in order to provide a certain service reliability for demand points. In
other words, they ensure that every demand point is served by at least one emergency vehicle
with a certain probability. In this study, we modify their probabilistic constraints and adapt them
for our humanitarian problem in order to ensure that whole demand of every affected area is
satisfied with a certain probability. So, the problem of pre-positioning disaster response facilities
and relief items is formulated with the probabilistic constraints, which are also called as chance
constraints. Effects of the chance constraints on the solutions are discussed and the results of
chance-constrained formulation and scenario-based formulation are compared on a simulated
data consisting of 16 affected areas and 65 candidate disaster response facility locations.
Afterwards, the related data of Istanbul European Side is introduced and the chance-constrained
formulation is also used on this real life case.
In humanitarian logistics literature as explained so far, formulations that capture the
stochastic properties of a disaster by considering a set of possible scenarios are frequently used.
On the other hand in this study, a chance constrained formulation is used to handle the
uncertainties imposed by a disaster.
Dow
nloa
ded
by [
Gaz
i Uni
vers
ity]
at 0
1:39
04
Nov
embe
r 20
14
ACCEPTED MANUSCRIPT
ACCEPTED MANUSCRIPT 9
MATHEMATICAL MODELS
Firstly, we introduce a deterministic location-allocation formulation and name it as the
uncapacitated location problem (UNLP). UNLP chooses the optimal locations of disaster
response facilities (DRFs) among candidate sites, assigns the affected areas to DRFs, and
determines the inventories of relief items in the DRFs. UNLP’s objective is minimizing the total
weighted distance between the DRFs and their assigned affected areas. This formulation does not
capture the vulnerability of the infrastructure due to the disaster; therefore, we introduce chance
constraints to UNLP to have more reliable transportation. The new model in which the chance
constraints are included is called the uncapacitated location problem with chance constraints
(UNLP-C). First, UNLP formulation is introduced below. The aim is to minimize response time
by locating disaster response facilities and positioning relief items in those facilities a priori to a
possible disaster.
In the following formulation indices i, j, and k are used for indicating a set of candidate
locations, affected areas, and relief items, respectively.
Sets
I set of candidate DRF locations
J set of affected areas
K set of relief items
Parameters
ijd j J shortest distance between DRF i and affected area j
jkn j J , k K need (demand) for relief item k in affected area j
km k K maximal service distance of relief item k
Dow
nloa
ded
by [
Gaz
i Uni
vers
ity]
at 0
1:39
04
Nov
embe
r 20
14
ACCEPTED MANUSCRIPT
ACCEPTED MANUSCRIPT 10
w number of DRFs to be located
kQ k K total number of relief item k to be allocated
k k K reliability for relief item k
Variables
iy i I 1, if a DRF is located on candidate location i; 0, otherwise
ijkt i I j J k K 1, if a DRF is located on candidate location i sends relief
item k to affected area j; 0, otherwise
ijkx i I j J k K amount of relief item k sent from DFR located on candidate
location I to affected area j
ikh i ,I k K amount of relief item k held at DRF located in candidate location i
Objective
,
min /ij ijk jk
i I j J k K j J k K
d x n
(1)
Constraints
ijk jk
i I
x n
,j J k K (2)
ijk ik
j J
x h
,i I k K (3)
1 ijk i
j J k K
t M y
i I (4)
2ijk ijkx M t i I ,j J k K (5)
ijk ijkt x i I ,j J k K (6)
Dow
nloa
ded
by [
Gaz
i Uni
vers
ity]
at 0
1:39
04
Nov
embe
r 20
14
ACCEPTED MANUSCRIPT
ACCEPTED MANUSCRIPT 11
ij ijk k id t m y i I ,j J k K (7)
i
i I
y w
(8)
ik k
i I k K
h Q
(9)
0, 0 ik ijkh x i I ,j J k K (10)
, 0,1i ijky t i I ,j J k K (11)
Objective function (1) minimizes total weighted distance between affected areas and their
assigned DRFs. By this way, the model minimizes total response time after a disaster strikes.
Weights are the fractions of total items sent from DRFs to affected areas. Constraint set (2)
ensures that demand of all affected areas for all types of relief items are met. Constraint set (3)
forces that total amount of a relief item type held at a DRF equals to total amount of this relief
item type sent from the DRF to its assigned affected areas. Constraint set (4) guarantees that no
relief item can be sent to any affected area from a DRF at a location if a DRF is not located there.
1M stands for a big number in this constraint set. By Constraint set (5), a DRF cannot send the
type of relief item to an affected area if that DRF is not assigned to that affected area for sending
that type of relief item. 2M stands for a big number in this constraint set. If any relief item k is
not sent from a DRF on candidate location i to affected area j, then the corresponding binary
variable takes the value of zero due to the Constraint set (6) for all DRFs, affected areas and
relief item types. With the Constraint set (7), a DRF on candidate location i cannot be assigned to
affected area j for sending relief item k, if the distance between the DFR and the affected area is
greater than maximal service distance of that relief item. Maximal service distance increases as
Dow
nloa
ded
by [
Gaz
i Uni
vers
ity]
at 0
1:39
04
Nov
embe
r 20
14
ACCEPTED MANUSCRIPT
ACCEPTED MANUSCRIPT 12
criticality of relief item decreases. Constraint sets (8-9) are budget-related constraints. Number of
DRFs to be pre-positioned is limited by Constraint set (8) and total amount of relief items to be
allocated is limited by Constraint set (9). Constraint sets (10) are non-negativity and (11) are
integrality constraints.
The UNLP model simply finds the optimal locations of the disaster response facilities
minimizing the weighted distance. Because the DRFs are uncapacitated, the number of affected
areas that can be assigned to an open DRF is not limited. Utilizing maximum service distance
constraints, Constraint set (7), UNLP distinguishes between the relief items. Other than its
objective function and Constraint set (7), UNLP is a classical location-allocation problem that
does not have any humanitarian perspective.
With humanitarian purposes in mind, we introduce the reliability constraints to UNLP.
Survivability of the infrastructure is an important concern in transportation of the relief items and
we want to provide a certain reliability for meeting the demand for the relief items through
transportation means. New parameters must be introduced in order to formulate the reliability
constraints. Let
k k K minimum service reliability for item k
ijv i I j J probability that path linking DRF i and affected area j is
blocked
We point out that probabilistic constraints are used before at emergency vehicle location
problem (ReVelle and Hogan 1989).Probabilistic constraints are used to provide a reliability
value for at least one vehicle being available to serve to a demand point, and this condition is
given as:
Dow
nloa
ded
by [
Gaz
i Uni
vers
ity]
at 0
1:39
04
Nov
embe
r 20
14
ACCEPTED MANUSCRIPT
ACCEPTED MANUSCRIPT 13
1 ijkt
ij k
i I
v
j J .k K (12)
These reliability constraints are linearized by taking the logarithms of both sides of the
Inequality (12) and the Constraint Set (13) is obtained.
log log(1 )ij ijk k
i I
v t
j J .k K (13)
However, ensuring an affected area being served by at least one DRF is not totally
satisfying in disaster response since the amount of relief items arrived to the affected area is also
important for reducing human suffering. Therefore, the chance constraints are modified
accordingly. Let
(1 ) ijkt
jk ij k
i I
P C v
j J ,k K (14)
where the event jkC is defined as all of the relief item k sent to affected area j reached to the
affected area j. Left hand side of Inequality (14) is the probability that event jkC occurs
while right hand side is the service reliability of item k. Constraint set (14) is linearized taking
the logarithms of both sides.
log 1 logij ijk k
i I
v t
j J k K (15)
The formulation consisting of (1‒11) and (15) is the proposed UNLP-C model in this
study. Since, stochastic nature of disasters is mostly included in models by scenario-based
formulations in humanitarian logistics literature; we also propose a scenario-based formulation
(SBP). The final model considered in this study is the scenario-based model (SBP). SBP’s
constraints are similar to UNLP except in SBP, the expected average distance traveled is
minimized over all scenarios considered.
Dow
nloa
ded
by [
Gaz
i Uni
vers
ity]
at 0
1:39
04
Nov
embe
r 20
14
ACCEPTED MANUSCRIPT
ACCEPTED MANUSCRIPT 14
Objective functions in all three models mentioned so far minimize the total weighted
distance between the affected areas and the DRFs, which helps minimizing the total average
response time. However, as well as the arrival time of the relief items, it is important that the
relief items actually arrive at the affected areas and the expected unsatisfied demand is
minimized. As a performance measure, we define / ij ijk jk
i I j J k K i I k K
E v x n
and use it in computations.
COMPUTATIONAL STUDIES AND RESULTS
We use the formulations introduced in the previous section in numerical examples created
by simulated data and in a numerical study that represents the pre-positioning problem for
European side of Istanbul city. In the numerical example with simulated data, we use different
disaster progression schemes with different intensities. In the numerical study, first, we introduce
the data for the Istanbul case and then use the proposed formulations to solve the problem.
Numerical Example
In the numerical example, we create an experimental setting where candidate DRF
locations and demand points are evenly distributed over a square area. In this experiment, we use
different disaster scenarios in which the center, intensity, and dissemination of the effect of a
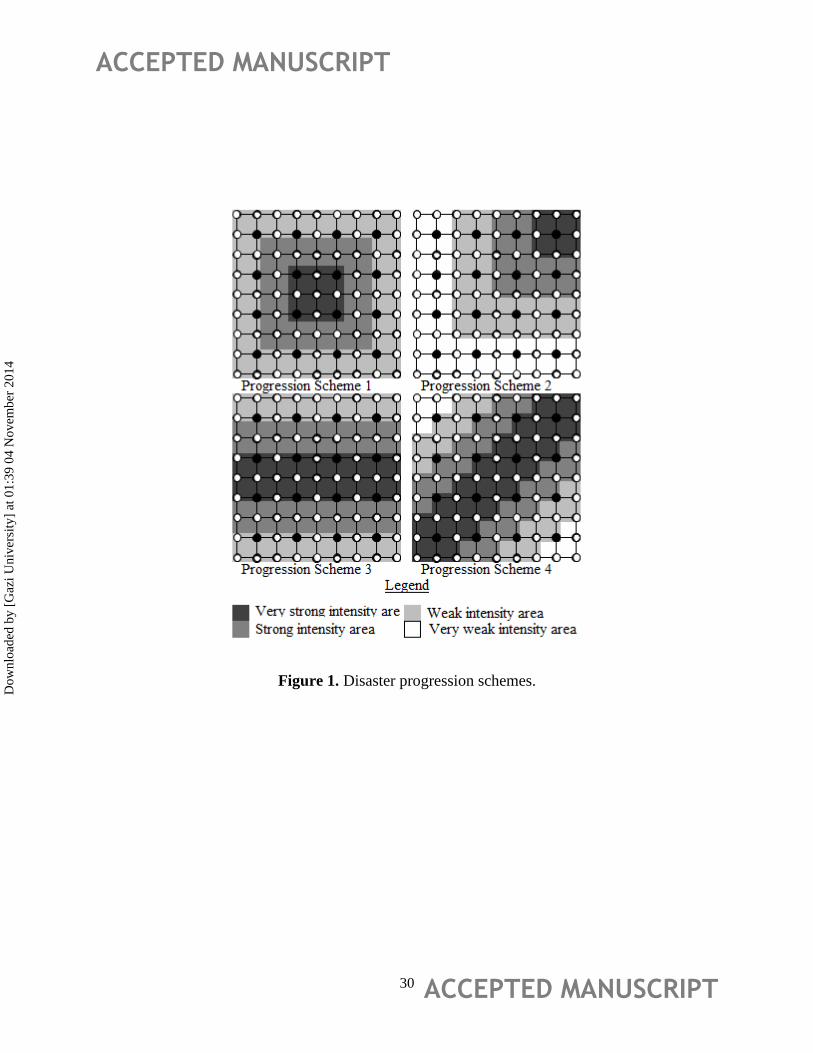
disaster vary. There are 16 affected areas and 65 candidate DRF locations. We consider the four
disaster progression schemes that can be seen in Figure 1. In addition, in each of the disaster
Dow
nloa
ded
by [
Gaz
i Uni
vers
ity]
at 0
1:39
04
Nov
embe
r 20
14
ACCEPTED MANUSCRIPT
ACCEPTED MANUSCRIPT 15
progression schemes, center of the earthquake can be thought to be at different points. The colors
represent the intensity of the disaster, which is also explained in Figure 1.
Black dots are the affected areas and white dots are the candidate DRF locations. Every
grid is a square that has a perimeter of 400 meters. We use shortest distance paths and rectilinear
distance between the locations. In this setting, the scenarios are defined in terms of their
progression schemes and the intensity levels. Population of each affected area is taken as the
same, 1,000 people, and it is assumed that the number of affected people is directly proportional
to the vulnerability factor of the area in which the population center is located. For example, if a
population center is located in an area whose vulnerability factor is 0.8, the number of affected
people at that location is 800.
Vulnerability factors of the paths are calculated as the weighted average of vulnerability
factors of intensity areas where weights are the distances traveled in the areas. Let the path
between candidate DRF location i and population center j consists of 10 grids, four of which are
in strong-intensity area, four of which are in very-strong intensity area, and the remaining two
are in the weak area. Given that vulnerability factors are 0.8, 0.6, and 0.4 in very strong-
intensity, strong-intensity and weak-intensity areas, respectively, then the vulnerability factor of
the path is; (4 x 0.8+4 x 0.6+2 x 0.4)/10 = 0.6.
For the sake of simplicity, one type of relief item is located at DRFs and it is assumed
that one affected person requires one relief item. In addition, maximum service distance is set to
7,000 meters and total number of relief items to be allocated equals to the total demand.
We assume four progression schemes and four different intensity levels; therefore, total
of 16 different problems are solved both using the chance constraints and without using them.
Dow
nloa
ded
by [
Gaz
i Uni
vers
ity]
at 0
1:39
04
Nov
embe
r 20
14
ACCEPTED MANUSCRIPT
ACCEPTED MANUSCRIPT 16
Results are compared in terms of the average distance and total expected unsatisfied percentage
of demand. Introducing the chance constraint to the formulation always causes an increase in the
optimal objective function value, which is the total weighted distance in all of the scenarios. This
is because the chance constraints require opening DRFs in safer places even if the weighted
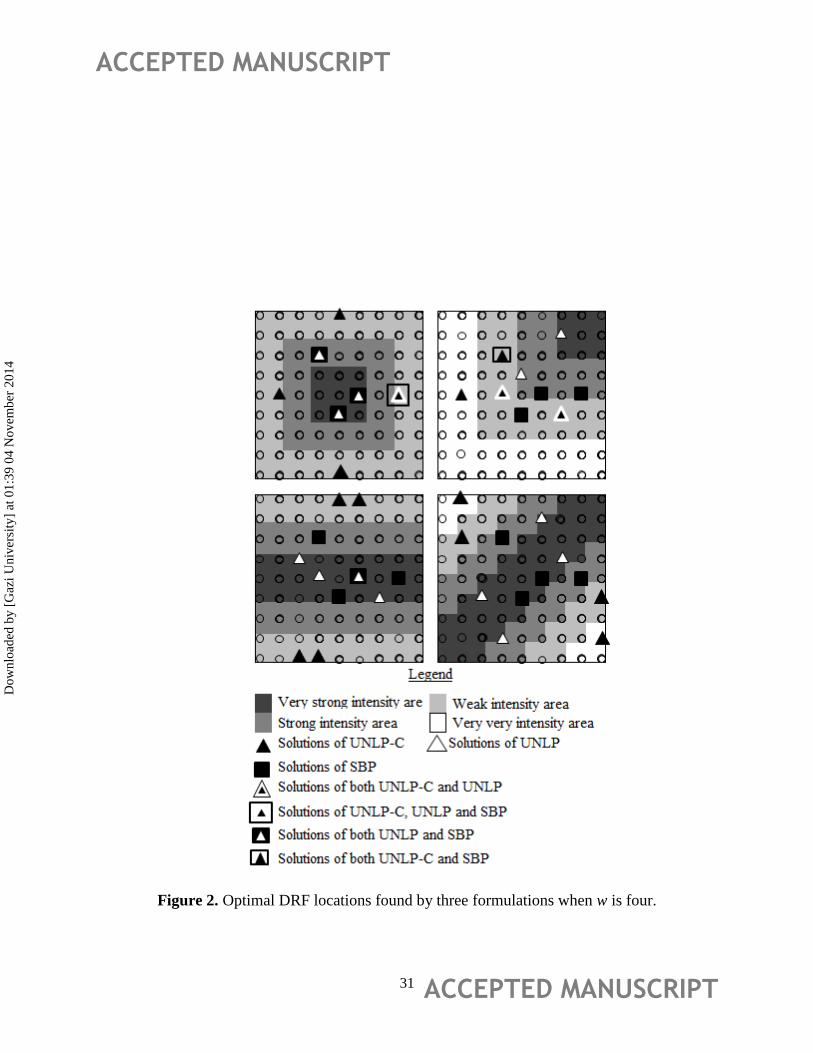
distance increases. To capture the differences between UNLP-C, UNLP, and SBP formulations a
small example is considered. A single intensity level and four disaster progression schemes are
used in order to create four different scenarios; Scenarios 1, 2, 3, and 4 use progression schemes
1, 2, 3, and 4, respectively. Intensity level is 0.8, 0.8, 0.4, and 0.2 for very strong, strong, weak,
and very weak intensity areas, respectively. UNLP and UNLP-C are solved for each scenario
(progression scheme) and locations chosen by them for each progression schemes are given in
Figure 2. SPB assumes all four scenarios are equally likely and are solved once, thus locations
chosen for SPB is the same for all four progression schemes in Figure 2.
It can be seen that locations chosen by UNLP and SBP are in higher intensity areas than
the DRF locations of UNLP-C. When UNLP-C is utilized, safer locations are chosen and thus
expected unsatisfied percentage of demand is decreased as observed in Table 1. Since chance
constraints are not included in scenario-based formulation, although it considers all possible
scenarios, it does not capture the risk of relief transportation blockage. Results in Table 1 help in
observing the tradeoff between the time and reliability concepts while providing a reliability for
relief transportation.
Dow
nloa
ded
by [
Gaz
i Uni
vers
ity]
at 0
1:39
04
Nov
embe
r 20
14
ACCEPTED MANUSCRIPT
ACCEPTED MANUSCRIPT 17
Numerical Study
Data related to Istanbul region
The proposed model in the previous section is applied to the European Side of Istanbul.
All data are obtained from The Study on A Disaster Prevention/Mitigation Basic Plan in Istanbul
Including Seismic Microzonation in the Republic of Turkey (JICA and IMM 2002) prepared by
the Japan International Cooperation Agency (JICA) and the Istanbul Metropolitan Municipality
(IMM). In this report of JICA and IMM, a detailed investigation on disaster management in
Istanbul is given and we use only the relevant data. We use population data of all districts of
Istanbul, and using population density in a district we find the population center of each district
and take them as demand points. Again, in that research, four possible earthquake models are
proposed namely Model A, Model B, Model C, and Model D. They state that Model D resembles
Model A and Model B resembles Model C; thus, they estimate damages for only two of the
models: Model A and Model C. Because Model C is the worst case, in this study estimations for
Model C are used. There are studies in the literature on disaster prediction and risk assessment
for disasters like the studies of Zhang (2009), Li et al. (2013), Huang et al. (2011) and Ding et al.
(2012). However, this topic is not the focus of our study. In order to assess the risk, we use the
report of JICA and IMM and we estimate the parameters of the problem using that source. As an
example, the report of JICA and IMM has building damage percentages for each districts of
Istanbul. To illustrate, they estimate that 14.1% of buildings in Avcılar district will be heavily
damaged with Model A and 16.5% of them will be heavily damaged with Model C. Using
building damage percentages of Model C and population data for the Avcılar district, we
Dow
nloa
ded
by [
Gaz
i Uni
vers
ity]
at 0
1:39
04
Nov
embe
r 20
14
ACCEPTED MANUSCRIPT
ACCEPTED MANUSCRIPT 18
estimate the demand of the Avcılar district for relief items, which is explained in detail later.
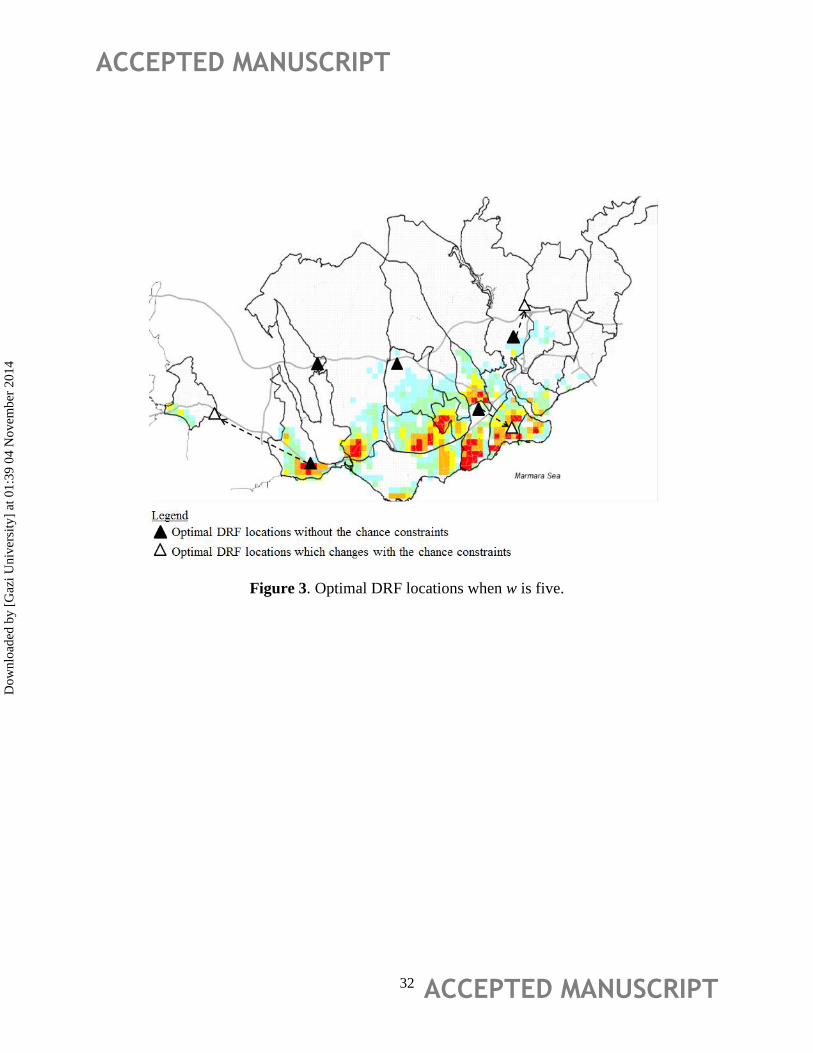
Also, the report of JICA and IMM includes a road risk evaluation. They provide blockage
probabilities of the roads with a map that can be seen in Figure 3. Different colors on the map
represent different magnitudes of risk and we assign each color a relative blockage probability.
Basically, we estimate three types of parameters in our study using the research of JICA and
IMM; demand for relief items, population centers of districts, and blockage probabilities of the
roads. The rest of this paper includes detailed information on estimation of these parameters.
There are 18 districts in Istanbul at the European Side. Weighted population centers of
the districts are used as demand points (affected areas) in the model. Since two of the districts,
Şişli and Avcılar, are divided into two due to their geographical shapes, there are 20 affected
areas in need of relief items.
The amounts of relief items needed by the affected areas are estimated based on the JICA
and IMM report. Most notable cause of damage is claimed to be building collapse. They evaluate
buildings located in each district in terms of their construction year, floor number, and structure;
and they group the buildings into three: heavily damaged buildings, moderately damaged
buildings, and partly damaged buildings. Heavily and moderately damaged buildings are not
usable for living until they are repaired or rebuilt. Therefore, people living in those types of
buildings will need certain items like tents, hygiene kits, food and water supplies. Additionally,
the need for medical equipment kits can be estimated using number of people living in these
types of buildings. The JICA and IMM report provides number and percentage of heavily,
moderately, and partly damaged buildings in each district together with population data of them.
In this study, the need for the five types of relief items are estimated for each district by
Dow
nloa
ded
by [
Gaz
i Uni
vers
ity]
at 0
1:39
04
Nov
embe
r 20
14
ACCEPTED MANUSCRIPT
ACCEPTED MANUSCRIPT 19
multiplying district population with the total percentage of heavily and moderately damaged
buildings in that district. Using CARE International's specifications, demands for relief items for
all districts are calculated. According to CARE's specifications, one tent is for 5 people, one
medical equipment kit is for 50 people, one food kit is for 8 people, one hygiene kit is for 8
people, and a person needs 3 liters of water daily.
We assume that the DRFs are not damaged by an earthquake because they can be built as
disaster-resisting buildings. However, they can be isolated due to the fact that the paths linking
them to affected areas can be damaged. Therefore, 25 candidate DRF locations are chosen
considering isolation risk caused by road blockage after an earthquake.
In the report of JICA and IMM, a proposed emergency road network is presented. Roads
are evaluated according to route division, connection, factor on traffic characteristics, building
collapse risk, and crossing large bridges and viaducts in order to propose most suitable road map
to be used in emergency situations. In this study, we use shortest paths over the proposed
emergency road network (see JICA and IMM 2002).
In the report of JICA and IMM, blockage probabilities of the roads in the proposed road
network are determined considering width of roads and building collapse risk (JICA and IMM
2002). Roads are categorized into three groups: wide width roads (16 meters and over), medium
width roads (7‒15 meters), and narrow width roads (2‒6 meters) and for these three types of
roads, blockage probabilities are presented. The average value of a range is used as building
collapse risk of a road passing through an area. A path between a DRF location and an affected
area can pass through the areas with different blockage probabilities. As explained in the
previous section, a weighted average probability of blockage for the path is calculated where
Dow
nloa
ded
by [
Gaz
i Uni
vers
ity]
at 0
1:39
04
Nov
embe
r 20
14
ACCEPTED MANUSCRIPT
ACCEPTED MANUSCRIPT 20
weights are the distances of parts passing through areas with different blockage probabilities. All
probabilities are less than 1 in the Istanbul case, which means there is no path that will be
definitely blocked, and therefore the explained calculation of blockage probabilities, finding an
average probability, is reasonable.
However, it is possible to calculate blockage probabilities of the paths in another way.
Again, we separate the path into the parts passing through the areas with different blockage
probabilities. Then, we multiply the probabilities of the parts not being blocked and extract the
multiplication from one. In this way, we find the probability that at least one of the parts is
blocked, which is named as overall blockage probability. Therefore, two different calculations
are possible for finding blockage probabilities; we can use average probabilities or overall
probabilities. Average probability calculation ignores the definitely blocked parts of the paths by
using distance weights and decreasing the blockage probability. On the other hand, overall
probability calculation ignores the distances of path parts. Finding the appropriate calculation is
not the main concern of this study; and since in Istanbul case, we do not have any parts that will
definitely be blocked, we prefer to use average probabilities initially.
Numerical results
Using data for the European Side of Istanbul, the problem of finding the locations for pre-
positioning DRFs and relief items a priori to a large-scale earthquake is solved. We set minimum
service reliabilities of relief items to 0.9, 0.85, 0.85, 0.7, and 0.7 for medical equipment, water,
food, hygiene kits, and tents, respectively. The formulation without the chance constraints
(UNLP) is used first. Then, chance-constrained formulation (UNLP-C) is used in order to obtain
Dow
nloa
ded
by [
Gaz
i Uni
vers
ity]
at 0
1:39
04
Nov
embe
r 20
14
ACCEPTED MANUSCRIPT
ACCEPTED MANUSCRIPT 21
results with smaller expected unsatisfied percentage of demand than those of UNLP. Results of
UNLP and UNLP-C are presented in Table 2.
The minimum number of DRFs is four in order to maintain feasibility in Table 2.
Maximum number of DRFs is chosen arbitrarily as eight while preparing Table 2, since the
results are very similar when more DRFs are opened. These results are expected considering the
analysis done on the simulated data. The chance constraints cause the average distance to
increase and the expected loss of demand to decrease. This is why DRFs are opened at safer but
more distant locations from their assigned affected areas than those of the formulation without
the chance constraints. As an illustration, an examination of Figure 3 shows the optimal locations
when the number of total DRFs is five. Moreover, presented in Table 3 are the corresponding
results on the expected unsatisfied demand percentage of all relief items individually.
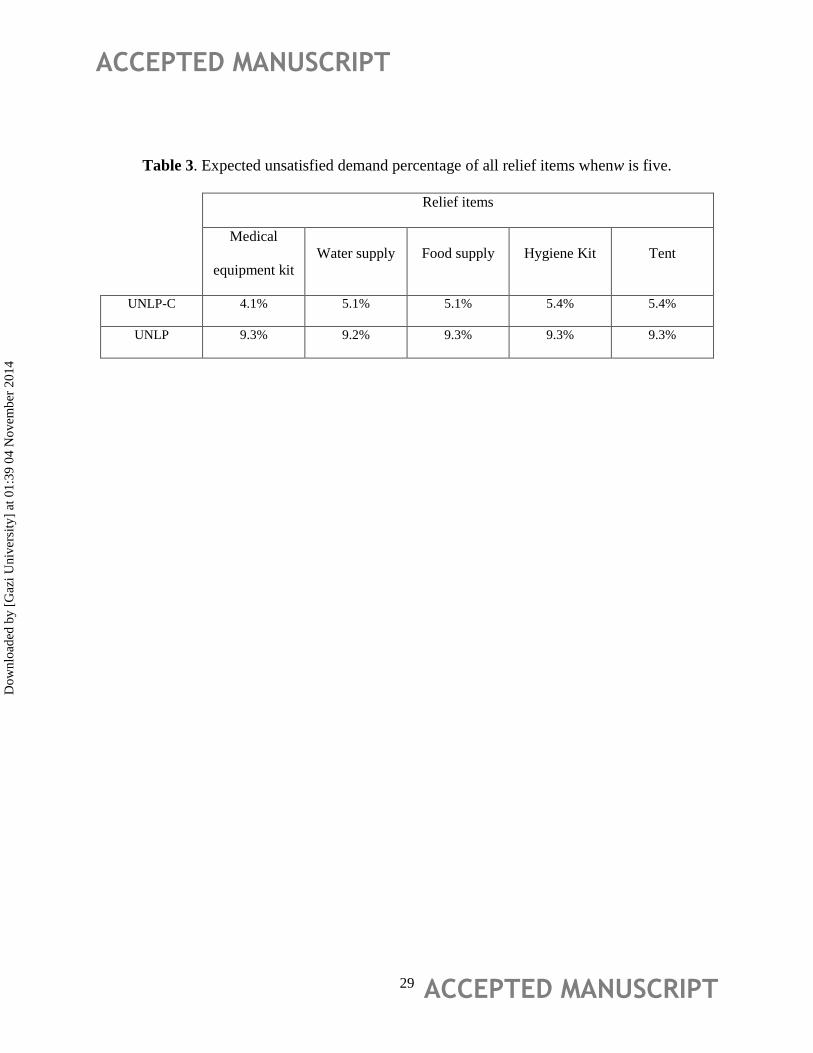
It can be seen in Table 3 that expected unsatisfied demand percentage of more critical
items are in less amounts than the less critical ones when the chance constraints are used. UNLP
treats as if all items have the same importance.
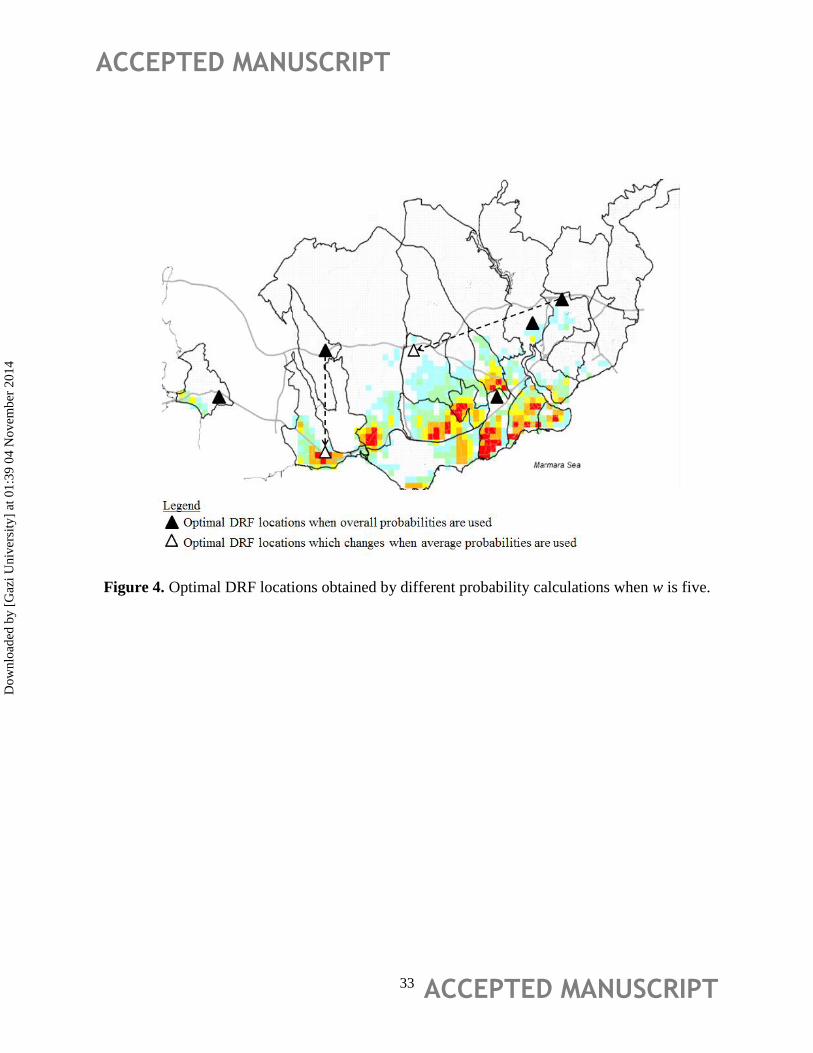
Shown in Figure 4 are the locations of DRFs with both blockage probability calculation
methods mentioned before. Minimum service reliabilities of relief items are taken as 0.5, 0.5,
0.4, 0.4, and 0.3 for medical equipment, food supply, water supply, hygiene kits, and tents,
respectively.
Dashed lines in Figure 4 show how the location of a DRF is changed when average
probabilities are used. As we can see from Figure 4, optimal DRF locations are located at safer
but further locations when overall probability calculation is used.
Dow
nloa
ded
by [
Gaz
i Uni
vers
ity]
at 0
1:39
04
Nov
embe
r 20
14
ACCEPTED MANUSCRIPT
ACCEPTED MANUSCRIPT 22
Solution times of computational experiments are negligible in this study. Most of the
experiments can be solved in less than 2 minutes using Cplex 12.4 solver and none of the
experiments are solved in more than 4 minutes.
CONCLUSION
The preparation stage of humanitarian logistics is a critical stage for reducing human
suffering and minimizing damage caused by disasters. In the literature, mathematical models
proposed handle the stochastic features of disasters by using expected values with respect to
possible disaster scenarios. In the proposed model, instead of scenarios, probabilistic constraints
are used.
First, an MIP model is developed without chance constraints. Then, the chance
constraints are introduced and implemented into the formulation. Moreover, a scenario-based
formulation is also considered to enable comparisons. In all experiments, the results are similar.
The main effect of chance constraints is that optimal disaster response facility locations are
getting out of risky areas; thus, chance and reliability constraints provide a minimum reliability
for relief item transportation and give better results in terms of expected unsatisfied demand than
the formulations without chance constraints. However, inclusion of chance constraints in the
formulation increases average distance. Therefore, there is a tradeoff between minimizing
average distance and minimizing expected unsatisfied demand, which can be interpreted as the
tradeoff between the response time and the risk.
As a future study, a risk-averse objective function, which is suitable for humanitarian
purposes, can be formulated and used. In addition, for the cases in which it is impossible to
Dow
nloa
ded
by [
Gaz
i Uni
vers
ity]
at 0
1:39
04
Nov
embe
r 20
14
ACCEPTED MANUSCRIPT
ACCEPTED MANUSCRIPT 23
satisfy all demand, a variation of maximal coverage problem together with the probabilistic
constraints can be developed. Also, considering our findings, there is a significant tradeoff
between the response time and risk in the Istanbul case, and risk assessment has an important
effect on the results. Although it is not the focus of this study, before using risk as a parameter in
such a study, a comprehensive risk assessment study is suggested to be carried out.
Dow
nloa
ded
by [
Gaz
i Uni
vers
ity]
at 0
1:39
04
Nov
embe
r 20
14
ACCEPTED MANUSCRIPT
ACCEPTED MANUSCRIPT 24
REFERENCES
Apte A. 2010. Humanitarian logistics: A new field of research and action. Foundations and
Trend® in Tech. Info. and Op. Management 3:1-100
Balcik B and Beamon M. 2008. Facility location in humanitarian relief. Internat J Logist Res
Appl 11:101-21
Barbarosoglu G and Arda Y. 2004. A two-stage stochastic programming framework for
transportation planning in disaster response. J Oper Res Soc 55:43-53
Ding P, Gerst MD, Bernstein A, et al. 2012. Rare disasters and risk attitudes: International
differences and implications for integrated assessment modeling. Risk Anal 32:1846–55
Duran S, Gutierrez MA, and Keskinocak P. 2011. Pre-positioning of emergency items for CARE
International. Interfaces 41:223-37
Gormez N, Koksalan M, and Salman S. 2011. Locating disaster response facilities in Istanbul. J
Operation Res Soc 62:1239–52
Guha-Sapir D, Hoyois P, and Below R. 2013. Annual Disaster Statistical Review 2012:The
Numbers andTrends. CRED; 2013, Brussels, Belgium
Hongzhong J, Ordonez F, and Dessouky M. 2005. A modeling framework for facility location of
medical services for large-scale emergencies. IIE Trans 39:41-53
Huang C. 2011. Differences between disaster prediction and risk assessment in natural disasters.
Hum Ecol Risk Assess 17:542-53
Dow
nloa
ded
by [
Gaz
i Uni
vers
ity]
at 0
1:39
04
Nov
embe
r 20
14
ACCEPTED MANUSCRIPT
ACCEPTED MANUSCRIPT 25
International Federation of Red Cross and Red Crescent Societies. 2012. World Disaster Report
2012. Available at http://www.ifrc.org/PageFiles/99703/1216800-WDR%202012-EN-
LR.pdf
JICA (Japan International Cooperation Agency) and IMM (Istanbul Metropolitan Municipality ).
2002. The Study on a Disaster Prevention/Mitigation Basic Plan in Istanbul Including
Seismic Microzonation in the Republic of Turkey. Tokyo, Japan
Klibi W, Ichoua S, and Martel A. 2013. Prepositioning Emergency Supplies to Support Disaster
Relief: A Stochastic Programming Approach. Available at
https://www.cirrelt.ca/DocumentsTravail/CIRRELT-FSA-2013-19.pdf
Li Q, Zhou J, Liu D, et al. 2013. Disaster risk assessment based on variable fuzzy sets and
improved information diffusion method. Hum Ecol Risk Assess 19:857–72
Mete HO and Zabinsky ZB. 2010. Stochastic optimization of medical supply location and
distribution in disaster management. Int J Production Econ 126:76-84
Rawls CG and Turnquist MA. 2010. Pre-positioning of emergency supplies for disaster response.
Transport Res Part B 44:521-34
Rawls CG and Turnquist MA. 2011. Pre-positioning for emergency response with service quality
constraints. OR Spectrum 33:481-98
Rawls CG and Turnquist MA. 2012. Pre-positioning and dynamic delivery planning for short
term response following a natural disaster. Socio-Econo Planning Sci 46:46-54
ReVelle CS and Hogan K. 1989. The maximum availability location problem. Transport Sci
23:192-200
Dow
nloa
ded
by [
Gaz
i Uni
vers
ity]
at 0
1:39
04
Nov
embe
r 20
14
ACCEPTED MANUSCRIPT
ACCEPTED MANUSCRIPT 26
Thomas A. 2005. Humanitarian logistics: Matching recognition with responsibility. Available at
http://www.fritzinstitute.org/PDFs/InTheNews/2005/ADR_0605.pdf
Verma A and Gaukler MG. 2011. A stochastic optimization model for positioning disaster
response facilities for large-scale emergencies. INOC 2011, LNCS 6701:547-52
Zhang J, Liang J, Liu X, et al. 2009. GIS-based risk assessment of ecological disasters in Jilin
Province, Northeast China. Hum Ecol Risk Assess 15:727-45
Dow
nloa
ded
by [
Gaz
i Uni
vers
ity]
at 0
1:39
04
Nov
embe
r 20
14
ACCEPTED MANUSCRIPT
ACCEPTED MANUSCRIPT 27
Table 1. Average distance and Expected loss w.r.t. to optimal DRF locations found by three
formulations when w is four.
Results of UNLP-C Results of UNLP Results of SBP
Scenario 1
Average distance (m) 1,666 944 944
Expected loss (%) 44 51 51
Scenario 2
Average distance (m) 982 879 914
Expected loss (%) 40 46 48
Scenario 3
Average distance (m) 1,600 900 925
Expected loss (%) 45 57 56
Scenario 4
Average distance (m) 1,707 978 978
Expected loss (%) 48 59 59
Dow
nloa
ded
by [
Gaz
i Uni
vers
ity]
at 0
1:39
04
Nov
embe
r 20
14
ACCEPTED MANUSCRIPT
ACCEPTED MANUSCRIPT 28
Table 2. Results of UNLP-C and UNLP for different w values.
Results of UNLP - C Results of UNLP Difference over UNLP
w Avg. D.* E.L.** Avg. D. E.L. Avg. D. E.L.
4 6,155 4.2% 3,985 9.3% 54% -55%
5 4,950 5.2% 3,508 9.3% 41% -44%
6 4,357 5.1% 3,095 8.1% 41% -37%
7 3,777 5% 2,719 14.1% 39% -64%
8 3,403 5.5% 2,469 18.8% 38% -71%
*Avg. D. : average distance (meters); **E.L. : percent expected loss
Dow
nloa
ded
by [
Gaz
i Uni
vers
ity]
at 0
1:39
04
Nov
embe
r 20
14
ACCEPTED MANUSCRIPT
ACCEPTED MANUSCRIPT 29
Table 3. Expected unsatisfied demand percentage of all relief items whenw is five.
Relief items
Medical
equipment kit
Water supply Food supply Hygiene Kit Tent
UNLP-C 4.1% 5.1% 5.1% 5.4% 5.4%
UNLP 9.3% 9.2% 9.3% 9.3% 9.3%
Dow
nloa
ded
by [
Gaz
i Uni
vers
ity]
at 0
1:39
04
Nov
embe
r 20
14
ACCEPTED MANUSCRIPT
ACCEPTED MANUSCRIPT 30
Figure 1. Disaster progression schemes.
Dow
nloa
ded
by [
Gaz
i Uni
vers
ity]
at 0
1:39
04
Nov
embe
r 20
14
ACCEPTED MANUSCRIPT
ACCEPTED MANUSCRIPT 31
Figure 2. Optimal DRF locations found by three formulations when w is four.
Dow
nloa
ded
by [
Gaz
i Uni
vers
ity]
at 0
1:39
04
Nov
embe
r 20
14
ACCEPTED MANUSCRIPT
ACCEPTED MANUSCRIPT 32
Figure 3. Optimal DRF locations when w is five.
Dow
nloa
ded
by [
Gaz
i Uni
vers
ity]
at 0
1:39
04
Nov
embe
r 20
14
ACCEPTED MANUSCRIPT
ACCEPTED MANUSCRIPT 33
Figure 4. Optimal DRF locations obtained by different probability calculations when w is five.
Dow
nloa
ded
by [
Gaz
i Uni
vers
ity]
at 0
1:39
04
Nov
embe
r 20
14